Embed Size (px)
Citation preview
1
J. Violin Soc. Am.: VSA Papers • Summer 2009 • Vol. XXII, No. 1
The acoustic qualities of a violin must ultimately be assessed by playing the violin and listening to the sound. Despite
the subjective variabilities of this method of assessment, it has served the violinmakers of the past very well and enabled the evolution of the instrument into its present—some would say perfect—form. However, some sort of simple objective measure of the acoustic response of the violin would be very useful to researchers and violinmakers.
Simple measures have been made possible by the availability of the instrumented force ham-mer. By tapping the bridge in its plane at the top of one edge with a force hammer and measuring the resulting velocity of the bridge at the top of the other edge, graphs can be constructed of the velocity per unit force of the bridge. If with a similar excitation the radiated sound pressure is measured, a graph can be constructed that shows the radiated sound pressure per unit force on the bridge at all frequencies within the range of interest. The velocity plots are referred to by various writers as the “mobility,” the “admit-tance,” or the “frequency response function.”
The confusion is not helped by some writers also calling the plot of the radiated sound pressure the “frequency response function.” The term “admittance” derives from the analogy to elec-trical systems. The correct term for the velocity plot is “mobility.” We refer to the sound pressure plot as the “normalized sound pressure,” or sim-ply “normalized pressure,” and define it as the space-averaged rms sound pressure divided by the rms force on the bridge.
Mobility can be either “point mobility” or “transfer mobility.” In the case of point mobil-ity, the velocity is measured at the same point and in the same direction as the applied force. The term “transfer mobility” is used when the point of measurement of velocity is not the same as the point of force application. The graphs of bridge top mobility, usually presented in violin acoustical characterizations, are actually graphs of the transfer mobility, because the velocity is measured on the side of the bridge opposite to where the hammer strikes.
Mobility is a mathematically complex quan-tity, which represents not only the ratio of the magnitudes of these quantities, but also their
A Comparative Study of the Hammered Bridge Response and the Bowed String
Response of the ViolinNIGEL HARRIS and FRANK FAHY
53 Aberdeen Ave., Cambridge, CB2 8DL, [email protected]
AbstractThe mobility of the bridge and the radiated sound pressure per unit force are measured for two contrasting violins, using the conventional hammered bridge excitation. The same measurements are made when the violins are bowed on a number of different notes and the string force on the bridge is measured directly. A case is made that the method used for measuring the bowed responses will produce data that are of greater relevance to the tone of a played violin. The results are compared to see to what extent the hammered bridge responses reflect the actual response of the bowed violins. These show that there are differences that increase with rising frequency and especially so in the region of the “hill.” These differences vary considerably across the frequency range, and vary with the note that is played. They also vary between the two violins. Compared to the bowed string responses, the hammered bridge responses do not reflect as clearly the differences between the violins that are relevant to the tonal criteria proposed by Dünnwald. The sound pressure normalized on the input force and the mobility of the bridge resulting from excitation by hammering the bridge are shown not to be reliable indicators of the response of the violin when bowed.
2
J. Violin Soc. Am.: VSA Papers • Summer 2009 • Vol. XXII, No. 1
relative phase. It must therefore be shown in two independent graphs. These can either be the real and imaginary parts of the mobility, or its magnitude and phase. It is conventional in violin acoustics to show the magnitude and phase. The magnitude of the mobility of the bridge is a mea-sure of the dynamic activity of the bridge and may or may not bear some relationship to the dynamic activity of the body modes that radiate sound from areas remote from the bridge.
The more telling significance of the mobil-ity of the bridge is that the vibrational power passing from the string to the bridge per unit string force on the bridge is equal to its real part (the magnitude of the mobility multiplied by the cosine of the phase angle). This can be represented by a single graph. This input power is partly dissipated into heat by mechanical damping of the violin structure and partly radi-ated as sound energy. If all violins had the same mechanical damping and radiated sound with equal effectiveness, the incoming power would be an indication of the violin’s acoustic response. However, violins are bound to vary in their damping and in their effectiveness as radiators, both with frequency, and from violin to violin. So a test method involving direct measurement of the radiated sound pressure is more appropri-ate.
The mobility is a purely mechanical prop-erty of the violin, while the sound pressure normalized on the force is an acoustic measure-ment. The mobility and the normalized pres-sure graphs both have been called “the acoustic fingerprint of the violin” by various writers. Ascribing this name to these graphs implies that it represents features that are unique to the violin and of significance to its tonal response when played. Normalized-pressure graphs are con-ventionally derived by tapping the bridge with a force hammer and measuring the radiated sound pressure. Considerable reliance has been placed on these graphs as encapsulating all that needs be known about a violin. Some have assumed that two violins will sound the same if they have the same normalized-pressure graphs.
The response of a range of violins to hammer impact will naturally differ, not only with where the violin is struck but also with the properties of the violin. However, the differences would not be expected to be truly indicative of the differences
of instrument performance or quality, unless the excitation were applied in such a way as to be closely representative of the forces applied by the bowed strings. In the absence of a simple and widely available means of measuring the force actually applied by the string to the bridge, the technique that has been universally applied over many years is to apply an impact to the topside of the bridge, in its plane. Violins differ in their vibrational and acoustic responses to this excita-tion, and attempts have been made to correlate instrument quality with these differences.
In our experiments with bowed excitation, the external vibrational force on the complete violin instrument system is the bowing force. We have adopted the term “mobility” to apply to the relation between a particular component of an internal force and the associated velocity (which, we acknowledge, may not be wholly caused by that particular force component because of other simultaneously acting components of that force and other forces acting at other points). Our justification for this adoption is that it is this relation that controls the transfer of power from a string to the bridge per unit string force component acting tangentially to the bridge top, which is the direction of string force assumed in almost all theoretical studies of violin acoustics. In other words, it is a measure of the effective-ness of the principal channel of transfer of vibra-tional energy from the string to the violin when the violin is subject to a force system representa-tive of the playing condition. This is not truly represented by the hammered mobility. Hence, we consider that our “internal” mobility is likely to be a more reliable indicator of the physical performance of a played violin than the mobility measured using a completely artificial external excitation.
The objective of this research is to find how well the widely used “hammered bridge” objec-tive method of tonal characterization reflects the actual response of the bowed violin. The normalized sound pressure and the mobility of a violin derived from hammered excitation are compared with the normalized pressure and internal mobility of the violin when the string is bowed. Tests have been made for different notes on the G-strings of two different violins.
3
J. Violin Soc. Am.: VSA Papers • Summer 2009 • Vol. XXII, No. 1
THE TESTS
The chosen violins were a four-year-old violin by Harris and Sheldon (referred to as Violin A) and an approximately 100-year-old trade violin (referred to as Violin B). The two violins were subjectively assessed as being clearly very differ-ent in tone when played. There was also an obvi-ous difference in the shape of the arching of the plates. It was decided to repeat the experiment with the bowed excitations on the following notes on the G-string of the violin: G3, A3, B3, C#4, D#4, F4, and G4. These notes are separated by one-tone intervals. Being low-pitched notes, the harmonics are closer together and more numerous in the range. Also, these notes often correlate most typically with the general tone quality of an instrument. Since the notes were all played on one string, the bridge only needed to be instrumented for force measurement at one string notch. Although the frequency gaps are still quite large, by testing six different notes the gaps in the frequency range are filled in more closely.
From the experimental results the follow-ing questions were addressed: Is the normalized pressure the same for bowed and hammered excitations? If it is not, is the difference the same for all notes, and is it the same for both violins? How does the mobility (both bowed and ham-mered) relate to the normalized radiated sound pressure of the bowed violin? Given what we can deduce subjectively about the tone of the instru-ments, is there any indication of this in the shape of the bowed spectra?
It was important to test more than one vio-lin. If the bowed and hammered excitations gave different responses, it would be possible to see if the difference was the same for the two violins. If the difference was the same, the hammered excitation could still be indicative of the bowed response. If the difference was not the same for the two violins, then this assumption could not be made.
THE STRING FORCE ON THE BRIDGE
In order to measure separately components of string force on the bridge—in its plane and in the directions tangential and normal to the upper edge of the bridge—a pair of small piezoelectric crystals in the form of small rectangular blocks
were installed in the G-string notch. They were arranged in a V-formation that was symmetric about, and normal to, the upper edge of the bridge at that point (see acknowledgments below). The outputs of the pair of crystals were summed to give a signal proportional to the normal component of string force applied to the notch and the difference was proportional to the tangential component of the force. The latter is the force component used to evaluate bridge mobility and normalized sound pressure. A circuit contained in a small box was made to convert the transducer outputs to their sum and difference (Fig. 1). The installation was very carefully designed and constructed so that the static string force was reacted without affecting the dynamic forces and there was no possibility of looseness in the fixture.
For the purpose of calibration, the instru-mented bridge was mounted on a rigid base and a string was placed in the notch and tensioned to replicate the conditions found in a real violin (same angle change over the bridge, same ten-sion, but the string length each side of the bridge was made the same to eliminate vibration normal to the plane of the bridge). The transducers were calibrated by applying an impulse from a force hammer in a direction normal to the tangent to the bridge at the point where the string crosses the notch. The transfer functions between the bridge transducer response and the force applied by the hammer gave a broadband calibration of each transducer. The calibrations of the two transducers were negligibly different.
To ensure the operational accuracy and durability of the transducers, the bridge was made a little on the thick side of what would be a normal bridge. This mass loading of the bridge top slightly affected the shape of the normalized-pressure graph and the mobility of the bridge. The same bridge and strings were used for all the experiments, and therefore any effect their design may have had was common to all test results.
THE FORCE IN THE TAILGUT
The dynamic force on the tailgut was measured by a piezoelectric crystal transducer. The two ends of the tailgut were made to pull on a plate. A small crystal transducer was inserted between this plate and the wood of the tailpiece. Tension
4
J. Violin Soc. Am.: VSA Papers • Summer 2009 • Vol. XXII, No. 1
in the tailgut applied a compression across the transducer. A broadband calibration was made by connecting the tailpiece, the tailgut, and a calibrated force gauge in series and applying an oscillatory force to the system.
TEST METHOD
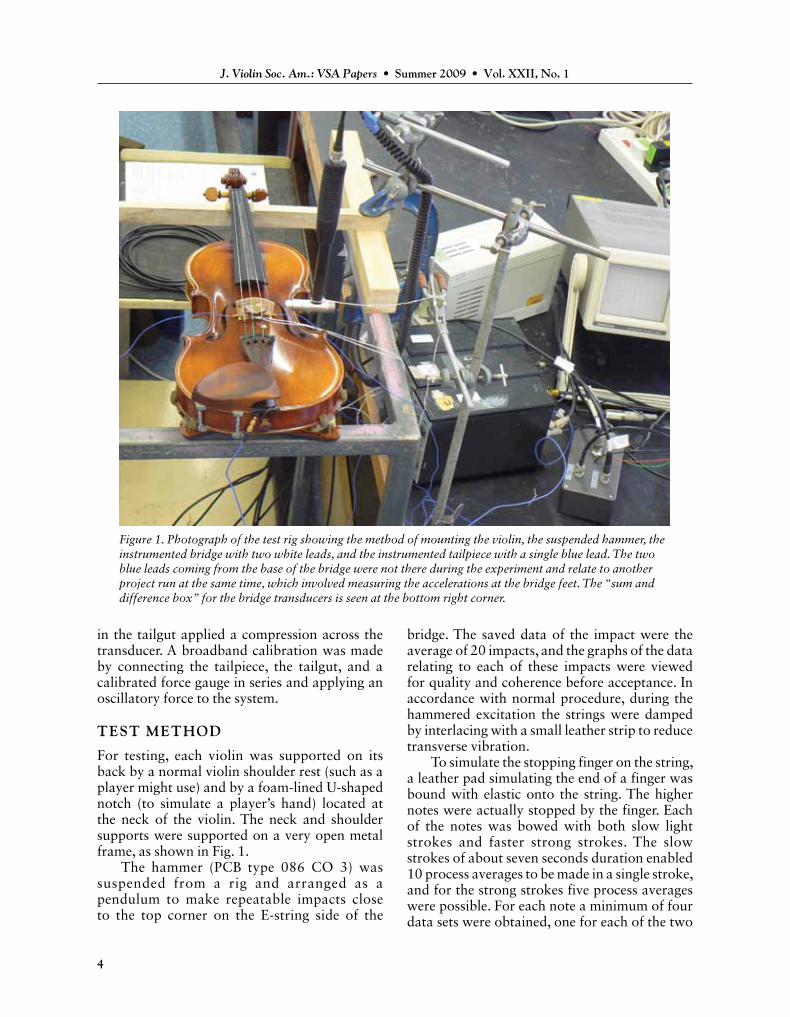
For testing, each violin was supported on its back by a normal violin shoulder rest (such as a player might use) and by a foam-lined U-shaped notch (to simulate a player’s hand) located at the neck of the violin. The neck and shoulder supports were supported on a very open metal frame, as shown in Fig. 1.
The hammer (PCB type 086 CO 3) was suspended from a rig and arranged as a pendulum to make repeatable impacts close to the top corner on the E-string side of the
bridge. The saved data of the impact were the average of 20 impacts, and the graphs of the data relating to each of these impacts were viewed for quality and coherence before acceptance. In accordance with normal procedure, during the hammered excitation the strings were damped by interlacing with a small leather strip to reduce transverse vibration.
To simulate the stopping finger on the string, a leather pad simulating the end of a finger was bound with elastic onto the string. The higher notes were actually stopped by the finger. Each of the notes was bowed with both slow light strokes and faster strong strokes. The slow strokes of about seven seconds duration enabled 10 process averages to be made in a single stroke, and for the strong strokes five process averages were possible. For each note a minimum of four data sets were obtained, one for each of the two
Figure 1. Photograph of the test rig showing the method of mounting the violin, the suspended hammer, the instrumented bridge with two white leads, and the instrumented tailpiece with a single blue lead. The two blue leads coming from the base of the bridge were not there during the experiment and relate to another project run at the same time, which involved measuring the accelerations at the bridge feet. The “sum and difference box” for the bridge transducers is seen at the bottom right corner.
5
J. Violin Soc. Am.: VSA Papers • Summer 2009 • Vol. XXII, No. 1
light strokes and one for each of the two strong strokes. The results were viewed on the com-puter screen and only accepted when found to be of high quality and coherence. The signals were acquired by a multichannel FFT analyzer over a range of 10 kHz with 3200 lines giving a resolu-tion of 3.125 Hz.
The experiments were carried out in a large reverberant room of which the Schroeder “large room” frequency was less than 100 Hz, so a tonal sound field could be taken as random above this frequency. The reverberation time of the room varied little over the frequency range of the tests. The omni-directional microphone was suspended ~2 meters away and to the side of the violin at a level ~0.6 m above it. This was in the reverberant field of the source. During the acquisition of data the microphone was caused to swing through an arc of not less than 2 m. This ensured that any standing waves in the room were averaged out. By this means, an aver-age-mean-square pressure that is proportional to the radiated sound power was measured. The movement of the microphone through the sound field prevented the direct measurement of a transfer function between the force and the sound pressure since it varies with microphone position. Therefore, the normalized pressure was calculated by taking the ratio of the space-averaged rms pressure to rms force. Phase was of no interest.
The transverse velocity of the bridge was measured by a laser velocimeter, thus avoiding the need for any attachments to the bridge. The velocity was measured at the top of the edge of the bridge on the G-string side. The bridge mobil-ities were calculated from the transfer function between bridge velocity and input force, which had a coherence of 0.98 over the whole fre-quency range, meaning that the random error of the estimate of transfer function was negligible. In the case of the bowed excitation, the values of the data at the harmonic peaks were identified and the intermediate data discarded.
RESULTS
All the results are presented using a linear fre-quency scale, rather than the logarithmic fre-quency scale normally used in violin acoustics. Usually the main area of interest has been in the
low-frequency peaks and this is made clearer by a log scale. However, the harmonic peaks of the bowed violin are equally spaced on a linear scale, which shows them more clearly. The dB scales used have all been calculated as 20 log to the base 10 of the mobility and the normalized rms sound pressure.
Since the velocity is measured on the side of the bridge opposite to the point where the hammer strikes, or in the case of the bowed excitation ~9 mm from the string notch, the measured mobilities are transfer mobilities. To achieve comparability between the hammered and bowed results, a correction was applied to these transfer mobilities to convert them to the equivalent point mobilities. Because of the time of travel of the impulse across the bridge, the velocity lags the force. A correction can be made for this, which varies from zero at 0° at 0 Hz to approximately +45° at 10 kHz. A similar but smaller correction was made for the distance from the bowed string notch to the point where the velocity is measured. By applying these cor-rections the equivalent point mobilities were inferred and these showed close agreement between the phase when hammered and bowed.
The bowed results were initially plotted as four graphs, two for the light strokes and two for the strong strokes. The variation was only small, so the results were averaged into two graphs, one for the light stroke and one for the strong stroke. These graphs were compared closely to see if there was any evidence of the result varying nonlinearly with the strength of the bow stroke. The particular area of interest for this was in the first four harmonics (because of the effect of string length increase with transverse dis-placement). There was some evidence, more for Violin A than Violin B, that the stronger stroke had strengthened the normalized pressure at the second harmonic and weakened the 1st and 3rd harmonics. This tendency was only small and not considered significant enough to discuss in detail.
Finally, the results of all four bow strokes were averaged together in the results presented below. Each bowed result is made up of 30 pro-cess averages. Uncertainty, caused by the acous-tical characteristics of the room, was reduced by the swinging microphone, and any remaining factors here would be common to all results
6
J. Violin Soc. Am.: VSA Papers • Summer 2009 • Vol. XXII, No. 1
and therefore not affect any comparisons made. Some attempt has been made to assess the reli-ability of the results. Because of the numerous factors affecting the accuracy of the results it is not possible to present a formal error analysis or a quantitative estimate of measurement uncer-tainty. On the basis of repeatability we expect the results to have a range of uncertainty of approximately ±1 dB below 2 kHz, rising to ±2 dB above 6 kHz.
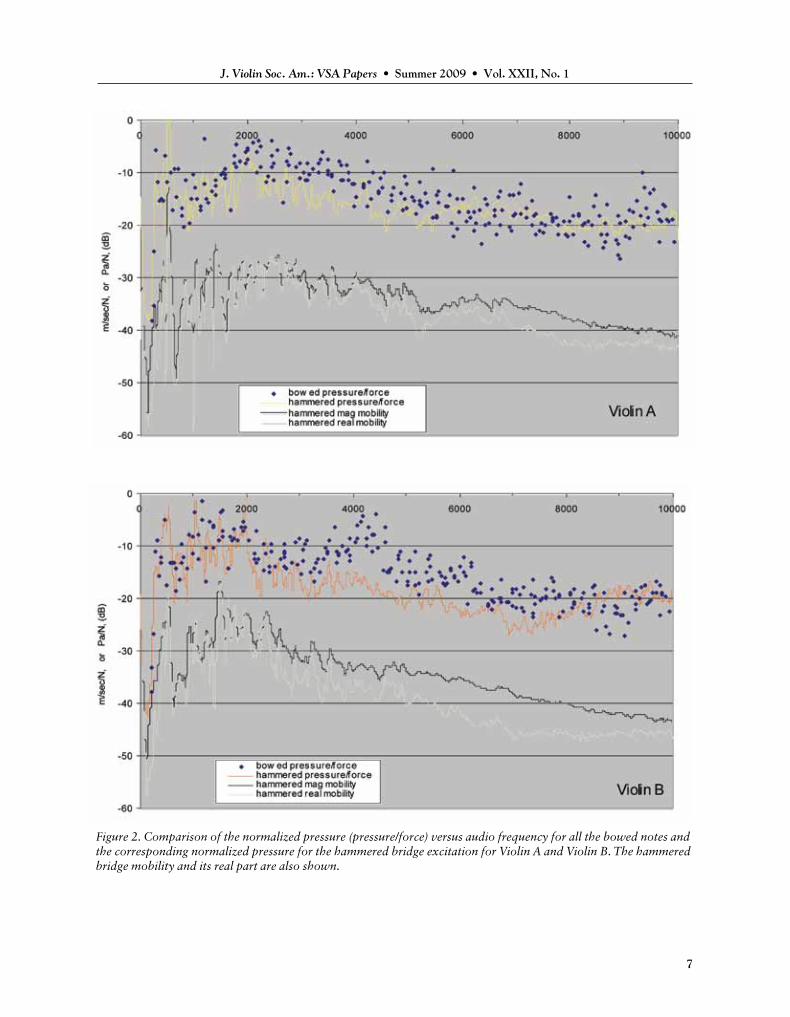
Figure 2 shows the bowed string normalized pressure for all of the seven notes specified above and their harmonics as a broad band of results. The vertical spread is well outside the range of experimental error. The response at a particu-lar frequency varied depending upon whether the excitation was by hammer or bow and also with which note was bowed. In addition to this variability, the best-fit mean of the band differs from the line of the normalized pressure found by hammering the bridge. This difference was not the same for both violins. The graph for Violin A shows that the normalized pressure was underestimated by the hammered excitation in the range 2 kHz to 8 kHz. For Violin B it was underestimated over the range 2 kHz to 8 kHz, especially so in the 4kHz region.
The time-average vibrational energy of the violin body is closely proportional to the input power from the string and therefore, for unit input force, to the real part of the mobility. The normalized pressure is closely proportional to the time-average radiated sound power. There-fore, the difference in dB between the two curves is a rough measure of the efficiency of the violin as a radiating surface. This quantity increases with frequency up to about 2 to 3 kHz and then levels off. It is clear from the various curves that the radiation efficiencies of the two violins differ considerably.
The two tested violins were selected part-ly because they had contrasting tones. The measured bowed normalized pressure can be compared with the subjectively assessed tonal quality of the violins to see what effect the shape of the pressure spectrum might have had. We have considered this on the basis of the bands suggested by Dünnwald [1]. He concluded that the band from 1300 Hz to 4200 Hz is important for brightness and clarity. Violin A is high in this area and has in fact a very bright clear sound.
Violin B is very low in this area with a big scoop down between 1500 to 4000 Hz. Again this matches the rather dull, woolly sound of the instrument. These characteristics are to some extent shown in the hammered-bridge normal-ized pressure, but the graph does significantly underestimate the response of Violin A when it is bowed.
Dünnwald suggested that, to avoid harsh-ness, the acoustic response should tail off above 4200 Hz. Neither violin is noticeably harsh and both tail off rather equally. Violin B has a much harder tonal quality than the smoother and warmer-toned Violin A. The strong response in the 4 kHz area for Violin B may well explain the harder quality. The hammered normalized-pressure graph for Violin B does not give any indication of the observed peak near 4 kHz, and indeed understates the strength of the response right out to 8 kHz. The corresponding graphs for Violin A also understate the response from 4 to 6 kHz, beyond which there is good agreement. In the range 5.5 to 8 kHz the hammered normal-ized-pressure curves for the two violins show a pronounced difference. Surprisingly, the bowed normalized pressure over this range shows very little difference.
Dünnwald also suggested that the zone from 650 to 1300 Hz should be low to avoid a nasal quality. Violin B certainly is very much stronger in this zone than Violin A. This is partly predicted by the hammered normalized-pressure curves, that of Violin A being much lower than Violin B. But the curves underestimate the difference. The actual response in the case of Violin A is close to that of the hammered response, but for Violin B it is well above the hammered response.
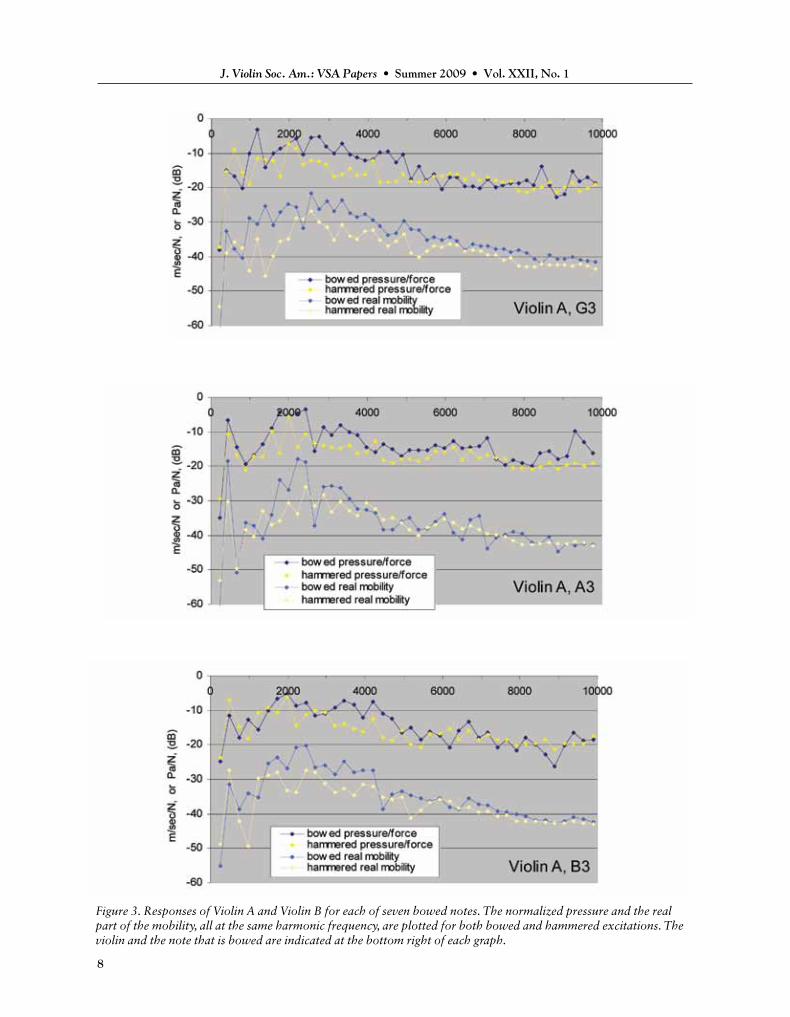
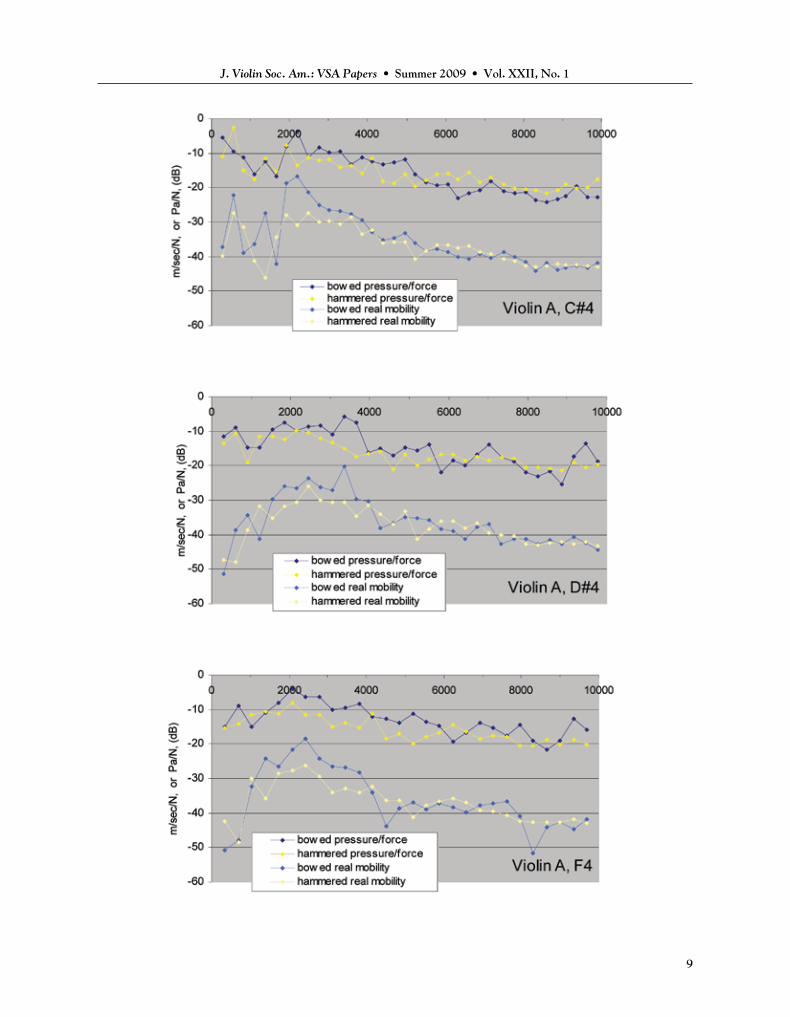
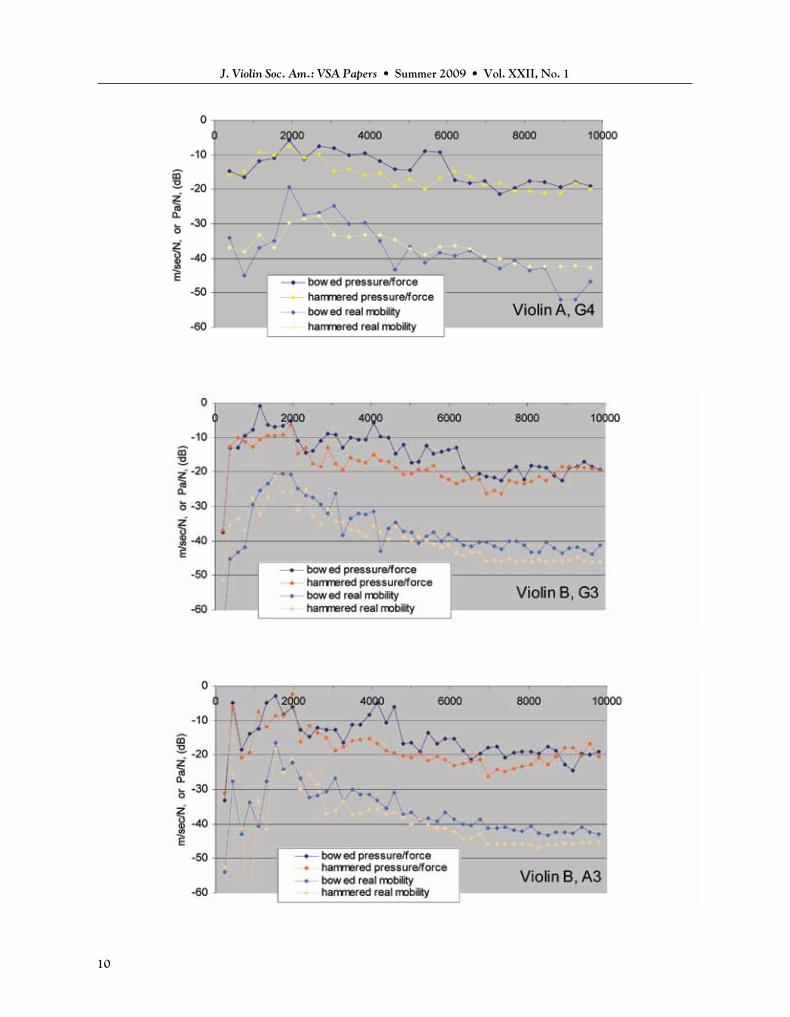
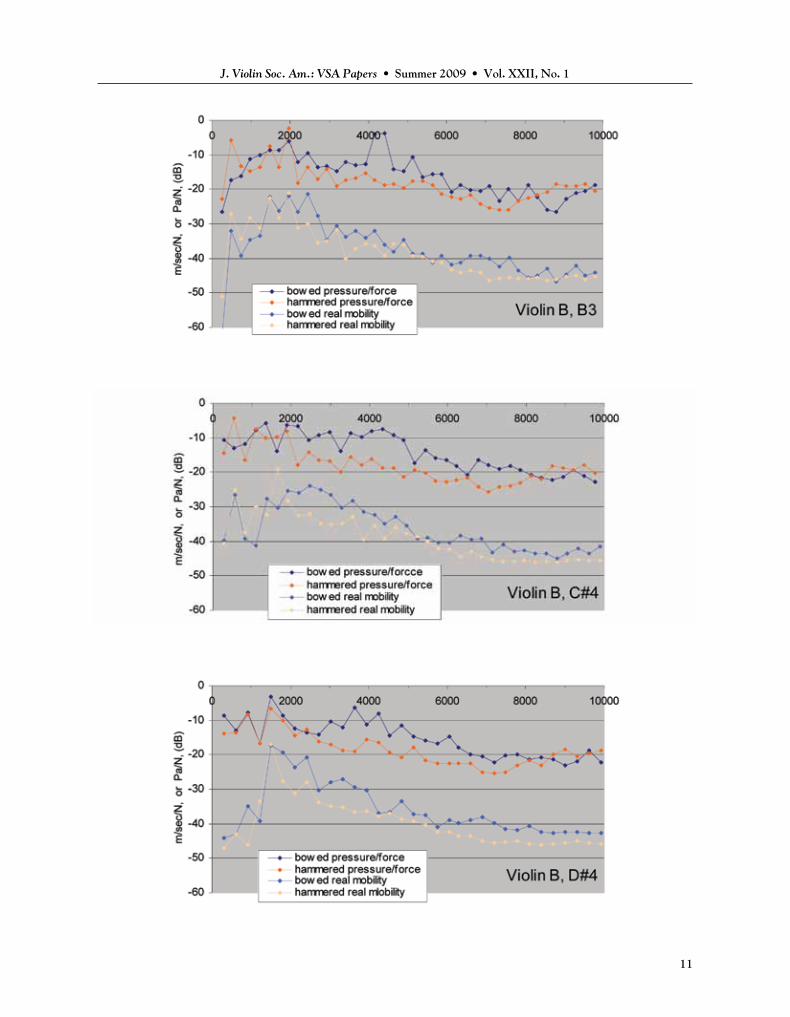
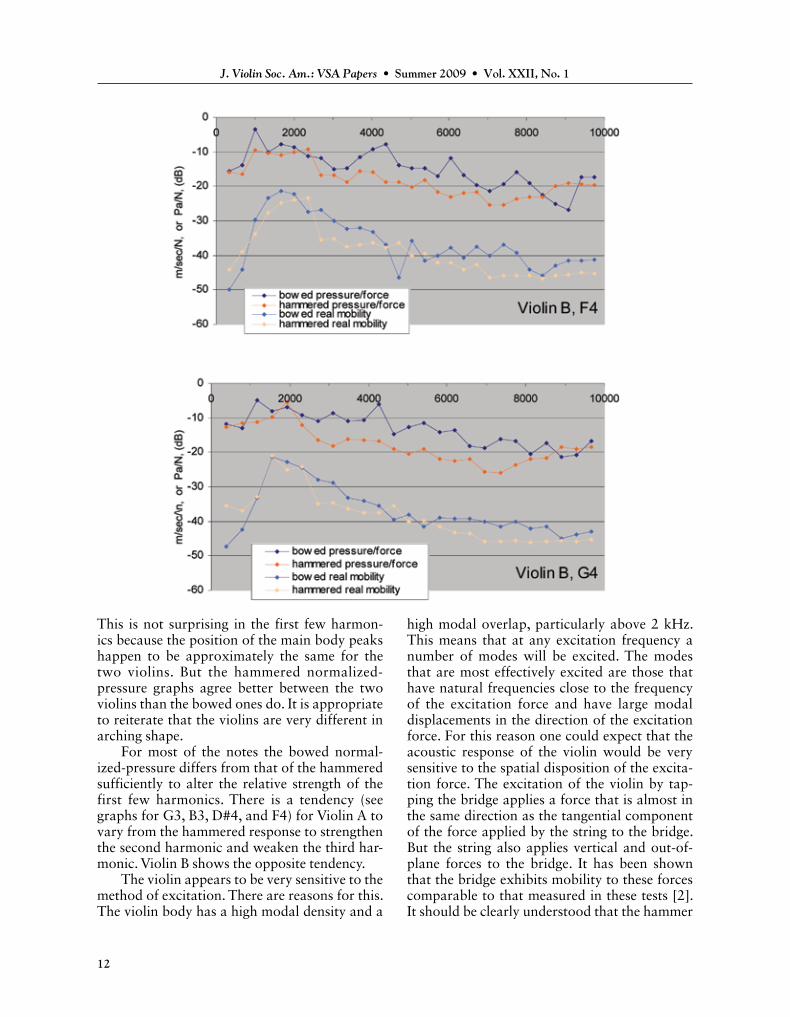
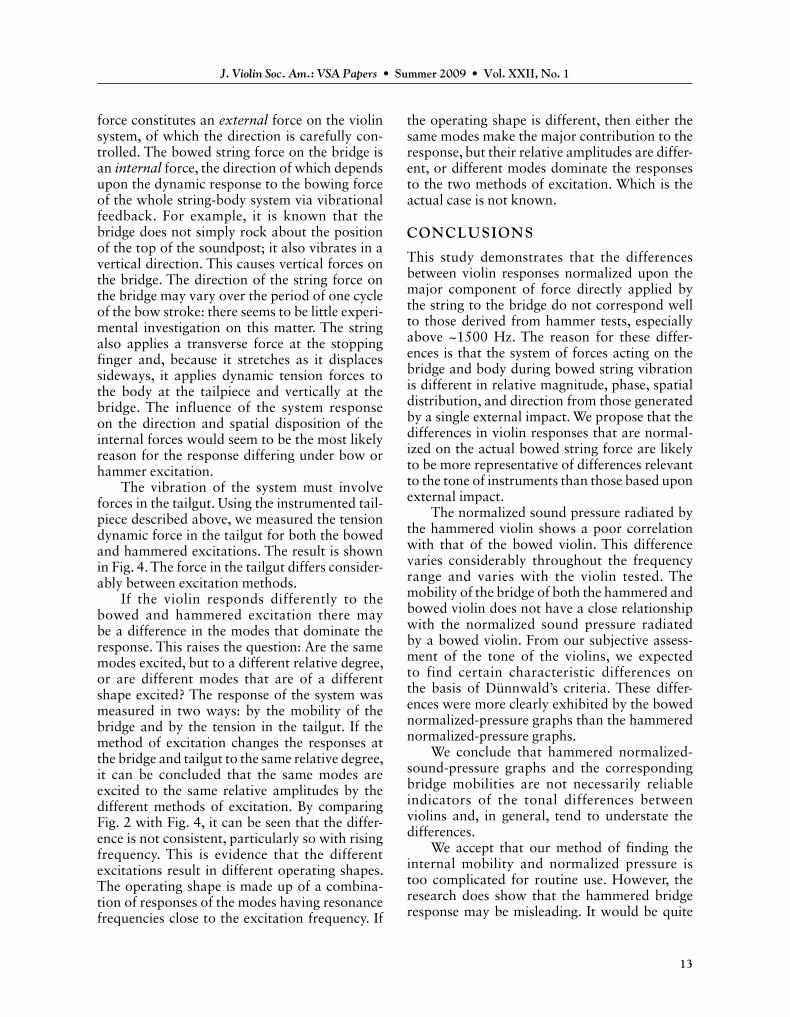
Figure 3 shows the response for each of the seven bowed notes for the two violins. In these graphs, the bowed normalized sound pressure and the real part of the bridge mobility are shown as dots. The corresponding hammered results at the same frequencies are also shown. These were selected from the measured ham-mered spectrum and averaged over a range of 35 Hz. The dots have been joined up with lines for clarity, but this does not imply any information about what happens between the dots.
These graphs show that the general shape of the normalized-pressure graphs varies more from note to note than from violin to violin.
7
J. Violin Soc. Am.: VSA Papers • Summer 2009 • Vol. XXII, No. 1
Figure 2. Comparison of the normalized pressure (pressure/force) versus audio frequency for all the bowed notes and the corresponding normalized pressure for the hammered bridge excitation for Violin A and Violin B. The hammered bridge mobility and its real part are also shown.
8
J. Violin Soc. Am.: VSA Papers • Summer 2009 • Vol. XXII, No. 1
Figure 3. Responses of Violin A and Violin B for each of seven bowed notes. The normalized pressure and the real part of the mobility, all at the same harmonic frequency, are plotted for both bowed and hammered excitations. The violin and the note that is bowed are indicated at the bottom right of each graph.
9
J. Violin Soc. Am.: VSA Papers • Summer 2009 • Vol. XXII, No. 1
10
J. Violin Soc. Am.: VSA Papers • Summer 2009 • Vol. XXII, No. 1
11
J. Violin Soc. Am.: VSA Papers • Summer 2009 • Vol. XXII, No. 1
12
J. Violin Soc. Am.: VSA Papers • Summer 2009 • Vol. XXII, No. 1
This is not surprising in the first few harmon-ics because the position of the main body peaks happen to be approximately the same for the two violins. But the hammered normalized-pressure graphs agree better between the two violins than the bowed ones do. It is appropriate to reiterate that the violins are very different in arching shape.
For most of the notes the bowed normal-ized-pressure differs from that of the hammered sufficiently to alter the relative strength of the first few harmonics. There is a tendency (see graphs for G3, B3, D#4, and F4) for Violin A to vary from the hammered response to strengthen the second harmonic and weaken the third har-monic. Violin B shows the opposite tendency.
The violin appears to be very sensitive to the method of excitation. There are reasons for this. The violin body has a high modal density and a
high modal overlap, particularly above 2 kHz. This means that at any excitation frequency a number of modes will be excited. The modes that are most effectively excited are those that have natural frequencies close to the frequency of the excitation force and have large modal displacements in the direction of the excitation force. For this reason one could expect that the acoustic response of the violin would be very sensitive to the spatial disposition of the excita-tion force. The excitation of the violin by tap-ping the bridge applies a force that is almost in the same direction as the tangential component of the force applied by the string to the bridge. But the string also applies vertical and out-of-plane forces to the bridge. It has been shown that the bridge exhibits mobility to these forces comparable to that measured in these tests [2]. It should be clearly understood that the hammer
13
J. Violin Soc. Am.: VSA Papers • Summer 2009 • Vol. XXII, No. 1
force constitutes an external force on the violin system, of which the direction is carefully con-trolled. The bowed string force on the bridge is an internal force, the direction of which depends upon the dynamic response to the bowing force of the whole string-body system via vibrational feedback. For example, it is known that the bridge does not simply rock about the position of the top of the soundpost; it also vibrates in a vertical direction. This causes vertical forces on the bridge. The direction of the string force on the bridge may vary over the period of one cycle of the bow stroke: there seems to be little experi-mental investigation on this matter. The string also applies a transverse force at the stopping finger and, because it stretches as it displaces sideways, it applies dynamic tension forces to the body at the tailpiece and vertically at the bridge. The influence of the system response on the direction and spatial disposition of the internal forces would seem to be the most likely reason for the response differing under bow or hammer excitation.
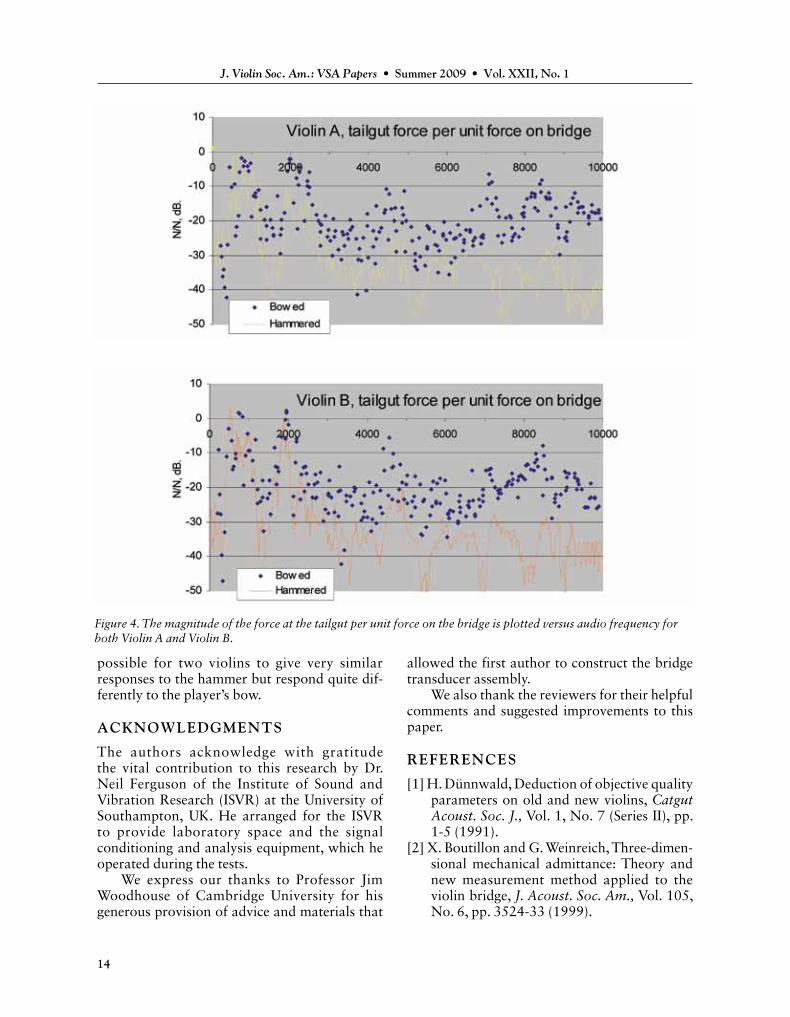
The vibration of the system must involve forces in the tailgut. Using the instrumented tail-piece described above, we measured the tension dynamic force in the tailgut for both the bowed and hammered excitations. The result is shown in Fig. 4. The force in the tailgut differs consider-ably between excitation methods.
If the violin responds differently to the bowed and hammered excitation there may be a difference in the modes that dominate the response. This raises the question: Are the same modes excited, but to a different relative degree, or are different modes that are of a different shape excited? The response of the system was measured in two ways: by the mobility of the bridge and by the tension in the tailgut. If the method of excitation changes the responses at the bridge and tailgut to the same relative degree, it can be concluded that the same modes are excited to the same relative amplitudes by the different methods of excitation. By comparing Fig. 2 with Fig. 4, it can be seen that the differ-ence is not consistent, particularly so with rising frequency. This is evidence that the different excitations result in different operating shapes. The operating shape is made up of a combina-tion of responses of the modes having resonance frequencies close to the excitation frequency. If
the operating shape is different, then either the same modes make the major contribution to the response, but their relative amplitudes are differ-ent, or different modes dominate the responses to the two methods of excitation. Which is the actual case is not known.
CONCLUSIONS
This study demonstrates that the differences between violin responses normalized upon the major component of force directly applied by the string to the bridge do not correspond well to those derived from hammer tests, especially above ~1500 Hz. The reason for these differ-ences is that the system of forces acting on the bridge and body during bowed string vibration is different in relative magnitude, phase, spatial distribution, and direction from those generated by a single external impact. We propose that the differences in violin responses that are normal-ized on the actual bowed string force are likely to be more representative of differences relevant to the tone of instruments than those based upon external impact.
The normalized sound pressure radiated by the hammered violin shows a poor correlation with that of the bowed violin. This difference varies considerably throughout the frequency range and varies with the violin tested. The mobility of the bridge of both the hammered and bowed violin does not have a close relationship with the normalized sound pressure radiated by a bowed violin. From our subjective assess-ment of the tone of the violins, we expected to find certain characteristic differences on the basis of Dünnwald’s criteria. These differ-ences were more clearly exhibited by the bowed normalized-pressure graphs than the hammered normalized-pressure graphs.
We conclude that hammered normalized-sound-pressure graphs and the corresponding bridge mobilities are not necessarily reliable indicators of the tonal differences between violins and, in general, tend to understate the differences.
We accept that our method of finding the internal mobility and normalized pressure is too complicated for routine use. However, the research does show that the hammered bridge response may be misleading. It would be quite
14
J. Violin Soc. Am.: VSA Papers • Summer 2009 • Vol. XXII, No. 1
possible for two violins to give very similar responses to the hammer but respond quite dif-ferently to the player’s bow.
ACKNOWLEDGMENTS
The authors acknowledge with gratitude the vital contribution to this research by Dr. Neil Ferguson of the Institute of Sound and Vibration Research (ISVR) at the University of Southampton, UK. He arranged for the ISVR to provide laboratory space and the signal conditioning and analysis equipment, which he operated during the tests.
We express our thanks to Professor Jim Woodhouse of Cambridge University for his generous provision of advice and materials that
allowed the first author to construct the bridge transducer assembly.
We also thank the reviewers for their helpful comments and suggested improvements to this paper.
REFERENCES
[1] H. Dünnwald, Deduction of objective quality parameters on old and new violins, Catgut Acoust. Soc. J., Vol. 1, No. 7 (Series II), pp. 1-5 (1991).
[2] X. Boutillon and G. Weinreich, Three-dimen-sional mechanical admittance: Theory and new measurement method applied to the violin bridge, J. Acoust. Soc. Am., Vol. 105, No. 6, pp. 3524-33 (1999).
Figure 4. The magnitude of the force at the tailgut per unit force on the bridge is plotted versus audio frequency for both Violin A and Violin B.


![J. Violin Soc. Am.: VSA Papers Vol. XXII, No. 1 Review of ...bormanviolins.com/pdfs/VSAPBormanandStoel.pdf · One of the current authors (BS) [9], build-ing on the quantitative use](https://img.pdfslide.us/doc/110x75/5ad49a6f7f8b9a177c8bf4d2/j-violin-soc-am-vsa-papers-vol-xxii-no-1-review-of-of-the-current-authors.jpg)