Embed Size (px)
Citation preview

j TV 930/3 S3
BARC/1993/E/003
i1
tenv nwi
IMPORTANCE OF DELAYED NEUTRONS IN NUCLEAR RESEARCHby
S. DasTheoretical Physics Division
1993

BARC/1993/E/003
ONONr -
U GOVERNMENT OF INDIAg ATOMIC ENERGY COMMISSIONCD
IMPORTANCE OF DELAYED NEUTRONS IN NUCLEAR RESEARCH
by
S. DasTheoretical Physics Division
BHABHA ATOMIC RESEARCH CENTREBOMBAY, INDIA
1993

BARC/1993/E/OO3
BIBLIOBRAPHY DESCRIPTION SHEET FOR TECHNICAL REPORT
(as per IS : 9400 - 1980)
Ol
02
03
04
05
O6
07
O8
10
Security classication s
Distribution :
Report status :
Series :
Report type :
Report No. :
Part No. or Volume No. :
Contract No. :
Title and subtitle :
Unc 1 ass i f i ed
External
New
BARC External
Technical! Report
BARC/1993/E/003
Importance of delayed neutrons innuclear research
11 Collation :
13 Project No. :
20 Personal author (s) :
119 p., 49 figs., 1O tabs.
S. Das
Affiliation of author (s) : Theoretical -Physics Division,Bhabha Atomic Research Centre, Bombay
22 Corporate author(s> :
23 Originating unit :
24 Sponsor(s) Name :
Type :
30 Date of submission :
31 Publication/Issue date
Bhabha Atomic Research Centre,Bombay - 400 085
Theoretical Physics Divison, BARC,Bombay
Department of Atomic Energy
Government
February 1993
March 1993
contd...(ii)

4O
42
50
51
52
53
Publisher/Distributor i
Form of distribution :
Language of text :
Language of summary :
No. of references :
Given data on :
Head, LibraryBhabbs Atomic
Hard Copy
English
English
refs.
and InformationResearch Centre,
D i v i s i on ,r 3ofr»bay
6O Abstract : The report presents a comprehensive review of the uses offt , n delayed neutrons in nuclear research with special emphasis onenergy spectra and reactor applications. The review covers thefollowing aspects : (1) delayed neutron in reactor analysis, (2:absolute delayed neutron yield, (3) delayed neutron decs.y constants.<4> delayed neutron energy spectra and their importance in highaccuracy criticality calculations and precise evaluation of reactorkinetics characteristics, particularly fast breeders, (5) schronological account of the developments in the maasureaent ofdelayed neuton energy spectra, both aggregate (composite) and fronindividual fission product isotopes during the last fifty years orso, (6) major spectrometry techniques for measuring delayed neutronenergy spectra, (7) spectral analysis9 (8) calculations of delaysneutron energy spectra from precursor data, and <9) sensitivityanalysis of fast reactor dynamic behaviour to delayed neutron energyspectra. Finally the report recommends a number of areas for futureresearch work on delayed neutrons.
70 Keywords/Descriptors : DELAYED NEUTRONS; REVIEWS; BETA DELAYEDNEUTRONS; REACTOR PHYSICS; REACTOR KINETICS; FISSION YIELD? NEUTRONEMISSION; ENERGY SPECTRA; NEUTRON SPECTRA; DECAY; NEUTRONSPECTROSCOPY; DELAYED NEUTRON PRECURSORS; SENSITIVITY ANALYSIS;FBR TYPE REACTORS; EXPERIMENTAL DATA
71 Class No. : INIS Subject Category s E2100; 63470
99 Supplementary elements :

ABSTRACT
This report is a comprehensive review of the uses of &~-delayed fission neutron information in nuclear research withspecial emphasis on energy spectra and the reactor applications.The report starts with a very brief introduction followed by adiscussion of the applications of delayed neutron properties innuclear structure and astrophysical studies. $3 gives the delayedneutron requirements for reactor physics purposes and points outthe difference between the physical and the mathematicalrepresentations of the delayed neutron data. In §4 and §5respectively, there are discussions of the total delayed neutronyield and the decay constants. §6 highlights the importance of anexact knowledge of delayed neutron energy spectra in highaccuracy criticality calculation and in precise evaluations ofreactor kinetics characteristics, particularly the fast breeders.The chapter also gives a skeletal description of the principalmethods that are commonly used for determining the delayed energyspectra. §7 gives a chronologic account of the developments inthe measurement of delayed neutron energy spectra, both aggregate(composite) and from individual fission product isotopes duringthe last fifty years or so, and compares the spectra, whereverpossible, with the ENOF/B evaluations. A comparison is made ofthe energy spectra of a few well-known precursors measured atdifferent laboratories. There are discussions on the majorspectrometry techniques that are employed in the measurements ofdelayed neutron energy spectra as well as on the methods ofperforming spectral analysis. This covers the response function,the efficiency and the sensitivity of the spectrometers, theirmerits and demerits and their applicability. Calculations ofdelayed neutron energy spectra from precursor data. anddecomposition of composite spectra into six-group delayed energyspectra using the summation and/or fitting procedures aredescribed in §8. §9 reviews the work of several authors on thesensitivity of the kinetic response of fast reactors to delayedneutron energy spectra. Both direct and adjoint methods arediscussed. §10 gives a summary. The report concludes in §11 witha number of recommendations for future investigations.

C O N T E N T S
PAGE NO,
ABSTRACT
§1. INTRODUCTION 1
$2. SIGNIFICANCE OF DELAYED NEUTRON EMISSION 1
2.1 Nuclear Physics Research 2
2.2 Astrophysical Applications 4
REFERENCES 6
$3. DELAYED NEUTRON IN REACTOR ANALYSIS 9
REFERENCES 10
§4. ABSOLUTE DELAYED NEUTRON YIELD 11
REFERENCES 17
§5. DELAYED NEUTRON DECAY CONSTANTS 19
REFERENCES 19
$6. DELAYED NEUTRON ENERGY SPECTRA 216.1 Importance of Delayed Neutron Energy Spectra 21
in Fast Reactor Dynamic Calculations6.2 Determination of Delayed Neutron Spectra 26
REFERENCES 28
§7. MEASUREMENT AND ANALYSIS OF DELAYED NEUTRON SPECTRA 30
7.1 Phase 1 307.2 Phase 2 327.3 Phase 3 437.4 Comparison of Spectra 517.5 Principal Detection Methods 54
7.5.1 Proton-recoil Spectrometry 547.5.2 Fast Neutron Time-of-Flight Spectrometers 57
7.5.3 3-He Spectrometers 60
7.6 Spectral Analysis 66
REFERENCES 70

PAGE NO.
§8. THEORETICAL ASPECTS 75
REFERENCES 95
§9. SENSITIVITY STUDIES 98
REFERENCES 107
$10. CONCLUDING REMARKS 110
$11. RECOMMENDATIONS 113

§ 1 . INTRODUCTION
The fundamental role of p~, n delayed fission neutrons in theoperation and time-dependent behaviour of nuclear reactors has beenknown since the early days of research in the field of fission chainreactors and is now a matter of practical experience in hundreds ofnuclear installations azound the world. These delayed neutrons ,thirty per cent of which are emitted in less than 1 s followingfission, constitute less than one per cent of the total neutronemission. Though fission is the most common way of producing delayedneutrons, production of neutron rich nuclides unstable to neutroneuission is not uniquely related to the fission process. There arealso other processes in which delayed neutrons are produced such as;delayed neutron emission subsequent to beta decay of the neutron-rich Na29-Na31 isotopes, the delayed neutron emission from theisotopes B15, C18, N19, N20, Al-34, Al-35, P39. In Na29(p")Mg2Sdecay scheme, five excited states of Mg29 are populated after p-delayed one-neutron emission. For Na30, 1n,2n delayed emissions havebeen reported [1]. The beta-delayed four neutron decay mode of B17was reported for the first time by Dufour et al [2].
Delayed neutrons are so called not because the neutrons aredelayed; the delay is because there are intermediate reactionsbefore the neutrons are emitted. For example,
2352 35f i s s i o n
(PrecursorNuclide)
8787 R r
(Daughter)
8686 R r
(GrandDaughter)
The mechanism of delayed emission of neutrons in fission is wellunderstood in principle [3,43- The p-decay of a nuclide (Z,K) withhigh decay energy, Q. can populate excited states lying above theneutron binding energy,B of the daughter nuclide (Z+1.N-1). Thesestates, from which neutron decay into the nucleus (Z+1,N-2) becomesenergetically possible, may then deexcite through the emission of aneutron. The neutrons are promptly emitted but the overall timescale is governed by the half-life of the preceding p-decay of thenuclide (Z,N), usually called the delayed neutron precursor {seefigure A). The process of delayed neutron emission is most likely tooccur in nuclides having a few neutrons in excess of a closedneutron shell because of the unusually low neutron binding energy insuch nuclides.
§2. SIGNIFICANCE OF DELAYED NEUTRON EMISSION
Since the discovery of the delayed neutron by Roberts et al in1939 [5], the majority of the interest in delayed neutron hasevolved through the various aspects of nuclear technology likethe design and operation of fission reactors, the measurement andinterpretation of reactivity effects, the dynamics and safetyanalysis of nuclear reactors, detection of fuel element failures infuel subassemblies of power reactors, fissile material assay of fuelelements, neutron flux monitoring by fissionable materials,determination of uranium content in urine from nuclear fuel

Z,N Z+17N-T Z + 1 . N - 2PRECURSOR EMITTER FINAL NUCLEUS
Flg.A-.Schematicrepresentotion of delayed-neutron emission;^ is the beta decayenergy of the precursor and Bn is the neutron binding energy of the emitter.
fabrication plant workers by delayed neutron counting £63, etc.While determining the worth of reactivity in a nuclear reactor froman analysis of the tine behaviour of the delayed neutrons, the beta-decay properties (group yields and decay constants) of delayedneutrons which affect the length of reactor period are required £7].The amount of decay heat after reactor shut-down is governed by thedecay properties of beta-delayed neutrons C*3• Chemical propertiesof individual delayed neutron precursors are important in reactorswhose precursors are transported out of the core region resulting ina corresponding loss of reactor control [9]. Examples of suchsystems are: reactors operating at very high temperatures, reactorswith continuous fuel reprocessing and reactors with circulatingfuel. However, interest in delayed neutron information goes beyondnuclear power as for example in nuclear structure and astrophysicsapplications.
2.1 Nuclear Physics Research
Studies of delayed neutron emission give important information onnuclear structure such as the matrix elements in beta-decay, leveldensities at medium excitation energies, the competition betweenneutron and gamma emission and through the decay energies involvedon the shape of the nuclear energy surface. Delayed neutrons serveas a tool for studying the fission process yielding information onthe fission fragment mass and charge distributions of various nucleifor different excitation energies, blowing P (delayed neutronemission probability) values and the yields of precursors, one canobtain an idea of the competition among the different types offiss?.on. Improvements in theoretical nuclear models for estimatingbeta-decay properties using beta strength functions,S_,etc. Klapdor[10-12] has shown that the structure in S. • I O,(E)B£(E)/D MeV 1
P T w v

sec"1 (with e being the level density in the daughter nucleus, B thereduced transition probability, and D = 6250 sec) are decisive forthe p-decay half-lives, the spectra of p-delayed particles and p-delayed fission rates and are crucial for obtaining reliableresults. It is important to point out that the shape of the betastrength function,Sg is of great importance for various processesand problems [12]. These ranget in nuclear physics, from theproblem of determining fission barriers from beta-delayed fission,interpretation of reactor neutrino oscillation experiments, theproduction of transuranium elements by thermonuclear explosions tosuch technical problems as the control of Pu-fuelled fast breederreactors and optimizing the emergency cooling system of reactors. Inastrophysics, the shape of SB governs the electron capture indegenerate cores of stars, thep neutrino cooling, the speed ofgravitational collapse in the initial phase, the processes (r- or n-process) responsible for the production of heavy elements in theuniverse and the unsolved problem of identifying the astrophysicalsite of such processes.
Determination of p-decay properties by high resolution delayedneutron spectroscopy provides new insight into nuclear structure offar-unstable nuclei [13,143- This is because for such nuclei, p-decay energies (Qfl) increase from less than one MeV to over 1O MeV(corresponding half^lives decrease down to milliseconds) and neutronbinding energies (B ) decrease with distance from p-stability as aresult of which delayed neutron emission becomes the more importantprocess. The overall shape of a delayed neutron spectrum is given by
* - € • •
i (E ) = t < i!; >_ . < ir/tr*; + r^n.,n n L£ P E^ n n i Eft
where, the first factor defines the p-decay intensity to neutronunbound levels and contains information about nuclear structure. Thesecond factor gives the probability f of delayed neutron emissionfrom these states according to their decay widths. For far-unstablenuclei having high level density Q( E ) , average p-decay propertiesare defined in terms of the p-strength function, Sa as-.
p
where, the average is taken over many narrowly spaced states insteadof the individual levels and the Fermi function f ("10 ) includesthe kinematic and the phase-space effects. In delayed neutronemission, the influence of r on the spectral shape of delayedneutrons is small since low-1 ^wave delayed neutrons are mostlyemitted and the coulomb barrier plays an unimportant role.Consequently, the factor r in the equation approaches unity even atneutron energies of 50 to 100 keV. This makes it possible to extractfrom the spectra reliable information on high energy p-decayproperties. For a detailed discussion of the average energies andbeta strength function, readers may refer to [15,16]. Delayedneutron spectroscopy including n-f-coincidence measurements allows toextend our knowledge of excitation spectra of far-unstable nuclei

beyond 10 MeV such as the verification of discrete nuclearstructures beyond gross statistical properties, identification ofnuclear shape changes via corresponding variations in the structureof Sfi, determination of 'quenching' of the Gammow-Teller strengthin eXotic nuclei [16,17], determination of Qfi, B from theknown 0-decay energies and the measured (Qfl"
Bn> valHe. Delayed
neutron spectroscopy offers a tool for studying individual levelsand for deriving reliable e(E) for far-unstable nuclei [18].Knowledge of individual levels is important for interpreting thepeak structure in delayed neutron spectra. This was tested in thecase of the compound nucleus Kr87 [19] whose neutron-unbound levelsare accessible to both 0-decay and neutron capture. Besides Kr87,the only other nucleus that is a daughter of a delayed neutronprecursor and that is also accessible with neutrons on a stabletarget is Xe137. However,.the neutron emitting levels in Xe137 haverelatively high spins (5/2*,7/2 ,9/2*) and therefore, the overlapbetween 0 decay and resonance neutron spectroscopy in Xe137 is notexpected to be as clean or dramatic as in Kr87. In the delayedneutron spectrum of Br87, in the first 250 keV, fourteen resonancesout of the seventeen observed p-wave capture resonances have beenidentified. With improved resolution of the techniques of neutronspectra measurements, it is possible to determine the natural linewidths for individual states and to obtain better evaluation oflevel density. This way a preliminary value of (300+40) keV wasdeduced for the natural width of the 14-keV resonance in Rb-95 byD.D. Clark, R.D. McElroy, T.-R. Yeh [15,p.449-454].
2.2 AstrophysicsI Applications
The rapid-neutron-capture process (r-process) of nucleosynthesisin astrophysics involves the progressive build-up of heavierisotopes via neutron captures proceeding on neutron-rich isotopesfar off the valley of beta stability, interspersed by beta decaystowards the stable regions [20]. The process is defined by thecondition T < tQ, where T is the life time for neutron capture andT. is the lrfe time for beta unstable nuclei. Its abundance featuresreflect nuclear properties. Also, the process forms the importantlong-lived nuclear chronometers Th-232, U-238 and U-235 which areutilized for dating the galaxy. Although, the astrophysical site ofthe r-process nucleosynthesis is not yet identified, its associationwith type II supernovae is strongly suggested. Knowledge of r-process nucleosynthesis enables to put limits on the duration ofgalactic nucleosynthesis, on the age of the Galaxy and the Universe.
The character of the astrophysical r-process is dictated bynuclear properties in the neutron-rich region. One of these physicsproperties which is of fundamental importance in r-processcalculations is the rate of beta-delayed neutron emission (P andP2n*" T n e °*ner t w o a r e : neutron capture cross-sections and thebeta-decay lives. The determinations of these properties areimportant to verifying empirical or physical models.
For the vast majority of nuclei in the r-process path,experimental information being non-available, it has becomenecessary to develope reliable theoretical methods for determiningvarious inputs to the calculations. In determining neutron cross-
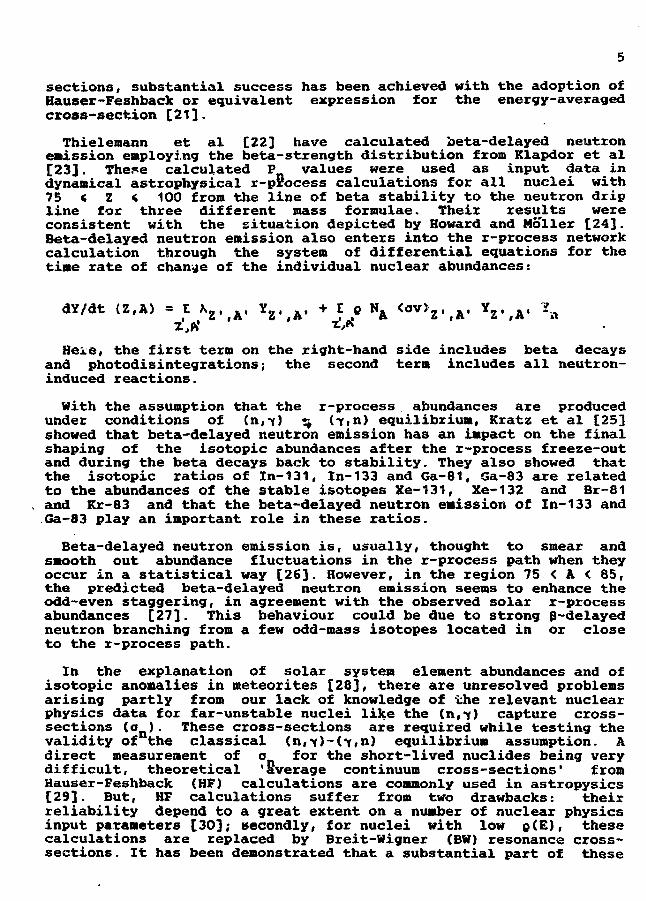
sections, substantial success has been achieved with the adoption ofHauser-Feshback or equivalent expression for the energy-averagedcross-section [21].
Thielemann et al [22] have calculated beta-delayed neutronemission employing the beta-strength distribution from Klapdor et al[23] • The^e calculated P values were used as input data indynamical astrophysical r-process calculations for all nuclei with75 < Z < 100 from the line of beta stability to the neutron dripline for three different mass formulae. Their results wereconsistent with the situation depicted by Howard and MoHer [24].Beta-delayed neutron emission also enters into the r-process networkcalculation through the system of differential equations for thetime rate of change of the individual nuclear abundances:
dY/dt (Z,A> - E X2,(A. Y 2 . A . + I e N & <ov>2,|A. Yx.fJk. ln
Heie, the first term on the right-hand side includes beta decaysand photodisintegrations; the second term includes all neutron-induced reactions.
With the assumption that the r-process . abundances are producedunder conditions of (n,i) «j (Tin) equilibrium, Kratz et al [25]showed that beta-delayed neutron emission has an impact on the finalshaping of the isotopic abundances after the r-process freeze-outand during the beta decays back to stability. They also showed thatthe isotopic ratios of In-131, In-133 and Ga-81, Ga-83 are relatedto the abundances of the stable isotopes Xe-131, Xe-132 and Br-81and Kr-83 and that the beta-delayed neutron emission of In-133 andGa-83 play an important role in these ratios.
Beta-delayed neutron emission is, usually, thought to smear andsmooth out abundance fluctuations in the r-process path when theyoccur in a statistical way [26]. However, in the region 75 < A < 85,the predicted beta-delayed neutron emission seems to enhance theodd-even staggering, in agreement with the observed solar r-processabundances [27]. This behaviour could be due to strong 8-delayedneutron branching from a few odd-mass isotopes located in or closeto the r-process path.
In the explanation of solar system element abundances and ofisotopic anomalies in meteorites [28], there are unresolved problemsarising partly from our lack of knowledge of the relevant nuclearphysics data for far-unstable nuclei like the (n,t) capture cross-sections (<*„)• These cross-sections are required while testing thevalidity of the classical (n,f)-(*f,n) equilibrium assumption. Adirect measurement of o for the short-lived nuclides being verydifficult, theoretical 'average continuum cross-sections' fromHauser-Feshback (HF) calculations are commonly used in astropysics[29]. But, HF calculations suffer from two drawbacks: theirreliability depend to a great extent on a number of nuclear physicsinput parameters [30]; secondly, for nuclei with low o(E), thesecalculations are replaced by Breit-Wigner (BW) resonance cross-sections. It has been demonstrated that a substantial part of these

input parameters can be derived from the 'inverse reaction' to n-capture, i.e., delayed neutron emission [19,30]. The actual inverserelationship demonstrated for Kr-87 is important for astrophysicalapplications in that high-resolution delayed neutron spectra ofisotopes such as Br-87 permit us to determine the relevantparameters of special 1 -wave resonances as well as an experimentalcross-section for the particular wave type(s). From this, partialcross-section and a reliable total o -rate can be derived [30].Using this method, level parameters of a number of unstableisotopes, for which high resolution delayed neutron spectra exist[31], have been determined. Results indicate that the o -valuesobtained with correct input parameters differ considerably from theearlier HF-rates [29].
Sandier et al [32] have given an explanation of the Ca-Ti isotopeanomalies found in high temperature meteoritic inclusions, inparticular in the EK-1-4-1 inclusion from the Allende meteorite. Inorder to confirm this, the systems Ca47-Ca5O(n,Y) were studied viatheir 'inverse reactions' K48-K51 O,n) [33]. These systems beingnuclei with low e(E), their individual resonances dominate the totalo -rate. Combining the delayed neutron spectrum of K4S with shellmSdel calculations, it has been shown that the low resonantcontribution (of 2-3\) to the total Ca48 (n,t) rate is due to thespecific particle-hole structure of Ca49 which excludes both s-wavecapture and delayed neutron emission upto about 1 MeV. This suggeststhat for the doubly-magic target Ca48, direct radiative capture isthe dominant reaction mechanism. Another example is the possiblenon-statistical behaviour of the reaction Ca49+n [32].
In ref.[32], Sandier et al have also given an explanation of theTi49/TiS0 abundance ratio. Although, existence of a low-energy s-wave resonance in Ca-50 could be verified from the delayed neutronspectrum of K-50, Sandier \s suggestion could not be confirmed asmeasurements of partial decay widths of Ca-50 revealed a too lowupper limit for the BW-rate. Further investigations have indicatedthat inclusion of the decay mode of delayed neutron emission ofneutron-rich S to K isotopes into n-capture process models ratherthan finding a rates of particular isotopes way explain the solarCa48/Ca46 abundance ratio and also the observed meteoritic Ca-Tiisotu£>ic anomalies of Ek-4-1 [33].
REFERENCES
1) D. Guillemaud-Mueller, C. Detraz, H. Langevin and F. Naulin, M.De Saint-Simon, C. Thibault and F. Touchard: Nucl. Phys. A426(1984) 37-76.
2) J.P. Dufour, R. Del Moral, F. Hubert, D. Jean, M.S. Pravikoff,A. Fleury, H. Delagrange, A.C. Mueller, K.-H. Schmidt, E.Hanelt, K. Summerer, J. Frehaut, M. Beau, G. Giraudet: AIPConference Proceedings 164, Nuclei Far From Stability FifthInternationaL Conference, Rosseau Lake, Ontario, Canada, 1987(American Institute of Physics, New York, 1988) 344-353.

3) Niels Bohr and John Archibald Wheeler: Phys. Rev. 5j6_ (1939) 426-450.
4) L. Tomlinson-. Nucl. Techn. ±4 (1972) 42-52.
5) R.B. Roberts, R.C. Meyer, P.Wang: Phys. Rev. 5JL (1939) 5"i0 and664.
6) D.R. Weaver: Nucl. Energy 2J_, No.2 (1988) 69-71.
7) S. Das: Dynamic measurement of reactivity in PURNIMA zero energyfast reactor, MSc Thesis, University of Bombay, Bombay, India(1977) vir 158 leaves (Unpublished).
8) S. Das: Physics News, 23, No.1&2 (1992) 27-50. Also see J.K.Dickens: Nucl. Sci. Eng. 109. (1991) 92-102.
9) James A. Lane, K.G. MacPherson, Frank Maslan (Ed.): Fluid FueLReactors (Addison-Wesley Publish:.nj Company, Inc., Reading,Massachusetts, U.S.A., 1958)979p.
10) H.V. Klapdor: Phys. Rev. C2J3 (1981) 1269-1271.
11) H.V. Klapdor, T. Oda and J. Metzinger: Z. Phys. A299 (1981) 213-229.
12) H.V. Klapdor and C O . Wene: J. Phys. G Nucl. Phys. S. (1930)1061-1104.
13) W. Mittig: Nucl. Phys. AS38 (1992) 6O9c-S18c.
14) Allan Bromley (Ed.): Treatise on Heavy-ion Science, Volume 8Nuclei Far From Stability (plenum Press, New York and London,1989) 3-727.
15) R.E. Chrien, T.W. Burrows (Eds.): NEANDC Specialists' Meeting onYields and Decay Data of Fission Product Nuclides, (Report BNL51778, Brookhaven National Laboratory, Upton. New York,1983)583p.
16) K.-L. Kratz: Nucl. Phys. A417 (1984) 447-476.
17) T. Sekine: Nucl. Phys. A467 (1937) 93-114.
18) Ian S. Towner (Ed.): AIP Conference Proceedings 164, Nuclei FarFrom Stability Fifth International Conference, Rosseau Lake,Ontario, Canada, 1987 ( American Institute of Physics, New York,1988) 1-869.
19) S. Raman, B. Fogelberg, J.A. Harvey. R.L. Macklin and P.H.Stelson: Phys. Rev. C28. (1933) 602-621.
20) John J. Cowan, F.K. Thielemann and James W. Truran: Phys. Rep'c.208, NOS. 46e5 (1991) 267-394.

8
21) Halter Hauser and Herman Feshbach: Fhys. Rev. £2, No.2 (1952)366-373.
22) F.-K. Thielemann, J. Metzinger and H.V. Klapdor: Z. Phys. A3O9(1983) 301-317.
23) H.V. Klapdor, J. Metzinger and T. Oda: At. Data Nucl. DataTables 21 (1984) 81-111.
24) tf.M. Howard and P. Nollex: At. Data Nucl. Data Tables 2J. (1980)219-285.
25) K.-L. Kratz, F.K. Thielemann, W. Hillebxandt, P. Moller, V.Harms, A. Wohr and J.V. Truran: J. Phys. G Nucl. Phys. 14. Suppl(1988) S331-S342.
26) Takeshi Kodama and Kohji Takahashi: Nucl. Phys. A239 (1975) 489-510.
27) K.-L. Kratz, V. Harms, W. Hillebrandt, B. Pfeiffer, F.-K.Thielemann and A. Wohr: Z. Phys. A336 (1990) 357-358.
28) William A. Fowler: The Neutron and Its Applications, 1982,Institute of Physics Conference Series Number 64 (The Instituteof Physics, Bristol and London, 1983) 83-88.
29) J.A. Holmes, S.E. Woosley, William A. Fowler and B.A. Zimmerman:At. Data Nucl. Data Tables 1J. (1976) 305-412.
30) K.-L. Kratz, W. Ziegert, W. Hillebrandt and F.-K. Thielemann:Astron. Astrophys. H5_ (1983) 381-387.
31) M. Wiescher, B. Leist, W. Ziegert, H. Gabelmann, B. Steinmuller,H. Ohm, K.-L. Kratz, F.-K. Thielemann, W. Hillebrandt: AIPConference Proceedings No. 125, Fifth International. Symposium OnCapture Gamma-Ray Spectroscopy and Related Topics, September 1O-14, 1984, Knoxville, Tennessee, USA (American Institute ofPhysics, New York, 1985) 908-911.
32) David G. Sandier, Steven E. Koonin and William A. Fowler: TheAstrophysical Journal 211 (1982) 908-919.
33) Wolfgang Ziegert, Michael Wiescher, Karl-Ludwig Kratz,Friedrich-Karl Thielemann, Wolfgang Hillebrandt, JoachimKrumlinde and Peter Holier: Nuclear Data for Basic and AppliedScience, Volume 1, Proceedings of the International Conference,Santa Fe, New Mexico, 13-17 May 1985 (Gordon and Breach, SciencePublishers,Inc., 1S86) 985-988.
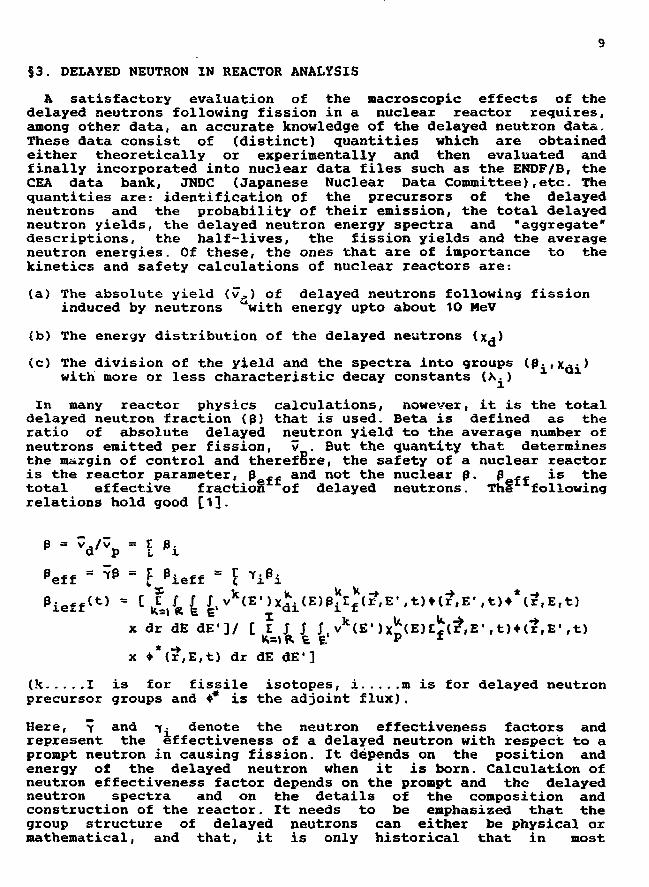
§3. DELAYED NEUTRON IN REACTOR ANALYSIS
A satisfactory evaluation of the macroscopic effects of thedelayed neutrons following fission in a nuclear reactor requires,among other data, an accurate knowledge of the delayed neutron data.These data consist of (distinct) quantities which are obtainedeither theoretically or experimentally and then evaluated andfinally incorporated into nuclear data files such as the ENDF/B, theCEA data bank, JNDC (Japanese Nuclear Data Committee),etc. Thequantities are: identification of the precursors of the delayedneutrons and the probability of their emission, the total delayedneutron yields, the delayed neutron energy spectra and "aggregate"descriptions, the half-lives, the fission yields and the averageneutron energies. Of these, the ones that are of importance to thekinetics and safety calculations of nuclear reactors are-.
(a) The absolute yield (v.,) of delayed neutrons following fissioninduced by neutrons "with energy upto about 10 MeV
(b) The energy distribution of the delayed neutrons (xd)
(c) The division of the yield and the spectra into groups (p.,xd-)with more or less characteristic decay constants (X.)
In many reactor physics calculations, nowever, it is the totaldelayed neutron fraction (p) that is used. Beta is defined as theratio of absolute delayed neutron yield to the average number ofneutrons emitted per fission, v . But the quantity that determinesthe margin of control and therefore, the safety of a nuclear reactoris the reactor parameter, 3 f~ and not the nuclear 0. P ** is thetotal effective fraction1 of delayed neutrons. The followingrelations hold good [13.
Peff
P H p f f(t) = [ ? / / / ,
x dr dE dE']/ [ E J J J, vk(E' )x^(E)E^(r>,E',t)*(r,E' ,t)
x **lx,E,t) dr dE dE']
(k I is for fissile isotopes, i m is for delayed neutronprecursor groups and •* is the adjoint flux).
Here, ~ and t- denote the neutron effectiveness factors andrepresent the effectiveness of a delayed neutron with respect to aprompt neutron in causing fission. It depends on the position andenergy of the delayed neutron when it is born. Calculation ofneutron effectiveness factor depends on the prompt and the delayedneutron spectra and on the details of the composition andconstruction of the reactor. It needs to be emphasized that thegroup structure of delayed neutrons can either be physical ormathematical, and that, it is only historical that in most

10
applications of delayed neutrons, the nuclear technology industryhas been content to work with the much simpler temporal grouprepresentation of delayed neutron enission obtained from themeasured aggregate data. These groups have no true physical basisand the generally accepted six-group delayed neutron data of Keepinet. al [2,3] is a mathematical one. They originated as six-term,twelve-parameter optimum least-squares fit to experimentallymeasured count rates following fission pulse and saturationirradiation experiments in critical assemblies. Obviously, there aredisadvantages in attempting to work with the large number ofequations, one for each precursor, when studying reactor kinetics.It is only relatively recently that Perry et al [4j and Brady andEngland [5] have reported the results of kinetics calculations usingindividual precursor data.
The difference between the mathematical and the physicalrepresentation of delayed neutron data is that while in the former,different fissile isotopes have different X.'s and different Xdj's,in the latter, the h.'s and xd- 's fox the physical precursorgroups are independent of the fissile material in which the fissionoccurred. Since, each mathematical group represents delayed neutronscontributed from different fission product nuclei, the delayedneutron spectra of the mathematical groups will be time-dependent.
REFERENCES
1) A.F. Henry: Nucl. Sci. Eng. 3 (1958) 52-70.
2) G.R. Ksepin, T.F. Wimett and R.K. Zeigler: Phys. Rev. 107 (1957)1044-1049.
3) G.R. Keepin, T.F. Wimett and R.K. Zeigler: J. Nucl. Energy 6.(1957) 1-21.
4) R.T. Perry, W.B. Wilson, T.R. England and M.C. Brady. RadiationEffects 9JL (1986) 43-48.
5) M.C. Brady and T.R. England: Nucl. Sci. Eng. 1Q2 (1989) 129-149.

11
§4. ABSOLUTE DELAYED NEUTRON YIELD
The absolute delayed neutron yield (7 ) of a fissile isotope isthe number of delayed neutrons emitted per fission. Since the firstdetection of delayed neutron emission, yields for a variety offissionable isotopes have been measured, calculated and evaluated inthe neutron energy range of 0 to about 10 MeV (the energy region ofinterest in reactor physics and design) using various forms ofnuclear fission such as neutron fission, charged-particle fission,photofission and spontaneous fission. Many measurements have alsobeen made near 14 to 15 MeV. For detailed reviews and discussions onthe subject, readers may refer to [1-12].
The reported delayed neutron yield measurements for fission causedby 14-15 MeV neutrons appear to fall into two groups: one of highvalues, measured prior to 1966, and one of low values, measuredlater. The latter values are in reasonable agreement withpredictions and the former values are consistent within themselveswhen compared between isotopes at 14-15 MeV. Waldo et al [7]obtained an expression for the yield of beta-delayed-neutrons by aleast-squares-fit of the available data (excluding Np237photofission, U234 photofissioti and Cf252 spontaneous fission). Theexpression, which has an accuracy of ±9%s is:
YDN ( p e r 1 0° f i s s i c m s) = exP (16.698 - 1.144Zc + O.377A(_i)
where, A and £„ are the composite mass and charge of thefissioning material? Correlations such as this are useful inestimating delayed neutron yields for unmeasured nuciides. Forexample, the contribution of Pu238 or U236 fission in reactors withthese minor contributions can be estimated using such a correlation.
Tuttle [4,5] prepared an extensive review of the measurements ofv, and also an evaluation. The uncertainties listed for thecalculations were based on fission product yield uncertainties inENDF/B-V and the P uncertainties. &. 1O0% uncertainty wae assignedto the estimated" P values. Except for 0235 thermal fission, thecalculated uncertainties were probably small. The v, calculationswere sensitive to the yield distribution along each mass chain. Thisyield distribution was based on models using parameters derivedlargely from 0235 independent yields. Errors in the most probablecharge or nuclear pairing effects could readily alter the v, values;even if mass chain yields were exact. Most (""90%) of the delayedneutrons are emitted from odd-Z precursors, and a relatively smallerror in the pairing could result in a large error in v, . Morerecently, Tuttle [11] combined the experimental information ondelayed neutron yields from nuclear fission induced by broad-spectrum and narrow spectrum neutrons, photofission and spontaneousfission with the calculated values in a unified manner to provide aconsistent set of energy-dependent evaluated yields for 44 fissionreactions from Th-'i27(n,f) to Fm-256(sf). The data were integrated,extended and interpolated using the observed systematic dependenceof yield on the parameters Z , A and E [13] of the fissioningnucleus. The evaluation provided estimates for yields from zero

12
excitation energy (corresponding to spontaneous fission) to fissioninduced by 15-MeV neutrons. The evaluation process consisted infirst combining the prepared absolute and relative measurements toproduce measured (and calculated} yield values at specifiedenergies. These values were then used to generate a continuouspointwise curve. This curve and an adjusted curve from thesystematics calculation were used to produce the evaluated yields.These evaluated yields were then used to convert the relativemeasurements to absolute values and the process continued.Uncertainty estimates were provided over the energy range. They weredetermined by a combination of the uncertainties expected for theaveraged values used in the first curve generation and the maximumof the expected and the observed uncertainties derived from thesysternatics calculation.
Comparison of the evaluated yield with the recommended yield fromthe 1974 evaluation of Cox [3], used in ENDF-B, showed goodagreement below 7 MeV, but above this energy Tuttle's evaluation wassignificantly higher. The evaluation showed considerably morestructure in the energy variation than was possible before. Theevaluation also provided information on the delayed neutron yieldfor poorly known fission reactions, such as U-237(n,£) (see figure Bbelow). For this reaction, the evaluated yield was based on thesingle input value calculated by T.R. England and B.F. Rider [10,pp.33-64] at an estimated effective neutron energy of 1 MeV.
0.0600
o_>LU
0.0000
I I I I I I I I I I I I i I
INCIDENT NEUTRON ENERGY (MeV)Fig. Bt Evaluated yield values for neutron inducedfission of U-237.
16

13
The relation for g (see §3) shows that error in g comes fromerrors in v, and v . Error in beta-effective comes from error in thecalculation of -yp due to the incomplete knowledge of delayedieutron spectra. According to Hammer [14], the target accuracy onbeta-effective deduced from power reactor and critical experimentrequirements is 13'. (1a). To achieve this, one has to determine theabsolute yields with a +1.5% error margin for the major fissileisotopes U235, 0238 and Pu239. For a fast breeder reactor, one hasto know the plutonium higher isotopes (Pu240, Pu241) data with anuncertainty of ±7% and for Pu242, Am241 the accuracy required is±20\. The present dispersion between the various evaluated resultsis higher than the maximum uncertainty required for the evaluatedresults. Also, major contributions are currently being made by thecalculated values. There is, therefore, a need for additionalexperimental measurements of the broadest possible scope andcomprehensiveness to complement the existing data base.
Although the total delayed neutron yield has been measured foi•any isotopes, the recent experimental work on precursors allowssummation calculations such as the following [15] to determine v, .
vd = / / xd(E,t) dE dt = [ Pn 1 Yj(t) dt
where, Xj(E,t) is the delayed neutron spectrum, P is theprobability of delayed neutron emission by a precursor11 n and Y (t;is the effective time-dependent precursor yield from the fissionprocess. The primary purpose of v, calculations is to test thefission pzoduct yield.
Table 1 lists the results of recent 7, calculations andcomparative results from evaluations and selected measurements. TheT, F, and H following the fissionable nuclide refer, respectively,to the thermal, fast, and high energy (-14 MeV) fission. Because ofthe large number of v, measurements, particularly for some of thefissionable nuclides, only a selection of these are listed here.
Calculation marked ENDF/B-VI used preliminary ENDF/B-VT fxssionyields. Calculation marked ENDF/B-V used evaluated fission yields ofthe precursors . and their P values from ENDF/B-V. Generally, thecalculated v. is very good. v,nvalues for U238 and Th232 suggestthat either an improvement in ENDF/B fission yields is needed or theevaluated experimental 7, values are in significant error. Table 2compares relative abundances of the six time groups for three fuels.The values in Table 2 are expressed as a per cent of v,. Results ofTables 1 and 2 show that using the measured delayed neutron data forprecursors, the model calculations and the evaluated fission productyields, one can do reasonably accurate summation calculations of thetotal v. and its relative abundance in each of the conventional sixtime-groups for a variety of fissioning nuclides and neutron fissionenergies. Table 3 lists the total v, and its dependance on theneutron fission energy as incorporated into ENDF/B-V [19]. Figure 1gives a typical representation of it. Here, "linear" refers to alinear interpolation in v, versus energy for the specified range,and "constant" refers to a constant value of v, over the noted

14
Table 1: Comparison of total delayed neutron yield per 100 fissions
FissionNuclide
232™Z3ZTh2332 3 32 3 3 [ J
2 3 52 3 52 3 S U
2 3 S U
2 3 82 3 8 u2 3 7Np
2 3 9PU2 3 9 PU2 3 9 PU
2*°PU
Pu
2 4 2 Pu
252cf
(F)(H)
(T)(F)(H)
(T)(F)(H)
( F )
(F)(H)
( F )
(T)(F)(H)
( F )
(T)(F)
(F)
( s )
C a l c u l a t e dENDF/B-VI
C16]
5.70 ± 1.084.15 ±1 .07
0.968^0.247O.9O7iO.1570.704+0.138
1.78 ±0.152.07 ±0.2931.09 ±0 .193
2.32 20.344
4.03 £0.4352.71 ±0.385
1.14 ±0.158
0.763+0.050.67910.093O.379iO.O76
O.8O6±O.1O9
1.39 10.1251.39 +0.165
1.40 ±0.169
O.6O8±O.O69
CalculatedENDF/B-V
[17,18]
4.76 +0.343.03 t0.29
0.846+0.0660.916+0.089O.7O82O.O95
1.77 ±0.0811.98 +0.180.978+0.097
2.26 ±0.19
3.51+0.272.69+0.21
1.28+0.13
0.769+0.05aO.724±O.O9O0.387+0.062
0 .923+0.11
1.58 ±0.131 .49 ±0 . 16
1.41+0.14
O.69O±O.O92
EvaluatedENDF/B-V
[193
5.273.00
0.7400.7400.420
1 .671 .670.900
-
4.402.60
-
0.6450.6450.430
0.900
1 .621 .62
-
-
Tutt leEvaluation
[4,5]
5.31 ±0 232.85 ±0.13
O.667tO.O290.73110.0360.422tO.025
1.621*0.051.673±O.O360.927*0.029
2.21 iO.24
4.39 tO.12.73 tO.08
-
0.628*0.0380.63040.01S0.417+0.016
0.95 ±0.08
1 .52 ±0.1-11 .52 £0.11
2.21 +0.26
-
SelectedMeasurements
4.96+0 303.1 ±0.3
0.66x0.04O.78±O.O80.4 3*0.04
i .5 8+0.071 .71l?0. 170.9 510.08
-
4.12+0.252.8310.12
-
0. SitO. 05O.651O.C6O.A3±D.O4
O.S8t.O.O9
1.57*0.15
1 . S 1 0 . 5
-

15
Table 2: Comparison of relative group abundances (*.) for 0235 (T),Pu239 (F) and U238 (F)
FissileNuclide
2 3 5O (T)
239Pu(F)
238U (F)
Table 3
Fissionable*Tuclide
232Th
2 3 3u
235U
2 3 8u
239Pu
2*°Pu
2* 1Pu
Calculated(B-VI)Calculated (B-V)ENDF/B-V(Keepin)
Calculated(B-VI)Calculated (B-V)ENDF/B-V(Keepin)
Calculated(B-VI)Calculated (B-V)ENDF/B-V(Keepin)
1 2
3.0 212.9 223.8 21
2.9 262.6 253.8 28
1 .0 111.1 151 .3 13
Precursor <
.1
.0
.2
.0
.6
.0
.8
.5
.7
: Summary of ENDF/B-V Evaluation
VJL per100 Fissions
5.275.27 to 3.00
3.00
0.7400.740 to 0.470
0.4700.470 to 0.420
0.420
1 .671.67 to 0.900
0.900
4.404.40 to 2.60
2.60
0.6450.645 to 0.430
0.430
0.9000.900 to 0.615
0.615
1 .620.900 to 0.840
0.840
Energy
3
17.17.18.
20.18.21 .
14.15.16.
for
Range(MeV)
ConstantLinearConstant
ConstantLinearConstantLinearConstant
ConstantLinearConstant
ConstantLinearConstant
ConstantLinearConstant
ConstantLinearConstant
ConstantLinearConstant
047
04.E61415
047
049
047
047
047
tototo
to5 totototo
tototo
tototo
tototo
tototo
tototo
898
076
222
3roup
4
3838.40
36.35.32
48.43.38.
5
.2 14
.4 13
.7 12
.6 12
.2 15
.8 10
.3 183 19.8 22
.2
.3
.8
.1
.7
.3
.2
.0
.5
6
5.75.62.6
2.42.33.5
6.56.07.5
Delayed Neutrons
47
20
4.6141520
47
20
49
20
47
20
47
20
47
20
.5
Spectra
Same
Same
Groupused5 and
Groupused
Groupused :5 and
Same <
as
as
4
2 3 5u
2 3 5u
spectrafor groups6
5foi
4for6
is
Same as
spectra: group 6
spectragroups
239Pu
239Pu

0.06
-232 T h
0.05 -
.constant
. 2 3 8
0.04
o
>0.03
oorUJ
S 0.025LUa
0.01
0-00
U
2 3 5 M
241Pu
. 233U
239t
- 1 6 -
LINEAR
constant
LINEAR
constant
linear constant constant
I I i I i
linearI I I I I 1
1 3 4 5 7 9 11 13 15 17 19NEUTRON ENERGY (MeV )
Rg. 1: A typical representation of D. dependence on neutronfission energy as incorporated into ENDF / B-V.

17
range. The ENDF/B-V aggregate spectra shown in the table are basedon Fieg's measurements [20] for time groups 1 through 4 or 5. Notethat the U235 spectrum is used for Th232 and U233, and the Pu239spectrum is used for Pu240 and Pu241. These spectra are normalisedand are assumed to be independent of the incident neutron fissionenergy. The original review of spectra extended from about 79 keV toabout 1.2 NeV. The lower cut-off was later changed using a straightline extension to E = 0 from the value at 79 keV.
REFERENCES
1) G.R. Keepin, T.F. Wimett and R.R. Zeigler: J. Nucl. Energy 6(1957) 1-21.
2) G. Robert Keepin: Nuclear Technology 13. (1972) 53-58.
3} S.A. Cox-. Report ANL/NDM-5, Argonne National Laboratory,Argonne, Illinois, U.S.A. (1974).
4) R.J. Tuttle: Nucl. Sci. Eng. 56. (1975) 37-71.
5) R.J. Tuttle: Proceedings Of the CnsuLtants' Meeting On DelayedKeutron Properties, Vienna, 26-30 March 1979 (InternationalAtomic Energy Agency, Vienna, August 1979, INDC (NDS)-1O7/G+Special) 29-68.
6) A. Tobias: Prog. Nucl. Energy 5. (1980) 1-93.
7) R.W. Waldo, R.A. Karam, R.A. Meyer: Phys. Rev. C2J. (1981) 1113-1127.
8) G. Benedetti, A. Cesana, V. Sangiust and M. Terrani and G.Sandrelli: Nucl. Sci. Eng. 80 (1982) 379-387.
9) A.E. Evans: American Chemical Society's Meeting, Las Vegas,Nevada, USA (1982).
10) R.E. Chrien and T.W. Burrows (Eds.): Report BNL-51778,Brookhaven National Laboratory, Upton, New York, USA (1983)573p.
11) R.J. Tuttle: DeLayed Neutron Properties Proceedings Of theSpecial.ists' Meeting, University of Birmingham, September 15th-19th, 1986 (University of Birmingham Report, England, 1987) 95-106.
12) S.A. Benayad, S.J. Chilton, J. Walker, J.G. Owen, M.B. Whitworthand D.R. Weaver: Ibid, pp.107-115.
13) J.R. Liaw, T.R. England: Trans. Am. Nucl. Soc. 28 (1978) 75O-752.
14} Ph. Hammer: Proceedings Of the Consultants' Meeting On DeLayedNeutron Properties, Vienna, 26-30 March 1979 (InternationalAtomic Energy Agency, Vienna, August 1979, INDC (NDS)-

18
107/G+Special) 1-28.
15) F.M. Mann, H. Schreiber and R.E. Schenter and T.R. England:Nucl. Sci. Eng. £7 (1984) 418-431.
16) Talaadge R. England, Michaele C. Bxady, William B. Wilson,Robert E. Schentez and Frederick N. Hann: Report LA-OR-85-1673,Los Alamos National Laboratory, Los Alamos, New Mexico (June1985) 4p.
17) T.R. England, R.E. Schenter and F. Schmittroth-. Report LA-OR 79-2890, Los Alamos Scientific Laboratory, Los Alaaos, New Mexico(Oct. 1979) 4p.
18) T.R. England, tf.B. Wilson, R.E. Schenter and F. Mann: Nucl. Sci.Eng. M (1983) 139-155.
19) Fission-Product Decay Library Of the Evaluated NucLear Data FiLeCENDF/B-IV and-V>s Available from and maintained by the NationalNuclear Data Centre (N.N.D.C.), Brookhaven National Laboratory,Opton, New York, OSA.
20) G. Fieg: J. Nucl. Energy 23. (1972) 585-592.

19
$5. DELAYED NEUTRON DECAY CONSTANTS
The group decay constants A. are usually deduced from theindividual data A., per isotope. There are two ways of doing this.The first is to combine the A., as:
Ai " ( £ Aik pieff > ' ( I * >
and the second is by combining 1/Vjj, a S :
where, (3. -- is the effective fraction of delayed neutrons emittedby the fiiflle isotope k in the delay group i. But due to the veryclose values of A., for the various fissile isotopes, the above twoprocedures fox calculating A. and A (the mean decay constant) giveresults which are not very different from each other, thedifferences being less than t*o per cent. The group decay constantsA. do not depend very much either upon the fissile isotope k (seeTable 4) or upon the energy of the neutron causing fission (fast orthermal). Table 5 gives mean values of A. for all the main isotopes(0 and Pu), and compares the dispersion associated to these meanvalues with the uncertainties applied to the individual A-. values.One notes that the differences between A., within one group and forvarious isotopes are not really significant due to the correspondingerror margins. Consequently, the present accuracies given on the A.seem sufficient for kinetics calculations. x
AsAs regards the yield repartition a., for each isotope, Keepidetermined the values with uncertainties which depend little on
for each isotope, Keepin hasthe
isotope and more on the precursor group i. The mean values of theseuncertainties group-wise are: 15%, 2.5%, 20%, 7%, 12% and 20%. Thepresent uncertainties on a.. seem acceptable for reactorapplications. In particular, Beta-effective is insensitive tomodifications in a...
The six groups delayed neutron scheme and the corresponding decayconstants evaluated by Keepin are adopted in Delayed NeutronConstant evaluations. Though, Keepin's and Tuttle's delayed neutrondata (group yield and decay constants) are widely used in reactoranalysis, in recent times, similar data have been generated byothers too. These new data have, however, not been in great use sofar.
REFERENCE
Ph. Hammer.: Proceedings Of the Consultants' Meeting On DeLaycdNeutron Properties, Vienna, 26-30 March 1979 (International AtomicEnergy Agency, Vienna, August 1979, INDC(NDS)-107/G+Special) 1-28.

20
Table 4 •. Decay constant per delayed neutron group and fissile element
Isotope<Jc) i
2 3 5U
238O
239Pu
2 4 0Pu
2 4 1Pu
2 4 2Pu
1
0.0127
0.0132
0.0129
0.0129 .
0^0128
0.0129
2
0.0317
0.0321
0.0311
0.0313
0.0299
0.0295
Precursor
3
0.115
0.139
0.134
0.135
0.124
0.131
Group,i
4
0.311
0.358
0.331
0.333
0.352
0.338
5
1.4
1.41
1.26
1.36
1.61
1.39
6
3.87
4.02
3.21
4.04
3.47
3.65
Table 5: Mean values of group decay constant
Delayedneutrongroup,i
1
2
3
4
5
6
Mean valuefor all Uand Pu,X ̂
0.0129
0.0309
0.130
0.337
1.405
3.710
Dispersionon mean,Ac
m
±1.3
±3.3
±6.7
±4.9
±8.1
+ 8.9
Error on in-dividual, A-
(*.)
-13
-£3
-J8
-±6
-±10
-±15

21
§6. DELAYED NEUTRON ENERGY SPECTRA
Of the three sets of lumbers that are required in the dynamics andsafety calculations of reactors, the least adequately known is theenergy spectrum of delayed neutrons for each delayed group (xdi(E))as well as for the composite spectra as a function of time, Xd(t)after fission. This inadequacy has been due AS much to thecomplexity of measurements - arising from the very short life timeof some of the precursors and the difficulty in separating them - asdue to a lack of demand for exact delayed neutron data in thermalreactor calculations.
6.1 Importance of Delayed Neutron Energy Spectra in Fast ReactorDynamic Calculations
Although the importance of delayed neutrons in controlling therate of a fission chain reaction was noted as early as in 194O [1]and the importance of the energy spectra of delayed neutrons inpredicting the kinetic response of fast breeder reactors (and thespace reactor systems) under fault conditions has been longrecognised [2-5], the available information on the number and energydistribution of delayed fission neutrons is inadequate for thedesign of the coming generation of high power fast breeder reactorscharacterized by large quantities of fertile material (0-238 or Th-232) in the breeder/blanket reflector. The importance of an accurateknowledge of the delayed neutron spectra to the kinetic behaviour,control and safety analysis of fast reactors, particularly thebreeders, is due to the following considerations:
(i) In * 3 50 thermal systems, the total effective delayed fraction isoften about 0.0065, because in such systems, fissions occur mainlyin 0-235. But in fast breeder reactors, which may . contain largequantities of 0-238 and Th-232 isotopes in the core and/or thebreeder blanket, the neutron spectrum being fast,, an appreciablefraction (upto 25\) of total fissions may occur'in these nuclideswhich have high threshold energies for fission and whose delayedneutron yields are relatively high (P of 0-238 = 0.0148; p of Th-232= 0.0203). Depending on the energy with which delayed neutrons areborn, they may or may not be able to produce fission in theseisotopes. This can significantly alter the delayed effectivefraction (group as well as total) and in certain cases can dominatethe dynamic behaviour of the reactor. The high burn-up breederreactors (Pu-0 cycle) produce not only Pu-239 but also the higherisotopes Pu-240, Pu-241, Pu-242 in significant quantities. Thedelayed neutrons from these higher H/Z ratio species will alsoaffect the kinetics and safety of such reactors.
(ii) In a fast breeder reactor, the fissile and the fertilesubstances are usually not hoaogeneously distributed. In such asituation, the dynamic behaviour of different regions in the fastbreeder will be characterized by different time-scales: "slow" inregions rich in 0-238, Th-232 and Pu-240;"fast" in regions rich inU-235 (p=O.OO65), Pu-239 (0=0.002.) and Pu-241 <p=O.OO49).Therefore, while investigating the possible damage that a localdisturbance might cause in a fast breeder, it might be criticalunder certain circumstances to know the exact effective delayed
22
neutron fraction in each region of the reactor.
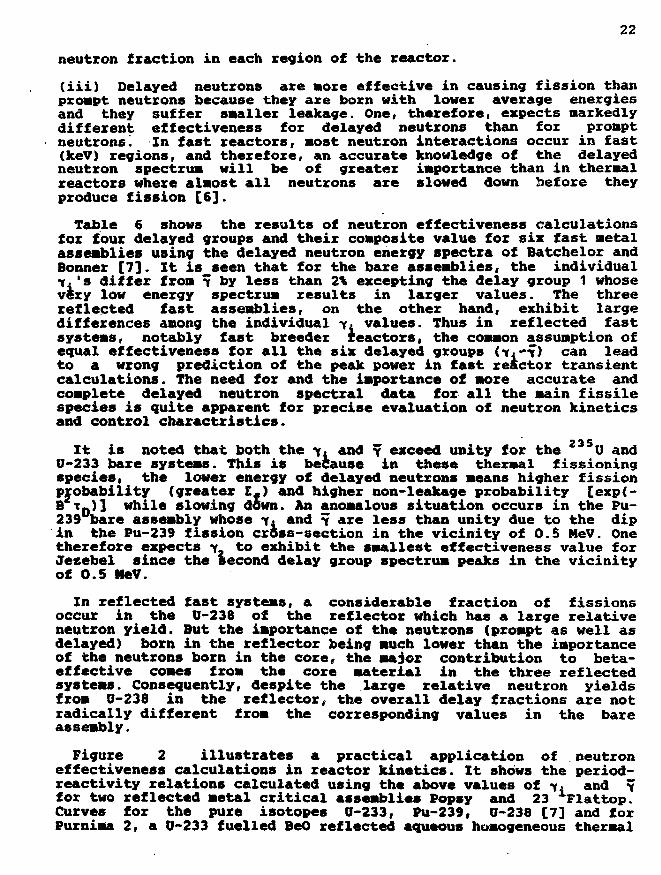
(iii) Delayed neutrons are sore effective in causing fission thanprompt neutrons because they axe born with lower average energiesand they suffer smaller leakage. One, therefore, expects markedlydifferent effectiveness for delayed neutrons than for promptneutrons! In fast reactors, most neutron interactions occur in fast(keV) regions, and therefore, an accurate knowledge of the delayedneutron spectrum will be of greater importance than in thermalreactors where almost all neutrons are slowed down before theyproduce fission £6].
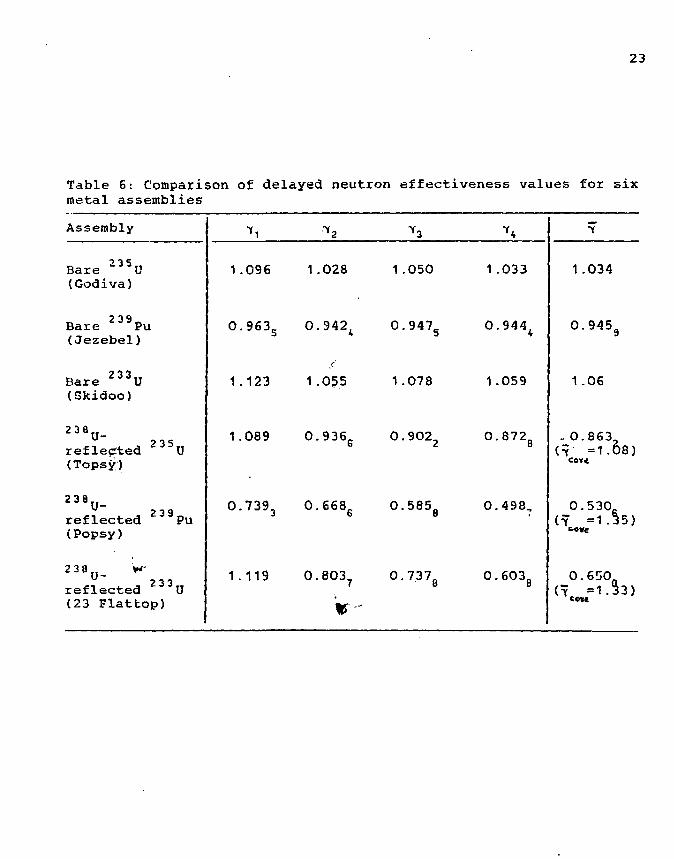
Table 6 shows the results of neutron effectiveness calculationsfor four delayed groups and their composite value for six fast metalassemblies using the delayed neutron energy spectra of Batchelor andBonner [73. It is seen that for the bare assemblies, the individualti's differ from y by less than 2% excepting the delay group 1 whosevery low energy spectrum results in larger values. The threereflected fast assemblies, on the other hand, exhibit largedifferences among the individual y. values. Thus in reflected fastsystems, notably fast breeder reactors, the common assumption ofequal effectiveness for all the six delayed groups (f .*~7) can leadto a wrong prediction of the peak power in fast reactor transientcalculations. The need for and the importance of more accurate andcomplete delayed neutron spectral data for all the main fissilespecies is quite apparent for precise evaluation of neutron kineticsand control charactristics.
2 3 5It is noted that both the y. and y exceed unity for the U and
0-233 bare systems. This is because in these thermal fissioningspecies, the lower energy of delayed neutrons means higher fissionprobability (greater I.) and higher non-leakage probability [exp(-B t_)] while slowing down. An anomalous situation occurs in the Pu-239 bare assembly whose y. and y are less than unity due to the dipin the Pu-239 fission cross-section in the vicinity of 0.5 MeV. Onetherefore expects y to exhibit the smallest effectiveness value forJezebel since the second delay group spectrum peaks in the vicinityof 0.5
In reflected fast systems, a considerable fraction of fissionsoccur in the 0-238 of the reflector which has a large relativeneutron yield. But the importance of the neutrons (prompt as well asdelayed) born in the reflector being much lower than the importanceof the neutrons born in the core, the major contribution to beta-effective comes from the core material in the three reflectedsystems. Consequently, despite the large relative neutron yieldsfrom 0-238 in the reflector, the overall delay fractions are notradically different from the corresponding values in the bareassembly.
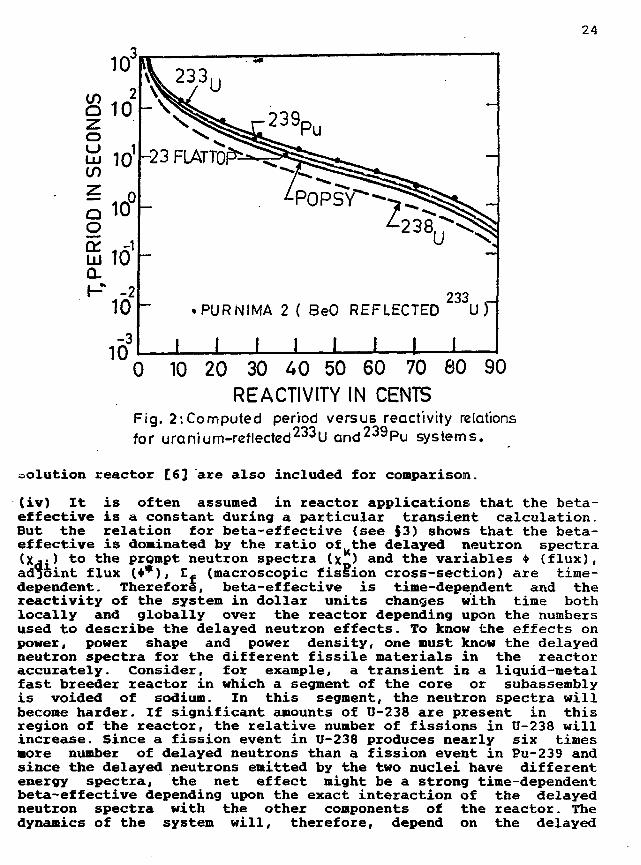
Figure 2 illustrates a practical application of neutroneffectiveness calculations in reactor kinetics. It shows the period-reactivity relations calculated using the above values of y. and yfor two reflected metal critical assemblies Popsy and 23 Flattop.Curves for the pure isotopes 0-233, Pu-239, 0-238 [7] and forPurnima 2, a 0-233 fuelled BeO reflected aqueous homogeneous thermal
23
Table 6: Comparison of delayed neutron effectiveness values for sixmetal assemblies
Assembly
Bare 235U(Godiva)
Bare Pu(Jezebel)
Bare 233U(Skidoo)
2 3 a u -r e f l e e t e d 2 3 5 U(Topsy)
2 3 8 u -2 3 9reflected Pu
(Popsy)
238 V2 3 3reflected U
(23 Flattop)
1
0
1
1
0
1
y,
.096
.9635
.123
.089
.7393
.119
1 .
0 .
1 .
0 .
0 .
0 .
0 2 8
S42t
055
936G
668G
8O3?
1
0
1
0
0
0
y2
.050
.947S
.078
• 9O22
. 585 8
.7.37,
1
0
1
0
0
0
y,
.033
.944 ,
.059
.872 8
. 4 9 8 ,
.6O38
7
1.034
0 . 9 4 5 9
1 .06
- 0 . 8 6 3 ,{y =1 .08)
0.530-iy =1.35)cow
0.650(=? =1 .33)
COW
24
3
10
233. PURNIMA 2 ( BeO REFLECTED U
I I I I I J I I0 10 20 30 40 50 60 70 80 90
REACTIVITY IN CENTSFig. 2:Computed perrod versus reactivity relationsfor uranium-retlected233U and 2 3 9Pu systems.
solution reactor [6] are also included for comparison.
(iv) It is often assumed in reactor applications that the beta-effective is a constant during a particular transient calculation.But the relation for beta-effective (see §3) shows that the beta-effective is dominated by the ratio of the delayed neutron spectra(x^j) to the prompt neutron spectra (x_) and the variables • (flux),adjoint flux (•*), Ef (macroscopic fission cross-section) are time-dependent. Therefore, beta-effective is time-dependent and thereactivity of the system in dollar units changes with time bothlocally and globally over the reactor depending upon the numbersused to describe the delayed neutron effects. To know the effects onpower, power shape and power density, one must know the delayedneutron spectra for the different fissile materials in the reactoraccurately. Consider, for example, a transient in a liquid-metalfast breeder reactor in which a segment of the core or subassemblyis voided of sodium. In this segment, the neutron spectra willbecome harder. If significant amounts of U-238 are present in thisregion of the reactor, the relative number of fissions in U-238 willincrease. Since a fission event in U-238 produces nearly six times•ore number of delayed neutrons than a fission event in Pu-239 andsince the delayed neutrons emitted by the two nuclei have differentenergy spectra, the net effect might be a strong time-dependentbeta-effective depending upon the exact interaction of the delayedneutron spectra with the other components of the reactor. Thedynamics of the system will, therefore, depend on the delayed

25
neutron spectra used. The actual magnitude and importance of thiseffect would depend greatly on the composition and configuration ofthe reactor considered and can be ascertained only by detailedinvestigations.
(v) Measured values of reactor physics parameters obtained fromintegral experiments on critical assemblies represent a composite ofmany individual input parameters. Therefore, further refinement ofdelayed neutron numbers and the spectral data will contributetowards more definite cross-section evaluations from criticalexperiments. This will increase the accuracy and reliability of fastpower reactor calculations.
(vi) The calculated and the measured values of reactivity axerelated to each other by beta-effective. Since beta-effectivedepends - among other quantities - on the prompt and the delayedneutron spectra, accurate determination of reactivity value requiresan accurate knowledge of delayed spectral data. Efforts to improvethe calibration of the reactivity scale between calculations andmeasurements by adjusting the total delayed neutron yields have beenreported by D'Angelo [8].
(vii) In most analysis of critical assemblies and in the design ofpower reactors, it is commonly assumed that the delayed and theprompt neutrons are emitted with the same energy distribution. Thisis justified on the ground that the influence of this approximationis small in comparison with other effects such as the nuclear datauncertainties or the approximations made in modelling real reactorconfiguration. But, Kiefhaber [9] has recently reported that thisassumption can lead to systematic deviations in fc-effective ofbetween -0.2 and +0.05\, the effect being more important for low-enriched k_ experiments and for highly enriched, high-leakage coresthan for "typical cores of LMFBR and their critical assemblies. Itis, therefore, necessary that in cross-section adjustment procedureswhich usually cover a wide range of critical assemblies with fairlydifferent nuclear characteristics, in precise prediction of nuclearparameters for an operating power reactor, or in high accuracycriticality calculation, the influence of exact delayed neutronspectra is taken into account.
(viii) Prompt neutron decay constant, a_c = (beta-effective/meanprompt neutron life time) can be subject to calculational error dueto the uncertainties in the delayed neutron spectral data. Errorscan also arise in the determination of prompt neutron life timeusing the measured values of ou.r and the calculated values of beta-effective <lp « P e £ £/« D C)•
(ix) One of the design requirements of a nuclear reactor is that itshould be operationally stable. This is normally achieved byconstructing the reactor with a high operational safety margin. Buthigher the safety margin, higher is the cost. Hence to reduce costs,one needs to reduce the uncertainties in accident analysis. Thismeans, in general, of improving and enlarging the existing basicexperimental nuclear data, including the data on delayed neutrons.
26
(x) It has been been pointed out several times that delayed neutronsdo not always have a stabilizing influence on nuclear reactordynamics £10,113- Complete neglect of delayed neutrons would, incertain cases, result in a conditionally stable reactor, where as,including delayed neutron effects in the same reactor would make itunstable. Therefore, changes in beta-effective resulting from theuncertainties in the knowledge of delayed neutron spectral data mayshift the reactor either into the unstable region or to a morestable region, depending on the error inherent in the neutroneffectiveness calculations. Hence, to say whether a certain reactorconfiguration is stable or not, a precise evaluation of beta-effective is required and can be obtained only if delayed spectraare known accurately.
6.2 Determination of DeLayed Neutron Spectra
In reactor applications, two types of delayed neutron energyspectra are, in principle, required; the equilibrium spectra forstatic calculations and the time-dependent spectra for dynamiccalculations. These spectral data are obtained by commonly employingtwo independent approaches. The first is from microscopic weightedsummation of measured or theoretically calculated separatedprecursor results (energy spectra, half-lives, cumulative fissionyield and delayed neutron emission probability) and the second isthe direct measurement of composite delayed neutron spectracontaining contributions from all precursors decaying withinspecific time intervals after fission (§7). The direct measurementof aggregate delayed neutron spectra and their decomposition intosix delay groups has the advantage that it avoids the uncertaintiesassociated with the combining of many individual precursor spectrato produce the composite spectra. However, these measurements havenot been very sensitive to the two shortest-lived Keepin groups,namely, groups 5 and 6. The summation method of generating delayedneutron energy spectra from precursors (§8) has the principaladvantage that a single set of precursor data (delayed neutronemission probabilities and energy spectra) can be used to predictdelayed neutron production for whatever group structure andfissioning system required, provided fission product yields areavailable [12]. Also, the method is mathematically more tractablethan the decomposition method.
The basic relations used in the summation calculations are-.
fk u
Yin " * N ° Yi Pni
Ain ' c Yin
v. u vAiXdi(E)dE = E Yinxdn(E) dE
27
Xd(E,t) = I fk E A* Xd\(E)exp(-A^t)dE
where,
• = neutron flux,
N = number of fissile nuclei,
fk "•
o = fission cross-section,
Y. = cumulative fission yield in the ith precursor group for
the kth fissile nuclide,
f. = abundance factor of the kth fissile nuclide of which thefuel has H components
A. = decay constant of the delayed neutron family (group) 1
for fissile material k,
Y. = yield of the nth precursor contributing to delayed
neutron group i,
A. = disintegration constant of the nth precursor in the ith
precursor group,
P .= delayed neutron emission probability of the nth precursorm
in the ith group,
A. = group abundance of the delayed neutron group i for the
various fissile materials k.
Alternatively, one can directly sum over the precursors and obtainthe delayed neutron spectrum as-.
Xd(E,t)dE = E (• N <rf Y n Pn An) exp(-Ant) Xdn<E) dE
The above basic procedures have been used to evaluate the six-groupspectra and the gross energy spectrum under equilibrium condition atany time for a number of fissioning systems [See §83. In practice,data by both the approaches (measurement and summation calculations)are needed to check for problems in the various measuring techniquesand for comparing the measured composite spectra with the equivalentsummation result. The current state of development is that thecalculation of reactor physics parameters from P values, fissionyields and spectra from separated nuclides has advanced to meet the

, 20] .the
l.ound
28
accuracy of data derived from experiments on aggregate onesBefore closing this section, we want to point out that a nu:ub<.,. m
calculations of delayed neutron energy spectra have been car; ;.,...! uusing statistical model considerations [13-15]. Also, "anal ,••..!<.:fits" to the experimental data have been made [ 16-18J u., iJxj uconstant 0 -strength function (Sg), proportional to either the \..-i^1density <c) or given by thep gross theory of fl-decay [ vSome of these results [14,15] showed a dramatic similarity woverall spectra to the experimental spectra. It was, howevei,that the model strength functions overestimated the ntutronintensity above 0.3 MeV and underestimated at lower energies, and ananalytical representation of the experimental Sfl gave a substantialimprovement in the fit to the experiment. Mannpet al [21] have useda statistical model with only one free global parameter, a.N/<N+Z)(a - level density parameter, N and Z are the number of neutrons andprotons respectively in the daughter nucleus) to predict the b~tadecay properties (t , E , E , E . P ) accurately and betterthan gross theory. The'fiodel,pwhich^is BsefBl when many levels areinvolved, considered only levels in the daughter nuclide based onneutron single particle states. Figure C below compares themeasured delayed neutron spectrum [16] with the model results forRb-93. It is seen that while the fine structure observed in delayedneutron experiments is not predicted, the overall shape is well«C^*«fi t~ i s t h e Pr°bability of delayed neutron emission (P -exp
« 0.0137*0.0008, Pn-model * 0.0131). n
3-0
. EXPERIMENT - |-.-MODEL
0-9 1.00.0 0.1 0.3 0.5 07ENERGY (MeV)
Figure C:Delayed neutron spectrumof 9 3Rb.
REFERENCES
1 ) M94O)a n d Y u B - Khariton: 2h. eksp. teor. Fiz. 10
2) R.J. Tutt le: Nucl. Sci . Eng. 56. (1975) 37-71.
3> i T ^ " b e l : g ' S ^ ^ *** S' Yi f tah: Nucl •
29
4) Ph. Hammer: Proceedings of the Consultants' Meeting on DelayedNeutron Properties, Vienna, 26-30 March 1979 (InternationalAtonic Energy Agency, Vienna, August 1979, INDC(NDS)-107/G+Special) 1-28.
5) A.E. Waltar and A.B. Reynolds: Fast Breeder Reactors (PergamonPress, New York, 1981). .
€) S. Das: Report BARC/1992/E/O14, Bhabha Atomic Research Centre,Bombay, India (1992) 4-5. I
7) G.R. Keepin: Delayed Fission Neutrons, Proceedings of a Panel,Vienna, 24-27 April, 1967 (International Atonic Energy Agency,Vienna, 1968, STI/PUB/176) 3-22.
8) A. D'Angelo: Proceedings of the International Conference On thePhysics of Reactors Operation, Design and Computation, PHYSOR' '90, Volune 1, April 23-27, 1990, Marseille-France, 111-84 to111-94.
9) Edgar Kiefhaber-. Nucl. Sci. Eng. H I (1992) 197-204.
10) Henry B. Smets: Nucl. Sci. Eng. 21 (1966) 236-241.
11) Ziya Akcasu, Gerald S. Leilouche, Louis M. Shotkin: MathematicalMethods in Nuclear Reactor Dynamics (Academic Press, New Yorkand London, 1971) 285-290.
12) M.C. Brady and T.R. England: Proceedings of the InternationalConference On the Physics of Reactors Operation, Design andComputation, PHYSOR *90, Volume 1, April 23-27, 1990, Marseille-France, 111-71 to 111-83.
13) A.C. Pappas and T. Sverdrup: Nucl. Phys. A188 (1972) 48-64.
14) O.K. Gjotterud, P. Hoff and A.C. Pappas: Nucl. Phys. A3O3 (1978)281-294 S. 295-312.
15> J.C. Hardy, B. Jonson and P.G. Hansen: Nucl. Phys. A3O5 (1978)15-28.
16) G. Rudstan and S. Shalev: Nucl. Phys. A235 (1974) 397-404.
17) S. Shalev and G. Rudstam: Nucl. Phys. A275 (1977) 76-92.
18) G. Rudstan: J. Radioanal. Chem. 3_6_ (1977) 591-618.
19) K. Takahashi: Prog. Theor. Phys. (Kyoto) 4J. (1969) 1470-1503.
20) Kohji Takahashi: Prog. Theor. Phys. £7, No.5 (1972) 1500-1516.
21) F.M. Mann, C. Dunn and R.E. Schenter: Phys. Rev. C25f No.1(1982) 524-526.

3O
§7. MEASUREMENT AND ANALYSIS OF DELAYED NEUTRON SPECTRA
Development in the measurements of delayed neutron energy spectracan broadly be divided into three stages. In the first phase,measurements of delayed neutron spectra were made with unseparatedfission products. In the second phase, more precise data on delayedneutron spectra were obtained. These measurements showed not onlygreater stucture but they also extended the energy range below 100keV with an appreciable fraction of delayed neutrons in this lowenergy region. The third phase roughly pertains to the periodfollowing the 1979 Vienna- workshop [1] and the 1983 Brookhavenmeeting [2], during which the trend in the development of delayedneutron data has been to study delayed neutron emission fromindividual precursor nuclides. This approach, made possible throughimprovements in the experimental techniques of isotope separationand neutron spectroscopy, has become very productive during the lastseveral years. The current state of development is that thecalculation of reactor physics parameters from P values, fissionyields and spectra from separated nuclides has advanced to meet theaccuracy of data derived from experiments on aggregate ones.
7.1 Phase 1
The first measurements of delayed neutron spectra were made byBurgy et al [3] followed by Hughes et al [4], Bonner et al [5],Batchelor and Hyder [6,7] and were limited to measurements on U-235.In each of these experiments, a sample was irradiated in a reactorfor a predetermined time (T_) and then transferred (via rabbit) tothe measuring system and allowed to decay for a certain time (T.)before recording started. In the measurements of Burgy et al,TR values varied from 0.5 to 50 sec and T_ from 0.8 to 3.3 sec.Proton recoils were measured in a hydrogen-filled cloud chamber andspectra were observed. Energy resolution in the experiment was ofthe order of 100 keV, caused partly by poor statistics. The averageenergies lay in the region from 0.2-0.8 MeV. No simple relationshipbetween energy and half-life was found. Figure 3 is the result ofdata graphically analyzed for the different groups and then combinedto the steady-state distribution of the delayed neutron spectra.Hughes et al by varying TR from 1 s to 5 min and T_ upto 5 minexamined the attenuation of neutron intensity with distance inparaffin and compared the attenuation slopes to those derived fromstandard monoenergetic (f,n) sources. Only mean neutron energies ofsome of the delayed neutron groups were derived. The resolution wasof the order of 100 keV. Spectra were observed by Bonner et al bymeasuring proton recoils for TR = T_ = 1 sec. In Batchelor andHyder's measurements, TR values ranged from 1.4 to 100 sec and T_values from 2 to 100 sec. Pulse heights were measured in a He-filled proportional counter and spectra were observed with aresolution of about 90 keV. In experiments where TR was varied, thedata enabled experimenters to extract the spectra of the varioushalf-life groups. Results of Batchelor and Hyder had the highestquality and are shown in figure 4. All the above measurementssuffered from the following defects:
(a) Resolution being poor, it was not clear whether the spectra werereally continuous with some superimposed fine structure (as obs-

- 3 1 -
0 0.4 0.8 1.2 1.6 1.8ENERGY, MeV
Fig. 3:Equilibrium DN Spectrum fromthermal-neutron fission ofobtained by Burgy et al.
_ 5 , Group 1 A]f[\ calculatedV- 2
I •
0.4 0.8 12 1.6
1o
Group 2
vGroup 3 Group 4
A. 3
2
1
0 0.2 0.4 1.20.8 1.2 0 0.4 U.8NEUTRON ENERGY(MeV)
Fig. 4:DN spectra from thermal neutron fission of 2 3 5 U , measured byBatchelor and McK. Hyder and Bonneret al.
•—f Resolution ( Full-width at halt-height). Approximate Statistical Errors
are indicated by Vertical Bars.

32
erved) or had a line structure.
(b) The magnitude of systematic effects from uncorrected backgroundwas uncertain. For example, whether the low-and the high-energyportions of the observed spectra were primarily due to the scat-tered prompt neutrons was not certain. The He3 spectrometer inBatchelor and Hyder's experiments was particularly susceptibleto scattered low-energy neutrons. Part of the apparent high-energy spectra might have been due to prompt neutrons arisingfrom the delayed neutron caused fissions in the sample itself.
(c) The accuracy of separating the spectra into various groups wasuncertain.
Latex experiments by N.G. Chrysochoides et al [8,pp.213-227] andChulik et al [9,103 did not clear up the uncertainties either. Theseexperiments, however, introduced the technique of neutron time-of-flight, triggering *ach flight-time measurement with the beta-decaydetection from the precursor. The method involved coincidencemeasurement and had a poor signal-to-noise ratio caused by theintense accidental coincidence rate. The results were seen to differmarkedly from the earlier four measurements in that a line structurewas observed which was different from the previously observedcontinuous spectra. This was due to the improved resolution, whichin Chulick's experiment varied from 6\ at 100 keV to 20% at 500 keV.The observed distribution was also much different. For example, theconcentration of neutrons at high energies (> 800 keV) did not agreeat all. Figure 5 reproduces a spectrum from Chrysochoides, figures 6and 7 from Chulick. The spectrum in figure 5 was thought to be amixture of spectra from the "traditional" groups 2 and 3. Figure 6represents delayed neutrons from Cf252, which does not have the samegroups as U235. This spectrum should correspond most closely to amixture of the "traditional" groups 4 and 5. The structural spectrumin figure 6 includes eleven peaks from 95 keV to 430 keV . Figure 7shows a comparison with the spectrum of Batchelor and Hyder whichmost closely corresponds to the results here.
Figure 8 shows the low energy combined spectrum of the mixture Br-87 and Br-88 obtained by Chrysochoides et al [11] using a fast TOFbeta-neutron coincidence technique which had excellent resolution atlow energies (5\ at 50 keV). The bromine isotopes from the fissionproducts of U-235 were separated using a fast radiochemicaltechnique. The structure observed in the spectra belcw 100 keV couldpossibly be due to the neutrons being emitted at discrete energies.
7.2 Phase 2
Since the early 1970, the number of delayed neutron spectrameasurements from fast- and thermal-neutron fission of differentfissile isotopes has been steadily increasing. In 1972, Feig [12]measured spectra from the thermal fission of U-235 and from 14-MeVfission of U-235, U-238, Pu-239 using a proton recoil proportionalcounter. The spectra were measured for different time intervals andthen resolved into four energy groups. The results fox U-235 thermalfission superimposed on Batchelor and McK. Hyder spectra are shown

Relative counts per channel
3
RELATIVE DN FRACTION
O io i^ en CD O
S.«°a. °o.
5 s.n<* - I^. O• "n
1 *
2.?f5a-" =• < - Relative counts per channel
— w tn «o «o
COUNT RATEO ro

34
in figure 9 for four delayed groups and in figure 10 for theequilibrium spectrum. The agreement between the Feig measurementsand the previous data is reasonable. The main difference is in thelarge amount of structure present in the Feig measurements as aresult of his much better resolution, while the results of Batchelorand McK.Hyder are relatively smooth curves. Sloan and Woodruff[13,14] measured the delayed neutron spectra from thermal fission of0235, U233 and Pu239 using methane-and hydrogen-filled proportionalcounters; the first counter was for the 150 keV to 1.5 MeV intervaland the second for 20 to 200 keV interval. Counting cycles of 4-,12-and 25-s were used to enhance the different time groups. Their near-equilibrium spectrum (4-s cycle) is shown in figure 11.
Later, Eccleston and Woodruff [15,16] used the same technique tomeasure the near-equilibrium spectra from fast fission of Th-232, U-233, U-235, U-238 and Pu-239 using the Be9 (p,n) B9 reaction with 10HeV protons as the neutron source. The Eccleston and Woodruffspectra for U-235 are reproduced and compared to several othermeasurements in figure 12. The results of Sloan and Woodruff,Eccleston and Woodruff are in good agreement with other measurementsabove about 200 keV. But, below 125 keV, these measurements show asignificant increase in the amount of delayed neutrons emitted withseveral distinct peaks. However, the spectra at lower energies werenot well supported by other measurements. Shalev and Cuttler £17]found a strong rise in the intensity of the delayed neutron spectrabelow 200 keV with a strong component at 120 keV, but were unable toobtain meaningful information below 200 keV because of the rapidlyincreasing detector efficiency at low energies and the deleteriouseffect of the high t-ray counting rate. Using the Shalev Hespectrometer, Evans and East [18] measured equilibrium delayedneutron spectra from fast fission of U235. In the experiment, 2.15MeV protons were accelerated on a lithium target producing neutronsof energies between 30 and 420 keV. Their spectrum had a complexline structure as observed by Shalev [17] and by Sloan and Woodruff[13,14]. Neutron energy peaks corresponded to peaks previouslyobserved. The overall shape of the spectrum, however, correspondedmore closely to that measured by Batchelor and Hyder than that ofSloan and Woodruff. Evans and Kricks [19,20] followed a proceduresimilar to that of Evans and East to measure the spectra ofequilibrium delayed neutrons from fast fission of U-235, U-238 andPu-239. Energy resolution of the spectra varied from 16 keV forthermal neutrons to 54.3 keV for 1.5-MeV neutrons. The data, shownin Figure 13, were similar to the spectra previously observed. Theaverage energies were about 500 keV, somewhat in disagreement withthe earlier results. The spectrum intensity below about 300 keV wasfound to be very sensitive to the wall-effect subtraction carriedout by them, and hence, part of the average-efficiency differencecould be experimental error.
Shalev and Cuttler [17,21,22] measured the delayed neutron spectrafor Th-232, U-233, U-235, U-238 and Pu-239 using a new type of He-3spectrometer and the IRR reactor as the neutron source. Afterirradiation, samples were transferred to the He3 counter by apneumatic rabbit. By appropriate variations of the irradiation andthe counting time and by recording the data as a function of time.

- 3 5 -
ou<a:
tu>
6
A
2
0!6
A
2
GROUP i
Batchelor-McK- Hyder
-i i i i i rGROUP 3
GROUP!
JL-i-i
GROUP A -]
04 0.8 12 0 04 0-8 1.2ENERGY, MeV
Fig. 9 ^Delayed neutron spectra fromGroup 1 through A from thermal neutronfission of 235y
DC
10
8
6
A
2
Combined data of•Batchelor- Mck'.Hyder"
Bonner et al
et al -\
0 0.2 O.A 0.6 0.8 1.0 1.2 U
ENERGY, MeVFig.10 -.Equilibrium delayed neutronspectra from thermal neutron fission of235u, measured by Feig.
0.01 .02 .04.06 0.1 0.2ENERGY, MeV
Fig.11 '.Near-equilibrium delayed neutronspectrum from thermal neutron fission of
( A - S cycle).
10
8
6
A
2
Q
and Woodruff
Eccleston and -|H. Woodruff
AFeig
O01 0.02 0.06 4 0-2 O.A .81 1.5ENERGY,MeV
Fig.12'.Comparison of measured delayedneutron spectra from fast neutron fissionof 235u n e a r equilibrium.

-36"
600 1200 1800ENERGY(KeV)
Fig. 13.Equilibrium spectra of delayed neutronsfrom fast fission of
2400
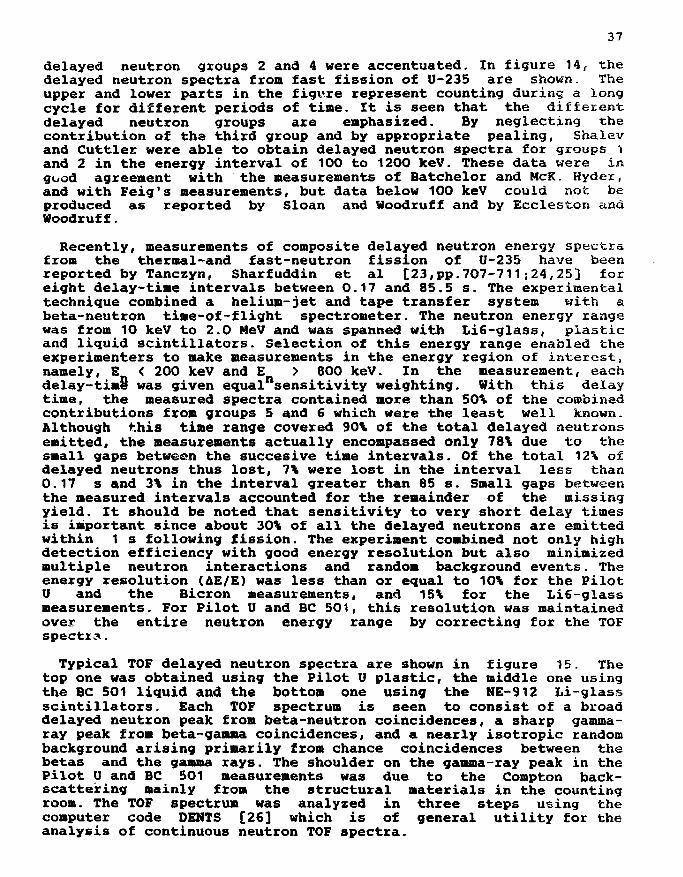
37
delayed neutron groups 2 and 4 were accentuated. In figure 14, thedelayed neutron spectra from fast fission of U-235 are shown. Theupper and lower parts in the figure represent counting during a longcycle for different periods of tine. It is seen that the differentdelayed neutron groups axe emphasized. By neglecting thecontribution of the third group and by appropriate pealing, Shalevand Cuttler were able to obtain delayed neutron spectra for groups 1and 2 in the energy interval of 100 to 1200 keV. These data were ingood agreement with the measurements of Batchelor and McK. Hyder,and with Feig's measurements, but data below 100 keV could not beproduced as reported by Sloan and Woodruff and by Eccles-ton andWoodruff.
Recently, measurements of composite delayed neutron energy spectrafrom the thermal-and fast-neutron fission of U-235 have beenreported by Tanczyn, Sharfuddin et al [23,pp.707-711;24,25] foreight delay-time intervals between 0.17 and 85.5 s. The experimentaltechnique combined a helium-jet and tape transfer system with abeta-neutron time-of-flight spectrometer. The neutron energy rangewas from 10 keV to 2.0 HeV and was spanned with Li6-glass, plasticand liquid scintillators. Selection of this energy range enabled theexperimenters to make measurements in the energy region of interest,namely, E < 200 keV and E > 800 keV. In the measurement, eachdelay-time was given equal sensitivity weighting. With this delaytime, the measured spectra contained more than 50% of the combinedcontributions from groups 5 and 6 which were the least well known.Although this time range covered 90\ of the total delayed neutronsemitted, the measurements actually encompassed only 78\ due to thesmall gaps between the succesive time intervals. Of the total 12% ofdelayed neutrons thus lost, 7\ were lost in the interval less than0.17 s and 3\ in the interval greater than 85 s. Small gaps betweenthe measured intervals accounted for the remainder of the missingyield. It should be noted that sensitivity to very short delay timesis important since about 30\ of all the delayed neutrons are emittedwithin 1 s following fission. The experiment combined not only highdetection efficiency with good energy resolution but also minimizedmultiple neutron interactions and random background events. Theenergy resolution (AE/E) was less than or equal to 10% for the PilotU and the Bicron measurements, and 15% for the Li6-glassmeasurements. For Pilot U and BC 501, this resolution was maintainedover the entire neutron energy range by correcting for the TOFspectra.
Typical TOF delayed neutron spectra are shown in figure 15. Thetop one was obtained using the Pilot U plastic, the middle one usingthe BC 501 liquid and the bottom one using the NE-912 Li-glassscintillators. Each TOF spectrum is seen to consist of a broaddelayed neutron peak from beta-neutron coincidences, a sharp gamma-ray peak from beta-gamma coincidences, and a nearly isotropic randombackground arising primarily from chance coincidences between thebetas and the gamma rays. The shoulder on the gamma-ray peak in thePilot U and BC 501 measurements was due to the Compton back-scattering mainly from the structural materials in the countingroom. The TOF spectrum was analyzed in three steps using thecomputer code DENTS [26] which is of general utility for theanalysis of continuous neutron TOF spectra.
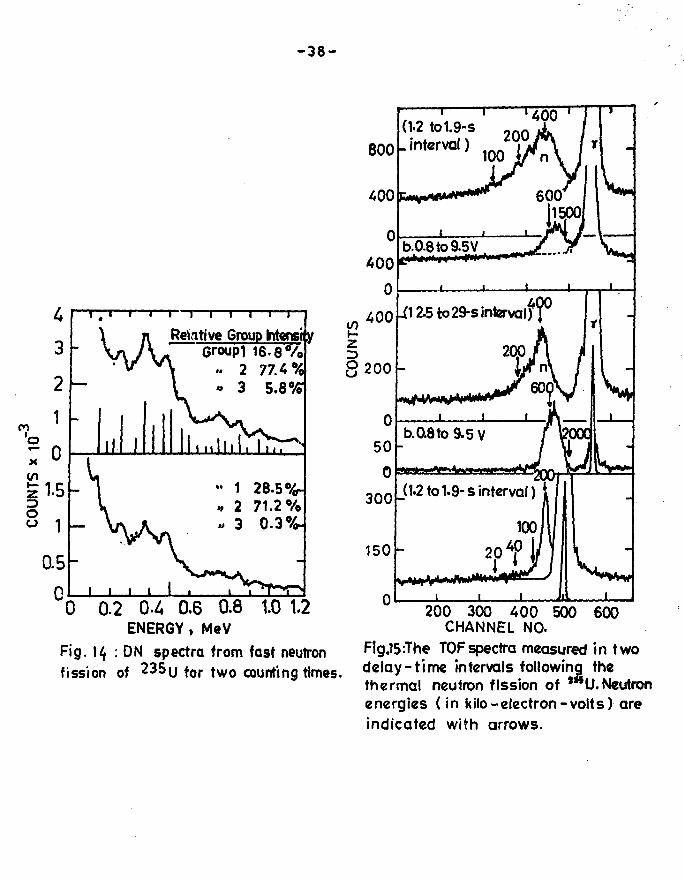
- 3 8 -
Relative Group htensi yGroupi 1 6 . 8 %
2 77A %3 5.8%
" 1 28.5%-2 71.2%3 0.3%-
800
400
0
400
0
.interval) 200
4 0 0 i12.5 to29-s interval)*?0
0 0.2 0-4 0.6 0.8 1.0 1.2ENERGY, MeV
Fig. 14 : DN spectra from fast neutronfission of 235u for fW 0 counting times.
1 ' ' 4 0 0(1.2to1.9-s
V * ,
toz
R200
0
50
0
300
150
200 300 400 500CHANNEL NO.
Fig.15:The TOF spectra measured in twodelay-t ime intervals following thethermal neutron fission of *MU.Neutronenergies ( in kilo-electron-volts) areindicated with arrows.
(1.2 to 1.9- s interval)
100

39
Composite delayed neutron energy spectra for the eight delay timeintervals are shown in figures 16 and 17. The total counts in eachspectrum were normalized to 10 . The energy bin size of 10 keVroughly approximated the energy resolution. Systematic uncertaintyin the background was much less than 3 V The uncertainty in the 10VeV yield was estimated to be 100\. For purposes of comparison,composite spectra were constructed from the six-group spectra of theENDF/B-V compilation [27] as well as from Rudstam's compilation [28]for U-235 based on the Studsvik measurements of delayed neutronspectra for individual precursors. These comparison spectra, alsonormalized to 10 , are shown as dotted curves in the figures.
The spectra show a smooth evolution from short to long delay timeswith the ones at the two extremes displaying the most dissimilarcharacteristics. Comparison of the measured spectra with thosegenerated from ENDF/B-V and Rudstam show the approximate overallagreement and the regions of differences. The ENDF composite delayedneutron spectra change little with delay time, but this is not sowith the measured spectra. The reason for this is partly due to thegroups 4,5 and 6 spectra being identical in the compilation.Further, the low energy peak and the high energy cut-off in the ENDFspectra appear to be quite artificial. In contrast to ENDF, thecomposite delayed neutron spectra derived from the individualprecursors data of Rudstam evolve in a manner quite similar to thepresent work. In particular, the agreement is close for the threeintervals between 2.1 and 29 sec. The authors have stated that fordelay times less than 2 s, the low-energy structure in Rudstam'sspectra might be slightly exaggerated due to the incomplete natureof the individual precursor data bases, particularly for groups 5and 6.
A delayed neutron equilibrium spectrum from thermal fission of U-235 was calculated from the composite spectra measurements by twomethods: the direct integration method and the matrix inversionmethod. In the direct integration method, the full range of delaytimes in the composite delayed neutron spectra was spanned and thedelayed neutron fractions as a function of delay time were used. Inthe matrix inversion method, only the six-group representation ofdelayed neutron spectra was used. Spectra at every delay timeinterval was unnecessary since a mathematical solution exists forany set of six independent delayed neutron spectra measurements. Thetwo methods yielded nearly indistinguishable equilibrium spectra fora given set of (p., X^). Figure 18 shows the spectra generated usingthe direct integration method and two sets of (p., A.). The solidcurve at the top was calculated using the (p. ,X7") set from ENDF/B-Vand the solid curve at the bottom employed the set from Rudstam. inthe figure, the dotted curve at the top was generated from theENDF/B-V group spectra and the one at the bottom from Rudstam'sgroup spectra. It is seen that the agreement in the overall shape issatisfactory. The two main discrepancies with ENDF are its low-energy peak and its high-energy cut-off. The Rudstam spectrum has asomewhat fewer high energy neutrons but differs mainly in thepersistence of the low energy peaks. The effect of these differenceswas found to decrease the average energy of the equilibrium spectrumby about 50 keV compared to the measured values.

- 4 0 -
ioo y m
!lliV
100 £ V
YIE
LC
100
;;I?
I
,11 0 0 i
0.17 to
V
0.41 to
0.79 to 1
1.2 to 1.
1%
0.37 s
"•—^
0.85 s
'v-'—-_
.25 s
9s
0 0.5 1.0 15 2.0 0 0.5 1.0 1.5 2.0NEUTRON ENERGY(MeV)
Fig.i6.Compositc DN enegy spectra measured by
Tanczyn et al (solid curves) following thermal235neutron induced fission of U, compared with
the spectra generated from ENDF / B-V (dottedcurves) for the same time intervals.
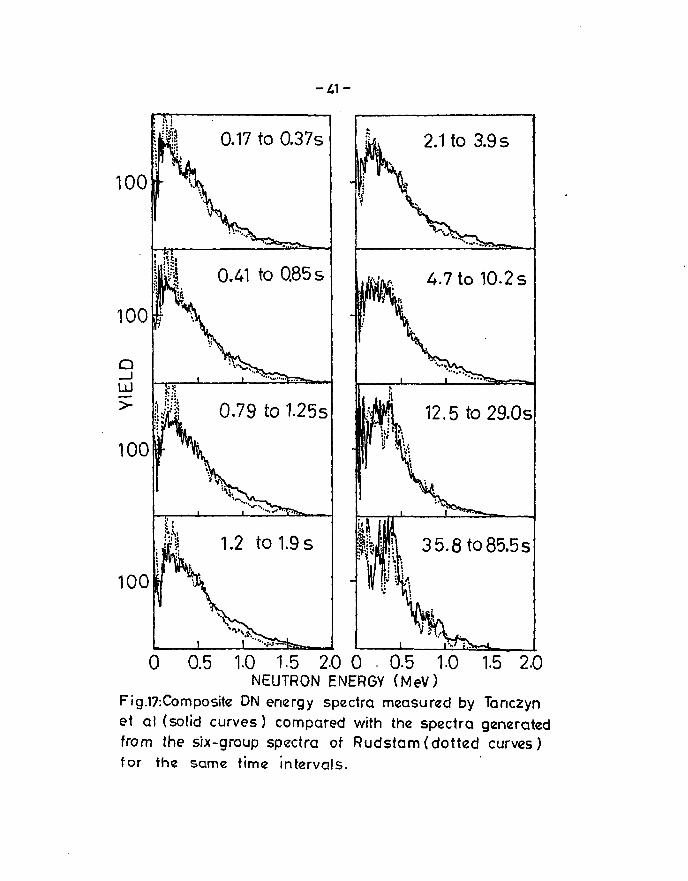
100
100
0 0.5 1.0 1.5 2-0 0 - 0.5 1.0 1.5 2.0NEUTRON ENERGY (MeV)
Fig.17:Composite DN energy spectra measured by Tanczynet al (solid curves) compared with the spectra generatedfrom the six-group spectra of Rudstam (dotted curves)for the same time intervals.
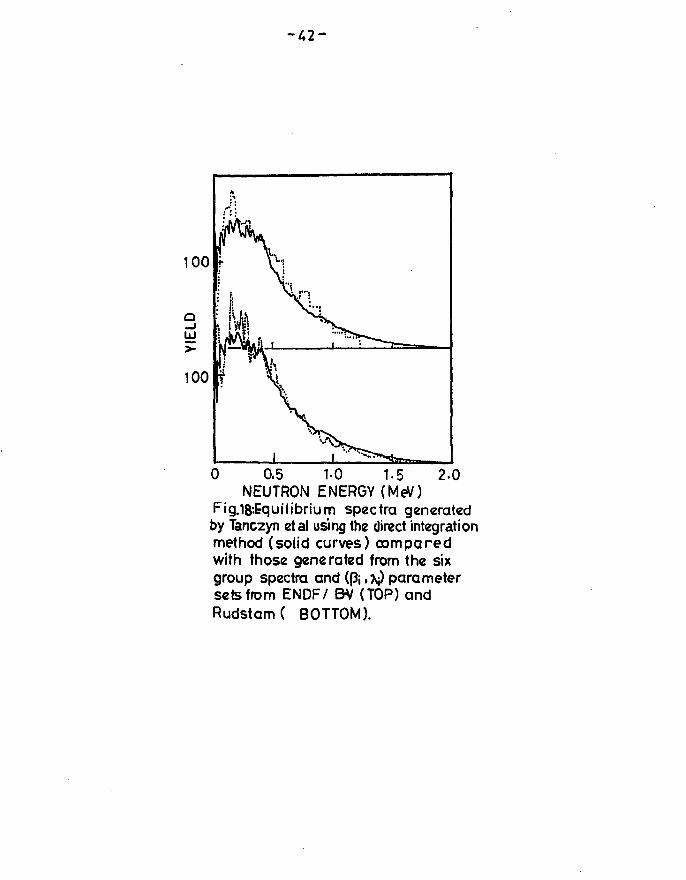
- 4 2 -
0 0.5 1-0 1-5 2.0NEUTRON ENERGY (MeV)
Fig.18'Equilibrium spectra generatedby Tanczyn etal using the direct integrationmethod (solid curves) comparedwith those generated from the sixgroup spectra and (|3i ,\) parametersets from ENDF/ BV (TOP) andRudstam( BOTTOM).

43
A search was made to find any changes in the composite delayedneutron spectra caused by a change in the energy of the neutronsinducing fission in 0-235 [29]. The search was performed over theeight successive delay time intervals with the mean energy of fastneutrons at 1.8 MeV. The eight fast ninus thermal delayed neutrondifference spectra indicated no measured changes of delayed neutronspectra between thezmal-and fast-induced U-235 fission. This resultwas consistent with the calculated difference spectra from England'scompilation. It was, however, noted that the delayed neutronspectral differences could be substantially greater for a muchharder neutron spectrum such as in the deuterium-tritium fusionprocess, where second-and third-chance fission modifies the yield ofdelayed neutron precursors.
Figure 19 shows the measured composite delayed neutron energyspectra following thermal neutron induced fission of Pu239 for fourdelay time intervals together with the corresponding ones from U-235fission by Couchell et al [30,pp.215-241]. The spectra are seen tobe very similar for short delay times, but show an increasingdifference for longer delay times. The average neutron energies ofthe Pu239 delayed neutron spectra were approximately 10 keV lowerthan those of 0235 for the two shortest delay intervals, and 40 to50 keV lower for the two longest delay intervals. This trend differssomewhat from the results of composite measurements reported byKratz and Gabelmann [23,pp.661-673] who found that the shapes andaverage energies of U-235 and Pu-239 delayed neutron spectra werequite similar for delay times ranging from about 1 to 50 seconds.
Atwater,Goulding et al [30,pp.255-274] have measured delayedneutron spectra from individual short pulse (about 50 fisec) fissionof small U-235 samples using a small NE 213 proton recoil neutronspectrometer and the Godiva fast.burst reactor as the neutron source(fast neutron flux « E+13 n/cm ). Data were acquired in sixty-fourO.5 s time bins and over an energy range of 1-7 MeV where verylittle is known about the delayed neutron spectra. The unfoldingtechnique used to obtain the energy spectrum from the pulse-heightdistribution was the "least-squares" method of Cook [31]. Theunfolded data started at 1 MeV since the threshold for the neutrondetector was 700 keV. Figure 20 shows a typical delayed neutronenergy spectrum for time bin of 5-10 sec together with thecalculation of England et al [30,p.270]. The early time data suggesta distribution that falls less steeply with energy than thecalculations indicate.
7.3 Phase 3 '
During the last one decade or so, following the 1979 Viennaworkshop and the 1983 Brookhaven meeting, the trend in thedevelopment of delayed neutron data has been to study delayedneutron emission from individual precursor nuclides. This approachhas become possible through improvements in the experimentaltechniques of isotope separation and the neutron spectroscopy. Intheir reviews, S. Amiel et al [8,pp.115-145] presented a list ofthirty-seven isotopes, Del-Marmol [32] of twenty-five isotopes andTomlinson [33] of forty-five together with their half-lives andemission probabilities (P ). These isotopes were the actual physical
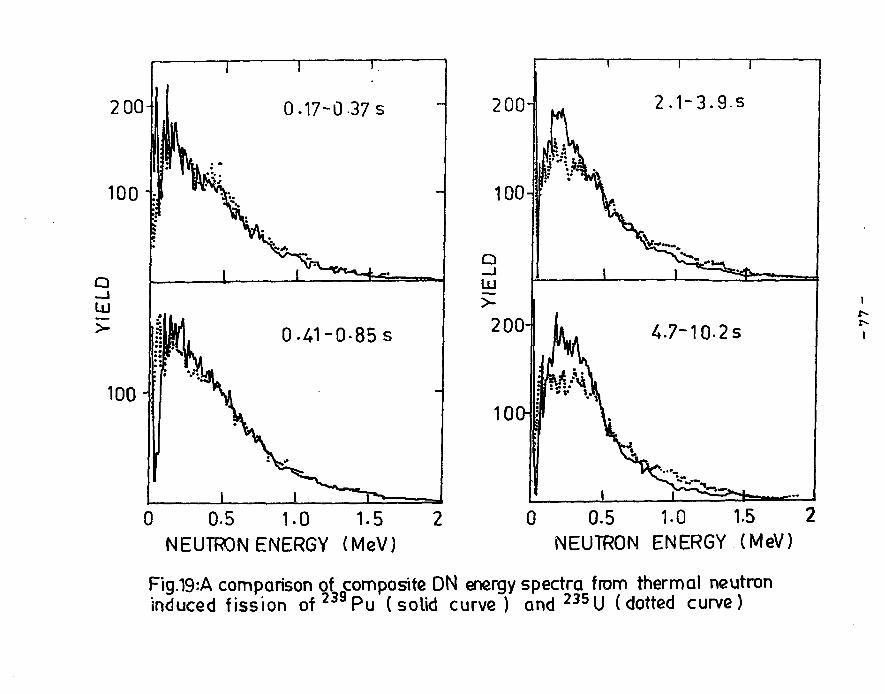
2 00- 200-
0 0.5 1.0 1-5 2NEUTRON ENERGY (MeV)
0 0.5 1-0 1.5 2NEUTRON ENERGY (MeV)
Fig.19:A comparison of composite DN energy spectra from thermal neutroninduced fission of 2 3 9Pu (solid curve) and 2 3 5 U (dotted curve)

210
.2in
a;
>
UJ
z:
104
io5
c:
1 To6
-710
Experimental =
Calculated -
1 2 3 4 5
NEUTRON ENERGY (MeV)Fig. 20: Neutron spectrum ( 5-10 seconds
after Godiva burst)

46
precursors of the delayed neutrons.
Measurements of delayed neutron spectra for separated precursorshave been made [11,30,34-48] at a number of laboratories using avariety of techniques: on-line mass spectrometry, He-3 spectroaetry,proton-recoil technique, the time-of-flight method and the neutronscintillator. The basic requirement in measuring the spectra of anindividual precursor is to have some fast method of separation ofthe particular fission product after the fissile sample isirradiated. These measurements indicate considerable variation inthe quality (statistical accuracy and resolution) of the spectradepending upon the technique and the laboratory doing the work. Theyalso indicate that while the overall shapes and peak structures canbe reproduced by different laboratories using the same or differenttechniques, the relative intensities of spectra at energies below200 keV are sensitive to the data processing techniques and theexperimental environment. Data analysis procedures are yet to bestandardized. Reeder and Warner have developed a ring ratiotechnique [49] to estimate the average energies of delayed neutronsfrom Dr87-Br89, Rb92-Rb98, 1-137 and Cs141-Cs147 precursors from theratio of counts in rings of counter tubes embedded in differentthicknesses of polythelene moderator [42,pp.239-263;5O]. Thetechnique has the advantage t!*at it requires relatively littlemeasuring time and has no cut-offs at high or low energies.
In figures 21 and 22, we present the neutron energy spectra of thefour nuclides (AS-85,Br-87) and (Sb-135,I-137) measured after rapidchemical separation of the individual precursors [38,51,52]. Thesenuclides represent characteristic pairs in the light and heavy massregions in fission, the member of each pair differing only by a pairof protons. The corresponding neutron emitters have N=51 and N=83.Consequently, the nuclides lead to nuclei with major closed shellsafter neutron emission. For the nuclides Br-87 and 1-137, theneutron decay proceeds entirely to the ground state of the finalnucleus where as for As-85 and Sb-135, the large energy windows(Qg-B ) result in neutron emission to several excited states. In thecases of Dr-87 and 1-137, the maximum neutron energies of about 1.3MeV and 1.7 MeV respectively are in agreement with the energy range(Qg-B ) available for neutron emission. A dominant feature of thespectra from As-85 and Sb-135 is the absence of appreciable neutronintensity at $high energies. For As-85, the intensity above 1.6 MeVis less than 3% of the total and for Sb-135 the intensity above 2.2MeV is less than 4\ of the total. This is despite the fact thatranges of 4.9 MeV (As) and 4.2 MeV (Sb) are possible. Through f-raystudies, it has been demonstrated that the effect is due to strongneutron emission to excited final states [11,51,53].
The neutron energy spectra shown in figures 23 and 24 are fromisotopes-separated precursors Rb92-Rb98 [54]. They have thefollowing main features:
(i) Only little high-energy neutron intensity even if energyranges upto 5.8 MeV (Rb98) are available for neutron emission.
(ii) A systematic variation,within the isotope sequence,of the peakstructure and the overall spectrum shape with the mass number.

RELATIVE INTENSITY
oo
oo
oo
oo
10oo©
and
CD
00
deco
<
Fig
u
- 1
1*0
Del a;
ICtro
3
*n>ctra
f
33co
zmcXIozmERG
«<(KeV
i
O
O
too
*<•oo
009
•e
—
j
Vglrr©
RELATIVE
to **Q O© ©
« i
l . ,
INTENSITYen coo Oo ©
s1 'w . . . - ;
^ • — _ • • i»
o©o
1
> •
- 2*8.0
1 303°
1 "i
m—i3DO
zmzm33
o(KeV
oo
00oo
N3oo
1600
0) 8
^-—
- ^ 8^fe-*-- ID
i •ro
- V fe C
>% § o
>J" *D ©«» g
r S1 *< IO800(keV
)
r
I
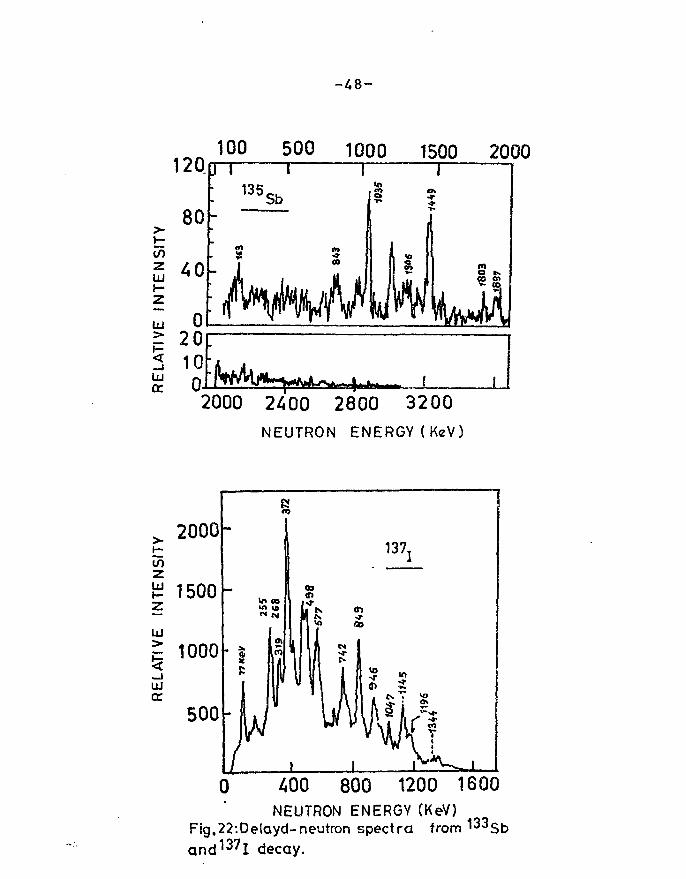
- 4 8 -
;COZUJf -z
UJ
100 500 1000 1500 2000
80-
4 0 -
020100
J•
-
• f
1 I135Sb
1(3 m
Im
IS
I
<
w
i*
%
w Is
2000 2400 2800 3200NEUTRON ENERGY(KcV)
> 2000
CO
zUJ
zUJ
UJ(X.
1500-
= 1000
500-
Inl
5
i137j
090)^-
I x> oo
li1-1-400 800 1200 1600
NEUTRON ENERGY (KeV)Fig,22:Delayd-neutron spectra fromand 1 3 7 l decay.
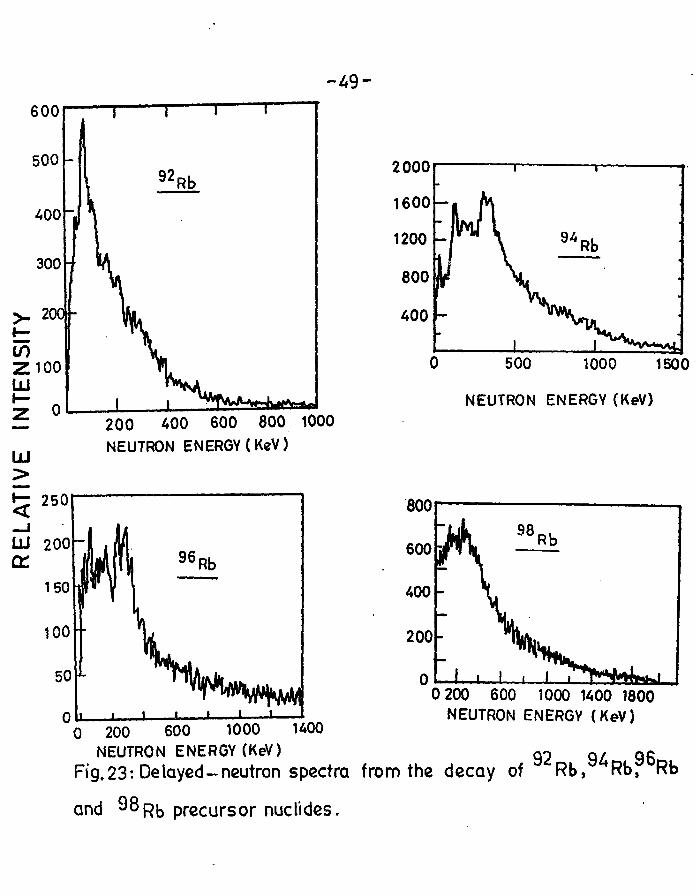
- 4 9 -600f
toztu
UJ>
200 400 600 800 1000NEUTRON ENERGY (KeV)
0 500 1000 1500
NEUTRON ENERGY (KeV)
200H
U00
0 200 600 1000 WOO 1800NEUTRON ENERGY (KeV)
0 200 600 1000NEUTRON ENERGY (KeV) g 2 94 96
Fig. 23: Delayed -neutron spectra from the decay of Rb, Rb, Rb
and 98Rb precursor nuclides.
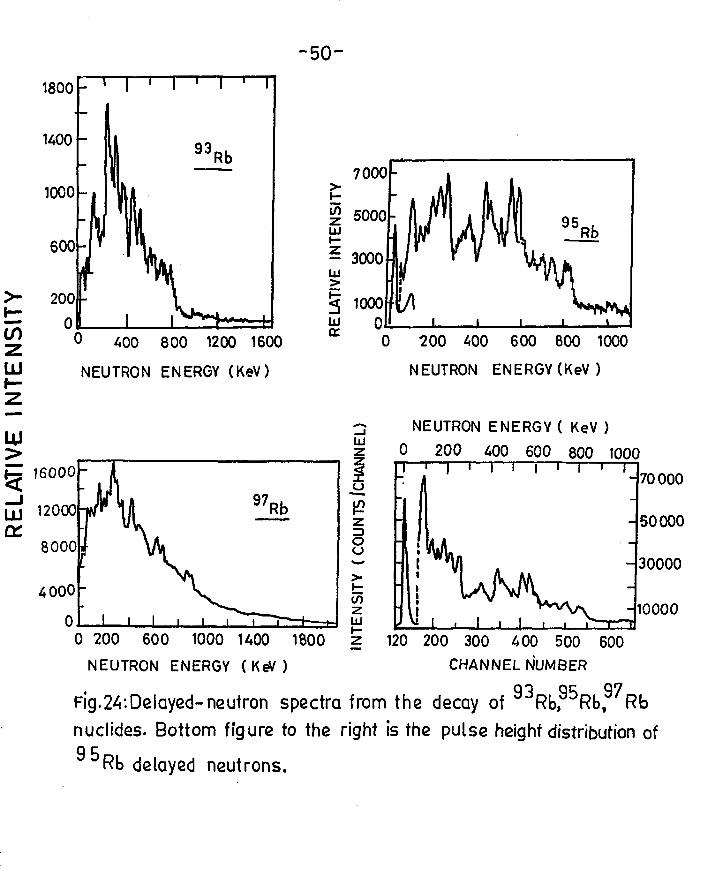
- 50 -
CO
zLU
1800
1400
1000
600
200
n
- ' 11
f pr
1
1 1 ' 1 ' 1
93 R b
I
V ;0 400 800 1200 1600
NEUTRON ENERGY (KeV)
0 200 AOO 600 800 1000
NEUTRON ENERGY (KeV)
>16000-
12000
0 200 600 1000 UOO 1800
NEUTRON ENERGY (KeV)
tuNEUTRON ENERGY ( KeV )
0 200 400 600 800 10001 i ' I • i
120 200 300 400 500 600
CHANNEL NUMBER
95™ 97,qq qc Q7Fig.24'.Delayed-neutron spectra from the decay of Rb, Rb, Rbnuclides. Bottom figure to the right is the pulse height distribution of9 5
Rb delayed neutrons.

3 51
(iii) Neutron spectra of odd mass Rb precursors decaying into even-even Sr nuclei exhibit prominent line structure and accountfor the majority of the total neutron intensity. A suddendrop in neutron intensity above about 850 keV is observed.
(iv) Even-mass Rb precursors decaying into odd-mass Sr final nucleishow a larger continuous neutron distribution superimposed byonly a few strong peaks which contain less than 20\ of thetotal neutron intensity. The main neutron intensity is con-centrated at energies below 400 keV.
Experiments have shown that the above variation in the shape ofthe spectrum and the absence of appreciable high-energy neutronintensity are due to the strong neutron emission to excited statesin the Sr final nuclei. Figure 25 shows the decay of Rb93-Rb95 tolevels in Sr92-Sr94. It is clearly seen that in the case of theeven-even final nuclei Sr-92 and Sr-94, neutron emission can lead toonly a few widely-spaced excited states, where as in the case of thefinal nucleus Sr-93, a total of about 30 narrowly spaced levels atexcitation energies upto 3 NeV are available for neutron decay. Thus•any neutron branches with comparable intensities superimposed leadto the complex neutron energy spectrum of the even-mass precursorRb-94, with only a few strong well-resolved neutron lines. This"odd-even effect" in neutron spectrum shapes is also observed forthe bromine, iodine and cesium isotope sequences.
Osing the detection and analysis philosophy described earlier in(7.2), Atwater et al carried out spectral measurements of separatedisotopes. Figure 26 shows the results of preliminary analysis forRb-97 with the experimental data normalized to the theoreticalcalculation. A steeper fall-off with neutron energy than theory isseen.
7.4 Comparison of Spectra [2]
Table 7 shows three data sets for each of the Br, Rb and Cs
Table
Source
7: Delayed neutron
Laboratory
energy spectra included
Spectra
xn the comparison
Detector
K.L.Kratz Mainz a7Br,33Rb,9*Rb,95Rb,1*3Cs 3He
P.Ray Penn. State 87Br Proton Recoil
G.Rudstam Studsvik 87Br,93Rb,9*Rb,9SRb,1*3Cs 3He
P.L.Reeder Pacific 03Rb,9*Rb,95Rb,1*3Cs 3HeNorth WestLaboratory
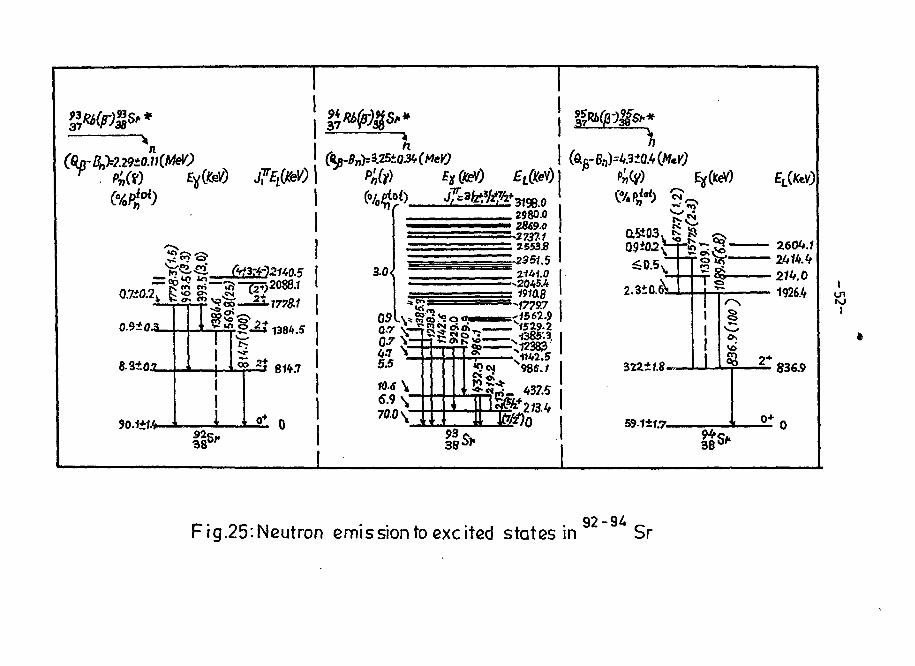
90.1*14-
Fig.25'.Neutron emission to excited states in92-94
Sr

- 5 3 -
10000
1000
yioo
<Xu
IDoo
10
0.1
ENERGY (MeV)2 3
Experimental—*
97
0 100 200 300 400 500 600 700CHANNELS
RUBIDIUM DELAYED NEUTRON SPECTRUM
Fig.26'-^Rb pulse hight spectrum.

54
precursors for comparison [43], In all the three data sew, much ofthe peak structure and overall intensity trends were reproducedexcept for the Studsvik data where below 200 keV, the intensitieswere generally higher. The intensities of the individual peaksdepend to some extent on the detector resolution and also on thelaboratory where the measurement is made. In figure 27 for Rb95. theMainz spectrum has a very intense peak at 13.7 keV, the area underthe peak corresponding to 10\ of the area between the limits at 100to 1100 keV. The same peak is observed in the Reeder*s spectrum butthe intensity is only 4% of the intensity between 100 and 1OOO keV.This illustrates the sensitivity of the low energy region to detailsof data processing. For Br87 (figure 28), there is reasonableagreement as to the peak positions and relative intensities for thetwo spectra measured with the He detectors. However, the spectrun•easured with a proton recoil detector has much greater intensitiesat low energies although the peak positions are reproduced wall. Theaverage energy for the spectrum measured with a proton recoildetector is about 140 keV where as the He spectrometer data giveaverage energies of about 220 keV. The average energy for Br87•easured by the ring-ratio technique gave a value of about. S50 keVwhich -tends to support the proton recoil result.
7.5 Principal. Detection Methods [2,30,42]
The principal detection methods employed in the ueasux eisents ofthe energy spectra of B-delayed neutrons from fission products inthe energy range of 0.01 MeV to about 4 MeV are: Pzpton-recoilspectroaetry, Time-of-flight measurements and the JKe (n,p)spectroaetry. We shall now discuss each of these techniques inbrief.
7.5.1 Proton-recoiL Spectrometry
Very clean measurements of fast neutron energy spectra can beperformed with recoil proton telescopes. In these spectrometers, theenergy and direction of the proton from a hydrogen-rich material are•easured with scintillators or semi-conductor counters. Using pulseshape discrimination in a CSI (Tl) proton detector, it is possibleto measure neutron spectra down to very low energies. However, thetechnique has a very low efficiency (about 10" ) and because ofthis, it is not commonly used in fl-delayed neutron spectroaietry.
The conventional proton-recoil system uses methane or hydragen-filled proportional counters at several atmospheres pressure and -y-ray discrimination via pulse-shape analysis [55]. Using this system,time-dependent neutron spectra from the thermal-neutron fission ofU-235 were measured by Sloan and Woodruff [13,14]. Later, Ecclestonand Woodruff [15,16] used it to measure the two-parameter data ofnear-equilibrium delayed neutron spectra produced by fa&t-aeutroninduced fission of different fissile isotopes. The main problem inanalyzing proton-recoil data consists in the transformation of theregistered two-parameter data to one-parameter proton-recoildistributions which are then differentiated using the PSHS code [seeReport ANL-7394,Jan.1968,130p] to give the neutron spectra. Accuracyof neutron spectra determination requires that corrections are madefor: the energy loss per ion pair, the neutron scattering on heavy

- 5 5 -
MAINZ SPECTRUM
STUDSVIK SPECTRUM
REEDER S SPECTRUM
u l . r ifnf , , , I200 400 600 800 1000
ENERGY (keV)1200
Fig.27 ".Comparison ofdefferent" laboratories.
delayed-neutron spectrum measured at

- 5 6 -
REEDERS SPECTRUM
STUDSVIK SPECTRUM
MAINZ SPECTRUM
L .400 800
ENERGY (keV)1200
87,Fig.28 = Comparison of delayed-neutron spectrum for ° Br measured
at different laboratories.
57
nuclei (carbon,nitrogen), the non-ideal electric-field effects andfor wall-and-end effects. It has been found that the (near-)equilibrium delayed neutron spectra obtained by proton-recoilspectroaietry show considerable differences in the energydistributions, especially in the low-energy portion of delayedneutrons, when coapared to He-spectrometry neutron energy spectra.
Ray and Kenney [39] used a methane filled proton-recoilproportional counter of the above type to measure the delayedneutron spectrum from Br-87 beyond 100 keV. Major peaks wereobserved at 131 and 192 keV and much smaller peaks at 261, 337, 420and 520 keV. The observed spectrum was.significantly softer comparedto the previously reported data. Greenwood and Caffrey [2,48]reported on measurements of the energy spectra of delayed neutronsfor the isotope-separated fission-product precursors Rb93-Rb97 andCs143-Cs145 over the energy region from about 10 to 1300 keV usinggas-filled proton-recoil proportional counters at the TRISTAN ISOLfacility. These measurements showed systematic deviations inintensities between the INEL data and the other reported data setsin the neutron energy region above about 800 keV. Subsequently[30,pp.199-214], they carried out a series of measurements using thesane experimental set up to obtain additional delayed neutronspectral information at these higher energies and below about 20 keVusing high pressure CH gas-filled proportional counters and aliquid scintillation counter. Tables 8 and 9 summarize the delayedneutron spectral intensity distributions obtained by combining thepresent data with their earlier data [2,48]. Quantitativeintercomparison of the present data with the previous data measuredusing He3 ionization chambers is given in Table 10 for the widelystudied Rb95 isotope. It is seen that while the most recent INELdata and the Rudstam data [2] appear to be reasonably consistent inthe energy region above 770 keV, the present INEL neutronintensities fall off much faster than those reported by Kratz [2].
7.5.2 Fast Neutron Time-of-fLight Spectrometers
In principle, the best method for precise measurements of fastneutron energy spectra is the TOF technique. Through thedevelopments of accelerators capable of delivering beam pulses ofgood quality, of large organic scintillation detectors, and of fastelectronics, the energy resolution in TOF neutron spectroscopy hasthe same quality as that obtained for charged particles. The methodis basically very simple and consists in measuring the flight timeof a neutron ejected from a target over a distance and thencalculating the neutron energy from it. The start pulse is takenfrom a pick-up coil in front of the target or from an associatedparticle emitted in the reaction. The stop pulse is taken from theneutron detector. In the case of delayed neutrons, the associatedparticles emitted are the 0-rays.
The energy resolution AE is determined by the time uncertainty At,since the flight distance (1) can be measured with high precision.The expected energy resolution is given by [56]:
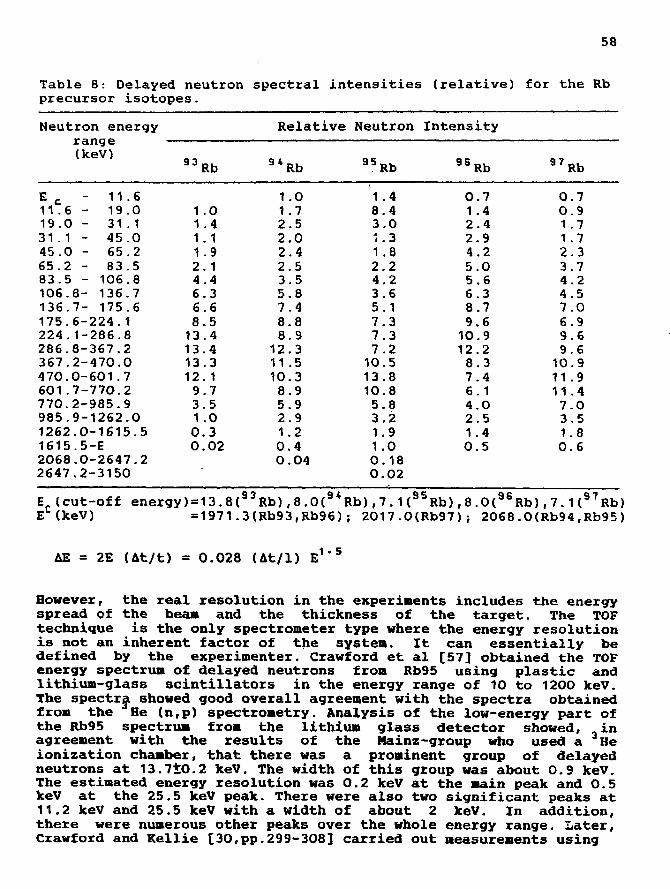
58
Table 8: Delayed neutron spectral intensities (relative) for the Rbprecursor isotopes.
Neutron energy
(keV)
E - 11.611.6- 19.019.0 - 31 .131.1 - 45.045.0 - 65.265.2 - 83.583.5 - 106.8106.8- 136.7136.7- 175.6175.6-224. 1224.1-286.8286.8-367.2367.2-47O.O470.0-601.7601.7-770.2770.2-985.9985.9-1262.01262.0-1615.51615.5-E2O68.O-2647.22647.2-3150
9 3 Rb
1 .01 .41.11 .92. 14.46.36.68.513.413.413.312.19.73.51.00.30.02
Relative
94Rb
1.01 .72.52.02.42.53.55.87.48.88.912.311 .510.38.95.92.91 .20.40.04
Neutron
9 5 Rb
1.48.43.01.31.82.24.23.65.17.37.37.210.513.810.85.83.21.91 .00.180.02
Intensity
96Rb
0.71.42.42.94.25.05.66.38.79.610.912.28.37.46.14.02.51.40.5
97Rb
0.70.91 .71.72.33.74.24.57.06.99.69.610.911 .911 .47.03.51 .80.6
E (cut-off energy)=13.8(93Rb),8.0(9*Rb),7.1(95Rb),8.0(96Rb),7.1(97Rb)Eu(keV) =1971.3(Rb93,Rb96); 2017.O(Rb97)} 2068.0<Rb94,Rb95)
AE = 2E Ut/t) = 0.028 (At/1) E1'5
However, the real resolution in the experiments includes the energyspread of the beam and the thickness of the target. The TOFtechnique is the only spectrometer type where the energy resolutionis not an inherent factor of the system. It can essentially bedefined by the experimenter. Crawford et al [57] obtained the TOFenergy spectrum of delayed neutrons from Rb95 using plastic andlithium-glass scintillators in the energy range of 10 to 12OO keV.The spectra showed good overall agreement with the spectra obtainedfrom the He (nfp) spectxometry. Analysis of the low-energy part ofthe Rb95 spectrum from the lithium glass detector showed, inagreement with the results of the Mainz-group who used a Heionization chamber, that there was a prominent group of delayedneutrons at 13.710.2 keV. The width of this group was about 0.9 keV.The estimated energy resolution was 0.2 keV at the main peak and 0.5keV at the 25.5 keV peak. There were also two significant peaks at11.2 keV and 25.5 keV with a width of about 2 keV. In addition,there were numerous other peaks over the whole energy range. Later,Crawford and Kellie [30,pp.299-308] carried out measurements using

59
Table 9: Delayed neutron spectral intensities (relative) for the Csprecursor isotopes.
Neutron energyrange(keV)
Relative Neutron Intensity
143 Cs144Cs
145 CS
1V6 -19.0 -31.1 -45.0 -65.2 -83.5 -106.8-136.7-175.6-224.1-286.8-367.2-470.0-601.7-770.2-985.6-1262.0-1615.5-
11 .619.031.145.065.283.5106.8136.7175.6224.1286.8367.2470.0601 .7770.2985.61262.01615.52017.0
0.32,66.13.34.05.87.58.611.012.911.39.85.44.63.42.01.00.20.001
0.52.75.24.96.85.97.18.78.99.48.67.77.15.95.23.11.70.60.1
0.81.62.93.24.64.86.47.18.68.88.68.89.18.97.34.62.51.10.3
E£(cut-off energy) - 10.2,10.2 and 7.8 keV (143"1*5Cs) respectively
Table 10: Rb - Comparison of He and proton recoil results
neutionenergyrange(keV)
0 - 39.839.8- 65.265.2- 106.8106.8- 175.6175.6- 286.8286.8- 367.2367.2- 470.04^0.0- 601.7601.7- 770.2770.2- 985.9985.9-1262.01262.0-1615.51615.5-2O68.O2O68.O-2647.22647.2-3386.6
3 HeRudstam
4.58.915.77.310.812.38.76.22.3
Relative Neutron
SpectrometerReeder
3.42.44.78.214.88.310.111.111.37.67.1
Kratz
10.31.44.56.213.16.610.515.312.17.44.73.92.70.90.3
Intensity
Proton-RecoilINEL
£2,48]
13.32.46.26.4
14.37.010.213.410.35.63.0
DetectorINEL[30]
13.02.46.28.414.27.010.213.410.55.63.11.81.00.20.02

60
the fission produce mass separator OSTIS at the ILL, Grc.o&i<; . Beta-particles froKi th& decay of fission products were: •:•.•.-•••.w.ad by asmall plastic scintiilator. Two neutron detectors, the i,E ?';'i liquidscintillator and the WE 312 lithium glass scintill a tor .'•>..£ used.For Rb-94 and Rb-95, flight paths were 2.5 m and covered the energyrange from about 160 keV to 10 MeV. With the glass r̂ci.- > ilia tor,short flight paths of 30 to 45 cm were used in order to cover theenergy region below 100 keV. In figures 29 to 31, sou? of. cheirresults are presented. The errors shown in the fiiqu.res -i:cn. purelystatistical based on the spectra themselves. No account v/.--s taxan ofthe possible uncertainties in the efficiency corrections. Theresults for Eb-S4 taken with the NE 213 liquid scint.illiter areshown in figure 29 and compared to those of the Mainz group '.'ho used3-He spectrometers. No normalization was included, so the intensityscales are arbitrary. The agreement is generally good. The resultsin figure 30 show .little evidence of significant yields above 2 MeV.Figure 31 shows the low-energy part of the delayed neutron spectrumfor Rb-95 taken with the Li glass detector. The well-known lowenergy peak at about 14 keV is seen.
7.5 = 3 3He~Sp£Cfcrcineters
In the spsctroscopy of neutrons in the energy range of 0 to 3 KeV,a He3 gas proportional counter provides the best combination, ofenergy resolution and detection efficiency [53*! . But He-spectroxsetry is not always a straightforward technique. With the He3(n,p) detection sethod, the energy spectra of delayed neuexons fromfission have been studied both from fissionable material and fromseparated fission products [59]. Thirty-three individual precursorshave been measured which include precursors of primary interest innuclear technology. However, for nearly fourteen of the-*? spectra,the low energy part up to about 100 keV is lacking and. :her£ is ageneral discrepancy in the energy/intensity distributions betweenthe OSIRIS and the Mainz neutron spectra. These discrepancies callfor detailed studies of the He3-spectroiaeter characteristics withparticular emphasis on detector resolution, efficiency ar,d spectrumdistortion effects.
The latest versions of the He spectrometers are cylindricalgridded ionization chambers with guard tubes to reduce fringingfields [17,60]- Neutrons are detected through the reaction
3He + n * p + 3H + 763.8 keV
which has a smooth and well measured cross-section in the energyrange of the delayed neutrons. Competing reactions with c0Hp3.ra.tivecross-sections are He3 (n,n') He3 and HI {ufj":') HI. Thespectrometers are filled with a gas mixture consisting aainly of 3-He, Ax and Methane. They are surrounded by thermal neucror, shieldswhich reduce the thermal neutron count rate by a factor of. about 50to 20. The energy calibration of the He3 spectrometers and theirresponse function to aono-energetic neutrons are usually obtainedusing neutrons from the Li (p,n) Be reaction produced with Van deGraaff accelerators. Scattered neutrons from the detector, the

Rb-94Crawford and Kellie
i i i i i
0.2 0.4 0-6 0.8 1.0NEUTRON ENERGY (MeV)
300
250
200
150
10050
0 1 1 1
R b - 9 5 l 2.5m flight path)
Background chosen to giveaverage counts from 7to
Figure 30
_1 • i i 1 • I l-lu
zero30 MeV)
i - 4 -0.5 1-5 2-5 3-5 4-5
NEUTRON ENERGY(MeV)6.0
Rb-95 ( Li glass spectrum)
u 0.02 0.04 0.06 0.08 0.10NEUTRON ENERGY (MeV)
Ien

62
surrounding material and the wall effects give a continuous pulsedistribution between the fast and the thermal neutron peak. Of majorinfluence are the recoil effects in the elastic scattering ofneutrons with protons and the He-3 nuclei. Because the Q-value ofthe He3 (n,p) H3 reaction is 763.8 keV, this recoil effect shows upbeyond the thermal neutron peak only for neutron energies greaterthan about 1.0 HeV.
The response function is determined with the aim of unfoldingexperimental neutron pulse-height spectra [42,61-63]. The techniqueused in some of these works utilizes a combination of pulse heightand rise time discrimination against scattering events in thedetector. This results in a significant decrease in efficiency sincefor high energies a major fraction of the response appears below thefull energy peak. Beimer et al [64] have measured and fitted thewhole detector response in the energy range of 130-3030 keV. Thefitting was done with regard to the fast neutron peak, the walleffects and recoil distributions of elastically scattered protonsand helium nuclei. This makes the total intensity of theexperimental spectrum useful for evaluating complex neutron spectra.This is specially important for high energies where the major partof the response is found in the low energy tail. The sixteen-parameter response function was:
R(E,En) = [A17(E-A18)+Al6]/[1+exp<(E-Al0)/A1s>]
]/[1+exp<(E-A113)/At ̂ >]
+A6 exp[-{(En+764)-E>/A7] ERFC
+\\ exp[-<(En+764)-E»/A5> ERFC
+61A1 exp [-{1/2)[<(En+764)-E)/A3]2]
+62A8 exp[-(1/2)[{(En+764)-E>/A932]
with fi = 1 and 6 = 0 for E < (E +764)6] = 0 and 8, = 1 for E > (E +764)1 2 n
and the energies are in keV. The peak energy (E +764 keV)corresponds to the fit parameter A . The function is valid forneutron energies E in the range 100 to 3100 keV and forabsolute energies E from 150 keV. A least-squares fit using thealgorithm of Marquardt [65] which combines a gradient search with ananalytical solution developed from linearization of the modelfunction is used. The fitting was done by minimizing the chi square.To predict the shape of the detector response for any neutronenergy, the parameters were determined by linear interpolationbetween the tabulated parameter values given in ref.65. Conclusionsdrawn from the study are:
(i) The 3He spectrometers can be used with confidence for neutronenergies upto at least 3000 keV. Care must, however, be taken

63
with the interpretation at low energies due to the unexpectedstructure.
(ii) The peak structure of the beta-delayed neutron spectrum wascaused by the He spectrometer itself;
(iii) Scattering from the detector wall is a possible source for thedistorted detector response;
(iv) The appearance and energy of the "ghost peaks" is due to back-scattering in the detector wall.
Ohm and Kratz [30,pp.175-198] have developed a computationaltechnique for response function analysis that removes the unwantedsi.de effects in the neutron spectra without disturbing theefficiency function. The method takes into account all the relevantphysical processes in detail and a relatively simple description ofthe detector response is derived instead of many-parameterpolynomial fitting routines [64,66,67]. Though the analysis methodwas demonstrated for the well-structured pdn-spectruro of theprecursor 1.26 s K49, the response correction is applicable to pdnspectra measured under different experimental conditions andgeometries provided minor adjustments to the magnitude of the walleffect are applied.
The wall-effect magnitude was calculated as a simple function ofthe total energy, as:
Pw,'t!ot Clt) - Ctot (V Et>
where, P ' (E.)=1-[a /(a +a E.+a E.)] and a ,a,a are theparameters"'51T tins parabola that*wire"*fitted to the data3points. E.is the total energy carried by the products of the reactionBe3(n,p)H3. P is a parameter that is determined for each standardspectrum.
The proton recoil plateau was described by:
.P., ]/[p<3He> .
Here p denotes the partial gas pressure, <r" , the scattering cross-section of neutrons by protons, E the 'recoil energy and AE thechannel width. P is a parameter and N is the number of protonrecoil events.
The 3He recoil distribution was described by:
Ej.) - t16»{1-P^tot(Er)>.aE.Knp(En).P4.dtf/dQ(En,Cos 9)]
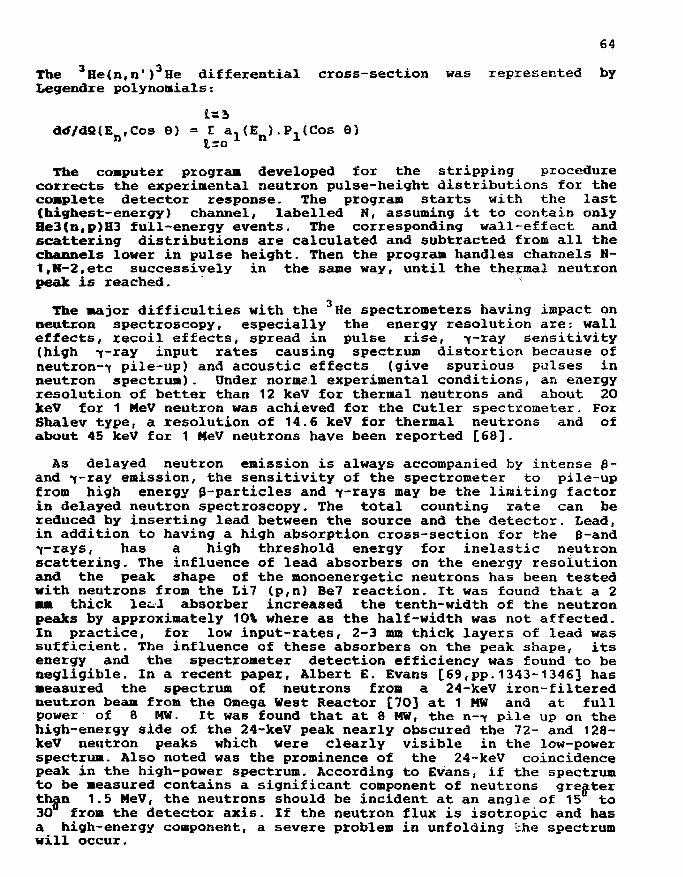
64
The 3He(n,n')3He differential cross-section was represented byLegendre polynomials:
dtf/dfi(E .Cos B) = Z an(E >.P.,(Cos 6)
The computer program developed for the stripping procedurecorrects the experimental neutron pulse-height distributions for thecomplete detector response. The program starts with the last(highest-energy) channel, labelled N, assuming it to contain onlyHe3(n,p)H3 full-energy events. The corresponding wall-effect andscattering distributions are calculated and subtracted from all thechannels lower in pulse height. Then the program handles channels H-1,H-2,etc successively in the same way, until the thermal neutronpeak is reached. ;
The major difficulties with the He spectrometers having impact onneutron spectroscopy, especially the energy resolution are: walleffects, recoil effects, spread in pulse rise, f-ray sensitivity(high -r-ray input rates causing spectrum distortion because ofneutron—f pile-up) and acoustic effects (give spurious pulses inneutron spectrum). Under norms1 experimental conditions, an energyresolution of better than 12 keV for thermal neutrons and about 20keV for 1 MeV neutron was achieved for the Cutler spectrometer. ForShalev type, a resolution of 14.6 keV for thermal neutrons and ofabout 45 keV for 1 MeV neutrons have been reported [68].
As delayed neutron emission is always accompanied by intense p-and f-ray emission, the sensitivity of the spectrometer to pile-upfrom high energy 0-particles and f-rays may be the limiting factorin delayed neutron spectroscopy. The total counting rate can bereduced by inserting lead between the source and the detector. Lead,in addition to having a high absorption cross-section for the B-andf-rays, has a high threshold energy for inelastic neutronscattering. The influence of lead absorbers on the energy resolutionand the peak shape of the monoenergetic neutrons has been testedwith neutrons from the Li7 (p,n) Be7 reaction. It was found that a 2mm thick led absorber increased the tenth-width of the neutronpeaks by approximately 10\ where as the half-width was not affected.In practice, for low input-rates, 2-3 mm thick layers of lead wassufficient. The influence of these absorbers on the peak shape, itsenergy and the spectrometer detection efficiency was found to benegligible. In a recent paper, Albert E. Evans [69,pp.1343-1346] hasmeasured the spectrum of neutrons from a 24-keV iron-filteredneutron beam from the Omega West Reactor [70] at 1 MW and at fullpower of 8 MW. It was found that at 8 MW, the n—y pile up on thehigh-energy side of the 24-keV peak nearly obscured the 72- and 128-keV neutron peaks which were clearly visible in the low-powerspectrum. Also noted was the prominence of the 24-keV coincidencepeak in the high-power spectrum. According to Evans, if the spectrumto be measured contains a significant component of neutrons greaterthan 1.5 MeV, the neutrons should be incident at an angle of 15 to30 from the detector axis. If the neutron flux is isotropic and hasa high-energy component, a severe problem in unfolding ihe spectrumwill occur.

65
Efficiency measurements [60,64] indicate a decrease at low energywhich follows the 1/v variation of the He (n,p) H cross-section,then a rapid decrease above 1 MeV where wall effects due to chargecollection problems become severe and a departure from the smooth•onotonic decrease of the efficiency with energy in the vicinity ofE_- 130 keV and E - 34O keV. Evans, Franz have suggested thatdifferences in the spectrometer construction could be important indetermining the performance characteristics of He spectrometers.Using a Monte Carlo approach, Sailor and Pxussin [71] have shownthat the decrease in the efficiency with increasing energy is afunction of the source to detector distance. This necessitatesefficiency correction for 'high' geometry measurements.
There are two major features which put constraints on theapplicability of the three types of spectrometers discussed. Thefirst is the energy dependence of the system resolution which isshown in figure 32 for the three spectrometer types. It is seen thatthe TOF and the proton-recoil spectroscopy are the superior methodsin the low-energy range upto about 150 keV and 300 keV respectively.
00 3000500 1000 2000
NEUTRON ENERGY ( keV )Fig.32;Comparison of detector resolution (FWHM)for a ^He spectrometer, a proton-recoilproportional counter ( 2.5 atm H2 / CH)and typicalTOF system ( flight path 50 cm, time resolution 3ns).
In contrast, He ionization chambers provide an adequate energyresolution of about 12 to 25 keV over the entire delayed neutronenergy range of interest upto 3 MeV, where the performance of theother two detector systems worsens drastically. The increased fwhmaround 300 keV is due to multiple scattering effects [30,p.153]. Thesecond feature relates to the potential spectrum distortions whoseorigin are different for the three detection systems. However, inall the three cases, background effects may obscure the low-energypart of the delayed neutron spectra and thus may raise doubts as tothe exact intensity distributions below about 150 keV.
The disadvantages of the delayed neutron detection systems can beminimized by careful experimentation and by taking due caution inthe spectrum analysis. For example, by minimizing spectrum

66
distortion effects, it has been possible to resolve delayed neutronswith energy greater than 10 keV from the thermal neutron peak in Hespectra.
7.6 Spectral Analysis
The conversion of a measured pulse spectrum C. obtained withan energy-sensitive detector to a true particle energy spectrum •.is called spectral analysis. Expressed mathematically:
Ci - f Rij *j
where, i denotes the energy channel (E.) and the matrix R..t-he response function of the detector. The components of R. . givethe probability that a particle of energy E. will-'give apulse of energy E.. The total probability that the3 particle ofenergy E- will give rise to a pulse is the efficiency of detection
e. = j «:./••>
Several methods are available for doing spectral analysis. Thesimplest of them is to use the matrix inversion and obtain
•j * (f Ci Di ) / D
where D is the determinant of the system and D. is the appropriatecofactor. A drawback of this method is that unphysical negativespectral values may occur. The difficulty can be overcome by meansof a modified unfolding technique [ ]
Another way is to use an iterative technique originally developedby Greenberger and Shalev [73]. The method uses a complete set ofpremeasured detector response functions for monoenergetic neutronsto fit the entire spectrum in a least squares approach and tosubtract the continuous pulse distribution below the respective fastneutron peaks. The program starts from a zeroeth approximation ofthe energy spectrum, applies the response function to theapproximate energy spectrum, deduces the expected pulse spectrum andcompares it to the measured one. The •. values are then adjusted insuccessive approximation until a set of3 values is obtained whichyields a pulse spectrum in agreement with the measured one. Insimple cases, a deconvolution method can be used provided theresponse function has a cut off,i.e., R.. = 0 for i>1. But theiterative method ignores the experimental -^conditions to which theresponse function is very sensitive. Besides, the technique is notvery suitable for an error analysis. The deconvolution method cannot be used directly since the response-function has no sharp cut-off in practice due to the presence of high-energy tail. In the

67
above methods the error at low energies are large because ofcontributions from all the higher energies. Evans and Krick [20}tWeaver et al [42,pp.207-238], Rudstam [67] all of them used theabove aentioned subtraction processes and applied fixed detectorresponse functions. Franz et al [38,60] used response functionsadapted to the experimental conditions during the spectrumMeasurements by varying the peak-to-plateau ratio. In addition tothe continuum subtraction, corrections for thermal neutrons and •*-ray pile-up are incorporated before the residual 'net' pulse heightdistribution is converted to a neutron spectrum by dividing it bythe efficiency function of the detector.
A method that circumvents the above problems is the modifieddeconvolution method [62] which is a combination of the iterativeand the deconvolution methods. In this method, one starts with thehighest channel 'n' containing information and adjusts its contentto obtain
Cn " Cn -TRn3*3
and then the corresponding neutron intensity •' which is closer tothe true value than •_. One more iteration gives a better and thefinal value (• ) of the number of neutrons of energy E . Afterdetermining the highest energy point of the nevstxon spectrum by theabove-mentioned procedure, all pulse values are adjusted as:
The above steps are repeated for the next channel and so on untilall the channels have been converted to a set of neutron intensities*". with statistical variances o* <•'!).
In the method for spectrum analysis reported by Walker et al[44,pp.265-267;61], the initial starting flux distribution wasobtained by dividing the measured pulse-height distribution by thedetection efficiency and the response function was computed usingthe equation
Y(E) = P(1) [ expl-O.5[(E-En)/P(2>]2>
+P(3) exp{-O.5[(E-(En-P(4)))/P(5)]2)
+P(6) ui(E)]
where Y<E) is the magnitude of the pulse height distribution at anenergy E, u>(E) is the wall effect prediction, P{1) is a normalisingfactor and P(2) to P(6) are terms determined from a non-linear leastsquares fit to the data. The computed result (product of flux

68
distribution and response function) was compared with the measuredpulse height distribution by means of a chi-squared test. Theiteration is continued till the change in chi-squares between twosuccessive iterations is less than some pre-determined value whenthe flux distribution • is determined. An analysis of errors is madeby calculating the full covariance error matrix for the unfoldedspectra. The basis of the operation is to vary each parameter withinthe unfolding operation by a known amount, and then repeat theunfolding. Thus each channel of the pulse-height distribution is inturn changed by 1 standard deviation and the unfolding repeated ineach case. Similarly, each parameter which is used to define theresponse function, both in shape and efficiency, is varied, and arevised unfolded distribution produced. In this manner, a differencematrix fi between each of the unfolded cases and the unperturbedresult is generated, and the error on the unfolded spectrum V iscalculated from the relationship:
where V is the covariance matr: x. of the input parameters. It isimportant to note that the method of determining the covariancematrix is independent of the method employed to unfold the data.Using this procedure, the uncertainties in the individual unfoldedspectra and in the differences between them were evaluated for a setof four measurements of delayed neuton spectra from fast fission inD-235 [74]. The results shown in figure 33 indicate a systematic
.NEUTRON INTENSITYI-(ARBITRARY SCALE)
NEUTRON ENERGY(MaV)
(c) T-E
600 1200All 3
1800
Fig.33: Differences between the P;Q,TQnd E spectra
trend of increasing intensity at delayed neutron energies less than200 keV as a function of increasing primary neutron energy. Thistrend is statistically significant and presumably arises fromvariations in the fission yields of delayed neutron precursors. Theletters P, Q, T and E refer to the four measurements conducted withmean primary neutron energies of 0.94,1.76,1.44 and 0.49 MeVrespectively. Similar results for other fission products werereported by W.J. Maeck [44,pp.91].

69
Shikoh Itoh [69,pp.1367-1370] has developed an unfolding procedurebased on the maximum likelihood method which incorporates thePoisson statistics of neutron detection. The solution spectrum isgiven by the matrix equation
• = R+[I - AUQ(U*A U o)~1 U*]c, R+= VS^uf
where, c = counts in the ith channel, A. = expectation of c. , A =diag ('X1, . . . . , \ . ) , •• = number of neutrons belonging to the jthenergy group, Rii t h e Probability that a jth group neutronproduces a count in3the ith channel, R=USV is the response matrixand A=R?. Results of his numerical calculations showed that theprocedure converged after three or four iterations and thedifferences between these solutions and the leagt-squares methodwere little. The appearance of negative values in • were found to bemore dependent on the statistical accuracies of c's than on themethods used. Itoh has introduced a factor called "error magnifyingfactor" (F) whose asymptotic value F indicates the intrinsiclimitation of spectroaeters that need unfolding procedures. Thefactor F can be used to compare the efficiency of various unfoldingalgorithms and also to plan experiments.
In the method of Gadjokov and Jordanova [75], neutron spectra,F(E ) are unfolded by differentiating the recoil-protonspectrum,P(E ) using the equation [76]:
F(En) = - [dP(Ep)/dEp].[K(Ep,En)]"1
Here, E is the proton energy, E the neutron energy and K(E ,E ) isthe spectrometer transfer function. The derivatives are competes onthe basis of global orthonormal-polynomial fits supported bysuitable functional transforms.
(dP/dEp) = (dP/da) <g.dL/dEp)2 + P(a).g.(d2L/dEp
2)
where, a is the pulse amplitude, g the spectrometer gain factor andL(E ) is the light-output function. A three-factor representation isusea fox the response transfer function [77]:
K(EptEn) = eCEn).S(Sp,En).B(Ep)
where, e(E ) is the crystal efficiency, S(S ,E ) is the recoil-proton distribution when a neutron of energypE is scattered, andB(E ) is the edge-effect function. Using the methSd outlined above,several spectra were unfolded. In particular, the peaks at energies2.1,3.2,4.8,5.6,6.8,7.85 and 9.7 MeV of the Pu-Be spectrum wereresolved in agreement with other experimental and calculated data.

70
The errors introduced into the delayed neutron intensity by thisunfolding procedure are estimated to be about
10* (E < 100 keV)n
7\ (100 keV < E < 1 MeV)n
10-20* (En > 1 MeV)
These errors include all possible uncertainties in the responsefunction, efficiency, correction for scattered and thermal neutrons,and "f-ray pile-up.
Though the main properties of the He ionization chambers are moreor less well understood by now, discrepancies still exist betweenthe near-equilibrium and the individual precursor neutron spectraaccummulated by various authors using the same type of spectrometer,and there is disagreement among the data obtained with differentdetection methods.
REFERENCES
1) Proceedings of the Consultants' Meeting on Delayed NeutronProperties, Vienna, 26-30 March 1979 (International At>micEnergy Agency, Vienna, August 1979, INDC(NDS)-107/G+Special) 1-293.
2) R.E. Chrien, T.W. Burrows (Eds.): NEANDC Specialists' Meeting OnYields and Decay Data of Fission Product NucLldes, (Report BNL51778, Brookhaven National Laboratory, Upton, New York,1983)583p.
3) Merle Burgy, L.A. Pardue, H.B. Willard and E.0. Wo1Ian: Phys.Rev. 70. (1946) 104. Also See Report MDDC-16, Manhattan DistrictDeclassified Documents (1946).
4) D.J. Hughes, J. Dabbs, A. Cahn and D. Hall: Phys. Rev. 73 (1948)111-124.
5) T.W. Bonner, S.J. Bame.Jr. and J.E. Evans: Phys. Rev. 101 (1956)15(4-1515.
6) R. Batchelor and H.R. McK. Hyder: J. Nucl. Energy 2 (1956) 7-17.
7) Arthur H. Jaffey: Report ANL-7747, Argonne National Laboratory,Azgonne, Illinois (November 1970) 34p.
8) Delayed Fission Neutrons, Proceedings of a Panel, Vienna, 24-27April, 1967 (International Atomic Energy Agency, Vienna, 1968,STI/POB/176) 1-249.
9) E.T. Chulik, P.L. Reeder, E. Eichler and C.E. Bemis.Jr.-. Bull.Am. Phys. Spc. 14 (1969) 190.

71
10) E.T. Chulik, P.L. Reeder, C.E. Bemis,Jr. and E. Eichler: Nucl.Phys. A168 (1971) 25O-258.
11) N.G. Chrysochoides, J.N. Anoussis, C.A. Mitsonias and D.C.Perricos: J. Nucl. Energy 25. (1971) 551-556.
12) G. Fieg: J. Nucl. Energy 2£ (1972) 585-592.
13) W.R. Sloan and G.L. Woodruff: Trans. An. Nucl. Soc. 15 (1972)942.
14) W.R. Sloan and G.L. Woodruff: Nucl. Sci. Eng. £5. (1974) 28-40.
15) George W. Eccleston arid Gene L. Woodruff: Trans. Am. Nucl. Soc.21 (1976) 492-493.
16) George W. Eccleston and Gene L. Woodruff: Nucl. Sci. Eng. 62.(1977) 636-651.
17) S. Shalev and J.M. Cuttler: Nucl. Sci. Eng. 5J. (1973) 52-66.
18) A.E. Evans and L.V. East: Trans. Am. Nucl. Soc. H (1974) 396-397.
19) A.E. Evans, M.S. Krick: Trans. Am. Nucl. Soc. 21 (1976) 491-492.
20) Albert E. Evans and M.S. Krick: Nucl. Sci. Eng. £2 (1977) 652-659.
21) S. Shalev and J. Cuttler: Trans. Am. Nucl. Soc. li (1971) 373.
22) J.M. Cuttler and S. Shalev: Report TNSD-P/278, Technion-IsraelInstitute of Technology (1971).
23) Nuclear Data for Basic and Applied Science, Volume 1,Proceedings of the International Conference, Santa Fe, NewMexico, 13-17 May 1985 (Gordon and Breach Science Publishers,New York, 1986) 3-992.
24) Gus Couchell, Robert Tanczyn, Livius Fisteag, Nahmoud Haghighi,David Pullen, Walter Schier and Quazi Shafuddin: RadiationEffects Vol.94/1-4 (1986) 33-38.
25) R.S. Tanczyn, Q. Sharfuddin, W.A. Schier, D.J. Pullen, M.H.Haghighi, L. Fisteag and G.P. Couchell: Nucl. Sci. Eng. 9_4(1986) 353-364.
26) C.A. Ciarcia, W.A. Schier, G.P. Couchell, D.J. Pullen, R.S.Tanczyn, M.H. Haghighi and Q. Sharfuddin: Computer PhysicsCommunications li (1986) 233-243.
27) R. Kinsey (Compiler): ENDF/B Summary Documentation- (Report BNL-17541, Brookhaven National Laboratory, New York, 1979).

72
28) G. Rudstam: Nucl. Sci. Eng. go (1982) 238-255.
29) Q. Sharfuddin, W.A. Schier, R.S. Tanczyn, D.J. Pullen, M.H.Haghighi, L. Fisteag and G.P. Couchell: Nucl. Sci. Eng. 9_8.( No.4(1988) 341-347.
30) DeLayed Neutron Properties Proceedings of the Specialists'Meeting,University of Birmingham, September 15th-19th, 1986(University of Birmingham Report, England, 1987) 1-331.
31) B.C. Cook: Nucl. Instrum. Methods 24 (1963) 256-268.
32) P. del MARMOL: Nuclear Data Tables A6 (1969) 141-151.
33) L. Tomlinson: Report AERE-R6993, United Kingdom Atomic EnergyAuthority, Harwell (1972).
34) H. Franz, J.-V. Kratz and G. Herman: Annual Meeting, RoyalInstitute of Chemistry, Manchester, England, 1972.
35) S. Shalev and G. Rudstam: Phys. Rev. Lett. 2JJ. (1972) 687-690.
36) S. Shalev and G. Rudstam: Nucl. Phys. A23O (1974) 153-172.
37) G. Rudstam and S. Shalev: Nucl. Phys. A235 (1974) 397-409.
38) H. Franz, J.-V. Kratz, K.-L. Kratz, W. Rudolph, G. Herrmann,F.M. Nuh, S.G. Prussin and A.A. Shihab-Eldin: Phys. Rev. Lett.31 (1974) 859-862.
39) Pxadosh K. Ray and Edward S. Kenney: Nucl. Instrum. Methods 134(1976) 559-564.
40) S. Shalev and G. Rudstam: Nucl. Phys. A275 (1977) 76-92.
41) G. Rudstam: J. Radioanal. Chem. 3_£ (1977) 591-618.
42) Proceedings of the Consultants' Meeting on Delayed NeutronProperties, Vienna, 26-30 March 1979 (International AtomicEnergy Agency, Vienna, August 1979, INDC(NDS)-107/G+Special) 1-293.
43) P.L. Reeder, L.J. Alquist, R.L. Kiefer, F.H. Ruddy and R.A.Warner: Nucl. Sci. Eng. 75. (1980) 140-150.
44) T.-R. Yeh, D.D. Clark, G. Scharff-Goldhaber, R.E. Chrien, L.-J.Yuan, M. Shmid, R.L. Gill, A.E. Evans, H. Dautet and J. Lee:Nuclear Data for Science and Technology, Proceedings of theInternational Conference, Antwerp, 6-10 September 1982 (ReidelPublishing Company, Dordrecht, Holland, 1983) 261-264.
45) K.-L. Kratz, H. Ohm, A. Schroder, H. Gabelmann, W. Ziegert, B.Pfeiffer, G. Jung, E. Monnand, J,A. Pinston, F. Schussler, G.I.Crawford, S.G. Prussin and Z.M. de Oliveira: Zeitschrift furPhysik A312 (1983) 43-57.

73
46) D.D. Clark, R.D. McElroy, T.R. Yeh, R.E. Chrien and R.L. Gill:Proceedings of International Conference on NucLear Physics,Vol.1, Florence, Italy, August 29-September 3, 1983 (TipographiaComposition, Bologna, 1983) 452.
47) R.C. Greenwood and A.J. Caffrey. Trans. Am. Nucl. Soc. 45 (1983)705-707.
48) R.C. Greenwood and A.J. Caffrey: Nucl. Sex. Eng. 9J. (1985) 305-323.
49) P.L. Reeder and R.A. Warner: Nucl. Instrum. Methods ISO (1981)173-183.
50) P.L. Reeder and R.A. Warner: Nucl. Sci. Eng. 21 (1981) 56-64.
51) K.-L. Kratz, W. Rudolph, H. Ohm, H. Franz, C. Ristori, M.Zendel, G. Herrmann, F. M. Nun, D.R. Slaughter, A.A. Shihab-Eldin and S.G. Prussin: 3rd International Conference on NucleiFar From Stability Proceedings, institut d'Etudes Scientifiques,Cargese, Corsica, France, 19-26 Hay 1976 (Report CERN 76-13,European Organization for Nuclear Research, Geneva, July 1976).
52) F.M. Nuh, D.R. Slaughter, S.G. Prussin, H. Ohm, W. Rudolph, K.-L. Kratz: Nucl. Phys. A293 (1977) 410-424.
53) K.-L. Kratz, W. Rudolph, H. Ohm, H. Franz, G. Herrmann, C.Ristori, J. Crancon, M. Asghar, G.I. Crawford, F. M. Nuh andS.G. Prussin: Phys. Lett. £5_B_ (1976) 231-234.
54) R.E. Chrien (Ed.): Proceedings of the Isotope Separator On-lineWorkshop, Brookhaven National Laboratory, October 31-November 1,1977 (Report BNL-50347, Brookhaven National Laboratory, Upton,New York, July 1978)368p.
55) E.F. Bennett and T.J. Yule: Report ANL-7763, Argonne NationalLaboratory, Illinois (August 1971)67p.
56) K.H. Beckurts, K. WirtZ: Neutron Physics (Springer-Verlag,Berlin, 1964) 41-44.
57) G.I. Crawford, J.D. Kellie, S.J. Hall, K.D. Wunsch, E. Koglin,M. Asghar: Annex to the Annual Report, Institut Max VonLaue.Paul Langevin, Grenoble Cedax, France (1977) 57.
58) G. Grosshoeg: Nucl. Instrum. Methods 162. (1979) 125.
59) T.R. England, W.B. Wilson, R.E. Schenter and F.M. Mann: Nucl.Sci. Eng. 8_5_ (1983) 139-155.
60) H. Franz, W. Rudolph, H. Ohm, K.-L. Kratz, G. Herrmann, F.M.Nuh, D.R. Slaughter and S.G. Prussin: Nucl. Instrum. Methods 144(1977) 253-261.

74
61) J.G. Owen, D.R. Weaver and J. Walker: Nucl. Instrum. Methods(1981) 579-593.
62) Gosta Rudstaa: Nucl. Instrum. Methods 177 (1980) 529-536.
63) S. Greenberger, J.M. Cuttler, S. Shalev: Trans. Am. Nucl. Soc.12 (1969) 64-65.
64) Klaes-Hakan Beimer, Goran Nyman and Olof Tengblad: Nucl.Instrum. Methods in Physics Research A245 (1986) 402-414.
65) D.W. Marquardt: J. Soc. Industrial Appl. Math. H (1963) 431.
66) S. Shalev and J.M. Cuttler: Nucl. Sci. Eng. 5J. (1973) 52-66.
67) G. Rudstam: Report LF-57, The Swedish Council's Laboratory,Studsvik, Sweden (1974).
68) J.M. Cuttler, S. Shalev, Y. Dagan: Trans. Am. Nucl. Soc. 12(1969) 63.
69) Nuclear Data for Basic and Applied Science, Volume 2,Proceedings of the International Conference, Santa Fe, NewMexico, 13-17 May 1985 (Gordon and Breach Science Publishers,New York, 1986) 995-1744.
70) A.E. Evans, P.J. Bendt: Trans. Am. Nucl. Soc. 4J7 (1984) 388-389.
71) W.C. Sailor and S.G. Prussin: Nucl. Instrum. Methods 121 (1980)511-515.
72) W.R. Burrus: Report ORNL-3743, Oak Ridge National Laboratory,Oak Ridge, Tennessee, USA (June 1965) 117p.
73) S. Greenberger and S. Shalev: Technion Haifa Report TNSD-R/407(1969).
74) John Walker, David Robert Weaver, John Gary Owen and StuartJonathan Chilton: Radiation Effects 9_i (1986) 101-104.
75} Vassil Gadjokov and Jordanka Jordanova: Radiation Effects 9_6(1986) 69-72.
76) V. Gadjokov and J. Jordanova: Comp. Phys. Commun. 31 (19b ) 53-73.
77) H.W. Broek and C.E. Anderson: Rev. Sci. Instru. 21 (1960) 1063-1069.

75
id. THEORETICAL ASPECTS
The first evaluation of delayed neutron emission spectra was aadeby Saphier et al [1] using the delayed neutron spectra from twentyfission product isotopes measured at Studsvik laboratory £2-4]. Theresults were presented in a 54 energy-group structure forapplications in nuclear technology and covered thermal neutronfission (0-233, 0-235, Pu-239 and Pu-241), fast-neutron fission (Th-232, 0-235, 0-238, Pu-239) and high-energy (14.7 MeV) fission (0-235, 0-238). The 54 multi-group energy structure was chosen becauseit was thought to be convenient and easily adaptable to otherexisting energy group structures like the ABM 26 group. However onlythe first 30 energy groups were presented, since there were nomeasured spectra below 50 keV. The upper limits (in keV) of thetwenty-four lower energy groups were: 50, 45, 40, 35, 31, 28, 25,22, 20, 18, 16, 14, 12, 11, 1O, 9, 8, 7, 6, 5, 4, 3, 2, and 1.
In calculating the spectra, they followed a least-squares fitmethod with the requirement that
*i Pi exp(-A.t) » £ A PM Y exp(-A t)x x x n n n n n
where the summation extends over all the isotopes in the ithprecursor group. It was assumed in the evaluation that a fissionproduct precursor 'n' contributed to two adjacent mathematicalgroups (i,i+1) with the condition that
It was also required that the least-squares error
| <An exp(-Ant) - C qn A A£ exp(-Ait)
be a minimum. Here, q . and q i + 1 are the contributions ofthe nth fission product to the ith and the (i-M)'th delayed neutrongroup, and q . + q { i + 1 l * 1. By the least-squares fit process,the best values of 'q for each fission product precursor for eachfissile isotope were obtained and the delayed neutron spectrum for aparticular delayed neutron group was calculated from the delayedneutron spectra of the fission product isotopes using the equation
) E qn L Yn p n X

76hi
where, B. =̂ E.»<I . Y P is the delayed neutron contribution to theith delayed group! Innthe evaluation, P values were either thosegiven by Tomlinson [5] or were obtained by a least squares fit.Another parameter that was required in the fitting process was Y ,the fission product yield of the precursors. As stated by tneauthors, "large liberties were taken when Y values had to beadjusted." Average equilibrium spectra for each fissile isotope w««calculated by weighing each delayed neutron group spectra withappropriate p^.
Figure 34 shows the measured near-equilibrium spectra superimposedon Saphier's evaluated equilibrium spectra. Although the two curveswere normalized differently, there is reasonable agreement betweenthe two above 150 keV. Below this energy, large discrepancies areseen.
The authors, while observing the large differences between thedelayed neutron energy spectra from U-235 fast fission as measuredby Eccleston and Woodruff [§7,ref.15} and the delayed neutronspectra froa U235 thermal fission as given by Sloan and Woodruff[$7,ref.14], noted the absence of the large peaks at 33 keV and 60keV in the measurement of Eccleston and Woodruff but reported bySloan and Woodruff. They attributed this phenomenon ta the possibledifferences in the relative fission product yields of some of theshort-lived precursors and suggested that more precise data onfission product yields were required since the error in the fissionproduct yield was as much as 64 per cent.
Figure 35 shows a comparison of the results of Saphier'sevaluation with some older spectral data. A good agreement above 400keV is seen; but below this energy, the evaluated spectrum gives asignificant amount of structure and relatively more delayed neutronsbelow 200 keV.
The isotopic spectra required in the evaluation of the delayedneutron spectra by Saphier et al were measured by Shalev and Rudstambut for the short-lived isotopes which contribute to groups 5 and 6,mainly to group 6. The contributors to group 6 were 5e89, Rb95,Rb96, Rb97 of which only the spectrum of Rb95 was then available.Rb95 was also a contributor to group 5. Therefore, in the sixthgroup, only about 30 per cent of the spectral emission was known andit belonged to Rb95. All the neutrons emitted in the precursor group1 were assumed to be from Br87. In groups 1 and 2, hundred per centof the spectra were known; in group 3 about 98 per cent, in group 4about 94 per cent, and 85 per cent in group 5. Thus the datapresented could be Considered a complete set except for group 6.
Figure 36 shows a sample six-group spectra of delayed neutrons.The large amount of structure seen does neither represent theexperimental resolution nor the great precision and detail of thedata. They were of numerical origin, mainly the result of thespectral lines having been prepared directly by a computer programin which the input spectra were first segmented into sixteen hundredintervals of 1 keV width and then recombined appropriately.

- 7 7 -
0.32
0.00
n> /Eccleston and Woodruff { experimental )
Saphier ( evaluated )
0-6 0.8 1.0 1.2 1.4 1.6ENERGY, MeV
Fig.34: Equilibrium delayed- neutron spectrumfrom fast-neutron fission of 2 3 9 Pu.
- Saphier's Evaluation
- Batchelor-McK.Hyder
and Bonner et al
Feig
1.2 1.60.8ENERGY {MeV)
Fig.35 '.Comparison of Saphier's evaluated delayed-neutron equilibrium
spectra ( U Thermal ) with a few older measurements.

- 7 8 -
0.56
0.40 -
0.000-4 0.8 1.2 1.6 0.4 0.8 1.2 1.6
0.4 0.8 1-2 1.6 0.8 1.2 1.6
0.00
0.48
0-32
0.16
0.00
i i
GROUP 6
0-4 0.8 1.2 1.6 0 0.4 0.8 1.2 1.6
ENERGY (MeV)Flg.36: Calculated six (precursor ) groupdeloyed-neutron energy
spectra from high energy ( H.7 MeV ) neutron fission of 2 3 8 U.

79
A summation calculation similar to Saphier's was carried out byRudsfcan [6] to provide updated group parameters (abundances andhalf-lives), group spectra and composite spectra for a variety offissionable nuclides, namely, Th-232, U-233, U-235, U-236, U-238,Np-237, Pu-239, Pu-240, Pu-241, Pu-242 and Cf-252. In hisevaluation, he used the spectral data, X_(E) from thirty-oneprecursors [3,4,7-18] to construct the group energy spectra, x;(E)dEwhich were assumed to be unchanged in shape during the coolingperiod. The experimental range was extended towards the extremes bya semi-empirical approach. The precursors were classified into sixgroups with half-life limits from group 1 to group 6 setrespectively at: 55.6 s, 30 to 10 s, 10 to 4 s, 4 to 1.4 s, 1.4 to0.4 s and less than 0.4 s. This grouping of precursors was somewhatarbitrary since there were precursors with half-lives which could beplaced in either of two adjacent groups. The group spectra of agiven fuel component k were evaluated from the relation:
A.. Xu-(E) dE = E a. x (E) dETci ki in n
and then the resulting delayed neutron spectrum at any cooling timewas calculated from the expression:
Xj(E,t) = Z t f. A. . expl-h. . ) Xv- <E) dE
where, the fuel was supposed to consist of M fissile components withappropriate abundance factors f. determined from the fuelcomposition. The group abundances (A..) and the decay constantsp JH
(\. .) were calculated from the corresponding precursor data usingthg*relations
na. A. ) / ( I a. )xn xn ^ in
Due to the statistical cancellations of errors, error in themeasured precursor spectra contributed very little to the error inthe calculated delayed neutron group spectra except at the low andthe high energy ends of the spectra. The main source of errors camefrom the incomplete nature of the precursor spectral data. Therewere a number of known precursors for which measured spectra werenot available then and these coresponded, typically for 0-235, to 0,0.5, 2, 13, 54 and 17 per cent of the effect for groups 1 to 6respectively. To account for this in the calculation, Rudstam gavethe missing precursors the same spectrum as the partial groupspectrum of the v' known precursors of the group. This was given bythe expression:

80
*'ki<E> d E = <rtE=*in *n
(E> d E ) ' <A'ki>
In the exxoz analysis, the errors of the unknown spectra wereassumed to be proportional to the spectral value with aproportionality constant,f. This assumption was also aade forprecursors with published spectra without error analysis and forparts of spectra obtained by the extrapolation procedure. Though thecontribution of the missing precursors of importance to delayedneutrons were neglected, it was pointed out that for higher massfissile materials, they can not be excluded.
Spectra calculated by Rudstaa showed good agreement with integralmeasurements in the energy range of 100 to 1200 keV with apronounced fine structure in group 1 and group 2 spectra. This finestructure, which was absent in the integral curves, was because theindividual precursor spectra were measured with higher resolution.Spectra of the same group but from different nuclei were found to bevery similar. For example, the differences between the group spectraof 0-235 and Pu-239 were found to be minute and rarely outside theuncertainties attributed to the spectral points. Comparison of thespectra for groups 2, 3 and 4 from thermal-neutron inducsd fissionof U-235 with those of Batchelor and Hyder, and of Feig showed thatthe agreement between the different determinations was very good.For group 3, the agreement was excellent, especially, with thespectrum of Batchelor and Hyder. For group 4, the agreement wasgood. Figures 37 and 38 show the normalized spectra for groups 2 and3 respectively. The errors of the evaluated spectra are indicated atregular intervals. They were built up from both the statistical andthe systematic errors.
The agreement of calculated total abundances with the recommendedvalues was acceptable except for fast fissions of 0-238 and Pu-242where the calculated values were too low. Comparison of averageneutron energies of the delayed spectra with their directdeterminations showed that the agreement was satisfactory. Thelargest deviations occurred in group 2 because of the rapidlychanging fission yield ratio between the two dominating members, Dr-80 and 1-137.
The authors have suggested that in applications, their groupparameters and group spectra for U-235 be used while calculatingneutron spectra. Only for group 2: the data for Pu-239 are to beused.
Reeder and Warner [19] used a procedure similar to Saphier et aland Rudstam to calculate the delayed neutron group and equilibriumspectra by summing the spectra of individual precursors by weightingthem with the appropriate cumulative fission yields and P values .But unlike Saphier et al and for simplicity, they did not divide thespectrum of a particular precursor into adjacent half-life groups,since the equilibrium spectra should be independent of whether sucha division was performed or not. The calculated equilibrium spectrawere compared to an approximate spectrum based on a Maxwelliandistribution with just one parameter, the average energy. The

S5
532
-3053LJ o
tn 2
510
1 I,RUDSTAM(EVALUATED)
BATCH E LORAND HYDER
FEI6
J_0 200 600 1000 WOO
NEUTRON ENERGY (keV)
Fig.37 '• Delayed neutron energy spectrumfor Group 2, normalized to unity, of235 u. The uncertainty (± 1<r) isindicated at 50 keV intervals.
2-3
10
10
RUDSTAM(EVALUATED)
BATCHELOR
and HYDER'
1 1 1
IOO
I
0 200 600 1000 WOONEUTRON ENERGY(keV)
Fig.38 : Delayed neutron energyspectrum for Group 3,normalizedto unity, of 235 u.

82
formula used for the comparison was the one frequently used todescribe prompt neutron spectra [20], namely.
N(E) *t E 0 5 exp(-E/T)
where,
N(E) = number of neutrons per unit energy intervalE = neutron energyT = "temperature" parameter
The average energy,! is related to the "temperature" parameter by:
E = (3/2)T
In the comparison, two sets of experimental spectra for individualprecursors measured at two different laboratories were used. Thefirst set was from the Mainz laboratory [10] and included eighteenspectra. These spectra had the best resolution and accuracy andaccounted for forty-five per cent of the total delayed neutron yieldfor U-235 (T) fission. When summed, this set gave an equilibriumspectrum that could be reasonably approximated by a Maxwellianspectrum with an average energy of 574 keV (see_figure 39). But, theequilibrium average energy calculated from E values listed inReeder's paper [19] was 440 keV based on eighty-eight per cent ofthe total yield. This indicated that the spectra excluded from thecalculation must, on the whole, have lower energies and, therefore,the true equilibrium spectrum would be better approximated by aMaxwellian curve with E~ = 440 keV. The peak structure seen in figure39 is largely due to the 1-137, which contributes nearly twenty-eight per cent of the calculated spectrum. This would correspond toabout twelve per cent of the true equilibrium spectrum. Hence, thepeaks would still be less prominent. The second set was from theStudsvik laboratory [7] and contained twenty-four spectra accountingfor seventy-nine per cent of the total delayed neutron yield. Thecalculated equilibrium spectrum from these Studsvik data could notbe fitted by a Maxwellian since the semi-empirical extrapolationresulted in a large peak at low energies. However, measuredequilibrium spectra having a large number of neutrons at energiesbelow 100 keV such as in figure 40 could not be fitted by a simpleMaxwellian-shaped spectrum. Reeder and .Warner also calculated anapproximate delayed neutron spectrum for each precursor. Theyobtained a reasonable overall agreement with the 1-137 spectrum fromMainz laboratory but with little peak structure (figure 41). Infigure 42 is the comparison made with the Rb-94 spectrum fromStudsvik laboratory. The semi-empirical extrapolation produced alarge peak at the lowest energies characteristic of the studsvikspectra and totally out of phase with the Maxwellian curve. But,thefe was a reasonable agreement between the measured Rb-94 spectrumfrom Mainz and the Maxwellian spectrum calculated using the
ssponding E value. It was found that except for Rb-95, the:ra from Mainz tended toward
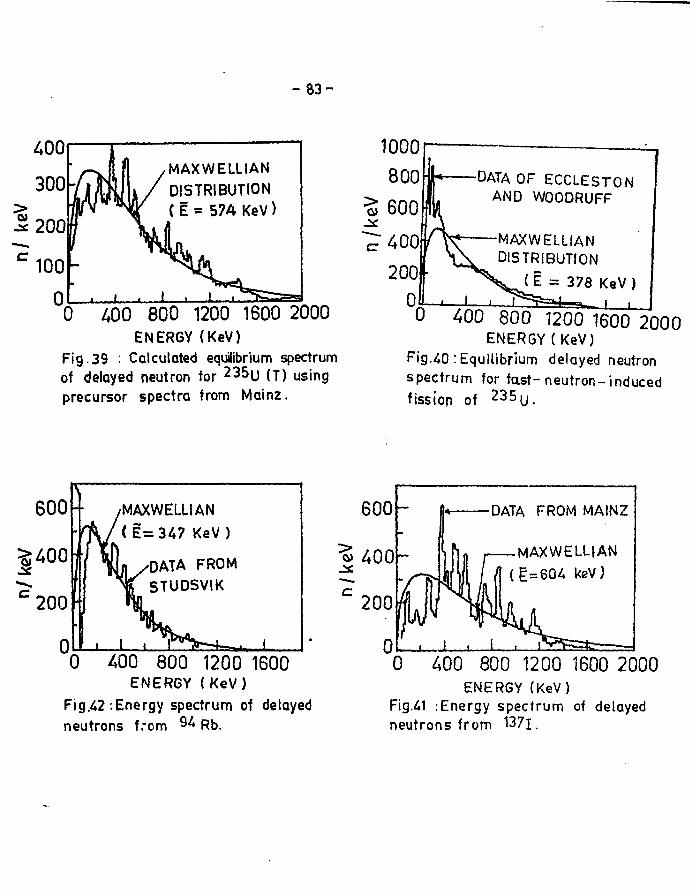
- 8 3 -
MAXWEIUAN
DISTRIBUTION( E a 574 KeV)
1000
'0 400 800 1200 1600 2000ENERGY (KeV)
Fig.39 : Calculated equilibrium spectrumof delayed neutron tor 2 3 5 U (T) usingprecursor spectra from Mainz.
0
DATA OF ECCLESTONAND WOODRUFF
MAXWELLIANDISTRIBUTION
(E = 378 KeV)h
0 400 800 1200 1600 2000ENERGY(KeV)
Fig.40 : Equilibrium delayed neutronspectrum for fast-neutron-inducedfission of 2 3 5 U .
400 800 1200 1600ENERGY (KeV)
Fig.42 .Energy spectrum of delayedneutrons from 94 Rfc>.
DATA FROM MAINZ
MAXWELLIAN
keV)
400 800 1200 1600 2000ENERGY (KeV)
Fig.41 .Energy spectrum of delayedneutrons from 137l.

84
low intensity at low energies ( < 50 keV). The authors alsocalculated the average energies of the six-group and the equilibriumspectra by weighting E values by the individual precursor fissionyield and P values and summing over the appropriate precursors. Forthis, they used the experimentally measured average energies of 34delayed neutron precursors. They found a reasonable agreementbetween the calculated values and the limited experimental dataavailable at that time.
England et al [21,22] have reported an evaluated library for 271delayed neutron precursors and have calculated six-group parametersand spectra for 43 fissioning systems (Th-227 to Fm-255) thatproduce results consistent with the explicit precursor results.Although some disagreement with ENDF/B-V was observed, the majorimprovement was in the delayed neutron group spectra, in producingdata for unmeasured systems and in expanding the incompletelymeasured spectra. ENDF/B-V contains six-group spectra for sevenfissioning nuclides in a 28 energy-group structure that extends onlyto about 1.2 MeV, where as the present group spectra cover twenty-eight fissioning nuclides in a fine 10 keV energy bin structure andextend to 3.0 MeV, the maximum range of the experimental data forany precursor. For some applications, the energy range was extendedto more than 8.5 MeV but without the temporal groups. The normalizedspectra, and the group constants (to a lesser degree) were found tobe nearly independent of the incident neutron energy. Resultsrelated to beta-effective were meant to check the self-consistencyof the precursor and the group data. Delayed neutron spectracalculated for various delay intervals compared well with somerecent measurements.
England et al found that of the available measured spectra forthirty-four precursors [23], thirty were inadequate in the measuredenergy range. These, they supplemented with two nuclear models: theBETA code [24] to extend the thirty measured spectra, and a modifiedevaporation model [25,26] for the remaining 237 precursors.Evaporation model had the advantage that it could produce the shapeof typical spectra without knowing - unlike the BETA code - theenergy levels, the spins, and the parities of precursors and theirdaughters, since these data are unknown for most short-livednuclides. Figure 43 shows a comparison of the measured data with the•odel results. For the simple evaporation model, this comparison istypical, but is one of the better comparisons with predictions fromthe BETA code. It is clear from the figure that neither of the modelpredicts the detailed variation of the spectra, and the evaporationmodel does not predict the low-energy values observed in a fewmeasured spectra.
The thirty-four precursors, having measured spectra, account forsixty-seven per cent or more of the total emission rate. Thesecontributions, at reactor shut-down, depend on the fissioningnuclide. For U-235 thermal fission, the contributions are eighty-four per cent. In the calculations, England et al classified therelative importance of the individual precursors into three ranges:those contributing 10 per cent or more, those between 1 and 10 percent, and those between 0.1 and 1 per cent. For some fuels, a singleprecursor nuclide contributes an excess of 10 per cent to the total

- 85 -
So.020
0.015 -
io 0.010
oo 0.005
0.000
EXPERIMENTAL ( MAINZ, 1983)
BETA CODE MODEL
EVAPORATION MODEL
1.5 2E(MeV)
2.5 3.5
Fig.43:Comparison of measured delayed-neutron energyspectra with Brady and England's model generated resultsfor the nuelide 9^s Rb.

86
delayed neutron yield and in some cases, it can be as much as 20 to30 per cent. Of the 271 precursors, nine have no measured data. Theyare: Ga-84, Ge-84, As-88, Se-90, Kr-96, Kr-98, Nb-105, Rb-91, Sb-137. Three of these (As-88, Rb-91, Nb-105) can be responsible for asmuch as 1 to 10% of the total delayed neutron yield in some fuels.Hence, the authors recommended the experimental determination of theP values for these precursors which would reduce the uncertainty inaggregate calculations.
Unlike in the earlier analysis of the individual precursor data,which defined half-life bounds using the U-235 six-group evaluation,the method used by England et al to determine the group half-livesand abundances was independent of any fixed half-life bounds. Equityrequired that the energy spectra for each group should be determinedin a consistent manner. For calculating the group parameters, theactivities of all precursor nuclides following a pulse irradiationin each of the fissioning systems was first calculated for 39cooling times upto 300 sec. These nuclide activities were thenfolded in with the evaluated emission probabilities to compute theaggregate delayed neutron emission values. By approximating thedelayed neutron emission as a sum of N exponentials (N - number oftime groups)
Nnd(t) - E A± exp(-Xit)
and using a non-linear least-squares fitting routine, the parametersA. and X. were determined. Here, the constant X. represents aneffective decay constant for the ith delayed group of precursors andthe coefficient A. represents the initial emission of delayedneutrons. A. was found to be the product of the group decay constant(X.) and the group yield per fission (a.v.)i where a. is thenormalized group abundances. Calculations for neutron-induced fastfission of U-235, U-238 and Pu-239 were performed using three, six,nine, and twelve delayed groups. Increasing the number of groupsfrom six to nine resulted in a significant improvement in the fit.However, point kinetics calculations using both the six-and thenine-group fits for step changes in reactivity did not reveal anycomparable significant differences. The calculated delayed neutronactivities using the new six-group parameters derived from precursorcalculations for U-235 (F) showed good agreement with theexperimental data [27]. The above six-group fits were performed forall the forty-three fissioning systems, and the normalized groupabundances and decay constants were determined. The equilibriumgroup spectra were found as
x (E) = E f Y P x (E)*di ^ n,i n n *dn
with the assumption that a delayed neutron precursor contributed toeither or both of the adjacent temporal groups as determined by thedecay constants in the inequality

87
n
In the equation above,spectrum of precursor n, Y.the precursor n and fproduced by precursor nwith the requirement that
d (ni(E) is the normalized delayed neutronis the cumulative yield from fission of
denotes the fraction of delayed neutronsthat contribute to the temporal group i
n,i
This condition ensured that the aggregate (total) spectrumcalculated by summing the six-group spectra would be the same asthat calculated by summing the contributions from the individualprecursors. The fractions f . were determined by requiring theleast-squares error n
<An exp(-A t)n n [f . A. exp(-X.t)n f x a. X
d t
to be a minimal [1,28]. Using this approach, England et al computedthe normalized (to unity) six-group spectra for U-235 fast andthermal fission over a 1 MeV energy range and compared them with thesix-group spectra of ENDF/B-V for U-235. Figure 44 shows a typicalresult for group 1. It is seen from the figure that the spectracalculated from the evaluated precursor data provide a much moredetailed structure than the earlier SNDF/B-V spectra [29]. In theenergy region from 1 to 79 keV, where the ENDF/B spectra have beensimply extrapolated to zero, the current spectra reveal several lowenergy peaks of varying intensity. Since in this evaluation, group 1has three contributing nuclides, namely: Br-87, 1-137,, Cs-141, thisresult allows the group 1 spectrum to vary for different fissioningsystems depending upon the relative yields of these nuclides assuggested by ENDF/B-V data. In a U-235 fuelled system, the precursorBr-87 contributes aJ.l (100 per cant) of its delayed neutrons and theother two precursors contribute about 20% each.
The practice in ENDF/B-V of approximating the missing groups 5 and6 spectra by group 4 data is apparent from figures 44 and 45; InENDF/B-V, only the spectra for U-235, U-238 and Pu-239 areevaluated, and these are used to represent all the other fissioningnuclides. The small differences seen between the calculated U-235thermal and fast spectra suggest that there is little dependence onthe incident neutron energy. The ENDF/B-V spectra are alsoindependent of the incident neutron energy. The authors haveincluded the uncertainties in the individual precursor spectra inENDF/B-VI but not the uncertainties in the group spectra.

FAST FISSION
THERMAL
ENDF/B-V EVALUATION
YIEL
DIR
ON
'N
EU
20
15
10
0.5E ( MeV)
Fig.44:Comparison of normalized (to un'ity ) delayed-
neutron group 1 ^ group 4 spectra for 2 3 5 U fast and
thermal fission.

DCLUQ_
zoenen
25
20
15
10
0
- 8 9 -
— FAST FISSIONTHERMAL FISSION
ENDF/B-V EVALUATION
COMPUTED
I I I [ I
0 0.5
0.2 07 0-9 10.5E (MeV)
Fig 45:Group 5 and Group 6 normalized(to unity) delayed-
neutron spectra for

90
In order to ensure that the group spectra produced *•-;.,-;j-bwere consistent with those obtained using the aggre^ale .spectraderived from the individual precursor data, the authors ca i i c?d outRossi-alpha, a D C ( = beta-effective/neutron general: Lor. time)calculations on the Godiva reactor using the PERT-V code [JOJ whichhad provision to input either a single delayed neutron spectrum orindividual group spectra. They found that the ratio of the six-groupspectra result to the measured value [31] of aD(, was 1.0020, andthat using the aggregate spectrum the ratio was i.007 6. Theexcellent agreement between the two results provided support for themethods used to derive the six-group spectra.
A further check on the consistency of the group spectra with theaggregate spectrum calculated from the evaluated precursor data wasdone by comparing the measured time-delay interval spectral data ofthe University of Lowell [32] with the calculated ones. Calculationsof spectra for the eight delay time intervals were car.ied out usingboth the individual precursor data and the six-group data. Theresults from the two calculations as well as the measured spectrawere found to be in very good agreement for all the eight delayintervals. There was also excellent agreement betv;een the twocalculations. The most notable differences between the calculatedand the measured spectra were in the delay intervals (1.2 to 1.9 s),(2.1 to 3.9 s), (4.7 to 10.2 s), (12.5 to 29.0 s) and (35.8 to 85.5s) with the last delay interval showing the greatest differences(see figure 46). The measured spectra for the above delay intervalsshowed a dominant low-energy peak, where as the calculationspredicted similar low-energy peaks but with slightly lowerintensities. In figure 46, the measurement depicts a dominant low-energy peak that is not observed with any significant intensity inthe calculations. This discrepancy was attributed to the following:
(i) The dominant delayed precursors contributing to this delay int-erval are those that make up "group 1", namely: Br-67, 1-137and Cs-141 whose delayed neutron spectra were measured usingHe3 spectrometry which had poorer resolution at lower energies.
(ii) The Lowell group have stated that in the 35.8 to 85.5 s inter-val, while normalizing, the TOF spectrum had too severe a gamma-ray background because of which the spectrum of the neighbour-ing time interval was used as an estimate of the spectrum below130 keV. And, it is precisely in the energy region below 130 keVthat the largest differences are observed.
Villani et al [33] have developed a constraint least-squaresmethod for decomposing composite spectra, measured at six or moredelay time intervals following fission, into six-group delayedneutron energy spectra. The constraining condition was chosen toyield not only stable and non-negative solutions, but also toprovide good fits to the measured spectra. The method was applied toobtain six-group spectra from the eight previously measured [32]composite delayed neutron spectra following thermal fission of U-235. The solutions were shown to be unique for a large range ofconstraint spectra and the dependence of the solutions on the choiceof six-group parameters (p.,A.) was also examined. The method,suggested by techniques developed for unfolding pulse-height spectra

- 9 1 -
2UEXPERIMENTAL(UNIVERSITY OF LOWELL).
FITTED SIX GROUPS
271 PRECURSORS
0 200 1000 1500 2000ENERGY (KeV)
Fig.46:Comparison between calculated and measured(Lowell ) time delay interval spectra (delayinterval 35.8 to 85.5 s).
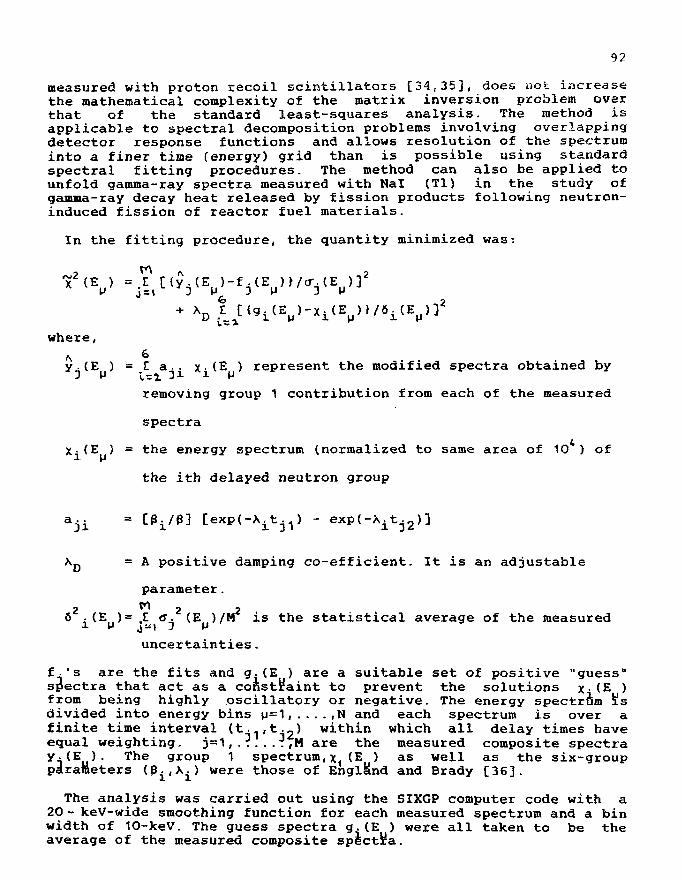
92
measured with proton recoil scintillators [34,35], does not increasethe mathematical complexity of the matrix inversion problem overthat of the standard least-squares analysis. The method isapplicable to spectral decomposition problems involving overlappingdetector response functions and allows resolution of the spectruminto a finer time (energy) grid than is possible using standardspectral fitting procedures. The method can also be applied tounfold gamma-ray spectra measured with Nal (Tl) in the study ofgamma-ray decay heat released by fission products following neutron-induced fission of reactor fuel materials.
In the fitting procedure, the quantity minimized was:
where,
\ 6
y ( E ) = Z a.. x(E ) represent the modified spectra obtained byj M \,-% 31 1 P
removing group 1 contribution from each of the measured
spectra
X-(E ) = the energy spectrum (normalized to same area of 10 ) of
the ith delayed neutron group
XD = A positive damping co-efficient. It is an adjustable
parameter.
2 ^ 2 26 . (E ) = ,E tf. (E )/M is the statistical average of the measured
uncertainties.
f.'s are the fits and g.(E ) are a suitable set of positive "guess"spectra that act as a constraint to prevent the solutions x(E )from being highly oscillatory or negative. The energy spectrum !LSdivided into energy bins u=1,....,N and each spectrum is over afinite time interval (t.^.t.,) within which all delay times haveequal weighting. j=1,.......M are the measured composite spectray.(E ). The group 1 spectrum,x (E ) as well as the six-groupparameters O ^ ^ ) were those of England and Brady [36].
The analysis was carried out using the SIXGP computer code with a20 - keV-wide smoothing function for each measured spectrum and a binwidth of 10-keV. The guess spectra g.(E ) were all taken to be theaverage of the measured composite spectra.

93
Solutions for x(E ) were obtained for values of AQ ranging from 0to 1.0. Figure $7 s*hows the delayed neutron energy spectra for group2 to 6 obtained with \D = 0.03, 0.1 and 0.3. It is seen that each ofthe fine spectrum has the general shape expected of a delayedneutron spectrum and shows little oscillatory structure. Within eachgroup, the solutions are nearly identical in shape and similar instructure. The X = 0.03 solution is the best since it is thesmallest among the damping co-efficients in the admissible rangethat produces physically acceptable solutions,i.e., solutions thatdo not show structure whose width is less than the energy resolutionof the detection system. Comparison of the eight measured delayedneutron spectra [32] with the six-group parameterization using the\D = 0.03 spectra of the above figure plus the assumed group 1spectrum showed that the fit was excellent. Figure 48 shows thecomparison for the two time intervals of 0.17 to 0.37 s and 35.8 to85.5 s.
The uniqueness of the six-group solutions was established bycalculating x(E ) with the constraint spectra, g^(E ) taken tobe the measured delayed neutron spectra for which grBup i had thelargest contribution. The results were nearly identical to thoseshown in figure 47. The uniqueness of the detailed structure wastested by representing the second set of constraint spectra g4(E }with Maxwellian spectra, each having the same average energy aS oHeof these spectra. The solutions x(E ) were virtually identical tothose obtained previously. These^'reKults suggest that the solutionsare unique for a class of constraint spectra having shapes similarto the measured delayed neutron spectra.
By generating synthetic composite spectra using Monte Carlosimulation studies, it was concluded that while the experimentaluncertainties in the measured composite spectra are magnified indeducing the si^-group spectra, they do not lead to unstablesolutions. A more likely cause of the instability was considered tobe coming from the six-group approximation of the time variation ofthe delayed neutron energy spectrum.
In order to test the dependence of the solutions x-(E ) on thesix-group parameters (p.,X.), six-group parameters from1 two othercompilations (ENDF/B-V and Rudstam) were examined. It was found thatin general there was a good agreement among the three sets. However,the ENDF/B-V parameters for group 6 were considerably different fromthose of the other two sets. Rudstam's group parameters [6] gavegroup spectra xi^ E
u^ identical to those obtained with England andBrady's parameters. Use of the ENDF/B-V group parameters producedsolutions mostly similar to those obtained with the other two setsexcept for group 6 whose solution displayed significant differencesespecially above 1.5 MeV neutron energy, where a much higher delayedneutron yield resulted from the ENDF parameters.
As an example of the extent of adequacy of the six-group delayedneutron representation in reactor kinetics calculations, we presentin figure 49 typical reactor rod-drop calibration curves calculated

- 9 4
200
1 2 0NEUTRON ENERGY { MeV )
235.235Fig.47 :Comparison of U group solutions obtained by theconstrained leas t—squares method for Ap= 0.03, 0.1 and 0.3.
200
100
0.17to 0.37s,
MEASURED
FIT(AD=O.O3J
0 1 2 o 1 2NEUTRON ENERGY(MeV)
Fig.48 :Comparison of measured U composite delayed neutronspectra with f i ts deduced from the A Q = 0-03 group solutions.

95
for U-235- thermal fission using the ENDF/B-V neutron precursor data[37]. The results indicate that a reactivity measurement evaluatedat $3.00 with the explicit nuclide data would be evaluated at $3.23with the ENDF/B-V six-group functions.
105 PRECURSCRS- 6 GROUPS
0 1 2 3 U 5REACTIVITY IN DOLLARS
Fig.£9:Comparison ot 105-precursorand ENDF/B-V six-group rodcalibration curves (235u thermalfission).
REFERENCES
1) D. Saphier, D. Ilberg, S. Shalev and S. Yiftah: Nucl. Sci. Eng.62 (1977) 660-694.
2) S. Shalev and G. Rudstam: Phys. Rev. Lett. 28 (1972) 687-690.
3) S. Shalev and G. Rudstam: Nucl. Phys. A23O (1974) 153-172.
4) S. Shalev and G. Rudstam: Nucl. Phys. A235 (1974) 397-409.
5) L. Tomlinson: Report AERE-R6993, United Kingdom Atomic EnergyAuthority, Harwell (1972).
6) G. Rudstam: Nucl. Sci. Eng. 80 (1982) 238-255.
7) G. Rudstam: Proceedings Second Advisory Group Meeting FissionProduct Nuclear Data, Petten, Netherlands, September 5-9, 1977(Report 213, Vol.11, p.567, International Atomic Energy Agency,1978).
8) G. Rudstam: Proceedings ConsuLtants' Meeting DeLayec! KeutronProperties, Vienna, Austria, March 26-30, 1979 (ReportINDC(NDS)-107/G+Special, International Atomic Energy Agency,Vienna, August 1979) 69-101,.
9) P.L. Reeder and R.A. Warner: Report PNL SA-7536 Revised, PacificNorthwest Laboratory (1980).
10) K.L. Kratz: Proceedings Consultants' Meeting Delayed neutronProperties, Vienna, Austria, March 26-30, 1979 (ReportINDC(NDS)-107/G+Special, International Atomic Energy Agency,Vienna, 1979) 103-182.
11) S. Shalev and G. Rudstam: Nucl. Phys. A275 (1977) 76-92.
12) G. Rudstam and E. Lund: Nucl. Sci. Eng. 64 (1977) 749-760.
13) G. Rudstam: Nucl. Instrum. Methods VH (1980) 529-536.
14) G. Rudstam: J. Radioanal. Chem. 36 (1977) 591-618.
15) E. Lund, P. Hoff, K. AJeklett, 0. Glomset and G. Rudstaa:Zeitschrift fur Physik A294 (1980) 233-240.
16) G. Engler, Y. Nir-El, M. Shmid and S. Amiel: Phys. Rev. C19.Number 5 (1979) 1948-1952.
17) K. Sistemich, G. Sadler, T.A. Khan, H. Lawn, W.D. Lauppe, H.A.Selic, F. Schussler, J. Blachot, E. Monnand, J.P. Bocquet and B.Pfeiffer: Zeitschrift fur Physik A281 (1977) 169-181.
18) K. Aleklett, P. Hoff, E. Lund and G. Rudstam: Zeitschrift furPhysik A295 (1980) 233-240.
19) P.L. Reeder and R.A. Warner: Nucl. Sci. Eng. H (1981) 56-64.
20) H. Marten, A. Ruben and D. Seeliger: Nucl. Sci. Eng. 109 (1991)120-127.
21) T.R. England, M.C. Brady, E.D. Arthur, R.J. LaBauve, F.M. Mann:Report LA-UR 86-2693, Los Alamos National Laboratory, NewMexico, USA (1986).
22) M.C. Brady and T.R. England: Nucl. Sci. Eng. 103 (1989) 129-149.
23) R.C. Greenwood and A.J. Caffrey: Nucl. Sci. Eng. 9J. (1985) 305-323.
24) F.M. Mann, C. Dunn and R.E. Schenter: Phys. Rev. C25. (1982) 524-526.
25) T.R. England, E.D. Arthur, M.C. Brady and R.J. LaBauve: ReportLA-11151-MS, Los Alamos National Laboratory, New Mexico, USA(May 1988)81p.

97
26) M.C. Brady: Report LA-11534-T, Los Alamos National Laboratory,New Mexico, USA (April 1989)275p.
27) G.R. Keepin: Physics of Nuclear Kinetics (Addison WesleyPublishing Company, Reading, Massachusetts, 1965).
28) M.C. Brady and T.R. England: Trans. Am. Nucl. Soc. 54. (1987)469-470.
29) S.A. Cox: Report ANL NDM-5, Argonne National Laboratory,Illinois (April 1974)62p. For ENDF/B-V, these data were updatedby R.E. Kaiser and S.G. Carpenter, Argonne National Laboratory-West (Unpublished).
30) D.C. George and R.J. LaBauve: Report LA-112O6-MS, Los AlamosNational Laboratory, New Mexico, USA (February 1988}25p.
31) Cross-Section Evaluation Working Group Benchmark Specifications,Fast Reactor Benchmark No.5: Report BNL-19302, BrookhavenNational Laboratory, Upton, New York (November 1981) (Revised).
32) R.S. Tanczyn, Q. Sharfuddin, W.A. Schier, D.J. Pullen, M.H.Haghighi, L. Fisteag and G.P. Couchell: Nucl. Sci. Eng. 94.(1986) 353-364.
33) M.F. Villani, G.P. Couchell, M.H. Haghighi, D.J. Pullen, W.A.Schier and Q. Sharfuddin: Nucl. Sci. Eng. H I (1992) 422-432.
34) W.R. Burrus: Report ORNL-3743, Oak Ridge National Laboratory,Oak Ridge, Tennessee, USA (1965)117p.
35) S. Wilensky: The Application of Fast Neutron Techniques toNuclear Engineering Problems, PhD Dissertation, MassachusettsInstitute of Technology (1964).
36) T.R. England and M.C. Brady: Proceedings International ReactorPhysics Conference, Jackson Hole, Wyoming (September 1988).
37) Robert T. Perry, William B. Wilson, Talmadge R. England,Michaele C. Brady: Radiation Effects, £4 (1986) 43-48.
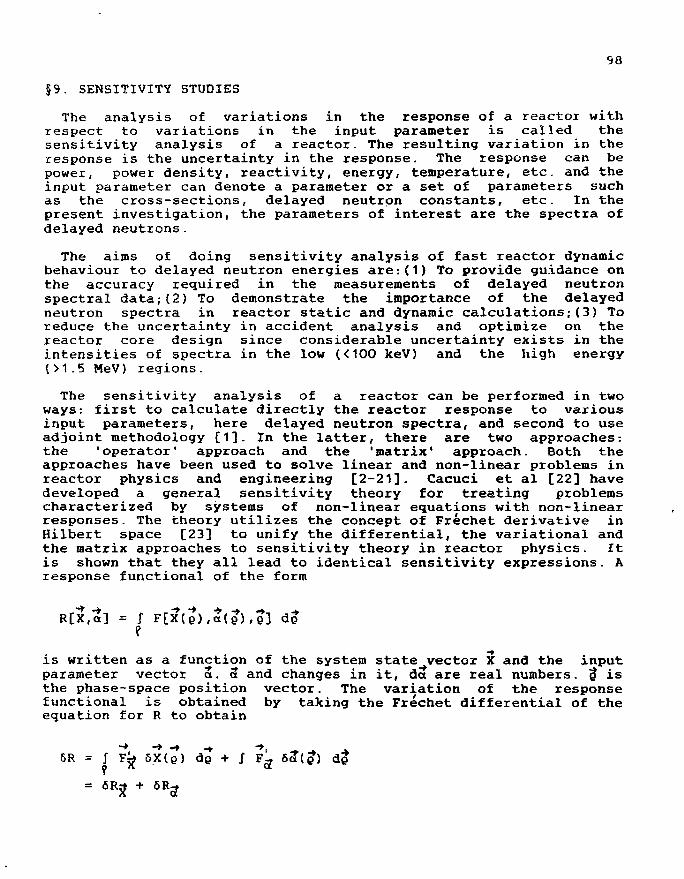
98
§9. SENSITIVITY STUDIES
The analysis of variations in the response of a reactor withrespect to variations in the input parameter is called thesensitivity analysis of a reactor. The resulting variation in theresponse is the uncertainty in the response. The response can bepower, power density, reactivity, energy, temperature, etc. and theinput parameter can denote a parameter or a set of parameters suchas the cross-sections, delayed neutron constants, etc. In thepresent investigation, the parameters of interest are the spectra ofdelayed neutrons.
The aims of doing sensitivity analysis of fast reactor dynamicbehaviour to delayed neutron energies are:(1) To provide guidance onthe accuracy required in the measurements of delayed neutronspectral data;(2) To demonstrate the importance of the delayedneutron spectra in reactor static and dynamic calculations;(3) Toreduce the uncertainty in accident analysis and optimize on thereactor core design since considerable uncertainty exists in theintensities of spectra in the low (<100 keV) and the high energy(>1.5 MeV) regions.
The sensitivity analysis of a reactor can be performed in twoways: first to calculate directly the reactor response to variousinput parameters, here delayed neutron spectra, and second to useadjoint methodology [1]. In the latter, there are two approaches-,the 'operator* approach and the 'matrix' approach. Both theapproaches have been used to solve linear and non-linear problems inreactor physics and engineering [2-21]. Cacuci et al [22] havedeveloped a general sensitivity theory for treating problemscharacterized by systems of non-linear equations with non-linearresponses. The theory utilizes the concept of Frechet derivative inHilbert space [23] to unify the differential, the variational andthe matrix approaches to sensitivity theory in reactor physics. Itis shown that they all lead to identical sensitivity expressions. Aresponse functional of the form
R[X,a] = J F[?(o),2(e),83 do
eis written as a function of the system state^vector X and the inputparameter vector a. a and changes in it, da are real numbers. $ isthe phase-space position vector. The variation of the responsefunctional is obtained by taking the Frechet differential of theequation for R to obtain
- • - • - » . , -•,6R = J Frf 5 X ( Q ) do + J F-
? X a
R?t + 6R-ta
99
where, Fr* = <F* , . . . . ,F' A and FU = (F* 'Fa*? are vectors
5R* is interpreted as the "direct effect" term accounting for U-<JS.changes 8a that produce explicit changes in the response, and 6Rg i:;the "indirect effect" term accounting for indirect changes in R dueto those changes 6a that produce changes 6X. It is shown that
6R = £ (dR/da.)6a. = <dR/da,6a>
= 6R3 + <?,S 6a> + P [+6)<
where, the inner product <»,S> is obtained by taking the Frechetderivative of the equations governing the system, taking theiradjoint and defining the solution vector of these equations to be +The S vector is the Frechet derivative of the governing equationswith respect to a. P[*,8X] is the bilinear concomitant [24]associated with the adjoint operation. It may be empasized that theterm adjoint referred to here is different from the term adjointflux used in reactor physics.In adjoint methodology, the adjointfunction (T) is adjoint to 6X and not to X, the state vector of thesystem. Therefore, 3 can not be interpreted as an importancefunction. It is rather a measure of the importance of the change inthe response due to differential changes in the input data field.Secondly, knowledge of the forward solution X is required to solvethe adjoint system for •. This is not the case with linear forwardsystems where the forward and the adjoint systems can be solvedindependently. More recently, Cacuci [25] has suggested a newdirection for the analysis of non-linear models of nuclear systemsby presenting a unified methodology for global analysis thatsynthesizes and extends the current scopes of sensitivity analysisand optimization. The methodology permits global computation of theessential features (maxima, minima, limit points, bifurcationpoints) of the system, provides sensitivities at any design point ofinterest and accommodates both equality and inequality constraints.The approach is to search for essential global features of thephysical system and responses under consideration instead ofinvesting huge efforts in the calculation of higher ordersensitivities. These global features correspond to the global rootsand singularities of the equation
F(U) I [N*(u),N(u)fS(u),K(u)l = 0.
The potential applicability of this methodology was illustrated bysolving test problems which involved multiple critical points andbifurcations [26,27] and comprising both equality and inequalityconstraints. The results showed that the methodology is reliable andyields accurate results. This unified formula recasts the problem ofdetermining the special features (i.e., critical points) into afixed point problem of the form

100
G(u,X) = 0 ,
whose global zeroes and singular points within the phase-space (u,Mare related to the special features of the original problem. Thefixed point problem G(u,M = 0 is solved by using a global algorithmbased on the so-called confirmation methods [28]. This algorithmalso provides automatically the local sensitivities at any phase-space point (un<\t) °^ interest. These mathematical methods havebeen developed to achieve computational economy in those problems ofsensitivity analysis where determination of the effects of largeparameter variations on physical systems is prohibitively expensive.The adjoint approach to making sensitivity study has the advantagethat it is not necessary to repeatedly solve the governing kineticsequations. This makes it computationally less expansive and is ofparticular importance when large systems of equations are involved.
Both the direct and the adjoint methods have been used to makesensitivity analysis of reactor dynamic behaviour to uncertaintiesin the delayed neutron spectra. The earliest reported sensitivitystudy seems to be that of Yiftah and Saphier [29]. Using the code"FREDY" [30] which solved the equations of a point kinetic model,they showed how various i±'s (delayed neutron effectiveness) affectthe reactor's response. A step of reactivity 6k=0.002 for 0.4 secand a reactivity ramp of 6k=0.01/sec for 0.3 sec were applied to areactor which had the delayed groups of U-235. For each of thisstudy, it was found that the peak power attained varied greatly withthe delayed neutron effectiveness chosen. Generally, the smaller thedelayed neutron effectiveness, the larger was the power excursionattained. In a subsequent sensitivity study of LMFBR transientbehaviour, Saphier et al [31] chose four reactors: the 300 MWe 5NRprototype fast breeder, the 250 MWe PHENIX prototype fast reactor,the 1000 MWe G.E. Commercial fast breeder and a very large slabreactor with data based on the INTERCOMPARISON system No.8 given byOkrent. The improved version of the SHOVAV [32] code was used tosolve the one dimensional time-dependent diffusion equation by thesource projection method [33]. A four energy group and six delayedneutron spectra were used in the calculation which excluded feedbackeffects. The four cores were perturbed exactly by the same amount inI , namely AE =-0.000348. It was found that the total excursionpower after 2 sec was 207% when delayed spectra were equal to promptspectra, and was (238.511.5)% depending upon whether Batchelor, Feigor Shalev spectra were used. In all the four cases, the powerexcursion was lower when a higher value for £ for U-238 was used. InSNR and PHENIX, decrease in total power was about 3%, 2 sec afterthe beginnings of perturbation; for GE the decrease was about 5\,and for the Intercomparison-8 cores, the decrease was about 15V Nosimple correspondence between the differences among the kineticparameters and the reactor transient response was found. It wasconcluded that detailed spatio-temporal calculations should beperformed to evaluate the exact power excursion and that dynamiccalculations performed in the various stages of fast reactor safetyanalysis should be performed with more caution with regard to thedata used and should be performed for clean as well as for high BUcores. Later, Saphier et al [34] performed more detailedcalculations using the multi-group two-dimensional dynamic code, FX2

101
[35,36]. In one series of calculations, a small portion of theClinch River Breeder Reactor (CRBR) core was voided and theresulting transient was simulated for 5 s. The calculations wereperformed in 26 energy groups and six groups of delayed neutronswere used for each of the fissile isotopes. In each run, thefollowing delayed neutron spectra were used: the evaluated spectraof Saphier et al £34], the spectra of Batchelor and McK Hyder fromthermal fission of U-235 [§7,ref.6], the spectra of Feig[§7,ref.12], and the prompt fission spectra replacing delayedneutron spectra. It was found that the differences among beta-effective and among the relative powers 5 s after the beginning ofthe perturbation were negligible. However, by replacing thesedelayed spectra by prompt spectra, beta-effective increased by 12*,and the resulting power was lower by 8\. In the second series ofcalculations, the total core was voided by a ramp function of 0.10 sduration resulting in partial fuel melting. In this prompt criticalpower excursion, significant differnces in the achieved power leveloccurred but the differences in the total beta-effective werenegligible. Thus at t=0.1 s, while for Feig, Saphier, Batchelor andHyder spectra, changes in beta-effective were negligible, thedifference in the power level was within about 1\. Gut, differencein the achieved power relative to prompt spectra was about 4.E+5 percent and in beta-effective about 15 per cant. Similar calculationswere performed by using a single average spectra for all theisotopes, average spectra for each fissile isotope, and detailedgroup sepctra. Negligible differences among the calculations werereported. This marginal sensitivity to differences in the delayedneutron spectra was attributed to the relatively small size and ahard spectrum of the CRBR core. Calculations were also carried outin a very large oxide core with a much softer spectrum and adifferent composition [37]. A narrow region of the core wasperturbed by a large change in the absorption cross section (stepperturbation) resulting in a significant flux shape and spectralchange. The resulting transients, when different spectra were used,showed that the spread among the transients was larger than in theearlier two cases. An interesting result in this case was thetransient in which the delayed-neutron spectra had a low-energycomponent with 46*. of its neutrons emitted below 50 JceV. For thisthe power at 0.4 s was about 2050 MW, where as for the promptspectra it was about 1600 MW, and for the other spectra (Burgy et al[§7,ref.3]f Bonner et al [$7,ref.5], Feig et al [§7,ref.12]), it wasabout 1450 MW. Based on these studies, the authors drew thefollowing conclusions:
(i) Although there are significant differences among the variousdelayed neutron spectra when observed in fine-group structure,the influence of these differences is usually negligible whenbroad energy bands are used in multi-group calculations in thedelayed-critical region. But, if there are large perturbationswhere spectral changes can be appreciable, or if significantamounts of high-threshold fissile materials are present in thecore, the uncertainties in the resulting power level can notbe neglected. Under such circumstances, it is desirable thatdelayed neutron spectra with fine group structure are used indynamics calculations. Under such circumstances, they recomme-nded that their spectra be used.
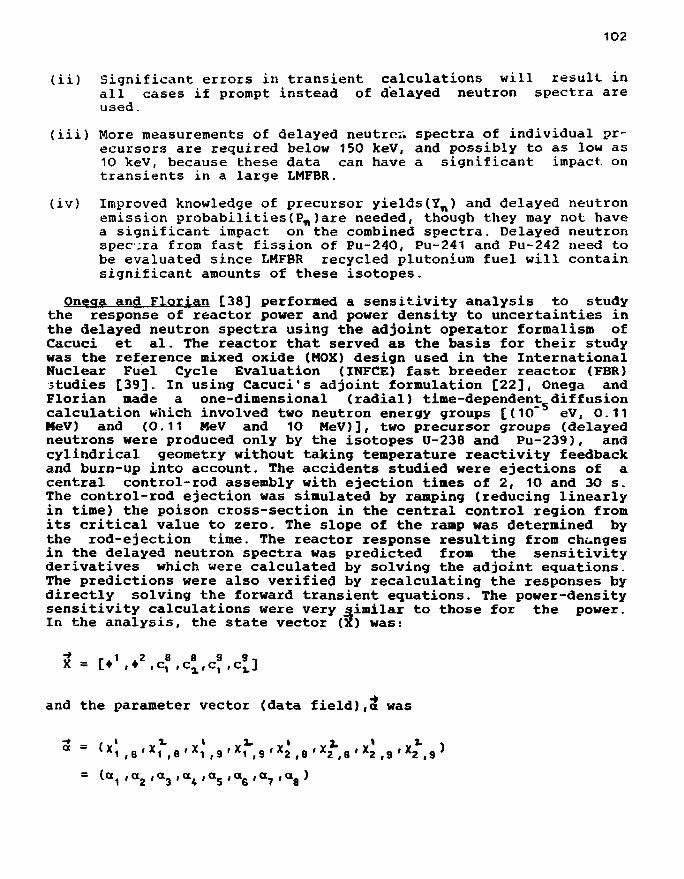
102
(ii) Significant errors in transient calculations will result inall cases if prompt instead of delayed neutron spectra areused.
(iii) More measurements of delayed neutrcr. spectra of individual pr-ecursors are required below 150 keV, and possibly to as low as10 keV, because these data can have a significant impact ontransients in a large LMFBR.
(iv) Improved knowledge of precursor yields(Yw) and delayed neutronemission probabilities(Pw)are needed, though they may not havea significant impact on the combined spectra. Delayed neutronspec;ra from fast fission of Pu-240, Pu-241 and Pu-242 need tobe evaluated since LMFBR recycled plutonium fuel will containsignificant amounts of these isotopes.
Onega and Florian [38] performed a sensitivity analysis to studythe response of reactor power and power density to uncertainties inthe delayed neutron spectra using the adjoint operator formalism ofCacuci et al. The reactor that served as the basis for their studywas the reference mixed oxide (NOX) design used in the InternationalNuclear Fuel Cycle Evaluation (INFCE) fast breeder reactor (FBR)studies [39]. In using Cacuci's adjoint formulation [22], Onega andFlorian made a one-dimensional (radial) time-dependent diffusioncalculation which involved two neutron energy groups [(10" eV, 0.11MeV) and (0.11 MeV and 10 MeV)], two precursor groups (delayedneutrons were produced only by the isotopes U-238 and Pu-239), andcylindrical geometry without taking temperature reactivity feedbackand burn-up into account. The accidents studied were ejections of acentral control-rod assembly with ejection times of 2, 10 and 30 s.The control-rod ejection was simulated by ramping (reducing linearlyin time) the poison cross-section in the central control region fromits critical value to zero. The slope of the ramp was determined bythe rod-ejection time. The reactor response resulting from changesin the delayed neutron spectra was predicted from the sensitivityderivatives which were calculated by solving the adjoint equations.The predictions were also verified by recalculating the responses bydirectly solving the forward transient equations. The power-densitysensitivity calculations were very similar to those for the power.In the analysis, the state vector (X) was:
and the parameter vector (data field),a was
a - (v1 Y1" vx Y1" Y 1 yl- v1 Y1- i
*1 , 8 ' *1 ,B'*1 , 9 ' *1 ,9 ' *2 ,8 '*2 ,8 ' *2 ,9 '*2 ,9

103
The sensitivity of the response due to a change in the component c^was
dR/do /* J i^il = 2wH /* J i^lx.t,^) S^r.t;^)
0 + • 2 ( r t ) S^ix.t-.S^U r dr dt
r,0;£0> •3(r,0;a0) r dr
+ •2(r,t;o0)
- 2wH Z Jj o
where, the Y3(r,0;a ), ,Y6(r,0;a ) are found by solving thedifferentiated two-group equations. The
respect,
teady-state Frechet differentiated two-group equations.(r,0;a ) are the derivatives of • ,• (C^c*,^1 and c^ with r
to a. .Using the linear power response functional
P[t;a0] =
Z2 V 6(t-t) 2wrH drdt
and the weight functions for the two-group fluxes
f (r,t) = w 5(t-t)
g(r,t) = wf z\ 6(t-t),
the sensitivity derivatives dP/da. were calculated. From these, thechange AP in the power was calculated for a given change Aa in theparameter vector. Knowing the response P(t,dL) evaluated using theunperturbed parameter vector a. and the sensitivity derivatives, theresponses P(t,<$) were calculated, where, a=6t+Ai is the perturbedparameter vector. The power response was given by
P(t;o) = AP
Some of the changes in a used were:Act =-Aa , Aa =2Aa and Aa =3AaFor a given response, the adjoint equations were solved in order tocalculate the sensitivity derivatives. In the calculation, a waseither 0.83 or 0.17 and Act was either 0.02 or -0.02. Sensitivityderivatives, dP/da. are positive and have units of MWth. Theperturbation, Ac? in the parameter vector is interpreted as anuncertainty in the parameter vector a ; so the change in the powerresponse, AP is also interpreted as the uncertainty in the reactorpower level.

104
Their sensitivity computations showed that small uncertainties indelayed neutron spectra could lead to large uncertainties in reactorpower responses. For example, an uncertainty of only 2.4*. in thefast components of the delayed neutron spectra resulted in a 6.1\uncertainty in the predicted reactor power level after 25 s into thetransient for a rod-ejection time of 2 s, where as a 7.2%uncertainty in the fast component of the parameter vector resultedin an uncertainty of 18.4* in the reactor power level after 25 sinto the transient. The largest uncertainty observed in thepredicted power level was 23.8\ at 45 s into the 30-s rod-ejectiontime transient and resulted from a 7.2*. uncertainty in the fastcomponents of the delayed neutron spectral data. The behaviour ofthe uncertainties in the power-density responses was exactly thesame as the behaviour of the power responses. They increased withtime during a transient and were more for rapid transients than forslow transients. The power and power density were found to be mostsensitive to uncertainties in the energy spectrum of delayedneutrons from fissions in 0-238 which contribute to precursorgroup 2 and neutron energy group 1 (xl B ) - The responses were leastsensitive to uncertainties in X* «• Results indicated the need forimproving the accuracy of delayed neutron spectral data: thecomponent needing most attention was xt a
an<* the spectral data forX* needed to be improved. Since, ' x'~ a was an integralquantity,i.e.,the second precursor group in'the model contained the2, 0.5 and 0.2 s half-life precursor groups, and energy group 1ranged from 10 MeV down to 0.11 MeV, the authors felt that detailedspectral measurements in these precursor groups for U-238 should beperformed.
Das and Walker [40-42] carried out a sensitivity analysis of anoxide fuelled LMFBR design used some years ago at the ArgonneNational Laboratory, USA. One-dimensional space-time kineticcalculations in multi-group diffusioin theory approximation werecarried out using the computer program QX-1 [43]. A loss of sodiumcoolant was assumed to produce an increase in reactivity and therange of ramp rates was varied from 0.57 mk/sec to about 1153mk/sec. Nine energy groups compressed from 26 in the original code,six precursors, and Doppler feedback were used in the calculations.The influence of delayed neutron energy spectra on fast reactordynamics was studied by calculating reactor characteristics forseven assumed spectra, i.e., the initial reference spectrum and thesix variants of it. Delayed neutron spectra were varied from verysoft, with nearly half the delayed neutrons below 40 keV (designatedX J . = 4 ( D ) , to excessively hard, close to a prompt neutron spectrum(designated xd^=Prompt). Although a collapsed nine-energy-groupstructure was used, four groups A., *ai' *di and %%• weremade zero for the initial spectra thus leaving onlymade zero for the initial spectra thus leaving only five populatedgroups (designated X J ' = 5 ) . Delayed neutron energy spectra werealtered by altering tne fractions in the various energy groups. Forthe kth fuel isotope

105
where, xf. • IE) is the energy spectrum of delayed neutron group ifrom the k'th fuel isotope and E , and E are the upper andlower energies for the gth energy 3group respectively. All thecalculations were carried out with the initial and the alteredneutron spectra normalized to unity. Of the nine transients studied,four were in the prompt critical domain and the rest in the delayedcritical domain. Sensitivity computations showed that for all thetransients and for all the spectra, the spread in peak power wasabout 1.2-6% and generally increased with input rate for both theproapt and the delayed critical transients. Power response (relativepower and peak power) was most sensitive to the relativedistribution of neutrons in the less than 200 keV energy region andwhen the delayed neutron spectrum was given the same spectrum as theprompt neutrons. For example, when a large component (46%) ofneutrons was put in the less than 40 keV region, peak power in theprompt excursion resulting from a ramp rate of about 0.14/sincreased by 3% but decreased by about 6% when xd-
=prompt. In thesame transient, at t=25 is, total fission power varied by as much asa factor of about 7 depending upon whether the reference spectrum orX».=4(I) spectrum was used; this factor decreased to about 1.3 at 50ms* The spread in the energy released within the transient was about15%. Harder the neutron spectrum, greater was the fraction of theenergy released in the first prompt burst but as the transientproceeded, the harder spectrum had the opposite effect. After thefirst burst, the integrated energy released showed largerdifferences,e.g., at t=50 us, the softest spectrum, x d
=4(I) gave arelease 13% greater than the initial reference spectrum, where asthe hardest spectrum (x - •=prompt) gave 20% less. For postulatedaccidents involving delayeaxcritical transients, the fuel took manyseconds to reach its melting point but only milliseconds with promptcriticality; the spread in these times was only a few per cent overall the seven assumed delayed neutron spectra. In the delayedcritical region, the spread in the maximum Ak reached was as much as67% for a ramp rate of about O.6E-3 per sec and decreased to about0.5% for 57.5E-3 per sec, but in the prompt critical domain thespread increased with ramp rate from about 1.5% to 6%. The authorsconcluded that the main cause of any sensitivity of fast reactorkinetic behaviour to delayed neutron spectra was through changes inthe effective delayed neutron fraction, p f~. The rather lowersensitivity of the present reactor compared to earlier studies was,it was felt, due to the hard spectrum for the prompt neutrons in thecore, and it was suggested that calculations were made with a softerspectrum characteristic of a large power breeder reactor with morediluents in the core. It was also suggested that calculations aredone to obtain results with finer energy structures in order to findthe optimum number of neutron energy groups for sensitivity studies.
Das [44,45] has performed a sensitivity analysis of the kineticresponse of a 500 MWe carbide-fuelled fast breeder reactor [46] tolarge uncertainties in delayed neutron energies using the conceptsof 'Delayed Spectrum Factor' and 'Beta Growth Factor'. The 'DelayedSpectrum Factor1(Kg) is a delayed neutron spectrum-dependentparameter and is a measure of the deviation of the beta-effectivefrom its reference value resulting from the uncertainty in thedelayed neutron spectra. It is unity for the reference spectrum and

106
not equal to unity for other spectra. The 'Beta Growth Factor1 (Qg)was the time variation of beta-effective during a transient with tnecondition that
c t > ' 0 )
for all values of Kg,i.e., for all the delayed spectra. It wasassumed that the neutron effectiveness was the same for all thedelayed precursor groups and that the total change in beta-effectiveis equally distributed over the precursor groups. In thecomputation, Kfl was varied from 0.8 upto a maximum of 1.4 in stepsof 0.1 and Q_ was taken as 0.5 mk/sec for all the spectra and wascontinued throughout the excursion. Positive reactivity accidentswere postulated with reactivity rate varying from 10 mk/sec to 800mk/sec and a simple reactor model was calculated using a pointkinetics code SENSTVTY [47], six precursor groups and Dopplerfeedback. Results of sensitivity computations showed that while theachieved power level was sensitive to the shape of the delayedneutron spectrum and varied by as much as a factor of about 10 at aparticular time, the spread was conservatively almost always withinabout 27% for the peak power attained and about 20% for the accidentenergy released. The spread in the maximum reactivity reached waswithin 18V The time spread in the melting of fuel resulting fromthe uncertainty in the delayed neutron spectrum was estimated to bein milliseconds, the spread decreasing with the increase of ramprate. Compared to the reference spectrum, the melting of fuel wasdelayed for the softer spectra, but occurred earlier for the hardspectra. The peak power decreased with the hardening of thespectrum, and the spread in peak power decreased with input rate.Thus a 20% uncertainty in the beta-effective resulting from theuncertainties in the delayed spectral data gave rise to a 30%uncertainty in the peak power for ramp reactivity rate of 10 mk/sec,but for 200 mk/sec, the uncertainty was only about 6%. The spread inthe pulse energy released during the excursions increased with inputrate. The author has suggested that the above study should be backedup with multi-group, multi-dimensional spatio-temporal calculationsusing, preferably, measured delayed neutron spectral data and theeffects of dimensionality, neutron energy group structure, reactorconfigurations and compositions on the sensitivity analysis shouldbe examined.
107
REFERENCES
1) D.G. Cacuci: The Forward and The Adjoint Methods of SensitivityAnalysis, (Ed.) Y. Ronen (CRC Press, Inc; Boca Raton, Florida,1988) Chap.3, p.71.
2) S. Glasstone and M.C. Edlund: The Elements of Nuclear ReactorTheory (Van Nostrand, Princeton, New Jersey, 1952).
3) E.P. Wigner: Chicago Report CP-G-3048 (1945).
4) H. Levine and J. Schwinger: Phys. Rev. 75 (1949) 1423-1437.
5) P. Roussopoulos-. Comptes Rendus 236 (1953) 1858-1860.
6) L.N. Usachev: J. Nucl. Energy, Parts A/B, H (1964) 571-583.
7) G.C. Pomraning: J. Math. Phys. 8, No.1 (1967) 149-158.
8) A. Gandini: J. Nucl. Energy 21 (1967) 755-765.
9) W.M. Stacey.Jr.: J. Math. Phys. H (1972) 1119-1125.
10) D.E. Bartine, E.M. Oblow and F.R. Mynatt: Nucl. Sci. Eng. 55.(1974) 147-167.
11) W.M. Stacey.Jr.: Variational Methods in Nuclear Reactor Physics(Academic Press,Inc; New York, 1974).
12) E.M. Oblow: Nucl. Sci. Eng. ii (1976) 187-189.
13) A. Gandini: Advances in Nuclear Science and Technology,(Eds.) J.Lewins and M. Becker (Plenum Press, New York, 1987) Vol.19,pp.205-380.
14) Martin Becker-. Nucl. Sci. Eng. .62 (1977) 296-301.
15) E. Greenspan, D. Gilai and E.M. Oblow: Nucl. Sci. Eng. £8. (1978)1-9.
16) M.L. Williams: Nucl. Sci. Eng. 70 (1979) 20-36.
17) C.F. Weber and E.M. Oblow: Report ORNL/TM-6900 (1979).
18) Dan G. Cacuci: J. Math. Phys. 22. (1981) 2794-2812.
19) G. Palmiotti: Nucl. Sci. Eng. £1 (1983) 281-294.
20) Yigal Ronen: Nucl. Sci. Eng. 9_6_ (1987) 153-158.
21) Rizwan-uddin and J.J. Doming: Nucl. Sci. Eng. 100 (1988) 393-404.

108
22) D.G. Cacuci, C.F. Weber, E.M. Oblow and J.H. Harable: Nucl. Sci.Eng. 75 (1980) 88-110.
23) T.M. Flett: Differential Analysis (Cambridge University Press,Cambridge, 1980) 166-250.
24) P.M. Morse and H. Feshbach: Methods of Theoretical Physics(McGraw-Hill Book Company, New York, 1953).
25) Dan G. Cacuci: Nucl. Sci. Eng. iQJ, (1990) 78-88.
26) J. March-Leuba, D.G. Cacuci and R.B. Perez: Nucl. Sci. Eng. 8_6(1984) 401-404.
27) J. March-Leuba, D.G. Cacuci and R.B. Perez: Nucl. Sci. Eng. 92(1986) 111-123 and 124-136.
28) D.W. Decker and H.B. Keller: Comm. Pure. Appl. Math. 34. (1981)149.
29) S. Yiftah and D. Saphier: Delayed Fission Neutrons, Proceedingsof a Panel, Vienna, 1967 (International Atomic Energy Agency,Vienna, 1968) 23-31.
30) D. Saphier and S. Yiftah: "FREDY - A Computer Program ForCalculating Fast Reactors' Transient Response and its TransferFunction".
31) D. Saphier, D. Ilberg and S. Yiftah: Advanced Reactors Physics,Design and Economics (Pergamon Press, New York, 1975) 592-605.
32) D. Saphier and S. Yiftah: Report IA-1217, Israel Atomic EnergyCommission (January 1971).
33) D. Saphier: Trans. Am. Nucl. Soc. 16 1 (1973) 300-301.
34) D. Saphier, D. Ilberg, S. Shalev and S. Yiftah: Nucl. Sci. Eng.62 (1977) 660-694.
35) D.A. Meneley et al: Proceedings of Symposium on Dynamics ofNuclear Systems, Tucson, Arizona (1970).
36) R.A. Shober, T.A. Daly and D.R. Fergusson: Report ANL-78-97,Argonne National Laboratory, Argonne, Illinois (October 1978).
37) D. Saphier and S. Yiftah: Nucl. Sci. Eng. 12 (1970) 272-277.
38) R.J. Onega and R.J. Florian: Ann. nucl. Energy, JjQ, No.9 (1983)477-490.
39) Y.I. Chang and C.E. Till: Report INFCE/5-TM-3, Argonne NationalLaboratory, Argonne, Illinois (July 1978).
40) S. Das and J Walker: Delayed Neutron Properties Proceedings ofthe Specialists' Meeting, University of Birmingham, September15th-19th, 1986 (University of Birmingham Report, England, 1987)
109
276-297.
41) S. Das and J. Walker: Nucl Energy 26, No.1 (1987) 47-55.
42) S. Das: Proceedings of the Fourth Asia Pacific PhysicsConference-VoLume 2, (Eds.) Ahn S.H., Cheon II.T., Lee C. (WorldScientific Publishing Co. Pte. Ltd, Singapore, 1991) 1233-1237.
43) D.A. Meneley, K.O. Ott and E.S. Wiener: Report ANL-7769, ArgonneNational Laboratory, Argonne, Illinois (March 1971).
44) S. Das: Report BARC-1525, Bhabha Atomic Research Centre, Bombay,India (1990) 1-45.
45) S. Das: Proceedings of the Third International. Seminar on SmaLLand Medium-Sized NucLear Reactors:Planning For World EnergyDemand and Supply, New Delhi, India (August 26-28, 1991) 356-365.
46) Om Pal Singh and R. Shankar Singh: Report PFBR/01170/2, ReactorResearch Centre, Kalpakkam, India (1982).
47) S. Das: 'SENSTVTY - A Point Kinetics Fortran Programme to Studythe Sensitivity of a Fission Reactor' (Unpublished).

11O
§10. CONCLUDING REMARKS
In this review, we have given a. summary o£ the diverse role p ,ndelayed neutrons play in various problems of nuclear science andtechnology. We have shown that quite apart, froai the practical valueof data on fission-product delayed neutrons for reactorapplications, the phenomenon of beta-delayed neutron emissionaffords unique empirical clues to neutron cross-sections of farunstable nuclides including cross-sections of nuclei in excitedstates. The key point is to exploit the inverse relationship betweenneutron emission and absorption by compound nuclear "• 3vels above theneutron binding energy and to explore the possibility of obtainingdata of sufficient quality and quantity to allow construction ofempirically based cross-section of very neutron-rich nuclides. Suchcross-sections as well as individual line properties and leveldensities are of interest in astrophysics and in nuclear theory. Insome cases, these cross-sections may be dominated by individualisolated resonances, and in others they aay be viewed as averagesover a number of closely spaced resonances. In either way, delayedneutron energy spectra are a unique source of data for constructingcross-sections of nuclides that are completely inaccessible todirect measurements. Another utility of delayed neutron informationis in the neutron emission probability (P^), whose accuratedetermination over as wide a range of short-lived nuclides aspossible, is important to verifying empirical or physical modelsemployed in astroohysical r-process. By studying neutron rich nucleiwith atomic number around 100, which are known to be stronglydeformed, it has been demonstrated that comparison of present shellmodel predictions with gross beta decay properties such as half-life, P and the beta strength function (S. , ) may provide a newand simple way to identify Nilson parameters and orbitals, and todetermine nuclear deformation. Thus there is a strong and close linkbetween applications and the testing of nuclear models which havelargely been developed by studying nuclei near neutron-richstability. Since the nuclei produced after fission are neutron richcompared to stable nuclei and some of these lie far off the valleyof stability, the ability of these nuclear models to predict thebehaviour of these exotic and highly unstable species would be anexcellent testing ground for these models. For example, the abilityto predict beta-decay parameters which are essential in predictingthe radioactivity of reactor cores after shut-down is closely linkedto nuclear models and the nuclear mass formulae.
Not only in the report we have brought out the present status ofdelayed neutron data (both experimental and theoretical), but alsohave created awareness that a continuing need exists for moreprecise and detailed delayed neutron data. To obtain these delayedneutron parameters, one requires accurate and complete informationof the fission fragment yields, half-lives, delayed neutron emissionprobabilities and energy spectra. Emission probabilities and decaytimes should be known to within 1 to 5 % for the primary precursors,especially for half-lives less than 20 sec. Energy spectra ofprecursors should be known to at least within 20 \. Calculated yieldvalues and decay times should agree with the measured values towithin 5 to 10 V Establishment of a complete individual precursordata base is a desirable long term goal to generating delayed
111
neutron parameters.The delayed neutron emission probability and the fissio,, product
yield form input to the calculations of total delayed -..iUttan yield(v.) and the delayed neutron spectrum. Recent work ha^ ;-,hi>.-n Hicituncertainty in summation calculations is approximately equjlLi' dueto fission yields and P values. The situation for precursor P;.-values and group abundances are quite satisfactory and except cor'afew precursors, there is good agreement between the p^-valuesmeasured at different laboratories. Over 80 precursors have beenevaluated and new precursors such as Cu75 and 'Cu7S have beenidentified. P values of precursors with just over 60 neutrons arereported to be lower than expected, such as the Y100-Y102precursors. This is thought to be due to deformation. £>r--values canbe estimated theoretically to about a factor of 2.5'! using theequation of Kratz and Herrmann. They can also be calculated usingmodels. The models have the advantage that they can give isomericratios which the equation can not. Gross theory P_'s for Kl> and Cshave been found to be in better overall agreement with experimentaldata than the TDA (Tamm-Dankoff Approximation) predictions. Frommeasurement of delayed neutron-gamma angular correlations for Rb94and Rb95, it has been shown that Rb95 has about 15\ f-wave emission.As regards fission product yields, a large number of independent andcumulative yields have been measured for thermal neutron-inducedfission in U235 and for thermal and fast fission in other fissilenuclides. The importance of independent fission yields in. nuclearfission reactors is mainly in three respects: control of nuclearreactors, size of emergency cooling systems in power stations andmicroscopic criticality studies. The U235 yields agreesatisfactorily with evaluated data but for Pu239 the agreement isnot so good. The evaluated yields need adjustment. The U235 datashow much better correlations with neutron energy than do the Pu239data. There is a definite need for more Pu239 yield measurementsespecially in the region of 500-1000 keV. No extensive study ofisomeric yields seem to have been made. These data are needed notonly for evaluations but also to test existing theories. Future workshould provide more data in this field. There is need to evaluatefission product yield data by more than one evaluators and targetaccuracies need to be redefined. In the context of evaluation needs,the more important fissioning nuclides are: Th232, U233, 0235, U238,Np237, Pu239 and Pu241. On the whole, a generally accepted referenceyield data set containing measured data as well as extensive modelsfor unmeasured data should be available to the nuclear coanaunity.
Information on total delayed neutron yield for each missioningisotope is important to analytical calculation c£ materialscontaining mixtures of nuclides such as light-water reactor fuelswhere the isotopes change with increasing exposure as uranium isconsumed and plutonium is produced. Even information on minorisotopes like U236 and Pu241 is important, since analytical analysisof these materials is required in reactor safety and safeguardsmodelling for these materials throughout the fuel cycle, in view ofthe major contributions currently being made by the calculatedvalues, there is need for additional experimental measurements ofthe broadest possible scope and comprehensiveness to complement theexisting data base. Aggregate and time-group re-evaluat.ions of v, -particularly for groups 5 and 6 - are also necessary.

112
The data sets for energy spectra used so far in energy-dependentreactor calculations are not at the desired level of accuracy.Although, a number of new integral measurements of delayed neutronspectra have become available, so far no consistent and generallyaccepted set of delayed neutron spectra for the entire energy rangeof interest exists. Direct measurements of composite delayed neutronspectra have the advantage that they can be performed over a muchshorter time frame than generating spectra from individual precursordata. The aggregate spectra not only furnish an independent methodof obtaining six-group spectra but also serve as a check tosummation calculations. Comparison of delayed neutron energy spectrameasured at different laboratories using the same or differenttechniques shows, on the one hand, a remarkable degree ofconsistency with regard to the existence of peak structure and theoverall spectral energy distribution. On the other hand, certainsystematic differences are observed both at lower energies (< 150keV) and at higher energies (> 700 keV). These inconsistenciesshould be resolved by further analysis and measurements. Intheoretical calculations of delayed neutron spectra, the grosstheory, the statistical model, the Tamm-Dankoff Approximation (TDA)model and the Random Phase Approximation (RPA) model can each beused by paying careful attention to input parameters. Test resultsof spectra calculation and multichannel neutron emission have givenreasonably good results when compared to experiments. An interestingobservation from the calculations of delayed neutron spectra is thatthe shape of the spectrum is the same for thermal, fast and 14 HeVneutron induced fission in spite of large changes in the fissionyields and total delayed neutron yields.
As regards the average delayed neutron energies, there isdiscrepancy in the estimates made by different groups. They need tobe resolved. It is important to note that average energies shouldnot be calculated from incomplete spectra, especially from thosethat lack the high energy part.
On the experimental side, measuring delayed neutron spectra hasdeveloped from a low-resolution detection to a high-resolutionspectroscopic method over the years with a wide range of techniqueshaving been applied to the measurements.
The major conclusions that have emerged from the various studiesconducted on the sensitivity of fast reactor kinetic behaviour todelayed neutron energy spectra are:(a) Dynamic calculationsperformed for fast reactor safety analysis should be performed withmore caution with respect to the data used and should be performedfor clean as well as for high burn-up cores;(b) Significant errorsin transient calculations would result in all cases if prompt (veryhard spectrum) instead of delayed neutron spectra are used;(c) Thereactor kinetic response depends considerably on the fraction ofdelayed neutrons in the low energy region ie on the degree ofsoftness of the delayed neutron spectrum;(d) For large perturbationsor for reactors having significant amounts cf high-threshold fissilematerial, it is desirable that delayed neutron spectra with finegroup structure are used in dynamics calculations;(e) There is needto improve the accuracy of delayed spectral data.

113
§11. RECOMMENDATIONS
Future work on Delayed Neutrons can focus on the following areas:
(1) Use of delayed neutron information in nuclear physics andastrophysics.
(2) Improvement in the existing theoretical models in order toobtain better estimates of unmeasured spectra.
(3) Improvement in the experimental techniques of measuring delayedneutron spectra with particular reference to efficiency andresolution.
(4) More accurate information of the structure in the delayedneutron spectra and the true intensities of delayed neutrons atboth the high (>1.5 MeV) and the low ends (<100 keV) of eachspectrum.
(5) Generation of delayed neutron spectral data both by microscopicsummation of separated precursor results and also by analysisof aggregate spectra from unseparated precursors to check forproblems in one technique or the other. Comparison of the expe-rimentally obtained aggregate spectra with the equivalent summ-ation results. Measurements using several different basic appr-oaches would help in identifying the serious systematic errors.
(6) Use of both the aggregate and the microscopic data to evaluatethe best "few" group representation of delayed neutron spectraand inclusion of the up-dated delayed neutron data into datafiles (ENDF/B, JEF).
(7) Adequacy of the widely used six-group representation of delayedneutron precursor groups versus explicit precursor representat-ion should be examined.
(8) Neutron spectral data for individual precursors should be sentto data banks so that they are easily accessible to all users.
(9) Measurements of energy spectra of delayed neutrons coming fromshort-lived nuclides.
(10) Measurement of delayed neutron spectra of important individualprecursors like bromine,iodine by different techniques to prov-ide a check for inconsistencies.
(11) Measurements of aggregate delayed, neutron spectra for 2 3 BU, 2 3 3Dand Th232 to complement the existing data for U235,Pu239 all ofwhich are important for fast reactors. Delayed neutron spectraldata from fast fission of Pu240, Pu241 and Pu242 are required.In particular, the fraction of delayed neutron having energiesabove the thresholds of fertile materials like U238, Th232 andPu240 are important.
(12) More P measurements on individual precursors to reduce thepresent discrepancies in the P values and to confirm results of
114
single measurements. P^ values should be measured for precursornuclides As88, Y100-Y103 and Sb138 and reneasured for other Asand Sb isotopes.
(13) More detailed evaluations of P̂» values. For example, p-strengthfunction with smooth shapes can be used in Prt calculations.
(14) Sensitivity studies should be made to better determine whichprecursors need to be measured and to what accuracy.
(15) Since corrections to v* also depend on knowledge of spectra, areassessment of corrections to v4 measurements should be madewith the improved status of the delayed neutron spectra.
(16) Delayed neutron spectra, using (n—f) coincidence techniques,should be used to obtain improved p-strength function models.
(17) Interlaboratory comparison of spectrometers using an Am/Lisource should be made.
(18) High resolution spectra for energies between 1 keV to 100 keVshould be measured for selected fission products to developedata for neutron cross-sections and for further understandingof the low energy results.
(19) The influence of delayed neutron spectrum on fast reactor cri-ticality should be studied.
(20) Use of diffusion or transport theory methods to study the sen-sitivity of reactor dynamic behaviour to assumed or experime-ntally measured delayed neutron energy spectra for differentreactor configurations, different core spectra, differentneutron energy groups and different energy group structure.
(21) To explorethe possibility of doing further work on sensitivitytheory or the refining of existing generalized sensitivitytheory for applications to problems in reactor kinetics,thermal-hydraulics or other areas of physics and technology.
(22) Development of computer code based on adjoint methodology.
(23) The discrepancy in the average energy of delayed neutron spec-tra should be sorted out.

Published by : M. R. Balakrishnan,Head, Libraiy & Information Services Division,Bhabha Atomic Research Centre, Bombay 400 085


![INSTITUTO PERUANO IPEN[1]](https://img.pdfslide.us/doc/110x75/55cf9832550346d033962a4f/instituto-peruano-ipen1.jpg)