Embed Size (px)
Citation preview
Volume 105, Number 1, January–February 2000Journal of Research of the National Institute of Standards and Technology
[J. Res. Natl. Inst. Stand. Technol. 105, 71 (2000)]
Study of Interatomic Potentials Using theCrystal-GRID Method on Oriented Single
Crystals of Ni, Fe, and Cr
Volume 105 Number 1 January–February 2000
N. Stritt and J. Jolie
Institut de Physique, Universitrolles,CH-1700 Fribourg, Switzerland
and
M. Jentschel, H. G. Borner, andC. Doll
Institut Laue Langevin,Av. des Martyrs 156X,38042 Grenoble CEDEX, France
The Crystal-GRID method is used to studyinteratomic collisions at low energy inmetals and such to probe the repulsive in-teratomic potential. Line shapes ofgamma rays, emitted by the recoiling 59Niisotope after thermal neutron capture inNi single crystals, were measured and com-pared to results obtained by moleculardynamics simulations of the slowing down.The same procedure is also used for re-coiling 57Fe and 54Cr atoms in Fe and Crsingle crystals, respectively. Different po-tentials (including several from the embed-ded atom method) are investigated usingthe observed fine structure of the line shapewhich depends on the crystal orientations.
From the detailed study of the lineshapesmeasured in two different orientations, anew potential is then derived for each ele-ment. Nuclear state lifetimes for the ex-cited isotopes are also deduced with ahigher precision than obtained with stan-dard nuclear techniques.
Key words: interatomic potential; lifetime;metals; molecular dynamics simulations;slowing down.
Accepted: July 22, 1999
Available online: http://www.nist.gov/jres
1. Introduction
The gamma-ray induced doppler broadening (GRID)method [1] is based on the observation of Doppler shiftsproduced by the motion of radioactive nuclei in solidstate targets. The motion of atoms is produced by de-ex-citation following thermal neutron capture. Usually afterthis type of reaction, the newly formed isotope willdecay by emission of gamma-ray cascades down to theground state. The GRID technique involves the measure-ment of the energy of the second gamma ray in a twogamma cascade. The first gamma ray induces a recoil tothe nucleus in the opposite direction of emission. If thenucleus emits a second gamma ray while still in flight,the measured energy of the latter will be Dopplershifted. As the gamma rays are emitted isotropically, thisresults in a Doppler broadened line shape rather than aline that is Doppler shifted. This small Doppler broaden-
ing can be measured by the two-axis flat crystals spec-trometer GAMS4 [2] installed at the Institut LaueLangevin (ILL) in Grenoble (France) in a ILL/NISTcollaboration. Typical values for the recoiling atom en-ergy analyzed with the transition metals are in the orderof 200 eV to 400 eV. With this kinetic energy, the atomhas enough energy to move from its lattice position andmake collisions with its neighboring atoms. Before theexcited nuclei emits the second gamma ray (the proba-bility of emission is determined by the nuclear statelifetime), the atom will slow down due to interactionswith its neighbors. The slowing down process is simu-lated by molecular dynamics programs where differentinteratomic potentials can be implemented. The result-ing Doppler line shape is compared to the measured onevia a fitting routine [3]. The Crystal-GRID technique [4]
71

Volume 105, Number 1, January–February 2000Journal of Research of the National Institute of Standards and Technology
uses single crystals as targets, and was developed tostudy and to construct new interatomic potentials. Herewe apply this method to analyze three transition metals:nickel, iron, and chromium.
The Doppler broadened line shape depends on threecontributions: i) the lifetime of the nuclear state, whichgives the probability of emission of the second gammaray at a given time, ii) the orientation of the crystal withrespect to the direction of observation, which will bediscussed in Sec. 2 and iii) the slowing down process,which will be discussed in detail in Sec. 3. The resultsof the different slowing down theories for the threetransitions metals are summarized in Sec. 4. Section 5deals with the construction of a new potential derivedfrom the measured Crystal-GRID data.
2. Crystal-GRID Technique
The gamma ray induced doppler broadening mea-surements are realized with single crystals as target. Thetargets consists of three crystals with a dimension of
2 mm � 18 mm � 20 mm having a total mass of 10 gto 15 g. The targets are placed oriented inside the nu-clear reactor and are irradiated with a neutron flux of5 � 1014 cm–2 s–1. The different isotopes and nuclearreaction studied in this experiment are listed below:
5828Ni30 + n(25 meV)→59
28Ni31*→59
28Ni31 + �5628Fe30 + n(25 meV)→57
26Fe31*→57
26Fe31 + � (1)5324Cr29 + n(25 meV)→54
24Cr30*→54
24Cr30 + �
The process involved in the production of a Dopplerbroadened gamma-ray line shape are described in Fig. 1.First (i), neutron capture forms an excited nucleus. Thenewly formed atom will deexcite by emitting a firstgamma ray (ii). This emission will induce a recoil to thenucleus and the atom starts to move in the crystal (iii).If a second gamma ray is emitted during the flight (iv)at a time depending on the nuclear state lifetime (� ), itwill be Doppler shifted due to the emitting atom veloc-ity. The GAMS4 spectrometer measures the energy ofthe second gamma ray with respect to a fixed directionand records this Doppler shift leading to the line shape.
Fig. 1. Description of the nuclear reaction and the nuclear state levels and transi-tions of interest for the Ni isotope (right) and the associated atomic events (left).For simplicity, the motion of the recoiling atom in the crystal is restricted in onedimension.
72
Volume 105, Number 1, January–February 2000Journal of Research of the National Institute of Standards and Technology
If the recoil is induced by only one primary gamma ray(no cascade or side feeding) then the kinetic energy (Er)of the atom at the beginning of the recoil is given by:
Er = E�12/2Mc 2 (2)
where E�1 is the energy of the first gamma ray emittedand M is the mass of the recoiling atom. Table 1 showsthe nuclear levels as well as the different transitionscharacteristics investigated during this analysis. All ofthe nuclear levels used are primary almost 100 % di-rectly fed, which gives rise to a unique recoil velocity.As the nuclear state lifetime can be known by othermeans (DSAM, etc.), and as the direction of observationwith respect to the orientation of the crystal is fixed, thedata analysis gives valuable information on the slowingdown process.
Specially adapted molecular dynamics (MD) pro-grams [5] calculate the trajectories and velocities of therecoiling atom depending on the interatomic potentialby solving the equations of motion of a set of atoms.Once the trajectories of the recoiling atoms have beensimulated, the only free parameter left over, which canbe varied during the fitting procedure, is the lifetime ofthe nuclear state. If the lifetime is very short, the atomwill have a great velocity when it emits the secondgamma ray as no collision has taken placed and the atomdid not have sufficient time to slow down. Therefore theDoppler line shape will be more broadened.
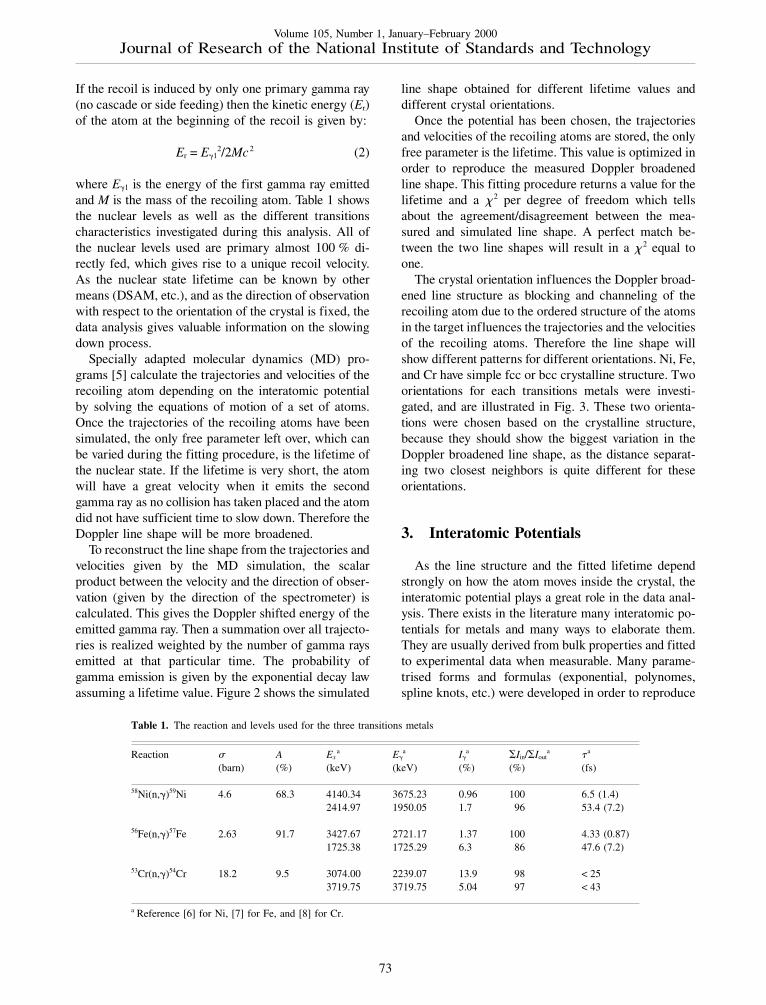
To reconstruct the line shape from the trajectories andvelocities given by the MD simulation, the scalarproduct between the velocity and the direction of obser-vation (given by the direction of the spectrometer) iscalculated. This gives the Doppler shifted energy of theemitted gamma ray. Then a summation over all trajecto-ries is realized weighted by the number of gamma raysemitted at that particular time. The probability ofgamma emission is given by the exponential decay lawassuming a lifetime value. Figure 2 shows the simulated
line shape obtained for different lifetime values anddifferent crystal orientations.
Once the potential has been chosen, the trajectoriesand velocities of the recoiling atoms are stored, the onlyfree parameter is the lifetime. This value is optimized inorder to reproduce the measured Doppler broadenedline shape. This fitting procedure returns a value for thelifetime and a � 2 per degree of freedom which tellsabout the agreement/disagreement between the mea-sured and simulated line shape. A perfect match be-tween the two line shapes will result in a � 2 equal toone.
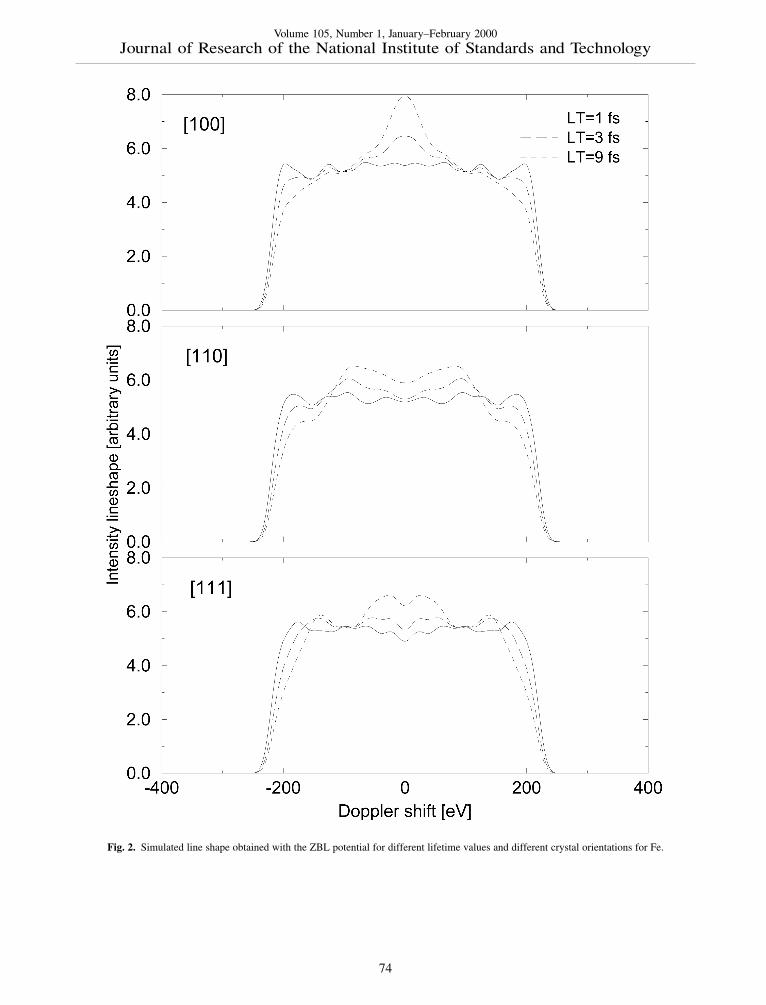
The crystal orientation influences the Doppler broad-ened line structure as blocking and channeling of therecoiling atom due to the ordered structure of the atomsin the target influences the trajectories and the velocitiesof the recoiling atoms. Therefore the line shape willshow different patterns for different orientations. Ni, Fe,and Cr have simple fcc or bcc crystalline structure. Twoorientations for each transitions metals were investi-gated, and are illustrated in Fig. 3. These two orienta-tions were chosen based on the crystalline structure,because they should show the biggest variation in theDoppler broadened line shape, as the distance separat-ing two closest neighbors is quite different for theseorientations.
3. Interatomic Potentials
As the line structure and the fitted lifetime dependstrongly on how the atom moves inside the crystal, theinteratomic potential plays a great role in the data anal-ysis. There exists in the literature many interatomic po-tentials for metals and many ways to elaborate them.They are usually derived from bulk properties and fittedto experimental data when measurable. Many parame-trised forms and formulas (exponential, polynomes,spline knots, etc.) were developed in order to reproduce
Table 1. The reaction and levels used for the three transitions metals
Reaction � A Exa E�
a I�a �Iin/�Iout
a � a
(barn) (%) (keV) (keV) (%) (%) (fs)
58Ni(n,�)59Ni 4.6 68.3 4140.34 3675.23 0.96 100 6.5 (1.4)2414.97 1950.05 1.7 96 53.4 (7.2)
56Fe(n,�)57Fe 2.63 91.7 3427.67 2721.17 1.37 100 4.33 (0.87)1725.38 1725.29 6.3 86 47.6 (7.2)
53Cr(n,�)54Cr 18.2 9.5 3074.00 2239.07 13.9 98 < 253719.75 3719.75 5.04 97 < 43
a Reference [6] for Ni, [7] for Fe, and [8] for Cr.
73
Volume 105, Number 1, January–February 2000Journal of Research of the National Institute of Standards and Technology
Fig. 2. Simulated line shape obtained with the ZBL potential for different lifetime values and different crystal orientations for Fe.
74
Volume 105, Number 1, January–February 2000Journal of Research of the National Institute of Standards and Technology
Fig. 3. Direction of observation for the two crystalline structures. Nihas a fcc structure shown on the left with the two orientations mea-sured and Fe and Cr have a bcc crystalline structure.
the value of the pair potential as a function of inter-atomic distance.
Table 2 gives a list of some of the potentials used forthe slowing down of atoms in metals. Only the best fourpotentials investigated are given in the table. These po-tentials are derived so to reproduce different characteris-tics of bulk properties, such as cohesive energy, lattice
Table 2. Interatomic potential references
Potential name Authors Ref.
Ni interactionBM Born Mayer [12]ZBL Ziegler, Biersack, Littmark [13]EAMVC Voter and Chen [14]EAMFBD Foiles, Baskes, Daw [15]
Fe interactionBM Born Mayer [8]ZBL Ziegler, Biersack, Littmark [9]EAMVC Voter and Chen [10]EAMGA Guellil and Adams [16]
Cr interactionBM Born Mayer [8]ZBL Ziegler, Biersack, Littmark [9]EAMGA Guellil and Adams [12]EAMWB Wang and Boerker [17]
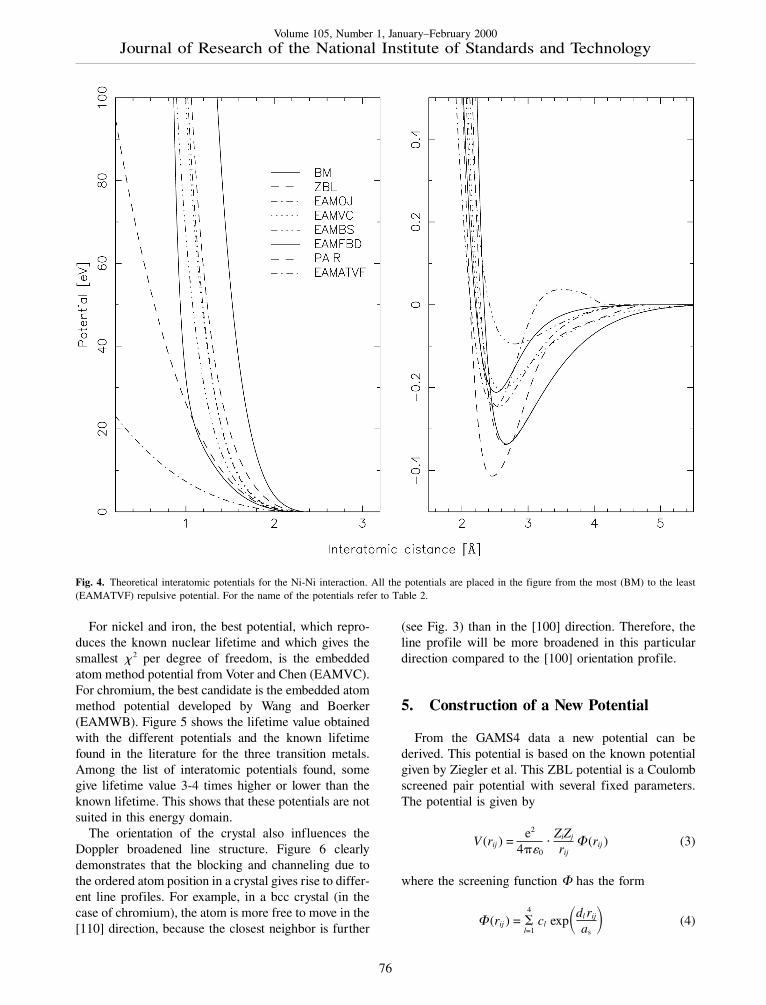
constant, elastic constants, properties of stable struc-ture, etc. All of the mentioned potentials are pair poten-tials and are only dependent on the interatomic distance,even the recent developed embedded atom method(EAM) potentials [9]. In this new approach developedfor metals, the atom is seen as embedded in the electrondensity caused by the neighboring atom and the totalenergy of the system can be described by the summa-tion over all atoms of an embedding function evaluatedfor an electron density and a core repulsive term. Anapproximation to have the force acting on one atom isneeded in order to avoid the double summation (sum-mation over all electron density and summation over allatoms). The approximation replaces the electron densityby an average electron density. A Taylor expansionover this average electron density is then realized forthe evaluation of the needed parameters [10]. Figure 4shows the form of the different potentials for the Ni-Niinteraction. More potentials are given in the figure inorder to illustrate the wide range of potentials found inthe literature. A detailed presentation of all the poten-tials can be found in Ref. [11].
4. Results
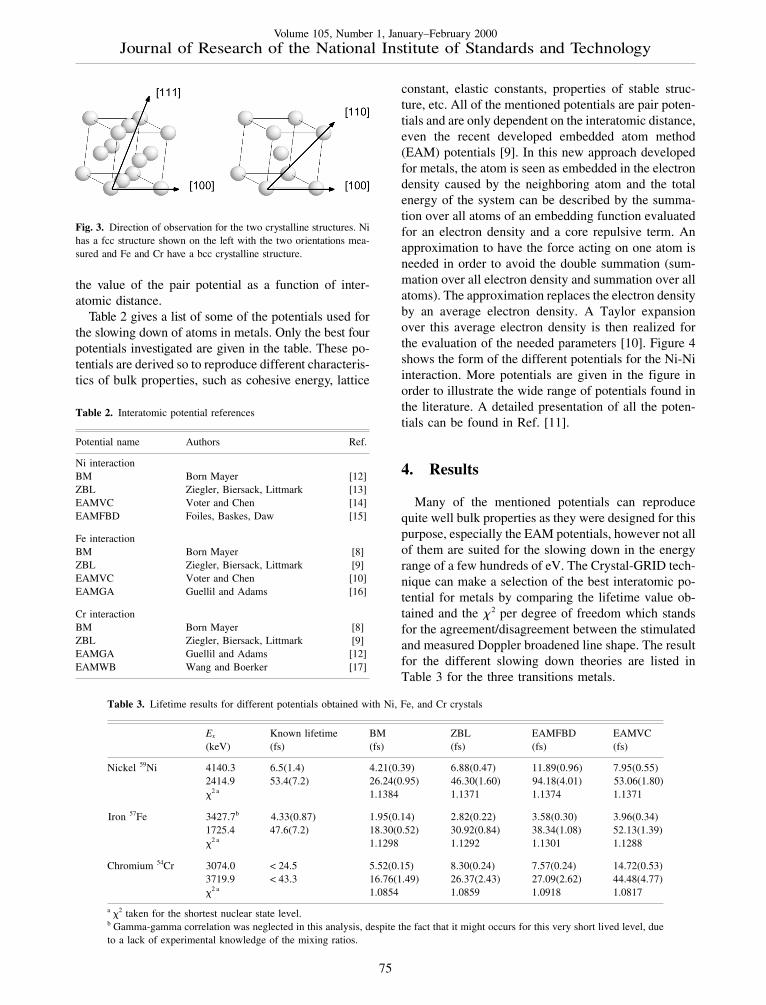
Many of the mentioned potentials can reproducequite well bulk properties as they were designed for thispurpose, especially the EAM potentials, however not allof them are suited for the slowing down in the energyrange of a few hundreds of eV. The Crystal-GRID tech-nique can make a selection of the best interatomic po-tential for metals by comparing the lifetime value ob-tained and the � 2 per degree of freedom which standsfor the agreement/disagreement between the stimulatedand measured Doppler broadened line shape. The resultfor the different slowing down theories are listed inTable 3 for the three transitions metals.
Table 3. Lifetime results for different potentials obtained with Ni, Fe, and Cr crystals
Ex Known lifetime BM ZBL EAMFBD EAMVC(keV) (fs) (fs) (fs) (fs) (fs)
Nickel 59Ni 4140.3 6.5(1.4) 4.21(0.39) 6.88(0.47) 11.89(0.96) 7.95(0.55)2414.9 53.4(7.2) 26.24(0.95) 46.30(1.60) 94.18(4.01) 53.06(1.80)�2 a 1.1384 1.1371 1.1374 1.1371
Iron 57Fe 3427.7b 4.33(0.87) 1.95(0.14) 2.82(0.22) 3.58(0.30) 3.96(0.34)1725.4 47.6(7.2) 18.30(0.52) 30.92(0.84) 38.34(1.08) 52.13(1.39)�2 a 1.1298 1.1292 1.1301 1.1288
Chromium 54Cr 3074.0 < 24.5 5.52(0.15) 8.30(0.24) 7.57(0.24) 14.72(0.53)3719.9 < 43.3 16.76(1.49) 26.37(2.43) 27.09(2.62) 44.48(4.77)�2 a 1.0854 1.0859 1.0918 1.0817
a �2 taken for the shortest nuclear state level.b Gamma-gamma correlation was neglected in this analysis, despite the fact that it might occurs for this very short lived level, dueto a lack of experimental knowledge of the mixing ratios.
75
Volume 105, Number 1, January–February 2000Journal of Research of the National Institute of Standards and Technology
Fig. 4. Theoretical interatomic potentials for the Ni-Ni interaction. All the potentials are placed in the figure from the most (BM) to the least(EAMATVF) repulsive potential. For the name of the potentials refer to Table 2.
For nickel and iron, the best potential, which repro-duces the known nuclear lifetime and which gives thesmallest � 2 per degree of freedom, is the embeddedatom method potential from Voter and Chen (EAMVC).For chromium, the best candidate is the embedded atommethod potential developed by Wang and Boerker(EAMWB). Figure 5 shows the lifetime value obtainedwith the different potentials and the known lifetimefound in the literature for the three transition metals.Among the list of interatomic potentials found, somegive lifetime value 3-4 times higher or lower than theknown lifetime. This shows that these potentials are notsuited in this energy domain.
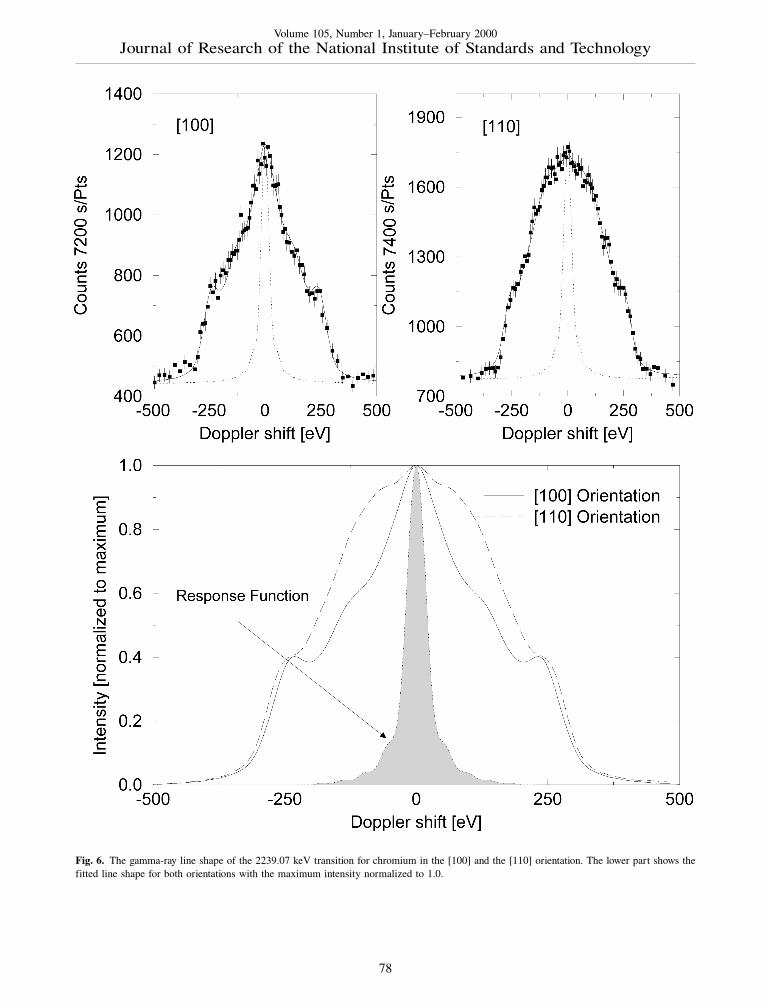
The orientation of the crystal also influences theDoppler broadened line structure. Figure 6 clearlydemonstrates that the blocking and channeling due tothe ordered atom position in a crystal gives rise to differ-ent line profiles. For example, in a bcc crystal (in thecase of chromium), the atom is more free to move in the[110] direction, because the closest neighbor is further
(see Fig. 3) than in the [100] direction. Therefore, theline profile will be more broadened in this particulardirection compared to the [100] orientation profile.
5. Construction of a New Potential
From the GAMS4 data a new potential can bederived. This potential is based on the known potentialgiven by Ziegler et al. This ZBL potential is a Coulombscreened pair potential with several fixed parameters.The potential is given by
V (rij ) =e2
4��0
ZiZj
rij (rij ) (3)
where the screening function has the form
(rij ) = �4
l=1cl exp�dl rij
as� (4)
76

Volume 105, Number 1, January–February 2000Journal of Research of the National Institute of Standards and Technology
Fig. 5. Fitted lifetimes for the three transition metals. Two nuclear state levels were analyzed. The dotted line represents the known lifetime rangefound in the literature.
77
Volume 105, Number 1, January–February 2000Journal of Research of the National Institute of Standards and Technology
Fig. 6. The gamma-ray line shape of the 2239.07 keV transition for chromium in the [100] and the [110] orientation. The lower part shows thefitted line shape for both orientations with the maximum intensity normalized to 1.0.
78
Volume 105, Number 1, January–February 2000Journal of Research of the National Institute of Standards and Technology
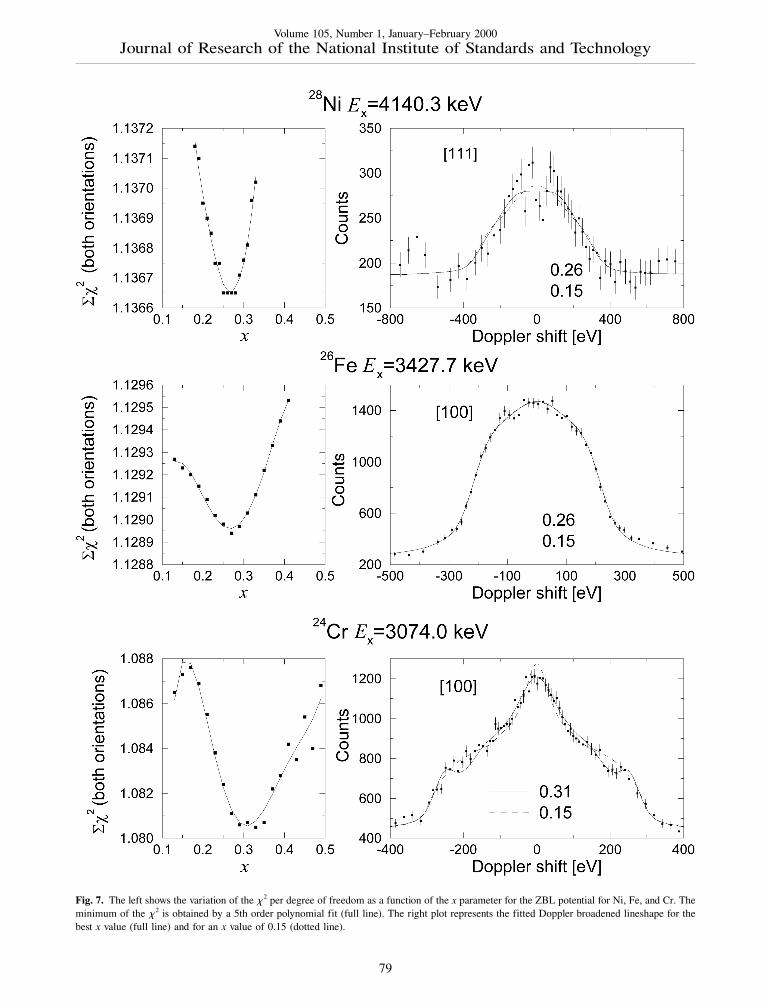
Fig. 7. The left shows the variation of the � 2 per degree of freedom as a function of the x parameter for the ZBL potential for Ni, Fe, and Cr. Theminimum of the � 2 is obtained by a 5th order polynomial fit (full line). The right plot represents the fitted Doppler broadened lineshape for thebest x value (full line) and for an x value of 0.15 (dotted line).
79
Volume 105, Number 1, January–February 2000Journal of Research of the National Institute of Standards and Technology
and the screening length as is defined by
as = 0.8853aB(Z ix + Zj
x)y (5)
with aB = 0.529 Å the Bohr radius and Zi,j the atomicnumber of the atoms i and j respectively. All the parame-ters (cl , dl , x , y ) for the evaluation of the ZBL potentialare listed in Ref. [12]. As we are dealing with atomsrecoiling in the same material, the x and y parameterscan be considered to be one unique parameter. For theconstruction of the new potential, all the parameters arekept identical, except the x parameter, which is variedfrom 0.05 to 0.40. The original x value is equal to 0.23[9]. An optimization of the x parameter is realized byfinding the minimum for the � 2 per degree of freedomobtained by comparing the simulated with the measuredline shape. Figure 7 shows the behavior of the � 2 as afunction of the x parameter for the three transitionmetals. The best x value for the nickel and iron crystalis equal to 0.26 and for chromium to 0.31. The newderived potential has a form similar to the best slowingdown theories found from the analysis when the selec-tion was realized with the lifetime and � 2 per degree offreedom as criteria. The construction of the new poten-tial from the Crystal-GRID measurement is independentof the nuclear state lifetime which in some case is notknown with sufficient precision by other methods.
6. Conclusion
We have investigated the interatomic potentials forthree transition metals using the Crystal-GRID tech-nique. This new method allows one to make a selectionof the best slowing down description among a set ofinteratomic potentials and also permits to construct newpotentials. Two criteria are preponderant for this analy-sis: i) the nuclear state lifetime and the � 2 per degree offreedom which is an indication of the agreement ordisagreement between the simulated and measured lineshape. Thus of a multitude of interatomic potentials formetals, the Crystal-GRID method shows that not all ofthem are valuable in the energy domain up to a fewhundreds of eV. For this particular energy domain,where very few experiments exist, the Crystal-GRIDmethod gives an opportunity to test the veracity of theslowing down of atoms in metals. This nuclear tech-nique based on the observation of Doppler broadeningresulting from gamma emission after neutron capturealso gives lifetime value for 6 nuclear levels with a muchhigher precision than standard nuclear techniques.
Acknowledgments
This work is financed by the Swiss National ScienceFund and the ILL. The authors are grateful to Dr. A.Voter from Los Alamos National Laboratory, to Prof.M. Siebert and Dr. G. Bhuiyan, from the School ofPhysics, University of East Wenglia, United Kingdom,and to Prof. Dr. Farkas from the Department of Materi-als Sciences and Engineering, Virginia Polytechnic In-stitute, for their precious help and discussion about theembedded atom method potentials.
7. References
[1] H. G. Borner and J. Jolie, J. Phys. G 19, 217 (1993).[2] M. S. Dewey, E. G. Kessler, G. L. Greene, R. D. Deslattes, H.
G. Borner, and J. Jolie, Nucl. Instr. Meth. A 284, 151 (1989).[3] S. J. Robinson and J. Jolie, The Computer Code GRIDDLE, ILL
Internal Report RO15T, 1992.[4] M. Jentschel, K. H. Heinig, H. G. Borner, J. Jolie, and E. G.
Kessler, Nucl. Instr. Meth. B 115, 446 (1991).[5] N. Stritt, J. Jolie, M. Jentschel, H. G. Borner, and C. Doll, Phys.
Rev. B 58, 2603 (1998).[6] C. M. Baglin, Nucl. Data Sheets 69, 733 (1993).[7] M. R. Bhat, Nucl. Data Sheets 67, 195 (1992).[8] A. E. Stuchberry, I. Morrison, D. L. Kennedy, and H. H.
Bolotin, Nucl. Phys. A. 337, 1 (1980).[9] M. S. Daw and M. I. Baskes, Phys. Rev. Lett. 50, 1285 (1993).
[10] S. M. Foiles, M. I. Baskes, M. S. Daw, Phys. Rev. B 33, 7983(1986).
[11] N. Stritt, J. Jolie, M. Jentschel, H. G. Borner, and H. Lehmann,Phys. Rev. B 60, 6476 (1999).
[12] A. Abrahamson, Phys. Rev. 178, 76 (1969).[13] J. F. Ziegler, J. P. Biersack, U. Littmark, The Stopping and
Range of Ions in Solids, Pergamnon Press, New York (1985).[14] A. F. Voter and S. P. Chen, Mat. Res. Soc. Symp. Proc. 82, 175
(1987).[15] M. S. Daw and S. M. Foiles, Phys. Rev. Lett. 59, 2756 (1987).[16] A. M. Guellil and J. B. Adams, J. Mater. Res. 7, 639 (1992).[17] Y. R. Wang and D. B. Boerker, J. Appl. Phys. 78, 122 (1995).
About the authors: N. Stritt and J. Jolie are physicistsat the Universite de Fribourg. M. Jentschel is a postdoctoral fellow at ILL. H. G. Borner is Group Leaderfor Nuclear and Particle Phsyics at ILL. C. Doll is athesis student at the Technical University of Munich.
80