Embed Size (px)
Citation preview
Volume 107, Number 1, January–February 2002Journal of Research of the National Institute of Standards and Technology
[J. Res. Natl. Inst. Stand. Technol. 107, 19–62 (2002)]
The 1997 North American InteragencyIntercomparison of Ultraviolet
Spectroradiometers Including NarrowbandFilter Radiometers
Volume 107 Number 1 January–February 2002
Kathleen Lantz and Patrick DisterhoftCooperative Institute for Researchin Environmental Studies,University of Colorado, Boulder, CO 80309,USA
Edward Early and Ambler ThompsonNational Institute of Standardsand Technology,Gaithersburg, MD 20899-0001, USA
John DeLuisiNational Oceanic and AtmosphericAdministration,David Skaggs Research Bldg.,325 Broadway, Boulder, CO 80303, USA
Jerry Berndt, Lee Harrison, andPeter KiedronAtmospheric Sciences Research Center,State University of New York,Albany, 251 Fuller Road, Albany, NY 12203,USA
James Ehramjian, Germar Bernhard,Lauriana Cabasug, and James RobertsonBiospherical Instruments Inc.,5340 Riley Street, San Diego,CA 92110-2621, USA
Wanfeng Mou and Thomas TaylorNational Ultraviolet Monitoring Center,University of Georgia, Athens, GA 30602,USA
James Slusser, David Bigelow,Bill Durham, and George JansonNatural Resource Ecology Laboratory,Colorado State University, Fort Collins,CO 80523, USA
Douglass HayesSmithsonian Environmental Research Center,P.O. Box 28, Edgewater, MD 21037, USA
and
Mark Beaubien and Arthur BeaubienYankee Environmental Systems,101 Industrial Road, P.O. Box 746,Turners Falls, MA 01376, USA
[email protected]@nist.gov
The fourth North American Intercompari-son of Ultraviolet Monitoring Spectro-radiometers was held September 15 to 25,1997 at Table Mountain outside ofBoulder, Colorado, USA. Concern overstratospheric ozone depletion hasprompted several government agencies inNorth America to establish networks ofspectroradiometers for monitoring solarultraviolet irradiance at the surface of theEarth. The main purpose of the Inter-comparison was to assess the ability ofspectroradiometers to accurately measuresolar ultraviolet irradiance, and tocompare the results between instruments ofdifferent monitoring networks. ThisIntercomparison was coordinated by NISTand NOAA, and included participantsfrom the ASRC, EPA, NIST, NSF, SERC,USDA, and YES. The UV measuringinstruments included scanning spectro-radiometers, spectrographs, narrow bandmulti-filter radiometers, and broadbandradiometers. Instruments were character-ized for wavelength accuracy, bandwidth,stray-light rejection, and spectral irradi-ance responsivity. The spectral irradianceresponsivity was determined two to threetimes outdoors to assess temporal stability.Synchronized spectral scans of the solarirradiance were performed over severaldays. Using the spectral irradianceresponsivities determined with the NISTtraceable standard lamp, and a simple
convolution technique with a Gaussianslit-scattering function to account for thedifferent bandwidths of the instruments,the measured solar irradiance from thespectroradiometers excluding the filterradiometers at 16.5 h UTC had a relativestandard deviation of �4 % for wavelengthsgreater than 305 nm. The relativestandard deviation for the solar irradiance at16.5 h UTC including the filter radio-meter was �4 % for filter functions above300 nm.
Key words: environmental monitoring; in-tercomparison; solar ultraviolet; spectro-radiometers..
Accepted: August 28, 2001
Available online: http://www.nist.gov/jres
19
Volume 107, Number 1, January–February 2002Journal of Research of the National Institute of Standards and Technology
Dedicated to the Fond Memory of Douglass Hayes andDavid Bigelow.
1. Introduction
Concern over the effects of changes in solar ultra-violet (UV) radiation on biological ecosystems, humans,and materials has prompted several government agen-cies in North America to develop UV MonitoringNetworks and research programs to address the currentand long-term impacts of these changes [1, 2].Detecting long-term trends in solar ultraviolet irradiancerequires accurate measurements of the absoluteirradiance, for individual instruments, for an entirenetwork, and between networks [3].
The North American Interagency Intercompari-sons of Ultraviolet Monitoring Spectroradiometers areperformed near Boulder, Colorado, to assess the abilityof spectroradiometers to accurately measure solar ultra-violet irradiance and to compare these results betweeninstruments of different monitoring networks on anannual or bi-annual basis. The first such Intercompari-son was held September 19 to 29, 1994; the secondIntercomparison was held June 12 to 23, 1995; and thethird Intercomparison was held June 15 to 25, 1996. Theexperimental details and results from these efforts havebeen described previously [4, 5, 6]. Results from thefourth Intercomparison, held September 17 to 25, 1997,are presented here. This Intercomparison was co-ordinated by the Optical Technology Division of theNational Institute of Standards and Technology (NIST)and the Surface Radiation Research Branch (SRRB) ofthe National Oceanic and Atmospheric Administration(NOAA). The following agencies and organizationsparticipated: the National UV Monitoring Center(NUVMC) at the University of Georgia which adminis-ters the Environmental Protection Agency’s (EPA) UVNetwork, the National Institute of Standards and Tech-nology (NIST), Biospherical Instruments which admin-isters the National Science Foundation’s (NSF) UVMonitoring Network for Polar Regions, the SmithsonianEnvironmental Research Center (SERC), the NaturalResource Ecology Laboratory (NREL) of ColoradoState University (CSU) which administers the Department of Agriculture’s (USDA) UV Monitoring Net-work [7], the Atmospheric Sciences Research Center(ASRC) of the State University of New York (SUNY)which represents the USDA monitoring program, and
Yankee Environmental Systems, Inc. (YES) whichmanufacturers a variety of UV instruments used in UVmonitoring networks and for atmospheric UV research.A list of attendees is given in Appendix A.
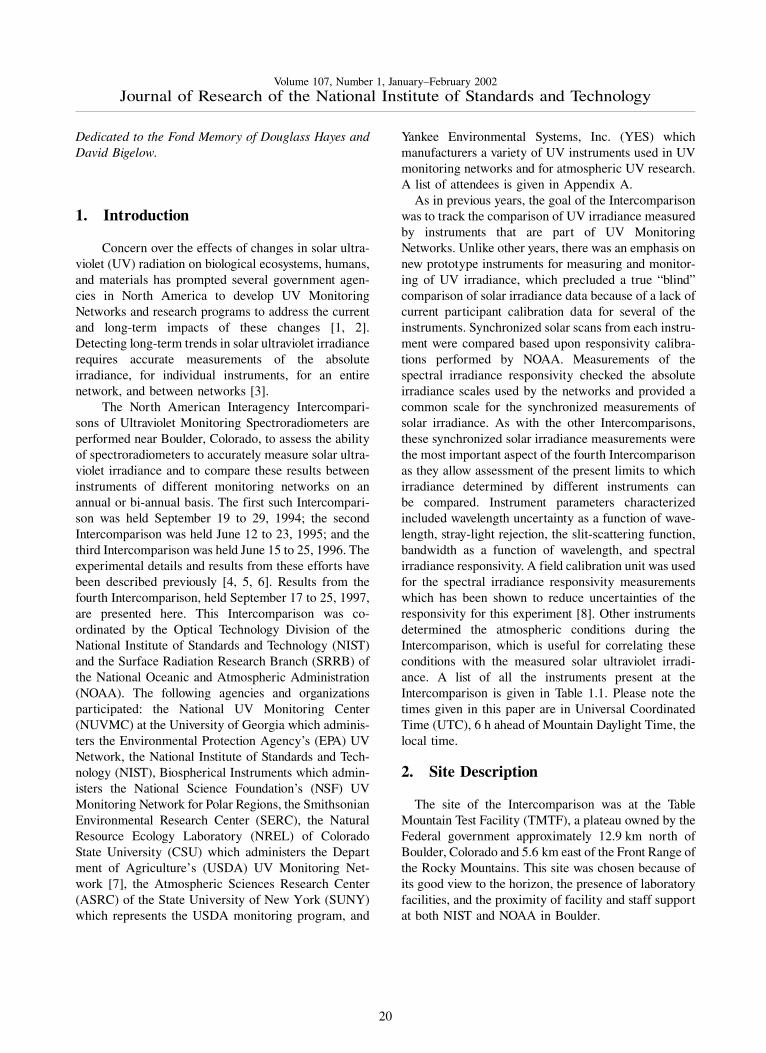
As in previous years, the goal of the Intercomparisonwas to track the comparison of UV irradiance measuredby instruments that are part of UV MonitoringNetworks. Unlike other years, there was an emphasis onnew prototype instruments for measuring and monitor-ing of UV irradiance, which precluded a true “blind”comparison of solar irradiance data because of a lack ofcurrent participant calibration data for several of theinstruments. Synchronized solar scans from each instru-ment were compared based upon responsivity calibra-tions performed by NOAA. Measurements of thespectral irradiance responsivity checked the absoluteirradiance scales used by the networks and provided acommon scale for the synchronized measurements ofsolar irradiance. As with the other Intercomparisons,these synchronized solar irradiance measurements werethe most important aspect of the fourth Intercomparisonas they allow assessment of the present limits to whichirradiance determined by different instruments canbe compared. Instrument parameters characterizedincluded wavelength uncertainty as a function of wave-length, stray-light rejection, the slit-scattering function,bandwidth as a function of wavelength, and spectralirradiance responsivity. A field calibration unit was usedfor the spectral irradiance responsivity measurementswhich has been shown to reduce uncertainties of theresponsivity for this experiment [8]. Other instrumentsdetermined the atmospheric conditions during theIntercomparison, which is useful for correlating theseconditions with the measured solar ultraviolet irradi-ance. A list of all the instruments present at theIntercomparison is given in Table 1.1. Please note thetimes given in this paper are in Universal CoordinatedTime (UTC), 6 h ahead of Mountain Daylight Time, thelocal time.
2. Site Description
The site of the Intercomparison was at the TableMountain Test Facility (TMTF), a plateau owned by theFederal government approximately 12.9 km north ofBoulder, Colorado and 5.6 km east of the Front Range ofthe Rocky Mountains. This site was chosen because ofits good view to the horizon, the presence of laboratoryfacilities, and the proximity of facility and staff supportat both NIST and NOAA in Boulder.
20
Volume 107, Number 1, January–February 2002Journal of Research of the National Institute of Standards and Technology
For the synchronized measurements of solar irradi-ance, the spectroradiometers except the UV-Multi FilterRotating Shadowband Radiometers (UV-MFRSR) werelocated on individual concrete pads on the south side ofthe plateau at latitude 40.125� N, longitude 105.237� W,and elevation 1689 m. The pads were arranged inan east-west line and were 2.4 m square and 12.2 mbetween centers. The UV-MFRSRs were located atNOAA/SRRB’s site on an elevated platform 50 m to thewest of the pads. The highest, and only major, obstruc-tion to the horizon was a peak 5.6 km due west of thepads with a 5.1� angle of inclination. Temporary trailersapproximately 30 m south of the pads housed the dataacquisition and control computers and equipment for thespectroradiometers. The plateau has a downward slopeto the south of the pads, so the tops of the trailers werebelow the elevation of the pads. At the Intercomparison,pyranometers, pyrgeometers, UVB radiometers,shadowband radiometers and a total sky imager (TSI)were located on the platform. A meteorological tower,
Table 1.1. Instruments present during the 1997 North American Interagency Intercomparison of UltravioletMonitoring Spectroradiometers
Agency Label Participating spectroradiometers Serial no. Purpose
EPA EPA_101 Sci-Tec Brewer MKIV 101 MonitoringEPA EPA_114 Sci-Tec Brewer MKIV 114 MonitoringNIST NIST RSI CalibrationNSF NSF_SUV BSI SUV-150 11-002 MonitoringSERC SERC SERC SR-18 UI MonitoringUSDA USDA_U1K U1000 Spectroradiometer Monitoring/CalibrationASRC ASRC_RSS UV-RSS Spectrograph 104 Research/MonitoringUSDA USDA_270 UV-MFRSR 270 MonitoringUSDA USDA_386 UV-MFRSR 386 MonitoringUSDA USDA_387 UV-MFRSR 387 MonitoringYES YES_RSS UV-RSS Spectrograph Research/Monitoring
Ancillary Measurements
Instrument Serial no.
Yankee UVB-1 Radiometer 940401Yankee UVB-1 Radiometer 940402Yankee UVB-1 Radiometer 940404Solar Light UV-Biometer 1916Solar Light UV-Biometer 2004Solar Light UV-Biometer 2005Li-Cor Photosynthetically Active Radiation Sensor (PAR) Q22666Normal Incidence Pryheliometer (NIP) 30399Spectrosun Precision Solar Pyranometer (Downwelling) 73-88Spectrosun Precison Solar Pyranometer (Upwelling) 73-82Eppley Precison Infrared Pyrgeometer (Downwelling) 31609F3Eppley Precison Infrared Pyrgeometer (Upwelling) 31608F3Total Sky Imager (TSI)
Meteorological Instruments
Measurement Instrument
Temperature and Relative Humidty Vaisala �R2410094Barometric pressure Vaisala P173002
recording the temperature, relative humidity,atmospheric pressure, and wind speed and direction atthe site was located approximately 90 m north-west ofthe pads. Finally, a concrete building immediately to thesouthwest of the platform was used for servicing theinstruments and holding meetings. A dome at thewestern end of the building was covered with a blackcloth to eliminate reflections from it to the instruments.
3. Instrument Descriptions
For clarity in this paper, spectroradiometers referto instruments capable of measuring irradiance atparticular spectral wavelengths and includes thescanning instruments, the spectrograph instruments, andthe narrow-band filter instruments [9]. In total, elevenUV measuring spectroradiometers participated at theIntercomparison. Six scanning spectroradiometersparticipated at the Intercomparison. These included two
21
Volume 107, Number 1, January–February 2002Journal of Research of the National Institute of Standards and Technology
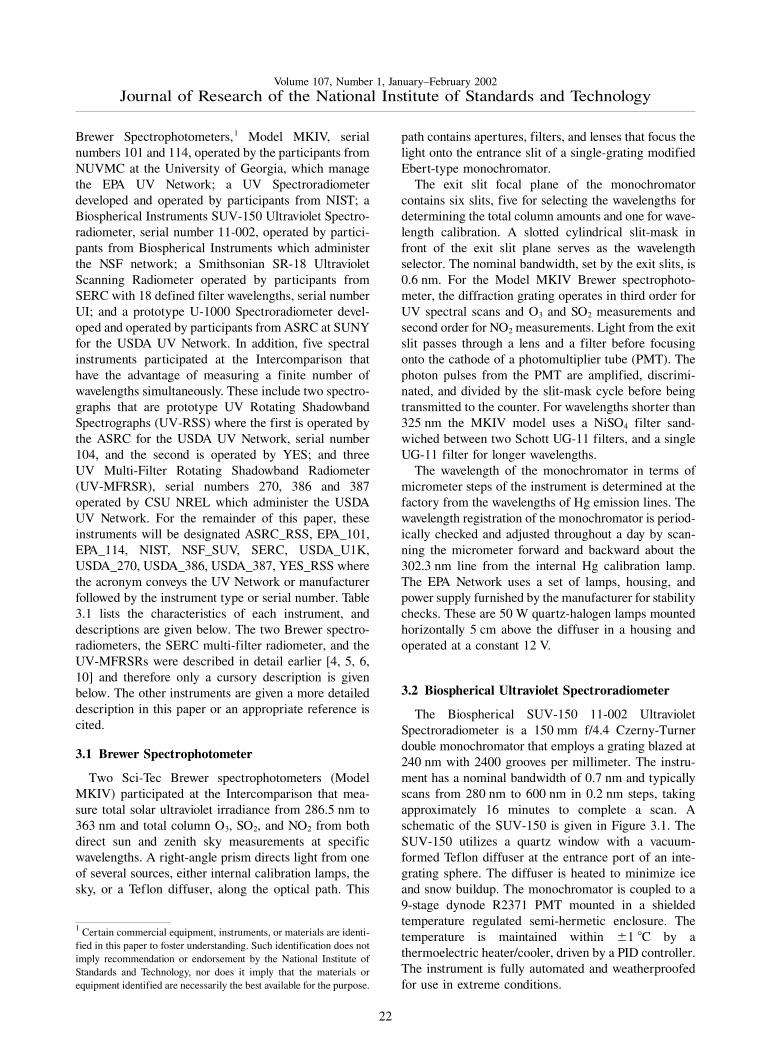
Brewer Spectrophotometers,1 Model MKIV, serialnumbers 101 and 114, operated by the participants fromNUVMC at the University of Georgia, which managethe EPA UV Network; a UV Spectroradiometerdeveloped and operated by participants from NIST; aBiospherical Instruments SUV-150 Ultraviolet Spectro-radiometer, serial number 11-002, operated by partici-pants from Biospherical Instruments which administerthe NSF network; a Smithsonian SR-18 UltravioletScanning Radiometer operated by participants fromSERC with 18 defined filter wavelengths, serial numberUI; and a prototype U-1000 Spectroradiometer devel-oped and operated by participants from ASRC at SUNYfor the USDA UV Network. In addition, five spectralinstruments participated at the Intercomparison thathave the advantage of measuring a finite number ofwavelengths simultaneously. These include two spectro-graphs that are prototype UV Rotating ShadowbandSpectrographs (UV-RSS) where the first is operated bythe ASRC for the USDA UV Network, serial number104, and the second is operated by YES; and threeUV Multi-Filter Rotating Shadowband Radiometer(UV-MFRSR), serial numbers 270, 386 and 387operated by CSU NREL which administer the USDAUV Network. For the remainder of this paper, theseinstruments will be designated ASRC_RSS, EPA_101,EPA_114, NIST, NSF_SUV, SERC, USDA_U1K,USDA_270, USDA_386, USDA_387, YES_RSS wherethe acronym conveys the UV Network or manufacturerfollowed by the instrument type or serial number. Table3.1 lists the characteristics of each instrument, anddescriptions are given below. The two Brewer spectro-radiometers, the SERC multi-filter radiometer, and theUV-MFRSRs were described in detail earlier [4, 5, 6,10] and therefore only a cursory description is givenbelow. The other instruments are given a more detaileddescription in this paper or an appropriate reference iscited.
3.1 Brewer Spectrophotometer
Two Sci-Tec Brewer spectrophotometers (ModelMKIV) participated at the Intercomparison that mea-sure total solar ultraviolet irradiance from 286.5 nm to363 nm and total column O3, SO2, and NO2 from bothdirect sun and zenith sky measurements at specificwavelengths. A right-angle prism directs light from oneof several sources, either internal calibration lamps, thesky, or a Teflon diffuser, along the optical path. This
1 Certain commercial equipment, instruments, or materials are identi-fied in this paper to foster understanding. Such identification does notimply recommendation or endorsement by the National Institute ofStandards and Technology, nor does it imply that the materials orequipment identified are necessarily the best available for the purpose.
path contains apertures, filters, and lenses that focus thelight onto the entrance slit of a single-grating modifiedEbert-type monochromator.
The exit slit focal plane of the monochromatorcontains six slits, five for selecting the wavelengths fordetermining the total column amounts and one for wave-length calibration. A slotted cylindrical slit-mask infront of the exit slit plane serves as the wavelengthselector. The nominal bandwidth, set by the exit slits, is0.6 nm. For the Model MKIV Brewer spectrophoto-meter, the diffraction grating operates in third order forUV spectral scans and O3 and SO2 measurements andsecond order for NO2 measurements. Light from the exitslit passes through a lens and a filter before focusingonto the cathode of a photomultiplier tube (PMT). Thephoton pulses from the PMT are amplified, discrimi-nated, and divided by the slit-mask cycle before beingtransmitted to the counter. For wavelengths shorter than325 nm the MKIV model uses a NiSO4 filter sand-wiched between two Schott UG-11 filters, and a singleUG-11 filter for longer wavelengths.
The wavelength of the monochromator in terms ofmicrometer steps of the instrument is determined at thefactory from the wavelengths of Hg emission lines. Thewavelength registration of the monochromator is period-ically checked and adjusted throughout a day by scan-ning the micrometer forward and backward about the302.3 nm line from the internal Hg calibration lamp.The EPA Network uses a set of lamps, housing, andpower supply furnished by the manufacturer for stabilitychecks. These are 50 W quartz-halogen lamps mountedhorizontally 5 cm above the diffuser in a housing andoperated at a constant 12 V.
3.2 Biospherical Ultraviolet Spectroradiometer
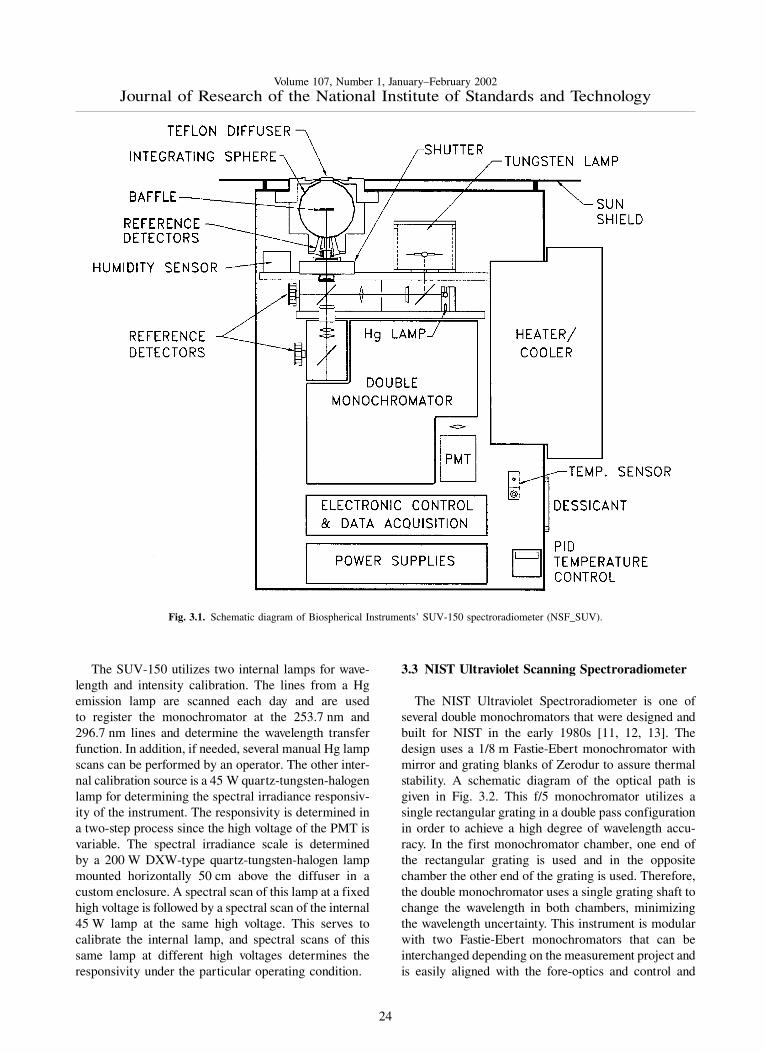
The Biospherical SUV-150 11-002 UltravioletSpectroradiometer is a 150 mm f/4.4 Czerny-Turnerdouble monochromator that employs a grating blazed at240 nm with 2400 grooves per millimeter. The instru-ment has a nominal bandwidth of 0.7 nm and typicallyscans from 280 nm to 600 nm in 0.2 nm steps, takingapproximately 16 minutes to complete a scan. Aschematic of the SUV-150 is given in Figure 3.1. TheSUV-150 utilizes a quartz window with a vacuum-formed Teflon diffuser at the entrance port of an inte-grating sphere. The diffuser is heated to minimize iceand snow buildup. The monochromator is coupled to a9-stage dynode R2371 PMT mounted in a shieldedtemperature regulated semi-hermetic enclosure. Thetemperature is maintained within �1 �C by athermoelectric heater/cooler, driven by a PID controller.The instrument is fully automated and weatherproofedfor use in extreme conditions.
22
Volume 107, Number 1, January–February 2002Journal of Research of the National Institute of Standards and Technology
23
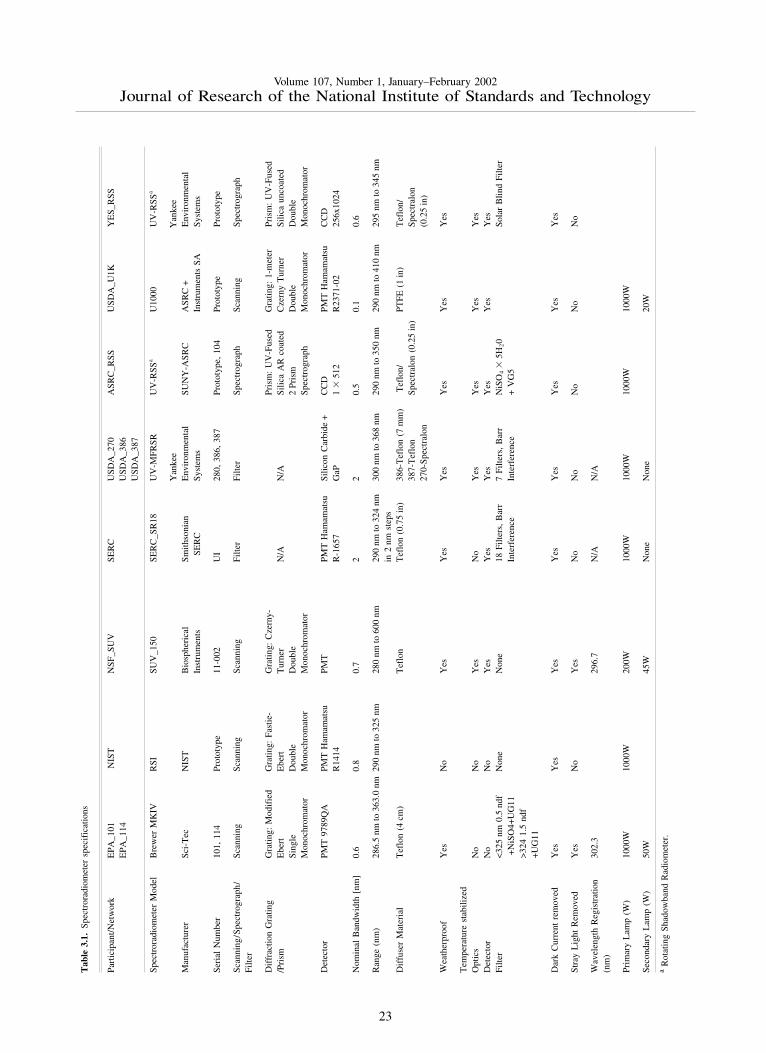
Tab
le3.
1.Sp
ectr
orad
iom
eter
spec
ific
atio
ns
Part
icip
ant/N
etw
ork
EPA
_101
NIS
TN
SF_S
UV
SER
CU
SDA
_270
ASR
C_R
SSU
SDA
_U1K
YE
S_R
SSE
PA_1
14U
SDA
_386
USD
A_3
87
Spec
tror
adio
met
erM
odel
Bre
wer
MK
IVR
SISU
V_1
50SE
RC
_SR
18U
V-M
FRSR
UV
-RSS
aU
1000
UV
-RSS
a
Yan
kee
Yan
kee
Man
ufac
ture
rSc
i-T
ecN
IST
Bio
sphe
rica
lSm
ithso
nian
Env
iron
men
tal
SUN
Y-A
SRC
ASR
C+
Env
iron
men
tal
Inst
rum
ents
SER
CSy
stem
sIn
stru
men
tsSA
Syst
ems
Seri
alN
umbe
r10
1,11
4Pr
otot
ype
11-0
02U
I28
0,38
6,38
7Pr
otot
ype,
104
Prot
otyp
ePr
otot
ype
Scan
ning
/Spe
ctro
grap
h/
Scan
ning
Scan
ning
Scan
ning
Filte
rFi
lter
Spec
trog
raph
Scan
ning
Spec
trog
raph
Filte
r
Dif
frac
tion
Gra
ting
Gra
ting:
Mod
ifie
dG
ratin
g:Fa
stie
-G
ratin
g:C
zern
y-Pr
ism
:U
V-F
used
Gra
ting:
1-m
eter
Pris
m:
UV
-Fus
ed/P
rism
Ebe
rtE
bert
Tur
ner
N/A
N/A
Silic
aA
Rco
ated
Cze
rny
Tur
ner
Silic
aun
coat
edSi
ngle
Dou
ble
Dou
ble
2Pr
ism
Dou
ble
Dou
ble
Mon
ochr
omat
orM
onoc
hrom
ator
Mon
ochr
omat
orSp
ectr
ogra
phM
onoc
hrom
ator
Mon
ochr
omat
or
Det
ecto
rPM
T97
89Q
APM
TH
amam
atsu
PMT
PMT
Ham
amat
suSi
licon
Car
bide
+C
CD
PMT
Ham
amat
suC
CD
R14
14R
-165
7G
aP1
�51
2R
2371
-02
256x
1024
Nom
inal
Ban
dwid
th[n
m]
0.6
0.8
0.7
22
0.5
0.1
0.6
Ran
ge(n
m)
286.
5nm
to36
3.0
nm29
0nm
to32
5nm
280
nmto
600
nm29
0nm
to32
4nm
300
nmto
368
nm29
0nm
to35
0nm
290
nmto
410
nm29
5nm
to34
5nm
in2
nmst
eps
Dif
fuse
rM
ater
ial
Tef
lon
(4cm
)T
eflo
nT
eflo
n(0
.75
in)
386-
Tef
lon
(7m
m)
Tef
lon/
PTFE
(1in
)T
eflo
n/38
7-T
eflo
nSp
ectr
alon
(0.2
5in
)Sp
ectr
alon
270-
Spec
tral
on(0
.25
in)
Wea
ther
proo
fY
esN
oY
esY
esY
esY
esY
esY
es
Tem
pera
ture
stab
ilize
dO
ptic
sN
oN
oY
esN
oY
esY
esY
esY
esD
etec
tor
No
No
Yes
Yes
Yes
Yes
Yes
Yes
Filte
r<
325
nm0.
5nd
fN
one
Non
e18
Filte
rs,
Bar
r7
Filte
rs,
Bar
rN
iSO
4�
5H20
Sola
rB
lind
Filte
r+
NiS
O4+
UG
11In
terf
eren
ceIn
terf
eren
ce+
VG
5>
324
1.5
ndf
+U
G11
Dar
kC
urre
ntre
mov
edY
esY
esY
esY
esY
esY
esY
esY
es
Stra
yL
ight
Rem
oved
Yes
No
Yes
No
No
No
No
No
Wav
elen
gth
Reg
istr
atio
n30
2.3
296.
7N
/AN
/A(n
m)
Prim
ary
Lam
p(W
)10
00W
1000
W20
0W10
00W
1000
W10
00W
1000
W
Seco
ndar
yL
amp
(W)
50W
45W
Non
eN
one
20W
aR
otat
ing
Shad
owba
ndR
adio
met
er.
Volume 107, Number 1, January–February 2002Journal of Research of the National Institute of Standards and Technology
The SUV-150 utilizes two internal lamps for wave-length and intensity calibration. The lines from a Hgemission lamp are scanned each day and are usedto register the monochromator at the 253.7 nm and296.7 nm lines and determine the wavelength transferfunction. In addition, if needed, several manual Hg lampscans can be performed by an operator. The other inter-nal calibration source is a 45 W quartz-tungsten-halogenlamp for determining the spectral irradiance responsiv-ity of the instrument. The responsivity is determined ina two-step process since the high voltage of the PMT isvariable. The spectral irradiance scale is determinedby a 200 W DXW-type quartz-tungsten-halogen lampmounted horizontally 50 cm above the diffuser in acustom enclosure. A spectral scan of this lamp at a fixedhigh voltage is followed by a spectral scan of the internal45 W lamp at the same high voltage. This serves tocalibrate the internal lamp, and spectral scans of thissame lamp at different high voltages determines theresponsivity under the particular operating condition.
3.3 NIST Ultraviolet Scanning Spectroradiometer
The NIST Ultraviolet Spectroradiometer is one ofseveral double monochromators that were designed andbuilt for NIST in the early 1980s [11, 12, 13]. Thedesign uses a 1/8 m Fastie-Ebert monochromator withmirror and grating blanks of Zerodur to assure thermalstability. A schematic diagram of the optical path isgiven in Fig. 3.2. This f/5 monochromator utilizes asingle rectangular grating in a double pass configurationin order to achieve a high degree of wavelength accu-racy. In the first monochromator chamber, one end ofthe rectangular grating is used and in the oppositechamber the other end of the grating is used. Therefore,the double monochromator uses a single grating shaft tochange the wavelength in both chambers, minimizingthe wavelength uncertainty. This instrument is modularwith two Fastie-Ebert monochromators that can beinterchanged depending on the measurement project andis easily aligned with the fore-optics and control and
Fig. 3.1. Schematic diagram of Biospherical Instruments’ SUV-150 spectroradiometer (NSF_SUV).
24
Volume 107, Number 1, January–February 2002Journal of Research of the National Institute of Standards and Technology
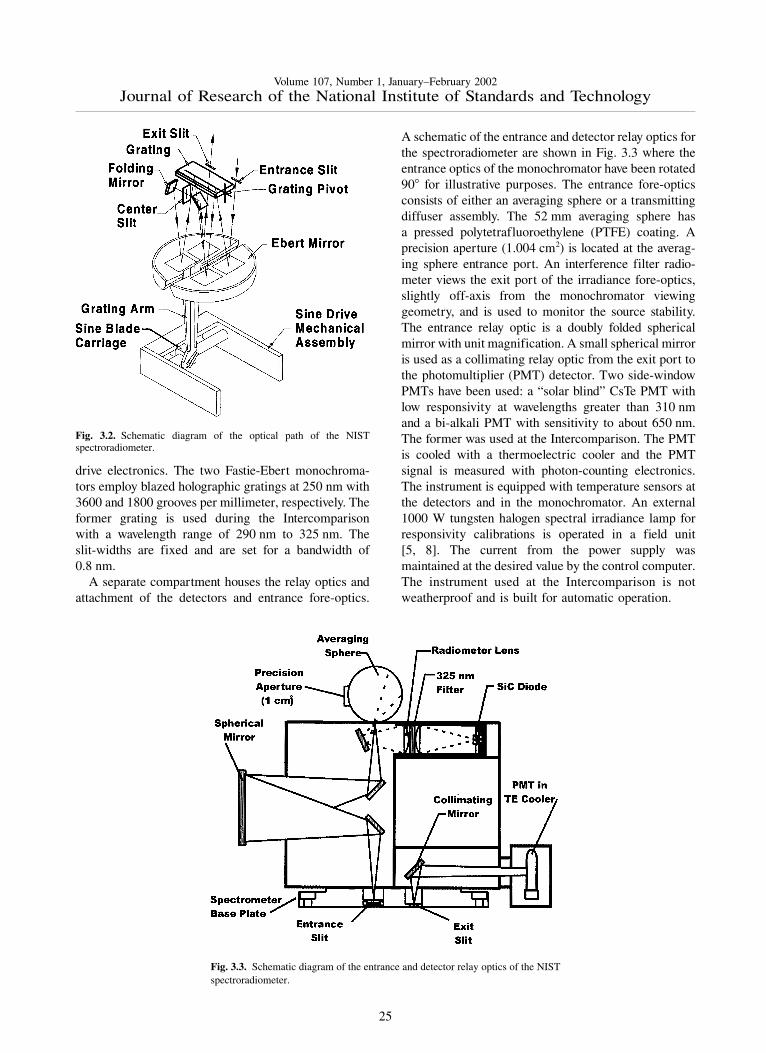
drive electronics. The two Fastie-Ebert monochroma-tors employ blazed holographic gratings at 250 nm with3600 and 1800 grooves per millimeter, respectively. Theformer grating is used during the Intercomparisonwith a wavelength range of 290 nm to 325 nm. Theslit-widths are fixed and are set for a bandwidth of0.8 nm.
A separate compartment houses the relay optics andattachment of the detectors and entrance fore-optics.
A schematic of the entrance and detector relay optics forthe spectroradiometer are shown in Fig. 3.3 where theentrance optics of the monochromator have been rotated90� for illustrative purposes. The entrance fore-opticsconsists of either an averaging sphere or a transmittingdiffuser assembly. The 52 mm averaging sphere hasa pressed polytetrafluoroethylene (PTFE) coating. Aprecision aperture (1.004 cm2) is located at the averag-ing sphere entrance port. An interference filter radio-meter views the exit port of the irradiance fore-optics,slightly off-axis from the monochromator viewinggeometry, and is used to monitor the source stability.The entrance relay optic is a doubly folded sphericalmirror with unit magnification. A small spherical mirroris used as a collimating relay optic from the exit port tothe photomultiplier (PMT) detector. Two side-windowPMTs have been used: a “solar blind” CsTe PMT withlow responsivity at wavelengths greater than 310 nmand a bi-alkali PMT with sensitivity to about 650 nm.The former was used at the Intercomparison. The PMTis cooled with a thermoelectric cooler and the PMTsignal is measured with photon-counting electronics.The instrument is equipped with temperature sensors atthe detectors and in the monochromator. An external1000 W tungsten halogen spectral irradiance lamp forresponsivity calibrations is operated in a field unit[5, 8]. The current from the power supply wasmaintained at the desired value by the control computer.The instrument used at the Intercomparison is notweatherproof and is built for automatic operation.
Fig. 3.2. Schematic diagram of the optical path of the NISTspectroradiometer.
Fig. 3.3. Schematic diagram of the entrance and detector relay optics of the NISTspectroradiometer.
25
Volume 107, Number 1, January–February 2002Journal of Research of the National Institute of Standards and Technology
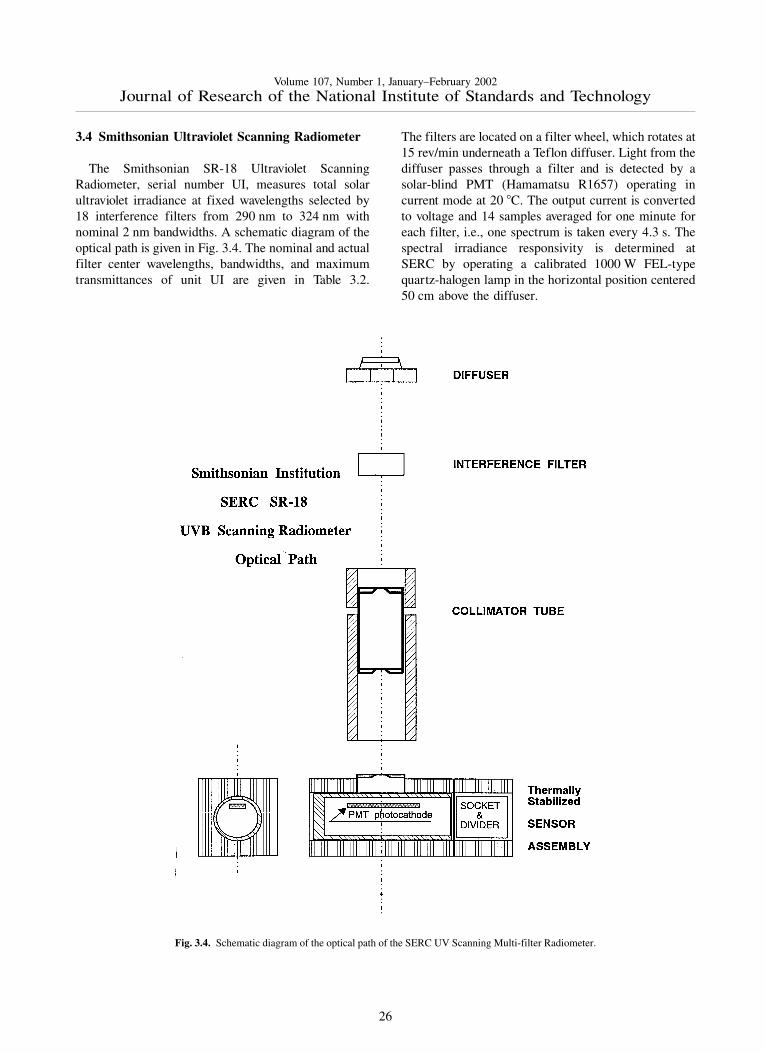
3.4 Smithsonian Ultraviolet Scanning Radiometer
The Smithsonian SR-18 Ultraviolet ScanningRadiometer, serial number UI, measures total solarultraviolet irradiance at fixed wavelengths selected by18 interference filters from 290 nm to 324 nm withnominal 2 nm bandwidths. A schematic diagram of theoptical path is given in Fig. 3.4. The nominal and actualfilter center wavelengths, bandwidths, and maximumtransmittances of unit UI are given in Table 3.2.
The filters are located on a filter wheel, which rotates at15 rev/min underneath a Teflon diffuser. Light from thediffuser passes through a filter and is detected by asolar-blind PMT (Hamamatsu R1657) operating incurrent mode at 20 �C. The output current is convertedto voltage and 14 samples averaged for one minute foreach filter, i.e., one spectrum is taken every 4.3 s. Thespectral irradiance responsivity is determined atSERC by operating a calibrated 1000 W FEL-typequartz-halogen lamp in the horizontal position centered50 cm above the diffuser.
Fig. 3.4. Schematic diagram of the optical path of the SERC UV Scanning Multi-filter Radiometer.
26
Volume 107, Number 1, January–February 2002Journal of Research of the National Institute of Standards and Technology
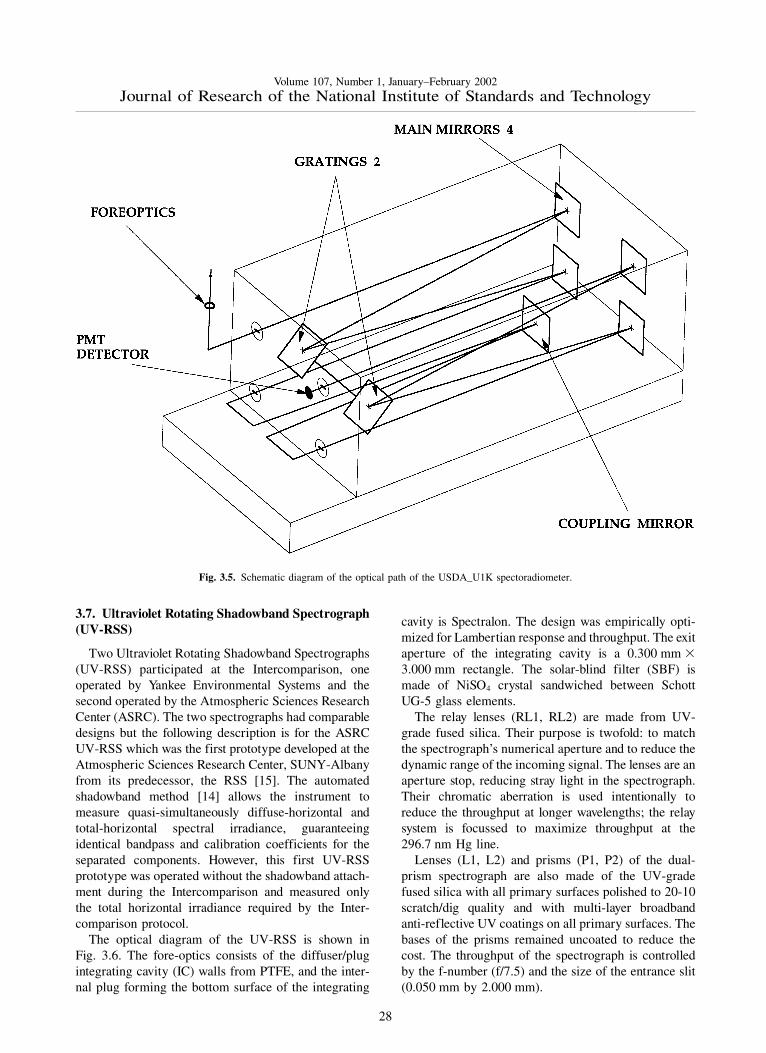
3.5. USDA/ASRC U1000 UltravioletSpectroradiometer
The USDA reference Ultraviolet Spectroradiometer isa recent prototype design built by ASRC andInstruments SA for use in the USDA UV/BiosphereNetwork. The monochromator is a 1-meter doubleCzerny-Turner design with an ion-etched holographicgrating operated in first order with 3600 lines per mm.The optical path is given in Fig. 3.5. The detector is aHamamatsu R2371-02 PMT with an ASRC-developeddual-threshold photon counting system with a maximumsynchronous counting capability of 600 MHz. Thewavelength range extends from 290 nm to 410 nm. Thenominal bandwidth is 0.1 nm and the instrument canoperate with a step-size of 0.0005 nm/step and a FWHMof 0.01 nm, preserving a triangular slit function andcommensurate throughput if carefully aligned. Theinstrument is capable of an out-of-band rejection ratio ofapproximately 10–10. The measurements at short wave-lengths are limited by dark signal and integration timerather than stray light. At wavelengths greater than295 nm, the uncertainty in the signal given by Poissonstatistics is less than 5 %, and less than 1 % beyond299 nm. The diffuser material is PTFE with a diameterof 2.54 cm. Because this instrument is designed for use
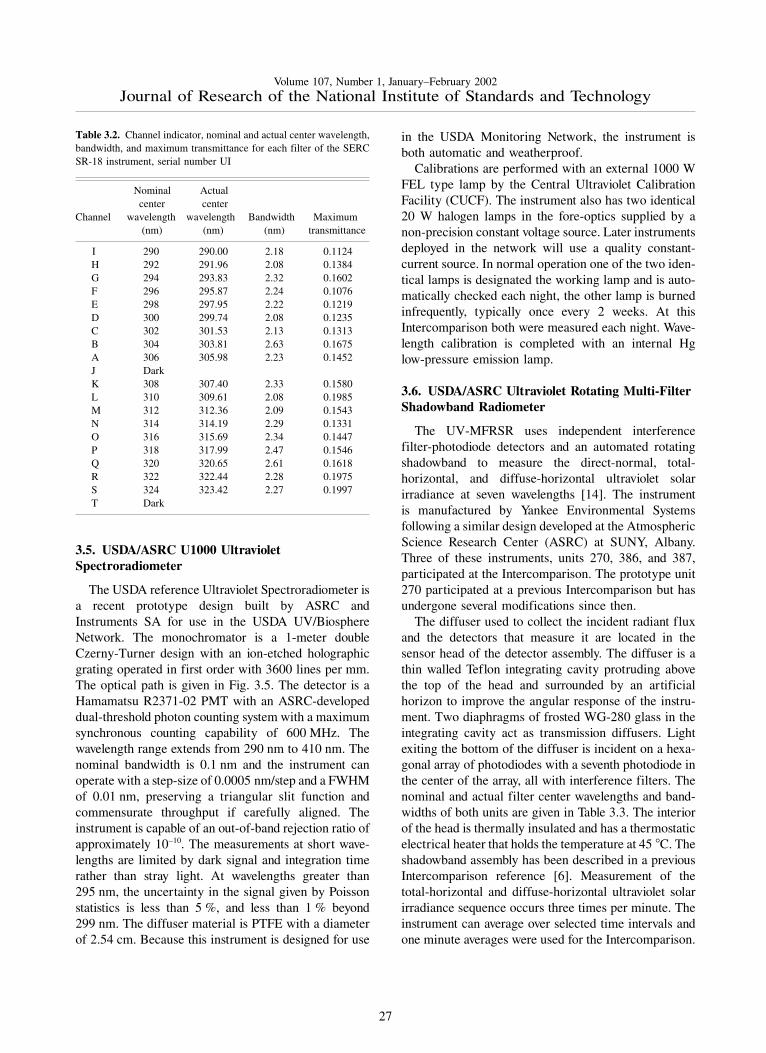
Table 3.2. Channel indicator, nominal and actual center wavelength,bandwidth, and maximum transmittance for each filter of the SERCSR-18 instrument, serial number UI
Nominal Actualcenter center
Channel wavelength wavelength Bandwidth Maximum(nm) (nm) (nm) transmittance
I 290 290.00 2.18 0.1124H 292 291.96 2.08 0.1384G 294 293.83 2.32 0.1602F 296 295.87 2.24 0.1076E 298 297.95 2.22 0.1219D 300 299.74 2.08 0.1235C 302 301.53 2.13 0.1313B 304 303.81 2.63 0.1675A 306 305.98 2.23 0.1452J DarkK 308 307.40 2.33 0.1580L 310 309.61 2.08 0.1985M 312 312.36 2.09 0.1543N 314 314.19 2.29 0.1331O 316 315.69 2.34 0.1447P 318 317.99 2.47 0.1546Q 320 320.65 2.61 0.1618R 322 322.44 2.28 0.1975S 324 323.42 2.27 0.1997T Dark
in the USDA Monitoring Network, the instrument isboth automatic and weatherproof.
Calibrations are performed with an external 1000 WFEL type lamp by the Central Ultraviolet CalibrationFacility (CUCF). The instrument also has two identical20 W halogen lamps in the fore-optics supplied by anon-precision constant voltage source. Later instrumentsdeployed in the network will use a quality constant-current source. In normal operation one of the two iden-tical lamps is designated the working lamp and is auto-matically checked each night, the other lamp is burnedinfrequently, typically once every 2 weeks. At thisIntercomparison both were measured each night. Wave-length calibration is completed with an internal Hglow-pressure emission lamp.
3.6. USDA/ASRC Ultraviolet Rotating Multi-FilterShadowband Radiometer
The UV-MFRSR uses independent interferencefilter-photodiode detectors and an automated rotatingshadowband to measure the direct-normal, total-horizontal, and diffuse-horizontal ultraviolet solarirradiance at seven wavelengths [14]. The instrumentis manufactured by Yankee Environmental Systemsfollowing a similar design developed at the AtmosphericScience Research Center (ASRC) at SUNY, Albany.Three of these instruments, units 270, 386, and 387,participated at the Intercomparison. The prototype unit270 participated at a previous Intercomparison but hasundergone several modifications since then.
The diffuser used to collect the incident radiant fluxand the detectors that measure it are located in thesensor head of the detector assembly. The diffuser is athin walled Teflon integrating cavity protruding abovethe top of the head and surrounded by an artificialhorizon to improve the angular response of the instru-ment. Two diaphragms of frosted WG-280 glass in theintegrating cavity act as transmission diffusers. Lightexiting the bottom of the diffuser is incident on a hexa-gonal array of photodiodes with a seventh photodiode inthe center of the array, all with interference filters. Thenominal and actual filter center wavelengths and band-widths of both units are given in Table 3.3. The interiorof the head is thermally insulated and has a thermostaticelectrical heater that holds the temperature at 45 �C. Theshadowband assembly has been described in a previousIntercomparison reference [6]. Measurement of thetotal-horizontal and diffuse-horizontal ultraviolet solarirradiance sequence occurs three times per minute. Theinstrument can average over selected time intervals andone minute averages were used for the Intercomparison.
27
Volume 107, Number 1, January–February 2002Journal of Research of the National Institute of Standards and Technology
3.7. Ultraviolet Rotating Shadowband Spectrograph(UV-RSS)
Two Ultraviolet Rotating Shadowband Spectrographs(UV-RSS) participated at the Intercomparison, oneoperated by Yankee Environmental Systems and thesecond operated by the Atmospheric Sciences ResearchCenter (ASRC). The two spectrographs had comparabledesigns but the following description is for the ASRCUV-RSS which was the first prototype developed at theAtmospheric Sciences Research Center, SUNY-Albanyfrom its predecessor, the RSS [15]. The automatedshadowband method [14] allows the instrument tomeasure quasi-simultaneously diffuse-horizontal andtotal-horizontal spectral irradiance, guaranteeingidentical bandpass and calibration coefficients for theseparated components. However, this first UV-RSSprototype was operated without the shadowband attach-ment during the Intercomparison and measured onlythe total horizontal irradiance required by the Inter-comparison protocol.
The optical diagram of the UV-RSS is shown inFig. 3.6. The fore-optics consists of the diffuser/plugintegrating cavity (IC) walls from PTFE, and the inter-nal plug forming the bottom surface of the integrating
cavity is Spectralon. The design was empirically opti-mized for Lambertian response and throughput. The exitaperture of the integrating cavity is a 0.300 mm �3.000 mm rectangle. The solar-blind filter (SBF) ismade of NiSO4 crystal sandwiched between SchottUG-5 glass elements.
The relay lenses (RL1, RL2) are made from UV-grade fused silica. Their purpose is twofold: to matchthe spectrograph’s numerical aperture and to reduce thedynamic range of the incoming signal. The lenses are anaperture stop, reducing stray light in the spectrograph.Their chromatic aberration is used intentionally toreduce the throughput at longer wavelengths; the relaysystem is focussed to maximize throughput at the296.7 nm Hg line.
Lenses (L1, L2) and prisms (P1, P2) of the dual-prism spectrograph are also made of the UV-gradefused silica with all primary surfaces polished to 20-10scratch/dig quality and with multi-layer broadbandanti-reflective UV coatings on all primary surfaces. Thebases of the prisms remained uncoated to reduce thecost. The throughput of the spectrograph is controlledby the f-number (f/7.5) and the size of the entrance slit(0.050 mm by 2.000 mm).
Fig. 3.5. Schematic diagram of the optical path of the USDA_U1K spectoradiometer.
28

Volume 107, Number 1, January–February 2002Journal of Research of the National Institute of Standards and Technology
Table 3.3. Channel indicator, nominal and actual center wavelength,and bandwidth for each filter of USDA instruments 270, 386AND 387
Nominal center Actual centerChannel wavelength wavelength Bandwidth
(nm) (nm) (nm)
Unit 270
0 300 299.73 2.311 305 305.42 2.152 311 311.47 2.283 317 317.65 2.184 325 325.48 1.895 332 332.46 2.036 368 367.78 1.71
Unit 386
0 300 300.36 2.131 305 305.84 2.232 311 311.90 2.433 317 318.25 2.244 325 326.01 1.885 332 332.93 2.146 368 368.44 1.76
Unit 387
0 300 300.37 2.171 305 305.69 2.232 311 311.81 2.393 317 318.20 2.204 325 325.94 1.855 332 333.04 2.136 368 368.41 1.81
This prototype used a relatively noisy metal-oxide-semiconductor (MOS) linear detector array fromHamamatsu with 512 pixels (0.025mm � 2.500mm).This is far from optimum for the UV, but was availableand well tested at the time. Subsequently, both standardand UV-RSS instruments use astronomical-grade1024 � 256 CCD arrays. The wavelength range is deter-mined by the size of the detector array and magnifi-cation of the spectrograph optics. In the UV-RSS, pixel1 corresponds to 295.8 nm and pixel 512 to 348.8 nm.Later UV instruments with the 1024 � 256 CCD arraysspan the range 288 nm to beyond 360 nm. The exposurefor the UV-RSS was set to 10 s. Each measurementcycle consisted of one open-shutter (SH) 10 s exposurefollowed by one closed-shutter 10 s exposure to measuredark signal. After adding the readout time and datatransfer time, the total horizontal irradiance at 512adjacent wavelengths was acquired every 27.12 s.
The fore-optics and spectrograph are dry-air purgedand temperature stabilized. The former prevents damageto optics and the detector array and the latter improvesdark signal and wavelength stability. Wavelength shiftsare driven chiefly by the temperature of the prism,thermal stress on the fore-optics, and the air densitywithin the spectrograph. No provision was made on thisprototype to control the latter.
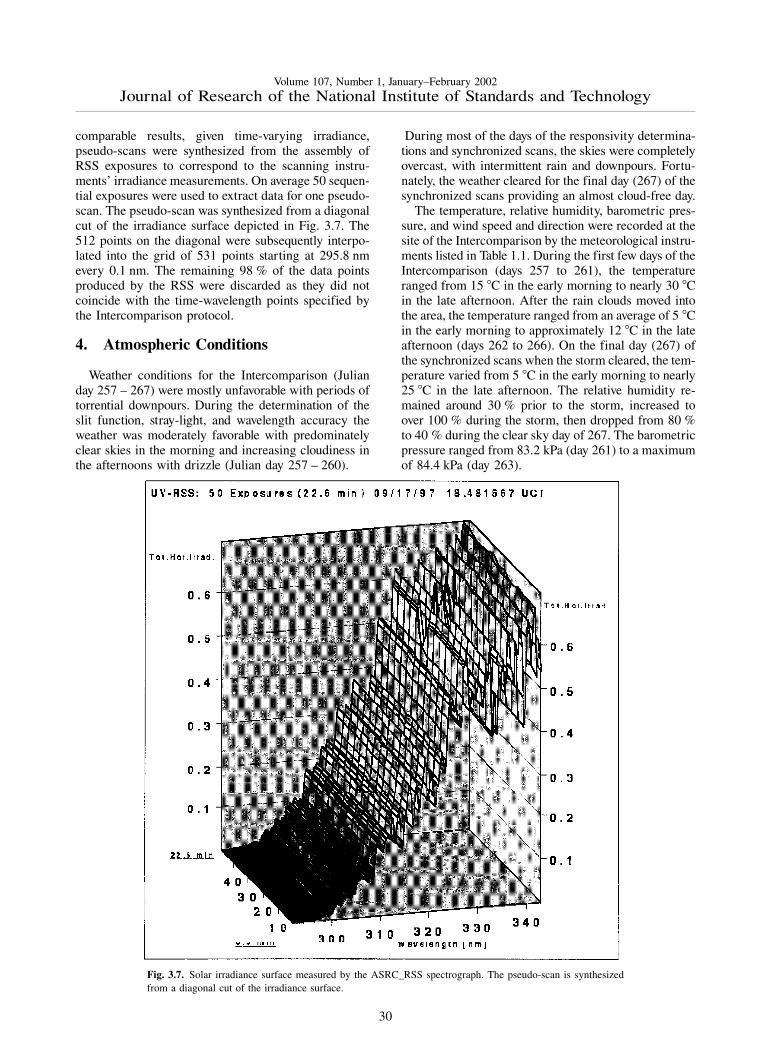
The Intercomparison protocol was designed for thecommon scanning instruments that acquire spectrasequentially. The RSS simultaneously acquires all 512spectral elements every 27.12 s. Therefore, to obtain
Fig. 3.6. Schematic diagram of the optical path of the ASRC_RSS spectrograph.
29
Volume 107, Number 1, January–February 2002Journal of Research of the National Institute of Standards and Technology
comparable results, given time-varying irradiance,pseudo-scans were synthesized from the assembly ofRSS exposures to correspond to the scanning instru-ments’ irradiance measurements. On average 50 sequen-tial exposures were used to extract data for one pseudo-scan. The pseudo-scan was synthesized from a diagonalcut of the irradiance surface depicted in Fig. 3.7. The512 points on the diagonal were subsequently interpo-lated into the grid of 531 points starting at 295.8 nmevery 0.1 nm. The remaining 98 % of the data pointsproduced by the RSS were discarded as they did notcoincide with the time-wavelength points specified bythe Intercomparison protocol.
4. Atmospheric Conditions
Weather conditions for the Intercomparison (Julianday 257 – 267) were mostly unfavorable with periods oftorrential downpours. During the determination of theslit function, stray-light, and wavelength accuracy theweather was moderately favorable with predominatelyclear skies in the morning and increasing cloudiness inthe afternoons with drizzle (Julian day 257 – 260).
During most of the days of the responsivity determina-tions and synchronized scans, the skies were completelyovercast, with intermittent rain and downpours. Fortu-nately, the weather cleared for the final day (267) of thesynchronized scans providing an almost cloud-free day.
The temperature, relative humidity, barometric pres-sure, and wind speed and direction were recorded at thesite of the Intercomparison by the meteorological instru-ments listed in Table 1.1. During the first few days of theIntercomparison (days 257 to 261), the temperatureranged from 15 �C in the early morning to nearly 30 �Cin the late afternoon. After the rain clouds moved intothe area, the temperature ranged from an average of 5 �Cin the early morning to approximately 12 �C in the lateafternoon (days 262 to 266). On the final day (267) ofthe synchronized scans when the storm cleared, the tem-perature varied from 5 �C in the early morning to nearly25 �C in the late afternoon. The relative humidity re-mained around 30 % prior to the storm, increased toover 100 % during the storm, then dropped from 80 %to 40 % during the clear sky day of 267. The barometricpressure ranged from 83.2 kPa (day 261) to a maximumof 84.4 kPa (day 263).
Fig. 3.7. Solar irradiance surface measured by the ASRC_RSS spectrograph. The pseudo-scan is synthesizedfrom a diagonal cut of the irradiance surface.
30
Volume 107, Number 1, January–February 2002Journal of Research of the National Institute of Standards and Technology
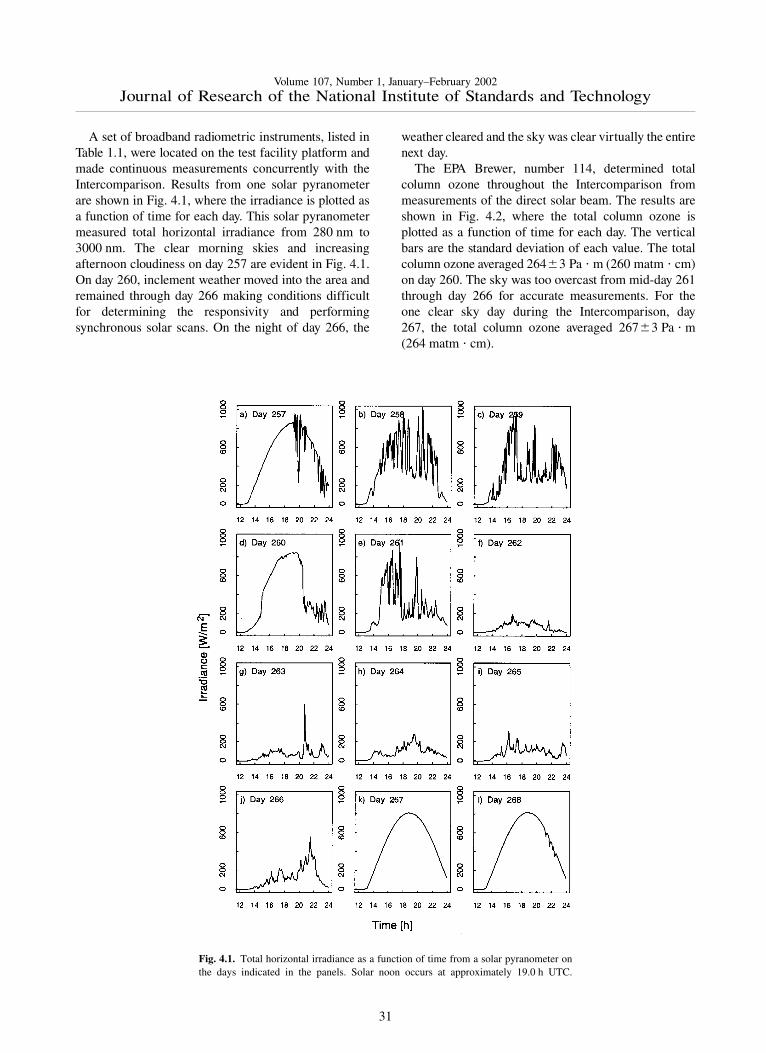
A set of broadband radiometric instruments, listed inTable 1.1, were located on the test facility platform andmade continuous measurements concurrently with theIntercomparison. Results from one solar pyranometerare shown in Fig. 4.1, where the irradiance is plotted asa function of time for each day. This solar pyranometermeasured total horizontal irradiance from 280 nm to3000 nm. The clear morning skies and increasingafternoon cloudiness on day 257 are evident in Fig. 4.1.On day 260, inclement weather moved into the area andremained through day 266 making conditions difficultfor determining the responsivity and performingsynchronous solar scans. On the night of day 266, the
weather cleared and the sky was clear virtually the entirenext day.
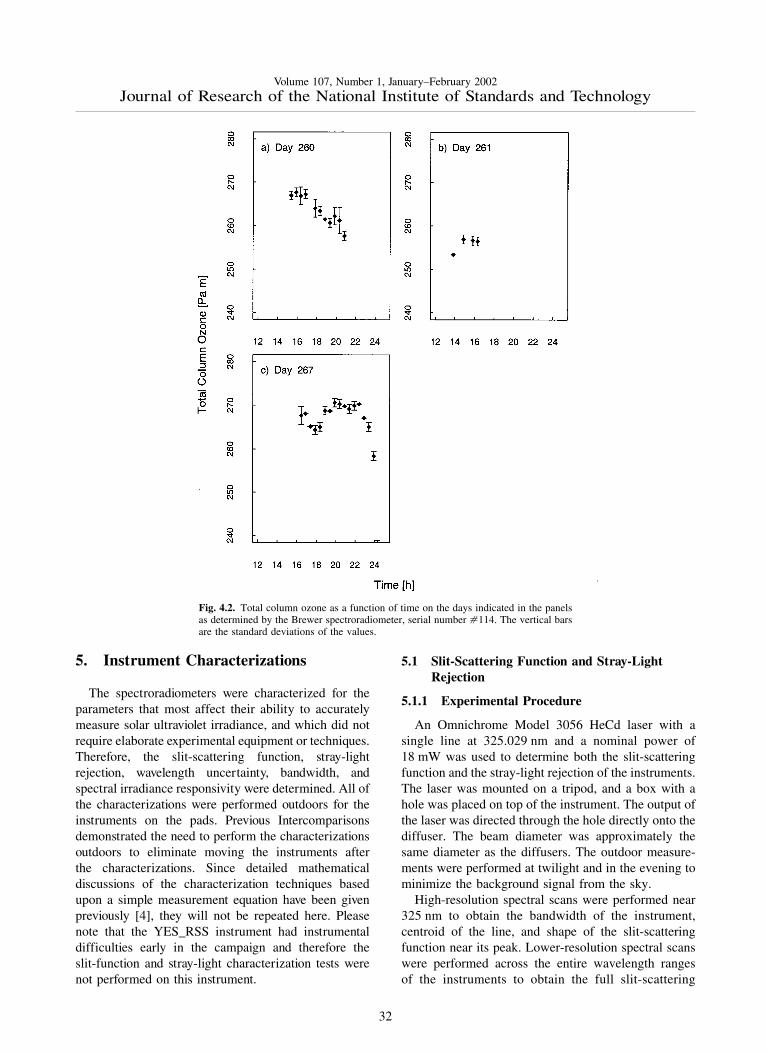
The EPA Brewer, number 114, determined totalcolumn ozone throughout the Intercomparison frommeasurements of the direct solar beam. The results areshown in Fig. 4.2, where the total column ozone isplotted as a function of time for each day. The verticalbars are the standard deviation of each value. The totalcolumn ozone averaged 264�3 Pa � m (260 matm � cm)on day 260. The sky was too overcast from mid-day 261through day 266 for accurate measurements. For theone clear sky day during the Intercomparison, day267, the total column ozone averaged 267�3 Pa � m(264 matm � cm).
Fig. 4.1. Total horizontal irradiance as a function of time from a solar pyranometer onthe days indicated in the panels. Solar noon occurs at approximately 19.0 h UTC.
31
Volume 107, Number 1, January–February 2002Journal of Research of the National Institute of Standards and Technology
5. Instrument Characterizations
The spectroradiometers were characterized for theparameters that most affect their ability to accuratelymeasure solar ultraviolet irradiance, and which did notrequire elaborate experimental equipment or techniques.Therefore, the slit-scattering function, stray-lightrejection, wavelength uncertainty, bandwidth, andspectral irradiance responsivity were determined. All ofthe characterizations were performed outdoors for theinstruments on the pads. Previous Intercomparisonsdemonstrated the need to perform the characterizationsoutdoors to eliminate moving the instruments afterthe characterizations. Since detailed mathematicaldiscussions of the characterization techniques basedupon a simple measurement equation have been givenpreviously [4], they will not be repeated here. Pleasenote that the YES_RSS instrument had instrumentaldifficulties early in the campaign and therefore theslit-function and stray-light characterization tests werenot performed on this instrument.
5.1 Slit-Scattering Function and Stray-LightRejection
5.1.1 Experimental Procedure
An Omnichrome Model 3056 HeCd laser with asingle line at 325.029 nm and a nominal power of18 mW was used to determine both the slit-scatteringfunction and the stray-light rejection of the instruments.The laser was mounted on a tripod, and a box with ahole was placed on top of the instrument. The output ofthe laser was directed through the hole directly onto thediffuser. The beam diameter was approximately thesame diameter as the diffusers. The outdoor measure-ments were performed at twilight and in the evening tominimize the background signal from the sky.
High-resolution spectral scans were performed near325 nm to obtain the bandwidth of the instrument,centroid of the line, and shape of the slit-scatteringfunction near its peak. Lower-resolution spectral scanswere performed across the entire wavelength rangesof the instruments to obtain the full slit-scattering
Fig. 4.2. Total column ozone as a function of time on the days indicated in the panelsas determined by the Brewer spectroradiometer, serial number �114. The vertical barsare the standard deviations of the values.
32
Volume 107, Number 1, January–February 2002Journal of Research of the National Institute of Standards and Technology
function. For the SERC instrument, the signals weremeasured for 4 min. The instruments were configuredso that the maximum signal did not saturate the PMT.For the EPA instruments, this involved using an internalneutral-density filter for the high-resolution scans, andthen removing the filter from the optical path for thelow-resolution scans. A lower-resolution scan was alsoperformed with the laser beam blocked to check forstray light from sources other than the laser. There wereno signals greater than the dark signal for any of theinstruments.
5.1.2 Data Analysis
The bandwidth of the instrument is defined here asthe full-width-at-half-maximum (FWHM) from a high-resolution spectral scan of a laser line or a singlet lampemission line. Linear interpolation is used to find thewavelengths at which the signal is one-half that of thepeak. The bandwidth is then the difference betweenthese two wavelengths.
The centroid method is used to estimate the wave-lengths of laser lines and lamp emission lines. Thecentroid C from a high-resolution scan is given by
C = �i
Si�i / �i
Si , (5.1)
where i indexes the signals Si and wavelengths �i ,respectively, of those signals greater than 0.1 of the peaksignal. Although baseline subtraction is not importantfor calculations of the centroid of laser lines because thelight is monochromatic, to maintain consistency withthe bandwidths determined by lamp emission lines,baseline subtraction was performed for spectral scans oflaser light. A description of the procedure is given inSec. 5.2.3.
For the high-resolution scans, normalization of thesignals by the peak signal was straight-forwardbecause there is no saturation of the signal. For thelow-resolution scans, the peak signals obtained in thehigh-resolution scans and the optical densities of thefilters were used to calculate the peak signals for thescans without the neutral-density filters. The opticaldensity at 325 nm of a neutral-density filter was deter-mined from the common wavelengths at which signalswere measured for scans both with and without thefilter.
The peak signals obtained in the high-resolutionscans were used to normalize the signals from the low-resolution scans for the ASRC_RSS, NIST, NSF_SUV,and USDA_U1K instruments since there was no satura-tion. The peak signal for the SERC instrument was notas readily known because there is no filter centered at
325 nm. Therefore, the peak signal for each filter wasobtained from the measured signal of the filter centeredat the longest wavelength that did not saturate. Thesepeak signals were calculated by dividing the measuredsignal from the filter centered at 320.65 nm by thetransmittance of that filter at 325 nm and multiplying bythe peak transmittance of each filter.
5.1.3 Results and Discussion
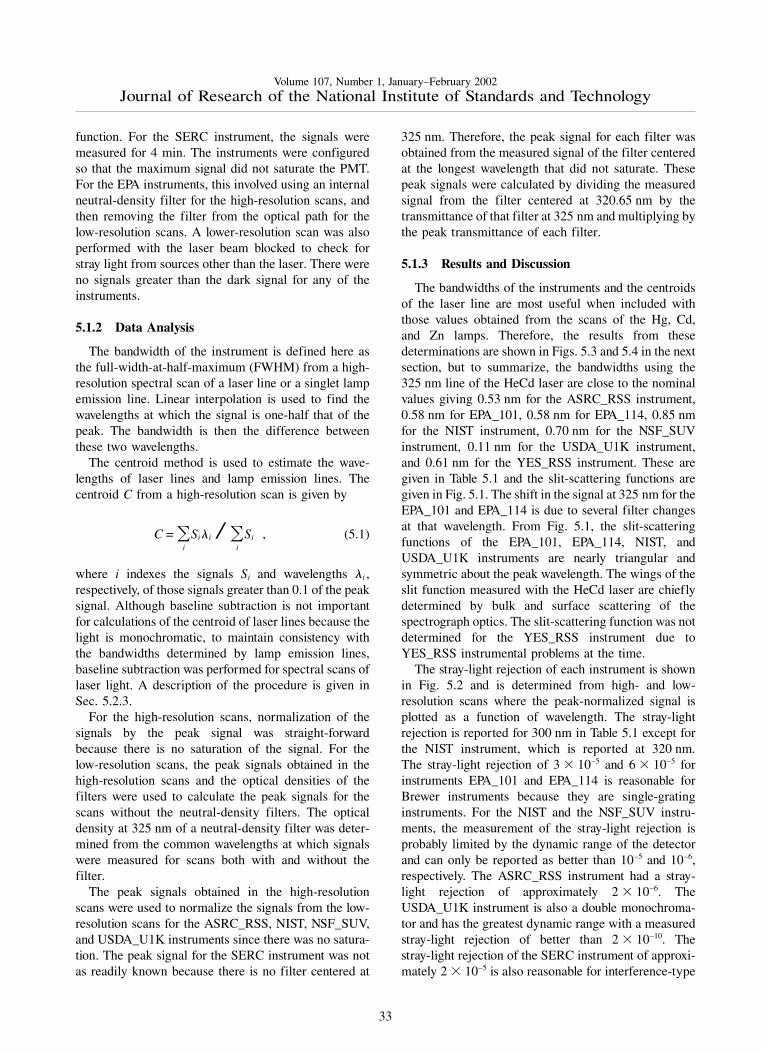
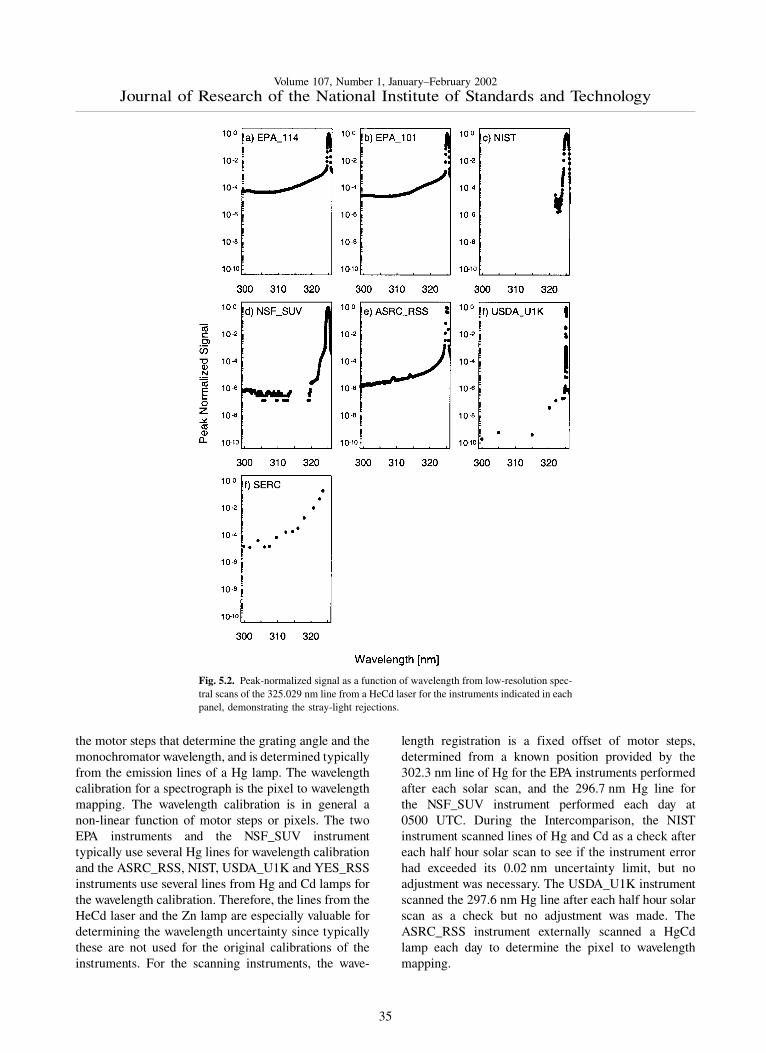
The bandwidths of the instruments and the centroidsof the laser line are most useful when included withthose values obtained from the scans of the Hg, Cd,and Zn lamps. Therefore, the results from thesedeterminations are shown in Figs. 5.3 and 5.4 in the nextsection, but to summarize, the bandwidths using the325 nm line of the HeCd laser are close to the nominalvalues giving 0.53 nm for the ASRC_RSS instrument,0.58 nm for EPA_101, 0.58 nm for EPA_114, 0.85 nmfor the NIST instrument, 0.70 nm for the NSF_SUVinstrument, 0.11 nm for the USDA_U1K instrument,and 0.61 nm for the YES_RSS instrument. These aregiven in Table 5.1 and the slit-scattering functions aregiven in Fig. 5.1. The shift in the signal at 325 nm for theEPA_101 and EPA_114 is due to several filter changesat that wavelength. From Fig. 5.1, the slit-scatteringfunctions of the EPA_101, EPA_114, NIST, andUSDA_U1K instruments are nearly triangular andsymmetric about the peak wavelength. The wings of theslit function measured with the HeCd laser are chieflydetermined by bulk and surface scattering of thespectrograph optics. The slit-scattering function was notdetermined for the YES_RSS instrument due toYES_RSS instrumental problems at the time.
The stray-light rejection of each instrument is shownin Fig. 5.2 and is determined from high- and low-resolution scans where the peak-normalized signal isplotted as a function of wavelength. The stray-lightrejection is reported for 300 nm in Table 5.1 except forthe NIST instrument, which is reported at 320 nm.The stray-light rejection of 3 � 10–5 and 6 � 10–5 forinstruments EPA_101 and EPA_114 is reasonable forBrewer instruments because they are single-gratinginstruments. For the NIST and the NSF_SUV instru-ments, the measurement of the stray-light rejection isprobably limited by the dynamic range of the detectorand can only be reported as better than 10–5 and 10–6,respectively. The ASRC_RSS instrument had a stray-light rejection of approximately 2 � 10–6. TheUSDA_U1K instrument is also a double monochroma-tor and has the greatest dynamic range with a measuredstray-light rejection of better than 2 � 10–10. Thestray-light rejection of the SERC instrument of approxi-mately 2 � 10–5 is also reasonable for interference-type
33
Volume 107, Number 1, January–February 2002Journal of Research of the National Institute of Standards and Technology
filter instruments. The features at 309 nm and 314 nmfor the ASRC_RSS instrument result from recycled rayswithin the prisms that have undergone three internalreflections. Their location is wavelength dependent.Developers of the ASRC_RSS instrument (ASRCSUNY) have suggested that the magnitude of thesefeatures could be further reduced with an anti-reflectivecoating for the prism bases.
5.2 Wavelength Uncertainty
5.2.1 Introduction
Characterizing the instruments in terms of theirresponse to light from Hg, Cd, and Zn emission linelamps is somewhat more complex than was the case for
a HeCd laser because there is a continuum in additionto the lines, and because there can be unresolvedmultiple lines. However, it is useful because it yieldsinformation at several wavelengths about the bandwidthand the wavelength dependence and wavelength uncer-tainty of the instruments. The wavelength uncertainty isespecially important in the UV-B region of the solarspectrum (280 nm to 315 nm) because the irradiance atthe Earth’s surface changes rapidly with wavelengthand therefore a small uncertainty in wavelength cantranslate into a large uncertainty in irradiance.
A distinction needs to be made between wavelengthcalibration and wavelength registration, both of whichaffect the wavelength uncertainty. The wavelength cali-bration for a scanning instrument is the relation between
Fig. 5.1. Peak-normalized signal as a function of wavelength from high-resolutionspectral scans of the 325.029 nm line from a HeCd laser for the instruments indicated ineach panel, demonstrating the slit-scattering functions. The shift in signal at 325 nm inthe EPA_101 and EPA_114 is due to several filter changes at this wavelength.
34
Volume 107, Number 1, January–February 2002Journal of Research of the National Institute of Standards and Technology
the motor steps that determine the grating angle and themonochromator wavelength, and is determined typicallyfrom the emission lines of a Hg lamp. The wavelengthcalibration for a spectrograph is the pixel to wavelengthmapping. The wavelength calibration is in general anon-linear function of motor steps or pixels. The twoEPA instruments and the NSF_SUV instrumenttypically use several Hg lines for wavelength calibrationand the ASRC_RSS, NIST, USDA_U1K and YES_RSSinstruments use several lines from Hg and Cd lamps forthe wavelength calibration. Therefore, the lines from theHeCd laser and the Zn lamp are especially valuable fordetermining the wavelength uncertainty since typicallythese are not used for the original calibrations of theinstruments. For the scanning instruments, the wave-
length registration is a fixed offset of motor steps,determined from a known position provided by the302.3 nm line of Hg for the EPA instruments performedafter each solar scan, and the 296.7 nm Hg line forthe NSF_SUV instrument performed each day at0500 UTC. During the Intercomparison, the NISTinstrument scanned lines of Hg and Cd as a check aftereach half hour solar scan to see if the instrument errorhad exceeded its 0.02 nm uncertainty limit, but noadjustment was necessary. The USDA_U1K instrumentscanned the 297.6 nm Hg line after each half hour solarscan as a check but no adjustment was made. TheASRC_RSS instrument externally scanned a HgCdlamp each day to determine the pixel to wavelengthmapping.
Fig. 5.2. Peak-normalized signal as a function of wavelength from low-resolution spec-tral scans of the 325.029 nm line from a HeCd laser for the instruments indicated in eachpanel, demonstrating the stray-light rejections.
35
Volume 107, Number 1, January–February 2002Journal of Research of the National Institute of Standards and Technology
The wavelengths of emission lines from gas lamps areknown to a high degree of accuracy. However, therelative intensities of these lines change with lamp andoperating condition. An Oriel Model 6035 Hg emissionlamp was used because of recent measurements of therelative intensities of the lines from this particularmodel of lamp [16, 17].
5.2.2 Experimental Procedure
The Hg, Cd, and Zn emission lamps were placed,separately, horizontally and as close as practical over thediffuser of the instrument. The lamps were warmed upfor 10 min and the instrument performed a spectralscan. The ASRC_RSS, EPA_101, EPA_114, NIST,NSF_SUV, USDA_U1K and YES_RSS instruments
performed spectral scans over their entire operatingranges at 0.08 nm, 0.03 nm, 0.03 nm, 0.04 nm, 0.02 nm,0.005 nm, and 0.04 nm increments, respectively.
5.2.3 Data Analysis
The bandwidths of the lamp emission lines arecalculated as described in Sec. 5.1.2. Baseline subtrac-tion was performed prior to calculation of the band-widths of the lamp emission lines. This is important forspectral scans of lamp emission lines because of theunderlying continuous emission from these lamps. Thebaseline signal is described by a linear fit of the signalsat wavelengths that differ by 1.5 bandwidths from thewavelength of the peak signal. For unresolved multiplelines in emission lamps, the factor is increased from
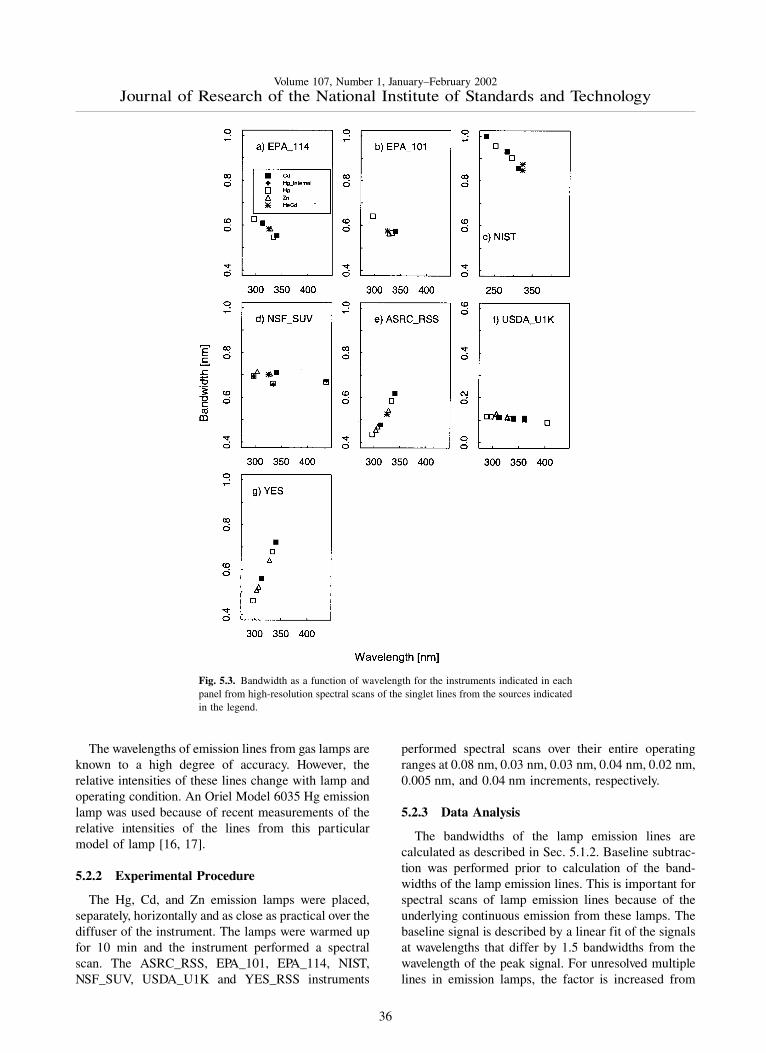
Fig. 5.3. Bandwidth as a function of wavelength for the instruments indicated in eachpanel from high-resolution spectral scans of the singlet lines from the sources indicatedin the legend.
36

Volume 107, Number 1, January–February 2002Journal of Research of the National Institute of Standards and Technology
1.5. to 2.0. The signals and wavelengths for the first fiveconsecutive data points that lie outside this range areaveraged and fit with a straight line to yield baselinesignal as a function of wavelength. This fit is subtractedfrom the signals within the range. There is obviously aninterplay between the baseline subtraction and the band-width, but a consistent bandwidth can be obtained afteronly one or, at most, two iterations between baselinesubtraction and the centroid calculation. Only the band-widths for single lines were taken to be indicative of thebandwidth of the instrument at that wavelength. Theactual centroids of the lines were calculated from thewavelengths and relative intensities of the lines for thatparticular model of Hg lamp and from the publishedvalues for Cd and Zn [18].
5.2.4 Results and Discussion
The bandwidths calculated from the singlet Hg, Cd,and Zn lines and the HeCd line are plotted in Fig. 5.3 asa function of wavelength. The differences between thecalculated and actual centroids of the Hg, Cd, Zn, andHeCd lines are plotted in Fig. 5.4 as a function ofwavelength.
The nominal band-pass of the two spectrographs, theASRC_RSS and the YES_RSS instruments, are approx-imately 0.6 nm which was designed to coincide with theBrewer spectroradiometer and to improve throughput.Note that later versions of the UV_RSS instrumentswith the 1024 nm � 256 nm CCD array typically arebuilt to achieve 0.3 nm FWHM at 296.7 nm. The
Fig. 5.4. Centroid difference between the calculated and actual values for the instru-ments indicated in each panel from high-resolution spectral scans of the lines from thesources indicated in the legend, demonstrating the wavelength uncertainty of eachinstrument.
37
Volume 107, Number 1, January–February 2002Journal of Research of the National Institute of Standards and Technology
bandwidths of the two spectrographs increase withincreasing wavelength by 0.82 %/nm and 0.97 %/nm,and this change is consistent between measurementsfrom the different lamps. The FWHM when expressedin pixels is approximately pixel independent, but whenconverted to units of nanometers is approximately linearwith wavelength. The nominal bandwidths of theUSDA_U1K and the NSF_SUV are 0.1 nm and 0.7 nm,respectively, and are essentially wavelength independent.The nominal bandpasses of the EPA and NIST instru-ments are 0.6 nm and 0.8 nm, respectively. Thebandpasses of the EPA_101, EPA_114, and NIST instru-ments decrease with increasing wavelength. Thedecrease in bandwidth with wavelength for the threeinstruments is 0.31 %/nm, 0.29 %/nm, and 0.18 %/nm,respectively.
The wavelength uncertainty is determined from thedifference between the published values of the centroidsfor the particular model of Hg lamp [18] and themeasured centroids. In general, the wavelength uncer-tainties were consistent between measurements of thevarious lamps. The deviations are larger for theNSF_SUV instrument, as explained below. The twoBrewer instruments (EPA_101 and EPA_114) appear tohave a distinct change in the centroid differences at325 nm where the filter change occurs. After 325 nm,there is a systematic trend toward decreasing centroiddifferences with increasing wavelength. Possibly theoriginal wavelength calibration for the Brewer instru-ment is not representative of the conversion from stepsto wavelength and could be improved. In general, for theEPA_101 and EPA_114 instruments, the RMS of theresiduals of the centroid differences is 0.029 nm and0.027 nm, respectively.
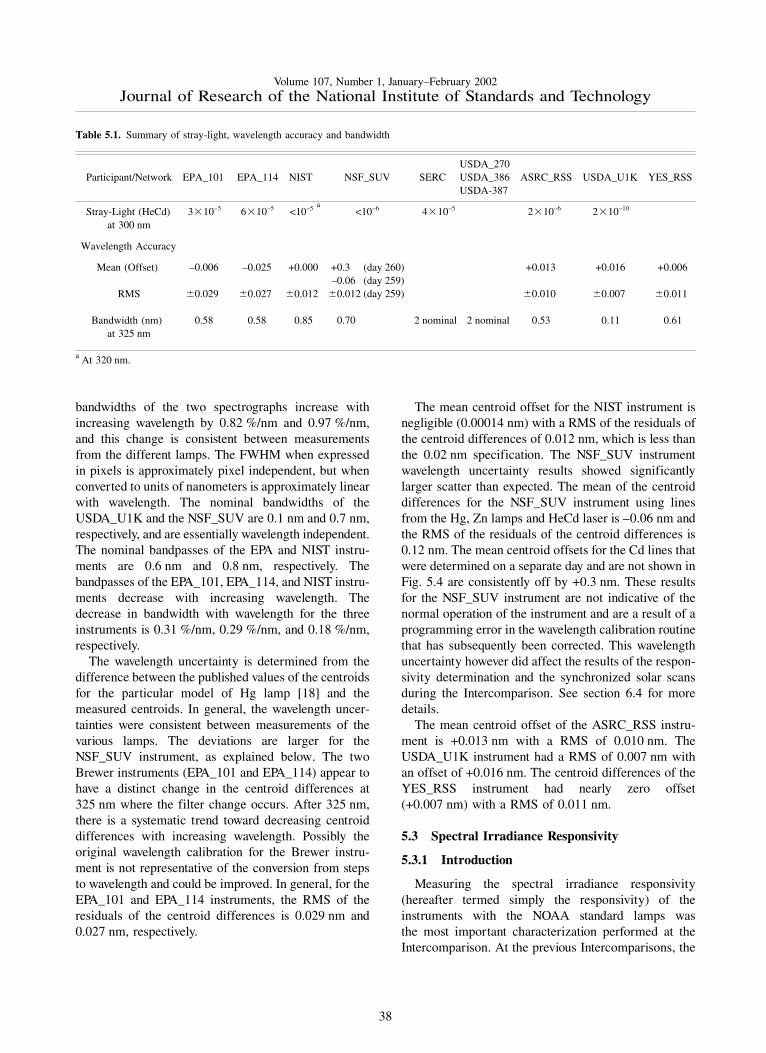
Table 5.1. Summary of stray-light, wavelength accuracy and bandwidth
USDA_270Participant/Network EPA_101 EPA_114 NIST NSF_SUV SERC USDA_386 ASRC_RSS USDA_U1K YES_RSS
USDA-387
Stray-Light (HeCd) 3�10–5 6�10–5 <10–5 a<10–6 4�10–5 2�10–6 2�10–10
at 300 nm
Wavelength Accuracy
Mean (Offset) –0.006 –0.025 +0.000 +0.3 (day 260) +0.013 +0.016 +0.006–0.06 (day 259)
RMS �0.029 �0.027 �0.012 �0.012 (day 259) �0.010 �0.007 �0.011
Bandwidth (nm) 0.58 0.58 0.85 0.70 2 nominal 2 nominal 0.53 0.11 0.61at 325 nm
a At 320 nm.
The mean centroid offset for the NIST instrument isnegligible (0.00014 nm) with a RMS of the residuals ofthe centroid differences of 0.012 nm, which is less thanthe 0.02 nm specification. The NSF_SUV instrumentwavelength uncertainty results showed significantlylarger scatter than expected. The mean of the centroiddifferences for the NSF_SUV instrument using linesfrom the Hg, Zn lamps and HeCd laser is –0.06 nm andthe RMS of the residuals of the centroid differences is0.12 nm. The mean centroid offsets for the Cd lines thatwere determined on a separate day and are not shown inFig. 5.4 are consistently off by +0.3 nm. These resultsfor the NSF_SUV instrument are not indicative of thenormal operation of the instrument and are a result of aprogramming error in the wavelength calibration routinethat has subsequently been corrected. This wavelengthuncertainty however did affect the results of the respon-sivity determination and the synchronized solar scansduring the Intercomparison. See section 6.4 for moredetails.
The mean centroid offset of the ASRC_RSS instru-ment is +0.013 nm with a RMS of 0.010 nm. TheUSDA_U1K instrument had a RMS of 0.007 nm withan offset of +0.016 nm. The centroid differences of theYES_RSS instrument had nearly zero offset(+0.007 nm) with a RMS of 0.011 nm.
5.3 Spectral Irradiance Responsivity
5.3.1 Introduction
Measuring the spectral irradiance responsivity(hereafter termed simply the responsivity) of theinstruments with the NOAA standard lamps wasthe most important characterization performed at theIntercomparison. At the previous Intercomparisons, the
38
Volume 107, Number 1, January–February 2002Journal of Research of the National Institute of Standards and Technology
responsivity was determined by the participant and byNIST and NOAA to show the agreement betweenthe two spectral irradiance scales. However, at thisIntercomparison the responsivity determined by theparticipants was not performed. This occurred primarilybecause many of the participants did not bring their ownfield calibration systems and previous Intercomparisonsshowed that its responsivity can change when an instru-ment is moved, highlighting the need for a field calibra-tor to perform in-situ responsivity measurements asopposed to laboratory responsivity measurements priorto field placement [4]. The responsivity was determinedpreferably three times for each instrument to assess thetemporal stability of the instruments and to use the mostrecent responsivity of each instrument for the syn-chronized solar irradiance measurements.
As stated above, previous Intercomparisons showedthat moving the instruments after calibrating causedmeasurable changes in the responsivity; therefore, thisyear the instruments were calibrated outdoors on theconcrete pads where the instrument remained for theentirety of the Intercomparison. The NOAA standardlamps were operated in the field calibration unit whoseperformance was demonstrated at the previous Inter-comparison [5, 6]. Experimental problems with theYES_RSS instrument had not been resolved duringthis stage of the Intercomparison and therefore itsresponsivity was not determined.
5.3.2 Experimental Procedure
Details of the NOAA field calibration unit are givenin a separate paper [8]. Briefly, the field calibration unitconsists of three circular baffles, 45 cm in diameter andseparated by 15 cm, with a mount for a horizontal lampon the top baffle. A light trap above the lamp andshrouding around the baffles enclose the lamp, isolatingit from the surroundings, and the unit mounts on aninterface plate, which is the key to the utility of the fieldcalibration unit. Each instrument has an interface platespecifically designed to fit around the diffuser and reston top of the instrument. The interface plate also sets thedistance from the diffuser to the lamp at 50.0 cm byusing spacers machined to the appropriate height. Thelamp mount on the field calibration unit was adjustedonce to center the lamp 50.0 cm above the diffuser.
The spectral irradiance of the 1000 W FEL-typeNIST standard lamps, designated 96598 and 96599, hadbeen determined by NOAA in the horizontal positionusing a method similar to the one described previously[19]. The spectral irradiance of the 1000 W FEL-typeNIST standard lamp, designated E-002, had been deter-mined by NIST in the horizontal position also using themethod described previously [19]. The responsivity ofeach instrument was determined with the calibratedlamps mounted horizontally in the field calibration unit.
For all determinations of responsivity using a NISTor NOAA lamp, spectral scans were performed with a3.5 cm wide shutter halfway between the lamp and thediffuser to measure the diffuse signal, and without theshutter to measure the total signal. For both Brewerinstruments, the wavelength registration was set prior tomeasuring the responsivity. The EPA_101 and EPA_114instruments performed spectral scans from 286.5 nm to360 nm at 3.5 nm increments with increasing wave-length for both the diffuse and the total signal. Spectralscans with the NIST instrument were performed from250 nm to 400 nm in 10 nm increments. Spectral scanswith the NSF_SUV instrument were from either 270 nmor 250 nm to 400 nm with a PMT voltage of 800 V.These scans were at a 1.0 nm increment with increasingwavelength with scans for the diffuse and total irradi-ance. In addition, scans were performed with the inter-nal shutter closed to measure the dark signal. Both thediffuse and total signals from the SERC instrument werecollected for nine minutes. The USDA UV-MFRSRinstruments (USDA_270, USDA_386, USDA_387)measured diffuse and total signals for 10 minutes. TheASRC_RSS spectrograph collected signals from 295.7to 349.0 nm at approximately every 0.08 nm for both thediffuse and total signals. The USDA_U1K instrumentperformed spectral scans from 280 nm to 410 nm at a1 nm increment with increasing wavelength for thediffuse signal and for the total signal. A schedule of thespectral scans of standard lamps is given in Table 5.2,along with the corresponding instrument temperatures ifavailable.
There were problems associated with using the adap-tor plates for the field calibration unit on theASRC_RSS and USDA_U1K instruments. An incorrectfit of the adaptor plate to each of these instrumentsresulted in an increased uncertainty in the responsivitymeasurements due to alignment, as seen in Table 5.3.
39
Volume 107, Number 1, January–February 2002Journal of Research of the National Institute of Standards and Technology
5.3.3 Data Analysis
From spectral scans of a standard lamp, the respon-sivity is given by dividing the signal by the lamp irradi-ance. For the NIST and NOAA standard lamps, thesignal was the direct signal, given by the differencebetween the total signal and the diffuse signal where thediffuse signal was determined by placing a shutter infront of the lamp during the irradiance measurement.Typically, the responsivity determined by the partici-pants for use in their networks do not use a shutter todetermine the diffuse signal and the signal is thereforethe total signal. The spectral irradiance of the standardlamps was fit with a cubic spline interpolation to thewavelengths of the signals. The NOAA standard lampshad been calibrated from 250 nm to 400 nm, whichcovers the wavelength range measured during thisIntercomparison.
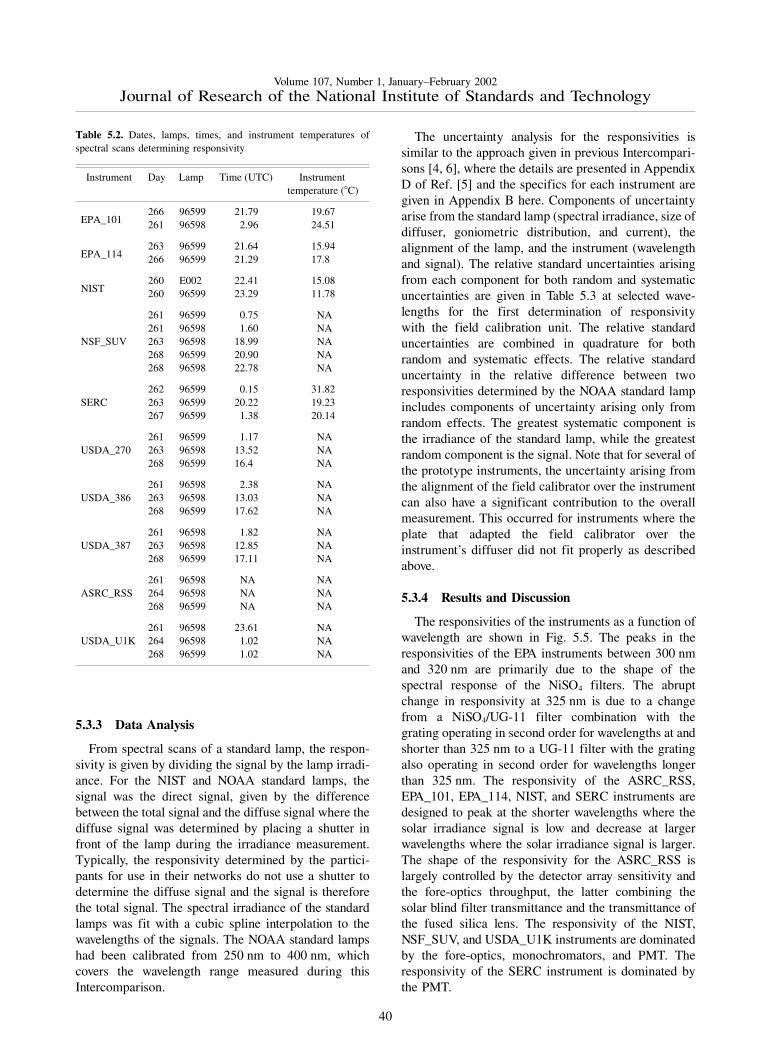
Table 5.2. Dates, lamps, times, and instrument temperatures ofspectral scans determining responsivity
Instrument Day Lamp Time (UTC) Instrumenttemperature (�C)
EPA_101266 96599 21.79 19.67261 96598 2.96 24.51
EPA_114263 96599 21.64 15.94266 96599 21.29 17.8
260 E002 22.41 15.08NIST 260 96599 23.29 11.78
261 96599 0.75 NA261 96598 1.60 NA
NSF_SUV 263 96598 18.99 NA268 96599 20.90 NA268 96598 22.78 NA
262 96599 0.15 31.82SERC 263 96599 20.22 19.23
267 96599 1.38 20.14
261 96599 1.17 NAUSDA_270 263 96598 13.52 NA
268 96599 16.4 NA
261 96598 2.38 NAUSDA_386 263 96598 13.03 NA
268 96599 17.62 NA
261 96598 1.82 NAUSDA_387 263 96598 12.85 NA
268 96599 17.11 NA
261 96598 NA NAASRC_RSS 264 96598 NA NA
268 96599 NA NA
261 96598 23.61 NAUSDA_U1K 264 96598 1.02 NA
268 96599 1.02 NA
The uncertainty analysis for the responsivities issimilar to the approach given in previous Intercompari-sons [4, 6], where the details are presented in AppendixD of Ref. [5] and the specifics for each instrument aregiven in Appendix B here. Components of uncertaintyarise from the standard lamp (spectral irradiance, size ofdiffuser, goniometric distribution, and current), thealignment of the lamp, and the instrument (wavelengthand signal). The relative standard uncertainties arisingfrom each component for both random and systematicuncertainties are given in Table 5.3 at selected wave-lengths for the first determination of responsivitywith the field calibration unit. The relative standarduncertainties are combined in quadrature for bothrandom and systematic effects. The relative standarduncertainty in the relative difference between tworesponsivities determined by the NOAA standard lampincludes components of uncertainty arising only fromrandom effects. The greatest systematic component isthe irradiance of the standard lamp, while the greatestrandom component is the signal. Note that for several ofthe prototype instruments, the uncertainty arising fromthe alignment of the field calibrator over the instrumentcan also have a significant contribution to the overallmeasurement. This occurred for instruments where theplate that adapted the field calibrator over theinstrument’s diffuser did not fit properly as describedabove.
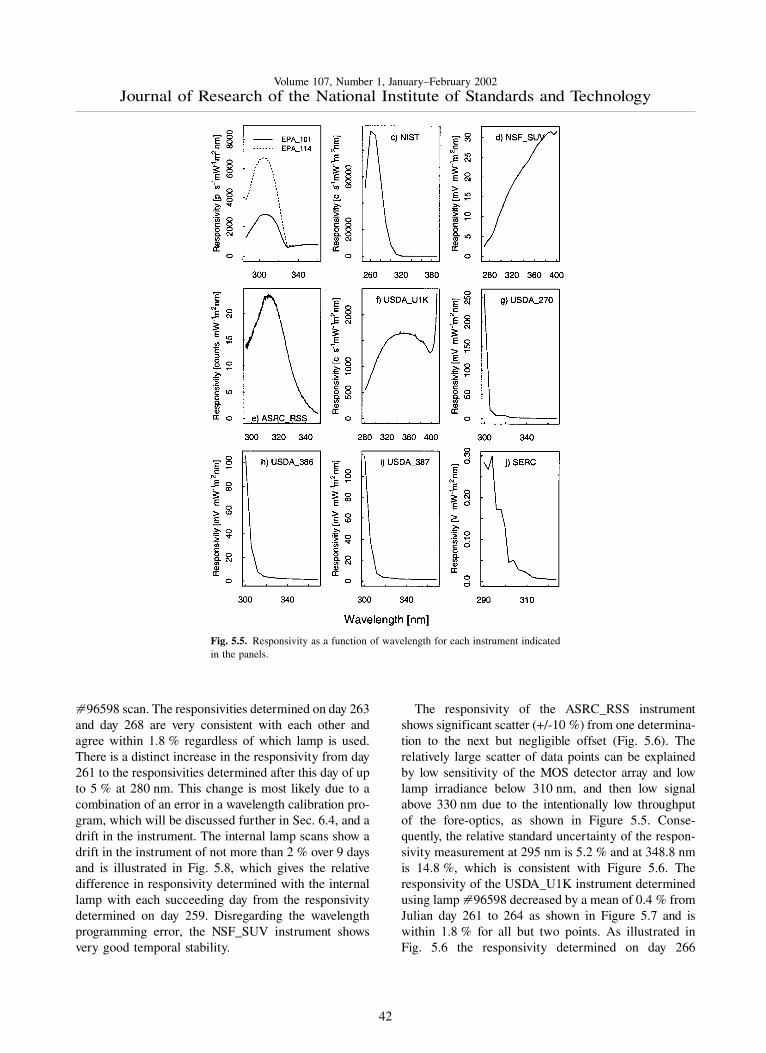
5.3.4 Results and Discussion
The responsivities of the instruments as a function ofwavelength are shown in Fig. 5.5. The peaks in theresponsivities of the EPA instruments between 300 nmand 320 nm are primarily due to the shape of thespectral response of the NiSO4 filters. The abruptchange in responsivity at 325 nm is due to a changefrom a NiSO4/UG-11 filter combination with thegrating operating in second order for wavelengths at andshorter than 325 nm to a UG-11 filter with the gratingalso operating in second order for wavelengths longerthan 325 nm. The responsivity of the ASRC_RSS,EPA_101, EPA_114, NIST, and SERC instruments aredesigned to peak at the shorter wavelengths where thesolar irradiance signal is low and decrease at largerwavelengths where the solar irradiance signal is larger.The shape of the responsivity for the ASRC_RSS islargely controlled by the detector array sensitivity andthe fore-optics throughput, the latter combining thesolar blind filter transmittance and the transmittance ofthe fused silica lens. The responsivity of the NIST,NSF_SUV, and USDA_U1K instruments are dominatedby the fore-optics, monochromators, and PMT. Theresponsivity of the SERC instrument is dominated bythe PMT.
40
Volume 107, Number 1, January–February 2002Journal of Research of the National Institute of Standards and Technology
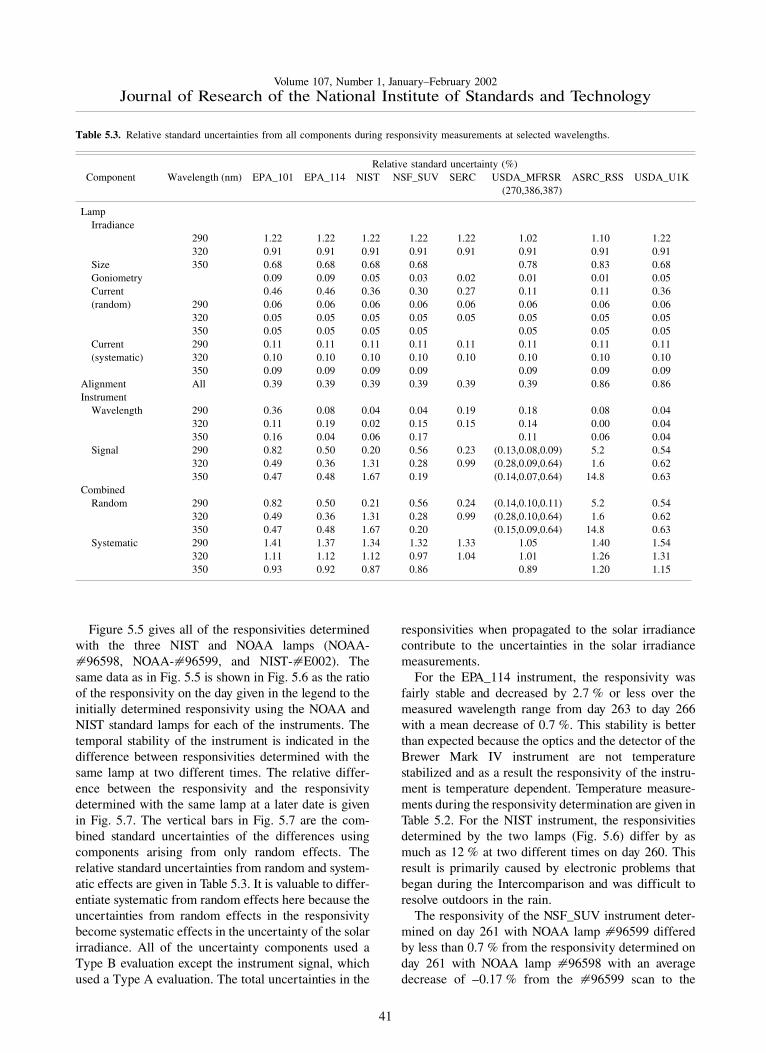
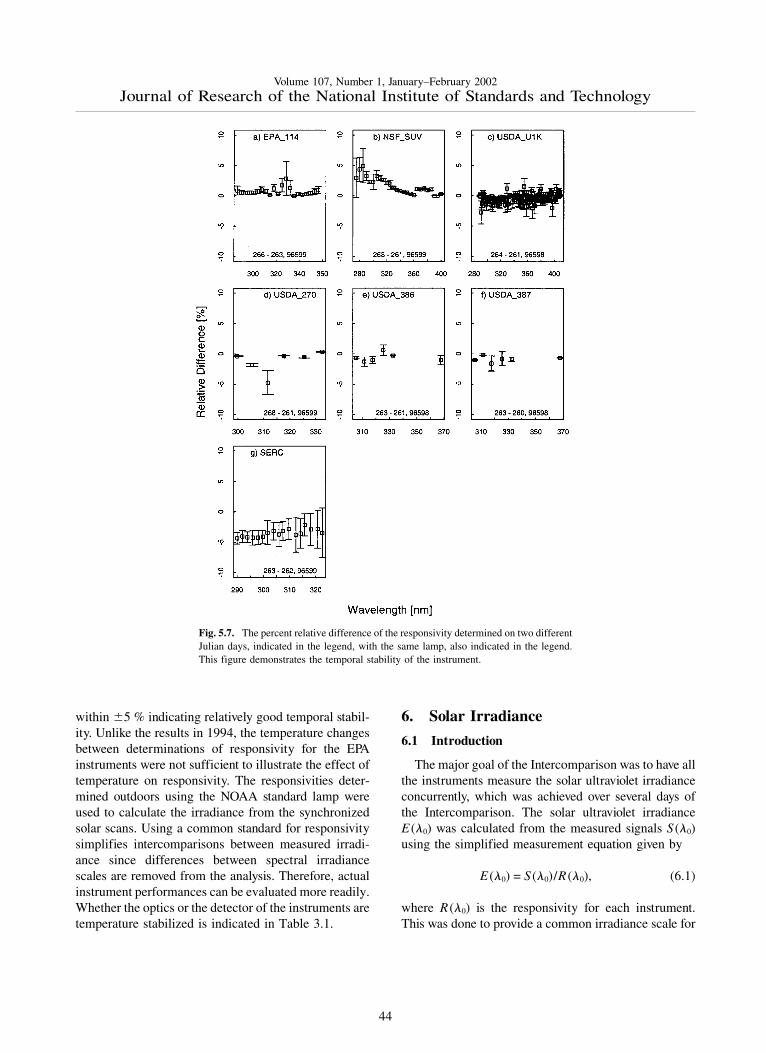
Figure 5.5 gives all of the responsivities determinedwith the three NIST and NOAA lamps (NOAA-�96598, NOAA-�96599, and NIST-�E002). Thesame data as in Fig. 5.5 is shown in Fig. 5.6 as the ratioof the responsivity on the day given in the legend to theinitially determined responsivity using the NOAA andNIST standard lamps for each of the instruments. Thetemporal stability of the instrument is indicated in thedifference between responsivities determined with thesame lamp at two different times. The relative differ-ence between the responsivity and the responsivitydetermined with the same lamp at a later date is givenin Fig. 5.7. The vertical bars in Fig. 5.7 are the com-bined standard uncertainties of the differences usingcomponents arising from only random effects. Therelative standard uncertainties from random and system-atic effects are given in Table 5.3. It is valuable to differ-entiate systematic from random effects here because theuncertainties from random effects in the responsivitybecome systematic effects in the uncertainty of the solarirradiance. All of the uncertainty components used aType B evaluation except the instrument signal, whichused a Type A evaluation. The total uncertainties in the
Table 5.3. Relative standard uncertainties from all components during responsivity measurements at selected wavelengths.
Relative standard uncertainty (%)Component Wavelength (nm) EPA_101 EPA_114 NIST NSF_SUV SERC USDA_MFRSR ASRC_RSS USDA_U1K
(270,386,387)
LampIrradiance
290 1.22 1.22 1.22 1.22 1.22 1.02 1.10 1.22320 0.91 0.91 0.91 0.91 0.91 0.91 0.91 0.91
Size 350 0.68 0.68 0.68 0.68 0.78 0.83 0.68Goniometry 0.09 0.09 0.05 0.03 0.02 0.01 0.01 0.05Current 0.46 0.46 0.36 0.30 0.27 0.11 0.11 0.36(random) 290 0.06 0.06 0.06 0.06 0.06 0.06 0.06 0.06
320 0.05 0.05 0.05 0.05 0.05 0.05 0.05 0.05350 0.05 0.05 0.05 0.05 0.05 0.05 0.05
Current 290 0.11 0.11 0.11 0.11 0.11 0.11 0.11 0.11(systematic) 320 0.10 0.10 0.10 0.10 0.10 0.10 0.10 0.10
350 0.09 0.09 0.09 0.09 0.09 0.09 0.09Alignment All 0.39 0.39 0.39 0.39 0.39 0.39 0.86 0.86Instrument
Wavelength 290 0.36 0.08 0.04 0.04 0.19 0.18 0.08 0.04320 0.11 0.19 0.02 0.15 0.15 0.14 0.00 0.04350 0.16 0.04 0.06 0.17 0.11 0.06 0.04
Signal 290 0.82 0.50 0.20 0.56 0.23 (0.13,0.08,0.09) 5.2 0.54320 0.49 0.36 1.31 0.28 0.99 (0.28,0.09,0.64) 1.6 0.62350 0.47 0.48 1.67 0.19 (0.14,0.07,0.64) 14.8 0.63
CombinedRandom 290 0.82 0.50 0.21 0.56 0.24 (0.14,0.10,0.11) 5.2 0.54
320 0.49 0.36 1.31 0.28 0.99 (0.28,0.10,0.64) 1.6 0.62350 0.47 0.48 1.67 0.20 (0.15,0.09,0.64) 14.8 0.63
Systematic 290 1.41 1.37 1.34 1.32 1.33 1.05 1.40 1.54320 1.11 1.12 1.12 0.97 1.04 1.01 1.26 1.31350 0.93 0.92 0.87 0.86 0.89 1.20 1.15
responsivities when propagated to the solar irradiancecontribute to the uncertainties in the solar irradiancemeasurements.
For the EPA_114 instrument, the responsivity wasfairly stable and decreased by 2.7 % or less over themeasured wavelength range from day 263 to day 266with a mean decrease of 0.7 %. This stability is betterthan expected because the optics and the detector of theBrewer Mark IV instrument are not temperaturestabilized and as a result the responsivity of the instru-ment is temperature dependent. Temperature measure-ments during the responsivity determination are given inTable 5.2. For the NIST instrument, the responsivitiesdetermined by the two lamps (Fig. 5.6) differ by asmuch as 12 % at two different times on day 260. Thisresult is primarily caused by electronic problems thatbegan during the Intercomparison and was difficult toresolve outdoors in the rain.
The responsivity of the NSF_SUV instrument deter-mined on day 261 with NOAA lamp �96599 differedby less than 0.7 % from the responsivity determined onday 261 with NOAA lamp �96598 with an averagedecrease of –0.17 % from the �96599 scan to the
41
Volume 107, Number 1, January–February 2002Journal of Research of the National Institute of Standards and Technology
�96598 scan. The responsivities determined on day 263and day 268 are very consistent with each other andagree within 1.8 % regardless of which lamp is used.There is a distinct increase in the responsivity from day261 to the responsivities determined after this day of upto 5 % at 280 nm. This change is most likely due to acombination of an error in a wavelength calibration pro-gram, which will be discussed further in Sec. 6.4, and adrift in the instrument. The internal lamp scans show adrift in the instrument of not more than 2 % over 9 daysand is illustrated in Fig. 5.8, which gives the relativedifference in responsivity determined with the internallamp with each succeeding day from the responsivitydetermined on day 259. Disregarding the wavelengthprogramming error, the NSF_SUV instrument showsvery good temporal stability.
The responsivity of the ASRC_RSS instrumentshows significant scatter (+/-10 %) from one determina-tion to the next but negligible offset (Fig. 5.6). Therelatively large scatter of data points can be explainedby low sensitivity of the MOS detector array and lowlamp irradiance below 310 nm, and then low signalabove 330 nm due to the intentionally low throughputof the fore-optics, as shown in Figure 5.5. Conse-quently, the relative standard uncertainty of the respon-sivity measurement at 295 nm is 5.2 % and at 348.8 nmis 14.8 %, which is consistent with Figure 5.6. Theresponsivity of the USDA_U1K instrument determinedusing lamp �96598 decreased by a mean of 0.4 % fromJulian day 261 to 264 as shown in Figure 5.7 and iswithin 1.8 % for all but two points. As illustrated inFig. 5.6 the responsivity determined on day 266
Fig. 5.5. Responsivity as a function of wavelength for each instrument indicatedin the panels.
42
Volume 107, Number 1, January–February 2002Journal of Research of the National Institute of Standards and Technology
decreased by a mean of 2.6 % from day 261 but used adifferent lamp. The largest sources of uncertainties inthe USDA_U1K signal are the random componentfrom the signal and the uncertainty in the positioningof the standard NOAA lamp over the instrument. Theuncertainty components are given in Table 5.3.
There were three UV-MFRSR instruments at theIntercomparison with serial numbers �270, �386, and�387 and the temporal stability of all three instrumentswere similar. The three instruments showed an approxi-mate mean decrease of 1.2 %, 0.6 %, and 0.9 % over7 d, 2 d, and 3 d (Fig. 5.7), respectively. The 311 nmchannel of the USDA_270 showed a decrease of 5 %over the 8 days that was unexplained. This instrumentshows pronounced deviations from day 261 to day 263(Fig. 5.6) but this was attributed to insufficient warm-
up time of the head and was not an indication of theinstrument’s stability. The typical warm-up time of thehead of an UV-MFRSR prior to measurement of theresponsivity should be at least 20 min. Excluding theresponsivity determined with an insufficient warm-uptime, all three instruments showed changes in theresponsivity within 5 %. The responsivity of the SERCinstrument decreased by less than 4.4 % over the wave-length range and had a mean decrease in the responsiv-ity of 3.5 % from day 262 to day 263 which is consistentwith previous Intercomparisons. The responsivity of theSERC instrument decreased by less than 2.9 % from day261 to day 267.
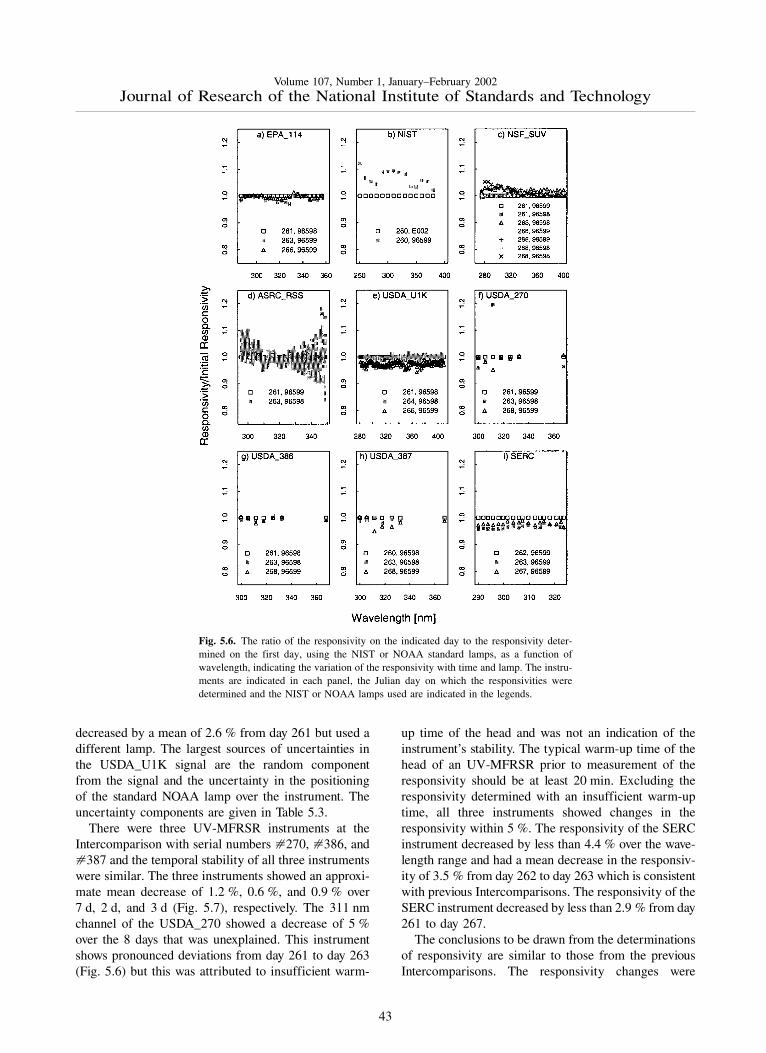
The conclusions to be drawn from the determinationsof responsivity are similar to those from the previousIntercomparisons. The responsivity changes were
Fig. 5.6. The ratio of the responsivity on the indicated day to the responsivity deter-mined on the first day, using the NIST or NOAA standard lamps, as a function ofwavelength, indicating the variation of the responsivity with time and lamp. The instru-ments are indicated in each panel, the Julian day on which the responsivities weredetermined and the NIST or NOAA lamps used are indicated in the legends.
43
Volume 107, Number 1, January–February 2002Journal of Research of the National Institute of Standards and Technology
within �5 % indicating relatively good temporal stabil-ity. Unlike the results in 1994, the temperature changesbetween determinations of responsivity for the EPAinstruments were not sufficient to illustrate the effect oftemperature on responsivity. The responsivities deter-mined outdoors using the NOAA standard lamp wereused to calculate the irradiance from the synchronizedsolar scans. Using a common standard for responsivitysimplifies intercomparisons between measured irradi-ance since differences between spectral irradiancescales are removed from the analysis. Therefore, actualinstrument performances can be evaluated more readily.Whether the optics or the detector of the instruments aretemperature stabilized is indicated in Table 3.1.
6. Solar Irradiance
6.1 Introduction
The major goal of the Intercomparison was to have allthe instruments measure the solar ultraviolet irradianceconcurrently, which was achieved over several days ofthe Intercomparison. The solar ultraviolet irradianceE (�0) was calculated from the measured signals S (�0)using the simplified measurement equation given by
E (�0) = S (�0)/R (�0), (6.1)
where R (�0) is the responsivity for each instrument.This was done to provide a common irradiance scale for
Fig. 5.7. The percent relative difference of the responsivity determined on two differentJulian days, indicated in the legend, with the same lamp, also indicated in the legend.This figure demonstrates the temporal stability of the instrument.
44
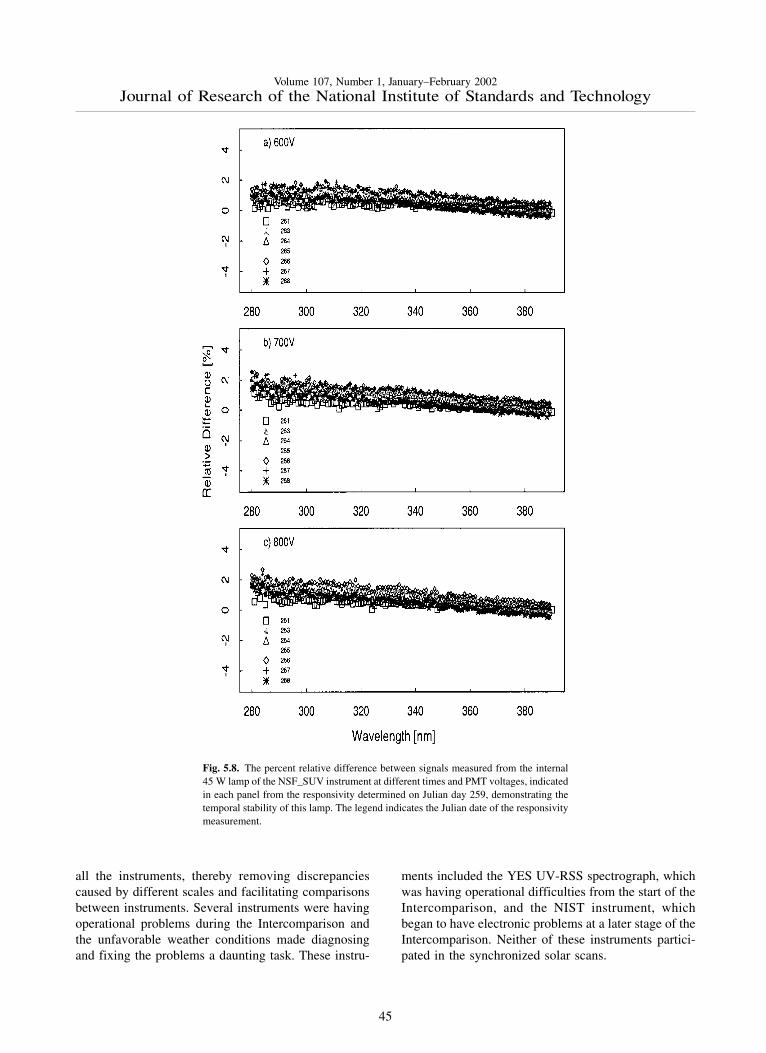
Volume 107, Number 1, January–February 2002Journal of Research of the National Institute of Standards and Technology
all the instruments, thereby removing discrepanciescaused by different scales and facilitating comparisonsbetween instruments. Several instruments were havingoperational problems during the Intercomparison andthe unfavorable weather conditions made diagnosingand fixing the problems a daunting task. These instru-
ments included the YES UV-RSS spectrograph, whichwas having operational difficulties from the start of theIntercomparison, and the NIST instrument, whichbegan to have electronic problems at a later stage of theIntercomparison. Neither of these instruments partici-pated in the synchronized solar scans.
Fig. 5.8. The percent relative difference between signals measured from the internal45 W lamp of the NSF_SUV instrument at different times and PMT voltages, indicatedin each panel from the responsivity determined on Julian day 259, demonstrating thetemporal stability of this lamp. The legend indicates the Julian date of the responsivitymeasurement.
45
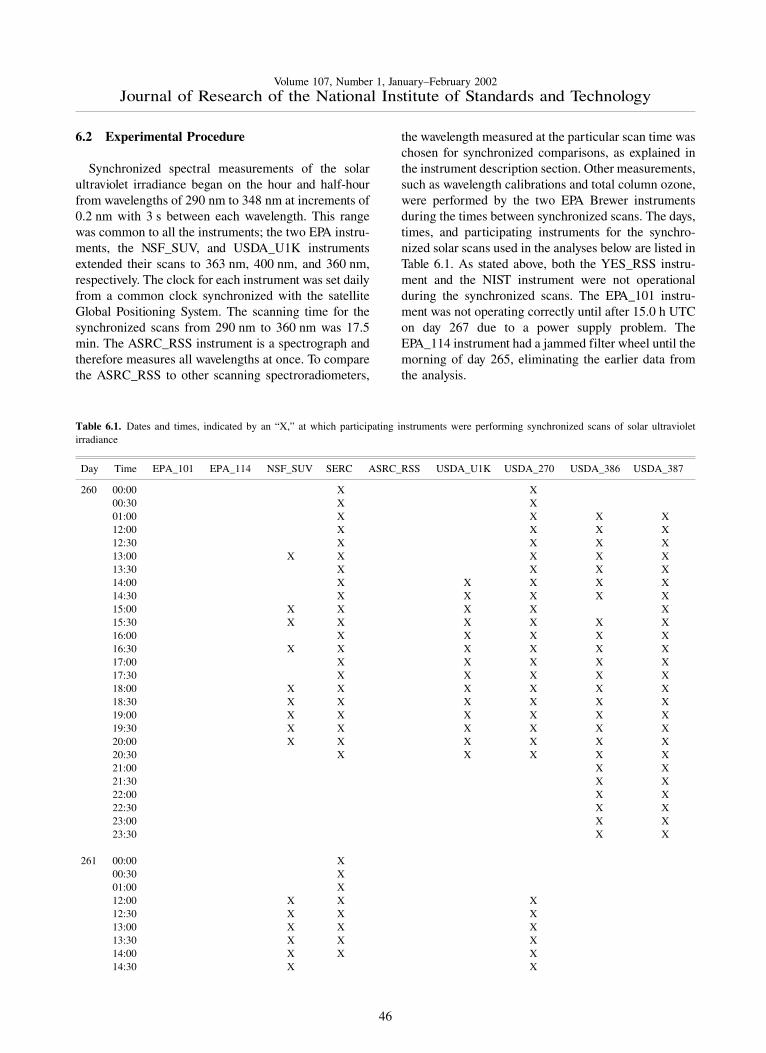
Volume 107, Number 1, January–February 2002Journal of Research of the National Institute of Standards and Technology
6.2 Experimental Procedure
Synchronized spectral measurements of the solarultraviolet irradiance began on the hour and half-hourfrom wavelengths of 290 nm to 348 nm at increments of0.2 nm with 3 s between each wavelength. This rangewas common to all the instruments; the two EPA instru-ments, the NSF_SUV, and USDA_U1K instrumentsextended their scans to 363 nm, 400 nm, and 360 nm,respectively. The clock for each instrument was set dailyfrom a common clock synchronized with the satelliteGlobal Positioning System. The scanning time for thesynchronized scans from 290 nm to 360 nm was 17.5min. The ASRC_RSS instrument is a spectrograph andtherefore measures all wavelengths at once. To comparethe ASRC_RSS to other scanning spectroradiometers,
the wavelength measured at the particular scan time waschosen for synchronized comparisons, as explained inthe instrument description section. Other measurements,such as wavelength calibrations and total column ozone,were performed by the two EPA Brewer instrumentsduring the times between synchronized scans. The days,times, and participating instruments for the synchro-nized solar scans used in the analyses below are listed inTable 6.1. As stated above, both the YES_RSS instru-ment and the NIST instrument were not operationalduring the synchronized scans. The EPA_101 instru-ment was not operating correctly until after 15.0 h UTCon day 267 due to a power supply problem. TheEPA_114 instrument had a jammed filter wheel until themorning of day 265, eliminating the earlier data fromthe analysis.
Table 6.1. Dates and times, indicated by an “X,” at which participating instruments were performing synchronized scans of solar ultravioletirradiance
Day Time EPA_101 EPA_114 NSF_SUV SERC ASRC_RSS USDA_U1K USDA_270 USDA_386 USDA_387
260 00:00 X X00:30 X X01:00 X X X X12:00 X X X X12:30 X X X X13:00 X X X X X13:30 X X X X14:00 X X X X X14:30 X X X X X15:00 X X X X X15:30 X X X X X X16:00 X X X X X16:30 X X X X X X17:00 X X X X X17:30 X X X X X18:00 X X X X X X18:30 X X X X X X19:00 X X X X X X19:30 X X X X X X20:00 X X X X X X20:30 X X X X X21:00 X X21:30 X X22:00 X X22:30 X X23:00 X X23:30 X X
261 00:00 X00:30 X01:00 X12:00 X X X12:30 X X X13:00 X X X13:30 X X X14:00 X X X14:30 X X
46
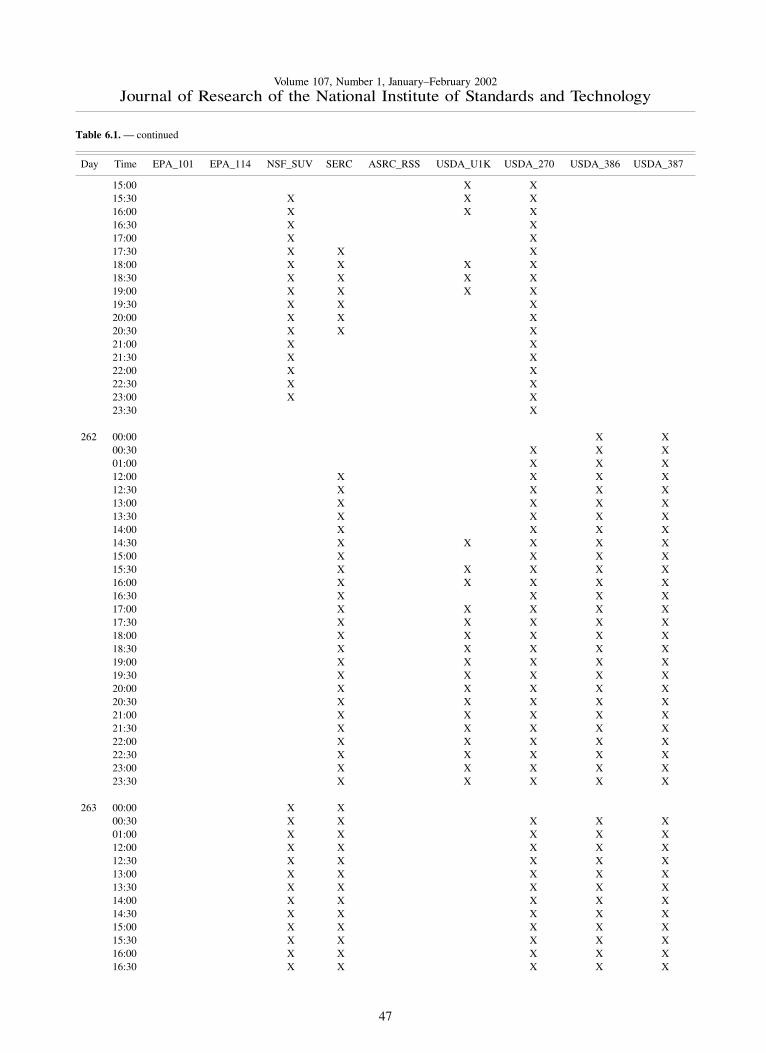
Volume 107, Number 1, January–February 2002Journal of Research of the National Institute of Standards and Technology
Table 6.1. — continued
Day Time EPA_101 EPA_114 NSF_SUV SERC ASRC_RSS USDA_U1K USDA_270 USDA_386 USDA_387
15:00 X X15:30 X X X16:00 X X X16:30 X X17:00 X X17:30 X X X18:00 X X X X18:30 X X X X19:00 X X X X19:30 X X X20:00 X X X20:30 X X X21:00 X X21:30 X X22:00 X X22:30 X X23:00 X X23:30 X
262 00:00 X X00:30 X X X01:00 X X X12:00 X X X X12:30 X X X X13:00 X X X X13:30 X X X X14:00 X X X X14:30 X X X X X15:00 X X X X15:30 X X X X X16:00 X X X X X16:30 X X X X17:00 X X X X X17:30 X X X X X18:00 X X X X X18:30 X X X X X19:00 X X X X X19:30 X X X X X20:00 X X X X X20:30 X X X X X21:00 X X X X X21:30 X X X X X22:00 X X X X X22:30 X X X X X23:00 X X X X X23:30 X X X X X
263 00:00 X X00:30 X X X X X01:00 X X X X X12:00 X X X X X12:30 X X X X X13:00 X X X X X13:30 X X X X X14:00 X X X X X14:30 X X X X X15:00 X X X X X15:30 X X X X X16:00 X X X X X16:30 X X X X X
47
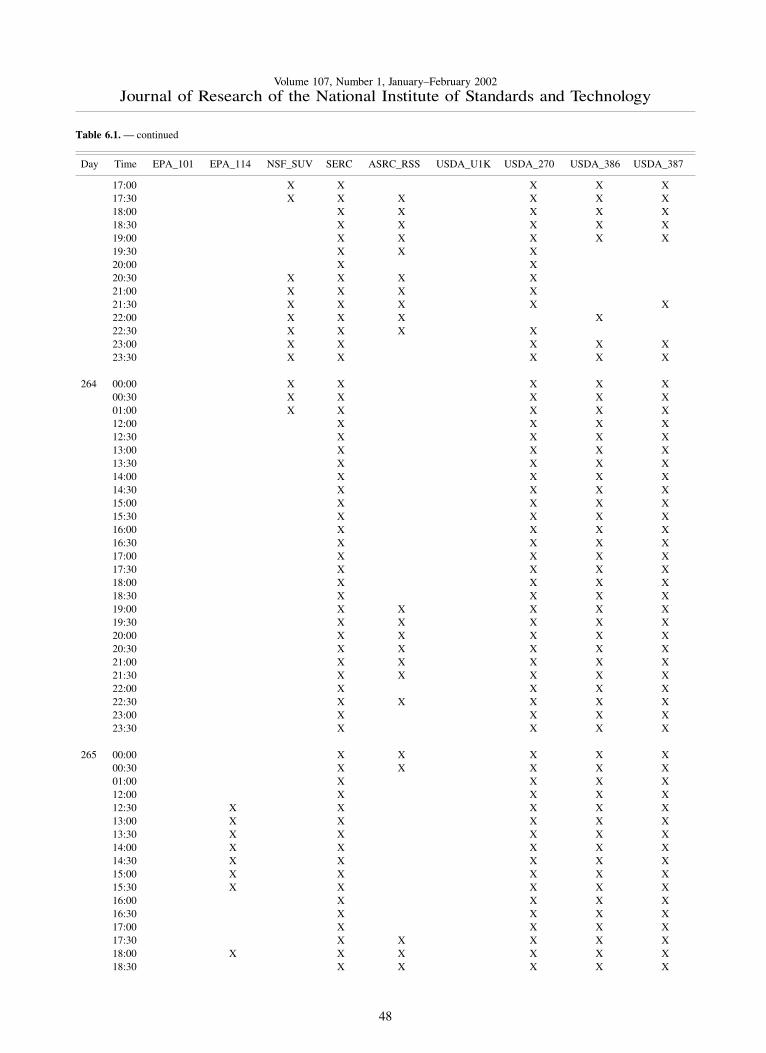
Volume 107, Number 1, January–February 2002Journal of Research of the National Institute of Standards and Technology
Table 6.1. — continued
Day Time EPA_101 EPA_114 NSF_SUV SERC ASRC_RSS USDA_U1K USDA_270 USDA_386 USDA_387
17:00 X X X X X17:30 X X X X X X18:00 X X X X X18:30 X X X X X19:00 X X X X X19:30 X X X20:00 X X20:30 X X X X21:00 X X X X21:30 X X X X X22:00 X X X X22:30 X X X X23:00 X X X X X23:30 X X X X X
264 00:00 X X X X X00:30 X X X X X01:00 X X X X X12:00 X X X X12:30 X X X X13:00 X X X X13:30 X X X X14:00 X X X X14:30 X X X X15:00 X X X X15:30 X X X X16:00 X X X X16:30 X X X X17:00 X X X X17:30 X X X X18:00 X X X X18:30 X X X X19:00 X X X X X19:30 X X X X X20:00 X X X X X20:30 X X X X X21:00 X X X X X21:30 X X X X X22:00 X X X X22:30 X X X X X23:00 X X X X23:30 X X X X
265 00:00 X X X X X00:30 X X X X X01:00 X X X X12:00 X X X X12:30 X X X X X13:00 X X X X X13:30 X X X X X14:00 X X X X X14:30 X X X X X15:00 X X X X X15:30 X X X X X16:00 X X X X16:30 X X X X17:00 X X X X17:30 X X X X X18:00 X X X X X X18:30 X X X X X
48

Volume 107, Number 1, January–February 2002Journal of Research of the National Institute of Standards and Technology
Table 6.1. — continued
Day Time EPA_101 EPA_114 NSF_SUV SERC ASRC_RSS USDA_U1K USDA_270 USDA_386 USDA_387
19:00 X X X X X X19:30 X X X X X X20:00 X X X X X X20:30 X X X X X X21:00 X X X X X X21:30 X X X X X X22:00 X X X X X X22:30 X X X X X X23:00 X X X X X X23:30 X X X X X X
266 00:00 X X X X X00:30 X X X X X01:00 X X X X X12:00 X X X X X12:30 X X X X X13:00 X X X X X13:30 X X X X X14:00 X X X X X14:30 X X X X X15:00 X X X X X X15:30 X X X X X X16:00 X X X X X X16:30 X X X X X X17:00 X X X X X X17:30 X X X X X X18:00 X X X X X X18:30 X X X X X X19:00 X X X X X19:30 X X X X X20:00 X X X X X20:30 X X X X X21:00 X X X X X21:30 X X X X X22:00 X X X X22:30 X X X X23:00 X X X X23:30 X X X X
267 00:00 X X X X X00:30 X X X X X01:00 X X X X12:00 X X X X12:30 X X X X X13:00 X X X X X13:30 X X X X X14:00 X X X X X14:30 X X X X X15:00 X X X X X X X X15:30 X X X X X X X16:00 X X X X X X X X X16:30 X X X X X X X X X17:00 X X X X X X X X X17:30 X X X X X X X X X18:00 X X X X X X X X X18:30 X X X X X X X X19:00 X X X X X X X X19:30 X X X X X X X X20:00 X X X X X X X X X20:30 X X X X X X X X X
49
Volume 107, Number 1, January–February 2002Journal of Research of the National Institute of Standards and Technology
6.3 Data Analysis
For all instruments, the measured signal was cor-rected before the irradiance was calculated. For the twoEPA instruments, the signal was converted to a photonrate [4] with dark subtraction and dead-time correction.Dark subtraction was performed on the NSF_SUVinstrument by averaging all the signals at wavelengthsshorter than 290 nm and subtracting this value from allthe signals of the scan. Dark subtraction and averagingthe signals over the 17.5 min of the synchronized scanswas performed for the SERC instrument. The average ofthe dark signals obtained immediately before and aftera synchronized scan of the USDA_U1K instrument wassubtracted from all the signals of the scan. For theASRC_RSS instrument, the exposure time of the CCDarray was set for 10 s with the shutter open to measurethe total irradiance signal, and then the exposure was setfor 10 s while the shutter was closed to measure the darksignal. The dark signal was then subtracted from thetotal signal.
The stray-light rejection of the instruments, shown inFig. 5.2, can result in relatively large signals at theshortest wavelengths. To account for this, stray-lightsubtraction was employed for the EPA instruments. Thesignals at wavelengths shorter than 292 nm wereaveraged and subtracted from all signals from the scan.It was these signals with the stray-light subtraction thatwere divided by the responsivity to obtain the solarultraviolet irradiance. The subtraction used for theNSF_SUV instrument would also correct for stray-lightif it exists. The stray-light rejection of the USDA_U1Kinstrument was sufficient and no correction to thesignals at the shortest wavelengths was necessary.
The method used to determine the responsivity of theNSF_SUV instrument during solar scans complicatedthe data analysis. The usual procedure with this instru-ment is to transfer the spectral irradiance scale of the
Table 6.1. — continued
Day Time EPA_101 EPA_114 NSF_SUV SERC ASRC_RSS USDA_U1K USDA_270 USDA_386 USDA_387
21:00 X X X X X X X X X21:30 X X X X X X X X X22:00 X X X X X X X X X22:30 X X X X X X X X X23:00 X X X X X X X X X23:30 X X X X X X X X
268 00:00 X X X X X X X00:30 X X X X X X01:00 X X X X X X12:00 X X X X12:30 X X X X X13:00 X X X X X13:30 X X X X X14:00 X X X X X
external 200 W lamp to the internal 45 W lamp fromspectral scans of both lamps with the same high voltageon the PMT. Different high voltages are used for scansof the solar irradiance, and the responsivity of theinstrument is dependent upon the high voltage. There-fore, the internal lamp is scanned at least daily at allPMT high voltages that are used for solar measure-ments. To use the NIST irradiance scale with thisprocedure, the scale was transferred to the NSF external200 W lamp from the scan of the NIST standard lamp at800 V, and this new scale for the external lamp wasthen used with scans of the internal 45 W lamp. Theresponsivity of the instrument at any high voltage wasdetermined from the scan of the 45 W lamp at the samehigh voltage that occurred closest in time to the scan ofthe solar irradiance. To maintain consistency with theNSF_SUV procedure for responsivity, the responsivitiesused to calculate the solar irradiance were thosedetermined closest in time to the synchronized scans.
The responsivities of the EPA instruments were deter-mined every 3.5 nm while the solar irradiance scans aredetermined every 0.2 nm. Because of the filter changeout after 325 nm, the responsivities were extrapolatedfrom 328.5 nm to 325.01 nm and from 360 nm to363 nm using second-order polynomials. The extrapo-lation for the responsivity of the EPA instrument doescause some additional uncertainties around 325.0 nmfor this analysis that are then propagated in the solarirradiance scans. Typically, the EPA Network deter-mines the responsivity at the same wavelengths as thesolar irradiance scans and this is therefore not a problem.From Eq. (6.1), the irradiance at a given wavelength isthe signal at that wavelength divided by the responsivityat that same wavelength; because the responsivities ofthe EPA instrument were not determined at all thewavelengths of the synchronized solar scans, the respon-sivities at these wavelengths were calculated from
50
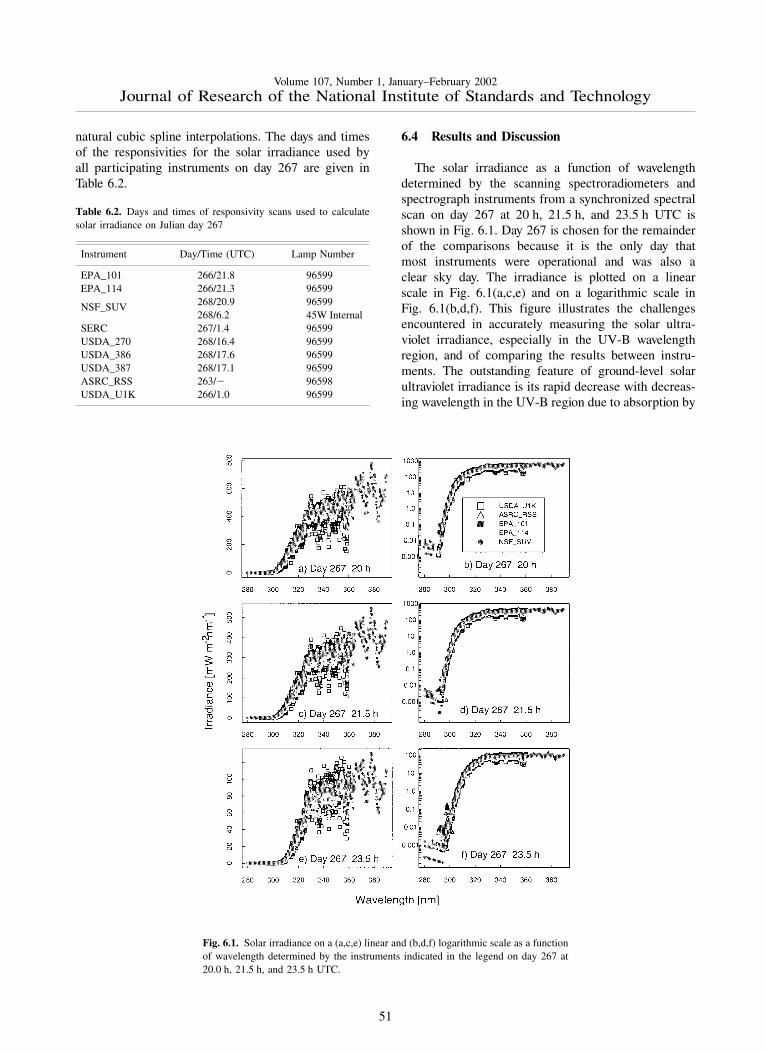
Volume 107, Number 1, January–February 2002Journal of Research of the National Institute of Standards and Technology
natural cubic spline interpolations. The days and timesof the responsivities for the solar irradiance used byall participating instruments on day 267 are given inTable 6.2.
6.4 Results and Discussion
The solar irradiance as a function of wavelengthdetermined by the scanning spectroradiometers andspectrograph instruments from a synchronized spectralscan on day 267 at 20 h, 21.5 h, and 23.5 h UTC isshown in Fig. 6.1. Day 267 is chosen for the remainderof the comparisons because it is the only day thatmost instruments were operational and was also aclear sky day. The irradiance is plotted on a linearscale in Fig. 6.1(a,c,e) and on a logarithmic scale inFig. 6.1(b,d,f). This figure illustrates the challengesencountered in accurately measuring the solar ultra-violet irradiance, especially in the UV-B wavelengthregion, and of comparing the results between instru-ments. The outstanding feature of ground-level solarultraviolet irradiance is its rapid decrease with decreas-ing wavelength in the UV-B region due to absorption by
Table 6.2. Days and times of responsivity scans used to calculatesolar irradiance on Julian day 267
Instrument Day/Time (UTC) Lamp Number
EPA_101 266/21.8 96599EPA_114 266/21.3 96599
NSF_SUV 268/20.9 96599268/6.2 45W Internal
SERC 267/1.4 96599USDA_270 268/16.4 96599USDA_386 268/17.6 96599USDA_387 268/17.1 96599ASRC_RSS 263/� 96598USDA_U1K 266/1.0 96599
Fig. 6.1. Solar irradiance on a (a,c,e) linear and (b,d,f) logarithmic scale as a functionof wavelength determined by the instruments indicated in the legend on day 267 at20.0 h, 21.5 h, and 23.5 h UTC.
51
Volume 107, Number 1, January–February 2002Journal of Research of the National Institute of Standards and Technology
ozone, as illustrated in Fig. 6.1(b,d,f). The irradiancedecreases by five to six orders of magnitude from325 nm to 290 nm, which imposes stringent require-ments on the instruments in terms of wavelengthaccuracy and stray-light rejection (see Sec. 5). Inthe region of steepest decrease, a relatively smalluncertainty in wavelength translates into a large uncer-tainty in irradiance. An accurate measurement of theirradiance at the shortest wavelengths requires the bestpossible stray-light rejection so the signal is notdominated by light from wavelengths longer than thenominal one.
The moderately structured nature of the solar spectralirradiance, as shown in Fig. 6.1(a,c,e) for wavelengthsgreater than 310 nm, complicates comparisons betweeninstruments. While the structure of the spectral irradi-ance is consistent among instruments, with maximaand minima occurring at approximately the same wave-lengths, the effect of the different bandwidths is alsoapparent. As the bandwidths of the instruments increasefrom USDA_U1K, ASRC_RSS, EPA, to NSF_SUV themeasured spectral irradiance becomes smoother. Themaxima and minima measured by the USDA_U1Kinstrument are more pronounced than those measuredby the EPA instruments, for instance, and virtually nostructure is evident with the filter instruments (SERC,UVMFRSR). The solar irradiance plotted on a logarith-mic scale gives an indicator of which instruments arecapable of measuring below 300 nm.
The problem remains of how to compare the solarirradiance measured by instruments with different band-widths. While deconvolution and spectral synthesistechniques are being investigated, for convenience theapproach taken for this paper is to convolve the irradi-ance with a common slit-scattering function [20, 21].This assumes the instruments are accurately measuringthe solar irradiance, so that the convolution is approxi-mating the solar irradiance that would be obtained by ahypothetical instrument with a given slit-scatteringfunction. The results are presented in order of increasingcomplexity of the slit-scattering function used inthe convolution. In the simplest case, the solar irradi-ance from the scanning spectroradiometers and spec-trograph instruments (ASRC_RSS, EPA_101,EPA_114, NSF_SUV, and USDA_U1K) are comparedby convolving each irradiance with a 1 nm FWHM idealtriangular slit-scattering function. Therefore, the effectof this convolution is that all the instruments have thesame 1 nm triangular bandwidth. This method is used tocompare all the instruments except the narrow bandfilter instruments. The final convolution techniqueallows comparisons among all the instruments. The goalis to produce a pseudo-measurement from the spectraldata that approximates what the filter instrument would
see by using the filter transmittances of the SERC,USDA_270, USDA_386 and USDA_387 instru-ments. This approach does not require any additionalknowledge about the atmosphere, solar spectral irradi-ance, or radiative transfer. The irradiance Ej at filterchannel j for each scanning instrument is given by
Ej = �i
E (�i )�j (�i ) /�i
�j (�i ) , (6.2)
where i indexes the wavelengths �i and �j is the filtertransmittance for channel j .
The relative standard deviation is the quantity used toquantify the agreement between instruments and is thestandard deviation of the solar irradiance divided by theaverage irradiance at each wavelength. The relativedifference is also used to convey the spread of valuesand is a good indicator of each instrument’s perfor-mance. The relative difference is given by the solarirradiance measured by a particular instrument minusthe average of the solar irradiance divided by theaverage solar irradiance at each wavelength. Because allthe instruments performed synchronized spectral scansunder nominally identical conditions, they are assumedto have been exposed to the same spectral irradiance.However, each instrument measured an independentvalue for the solar irradiance, and therefore the relativedifference of these independent values is used toindicate the agreement between instruments.
The results presented here focus on the irradiancemeasured on day 267 at 16.5 h UTC since all theinstruments were operating correctly and the sky wasclear. The relative difference of the solar irradianceconvolved with a 1 nm triangular slit-function for theinstrument given in the legend to the average solar irra-diance of all the instruments given in the legend isshown in Fig. 6.2 a-c. The relative differences inFig. 6.2 a use the triangular convolution and rangefrom –8 % to 25 % for wavelengths greater than305 nm. This is greater than expected from thepropagation of uncertainties. The NSF_SUV instrumentis noticeably higher than the other spectroradiometersand also shows significant spectral structure (Fig. 6.2 a).The significant spectral structure for the NSF_SUV datain Fig. 6.2 a suggests a wavelength calibration problem.A spectral shift of the data of approximately 0.3 nmcorrects the discrepancy. A further analysis revealed aprogramming error in a wavelength calibration routineused by the NSF_SUV instrument. This program is notgenerally used in routine remote operations but wasused as an additional check. The program is designed todetermine the position of the 253.652 nm Hg line inmeasured wavelength scans, subtract this positionfrom the nominal value of 253.652 nm and adjust the
52
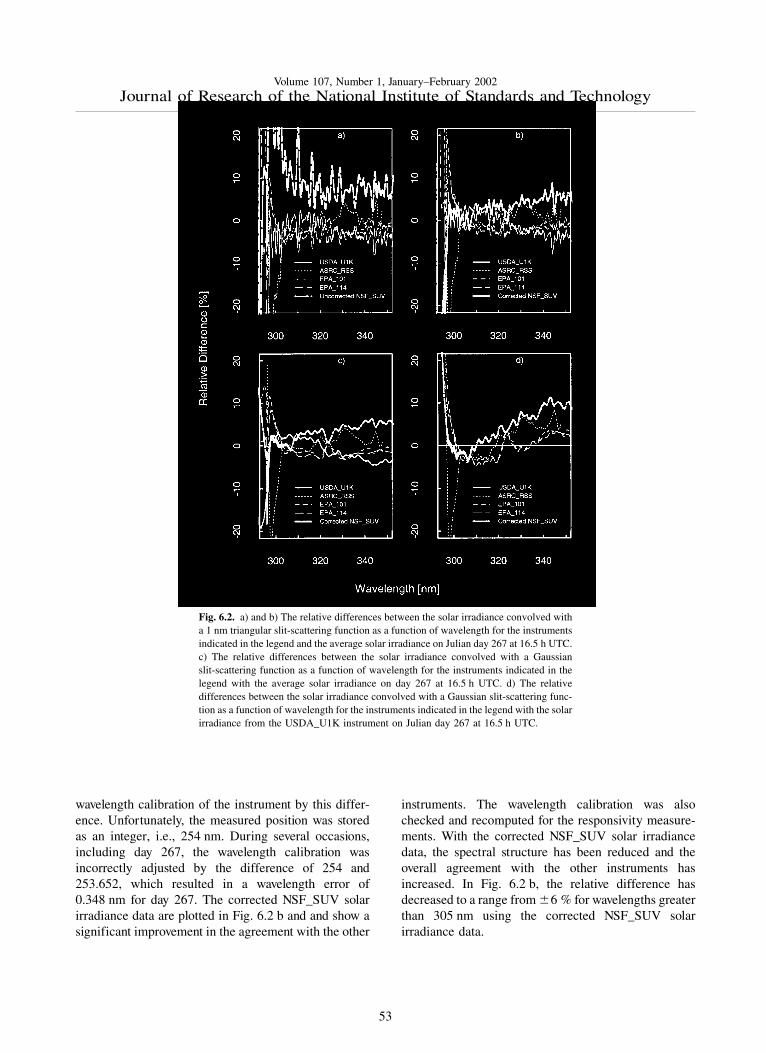
Volume 107, Number 1, January–February 2002Journal of Research of the National Institute of Standards and Technology
wavelength calibration of the instrument by this differ-ence. Unfortunately, the measured position was storedas an integer, i.e., 254 nm. During several occasions,including day 267, the wavelength calibration wasincorrectly adjusted by the difference of 254 and253.652, which resulted in a wavelength error of0.348 nm for day 267. The corrected NSF_SUV solarirradiance data are plotted in Fig. 6.2 b and and show asignificant improvement in the agreement with the other
instruments. The wavelength calibration was alsochecked and recomputed for the responsivity measure-ments. With the corrected NSF_SUV solar irradiancedata, the spectral structure has been reduced and theoverall agreement with the other instruments hasincreased. In Fig. 6.2 b, the relative difference hasdecreased to a range from �6 % for wavelengths greaterthan 305 nm using the corrected NSF_SUV solarirradiance data.
Fig. 6.2. a) and b) The relative differences between the solar irradiance convolved witha 1 nm triangular slit-scattering function as a function of wavelength for the instrumentsindicated in the legend and the average solar irradiance on Julian day 267 at 16.5 h UTC.c) The relative differences between the solar irradiance convolved with a Gaussianslit-scattering function as a function of wavelength for the instruments indicated in thelegend with the average solar irradiance on day 267 at 16.5 h UTC. d) The relativedifferences between the solar irradiance convolved with a Gaussian slit-scattering func-tion as a function of wavelength for the instruments indicated in the legend with the solarirradiance from the USDA_U1K instrument on Julian day 267 at 16.5 h UTC.
53

Volume 107, Number 1, January–February 2002Journal of Research of the National Institute of Standards and Technology
In contrast, convolving with a Gaussian slit-scatteringfunction results in relative differences that range from�5 % and are approximately the same as those expectedfrom the propagation of uncertainties. Here, the minimaand maxima have decreased from the triangular con-volution in Fig. 6.2 b. The decreased relative differencesrelative to those obtained with a triangular convolutionare primarily a result of convolving with a functionwhich includes all the wavelengths from the spectralscan, and not a limited number as with the triangularconvolution. However, convolving with a Gaussianfunction is a reasonable method for comparingirradiance measured by instruments with differentbandwidths since all the convolved irradiances includethe bandwidths of all the instruments. The discrepanciesbetween instruments increase significantly below300 nm and are in part due to differences in stray-lightrejection (see Sec. 5.1). An instrument with poor stray-light rejection is expected to have a larger signal than the
true value. Because the USDA_U1K instrument wasshown to have the best stray-light rejection (�10–10), thepercent relative difference is plotted relative to theUSDA_U1K solar irradiance data (Fig. 6.2 d). TheASRC_RSS instrument is showing unusual behaviorstarting around 303 nm, becoming more pronouncedas the day progressed; this feature is unexplained.Excluding the data from the ASRC_RSS instrument, theUSDA_U1K instrument has the lowest irradiance at theshorter wavelengths and the NSF_SUV instrument,which is also a double monochromator, measures lessthan the Brewer spectroradiometers at these shorterwavelengths.
The relative standard deviations of the solar irradi-ances measured by the five instruments from Figs. 6.2 band 6.2 c are shown in Fig. 6.3. For the triangle slitscattering function the relative standard deviation isless than 5 % for wavelengths longer than 305 nm(Fig. 6.3 a) and for the Gaussian slit scattering
Fig. 6.3. The relative standard deviation of the solar irradiance at 16.5 h UTC of thespectral instruments convolved with a (a) triangle slit-scattering function and a (b)Gaussian slit-scattering function.
54

Volume 107, Number 1, January–February 2002Journal of Research of the National Institute of Standards and Technology
function the relative standard deviation is less than 4 %(Fig. 6.3 b). In general, the convolution removes most ofthe discrepancies due to differences in bandwidth. Thedifferences in bandwidth and the wavelength uncertain-ties among the instruments are responsible for much ofthe spectral structure observed in the relative differ-ences. Using the same analysis used previously [4]and assuming a 2 % relative standard deviation from allother sources, a wavelength uncertainty of approxi-mately 0.1 nm would account for the relative differencesin Fig. 6.2 d.
Figure 6.4 illustrates the relative differences betweeninstruments with changing solar zenith angle (SZA).Figure 6.4 gives the solar irradiance convolved withGaussian slit-scattering function versus wavelength forthe instruments indicated in the legend for four differenttimes indicated in the title (16 h, 20 h, 21.5 h, and 23.5 hUTC or 56.4�, 43.2�, 54�, and 74.5� SZA). The relativedifferences generally increase with increasing solar
zenith angle, partly due to the increased uncertainties inthe measurements, but also due to differences betweenthe instruments. This could possibly be due to either thedifferences in the angular response of the detectors orthe linearity of the detectors. Interestingly, the EPAinstruments are grouped together and decrease relativeto the USDA_U1K, ASRC_RSS, and the NSF_SUV asthe solar zenith angle increases. This is consistent withtheir angular response because the angular response ofthe USDA_U1K, ASRC_RSS and the NSF_SUV instru-ment are in general closer to ideal than the two EPAinstruments. Instruments with a non-ideal angularresponse measure less irradiance than the true irradi-ance and as the solar zenith angle increases the angularresponse error typically increases. For instance, theBrewer instruments are estimated to measure approxi-mately 3 % low at high sun and 8 % low at low sun dueto angular response error based on a typical measuredangular response and model calculations of the sky
Fig. 6.4. (a) (d) The relative differences between the solar irradiance convolved with aGaussian slit-scattering function of the instrument indicated in the legend to the averageconvolved solar irradiance as a function of wavelength on day 267 at 16 h, 20 h, 21.5 h,and 23.5 h UTC (56.4�, 43.2�, 54�, and 74.5� SZA, respectively).
55
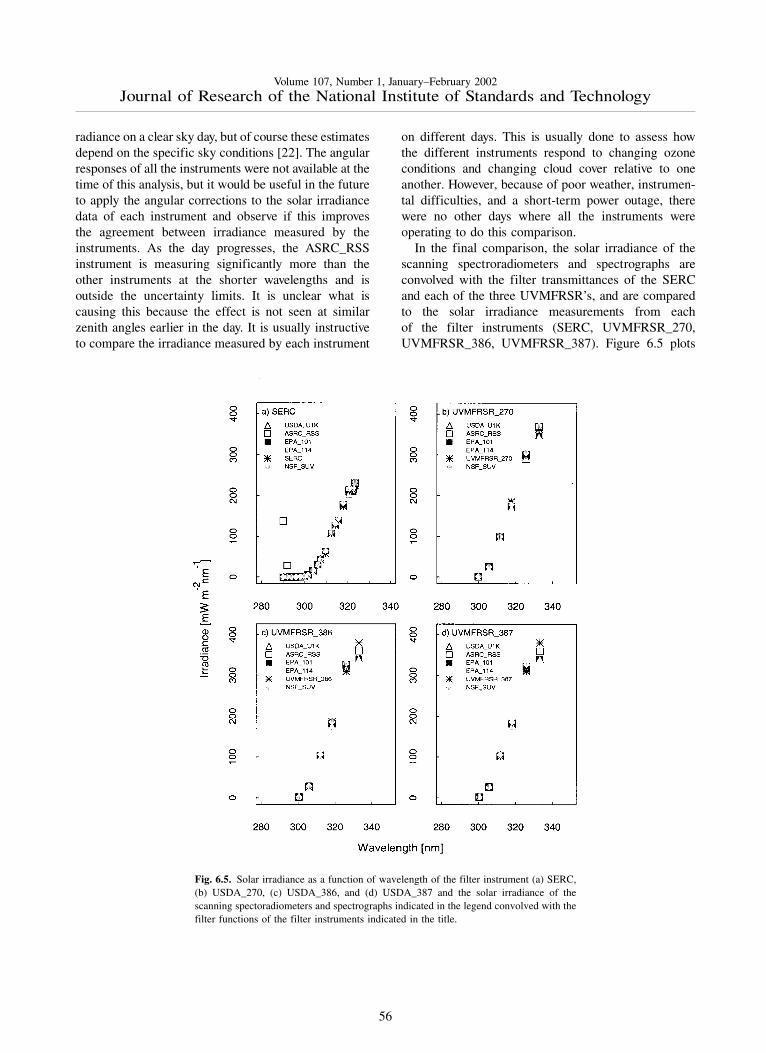
Volume 107, Number 1, January–February 2002Journal of Research of the National Institute of Standards and Technology
radiance on a clear sky day, but of course these estimatesdepend on the specific sky conditions [22]. The angularresponses of all the instruments were not available at thetime of this analysis, but it would be useful in the futureto apply the angular corrections to the solar irradiancedata of each instrument and observe if this improvesthe agreement between irradiance measured by theinstruments. As the day progresses, the ASRC_RSSinstrument is measuring significantly more than theother instruments at the shorter wavelengths and isoutside the uncertainty limits. It is unclear what iscausing this because the effect is not seen at similarzenith angles earlier in the day. It is usually instructiveto compare the irradiance measured by each instrument
on different days. This is usually done to assess howthe different instruments respond to changing ozoneconditions and changing cloud cover relative to oneanother. However, because of poor weather, instrumen-tal difficulties, and a short-term power outage, therewere no other days where all the instruments wereoperating to do this comparison.
In the final comparison, the solar irradiance of thescanning spectroradiometers and spectrographs areconvolved with the filter transmittances of the SERCand each of the three UVMFRSR’s, and are comparedto the solar irradiance measurements from eachof the filter instruments (SERC, UVMFRSR_270,UVMFRSR_386, UVMFRSR_387). Figure 6.5 plots
Fig. 6.5. Solar irradiance as a function of wavelength of the filter instrument (a) SERC,(b) USDA_270, (c) USDA_386, and (d) USDA_387 and the solar irradiance of thescanning spectoradiometers and spectrographs indicated in the legend convolved with thefilter functions of the filter instruments indicated in the title.
56
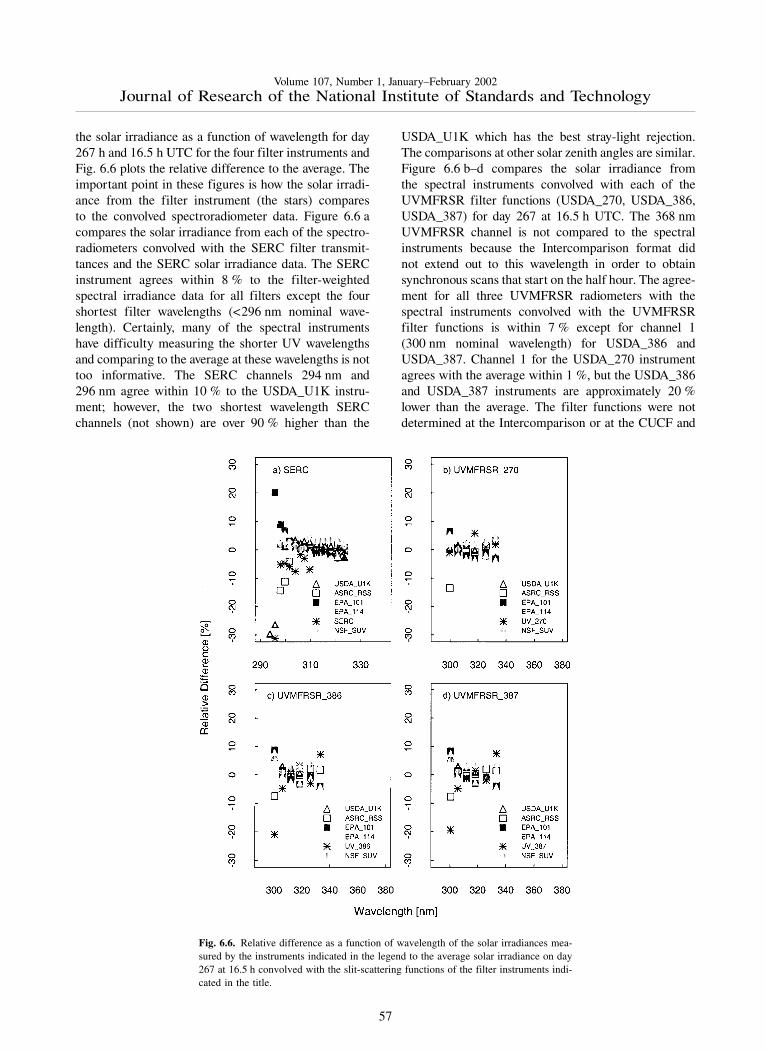
Volume 107, Number 1, January–February 2002Journal of Research of the National Institute of Standards and Technology
the solar irradiance as a function of wavelength for day267 h and 16.5 h UTC for the four filter instruments andFig. 6.6 plots the relative difference to the average. Theimportant point in these figures is how the solar irradi-ance from the filter instrument (the stars) comparesto the convolved spectroradiometer data. Figure 6.6 acompares the solar irradiance from each of the spectro-radiometers convolved with the SERC filter transmit-tances and the SERC solar irradiance data. The SERCinstrument agrees within 8 % to the filter-weightedspectral irradiance data for all filters except the fourshortest filter wavelengths (<296 nm nominal wave-length). Certainly, many of the spectral instrumentshave difficulty measuring the shorter UV wavelengthsand comparing to the average at these wavelengths is nottoo informative. The SERC channels 294 nm and296 nm agree within 10 % to the USDA_U1K instru-ment; however, the two shortest wavelength SERCchannels (not shown) are over 90 % higher than the
USDA_U1K which has the best stray-light rejection.The comparisons at other solar zenith angles are similar.Figure 6.6 b–d compares the solar irradiance fromthe spectral instruments convolved with each of theUVMFRSR filter functions (USDA_270, USDA_386,USDA_387) for day 267 at 16.5 h UTC. The 368 nmUVMFRSR channel is not compared to the spectralinstruments because the Intercomparison format didnot extend out to this wavelength in order to obtainsynchronous scans that start on the half hour. The agree-ment for all three UVMFRSR radiometers with thespectral instruments convolved with the UVMFRSRfilter functions is within 7 % except for channel 1(300 nm nominal wavelength) for USDA_386 andUSDA_387. Channel 1 for the USDA_270 instrumentagrees with the average within 1 %, but the USDA_386and USDA_387 instruments are approximately 20 %lower than the average. The filter functions were notdetermined at the Intercomparison or at the CUCF and
Fig. 6.6. Relative difference as a function of wavelength of the solar irradiances mea-sured by the instruments indicated in the legend to the average solar irradiance on day267 at 16.5 h convolved with the slit-scattering functions of the filter instruments indi-cated in the title.
57
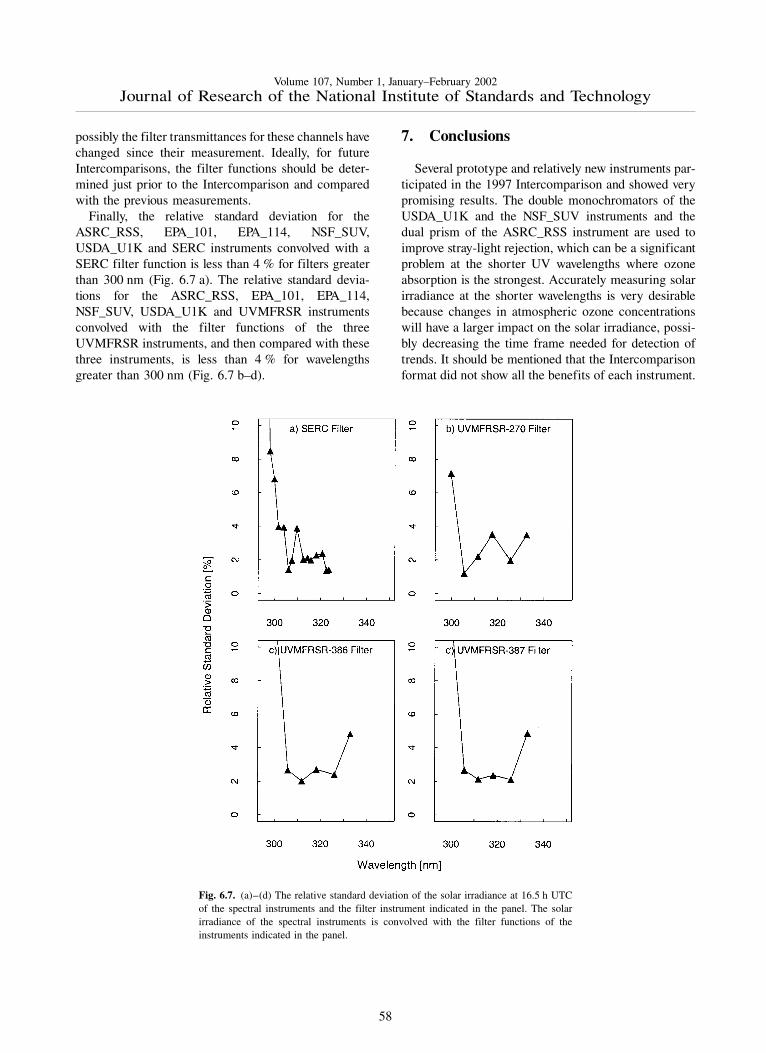
Volume 107, Number 1, January–February 2002Journal of Research of the National Institute of Standards and Technology
possibly the filter transmittances for these channels havechanged since their measurement. Ideally, for futureIntercomparisons, the filter functions should be deter-mined just prior to the Intercomparison and comparedwith the previous measurements.
Finally, the relative standard deviation for theASRC_RSS, EPA_101, EPA_114, NSF_SUV,USDA_U1K and SERC instruments convolved with aSERC filter function is less than 4 % for filters greaterthan 300 nm (Fig. 6.7 a). The relative standard devia-tions for the ASRC_RSS, EPA_101, EPA_114,NSF_SUV, USDA_U1K and UVMFRSR instrumentsconvolved with the filter functions of the threeUVMFRSR instruments, and then compared with thesethree instruments, is less than 4 % for wavelengthsgreater than 300 nm (Fig. 6.7 b–d).
7. Conclusions
Several prototype and relatively new instruments par-ticipated in the 1997 Intercomparison and showed verypromising results. The double monochromators of theUSDA_U1K and the NSF_SUV instruments and thedual prism of the ASRC_RSS instrument are used toimprove stray-light rejection, which can be a significantproblem at the shorter UV wavelengths where ozoneabsorption is the strongest. Accurately measuring solarirradiance at the shorter wavelengths is very desirablebecause changes in atmospheric ozone concentrationswill have a larger impact on the solar irradiance, possi-bly decreasing the time frame needed for detection oftrends. It should be mentioned that the Intercomparisonformat did not show all the benefits of each instrument.
Fig. 6.7. (a)–(d) The relative standard deviation of the solar irradiance at 16.5 h UTCof the spectral instruments and the filter instrument indicated in the panel. The solarirradiance of the spectral instruments is convolved with the filter functions of theinstruments indicated in the panel.
58

Volume 107, Number 1, January–February 2002Journal of Research of the National Institute of Standards and Technology
For instance, the ASRC_RSS and the YES_RSSspectrograph instruments, and the UVMFRSRs arecapable of measuring all wavelengths simultaneously,and the SERC instrument performs a scan every 4.3 s,which is desirable when investigating a rapidly changingatmosphere such as cloud effects on solar irradiance.These same instruments except the SERC are alsorotating shadowband radiometers that are capable ofmeasuring the total irradiance and the diffuse beam,and consequently the direct beam from subtraction.The NSF_SUV instrument is capable of measuringirradiance out to 600 nm, which is useful for manyapplications in atmospheric research.
As in previous years, the 1997 Intercomparisoncharacterized instruments for stray-light, bandwidth,and wavelength accuracy using spectral lines from aHeCd laser, and Hg, Cd, and Zn lamps. These results aresummarized in Table 5.1. The stray-light rejections ofthe instruments were consistent with those expected forsingle- and double-grating monochromators and forinterference filters. The bandwidths of the EPA_101,EPA_114, and the NIST scanning instruments decreasedwith increasing wavelength. The bandwidth of thespectrograph instruments, ASRC_RSS and YES_RSS,increased with increasing wavelength. The bandwidth ofthe NSF_SUV and the USDA_U1K remained relativelyconstant with wavelength. Many of the newer instru-ments, ASRC_RSS, NIST, USDA_U1K, and YES_RSS,showed very good wavelength accuracy of better than0.02 nm. For the EPA instruments, the wavelengthuncertainties showed some dependence on wavelength.The wavelength accuracy of the NSF_SUV instrumentwas less than expected but this is attributable to an errorin a wavelength calibration routine that has subsequentlybeen remedied.
The spectral irradiance responsivity of the instru-ments was determined several times outdoors with theNOAA horizontally calibrated 1000 W lamps using theNOAA field calibrator. The temporal stability of theresponsivities is very important for reliability of spectralsolar irradiance measurements and should change aslittle as possible while the instruments are monitoringsolar ultraviolet irradiance. There was not sufficient datato completely assess the temporal stability of the instru-ments under a variety of conditions but the responsivitywas determined several times to get an indication of thestability. In this current set of spectroradiometers, theresponsivities do not change more than 5 % over 5 days
except for the NIST instrument, which had electronicproblems related to the weather because the instrumentwas not weatherproof, and the UVMFRSR_270 whichmay have had an insufficient warm-up time prior to themeasurement. The responsivity of the ASRC_RSS in-strument had a negligible offset from one scan to thenext but scatter of approximately 10 % at the shortand long wavelengths, which is attributed to the lowsensitivity of the MOS detector.
Synchronized solar irradiance scans from 290 nm to360 nm were performed every half-hour during theIntercomparison. Because the instruments had differentbandwidths, the measured irradiances were convolvedto common bandwidths by using both triangular andGaussian slit scattering functions and the filter transmit-tances of the filter-based instruments. The agreementamong the convolved irradiances was described by theirrelative difference from the average. The relativestandard deviation in the solar irradiance convolved witha triangular slit-scattering function between the spectralinstruments was within 5 % using the correctedNSF_SUV data for wavelengths greater than 300 nmon day 267 at 16.5 h UTC. With the Gaussian slit-scattering function the relative standard deviation waswithin 4 %. The ASRC_RSS instrument deviates fromthe average more than expected for 300 nm to 305 nmand the problem becomes more severe as the day pro-gresses. The changes in the relative differences of thespectral instruments with increasing solar zenith angleindicates a possible difference in the angularresponses of the instruments, suggesting the need forcorrections or improvements in the Lambertian qualityof the diffusers and linearity of the detectors. Therelative standard deviation of the solar irradiance at16.5 h UTC including the filter instruments was 4 % forwavelengths above 300 nm. The solar irradiances forfilter wavelengths down to 296 nm agree within 10 % tothose of the USDA_U1K instrument on day 267 at16.5 h UTC.
In conclusion, this Intercomparison was successful atcharacterizing the instruments and comparing the newerinstruments with existing UV spectroradiometers. Evenwith difficult weather, all the instrument characteriza-tions could be performed outdoors. The results from thedata yielded valuable information about the performanceof the instruments, especially the prototype instruments,and suggested possible improvements in techniques anddesign.
59
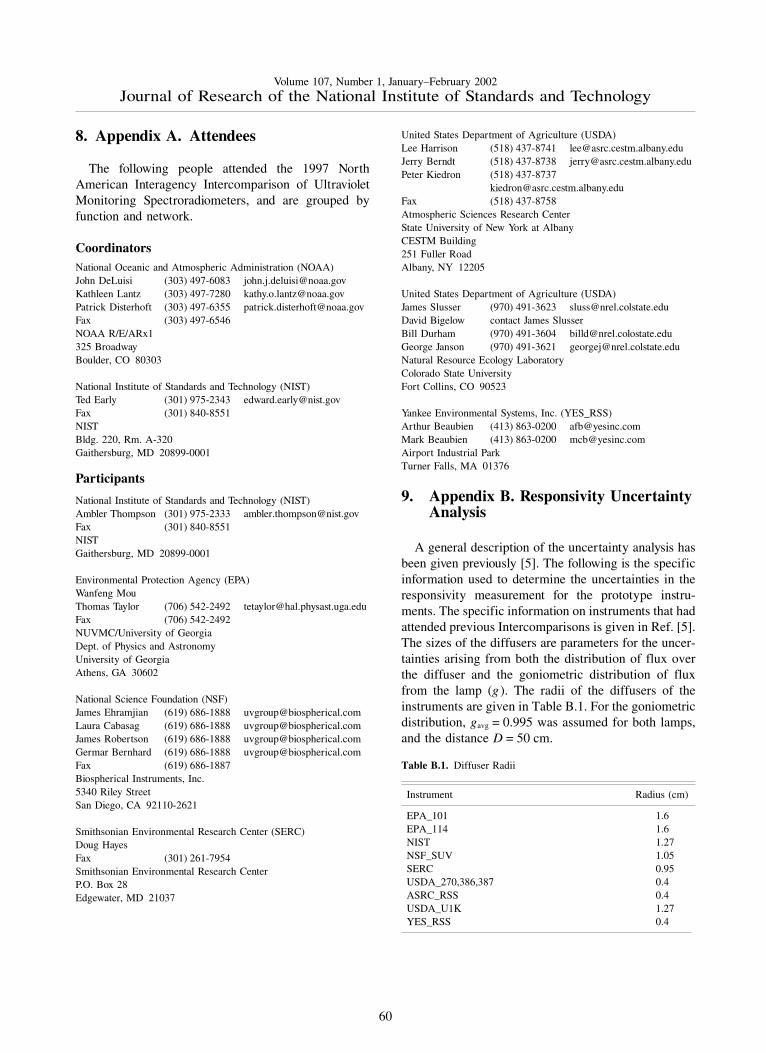
Volume 107, Number 1, January–February 2002Journal of Research of the National Institute of Standards and Technology
8. Appendix A. Attendees
The following people attended the 1997 NorthAmerican Interagency Intercomparison of UltravioletMonitoring Spectroradiometers, and are grouped byfunction and network.
CoordinatorsNational Oceanic and Atmospheric Administration (NOAA)John DeLuisi (303) 497-6083 [email protected] Lantz (303) 497-7280 [email protected] Disterhoft (303) 497-6355 [email protected] (303) 497-6546NOAA R/E/ARx1325 BroadwayBoulder, CO 80303
National Institute of Standards and Technology (NIST)Ted Early (301) 975-2343 [email protected] (301) 840-8551NISTBldg. 220, Rm. A-320Gaithersburg, MD 20899-0001
Participants
National Institute of Standards and Technology (NIST)Ambler Thompson (301) 975-2333 [email protected] (301) 840-8551NISTGaithersburg, MD 20899-0001
Environmental Protection Agency (EPA)Wanfeng MouThomas Taylor (706) 542-2492 [email protected] (706) 542-2492NUVMC/University of GeorgiaDept. of Physics and AstronomyUniversity of GeorgiaAthens, GA 30602
National Science Foundation (NSF)James Ehramjian (619) 686-1888 [email protected] Cabasag (619) 686-1888 [email protected] Robertson (619) 686-1888 [email protected] Bernhard (619) 686-1888 [email protected] (619) 686-1887Biospherical Instruments, Inc.5340 Riley StreetSan Diego, CA 92110-2621
Smithsonian Environmental Research Center (SERC)Doug HayesFax (301) 261-7954Smithsonian Environmental Research CenterP.O. Box 28Edgewater, MD 21037
United States Department of Agriculture (USDA)Lee Harrison (518) 437-8741 [email protected] Berndt (518) 437-8738 [email protected] Kiedron (518) 437-8737
[email protected] (518) 437-8758Atmospheric Sciences Research CenterState University of New York at AlbanyCESTM Building251 Fuller RoadAlbany, NY 12205
United States Department of Agriculture (USDA)James Slusser (970) 491-3623 [email protected] Bigelow contact James SlusserBill Durham (970) 491-3604 [email protected] Janson (970) 491-3621 [email protected] Resource Ecology LaboratoryColorado State UniversityFort Collins, CO 90523
Yankee Environmental Systems, Inc. (YES_RSS)Arthur Beaubien (413) 863-0200 [email protected] Beaubien (413) 863-0200 [email protected] Industrial ParkTurner Falls, MA 01376
9. Appendix B. Responsivity UncertaintyAnalysis
A general description of the uncertainty analysis hasbeen given previously [5]. The following is the specificinformation used to determine the uncertainties in theresponsivity measurement for the prototype instru-ments. The specific information on instruments that hadattended previous Intercomparisons is given in Ref. [5].The sizes of the diffusers are parameters for the uncer-tainties arising from both the distribution of flux overthe diffuser and the goniometric distribution of fluxfrom the lamp (g ). The radii of the diffusers of theinstruments are given in Table B.1. For the goniometricdistribution, gavg = 0.995 was assumed for both lamps,and the distance D = 50 cm.
Table B.1. Diffuser Radii
Instrument Radius (cm)
EPA_101 1.6EPA_114 1.6NIST 1.27NSF_SUV 1.05SERC 0.95USDA_270,386,387 0.4ASRC_RSS 0.4USDA_U1K 1.27YES_RSS 0.4
60
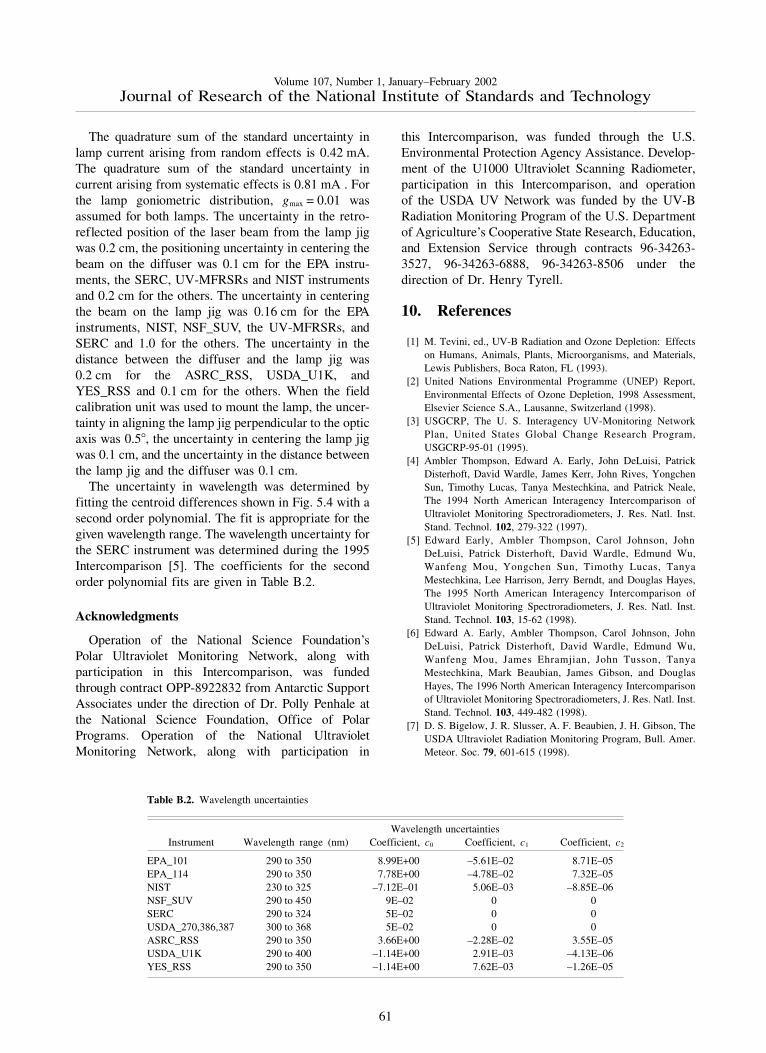
Volume 107, Number 1, January–February 2002Journal of Research of the National Institute of Standards and Technology
The quadrature sum of the standard uncertainty inlamp current arising from random effects is 0.42 mA.The quadrature sum of the standard uncertainty incurrent arising from systematic effects is 0.81 mA . Forthe lamp goniometric distribution, gmax = 0.01 wasassumed for both lamps. The uncertainty in the retro-reflected position of the laser beam from the lamp jigwas 0.2 cm, the positioning uncertainty in centering thebeam on the diffuser was 0.1 cm for the EPA instru-ments, the SERC, UV-MFRSRs and NIST instrumentsand 0.2 cm for the others. The uncertainty in centeringthe beam on the lamp jig was 0.16 cm for the EPAinstruments, NIST, NSF_SUV, the UV-MFRSRs, andSERC and 1.0 for the others. The uncertainty in thedistance between the diffuser and the lamp jig was0.2 cm for the ASRC_RSS, USDA_U1K, andYES_RSS and 0.1 cm for the others. When the fieldcalibration unit was used to mount the lamp, the uncer-tainty in aligning the lamp jig perpendicular to the opticaxis was 0.5�, the uncertainty in centering the lamp jigwas 0.1 cm, and the uncertainty in the distance betweenthe lamp jig and the diffuser was 0.1 cm.
The uncertainty in wavelength was determined byfitting the centroid differences shown in Fig. 5.4 with asecond order polynomial. The fit is appropriate for thegiven wavelength range. The wavelength uncertainty forthe SERC instrument was determined during the 1995Intercomparison [5]. The coefficients for the secondorder polynomial fits are given in Table B.2.
Acknowledgments
Operation of the National Science Foundation’sPolar Ultraviolet Monitoring Network, along withparticipation in this Intercomparison, was fundedthrough contract OPP-8922832 from Antarctic SupportAssociates under the direction of Dr. Polly Penhale atthe National Science Foundation, Office of PolarPrograms. Operation of the National UltravioletMonitoring Network, along with participation in
this Intercomparison, was funded through the U.S.Environmental Protection Agency Assistance. Develop-ment of the U1000 Ultraviolet Scanning Radiometer,participation in this Intercomparison, and operationof the USDA UV Network was funded by the UV-BRadiation Monitoring Program of the U.S. Departmentof Agriculture’s Cooperative State Research, Education,and Extension Service through contracts 96-34263-3527, 96-34263-6888, 96-34263-8506 under thedirection of Dr. Henry Tyrell.
10. References
[1] M. Tevini, ed., UV-B Radiation and Ozone Depletion: Effectson Humans, Animals, Plants, Microorganisms, and Materials,Lewis Publishers, Boca Raton, FL (1993).
[2] United Nations Environmental Programme (UNEP) Report,Environmental Effects of Ozone Depletion, 1998 Assessment,Elsevier Science S.A., Lausanne, Switzerland (1998).
[3] USGCRP, The U. S. Interagency UV-Monitoring NetworkPlan, United States Global Change Research Program,USGCRP-95-01 (1995).
[4] Ambler Thompson, Edward A. Early, John DeLuisi, PatrickDisterhoft, David Wardle, James Kerr, John Rives, YongchenSun, Timothy Lucas, Tanya Mestechkina, and Patrick Neale,The 1994 North American Interagency Intercomparison ofUltraviolet Monitoring Spectroradiometers, J. Res. Natl. Inst.Stand. Technol. 102, 279-322 (1997).
[5] Edward Early, Ambler Thompson, Carol Johnson, JohnDeLuisi, Patrick Disterhoft, David Wardle, Edmund Wu,Wanfeng Mou, Yongchen Sun, Timothy Lucas, TanyaMestechkina, Lee Harrison, Jerry Berndt, and Douglas Hayes,The 1995 North American Interagency Intercomparison ofUltraviolet Monitoring Spectroradiometers, J. Res. Natl. Inst.Stand. Technol. 103, 15-62 (1998).
[6] Edward A. Early, Ambler Thompson, Carol Johnson, JohnDeLuisi, Patrick Disterhoft, David Wardle, Edmund Wu,Wanfeng Mou, James Ehramjian, John Tusson, TanyaMestechkina, Mark Beaubian, James Gibson, and DouglasHayes, The 1996 North American Interagency Intercomparisonof Ultraviolet Monitoring Spectroradiometers, J. Res. Natl. Inst.Stand. Technol. 103, 449-482 (1998).
[7] D. S. Bigelow, J. R. Slusser, A. F. Beaubien, J. H. Gibson, TheUSDA Ultraviolet Radiation Monitoring Program, Bull. Amer.Meteor. Soc. 79, 601-615 (1998).
Table B.2. Wavelength uncertainties
Wavelength uncertaintiesInstrument Wavelength range (nm) Coefficient, c0 Coefficient, c1 Coefficient, c2
EPA_101 290 to 350 8.99E+00 –5.61E–02 8.71E–05EPA_114 290 to 350 7.78E+00 –4.78E–02 7.32E–05NIST 230 to 325 –7.12E–01 5.06E–03 –8.85E–06NSF_SUV 290 to 450 9E–02 0 0SERC 290 to 324 5E–02 0 0USDA_270,386,387 300 to 368 5E–02 0 0ASRC_RSS 290 to 350 3.66E+00 –2.28E–02 3.55E–05USDA_U1K 290 to 400 –1.14E+00 2.91E–03 –4.13E–06YES_RSS 290 to 350 –1.14E+00 7.62E–03 –1.26E–05
61
Volume 107, Number 1, January–February 2002Journal of Research of the National Institute of Standards and Technology
[8] Edward A. Early, Ambler Thompson, and Patrick Disterhoft, AField Calibration Unit for Ultraviolet Spectroradiometers, Appl.Opt. 37, 6664-6670 (1998).
[9] W. L. Wolfe, ed., The Handbook of Military Infrared Technology,Office of Naval Research, Department of the Navy, Washington,DC, Superintendent of the Documents, U.S. GovernmentPrinting Office, Washington, DC., 20402 (1965) pp. 763-764.
[10] D. S. Bigelow, J. R. Slusser, Establishing the Stability of theMulti-filter UV Rotating Shadowband Radiometers, J. Geophys.Res. 105, 4833-4840 (2000).
[11] H. J. Kostkowski, R. D. Saunders, J. F. Ward, C. H. Popenoe,and A. E. S. Green, Measurement of Solar Terrestrial SpectralIrradiance in the Ozone Cut-Off Region, Self-Study Manualon Optical Radiation Measurements: Part III Applications,Chapt. 1, Natl. Bur. Stand. (U.S.) Tech. Note 910-5 (1982).
[12] H. J. Kostkowski, J. L. Lean, R. D. Saunders, and L. R. Hughey,Comparison of the NBS SURF and Tungsten UltravioletIrradiance Standards, Appl. Opt. 25, 3297-3304 (1986).
[13] J. L. Lean, H. J. Kostkowski, R. D. Saunders, and L. R. Hughey,Comparison of the NBS SURF and Argon Mini-arc IrradianceStandards at 214 nm, Appl. Opt. 28, 3246-3253 (1989).
[14] L. Harrison, J. Michalsky, and J. Berndt, Automated Multi-FilterRotating Shadowband Radiometer: An Instrument for OpticalDepth and Radiation Measurements, Appl. Opt. 33, 5118-5125(1994).
[15] L. Harrison, M. Beauharnois, J. Berndt, P. Kiedron, J.Michalsky, and Q. Min, The Rotating Shadowband Spectro-radiometer (RSS) at SGP, Geophys. Res. Lett. 26, 1715-1718(1999).
[16] C. J. Sansonetti, M. L. Salit, and J. Reader, Wavelengths ofSpectral Lines in Mercury Pencil Lamps, Appl. Opt. 35, 74(1996).
[17] J. Reader, C. J. Sansonetti, and J. M. Bridges, Radiances ofSpectral Lines in Mercury Pencil Lamps, Appl. Opt. 35, 78(1996).
[18] CRC Handbook of Chemistry and Physics, CRC Press, Inc.,Boca Raton (1979) pp. E-227–E-228.
[19] E. A. Early and A. Thompson, Irradiance of Horizontal Quartz-Halogen Standard Lamps, J. Res. Natl. Inst. Stand. Technol. 101,141 (1996).
[20] P. A. Jansson, Deconvolution with Applications in Spectroscopy,Academic Press, San Diego (1984) pp. 8–10.
[21] H. Slaper, H. A. J. M. Reinen, M. Blumehaler, M. Huber, andF. Kuik, Comparing ground-level spectrally resolved solar UVmeasurements using various instruments: A technique resolvingeffects of wavelength shift and slit width, Geophys. Res. Lett. 22,2721-2724 (1995).
[22] K. O. Lantz, P. Disterhoft, J. J. DeLuisi, E. Early, A. Thompson,D. Bigelow, and J. Slusser, Methodology for deriving clear-skyerythemal calibration factors for UV Broadband Radiometers, ofthe U.S. Central UV Calibration Facility, J. Atmos. Ocean. Tech.16, 1736-1752 (1999).
About the authors: Kathleen Lantz and PatrickDisterhoft are members of the Cooperative Institute forResearch in Environmental Science of the University ofColorado, Boulder.
John DeLuisi is the director of the Surface RadiationResearch Branch of the NOAA Air Resources Labora-tory. The National Oceanic and AtmosphericAdministration is an agency of the U.S. Department ofCommerce.
Edward Early and Ambler Thompson are members ofthe Optical Technology Division of the NIST PhysicsLaboratory.
Wanfeng Mou and Thomas Taylor are membersof the National Ultraviolet Monitoring Center at theUniversity of Georgia.
James Ehramjian, Germar Bernhard, LaurianaCabasua, and James Robertson are with BiosphericalInstruments Inc., which operates the National ScienceFoundation’s Polar Ultraviolet Monitoring Network.
Doug Hayes was a member of the SmithsonianEnvironmental Research Center Solar RadiationLaboratory of the Smithsonian Institution.
Lee Harrison, Jerry Berndt, and Peter Kiedron arewith the Atmospheric Science Research Center at SUNY,Albany.
James Slusser, Dave Bigelow, Bill Durham, andGeorge Janson are with Natural Resource EcologyLaboratory, at Colorado State University which operatesthe USDA UV Monitoring Program.
Arthur Beaubien and Mark Beaubien are with YankeeEnvironmental Systems, Inc., in Turner Falls, MA.
The National Institute of Standards and Technology isan agency of the Technology Administration, U.S.Department of Commerce.
62

![Oblique-incidence radio transmission and the Lorentz ...nvlpubs.nist.gov/nistpubs/jres/26/jresv26n2p105_A1b.pdf · Smith] Radio Transmission and Lorentz Term 107 The method of calculating](https://img.pdfslide.us/doc/110x75/5ab715837f8b9ab7638e6f29/oblique-incidence-radio-transmission-and-the-lorentz-radio-transmission-and.jpg)