Embed Size (px)
Citation preview

! nfrared Spectra Salt Solutions of Aluminum
Tech · · meal Report 1\Jo.~~ . ·'·T# 11
:;'J.F. Mcintyre R T F I By· . ' . . o ey and B F B . · · rown (J January 1981
/~·~ 4>'~ -~ '. t.v·~~ ~ . ,,
'ft '> (I
'

77 7
UNCLASSIFIEDSECURITY CLASSIFICATION OF ThIS PAGE (N, ee. Enigeud)-
REPORT DOCUMENTATION PAGE READ IN4STRUCTIONSBEFORE COMPLETING FORM
IREPORT NUMOERt 2GOVT ACCESSION NO. 3. RECIPIENT'S CATALOG NUMBER
W - IL.I / /0I. TLE (and SabdIIJ.) S. TYPE OF REPORT 4 PERIOD COVERED
Infrared Spectra of Aluminum Salt Solutions* Technical Progress Reprot01/01/80-1 2/01/80
S. PERFORMING ORG. REPORT NUMSER
MicIntyre, J.F., Foley, R.T., and Brown, B.F4 ) S.CNAG29-78GRAMTUUUR
S. PERFORMING ORGANIZWTIO ~ A ADDRESS 10. PROGRAM ELEMENT. PROJECT. TASKAREA 6 WORK UN17 JMUMIRERS
The American Unvr tP ~ 'e B Fi~ IBUwWashington, DC 20016 I\T/ r-~ a 16,U~t
11. CONTROLLING OFFICE NAMIE AND ADDRESS I2 REPORTDATA
Army Research Office Ja O 091P.O. Box 12211 WSR*R -
Research Trianale Park, N.C. 27709 ~'2714 MONITORING AGENCY NAMIE& AODRSSiidiUsto * COWMOQIMOO01 g) IS. SECURITY CLASS. (of *1.e report)
)T'C~i~/bi, I ~-oy'e' -ri Unclassified/~ A tP s.. DECLASSIFICATION/00OGRADING
L-..(Ur-J. ~J~~j?~ ~SCHEDULEIS. OISTRIUUTION STATEME-NT (1thle Repme
Approved for public release: Distribution unlimited
17. DISTRISUTION STATEMENT (of the abogrect enterd in Week 20. If different ftsm Roport)
I0. SUPPLEMENTARY NOTES
THE VIEW, OPINIONS. AT;:OR FINCINC S CONTAINFL IN THIS REPORTARE THOSE OF ThF AUMI S) AIN7 r- 5j',-;T RE C--271L AsAN OFFiCIAL CEPARm 2.'_,T CF THLE f- _)S: T~t. ,1'CV 6H DE-CISION, UNLESS SO 1)ESK(;4ATE:) E2.% UtLrl L )CUIN[Aii Qi.
IS. KEY wORDS (Coninue an revers. side it neesary ad Idoftttfr' 6V 69ch inumb~)
Infrared, Aluminum Salts, Aluminum Corrosion
20. AJR11AC? (CIN~E90 4 rgwerm 8611 II .ms 1- Mad Dd~oiiy by 61"k ibe
Aluminum salt solution activate metallic aluminum surfaces at differentrates. The objective of this investigation was to attempt to establishwhether or not structural differences at the molecular level could accountfor the chemical reactivity. The infrared spectra of various concentrationsof aluminum chloride, aluminum nitrate, aluminum' perchlorate, and aluminumsulfate were measured. The spectra included several general features:
JOM ~ E~IW#UVSS LT UNCLASSIFIED '.&'J 4SaCUITY1 CLASSIFICATION OF Twit PAMt (111ha DOe "tam

UNCLASSIFIED
SACURIT 7 AIIPSCATIONOF THIS PAG@Uibmh DW.O EAAMwM
/1) a broadening of the OH stretching band of water,2 a splitting of the OH stretch of water into several absorption bands,'3) the emergence of a new absorption band at 2400 cm-' (related to dimer
formation),'4) occasional splitting of the OH bending mode of water..5) no direct evidence of anion-cation covalent bonding.
In general, there was no differences at the molecular level between thesealuminum salt solutions that would account for differences in chemicalreactivity
XTI. S GRA&t
rTIC TAB 0Utan- o1nc' ed 1 I
*p Ijusti-- icto -
Dib2stribut ion/.. .]
t~~Availtiity Codes
--im 'or
UNCLASSIFIED8SCURITY CLA"IPICATIOW OF T1WIS P&A49MMl04U * 6"teed)

INFRARED SPECTRA OF ALUMINUM SALT SOLUTIONS
J.F. McIntyre, R.T. Foley and B.F. BrownDepartment of ChemistryThe American UniversityWashington, D.C. 20016
Aluminum salt solutions activate metallic aluminum surfaces at dras-
tically different rates (1). Solutions of aluminum nitrate, iodide,
bromide, and chloride react rapidly-aluminum sulfate at a low rate.
All of these salts hydrolyze in aqueous solution such that 0.2M solutions
have pH's in the range of 2.5 to 3.5. It has been shown that the pH of
the solution, per se, is not the determining factor in the activity of
the aluminum salt solution (1).
The objective of this investigation was to attempt to establ'ish
whether or not structural differences at the molecular level could account
for the chemical reactivity. This would involve assessing the effect of
the anion on the structure of the aqueous aluminum salt solution.
The composition of hydrolyzed aluminum solutions :has been studied
extensively. These studies have been reviewed by Baes and Mesmer (2).
Smith (3) characterizes the form of aluminum as Ala, Alb, and Alc, the
form predominating dependent on the pH. Ala consists of monomeric species
such as Al+++ , Al(OH)+,AI(OH)+, and Al(OH) . Alb is a polynuclear
compound containing 20-100 aluminum atoms. Alc are large Al(OH)3
particles. The solutions of interest here have pH's in the range of 1.1
to 3.6. From what has been reported in the literature and confirmed by
an analysis of the hydrolysis reaction the species Al(H 20)6 ..,
AI(H 2 0) 50H++ , AI(H 20)4 (OH)2+ , and perhaps the dimer, A12 (OH) 2 (H2 0) 8+,
would be expected in these solutions. The existence of these species
would in turn suggest the structures schematically given in figure 1.

*000
0qC'4
(.4
- 1 4 J
0D4 a 0 .00
C454
mj cn

-3-
Infrared spectroscopy has been successfully used to clarify the
structure of aluminum salt solutions. Riesgraf and May (4) used a
Fourier transform spectrometer to examine solutions of aluminum chloride
and aluminum hydroxide chloride solutions. Fripiat, et al. (5) used the
attenuated total reflectance technique to measure absorptions due to
AlBr3, AICl3, and AI(N03 )3 . Both of these investigations were concerned
with solutions of higher pH which would lead to the formation of polymers.
The present investigation was limited to solutions of low pH with the
corresponding structures.
EXPERIMENTAL
The aqueous aluminum salt solutions in this investigation were pre-
pared with reagent grade materials. The solutions of four salts were
examined: aluminum chloride, aluminum perchlorate, aluminum nitrate, and
aluminum sulfate. These four salts are highly soluble. A concentrated
stock so1ution was prepared and less concentrated solutions were made by
successive dilutions. The concentration of the stock solution was deter-
mined by performing an EDTA analytical titration, as described by Welcher
(6).
Perkin-Elmer double-beam spectrophotometers model number 727 and 397
were used. Special IR cells manufactured by the Eastman Kodak Company,
IR-TRAN-2 cells, were used to hold the samples. The cells are trans-
parent between 4000 and 750 cm-1 and show a strong absorption at 650 cm 1 .
A thin-film was prepared by placing one to five drops of sample (one drop
is equivalent to 2.5 pt) between two IR-TRAN-2 cells and pressing the
cel l s together.

-4-
Three scans were generally run for each salt: The first scan con-
tained just the aluminum salt sample with no reference; the second scan
required an H20 reference; and the final scan used a sodium salt reference.
The strong absorption bands of water (see figure 2) were partially compen-
sated for by using a reference solution. The reference solution was pre-
pared by placing one to three drops more than the number of drops used
for the aluminum salt sample. A partial elimination is seen in the OH
stretching region, 3900-3200 cnf1; i.e., about 100% transmittance is
observed. The OH bending absorption of water was usually eliminated at
1650 cm-1; however, occasionally it appeared with less intensity than
found in the noncompensated spectrum of the aluminum salt solution. This
can be eliminated if the scan is stopped at approximately 2000 cm-1 and
additional reference solution added. Presumably the absence of absorption
in these areas is due to non-interacting H20 molecules; that is, absorption
can be attributed to the bulk solvent. Absorptions located adjacent to
the eliminated absorption bands are assigned to aluminum-water interactions,
such as Al-O-H stretching or Al-OH-Al bending.
RESULTS
Aluminum Chloride Solutions
The spectra of solutions 0.1107M, 0.27M, and 1.107M in AM l3 were
taken with an H 0 reference and NaCl solution references. The absorption
bands for these solutions are tabulated in Table 1.
Although the spectra of these aluminum salt solutions are dominated
by the absorption bands of water, a partial compensation was made by
using either a water or a sodium salt reference. Inspection of figure 3,

A--
m -IC
- 7
aalb-P
+4 0 01
IA 4
I->
0 w
Mo4 V

-6-
TABLEA1C1i ABSCRPT:CN
FREQUENCY
EXSE.ALENT CONCENTRA:ON REFERENCE DESCRITZCN (CM"4) ASSIO:4ENT
0.1107 M H20 SB 35507 Al-OH-Al stret.S 3325 mixed with OH
pH-3.15 X 3220 stret. of H20.5A w 2650
WB 2150 H20 overtone bandS 1650 OH bending of 520M 820
0.1107 X 520 S 3220 Al-OH-AI stretching5B w 2400 Al-O-Al unsym. stzet.
w 2100 H20 overtone bandS 1650 OH bending of E20
0.1107 X H20 WB 2900 unsym. stret. ofH20 coord. to Al.
ms 2500 sym. stret. of 520coord. to Al.
5C w 2050 H20 overtone bandWB 1450WB 1200WB 1000 Al-O-9 or AI-OH-Al
deformation.
0.277 M H20 SB 3500 Al-Os-Al stretchingS 3125 unsym. stret. of
p,,2.80 H20 coord. to Al.6 M 2525 sym. stret. of H20
coord. to Al.w 2100 320 overtone bandS 1650 OR bending of 520S 820
-i
0.277 X 20M 2900 unsym. stret. ofH20 coord. to Al.
7 w 2300M 1780M 1525M 940 AI-O-H or Al-OH-A1
deformation
1.107 M NaCI S 2950 unsym. stret. ofpH-1.95 120 coord. to Al.
W 2550 Sym. $treot. of H208 coord. to Al.V 1710
w 1600M 950 AI-O-. or Al-OH-Al
deformation
1.107 H H20 S 3000 unsym. s&treo. ofH20 coord. to Al.
1 2550 sym. satreat. of H20cooed. to Al.9A w 2400 Al-O-Al unsym. stret.
' 1980W 1720
H .600M 810
1.107 M H20 S 3050 unsym. stret. Cf.20 coord. to Al.
w 2530 sym. streSt of H209B coord. to Al.
Ws 2400 Al-O-A1 unsym. strat.S 1630 OH bending of 920M 810

o goI4
0 WE- N N
C0 .1
- /c

-8-
the absorption spectra of O.1107M AIM 3, will show that the strong absorp-
tion bands of water found at 3800-3100 cm-1 and 1650 cm-1 in curve A are
absent in curve C when recorded with an H20 reference. Inspection of
curve A will reveal that several types of OH stretching are found in the
3800-3100 cm-1 range. These absorption bands are found at 3550, 3325, and
3220 cm-1 . Curve B shows an enlargement of the absorption at 3220 cm 1 .
The absorption at 3550 cm-1 is more likely due to the OH stretching of the
bulk water. The absorption at 3325 cm-1 can be attributed to the OH
stretching of water coordinated to aluminum in polymeric species, and the
lower frequency absorption may be a result of OH stretching in hydrogen
bonded water. Inspection of curve C shows the three types of stretching
proposed by Fripiat, et al. (5) discussed below.
The present work shows .a band between 1950-1800 cm-1 . This band has
been interpreted by Riesgraf and May (4) as an artifact of the combination
band of water at 2100 cm-l when a water reference is used. However, a band
in this region is sometimes found when the 2100 cm-1 band is present; this
usually appears near 1840 cm-1 . A band is not always observed in this
region which suggests that it may very well be a result of the water
compensation process.
An absorption band found at 2400 cm-1 appears consistently in all of
the aluminum salt solution spectra; however, this absorption band is not do-
cumented in the literature. Initial interpretation attempted to assign
this absorption to a combination band; however, the observed absorptions do
not add or substract in a manner which gives rise to this band at 2400 cm l.
Present assignment is attributed to Al-O-Al unsymmetrical stretching.
This assignment is supported by the fact that A1203 in the solid form and
m6 _

-9-
saturated solutions show absorption at 2400 cm-" (see figure 4). This
band is observed in solutions of 1.107M AICl3 at a pH of 1.85. When the
pH of a solution 0.213M in AICl 3 is lowered to a pH of 0.8 with HCl, the
band is not observed. For this reason the appearance of this band has
been used as a test for dimers in solution.
The absorption spectrum of 0.277M AIC13 (experiment 7) reveals an
interesting feature near the eliminated 1650 cm 1 absorption band of water.
This spectrum gives absorptions at 1780 and 1525 cm-1 , the absorption near
1780 cm-l is probably due to the combitation band of water at 2100 cm-1 ;
however, there is no explanation for the band found at 1525 cm-1 . This
lower frequency absorption may be a result of OH bending in water coordi-
nated to aluminum, which, because of the strong absorption of water at
1650 cm-1 , is not likely to be seen. The Al-O-H and Al-OH-Al deformation
at 940 cm-1 is also present in this spectrum.
The unsymmetrical and symmetrical stretch of OH coordinated to alumi-
num is strongly evident in spectra produced by a solution 1.107M in AM 3
and compensated with a 3.OM NaCl reference (see figure 5). These absorp-
tions are found at 3000 and 2550 cm-1 . Again, there is a splitting of the
water absorption band at 1650 cm-1 ; absorptions are found at 1710 and 1600
cm-1 . Figure 6, the spectra of 1.107M AlCl3 , also reveals the major
absorptions of aluminum salt solutions; however, a new band emerges at
2400 cm-1 which is presently attributed to the unsymmetrical stretci. f
Al -O-Al.
Aluminum Nitrate Solutions
The spectra of aluminum nitrate solutions, 0.116M, 0.290M, and 1.159M,
were recorded and the significant absorptions are given in Table II. All

8--'0i
W -4 )$
W In1 4 34
- W
4- (4H -fn 2o @1q-
0 1 1Z - OU GI .N
2r N1

u00z 0
00-
-4
0 U0~W
el ~
wl I*

--
-32-
Co
oo --*
-
Ia 3
(aa~.N-4
-I
o0~~~ I
-, -
Ca-
(V~
-
e*-f
-9 -
41
8=
41
c~, 0 *
U
- *~
--,4
Zb~l 41 41t~ ~ 41~4
- I~ gbi
I*lo~ ~
g N -0 -1*
01% 0.
0 *.liiitfl,.~
04ci,-
H
o -aN -
-a a. - e* a * - -
-- /C -.
ac a a a

-13-
TABLE 'IA1 (N03)3 ABSORPTION
FREQUENCYEXPERIMENT CONCENTRATION REFERENCE DESCRIPTION (CM-I) ASSIGNMENT
0.116 M 0.30 M w 2900 unsym. stret. ofNaNO 3 H20 coord. to Al.
pH-3.0 M 2500 sym. tu:et. of H20coord. to Al.14 M 2000 H20 overtone band
M 1480W 1000 AI-O-H or Al-OH-Al
defromation
0.290 M '20 NB 3500 Al-OH-Al stretchingS 3150 unsym. stret. of
pH2.60 R20 coord. to Al.w 2400 A -O-Al unsym. stret.11 w 2075 H20 overtone bandW 1860S 1650 OH bending of H20S 1375 N03w 1260M 960 Al-O-H or Al-OH-Al
deformation
1.159 M B20 SB 3050 unsym. str et. ofa20 coord. to Al.
pHL.70 W 2550 sym. stret. of H20coord. to Al.
12 w 2400 Al-O-Al unsym st.rut.M 1890
MB 1550R 1330 NO3M 960 Al-O-H or Al-OH-Al
deformation
1.159 M H20 SB 3300 Al-OH-Al stretchingM 2570 sym. str e of H20
coord. to Al.w 2400 Al-O-Al unsym. stret.13A S 1650 OH bending of H20
W 1425M 1360 NoS 940 Al-O-H or Al-OH-Al
deformationM 820
1.159 M 3.0 M S 3000 unsym. strut. ofNaNO 3 H20 coord. to Al.
M 2550 sym. stret. of H2013B 2 coord. to Al.W3A 2400 A-O-Al unsym. strut.
HS 1820MB 1510M 1320 no-S 950 Al-OH-Al deformation
-14-
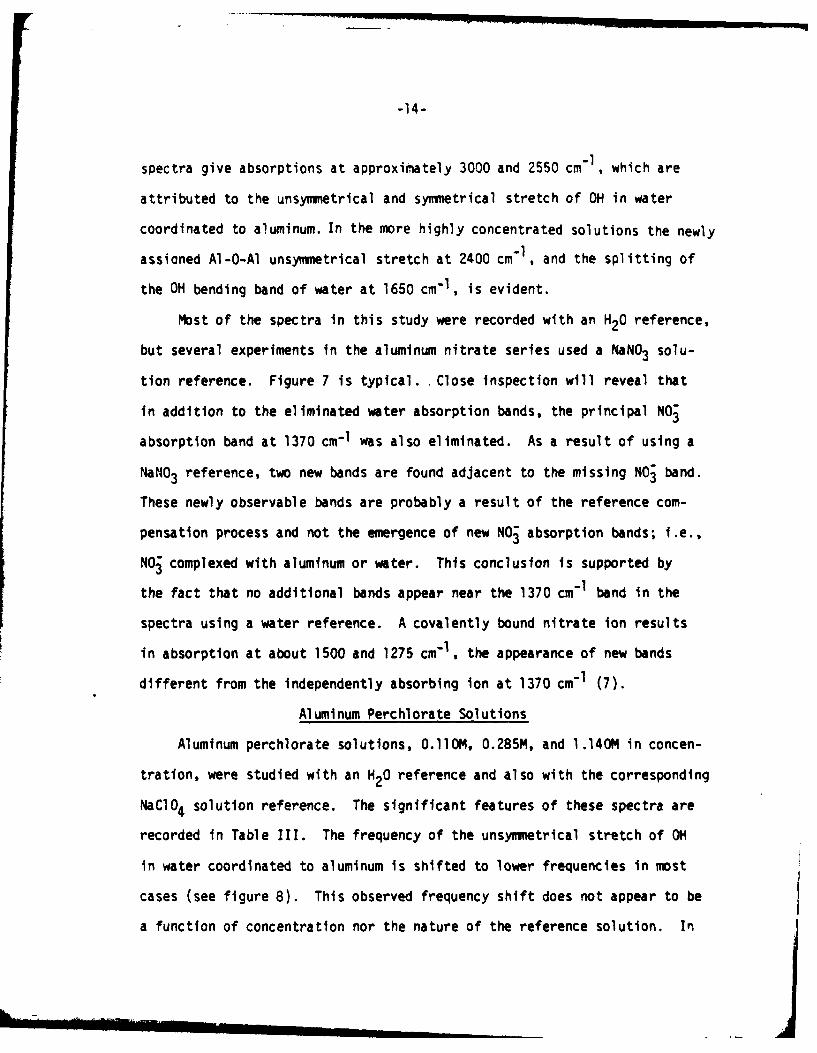
spectra give absorptions at approximately 3000 and 2550 cm 1 , which are
attributed to the unsymmetrical and symmetrical stretch of OH in water
coordinated to aluminum. In the more highly concentrated solutions the newly
assianed Al-O-Al unsymnmetrical stretch at 2400 cm-1 , and the splitting of
the OH bending band of water at 1650 cm-1 , is evident.
Most of the spectra in this study were recorded with an H20 reference,
but several experiments in the aluminum nitrate series used a NaNO3 solu-
tion reference. Figure 7 is typical. Close inspection will reveal that
in addition to the eliminated water absorption bands, the principal N03
absorption band at 1370 cm-1 was also eliminated. As a result of using a
NaNO3 reference, two new bands are found adjacent to the missing N03 band.
These newly observable bands are probably a result of the reference com-
pensation process and not the emergence of new N03 absorption bands; i.e.,
N03 complexed with aluminum or water. This conclusion is supported by
the fact that no additional bands appear near the 1370 cm"1 band in the
spectra using a water reference. A covalently bound nitrate ion results
in absorption at about 1500 and 1275 cm-1 , the appearance of new bands
different from the independently absorbing ion at 1370 cm-I (7).
Aluminum Perchlorate Solutions
Aluminum perchlorate solutions, 0.110M, 0.285M, and 1.140M in concen-
tration, were studied with an H20 reference and also with the corresponding
NaClO 4 solution reference. The significant features of these spectra are
recorded in Table III. The frequency of the unsymmetrical stretch of OH
in water coordinated to aluminum is shifted to lower frequencies in most
cases (see figure 8). This observed frequency shift does not appear to be
a function of concentration nor the nature of the reference solution. In

a Z
lb r~d tn-i5-
ineCr
oloo
0-0

-16-
TABLE I IAl(CO 4 13 A3SORPTION
FREQUENCY
EXPERV.'ENT CONCENTRATION REFERENCE DESCRIPTION (CM- 1 ) ASSI GNENT
0.285 x H20 M 2800M 2600 sym. strut. of H20
pH-2. 9 5 coord. to A..WS5 w 2350 Al-a-Al unsym. strat.
15A 1820M 1120 CIO;W 820
0.285 M 20 5 2950 unsym. stret. ofH20 coord. to Al.
W 2550 sym. stret. of 120coord. to Al.
w 2390 Al-O-Al UnsyM. stret.w 2050 120 overtone bandS 1650 O bending of H20S 1110 CIO;M 820
1.140 H 520 S 2920 unsym. stret. of920 cooed, to Al.
pu. l15 w 2650W 2420 Al-O-Al unsym. stret.
16A w 2060 520 overton* bandMR 1840S 1120 CIO-V 940 AI-6-H or Al-OH-Al
deformation14 820
1.140 M H20 MB 3500 Al-OH-AI stretchingS 3025 unaym. stret. of
H20 coord. to Al.
16B w 2600 gym. stret. of 520coord. to Al.
w 2400 Al-O-A unsym. strot.W 2050 H20 overtone bandS 1650 01 bonding of H20S 1120 C10w 940 Al-S-9 or Al-OH-Al
deformation_820
0.111 14 H20 x 3550M 3340 Al-CH-Al stretching
p5-3.10 14 314017 M 2900 unsym. stret. of17 2 ord. to Al.
W 2600 sym. strGe-. of H20coord. to Al.
W 2400 AI-O-AI unsym. stret.W 2000 H20 overtone bandW 1820S 1650 OH bending of H20.x 111a C.O0w 920
0.285 m H20 W 2900 unsym. stret. ofH20 coord. to Al.
18A pa-2.35 R 2610 sy. gtzet. of H20coord. to Al.
w 1900S 1120 CI0
-I l -..

-17-
TABLE II (continued)
FREQUENCY
MERELNT CONCENTRATZON REFERENCE DESCRIPTION (C.- 1 ) ASSIGNMENT
0.285 . H20 H 2910 unsym. stret. ofU20 coord. to Al.
pH-2.85 w 2600 sym. strut. of 120coord. to Al.
18B w 2400 Al--Al unsym. $trot.W 1900S 1650 ON bending of H20S 1100 C1014 810
1.140 M 3.0 14 S 3050 unsym. stret. ofNaC1O4 H20 coord. to Al.
pgI.1w 2580 sym. strt. of 820coord. to Ai.
19 w 2410 Al-O-Al unsym. stret.w 2000 H20 overtone bandw 1730w 1600w 12104 940 Al-a-H or Al-OH-Al
deformation
1.140 K 120 S 2800M 2580 SYM. $trot. of 120
coord. to Al.20A w 2300 Al-O-Al unsym. stret.14 1980Ws 1710M 1600
Sa 1000 Al-0-H or Al-O-A1deformation
1.140 M 120 s3 3600S 3100 unsym. stret. of
120 coord. to Al.M 2580 sym. str t. of H2 0
20B coord. to Al.W 2400 Al-o-Al unsym. stret.w 2050 120 overtone bandS 1650 08 bending of 120S 1100 Clo-w 940 AI-O-H or Al-OH-Al
deformationS 820
*11

00a-
z 4
00 a
E-
au

-19-
some cases, as in experiments 16B, 19, and 20B, the frequency is shifted
to slightly higher values. This may or may not be a function of anion-
cation interaction; however, the absence of additional absorption bands
near the ClO band, 1120 cm-1 , suggests that ClO is not significantly
coordinating with aluminum.
The symmetrical stretch of OH in water coordinated to aluminum is
found in the 2550-2600 cm-1 range. Again, there is little evidence for
anion-cation interaction. The absorption band found at 2400 cm-1 is
present in most of the spectra. The AI-O-H or Al-OH-Al deformation band
is present in most of the spectra between 940 and 1000 cm-1 . A close
inspection of figure 9 will reveal that the ClO absorption is eliminated
at 1120 cmI and a strong AI-0-H or AI-OH-Al absorption band is observable.
Experiment 17 shows a definite splitting of the OH stretching band of-l
water between 3800-3000 cm . Three distinct absorption bands are present
at 3550, 3340, and 3140 cm-1 . The higher frequency band is due to the OH
stretch in water and the two lower frequencies are most likely a result of
AI-OH-Al stretching in polymeric species.
Experiments 19 and 20 revealed a splitting of the OH bending band as
previously observed in aluminum nitrate and chloride solutions.
Aluminum Sulfate Solutions
The absorptions in the spectra from aluminum sulfate solutions 0.036M,
0.125M, and I.lIOM are tabulated in Table IV. These spectra are quite
similar to the absorptions found in aluminum chloride, nitrate, and per-
chlorate solutions. The unsymmetrical and symmetrical stretches of OH in
water coordinated to aluminum are found at the usual frequencies. The
band located at 2400 cm-1 is present and the difficulty in observing the
deformation band near 940 cm-I is also apparent.

-20-
C -4
Cr W
co 04
'.44
o0 -
-E-0
o0r4

-21-
TABLE :VA12 (SO4) ABSORPTION
F.EQUE:JcyEXPERIMENT CONCENTRATION RZFERENCE DESCRIPTION (CM- 1) ASSIGIMEN1T
0.125 M H20 M 2850 unsym. stret. ofH20 coord. to Al.
21A p5-3.30 M 2600 sym. stret. of 2021A coord. to Al.M 2425 AI-O-Al unsym. stret.W 1800 2-S 1120 S04
0.125 M H20 M 2950 unsym. stret. of
21B w 2625 H20 coord. to Al.
W 1650 OH bending of H20S 1110 Soi-H 820
0.125 H 320 SB 3250 Al-OH-Al stretchingW 2400 AI-O-AI unsym. stret.
21C M 1650 OH bending of H20S 1120 Soz-M 820
1.110 M H20 .MB 3550 Al-OH-Al stretchingS 3000 unsym. stret. of
pH52.20 520 coord. to A!.W 2550 sym. stzet, of 52022A coord. to Al.
Ws 2400 Al-O-Al unsym. stret.Ws 1540S 1650 OH bending of H20S 1100 SOz-W 980 A1-0-H or Al-OH-Al
deformationw 820
1.110 H ' 20 S 3000 unsym. stret. ofH20 coord. to Al.N 2550 sym. stret. of 520coord. to Al.
22B w 2400 A1-O-Al unsvm. stret.S 1650 OH bending of H20S 1100 so;-W 980 Al-a-H or Al-OH-Al
deformationW 820
22C 1.110 M B20 MB 1580 appears as a shoulderon curve A.
0.036 M H20 W 2900 unsym. stet. ofH20 coord. to Al.
23 p5-3.60 M 2550 sym. stret. of H20coord. to Al.
x 1820M 1520
WB .000 AI-0-H or Al-CH-A!deformation
0.125 M H20 W1 2850 unsym, strat, o4.H20 coord. to Al.
24 2500 sym. stret. of HICcoord. to Al.
S 1650 OH bending of 92oS 1120 soi-5 830

-22-
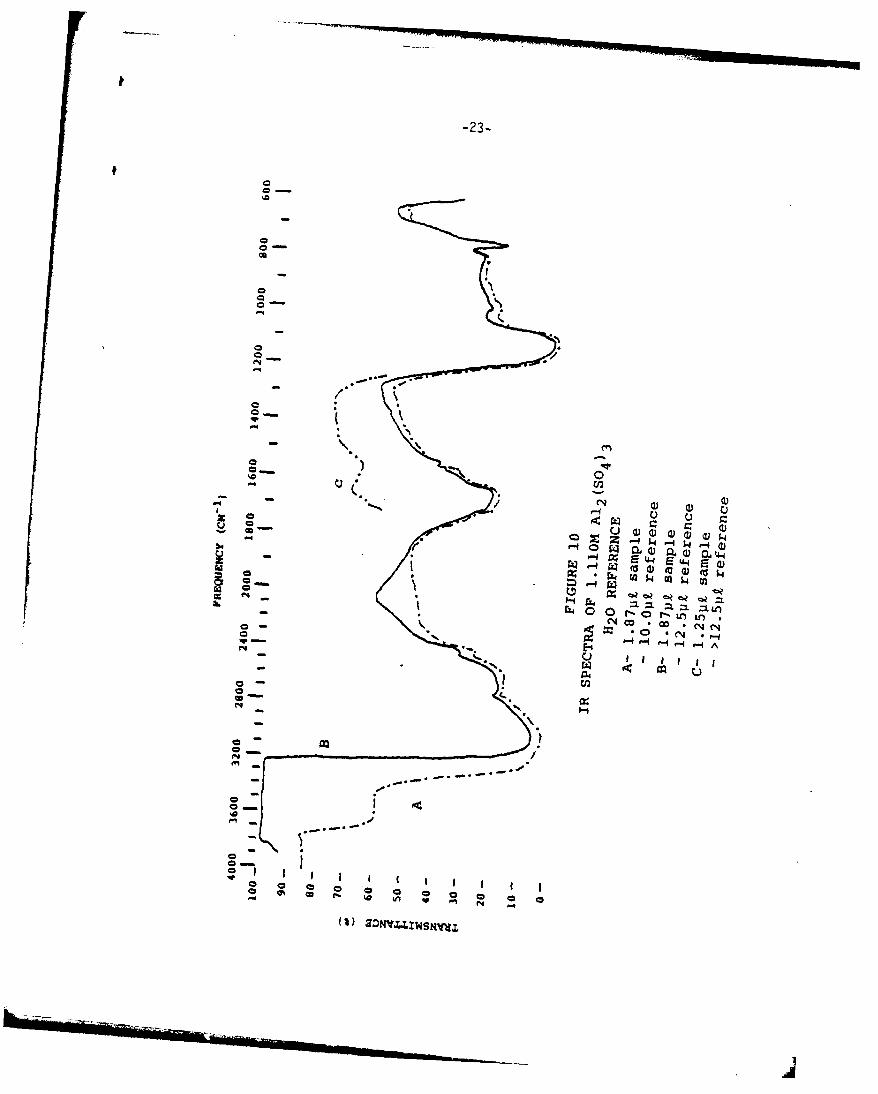
Inspection of figure 10 reveals an interesting feature: The OH bending
band at 1650 cm-1 is split and a new band emerges at 1580 cm-1. This band
at 1580 cm-1 is also found in the spectra of aluminum chloride, nitrate,
and perchlorate and appears distinctly in curve C of figure 9. This scan
was started at 1710 cm-1 and completed at 1200 cm-l, an excess of H20
reference is added prior to this scan. The absorption at 1580 cm-1 appears
as a shoulder in curves A and B, but shows up as a definite absorption in
curve C. This may be a result of OH bending in water coordinated to alumi-
num as previously assigned.
DISCUSSION OF RESULTS
The absorption spectra of aluminum salt solutions include several
general features:
(1) A broadening of the OH stretching band of water.
(2) A splitting of the OH stretch of water into several absorption
bands.
(3) The emergence of a new absorption band at 2400 cm -
(4) Occasional splitting of the OH bending mode of water.
(5) No direct evidence of anion-cation interactions.
The ability to eliminate portions of the water absorption spectrum
proved to be quite valuable, particularly in the OH stretching region of
water. The observed splitting in this region is a direct result of various
types of OH present in the aluminum solutions; i e. H 0 coordinated to
aluminum, OH stretching in polymeric species.
The occasional splitting of the OH bending mode of water is presently
attributed to OH bending in water coordinated to aluminum, especially at
-23-
00-
0o -
00o -
00
00
-4
0 ~q.
0~ ) 0
U,-*
C)0C) 0
-4
0~
0
0r~~u~U~0-
C~4~ .~o4.-
I~. -Cd eij-
N
o -Ci20
* -
0~ 1/
00~ I
4-,
0 - i.-. -4 -0~0 ~ ~ I 1 I I i j I I0 0 0 0 0 0 0 0 0o a~ 0 1%
0 0
-4
1%) -4

-24-
1580 cm 1. This interpretation for the moment is tentative and further
investigation is needed.
Analysis of the absorption spectra for each aluminum salt indicates
that little difference is observed between the individual salts. Thus, it
may be concluded that anion effects are seemingly absent in the observed
spectra. It is well known that at low pH values the aluminum salts are
completely dissociated. The possibility of long-lived complexes existing
in aqueous solutions where NO, SO4 , CIOd, and Cl- are covalently coordi-
nated to aluminum is not likely. When these anions are covalently coordi-
nated to a metal a lowering of the anion's symmetry occurs and the appear-
ance of additional absorption bands is observed (7). The infrared spectra
of aluminum nitrate and perchlorate reveal that the major absorption bands
of water are eliminated and the unsymmetrical and symmetrical OH stretch
of water coordinated to aluminum can be seen at 2900 and 2500 cm-l. In
addition, a weak absorption is found at 1000 cm-1 which is a result of
Al-O-H or Al-OH-Al deformation. The absorption of OH stretching in water
coordinated to aluminum can be readily seen in several spectra at 3100 and
2500 cm 1 .
While the experimental evidence would not support the proposition that
covalently-bonded Al anion complexes exist, the existence of ion pairing
or triple ions is not ruled out, in fact, other lines of experimental evi-
dence would indicate that the anions are associated in some fashion with
aluminum ions.
These aluminum salt solutions have relatively low pH's. The literature
indicates that the predominant structures should be monomeric species such
as Al+++ and AlOH++. Several of the bands suggest the existence of such

-25-
species as Al2 (OH) 2+ 2 , or structures that would include Al-O-Al or Al-OH-Al,
stretchings. Further, these are indicated at pH's lower than one would
expect from literature studies, e.g., at about pH of 1.4. Depending on
the concentration of the four salts, bands at 3100-3200, 3000, 2500, 2400,
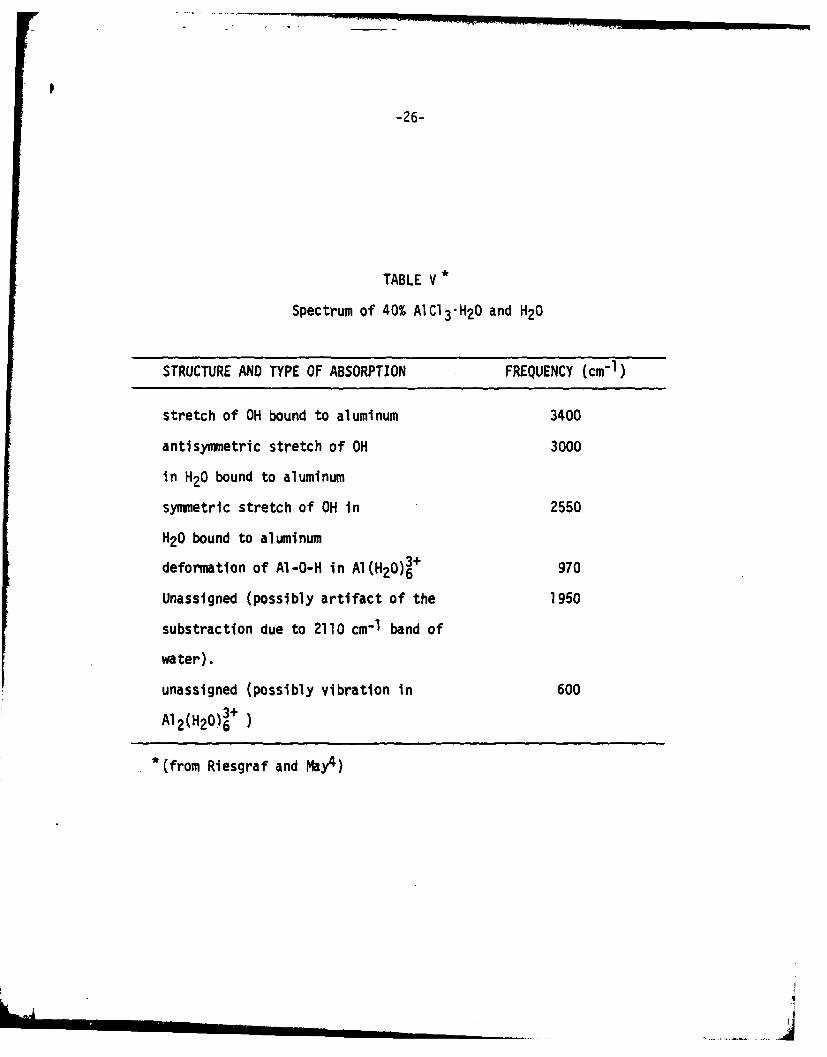
1950-1800, and 960 cm-1 were observed. These are in general agreement
with the results of Riesgraff and May (4) who observed almost similar bands
and gave the assignments listed in Table V.
Fripiat, et al. (5) observed absorptions at 3480, 2965, and 2530 cm-1
for aluminum bromide, nitrate, and chloride solutions. Their assignments
are as follows: The band at 3480 cm-1 is assigned to the stretch of OH
bound to two aluminum atoms, the 2965 cm-l band is attributed to the stretch
of OH in water coordinated to aluminum, and the lower frequency band, 2530
cm-l , is assigned to the OH stretch of water in the second coordination
sphere.
It is significant that in both studies the band at 3400 cm-1 is con-
sidered to signify the existence of the structure Al-O-Al, which would be
a test for the dimer. H
CONCLUSION
These spectra do provide information on the structure of these alumi-
num salt solutions which will be of value in the interpretation of results
on their chemical reactivity. The evidence for the formation of dimers
at relatively low pH's was not expected.
There was no unique feature in any of the four salt solutions. This
is surprising because complexes such as AlSO+ are considered to involve
the displacement of inner sphere coordinated water (8).
-26-
TABLE V *
Spectrum of 40% AlCl3 -H20 and H20
STRUCTURE AND TYPE OF ABSORPTION FREQUENCY (cm-1 )
stretch of OH bound to aluminum 3400
antisymnmetric stretch of OH 3000
in H20 bound to aluminum
symmetric stretch of OH in 2550
H20 bound to aluminum
deformation of Al-O-H in AI(H 20)3+ 970
Unassigned (possibly artifact of the 1950
substraction due to 2110 cm-1 band of
water).
unassigned (possibly vibration in 600
Al 2(H20)3+
*(from Riesgraf and May4 )

-27-
ACKNOWLEDGEMENT
The Authors are pleased to acknowledge the support of the Army Research
Office. This research was done under Grant No. DAAG29-78-G-0l65.
REFERENCES
1. K. Sotoudeh, T.H. Nguyen, R.T. Foley and B.F. Brown, CORROSION, in press.
2. C.F. Baes and R.E. Mesmer, "The Hydrolysis of Cations," John Wiley &Sons, New York (1976).
3. R.W. Smith, "The State of Al(III) in Aqueous Solution and Adsorptionof Hydrolysis Products on a-A1203 ," Dissertation, Stanford University,June 1969.
4. D.A. Riesgraf and M.L. May, Applied Spectroscopy, 32(4), 362 (1978).
5. J.J. Fripiat, F. Van Cauwelaert and H. Bosmans, J. Phys. Chem., 69(7),2458 (1965).
6. F.J. Welcher, The Analytical Uses of Ethylenediaminetetraacetic Acid,Van Nostand, Princeton, NJ (1958).
7. J.R. Ferraro, "Interpretation of the Infrared Spectra of InorganicMolecules," presented at the Infrared Spectroscopy Institute, CanisiusCollege, Buffalo, NY (August 1961).
8. J. Miceli and J. Stuehr, J. Am. Chem. Soc., 90, 6967 (1968).