Embed Size (px)
Citation preview
DiversityCommittee Meeting
May 2016
Committee MembersJ. Molloy, ChairmanF. Ferrer, MTA Vice ChairmanS. MetzgerJ. Banks IIIR. Bickford
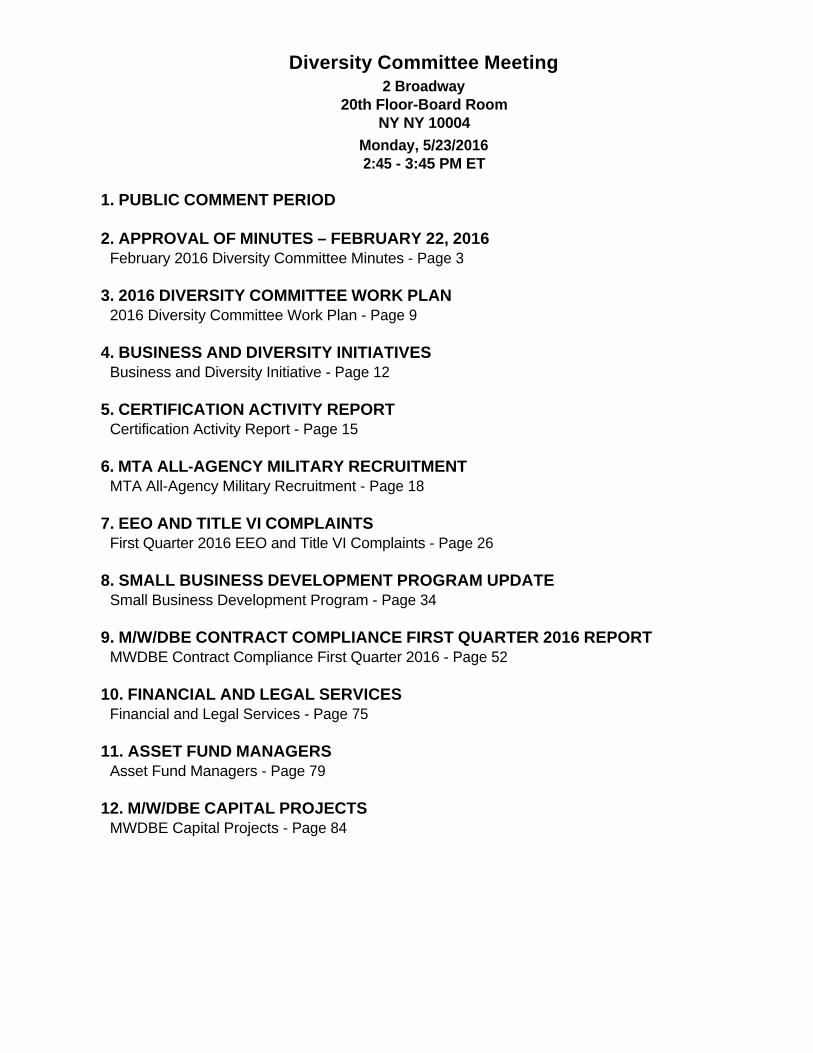
Diversity Committee Meeting 2 Broadway
20th Floor-Board Room NY NY 10004
Monday, 5/23/2016 2:45 - 3:45 PM ET
1. PUBLIC COMMENT PERIOD
2. APPROVAL OF MINUTES – FEBRUARY 22, 2016
February 2016 Diversity Committee Minutes - Page 3
3. 2016 DIVERSITY COMMITTEE WORK PLAN 2016 Diversity Committee Work Plan - Page 9
4. BUSINESS AND DIVERSITY INITIATIVES
Business and Diversity Initiative - Page 12
5. CERTIFICATION ACTIVITY REPORT Certification Activity Report - Page 15
6. MTA ALL-AGENCY MILITARY RECRUITMENT
MTA All-Agency Military Recruitment - Page 18
7. EEO AND TITLE VI COMPLAINTS
First Quarter 2016 EEO and Title VI Complaints - Page 26 8. SMALL BUSINESS DEVELOPMENT PROGRAM UPDATE
Small Business Development Program - Page 34
9. M/W/DBE CONTRACT COMPLIANCE FIRST QUARTER 2016 REPORT
MWDBE Contract Compliance First Quarter 2016 - Page 52
10. FINANCIAL AND LEGAL SERVICES
Financial and Legal Services - Page 75
11. ASSET FUND MANAGERS
Asset Fund Managers - Page 79
12. M/W/DBE CAPITAL PROJECTS MWDBE Capital Projects - Page 84
MTA Diversity Committee Meeting Minutes, Monday, February 22, 2016 1
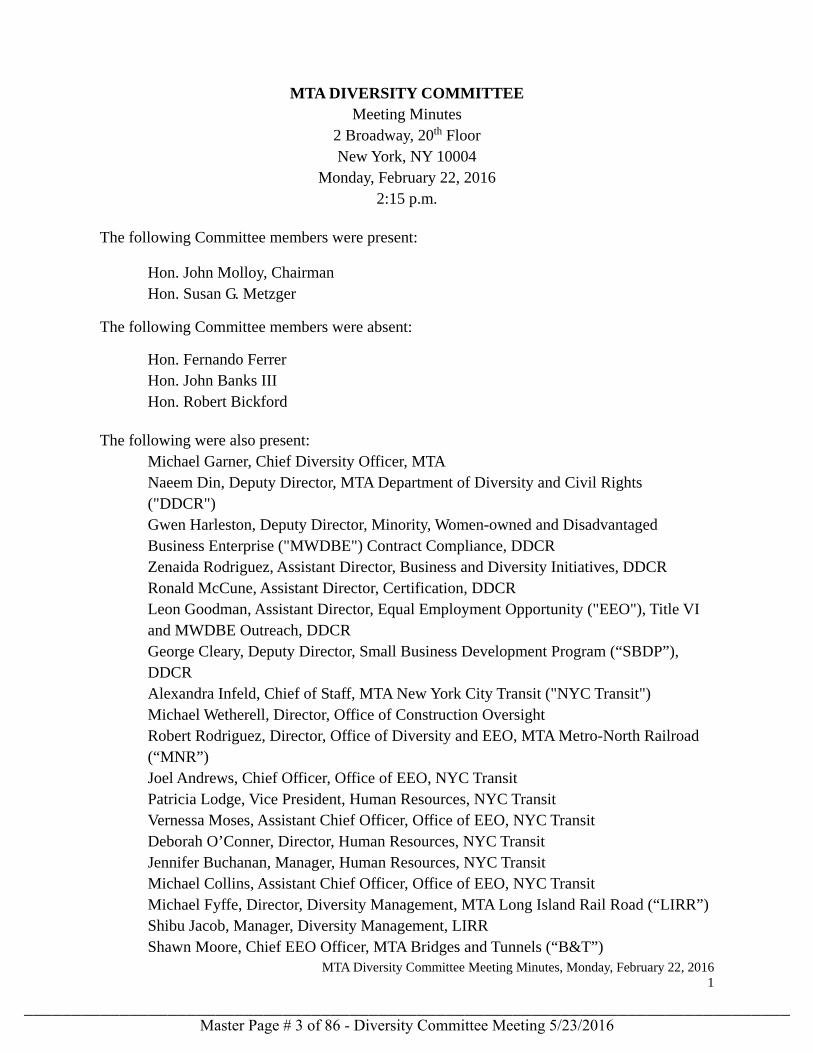
MTA DIVERSITY COMMITTEE Meeting Minutes
2 Broadway, 20th Floor New York, NY 10004
Monday, February 22, 2016 2:15 p.m.
The following Committee members were present:
Hon. John Molloy, Chairman Hon. Susan G. Metzger
The following Committee members were absent:
Hon. Fernando Ferrer Hon. John Banks III Hon. Robert Bickford
The following were also present: Michael Garner, Chief Diversity Officer, MTA Naeem Din, Deputy Director, MTA Department of Diversity and Civil Rights ("DDCR") Gwen Harleston, Deputy Director, Minority, Women-owned and Disadvantaged Business Enterprise ("MWDBE") Contract Compliance, DDCR Zenaida Rodriguez, Assistant Director, Business and Diversity Initiatives, DDCR Ronald McCune, Assistant Director, Certification, DDCR Leon Goodman, Assistant Director, Equal Employment Opportunity ("EEO"), Title VI and MWDBE Outreach, DDCR George Cleary, Deputy Director, Small Business Development Program (“SBDP”), DDCR Alexandra Infeld, Chief of Staff, MTA New York City Transit ("NYC Transit") Michael Wetherell, Director, Office of Construction Oversight Robert Rodriguez, Director, Office of Diversity and EEO, MTA Metro-North Railroad (“MNR”) Joel Andrews, Chief Officer, Office of EEO, NYC Transit Patricia Lodge, Vice President, Human Resources, NYC Transit Vernessa Moses, Assistant Chief Officer, Office of EEO, NYC Transit Deborah O’Conner, Director, Human Resources, NYC Transit Jennifer Buchanan, Manager, Human Resources, NYC Transit Michael Collins, Assistant Chief Officer, Office of EEO, NYC Transit
Michael Fyffe, Director, Diversity Management, MTA Long Island Rail Road (“LIRR”) Shibu Jacob, Manager, Diversity Management, LIRR Shawn Moore, Chief EEO Officer, MTA Bridges and Tunnels (“B&T”)
Master Page # 3 of 86 - Diversity Committee Meeting 5/23/2016________________________________________________________________________________
MTA Diversity Committee Meeting Minutes, Monday, February 22, 2016 2
David Cannon, Director, Procurement and Risk Management, MTA Capital Construction (“CC”) Melissa Jones, Manager, MWBE Compliance Manager, CC Paige Graves, Acting General Counsel, MTA Bus Company (“MTA Bus”) Alberto Richardson, Operations Analysis Officer, MTA Bus Sonia Mercado, Manager, Supply Diversity Manager, MTA BSC William Howell, Consultant, MTA SBDP
Public Speakers: There were no public speakers. Minutes Upon a motion duly made and seconded, the Committee unanimously approved the minutes of the meeting held on December 14, 2015. 2016 Diversity Committee Work Plan
There were no changes to the 2016 Committee Work Plan.
2016 Departmental Goals Update
Mr. Garner provided an update to the DDCR goals and the current DDCR initiatives. The goals and initiatives are described on page 12 of the Committee book. Business and Diversity Initiatives
Ms. Rodriguez provided an update on MTA’s Business and Diversity Initiatives. Ms. Rodriguez stated that DDCR hosted a New Firm Orientation session in January 2016; approximately 70 firms attended in addition to MTA agency procurement staff. Ms. Rodriguez said an overview of SBDP was provided at the orientation. Ms. Rodriguez said that DDCR is in the process of finalizing outreach events for March 2016 to be held in Orange and Nassau Counties. She said additional outreach events are listed in the SBDP presentation in the Committee book. Mr. Din provided an update on MTA-wide diversity events. He said MTA Headquarters (“MTAHQ”), LIRR, and B&T celebrated Black History Month in February 2016. Mr. Din added that MTAHQ will celebrate the Jewish American Heritage Month in April 2016. Certification Activity Report
Mr. McCune reported on the 2015 DBE certification activity. He said a total of 94 new applications were received; compared with the previous two years the number of new applications has decreased. Mr. McCune reported that overall 107 applications were handled: 59 firms were certified, 3 were denied certification, 29 were returned, and 16 were withdrawn. He said compared with the previous two years, the number of applications processed has decreased. Chairman Molloy said the number of new applications received has continued to
Master Page # 4 of 86 - Diversity Committee Meeting 5/23/2016________________________________________________________________________________
MTA Diversity Committee Meeting Minutes, Monday, February 22, 2016 3
decrease when compared with the last two years. Mr. McCune replied that in 2014, the Federal Transit Administration created a new certification application which is much more extensive, and requires a lot more documentation. Ms. Metzger asked if the new application is more difficult. Mr. McCune said it is the same application but it requires more documentation. He added that DDCR has been conducting monthly training sessions on the certification process, including informing potential applicants about the new application. Ms. Metzger asked if other agencies are experiencing a similar drop in the number of new applications. Mr. McCune said the other agencies are also seeing a drop in the number of new applications, and they are also educating potential applicants on how to complete the new application. Ms. Metzger asked if there is a different application for re-certification. Mr. McCune said for annual certification renewal the certified firms need to complete a different form and submit their tax return. He said it is a shorter process. Ms. Metzger asked if there is still reciprocity with other states. Mr. McCune said that if a DBE firm is certified in another state then the certification process is easier, and quicker. He said the applicant firm would send the certification documentation from the state in which they are already certified. Mr. McCune also reported on contract awards to certified DBEs. He said for the 2009-2015 period, 442 DBE firms were certified. He said for the same period, 111 DBE firms received 397 federally funded prime or subcontracts. Mr. McCune said MTA awarded in excess of $741 million. Mr. McCune said in addition there were 133 DBE firms which are also certified as M/WBEs. He said these firms received approximately $311 million in 574 prime or subcontract awards. Mr. McCune said overall $1 billion was awarded in prime and subcontracts. Ms. Metzger said this number represents a huge improvement when compared with previous years. Fourth Quarter 2015 EEO Activities
Mr. Din reported that as of December 31, 2015, females, Hispanics and Native Hawaiian Other Pacific Islanders were underrepresented in various job categories at MTAHQ and the agencies. Mr. Din stated that a majority of the underrepresentation within these groups occurred in the officials & administrators, administrative support, skilled craft, and service maintenance job categories. Mr. Din explained that the agencies employ the most number of employees in these job categories. Mr. Din also reported on MTA-wide new hires. He said a total of 6,726 employees were hired, of which 20% are females, and 72% are minorities. Mr. Din said of the total minorities hired, 37% are black and 17% are Hispanic. Mr. Din described the new hires at MTA NYC Transit. He said out of a total of 4,180 employees hired, 890 (21%) are females and 3,359 (80%) are minorities. Mr. Din that the 948 new hires at MTAHQ reflects the Information Technology consolidation. Mr. Din also reported on the number of veterans that were hired by the MTAHQ and the agencies. He said 238 veterans were hired in 2015, which is more than 218 that were hired in 2014. Mr. Din added that MTA has continued its outreach to veterans. Mr. Molly stated that the new hires show improvement but we need to find a way to increase the representation of women and Hispanics in MTA’s workforce. Mr. Garner stated that there
Master Page # 5 of 86 - Diversity Committee Meeting 5/23/2016________________________________________________________________________________
MTA Diversity Committee Meeting Minutes, Monday, February 22, 2016 4
are ongoing internal discussions about formulating strategies for improvement. He said some of the strategies being considered include establishing closer working relationships with ethnic associations, targeting media outlets, and establishing an all-agency recruitment budget. He said in addition, another strategy is establishing a closer working relationship between EEO and HR staff. Mr. Garner stated that DDCR will report back to the Committee about these strategies for improvement. Mr. Din also reported on MTA-wide EEO and Title VI complaints. He said in 2015, MTA and the agencies handled a total of 528 EEO complaints, citing 955 separate allegations. He said of these complaints, 240 were filed externally at city, state and federal agencies, and 288 were filed internally. Mr. Din explained that of the 240 external complaints, the most frequently cited bases for complaints were disability discrimination (21%), other types of miscellaneous discrimination, and race/color discrimination (18%). Mr. Din said of the 288 internal complaints, the most frequently cited bases for complaints were sexual harassment (18%), other types of miscellaneous discrimination, and race/color discrimination (23%). Mr. Din said that in 2015 MTA and the agencies also handled a total of 169 Title VI complaints, which cited 188 separate allegations. He said of the total Title VI complaints, race discrimination (73%) was most frequently alleged as the basis for the complaint. Mr. Din also provided an update on the EEO and Title VI complaints handled at MTAHQ in 2015. In addition, he provided workforce utilization statistics for MTAHQ, including MTA Police Department (“MTAPD”). Mr. Din said movement above the rank of police officer occurs through internal promotion. Mr. Garner said DDCR is working with MTA Human Resources to ensure that there is a diverse pool of applicants for the position of police officer in MTAPD. SBDP Update
Mr. Cleary provided an update on MTA’s SBDP. He said as of December 31, 2015, there were 135 prequalified firms in Tier 1, 38 in Tier 2, and 35 in the Small Business Federal Program (“SBFP”), totaling 208 firms. He said 29 firms were prequalified for the period September 2015 through February 2016, and 43 firms are pending prequalification. Mr. Cleary provided a breakdown of pre-qualified firms by ethnicity. He also reported that from the inception of the program and through 2015, 219 awards have been made, totaling $197 million. Mr. Cleary also provided a breakdown by gender and ethnicity of firms that have received contract awards. Mr. Cleary reported that under the loan program, a total of 69 loans were approved by Carver Bank totaling over $9 million. Chairman Molloy asked if the MTA makes any recommendation whether a particular loan should be made. Mr. Garner said the MTA refers the firm to the bank but it does not push the bank to make the loan. Mr. Garner said that the MTA is helping the bank mitigate risk through two-party checks until the loan is paid off. Chairman Molloy asked about the success rate of the firms that have received loans. He said there was a default on one loan due to death of the firm’s owner. Ms. Metzger asked if in the case of loan default the bank was made whole. Mr. Garner said no but New York State has a program where the state pays off the loan of a certified firm in case of default. Ms. Metzger asked if in this case the state paid off the loan of the firm that had defaulted. Mr. Garner said that it did. Mr. Cleary reported the MTA has secured surety bonding assistance through the team of Willis/Ace/Centaur. Mr. Cleary also reported that since inception the SBDP has contributed to
Master Page # 6 of 86 - Diversity Committee Meeting 5/23/2016________________________________________________________________________________
MTA Diversity Committee Meeting Minutes, Monday, February 22, 2016 5
the creation of over 4,700 jobs within MTA’s 14-county service region. He said the program has also provided small businesses with over 1,000 bidding opportunities. He said 278 firms have participated in the classroom training program since inception. He said the fall 2015 average class attendance was 50 firms, and next training class will begin in March 2016. Mr. Cleary also highlighted the upcoming outreach events. Mr. Cleary noted that the SBDP anticipates awarding 430 projects in MTA’s next Five-Year Capital Plan, totaling $500 million. He said this will create an estimated 12,000 jobs. Mr. Cleary said next steps in the program include contractor recruitment, and Requests for Proposal (“RFPs”) for construction management and business development services, and for the loan program. M/W/DBE Contract Compliance Fourth Quarter 2015 Report Ms. Harleston reported on federal and state funded contract award and payment activities. She said for the period October to December 2015, MTA awarded approximately $142 million in federally funded contracts with approximately $17 million (12%) being awarded to certified DBEs. Ms. Harleston said MTA has an overall 17% DBE participation goal. She said for the same period MTA paid over $455 million to prime contractors, with payments to certified DBEs totaling over $64 million (14%). Ms. Harleston also reported that for the period April to September 2015, MTA awarded approximately $2 billion in state funded contracts, with $177 million (10%) being awarded to certified MWBEs. She said for the same period MTA paid approximately $998 million on prime contracts with approximately $237 million (24%), being paid to MWBEs. She said MTA has an overall 30% MWBE participation goal. Regarding discretionary procurement awards, Ms. Harleston reported that from April through December 2015, over $200 million was awarded. MWBE participation was 10%, and participation of Small Business Concerns was 6%. Ms. Metzger said MTA has some ground to cover in achieving its goals. She asked if MTA will achieve its MWDBE goals this year. Mr. Garner said the report covers only part of the fiscal year and he is confident that MTA will achieve its MWDBE goals. He said MTA’s SBFP is driving DBE participation. Mr. Garner noted that MTA has to work towards creating a diverse pool of firms for its discretionary awards. Financial and Legal Services Regarding the underwriter fees, Mr. Garner said MWBE participation was 35%. Mr. Garner said a RFP will be issued in order to create a diverse pool of underwriters. Mr. Garner reported that for payments made for outside legal services, MWBE participation was 10%. He said MWBE participation in this area is improving based on the number of legal assignments that the MTA agencies are awarding. Mr. Garner said for the first time since 2004 an RFP has been issued in order to establish a new and diverse pool of outside counsel firms.
Master Page # 7 of 86 - Diversity Committee Meeting 5/23/2016________________________________________________________________________________
MTA Diversity Committee Meeting Minutes, Monday, February 22, 2016 6
Asset Fund Managers Mr. Garner reported on MWBE participation in the area of asset fund management. He said MWBE participation in total assets was 11%, with 26% participation in traditional assets and none in nontraditional assets. Mr. Garner said he is exploring ways to improve MWBE participation with Robert Foran, MTA Chief Financial Officer, by creating at the MTA a program similar to New York City and state comptrollers’ Emerging Managers Program. Ms. Metzger asked if the firms that are qualified for the state and city programs will also be able to work for the MTA. Mr. Garner said we need to see if the opportunities at the MTA are similar to those at the city and state level, and if this program is a good fit for the MTA. M/W/DBE Capital projects Ms. Harleston reported on MWDBE participation on MTA’s capital projects. She said in 2015, MTA achieved 20% participation on federally funded projects, exceeding its overall 17% DBE goal. Ms. Harleston stated that for state funded projects in 2015, MWBE participation was 21% (11% MBE and 10% WBE participation), which is below MTA’s overall 30% MWBE goal. MTA EEO Policy Statements Mr. Din presented MTA’s updated EEO, Sexual and Other Discriminatory Harassment, and Americans with Disability Act Policies. He said these policies are updated annually, and the updated policies will be displayed in prominent locations throughout MTA facilities. Adjournment
Upon a motion duly made and seconded, the meeting was adjourned.
Respectfully submitted,
Faith Beauzile
Department of Diversity and Civil Rights
Master Page # 8 of 86 - Diversity Committee Meeting 5/23/2016________________________________________________________________________________
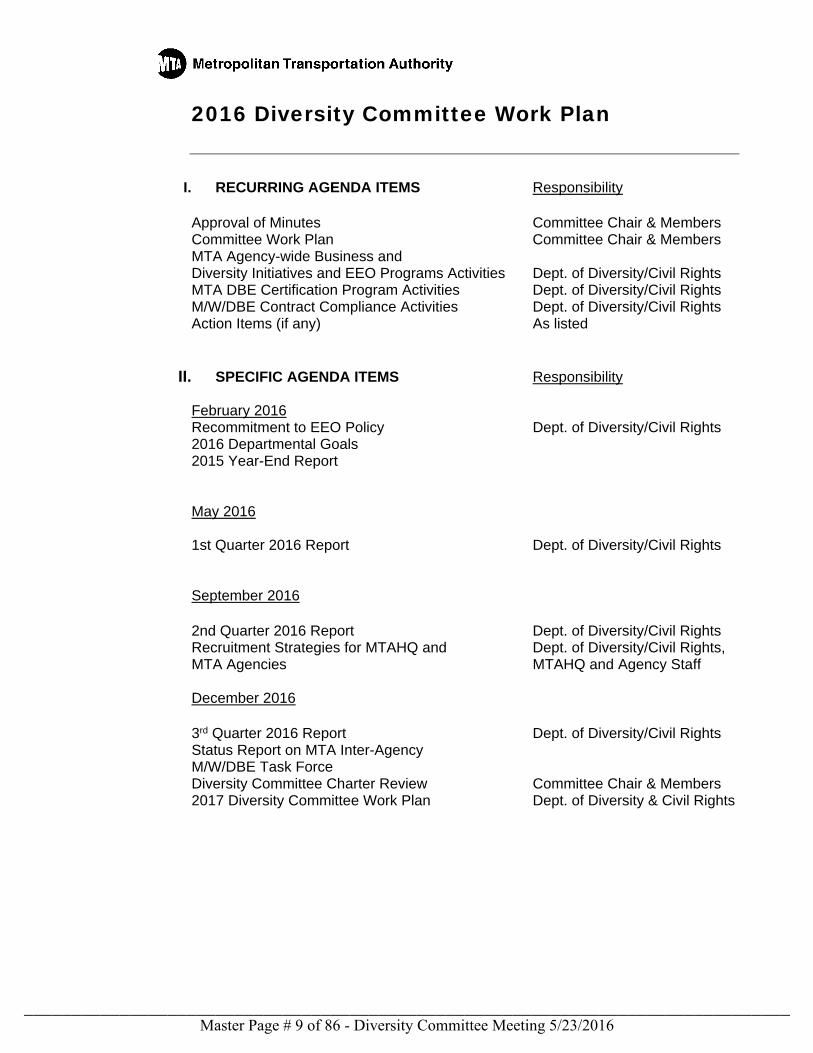
2016 Diversity Committee Work Plan
I. RECURRING AGENDA ITEMS Responsibility Approval of Minutes Committee Chair & Members Committee Work Plan Committee Chair & Members
MTA Agency-wide Business and Diversity Initiatives and EEO Programs Activities Dept. of Diversity/Civil Rights
MTA DBE Certification Program Activities Dept. of Diversity/Civil Rights M/W/DBE Contract Compliance Activities Dept. of Diversity/Civil Rights Action Items (if any) As listed
II. SPECIFIC AGENDA ITEMS Responsibility February 2016 Recommitment to EEO Policy Dept. of Diversity/Civil Rights 2016 Departmental Goals 2015 Year-End Report May 2016 1st Quarter 2016 Report Dept. of Diversity/Civil Rights September 2016 2nd Quarter 2016 Report Dept. of Diversity/Civil Rights Recruitment Strategies for MTAHQ and Dept. of Diversity/Civil Rights, MTA Agencies MTAHQ and Agency Staff December 2016 3rd Quarter 2016 Report Dept. of Diversity/Civil Rights Status Report on MTA Inter-Agency M/W/DBE Task Force Diversity Committee Charter Review Committee Chair & Members 2017 Diversity Committee Work Plan Dept. of Diversity & Civil Rights
Master Page # 9 of 86 - Diversity Committee Meeting 5/23/2016________________________________________________________________________________
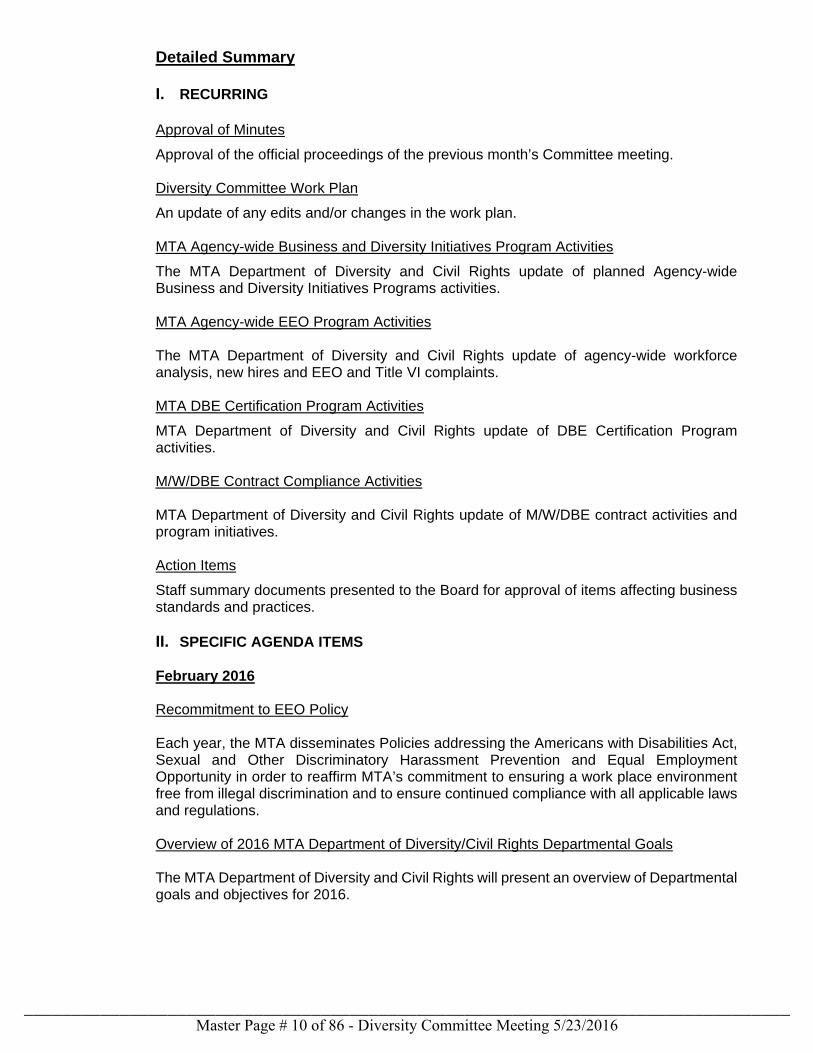
Detailed Summary I. RECURRING Approval of Minutes
Approval of the official proceedings of the previous month’s Committee meeting. Diversity Committee Work Plan
An update of any edits and/or changes in the work plan. MTA Agency-wide Business and Diversity Initiatives Program Activities
The MTA Department of Diversity and Civil Rights update of planned Agency-wide Business and Diversity Initiatives Programs activities. MTA Agency-wide EEO Program Activities The MTA Department of Diversity and Civil Rights update of agency-wide workforce analysis, new hires and EEO and Title VI complaints. MTA DBE Certification Program Activities
MTA Department of Diversity and Civil Rights update of DBE Certification Program activities. M/W/DBE Contract Compliance Activities MTA Department of Diversity and Civil Rights update of M/W/DBE contract activities and program initiatives. Action Items
Staff summary documents presented to the Board for approval of items affecting business standards and practices. II. SPECIFIC AGENDA ITEMS February 2016 Recommitment to EEO Policy Each year, the MTA disseminates Policies addressing the Americans with Disabilities Act, Sexual and Other Discriminatory Harassment Prevention and Equal Employment Opportunity in order to reaffirm MTA’s commitment to ensuring a work place environment free from illegal discrimination and to ensure continued compliance with all applicable laws and regulations. Overview of 2016 MTA Department of Diversity/Civil Rights Departmental Goals The MTA Department of Diversity and Civil Rights will present an overview of Departmental goals and objectives for 2016.
Master Page # 10 of 86 - Diversity Committee Meeting 5/23/2016________________________________________________________________________________
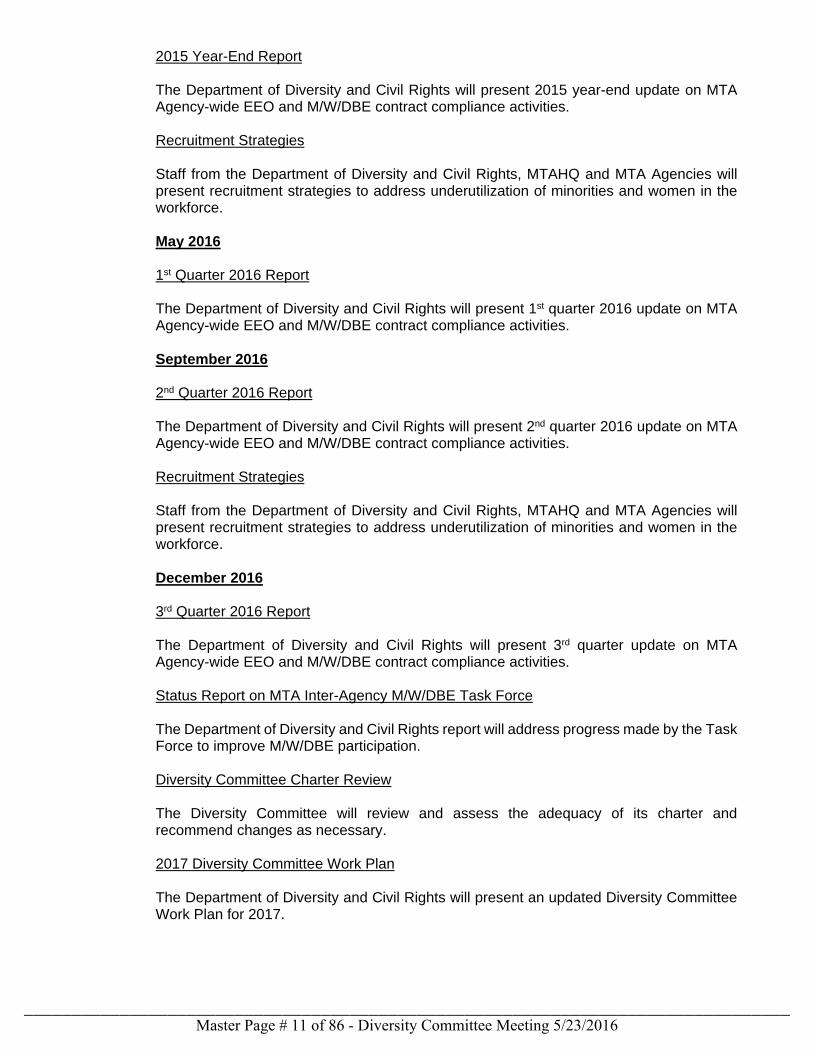
2015 Year-End Report The Department of Diversity and Civil Rights will present 2015 year-end update on MTA Agency-wide EEO and M/W/DBE contract compliance activities. Recruitment Strategies Staff from the Department of Diversity and Civil Rights, MTAHQ and MTA Agencies will present recruitment strategies to address underutilization of minorities and women in the workforce. May 2016 1st Quarter 2016 Report The Department of Diversity and Civil Rights will present 1st quarter 2016 update on MTA Agency-wide EEO and M/W/DBE contract compliance activities. September 2016 2nd Quarter 2016 Report The Department of Diversity and Civil Rights will present 2nd quarter 2016 update on MTA Agency-wide EEO and M/W/DBE contract compliance activities. Recruitment Strategies Staff from the Department of Diversity and Civil Rights, MTAHQ and MTA Agencies will present recruitment strategies to address underutilization of minorities and women in the workforce. December 2016 3rd Quarter 2016 Report The Department of Diversity and Civil Rights will present 3rd quarter update on MTA Agency-wide EEO and M/W/DBE contract compliance activities. Status Report on MTA Inter-Agency M/W/DBE Task Force The Department of Diversity and Civil Rights report will address progress made by the Task Force to improve M/W/DBE participation. Diversity Committee Charter Review The Diversity Committee will review and assess the adequacy of its charter and recommend changes as necessary. 2017 Diversity Committee Work Plan The Department of Diversity and Civil Rights will present an updated Diversity Committee Work Plan for 2017.
Master Page # 11 of 86 - Diversity Committee Meeting 5/23/2016________________________________________________________________________________

MTA DEPARTMENT OF DIVERSITY AND CIVIL RIGHTS
BUSINESS AND DIVERSITY INITIATIVES
May 23, 2016
Master Page # 12 of 86 - D
iversity Com
mittee M
eeting 5/23/2016________________________________________________________________________________
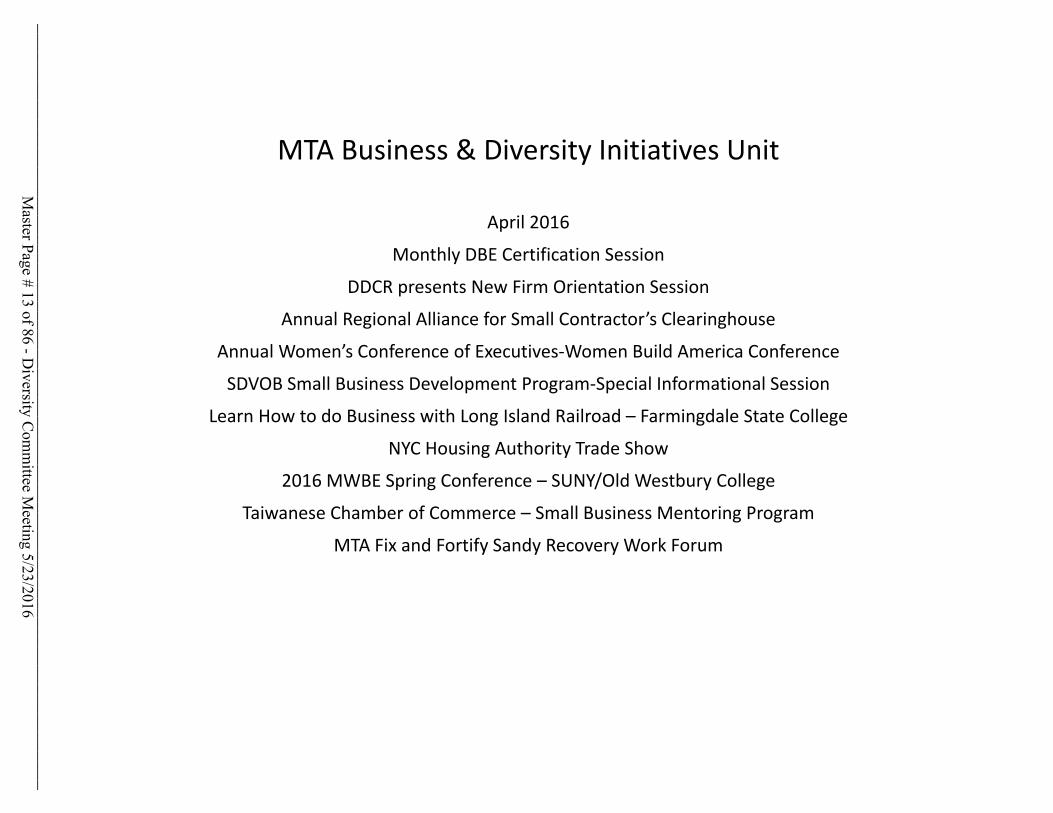
MTA Business & Diversity Initiatives Unit
April 2016
Monthly DBE Certification Session
DDCR presents New Firm Orientation Session
Annual Regional Alliance for Small Contractor’s Clearinghouse
Annual Women’s Conference of Executives‐Women Build America Conference
SDVOB Small Business Development Program‐Special Informational Session
Learn How to do Business with Long Island Railroad – Farmingdale State College
NYC Housing Authority Trade Show
2016 MWBE Spring Conference – SUNY/Old Westbury College
Taiwanese Chamber of Commerce – Small Business Mentoring Program
MTA Fix and Fortify Sandy Recovery Work Forum
Master Page # 13 of 86 - D
iversity Com
mittee M
eeting 5/23/2016________________________________________________________________________________
MTA Business & Diversity Initiatives Unit
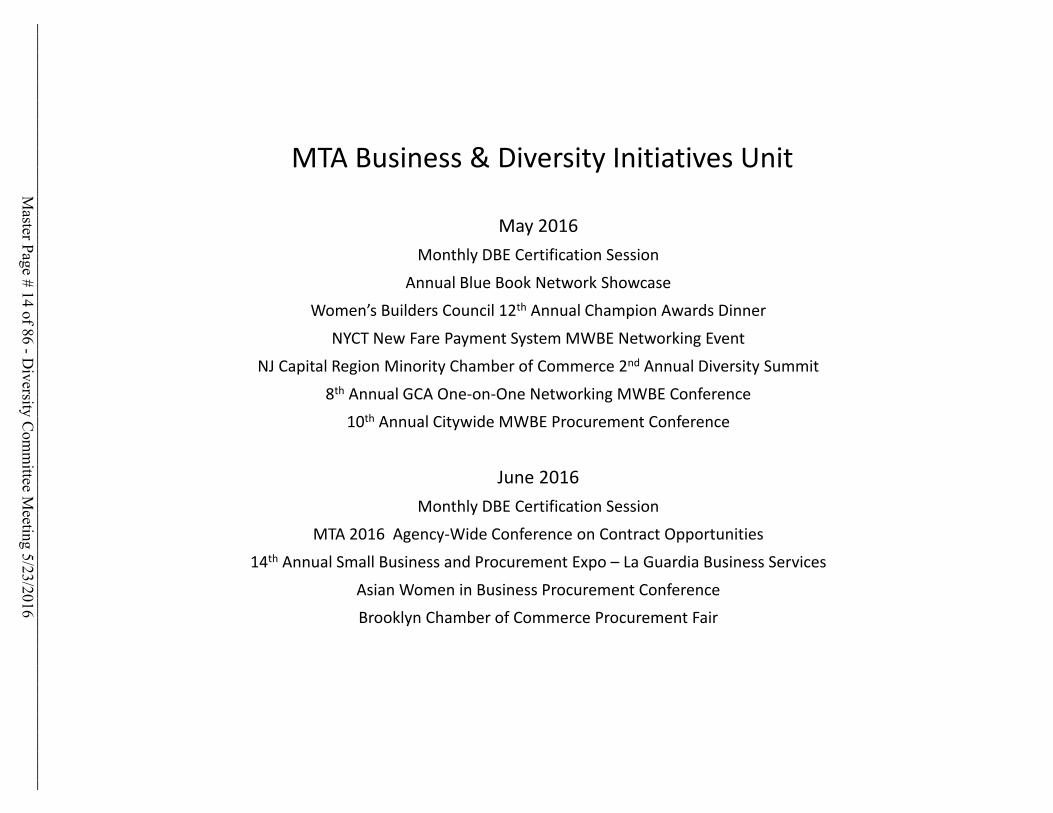
May 2016Monthly DBE Certification Session
Annual Blue Book Network Showcase
Women’s Builders Council 12th Annual Champion Awards Dinner
NYCT New Fare Payment System MWBE Networking Event
NJ Capital Region Minority Chamber of Commerce 2nd Annual Diversity Summit
8th Annual GCA One‐on‐One Networking MWBE Conference
10th Annual Citywide MWBE Procurement Conference
June 2016Monthly DBE Certification Session
MTA 2016 Agency‐Wide Conference on Contract Opportunities
14th Annual Small Business and Procurement Expo – La Guardia Business Services
Asian Women in Business Procurement Conference
Brooklyn Chamber of Commerce Procurement Fair
Master Page # 14 of 86 - D
iversity Com
mittee M
eeting 5/23/2016________________________________________________________________________________
MTA Department of Diversity/Civil RightsCertification Activity Report
May 23, 2016
Master Page # 15 of 86 - D
iversity Com
mittee M
eeting 5/23/2016________________________________________________________________________________

2016 2015 2014
JANUARY 5 4 14
FEBRUARY 11 6 4
MARCH 7 8 6
TOTAL 23 18 24
FIRST QUARTER 2014 ‐ 2016CERTIFICATION APPLICATIONS RECEIVED
Master Page # 16 of 86 - D
iversity Com
mittee M
eeting 5/23/2016________________________________________________________________________________
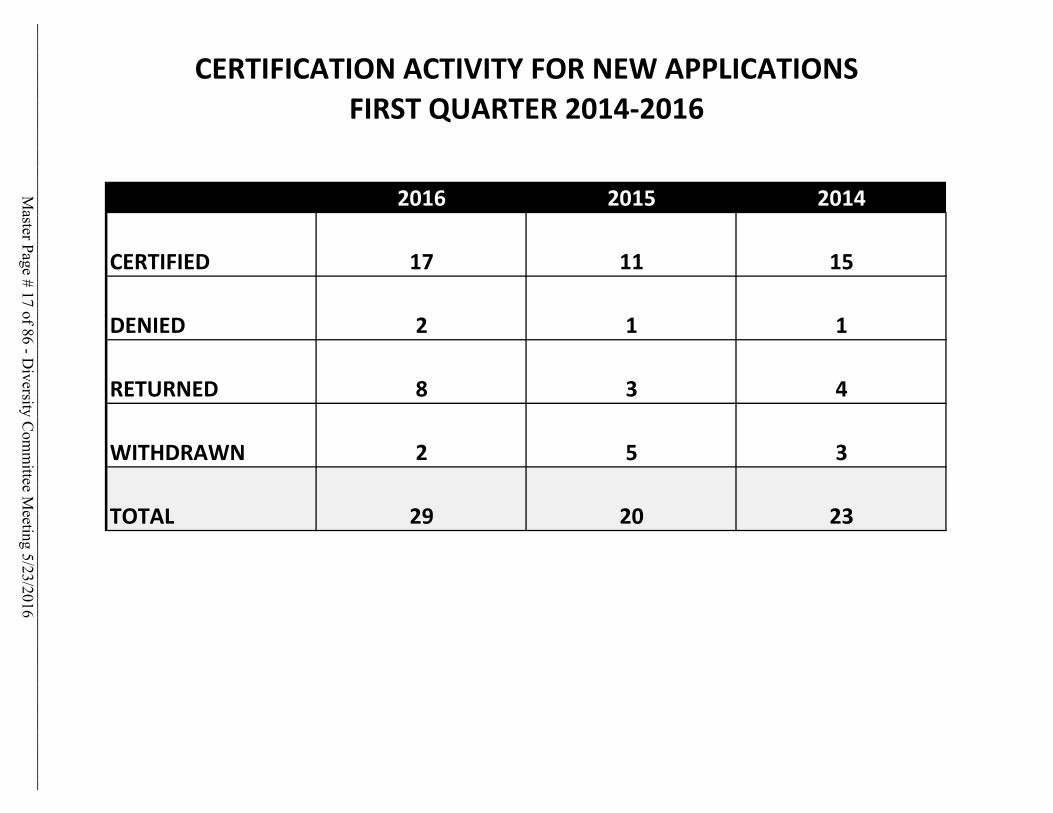
2016 2015 2014
CERTIFIED 17 11 15
DENIED 2 1 1
RETURNED 8 3 4
WITHDRAWN 2 5 3
TOTAL 29 20 23
CERTIFICATION ACTIVITY FOR NEW APPLICATIONSFIRST QUARTER 2014‐2016
Master Page # 17 of 86 - D
iversity Com
mittee M
eeting 5/23/2016________________________________________________________________________________
MTA All-Agency Military Recruitment
Master Page # 18 of 86 - D
iversity Com
mittee M
eeting 5/23/2016________________________________________________________________________________
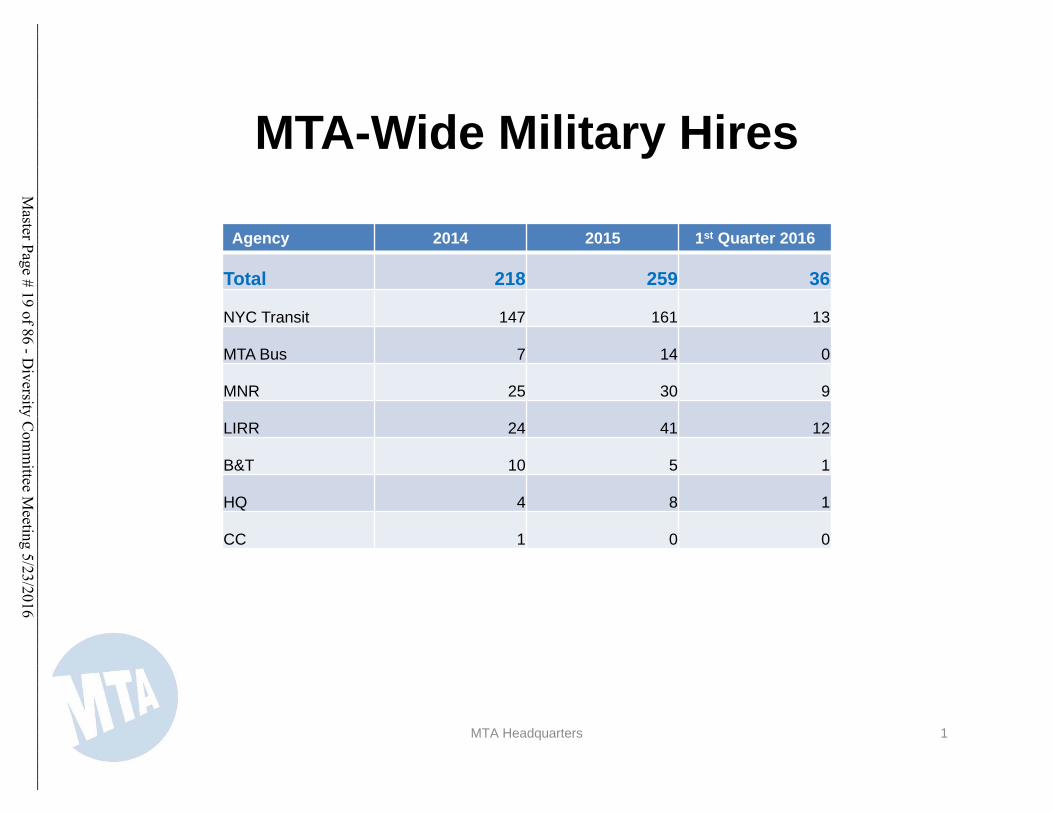
MTA-Wide Military Hires
Agency 2014 2015 1st Quarter 2016
Total 218 259 36
NYC Transit 147 161 13
MTA Bus 7 14 0
MNR 25 30 9
LIRR 24 41 12
B&T 10 5 1
HQ 4 8 1
CC 1 0 0
MTA Headquarters 1
Master Page # 19 of 86 - D
iversity Com
mittee M
eeting 5/23/2016________________________________________________________________________________
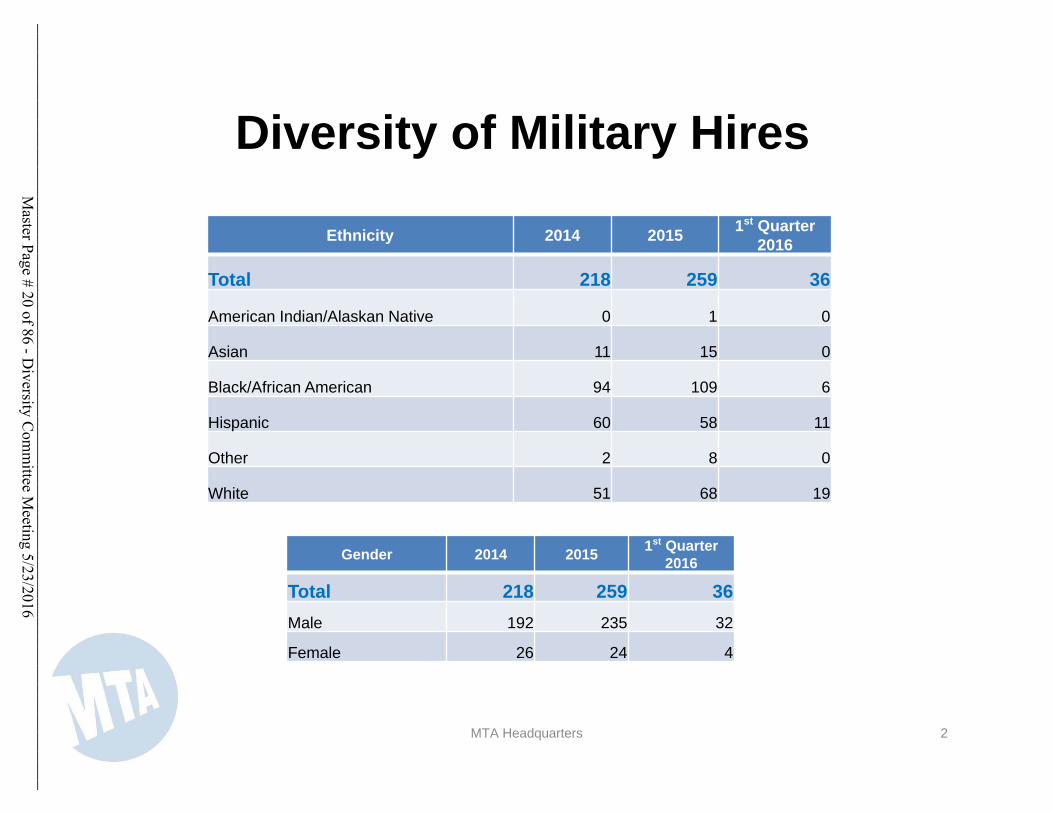
Diversity of Military Hires
MTA Headquarters 2
Ethnicity 2014 20151st Quarter
2016
Total 218 259 36
American Indian/Alaskan Native 0 1 0
Asian 11 15 0
Black/African American 94 109 6
Hispanic 60 58 11
Other 2 8 0
White 51 68 19
Gender 2014 20151st Quarter
2016
Total 218 259 36
Male 192 235 32
Female 26 24 4
Master Page # 20 of 86 - D
iversity Com
mittee M
eeting 5/23/2016________________________________________________________________________________
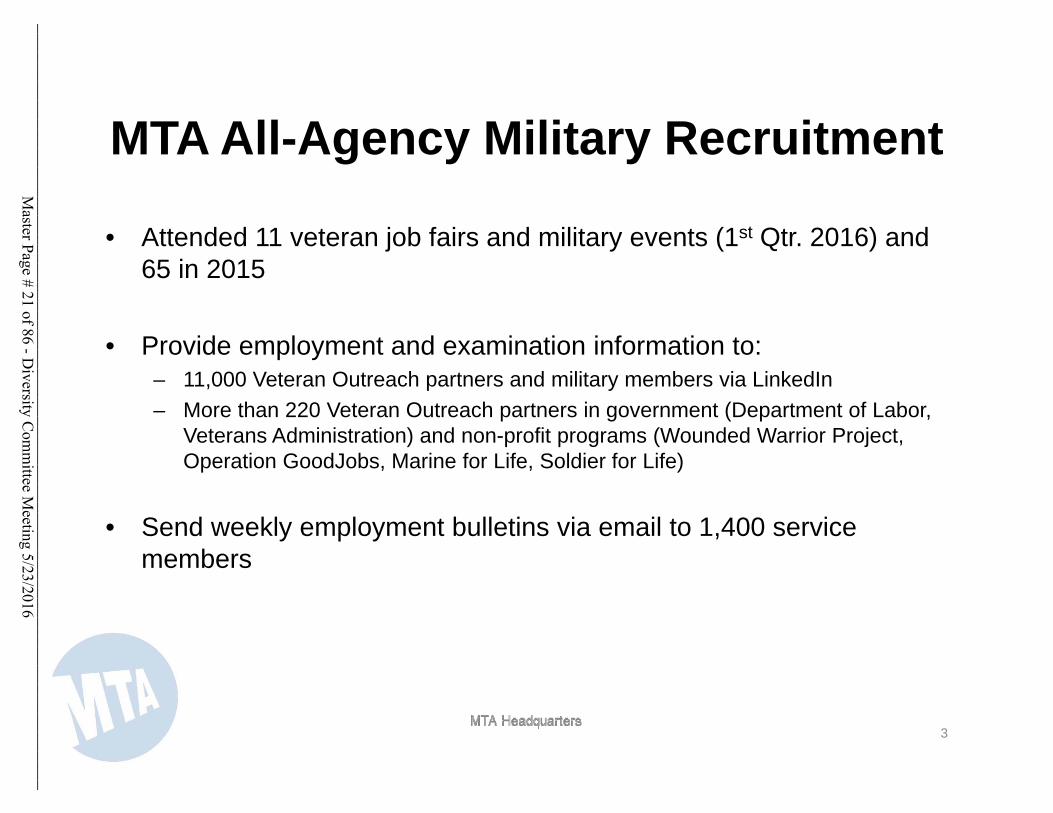
MTA All-Agency Military Recruitment
• Attended 11 veteran job fairs and military events (1st Qtr. 2016) and 65 in 2015
• Provide employment and examination information to: – 11,000 Veteran Outreach partners and military members via LinkedIn
– More than 220 Veteran Outreach partners in government (Department of Labor, Veterans Administration) and non-profit programs (Wounded Warrior Project, Operation GoodJobs, Marine for Life, Soldier for Life)
• Send weekly employment bulletins via email to 1,400 service members
3
Master Page # 21 of 86 - D
iversity Com
mittee M
eeting 5/23/2016________________________________________________________________________________
MTA All-Agency Military Training Seminars
MTA Headquarters 4
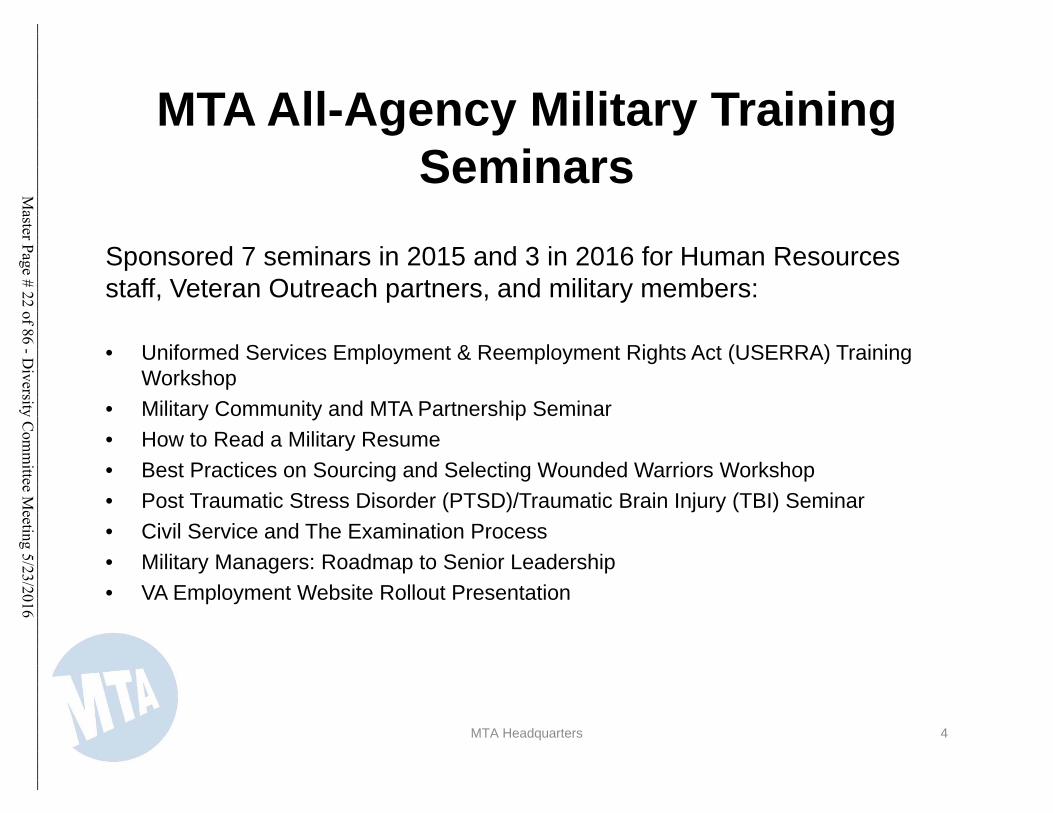
Sponsored 7 seminars in 2015 and 3 in 2016 for Human Resources staff, Veteran Outreach partners, and military members:
• Uniformed Services Employment & Reemployment Rights Act (USERRA) Training Workshop
• Military Community and MTA Partnership Seminar
• How to Read a Military Resume
• Best Practices on Sourcing and Selecting Wounded Warriors Workshop
• Post Traumatic Stress Disorder (PTSD)/Traumatic Brain Injury (TBI) Seminar
• Civil Service and The Examination Process
• Military Managers: Roadmap to Senior Leadership
• VA Employment Website Rollout Presentation
Master Page # 22 of 86 - D
iversity Com
mittee M
eeting 5/23/2016________________________________________________________________________________
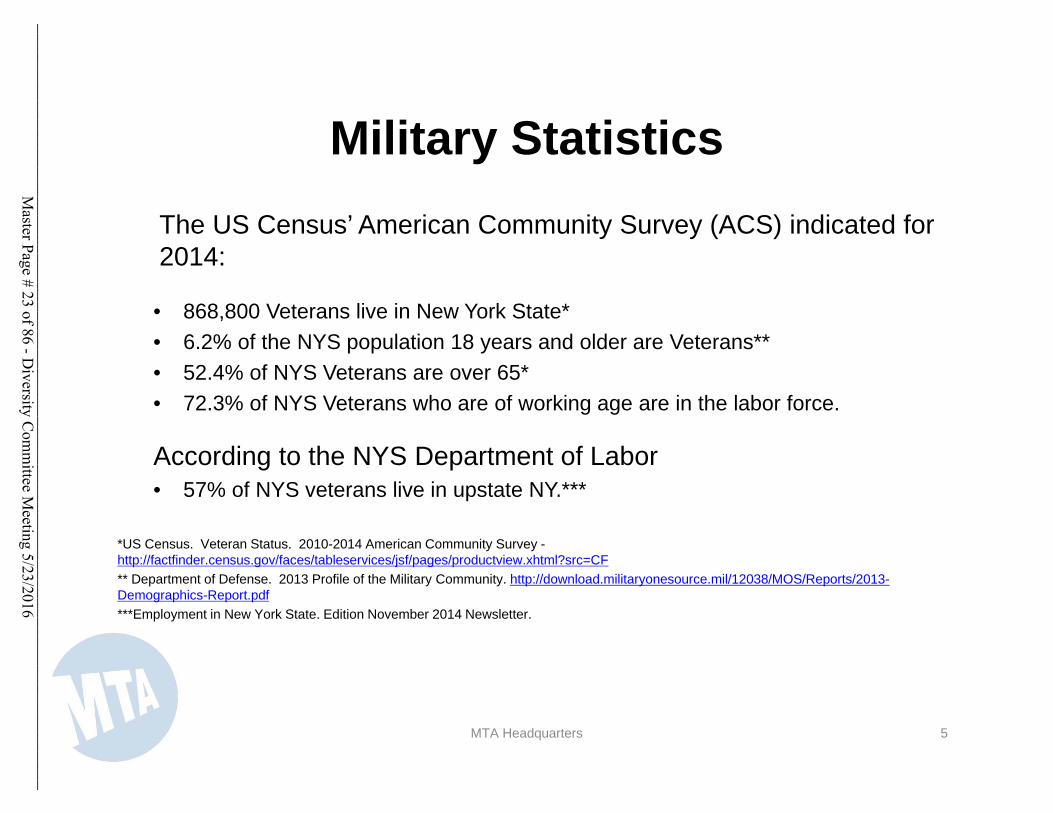
Military Statistics
The US Census’ American Community Survey (ACS) indicated for 2014:
• 868,800 Veterans live in New York State*
• 6.2% of the NYS population 18 years and older are Veterans**
• 52.4% of NYS Veterans are over 65*
• 72.3% of NYS Veterans who are of working age are in the labor force.
According to the NYS Department of Labor• 57% of NYS veterans live in upstate NY.***
*US Census. Veteran Status. 2010-2014 American Community Survey -http://factfinder.census.gov/faces/tableservices/jsf/pages/productview.xhtml?src=CF
** Department of Defense. 2013 Profile of the Military Community. http://download.militaryonesource.mil/12038/MOS/Reports/2013-Demographics-Report.pdf
***Employment in New York State. Edition November 2014 Newsletter.
MTA Headquarters 5
Master Page # 23 of 86 - D
iversity Com
mittee M
eeting 5/23/2016________________________________________________________________________________
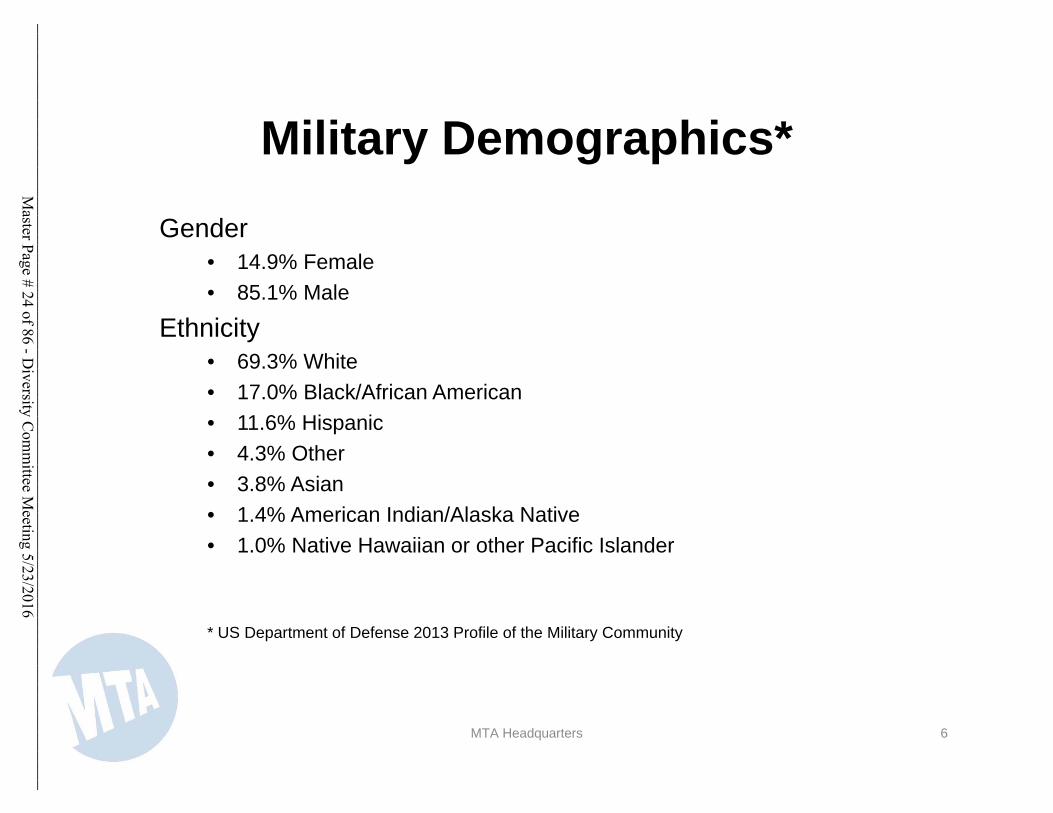
Military Demographics*
Gender• 14.9% Female
• 85.1% Male
Ethnicity• 69.3% White
• 17.0% Black/African American
• 11.6% Hispanic
• 4.3% Other
• 3.8% Asian
• 1.4% American Indian/Alaska Native
• 1.0% Native Hawaiian or other Pacific Islander
* US Department of Defense 2013 Profile of the Military Community
MTA Headquarters 6
Master Page # 24 of 86 - D
iversity Com
mittee M
eeting 5/23/2016________________________________________________________________________________
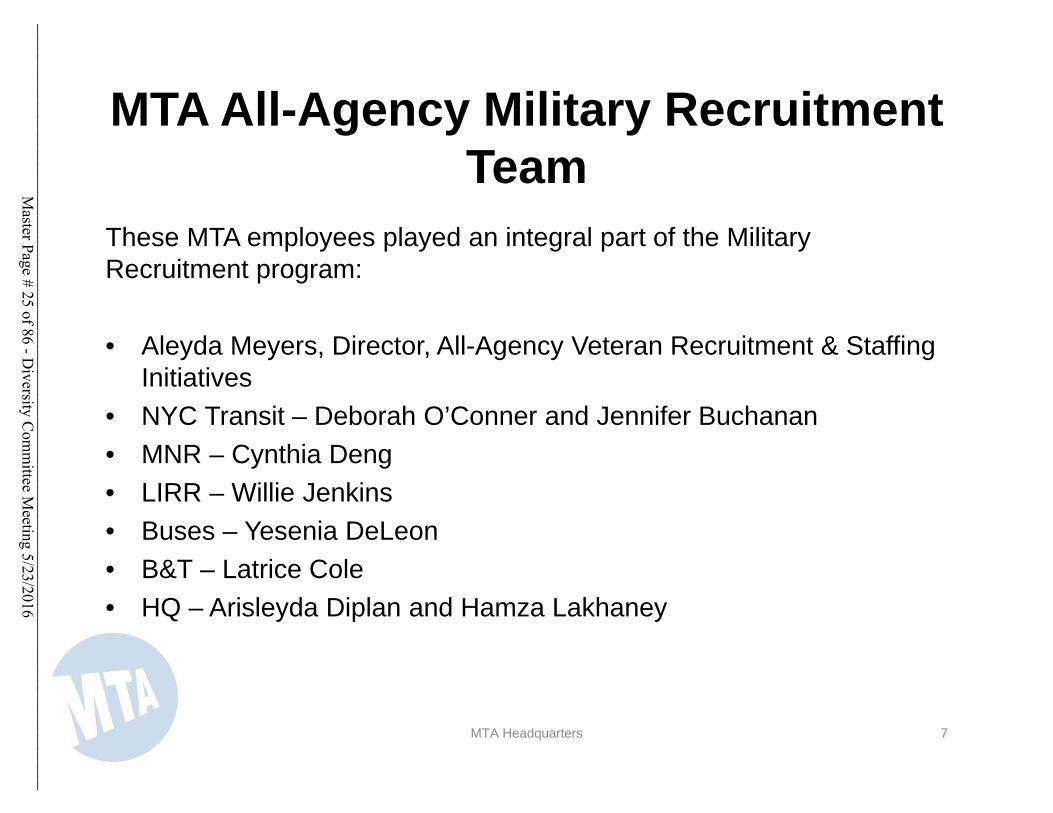
MTA All-Agency Military Recruitment Team
MTA Headquarters 7
These MTA employees played an integral part of the Military Recruitment program:
• Aleyda Meyers, Director, All-Agency Veteran Recruitment & Staffing Initiatives
• NYC Transit – Deborah O’Conner and Jennifer Buchanan
• MNR – Cynthia Deng
• LIRR – Willie Jenkins
• Buses – Yesenia DeLeon
• B&T – Latrice Cole
• HQ – Arisleyda Diplan and Hamza Lakhaney
Master Page # 25 of 86 - D
iversity Com
mittee M
eeting 5/23/2016________________________________________________________________________________
MTA DEPARTMENT OF DIVERSITY/CIVIL RIGHTS
EEO AND TITLE VI COMPLAINTSFIRST QUARTER 2016
MAY 23, 2016
Master Page # 26 of 86 - D
iversity Com
mittee M
eeting 5/23/2016________________________________________________________________________________
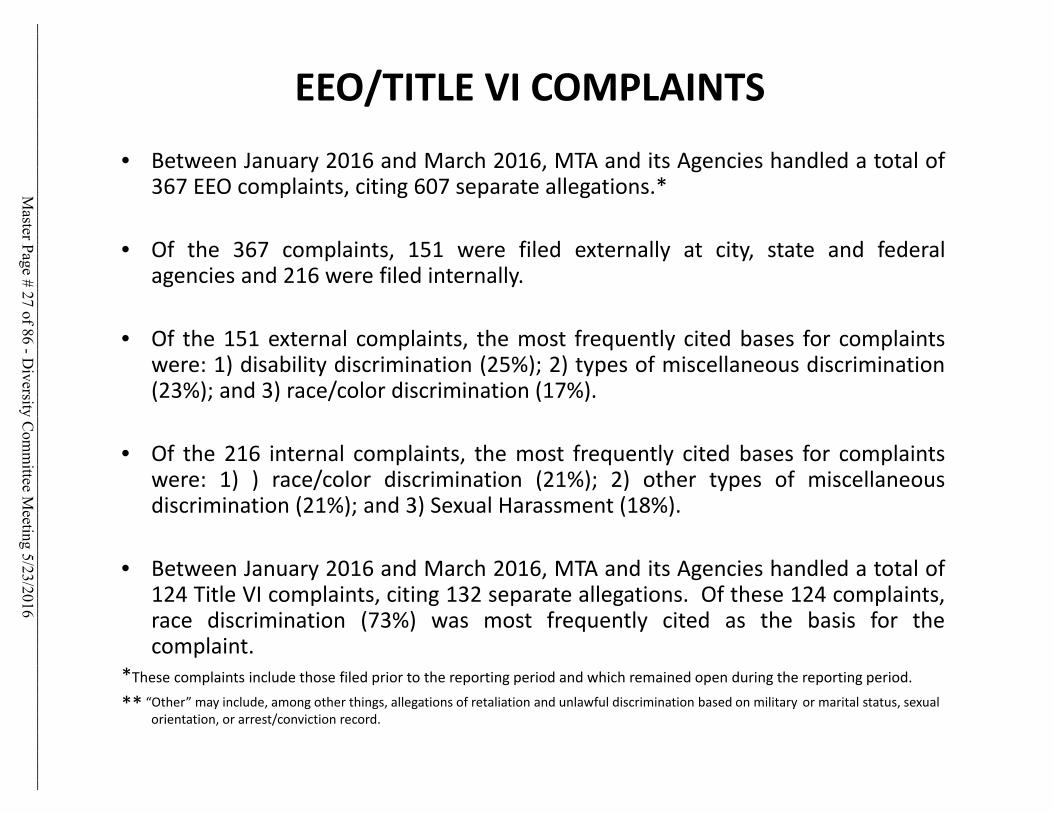
EEO/TITLE VI COMPLAINTS
• Between January 2016 and March 2016, MTA and its Agencies handled a total of367 EEO complaints, citing 607 separate allegations.*
• Of the 367 complaints, 151 were filed externally at city, state and federalagencies and 216 were filed internally.
• Of the 151 external complaints, the most frequently cited bases for complaintswere: 1) disability discrimination (25%); 2) types of miscellaneous discrimination(23%); and 3) race/color discrimination (17%).
• Of the 216 internal complaints, the most frequently cited bases for complaintswere: 1) ) race/color discrimination (21%); 2) other types of miscellaneousdiscrimination (21%); and 3) Sexual Harassment (18%).
• Between January 2016 and March 2016, MTA and its Agencies handled a total of124 Title VI complaints, citing 132 separate allegations. Of these 124 complaints,race discrimination (73%) was most frequently cited as the basis for thecomplaint.
*These complaints include those filed prior to the reporting period and which remained open during the reporting period.
** “Other” may include, among other things, allegations of retaliation and unlawful discrimination based on military or marital status, sexual orientation, or arrest/conviction record.
Master Page # 27 of 86 - D
iversity Com
mittee M
eeting 5/23/2016________________________________________________________________________________
MTA‐WIDE EEO COMPLAINTS AS OF MARCH 31, 20161
RACE SEXUAL NATIONAL TOTAL TOTAL STATUS
AGENCY COLOR HARASS. AGE GENDER RELIGION ORIGIN DISABILITY OTHER2 ISSUES3CASES OPEN
MTA 1 0 1 2 0 1 3 3 11 7 6
B&T 3 0 1 0 1 1 2 3 11 6 6
MNR 6 0 4 3 0 4 6 6 29 16 9
LIRR 3 0 0 0 0 0 3 0 6 6 6
NYCT 25 8 13 19 5 15 39 39 163 111 98
CC 0 0 0 0 0 0 0 0 0 0 0
BUS 1 0 0 1 0 0 3 1 6 5 5TOTAL 39 8 19 25 6 21 56 52 226 151 130
17% 4% 8% 11% 3% 9% 25% 23%
RACE SEXUAL NATIONAL TOTAL TOTAL STATUS
AGENCY COLOR HARASS. AGE GENDER RELIGION ORIGIN DISABILITY OTHER2 ISSUES3CASES OPEN
MTA 2 2 0 1 0 3 1 5 14 8 3
B&T 2 0 0 15 1 1 1 3 23 20 18
MNR 4 6 1 9 0 2 2 8 32 22 12
LIRR 2 2 1 1 0 0 0 3 9 7 4
NYCT 69 58 8 33 16 43 10 61 298 155 146
CC 0 0 0 0 0 0 0 0 0 0 0
BUS 2 0 2 0 1 0 0 0 5 4 1
TOTAL 81 68 12 59 18 49 14 80 381 216 184
21% 18% 3% 15% 5% 13% 4% 21%
1. This chart includes all pending matters as of the date of the report; including matters filed prior to the reporting period. 2. "Other" contains all EEO categories not otherwise specifically mentioned on the chart ( i.e., sexual orientation, military status, marital status, arrest/conviction record or retaliation, etc.)3. In some instances, a single complaint may involve two or more EEO categories.
EEO DISCRIMINATION COMPLAINTS EXTERNAL
EEO DISCRIMINATION COMPLAINTS INTERNAL
Master Page # 28 of 86 - D
iversity Com
mittee M
eeting 5/23/2016________________________________________________________________________________
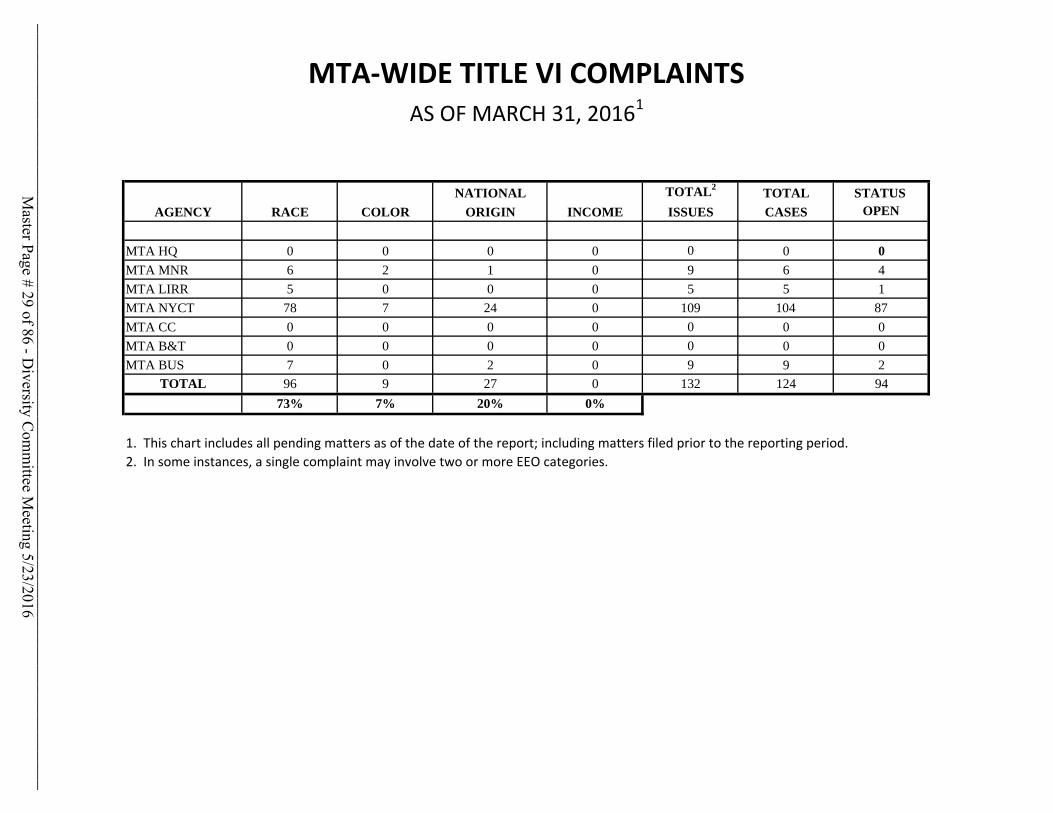
MTA‐WIDE TITLE VI COMPLAINTS AS OF MARCH 31, 20161
NATIONAL TOTAL2TOTAL STATUS
AGENCY RACE COLOR ORIGIN INCOME ISSUES CASES OPEN
MTA HQ 0 0 0 0 0 0 0
MTA MNR 6 2 1 0 9 6 4
MTA LIRR 5 0 0 0 5 5 1
MTA NYCT 78 7 24 0 109 104 87
MTA CC 0 0 0 0 0 0 0
MTA B&T 0 0 0 0 0 0 0
MTA BUS 7 0 2 0 9 9 2
TOTAL 96 9 27 0 132 124 94
73% 7% 20% 0%
1. This chart includes all pending matters as of the date of the report; including matters filed prior to the reporting period. 2. In some instances, a single complaint may involve two or more EEO categories.
Master Page # 29 of 86 - D
iversity Com
mittee M
eeting 5/23/2016________________________________________________________________________________
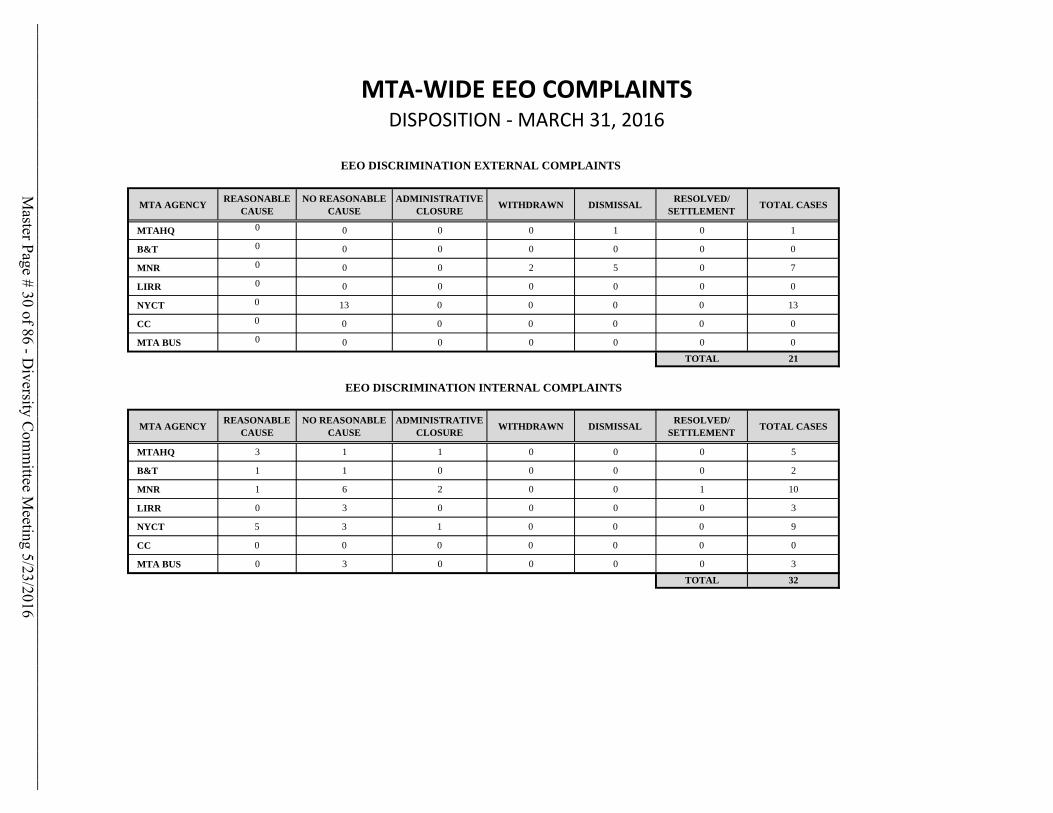
MTA‐WIDE EEO COMPLAINTSDISPOSITION ‐ MARCH 31, 2016
MTA AGENCYREASONABLE
CAUSENO REASONABLE
CAUSEADMINISTRATIVE
CLOSUREWITHDRAWN DISMISSAL
RESOLVED/ SETTLEMENT
TOTAL CASES
MTAHQ 0 0 0 0 1 0 1
B&T 0 0 0 0 0 0 0
MNR 0 0 0 2 5 0 7
LIRR 0 0 0 0 0 0 0
NYCT 0 13 0 0 0 0 13
CC 0 0 0 0 0 0 0
MTA BUS 0 0 0 0 0 0 0
TOTAL 21
MTA AGENCYREASONABLE
CAUSENO REASONABLE
CAUSEADMINISTRATIVE
CLOSUREWITHDRAWN DISMISSAL
RESOLVED/ SETTLEMENT
TOTAL CASES
MTAHQ 3 1 1 0 0 0 5
B&T 1 1 0 0 0 0 2
MNR 1 6 2 0 0 1 10
LIRR 0 3 0 0 0 0 3
NYCT 5 3 1 0 0 0 9
CC 0 0 0 0 0 0 0
MTA BUS 0 3 0 0 0 0 3
TOTAL 32
EEO DISCRIMINATION EXTERNAL COMPLAINTS
EEO DISCRIMINATION INTERNAL COMPLAINTS
Master Page # 30 of 86 - D
iversity Com
mittee M
eeting 5/23/2016________________________________________________________________________________
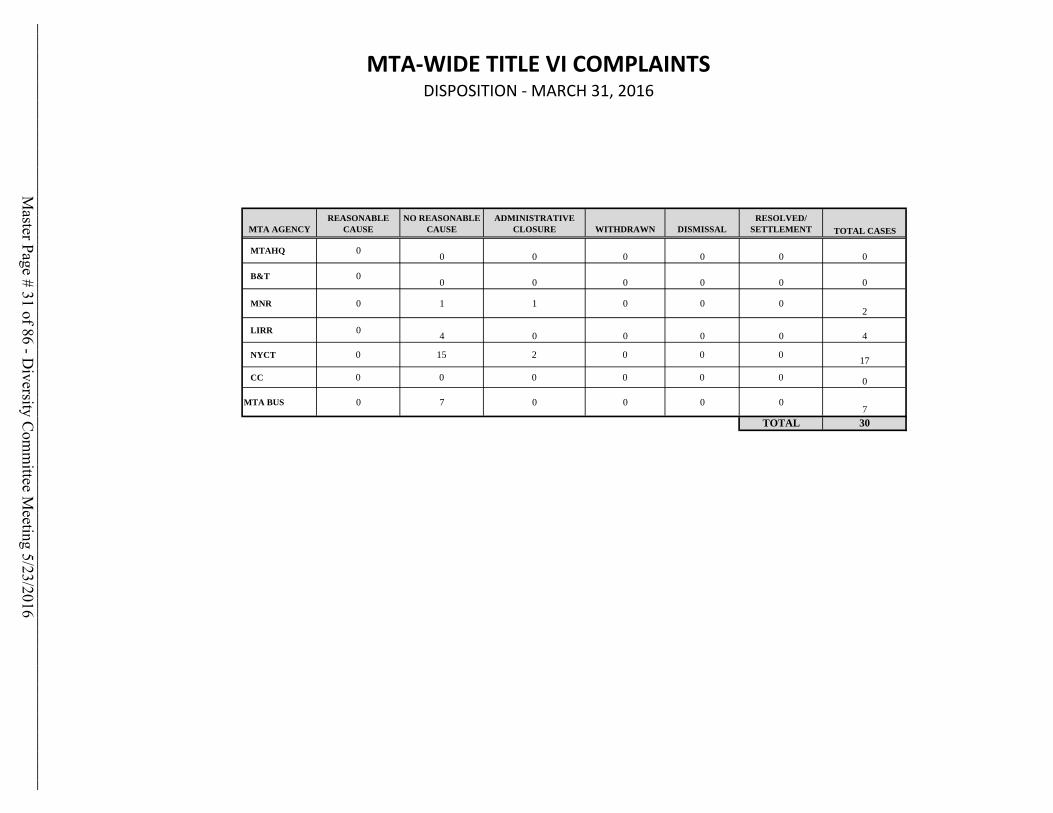
MTA‐WIDE TITLE VI COMPLAINTSDISPOSITION ‐ MARCH 31, 2016
MTA AGENCYREASONABLE
CAUSENO REASONABLE
CAUSEADMINISTRATIVE
CLOSURE WITHDRAWN DISMISSALRESOLVED/
SETTLEMENT TOTAL CASES
MTAHQ 00 0 0 0 0 0
B&T 00 0 0 0 0 0
MNR 0 1 1 0 0 02
LIRR 04 0 0 0 0 4
NYCT 0 15 2 0 0 017
CC 0 0 0 0 0 0 0
MTA BUS 0 7 0 0 0 07
TOTAL 30
Master Page # 31 of 86 - D
iversity Com
mittee M
eeting 5/23/2016________________________________________________________________________________
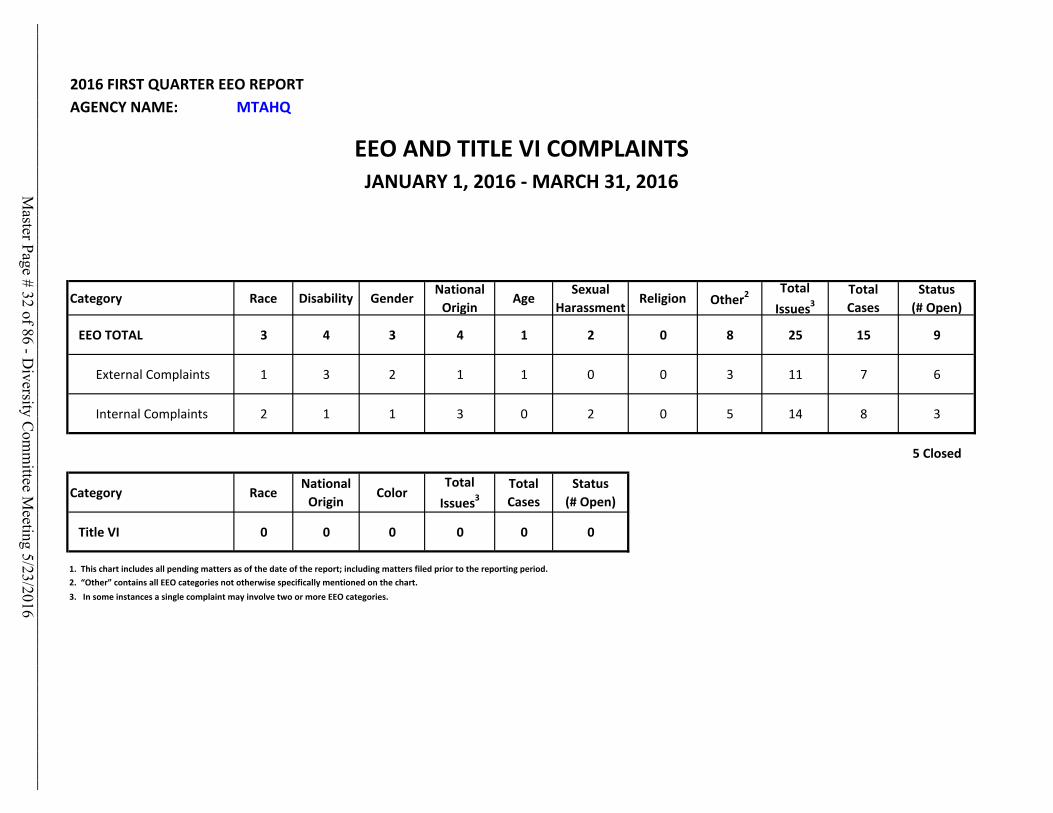
2016 FIRST QUARTER EEO REPORTAGENCY NAME: MTAHQ
Category Race Disability GenderNational Origin
AgeSexual
HarassmentReligion Other2
Total Issues3
Total Cases
Status(# Open)
EEO TOTAL 3 4 3 4 1 2 0 8 25 15 9
External Complaints 1 3 2 1 1 0 0 3 11 7 6
Internal Complaints 2 1 1 3 0 2 0 5 14 8 3
5 Closed
Category RaceNational Origin
ColorTotal Issues3
Total Cases
Status(# Open)
Title VI 0 0 0 0 0 0
1. This chart includes all pending matters as of the date of the report; including matters filed prior to the reporting period.2. “Other” contains all EEO categories not otherwise specifically mentioned on the chart.3. In some instances a single complaint may involve two or more EEO categories.
EEO AND TITLE VI COMPLAINTSJANUARY 1, 2016 ‐ MARCH 31, 2016M
aster Page # 32 of 86 - Diversity C
omm
ittee Meeting 5/23/2016
________________________________________________________________________________
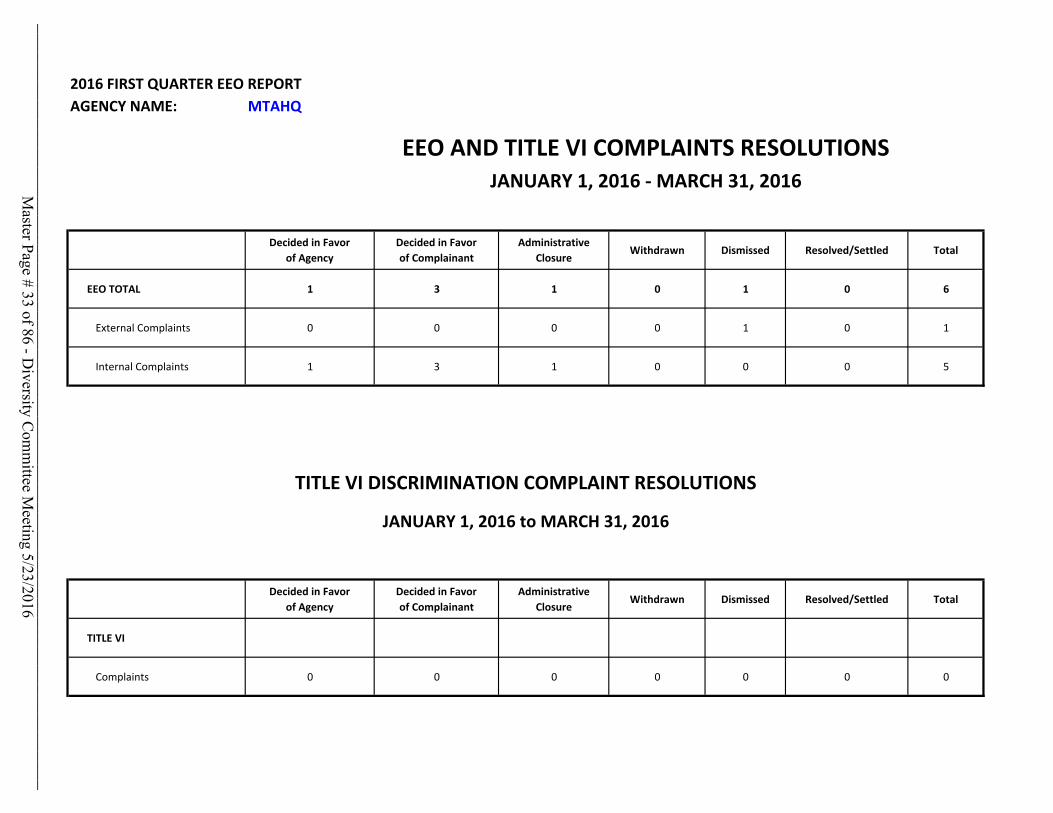
2016 FIRST QUARTER EEO REPORTAGENCY NAME: MTAHQ
Decided in Favorof Agency
Decided in Favorof Complainant
AdministrativeClosure
Withdrawn Dismissed Resolved/Settled Total
EEO TOTAL 1 3 1 0 1 0 6
External Complaints 0 0 0 0 1 0 1
Internal Complaints 1 3 1 0 0 0 5
Decided in Favorof Agency
Decided in Favorof Complainant
AdministrativeClosure
Withdrawn Dismissed Resolved/Settled Total
TITLE VI
Complaints 0 0 0 0 0 0 0
TITLE VI DISCRIMINATION COMPLAINT RESOLUTIONS
JANUARY 1, 2016 to MARCH 31, 2016
EEO AND TITLE VI COMPLAINTS RESOLUTIONSJANUARY 1, 2016 ‐ MARCH 31, 2016M
aster Page # 33 of 86 - Diversity C
omm
ittee Meeting 5/23/2016
________________________________________________________________________________
MTA SMALL BUSINESS DEVELOPMENT PROGRAM UPDATE
(Tier 1,Tier 2 and Federal)
May 23, 2016
Master Page # 34 of 86 - D
iversity Com
mittee M
eeting 5/23/2016________________________________________________________________________________
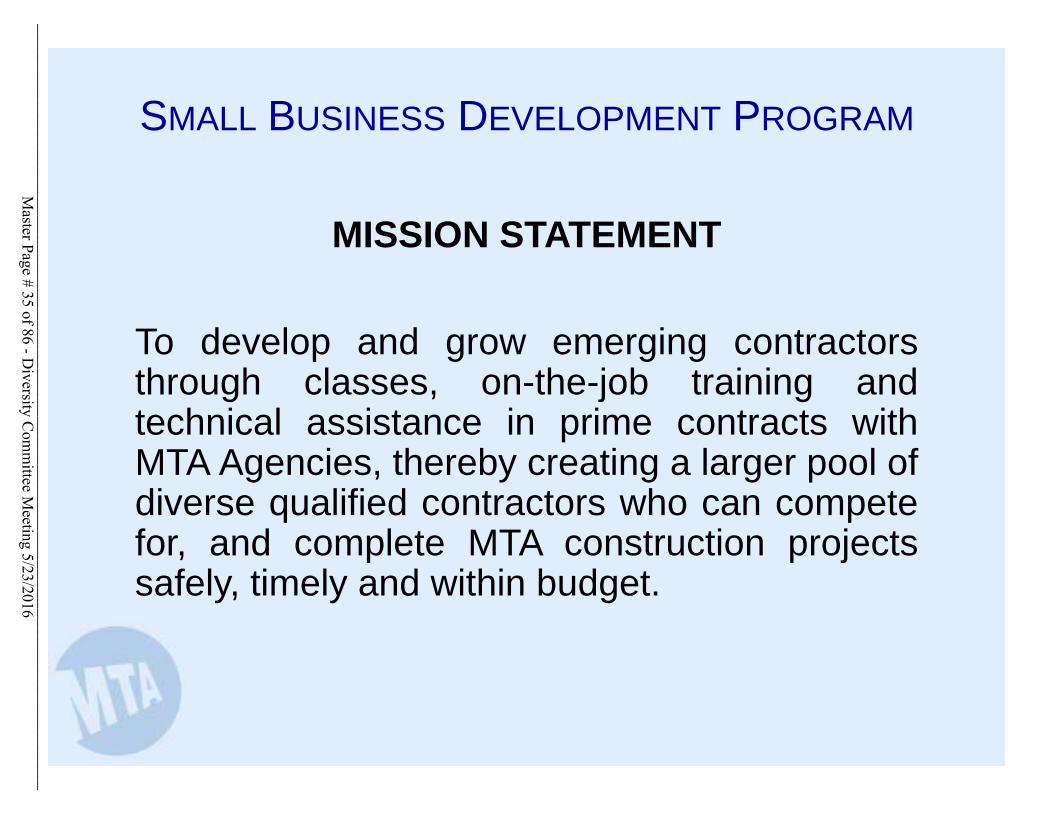
MISSION STATEMENT
To develop and grow emerging contractorsthrough classes, on-the-job training andtechnical assistance in prime contracts withMTA Agencies, thereby creating a larger pool ofdiverse qualified contractors who can competefor, and complete MTA construction projectssafely, timely and within budget.
SMALL BUSINESS DEVELOPMENT PROGRAM
Master Page # 35 of 86 - D
iversity Com
mittee M
eeting 5/23/2016________________________________________________________________________________
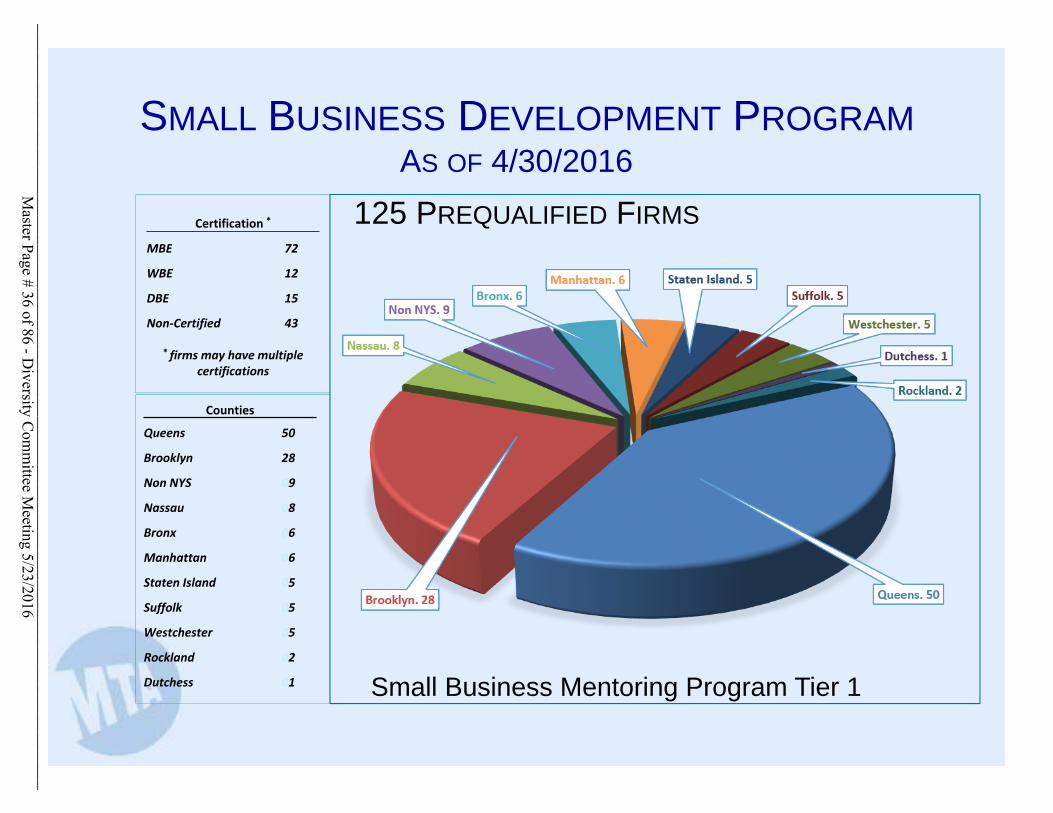
Certification *
MBE 72
WBE 12
DBE 15
Non‐Certified 43
* firms may have multiple certifications
Counties
Queens 50
Brooklyn 28
Non NYS 09
Nassau 08
Bronx 06
Manhattan 06
Staten Island 05
Suffolk 05
Westchester 05
Rockland 02
Dutchess 01 Small Business Mentoring Program Tier 1
125 PREQUALIFIED FIRMS
AS OF 4/30/2016SMALL BUSINESS DEVELOPMENT PROGRAM
Queens. 50Brooklyn. 28
Nassau. 8
Non NYS. 9Bronx. 6
Manhattan. 6 Staten Island. 5Suffolk. 5
Westchester. 5
Dutchess. 1
Rockland. 2
Master Page # 36 of 86 - D
iversity Com
mittee M
eeting 5/23/2016________________________________________________________________________________
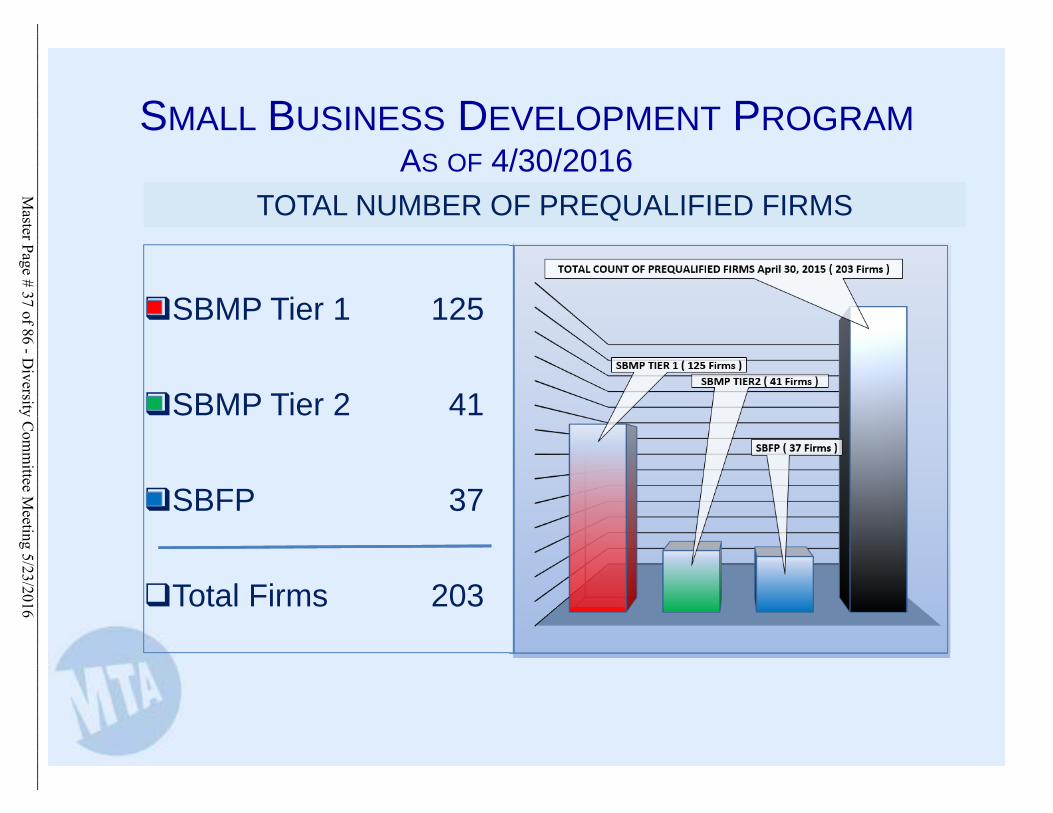
SBMP TIER 1 ( 125 Firms SBMP TIER2 ( 41 Firms )
SBFP ( 37 Firms
TOTAL COUNT OF PREQUALIFIED FIRMS April 30, 2015 ( 203 Firms )SBMP Tier 1 125
SBMP Tier 2 41
SBFP 37
Total Firms 203
TOTAL NUMBER OF PREQUALIFIED FIRMS
SMALL BUSINESS DEVELOPMENT PROGRAMAS OF 4/30/2016
Master Page # 37 of 86 - D
iversity Com
mittee M
eeting 5/23/2016________________________________________________________________________________
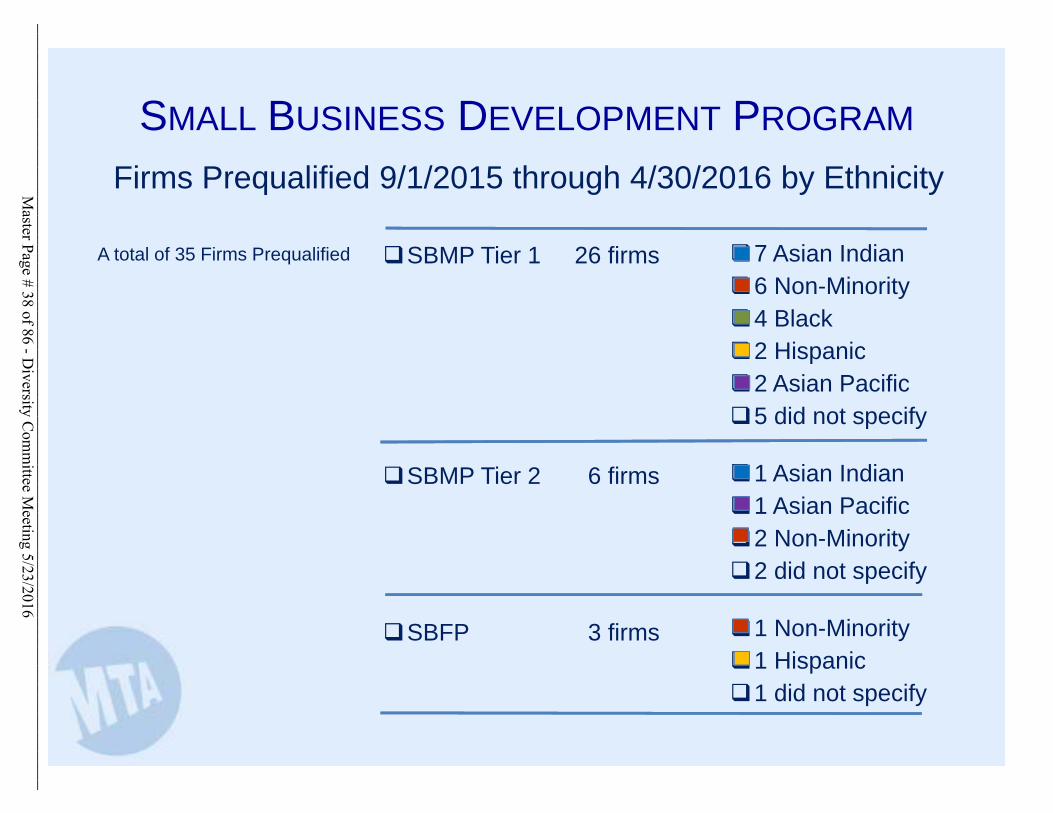
7 Asian Indian6 Non-Minority4 Black2 Hispanic2 Asian Pacific5 did not specify
1 Asian Indian1 Asian Pacific2 Non-Minority2 did not specify
1 Non-Minority1 Hispanic1 did not specify
Firms Prequalified 9/1/2015 through 4/30/2016 by Ethnicity
SMALL BUSINESS DEVELOPMENT PROGRAM
SBMP Tier 1 26 firms
SBMP Tier 2 6 firms
SBFP 3 firms
A total of 35 Firms Prequalified
Master Page # 38 of 86 - D
iversity Com
mittee M
eeting 5/23/2016________________________________________________________________________________
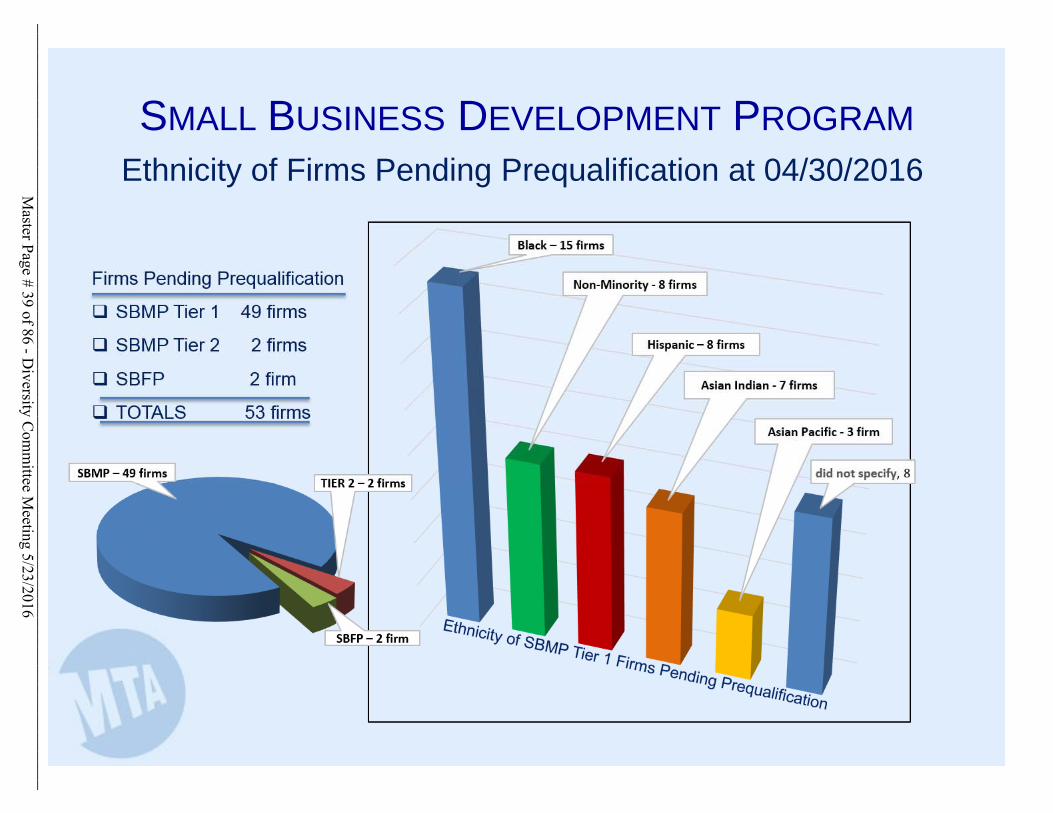
Ethnicity of Firms Pending Prequalification at 04/30/2016
Black – 15 firms
Non‐Minority ‐ 8 firms
Hispanic – 8 firms
Asian Indian ‐ 7 firms
Asian Pacific ‐ 3 firm
did not specify, 8
SMALL BUSINESS DEVELOPMENT PROGRAM
Firms Pending Prequalification
SBMP Tier 1 49 firms
SBMP Tier 2 2 firms
SBFP 2 firm
TOTALS 53 firms
SBMP – 49 firmsTIER 2 – 2 firms
SBFP – 2 firm
Master Page # 39 of 86 - D
iversity Com
mittee M
eeting 5/23/2016________________________________________________________________________________
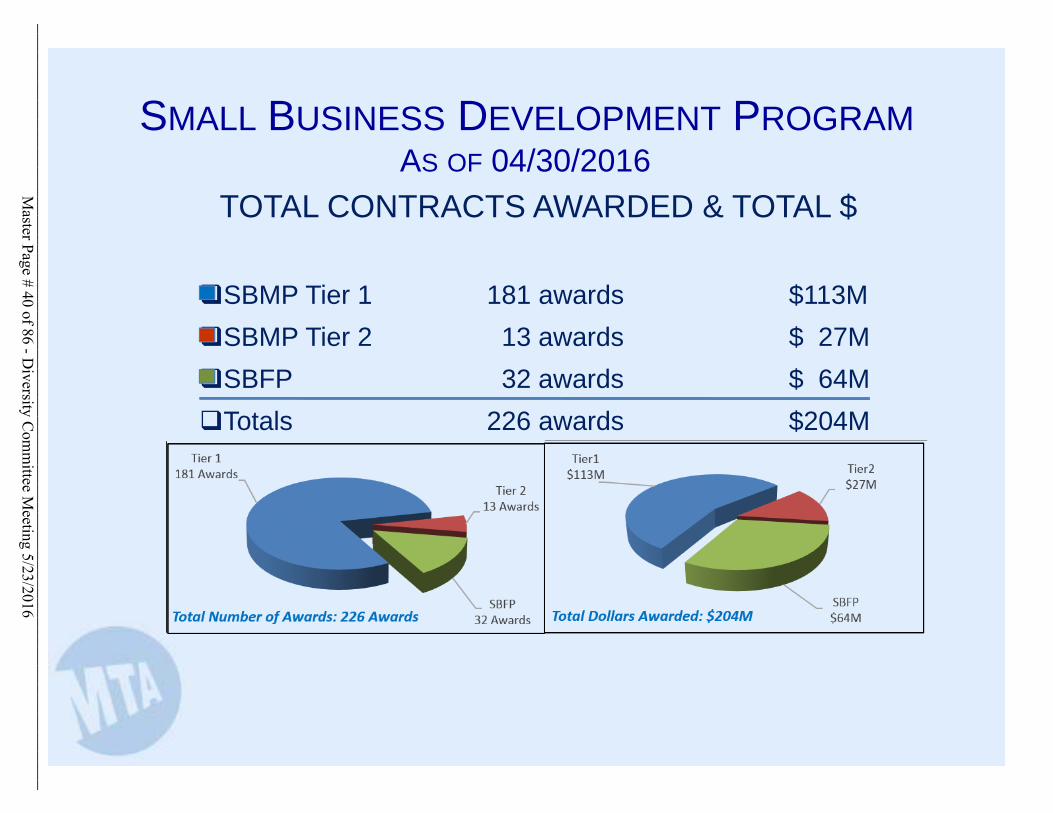
SBMP Tier 1 181 awards $113M
SBMP Tier 2 13 awards $ 27M
SBFP 32 awards $ 64M
Totals 226 awards $204M
TOTAL CONTRACTS AWARDED & TOTAL $
Tier1 $113M Tier2
$27M
SBFP $64M
Tier 1 181 Awards
Tier 2 13 Awards
SBFP 32 AwardsTotal Number of Awards: 226 Awards Total Dollars Awarded: $204M
SMALL BUSINESS DEVELOPMENT PROGRAMAS OF 04/30/2016
Master Page # 40 of 86 - D
iversity Com
mittee M
eeting 5/23/2016________________________________________________________________________________
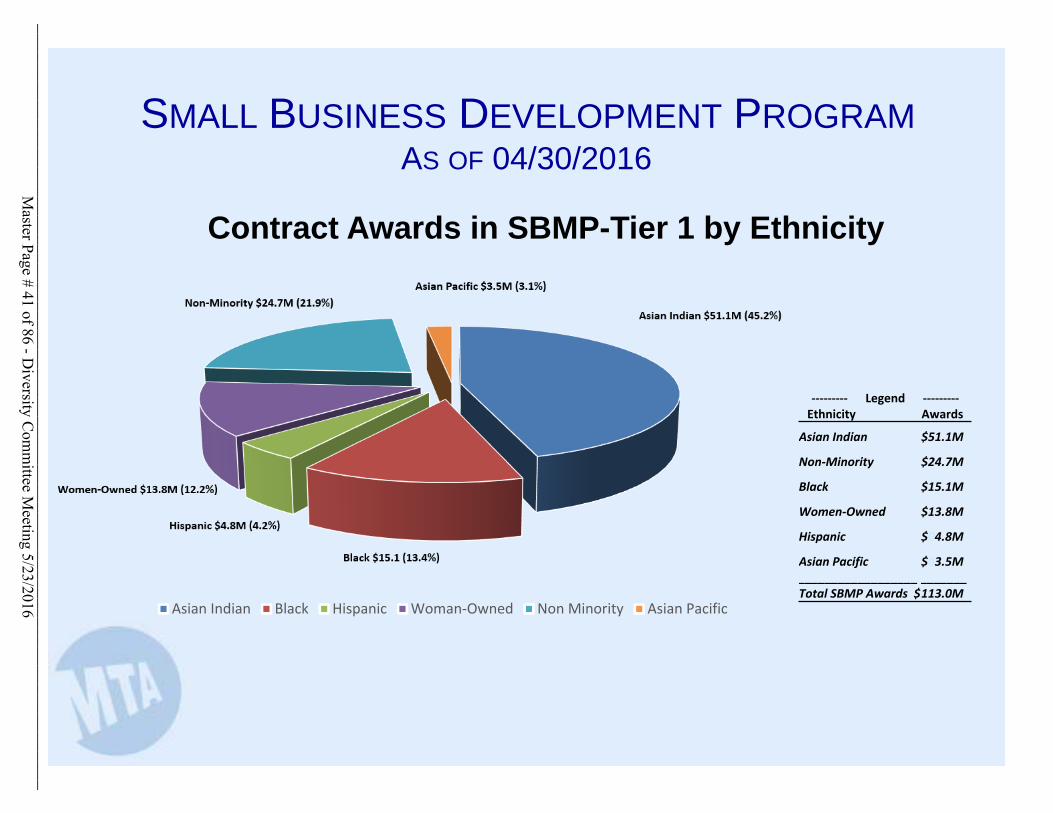
Asian Indian Black Hispanic Woman‐Owned Non Minority Asian Pacific
Asian Indian $51.1M (45.2%)
Black $15.1 (13.4%)
Women‐Owned $13.8M (12.2%)
Non‐Minority $24.7M (21.9%)
Hispanic $4.8M (4.2%)
Asian Pacific $3.5M (3.1%)
Contract Awards in SBMP-Tier 1 by Ethnicity
‐‐‐‐‐‐‐‐‐ Legend ‐‐‐‐‐‐‐‐‐Ethnicity Awards
Asian Indian $51.1M
Non‐Minority $24.7M
Black $15.1M
Women‐Owned $13.8M
Hispanic $04.8M
Asian Pacific $03.5M__________________Total SBMP Awards $
_______113.0M
SMALL BUSINESS DEVELOPMENT PROGRAMAS OF 04/30/2016
Master Page # 41 of 86 - D
iversity Com
mittee M
eeting 5/23/2016________________________________________________________________________________
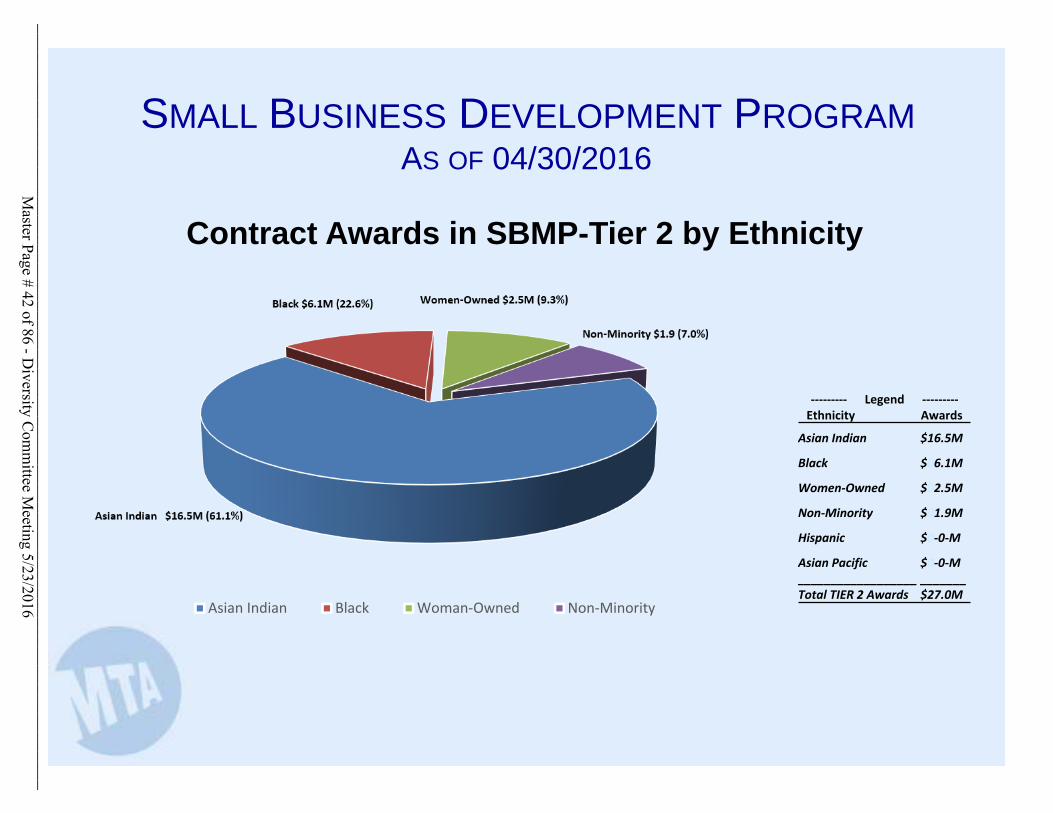
Asian Indian Black Woman‐Owned Non‐Minority
Asian Indian $16.5M (61.1%)
Black $6.1M (22.6%) Women‐Owned $2.5M (9.3%)
Non‐Minority $1.9 (7.0%)
Contract Awards in SBMP-Tier 2 by Ethnicity
‐‐‐‐‐‐‐‐‐ Legend ‐‐‐‐‐‐‐‐‐Ethnicity Awards
Asian Indian $16.5M
Black $06.1M
Women‐Owned $02.5M
Non‐Minority $01.9M
Hispanic $0‐0‐M
Asian Pacific $0‐0‐M__________________Total TIER 2 Awards
_______$27.0M
SMALL BUSINESS DEVELOPMENT PROGRAMAS OF 04/30/2016
Master Page # 42 of 86 - D
iversity Com
mittee M
eeting 5/23/2016________________________________________________________________________________
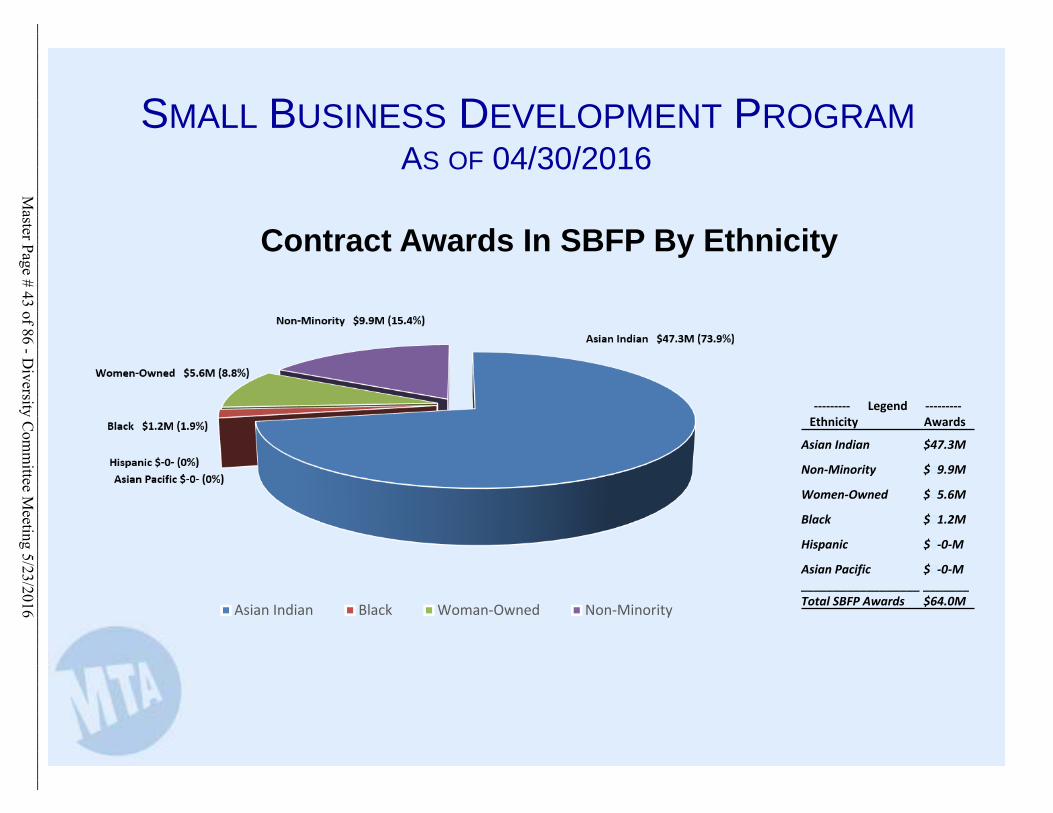
Asian Indian Black Woman‐Owned Non‐Minority
Asian Indian $47.3M (73.9%)
Black $1.2M (1.9%)
Women‐Owned $5.6M (8.8%)
Non‐Minority $9.9M (15.4%)
Contract Awards In SBFP By Ethnicity
‐‐‐‐‐‐‐‐‐ Legend ‐‐‐‐‐‐‐‐‐Ethnicity Awards
Asian Indian $47.3M
Non‐Minority $09.9M
Women‐Owned $05.6M
Black $01.2M
Hispanic $0‐0‐M
Asian Pacific $0‐0‐M__________________Total SBFP Awards
_______$64.0M
Hispanic $‐0‐ (0%)Asian Pacific $‐0‐ (0%)
SMALL BUSINESS DEVELOPMENT PROGRAMAS OF 04/30/2016
Master Page # 43 of 86 - D
iversity Com
mittee M
eeting 5/23/2016________________________________________________________________________________
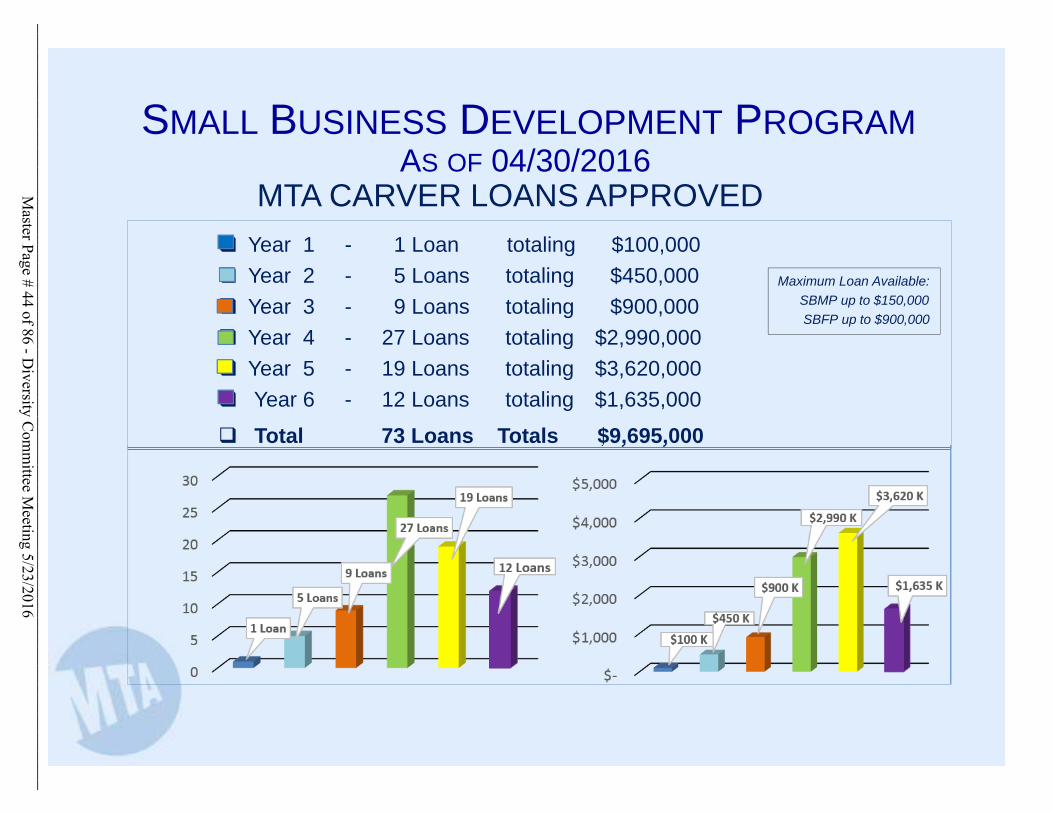
Year 1 - 1 Loan totaling $100,000
Year 2 - 5 Loans totaling $450,000
Year 3 - 9 Loans totaling $900,000
Year 4 - 27 Loans totaling $2,990,000
Year 5 - 19 Loans totaling $3,620,000
Year 6 - 12 Loans totaling $1,635,000
Total 73 Loans Totals $9,695,000
0
5
10
15
20
25
30
1 Loan
5 Loans
9 Loans
27 Loans
19 Loans
12 Loans
$‐
$1,000
$2,000
$3,000
$4,000
$5,000
$100 K
$450 K
$900 K
$2,990 K
$3,620 K
$1,635 K
Maximum Loan Available: SBMP up to $150,000 SBFP up to $900,000
MTA CARVER LOANS APPROVED
SMALL BUSINESS DEVELOPMENT PROGRAMAS OF 04/30/2016
Master Page # 44 of 86 - D
iversity Com
mittee M
eeting 5/23/2016________________________________________________________________________________
Emerging Contractors Pilot Program
SMALL BUSINESS DEVELOPMENT PROGRAMAS OF 04/30/2016
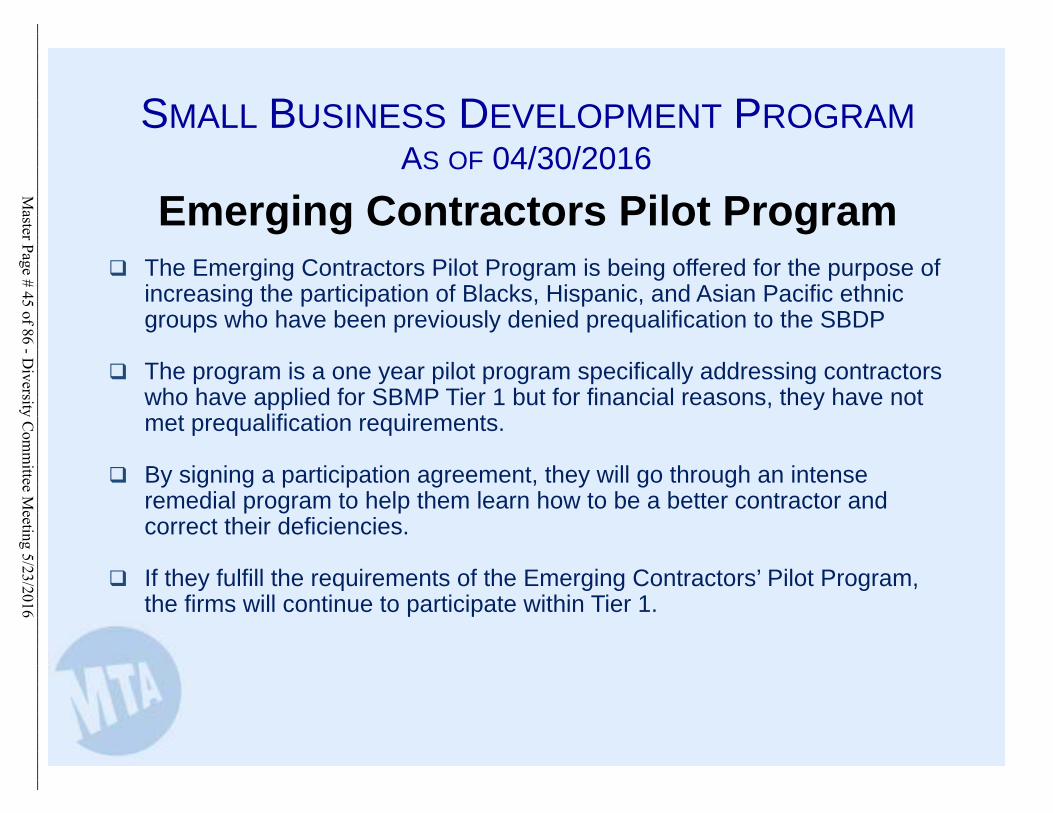
The Emerging Contractors Pilot Program is being offered for the purpose of increasing the participation of Blacks, Hispanic, and Asian Pacific ethnic groups who have been previously denied prequalification to the SBDP
The program is a one year pilot program specifically addressing contractors who have applied for SBMP Tier 1 but for financial reasons, they have not met prequalification requirements.
By signing a participation agreement, they will go through an intense remedial program to help them learn how to be a better contractor and correct their deficiencies.
If they fulfill the requirements of the Emerging Contractors’ Pilot Program, the firms will continue to participate within Tier 1.
Master Page # 45 of 86 - D
iversity Com
mittee M
eeting 5/23/2016________________________________________________________________________________
Emerging Contractors Pilot Program
SMALL BUSINESS DEVELOPMENT PROGRAMAS OF 04/30/2016
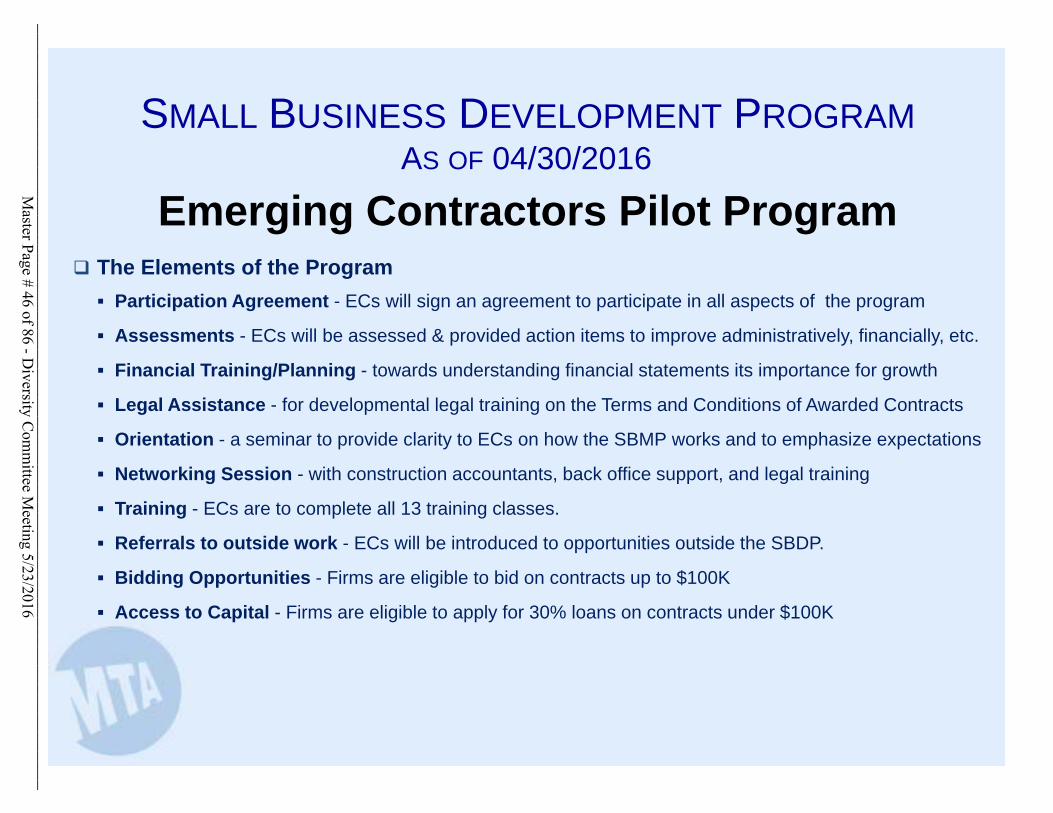
The Elements of the Program
Participation Agreement - ECs will sign an agreement to participate in all aspects of the program
Assessments - ECs will be assessed & provided action items to improve administratively, financially, etc.
Financial Training/Planning - towards understanding financial statements its importance for growth
Legal Assistance - for developmental legal training on the Terms and Conditions of Awarded Contracts
Orientation - a seminar to provide clarity to ECs on how the SBMP works and to emphasize expectations
Networking Session - with construction accountants, back office support, and legal training
Training - ECs are to complete all 13 training classes.
Referrals to outside work - ECs will be introduced to opportunities outside the SBDP.
Bidding Opportunities - Firms are eligible to bid on contracts up to $100K
Access to Capital - Firms are eligible to apply for 30% loans on contracts under $100K
Master Page # 46 of 86 - D
iversity Com
mittee M
eeting 5/23/2016________________________________________________________________________________
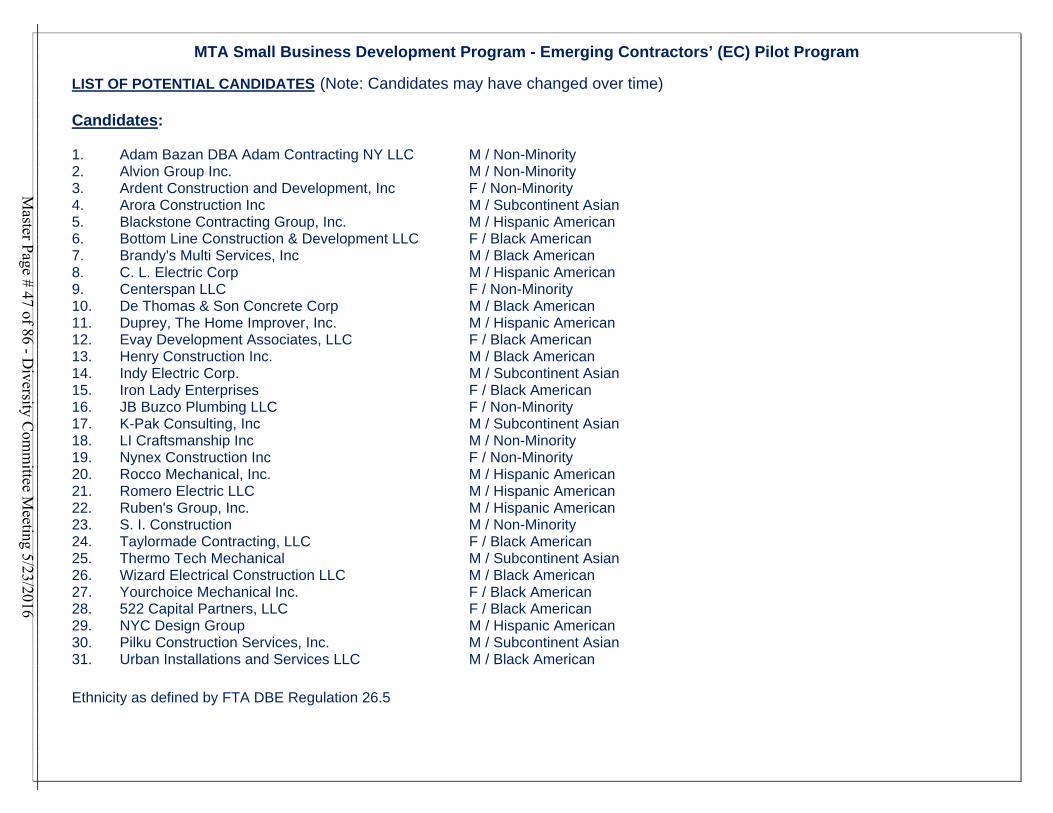
MTA Small Business Development Program - Emerging Contractors’ (EC) Pilot Program
LIST OF POTENTIAL CANDIDATES (Note: Candidates may have changed over time) Candidates: 1. Adam Bazan DBA Adam Contracting NY LLC M / Non-Minority 2. Alvion Group Inc. M / Non-Minority 3. Ardent Construction and Development, Inc F / Non-Minority 4. Arora Construction Inc M / Subcontinent Asian 5. Blackstone Contracting Group, Inc. M / Hispanic American 6. Bottom Line Construction & Development LLC F / Black American 7. Brandy's Multi Services, Inc M / Black American 8. C. L. Electric Corp M / Hispanic American 9. Centerspan LLC F / Non-Minority 10. De Thomas & Son Concrete Corp M / Black American 11. Duprey, The Home Improver, Inc. M / Hispanic American 12. Evay Development Associates, LLC F / Black American 13. Henry Construction Inc. M / Black American 14. Indy Electric Corp. M / Subcontinent Asian 15. Iron Lady Enterprises F / Black American 16. JB Buzco Plumbing LLC F / Non-Minority 17. K-Pak Consulting, Inc M / Subcontinent Asian 18. LI Craftsmanship Inc M / Non-Minority 19. Nynex Construction Inc F / Non-Minority 20. Rocco Mechanical, Inc. M / Hispanic American 21. Romero Electric LLC M / Hispanic American 22. Ruben's Group, Inc. M / Hispanic American 23. S. I. Construction M / Non-Minority 24. Taylormade Contracting, LLC F / Black American 25. Thermo Tech Mechanical M / Subcontinent Asian 26. Wizard Electrical Construction LLC M / Black American 27. Yourchoice Mechanical Inc. F / Black American 28. 522 Capital Partners, LLC F / Black American 29. NYC Design Group M / Hispanic American 30. Pilku Construction Services, Inc. M / Subcontinent Asian 31. Urban Installations and Services LLC M / Black American
Ethnicity as defined by FTA DBE Regulation 26.5
Master Page # 47 of 86 - D
iversity Com
mittee M
eeting 5/23/2016________________________________________________________________________________
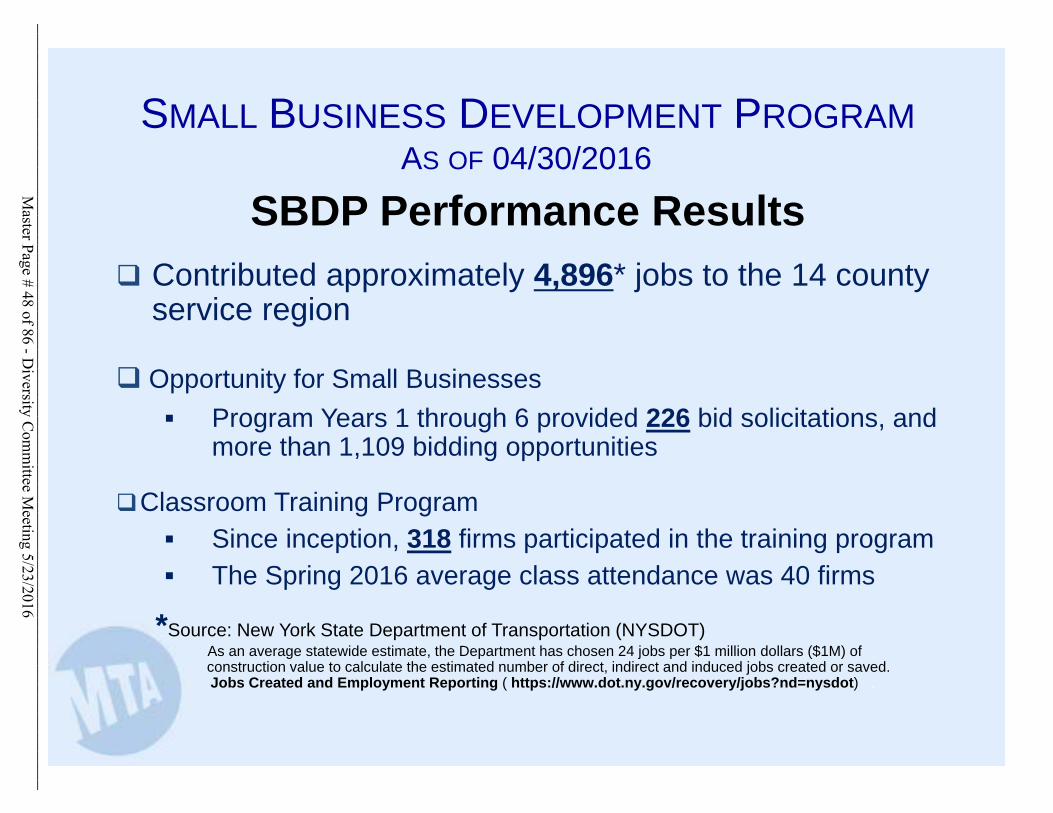
*Source: New York State Department of Transportation (NYSDOT)As an average statewide estimate, the Department has chosen 24 jobs per $1 million dollars ($1M) of construction value to calculate the estimated number of direct, indirect and induced jobs created or saved.Jobs Created and Employment Reporting ( https://www.dot.ny.gov/recovery/jobs?nd=nysdot) .
SBDP Performance Results
SMALL BUSINESS DEVELOPMENT PROGRAMAS OF 04/30/2016
Contributed approximately 4,896* jobs to the 14 county service region
Opportunity for Small Businesses
Program Years 1 through 6 provided 226 bid solicitations, and more than 1,109 bidding opportunities
Classroom Training Program Since inception, 318 firms participated in the training program The Spring 2016 average class attendance was 40 firms
Master Page # 48 of 86 - D
iversity Com
mittee M
eeting 5/23/2016________________________________________________________________________________
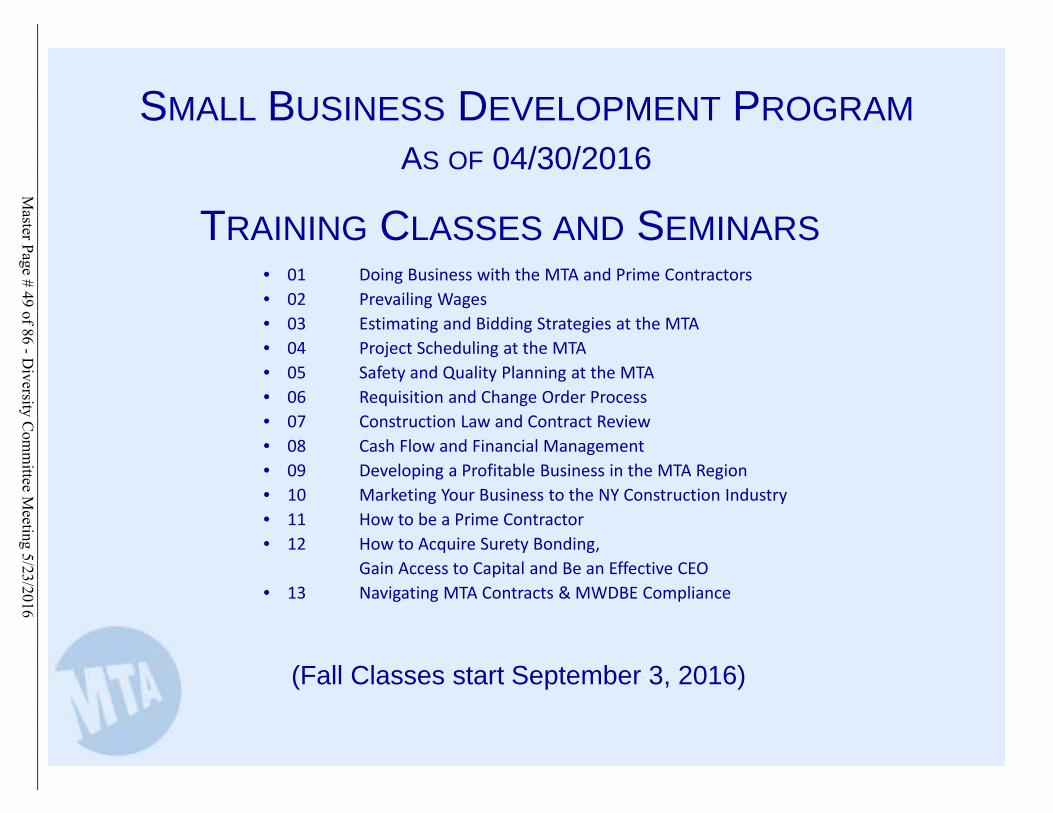
• 01 Doing Business with the MTA and Prime Contractors• 02 Prevailing Wages• 03 Estimating and Bidding Strategies at the MTA• 04 Project Scheduling at the MTA• 05 Safety and Quality Planning at the MTA• 06 Requisition and Change Order Process• 07 Construction Law and Contract Review• 08 Cash Flow and Financial Management• 09 Developing a Profitable Business in the MTA Region• 10 Marketing Your Business to the NY Construction Industry• 11 How to be a Prime Contractor• 12 How to Acquire Surety Bonding,
Gain Access to Capital and Be an Effective CEO• 13 Navigating MTA Contracts & MWDBE Compliance
TRAINING CLASSES AND SEMINARS
SMALL BUSINESS DEVELOPMENT PROGRAM
AS OF 04/30/2016
(Fall Classes start September 3, 2016)
Master Page # 49 of 86 - D
iversity Com
mittee M
eeting 5/23/2016________________________________________________________________________________
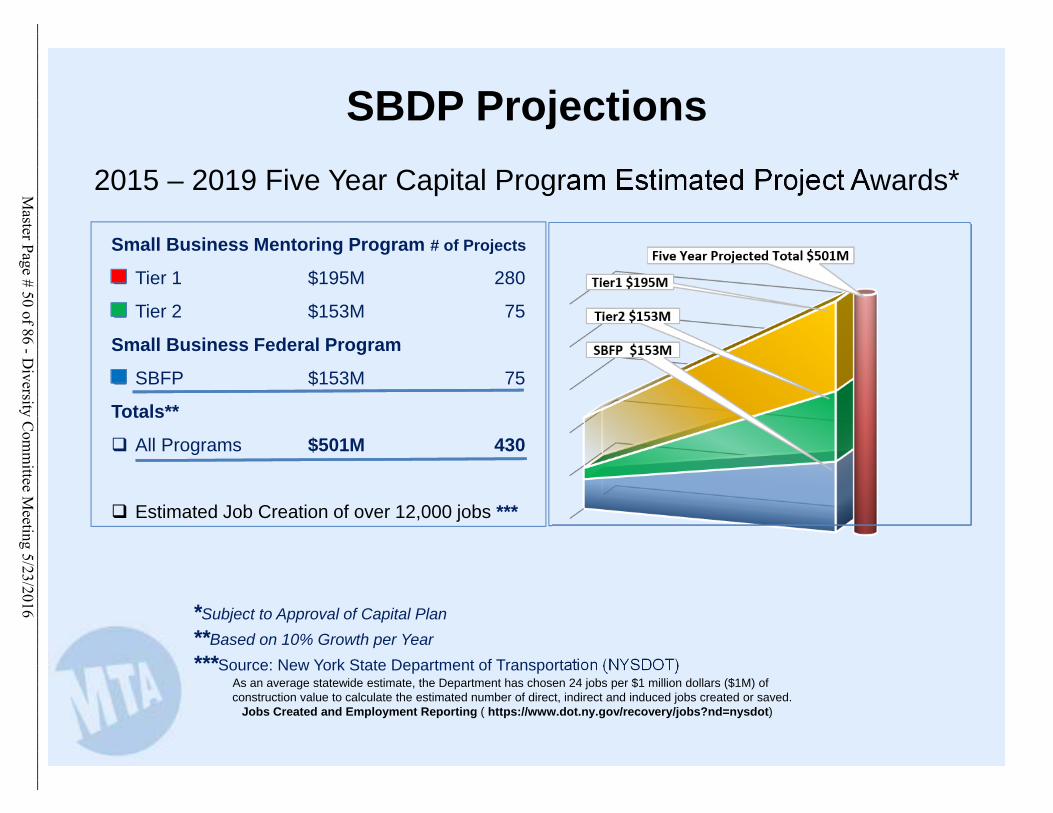
Small Business Mentoring Program # of Projects
Tier 1 $195M 280
Tier 2 $153M 75
Small Business Federal Program
SBFP $153M 75
Totals**
All Programs $501M 430
Estimated Job Creation of over 12,000 jobs ***
2015 – 2019 Five Year Capital Program Estimated Project Awards*
*Subject to Approval of Capital Plan**Based on 10% Growth per Year***Source: New York State Department of Transportation (NYSDOT)
As an average statewide estimate, the Department has chosen 24 jobs per $1 million dollars ($1M) of construction value to calculate the estimated number of direct, indirect and induced jobs created or saved.
Jobs Created and Employment Reporting ( https://www.dot.ny.gov/recovery/jobs?nd=nysdot)
SBDP Projections
SBFP $153M
Tier2 $153M
Tier1 $195M
Five Year Projected Total $501M
Master Page # 50 of 86 - D
iversity Com
mittee M
eeting 5/23/2016________________________________________________________________________________
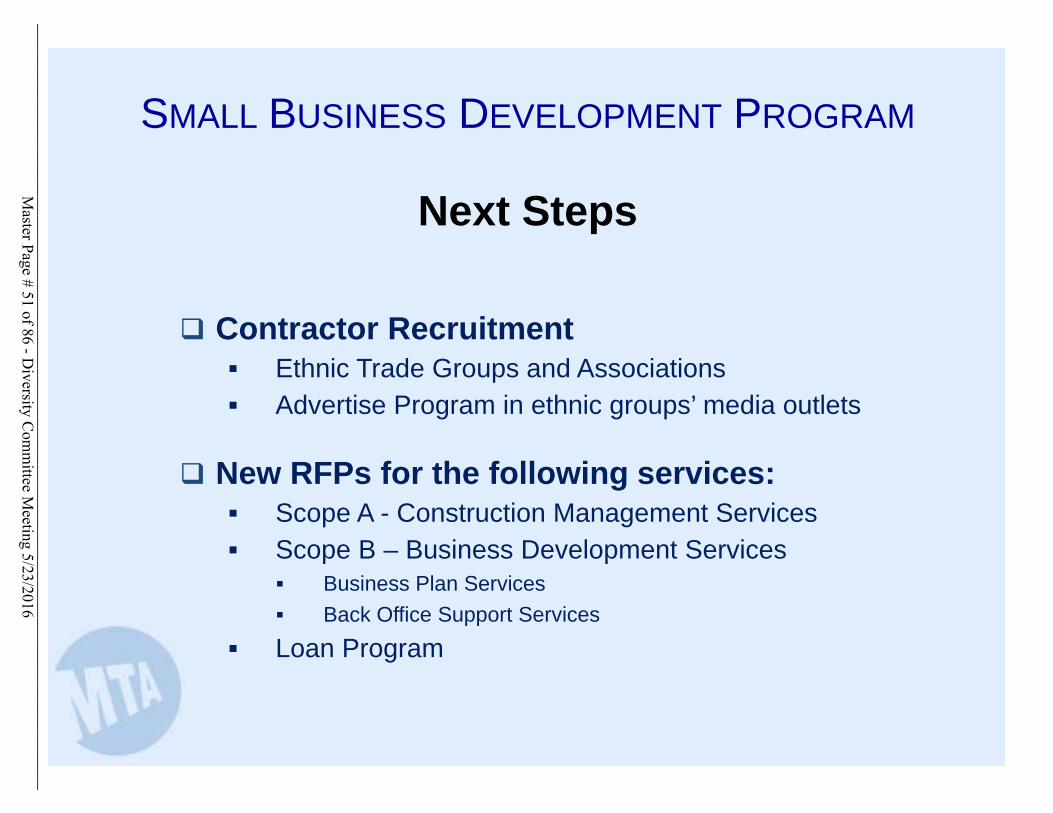
Next Steps
SMALL BUSINESS DEVELOPMENT PROGRAM
Contractor Recruitment Ethnic Trade Groups and Associations Advertise Program in ethnic groups’ media outlets
New RFPs for the following services: Scope A - Construction Management Services Scope B – Business Development Services
Business Plan Services
Back Office Support Services
Loan Program
Master Page # 51 of 86 - D
iversity Com
mittee M
eeting 5/23/2016________________________________________________________________________________
M/W/DBE CONTRACT COMPLIANCEFirst Quarter 2016
May 23, 2016
a Metropolitan Transportation Authority Master Page # 52 of 86 - D
iversity Com
mittee M
eeting 5/23/2016________________________________________________________________________________
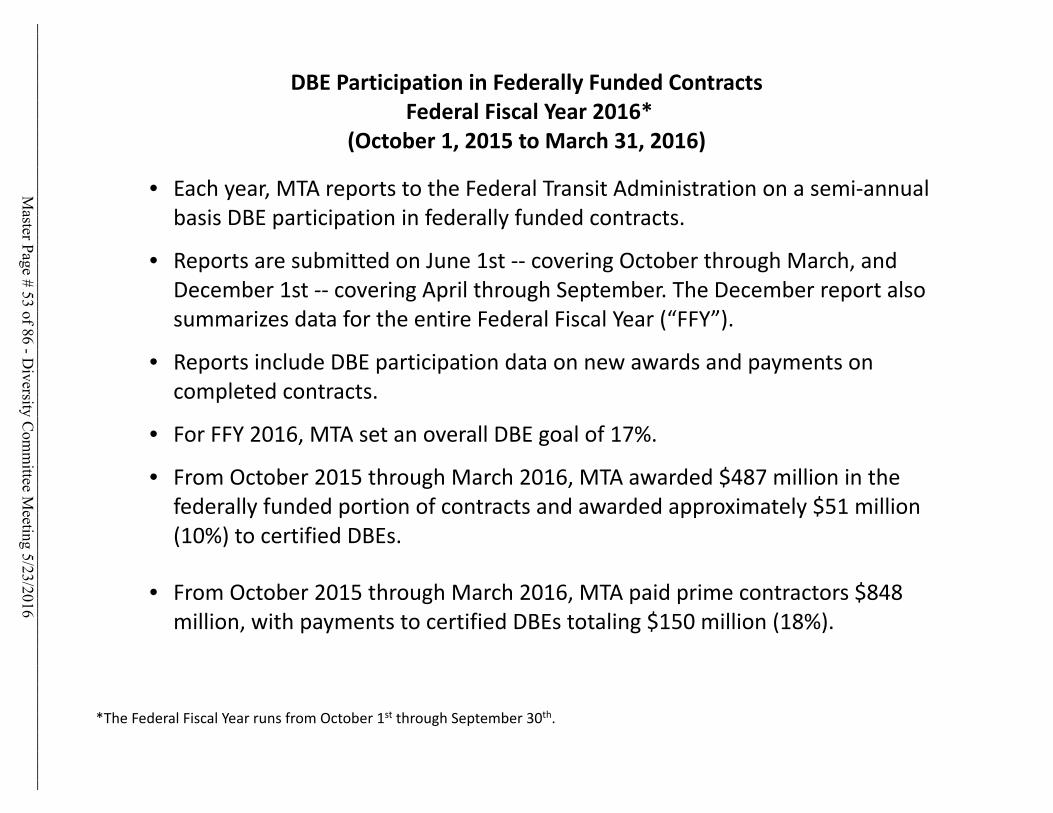
DBE Participation in Federally Funded Contracts
Federal Fiscal Year 2016*
(October 1, 2015 to March 31, 2016)
• Each year, MTA reports to the Federal Transit Administration on a semi‐annual basis DBE participation in federally funded contracts.
• Reports are submitted on June 1st ‐‐ covering October through March, and December 1st ‐‐ covering April through September. The December report also summarizes data for the entire Federal Fiscal Year (“FFY”).
• Reports include DBE participation data on new awards and payments on completed contracts.
• For FFY 2016, MTA set an overall DBE goal of 17%.
• From October 2015 through March 2016, MTA awarded $487 million in the federally funded portion of contracts and awarded approximately $51 million (10%) to certified DBEs.
• From October 2015 through March 2016, MTA paid prime contractors $848 million, with payments to certified DBEs totaling $150 million (18%).
*The Federal Fiscal Year runs from October 1st through September 30th.
Master Page # 53 of 86 - D
iversity Com
mittee M
eeting 5/23/2016________________________________________________________________________________
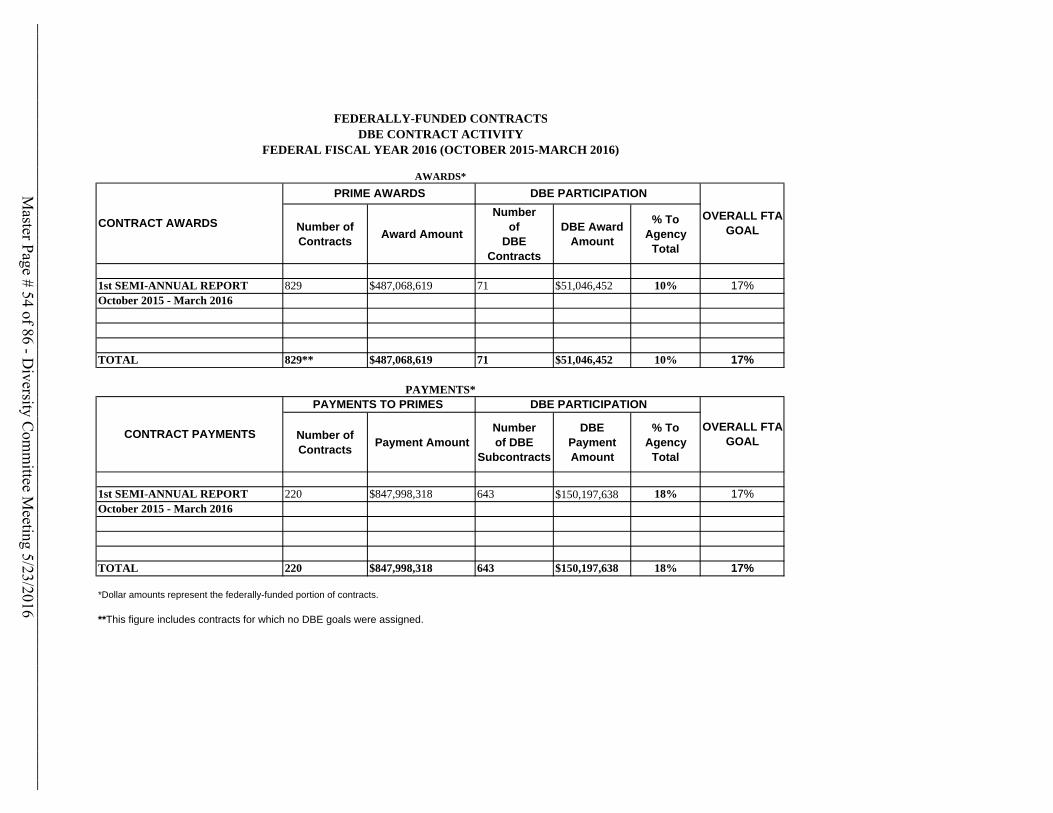
Number of Contracts
Award Amount
Numberof
DBE Contracts
DBE Award Amount
% To Agency
Total
1st SEMI-ANNUAL REPORT 829 $487,068,619 71 $51,046,452 10% 17%October 2015 - March 2016
TOTAL 829** $487,068,619 71 $51,046,452 10% 17%
Number of Contracts
Payment AmountNumberof DBE
Subcontracts
DBE Payment Amount
% To Agency
Total
1st SEMI-ANNUAL REPORT 220 $847,998,318 643 $150,197,638 18% 17%October 2015 - March 2016
TOTAL 220 $847,998,318 643 $150,197,638 18% 17%
*Dollar amounts represent the federally-funded portion of contracts.
**This figure includes contracts for which no DBE goals were assigned.
PAYMENTS*
CONTRACT PAYMENTS
PAYMENTS TO PRIMES DBE PARTICIPATION
OVERALL FTA GOAL
FEDERALLY-FUNDED CONTRACTSDBE CONTRACT ACTIVITY
FEDERAL FISCAL YEAR 2016 (OCTOBER 2015-MARCH 2016)
AWARDS*
CONTRACT AWARDS
PRIME AWARDS DBE PARTICIPATION
OVERALL FTA GOAL
Master Page # 54 of 86 - D
iversity Com
mittee M
eeting 5/23/2016________________________________________________________________________________
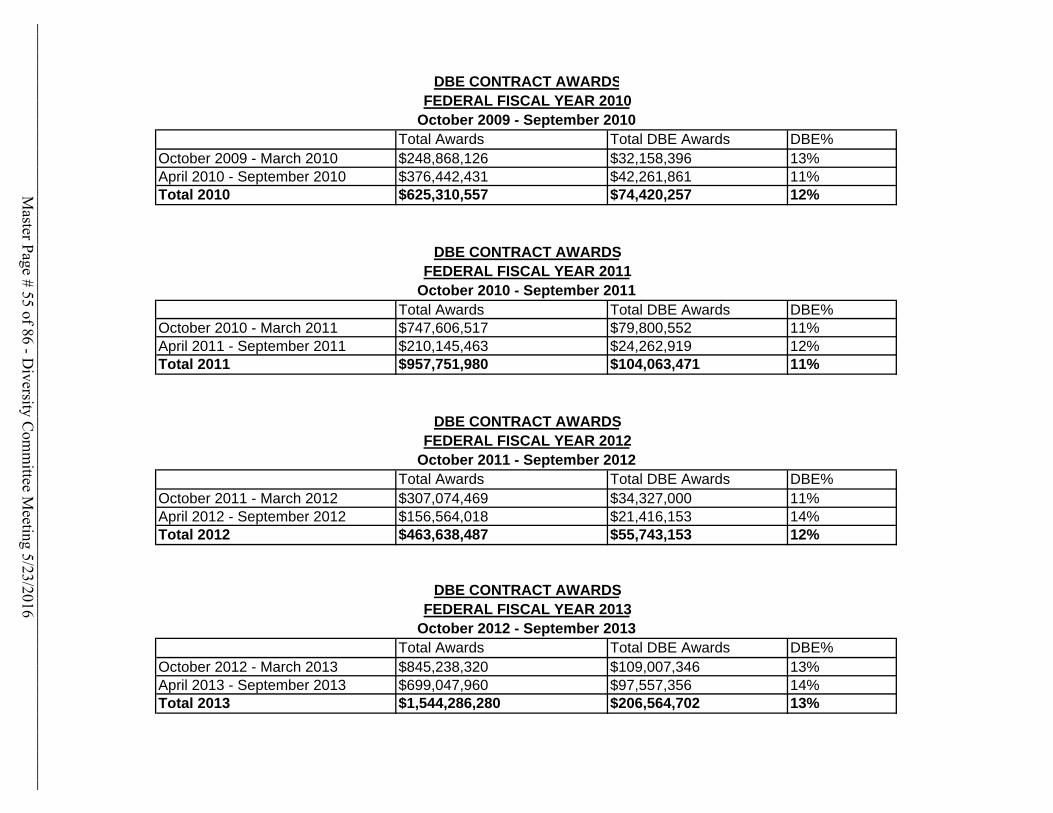
Total Awards Total DBE Awards DBE%October 2009 - March 2010 $248,868,126 $32,158,396 13%April 2010 - September 2010 $376,442,431 $42,261,861 11%Total 2010 $625,310,557 $74,420,257 12%
Total Awards Total DBE Awards DBE%October 2010 - March 2011 $747,606,517 $79,800,552 11%April 2011 - September 2011 $210,145,463 $24,262,919 12%Total 2011 $957,751,980 $104,063,471 11%
Total Awards Total DBE Awards DBE%October 2011 - March 2012 $307,074,469 $34,327,000 11%April 2012 - September 2012 $156,564,018 $21,416,153 14%Total 2012 $463,638,487 $55,743,153 12%
Total Awards Total DBE Awards DBE%October 2012 - March 2013 $845,238,320 $109,007,346 13%April 2013 - September 2013 $699,047,960 $97,557,356 14%Total 2013 $1,544,286,280 $206,564,702 13%
DBE CONTRACT AWARDSFEDERAL FISCAL YEAR 2013
October 2012 - September 2013
October 2011 - September 2012
DBE CONTRACT AWARDSFEDERAL FISCAL YEAR 2012
DBE CONTRACT AWARDSFEDERAL FISCAL YEAR 2010
DBE CONTRACT AWARDSFEDERAL FISCAL YEAR 2011
October 2009 - September 2010
October 2010 - September 2011
Master Page # 55 of 86 - D
iversity Com
mittee M
eeting 5/23/2016________________________________________________________________________________
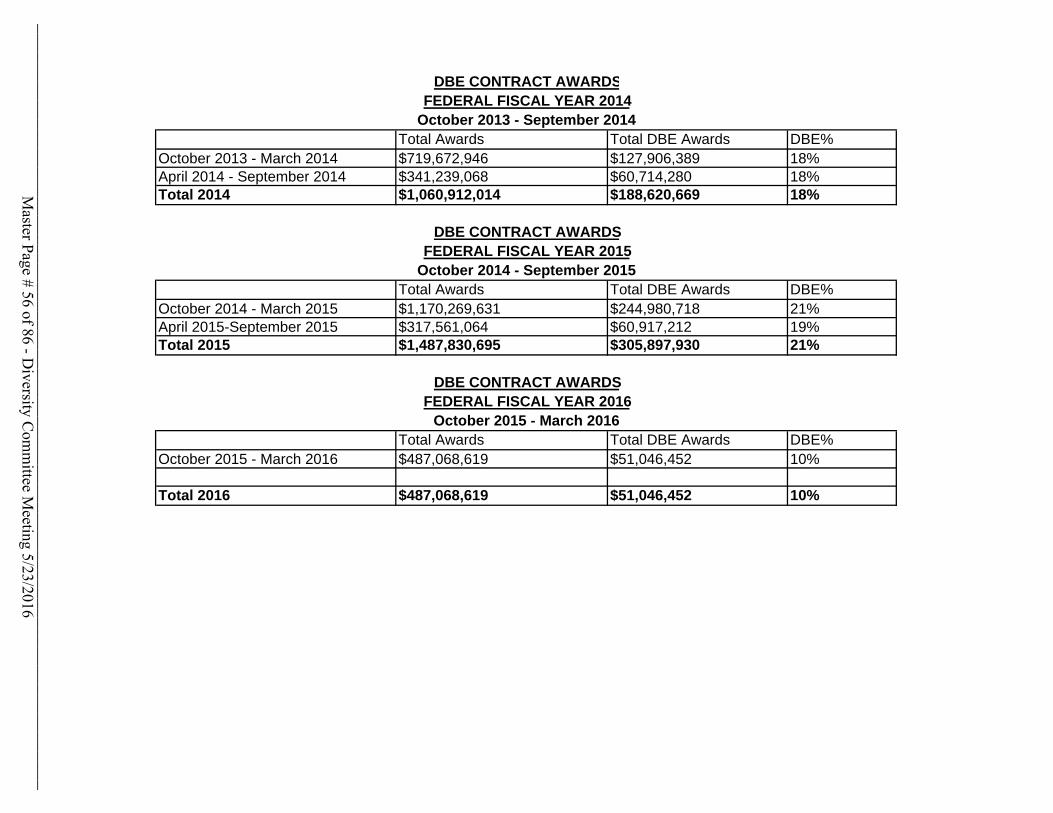
Total Awards Total DBE Awards DBE%October 2013 - March 2014 $719,672,946 $127,906,389 18%April 2014 - September 2014 $341,239,068 $60,714,280 18%Total 2014 $1,060,912,014 $188,620,669 18%
Total Awards Total DBE Awards DBE%October 2014 - March 2015 $1,170,269,631 $244,980,718 21%April 2015-September 2015 $317,561,064 $60,917,212 19%Total 2015 $1,487,830,695 $305,897,930 21%
Total Awards Total DBE Awards DBE%October 2015 - March 2016 $487,068,619 $51,046,452 10%
Total 2016 $487,068,619 $51,046,452 10%
FEDERAL FISCAL YEAR 2016October 2015 - March 2016
October 2013 - September 2014
DBE CONTRACT AWARDSFEDERAL FISCAL YEAR 2015
October 2014 - September 2015
DBE CONTRACT AWARDS
DBE CONTRACT AWARDSFEDERAL FISCAL YEAR 2014
Master Page # 56 of 86 - D
iversity Com
mittee M
eeting 5/23/2016________________________________________________________________________________
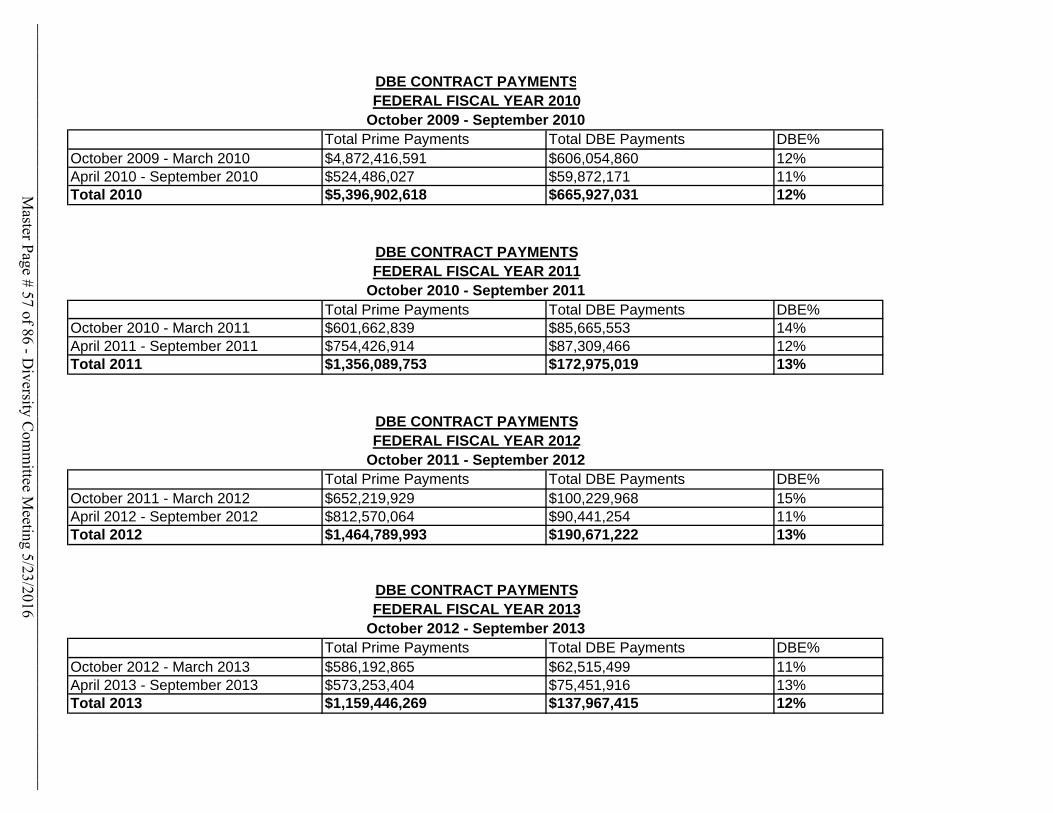
Total Prime Payments Total DBE Payments DBE%October 2009 - March 2010 $4,872,416,591 $606,054,860 12%April 2010 - September 2010 $524,486,027 $59,872,171 11%Total 2010 $5,396,902,618 $665,927,031 12%
Total Prime Payments Total DBE Payments DBE%October 2010 - March 2011 $601,662,839 $85,665,553 14%April 2011 - September 2011 $754,426,914 $87,309,466 12%Total 2011 $1,356,089,753 $172,975,019 13%
Total Prime Payments Total DBE Payments DBE%October 2011 - March 2012 $652,219,929 $100,229,968 15%April 2012 - September 2012 $812,570,064 $90,441,254 11%Total 2012 $1,464,789,993 $190,671,222 13%
Total Prime Payments Total DBE Payments DBE%October 2012 - March 2013 $586,192,865 $62,515,499 11%April 2013 - September 2013 $573,253,404 $75,451,916 13%Total 2013 $1,159,446,269 $137,967,415 12%
DBE CONTRACT PAYMENTSFEDERAL FISCAL YEAR 2010
October 2009 - September 2010
DBE CONTRACT PAYMENTSFEDERAL FISCAL YEAR 2013
October 2012 - September 2013
DBE CONTRACT PAYMENTSFEDERAL FISCAL YEAR 2011
October 2010 - September 2011
DBE CONTRACT PAYMENTSFEDERAL FISCAL YEAR 2012
October 2011 - September 2012
Master Page # 57 of 86 - D
iversity Com
mittee M
eeting 5/23/2016________________________________________________________________________________
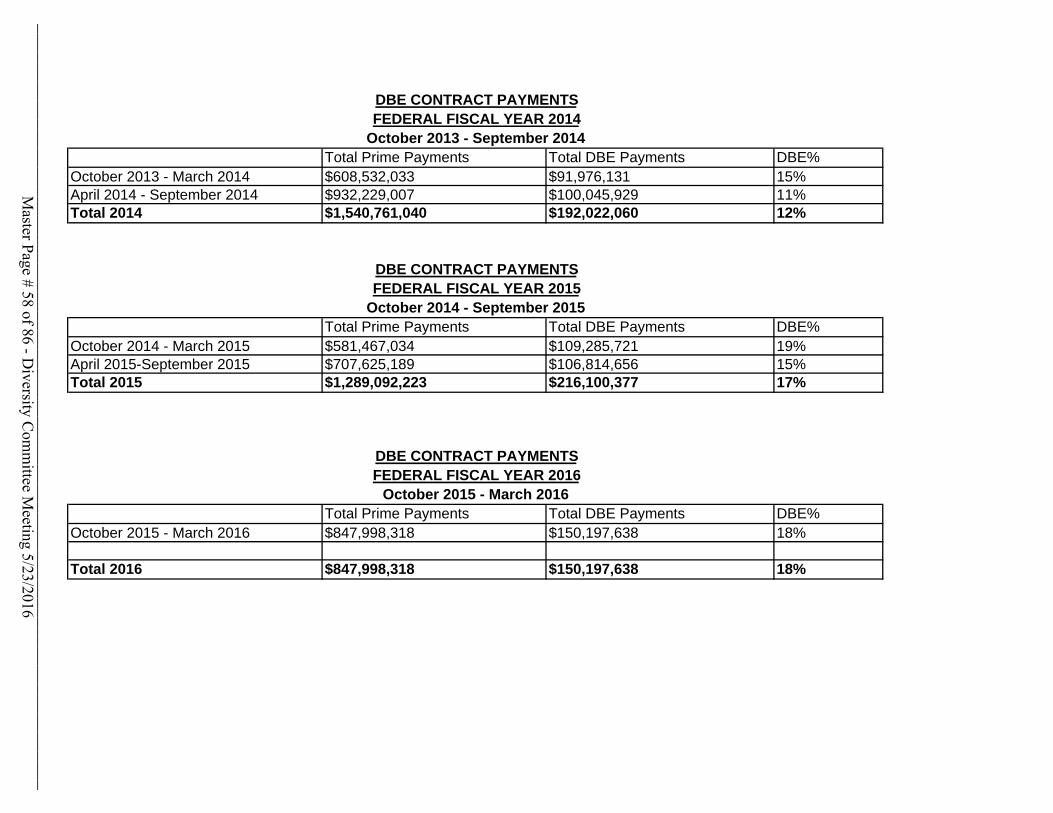
Total Prime Payments Total DBE Payments DBE%October 2013 - March 2014 $608,532,033 $91,976,131 15%April 2014 - September 2014 $932,229,007 $100,045,929 11%Total 2014 $1,540,761,040 $192,022,060 12%
Total Prime Payments Total DBE Payments DBE%October 2014 - March 2015 $581,467,034 $109,285,721 19%April 2015-September 2015 $707,625,189 $106,814,656 15%Total 2015 $1,289,092,223 $216,100,377 17%
Total Prime Payments Total DBE Payments DBE%October 2015 - March 2016 $847,998,318 $150,197,638 18%
Total 2016 $847,998,318 $150,197,638 18%
October 2014 - September 2015
DBE CONTRACT PAYMENTSFEDERAL FISCAL YEAR 2016
October 2015 - March 2016
DBE CONTRACT PAYMENTSFEDERAL FISCAL YEAR 2014
October 2013 - September 2014
DBE CONTRACT PAYMENTSFEDERAL FISCAL YEAR 2015
Master Page # 58 of 86 - D
iversity Com
mittee M
eeting 5/23/2016________________________________________________________________________________
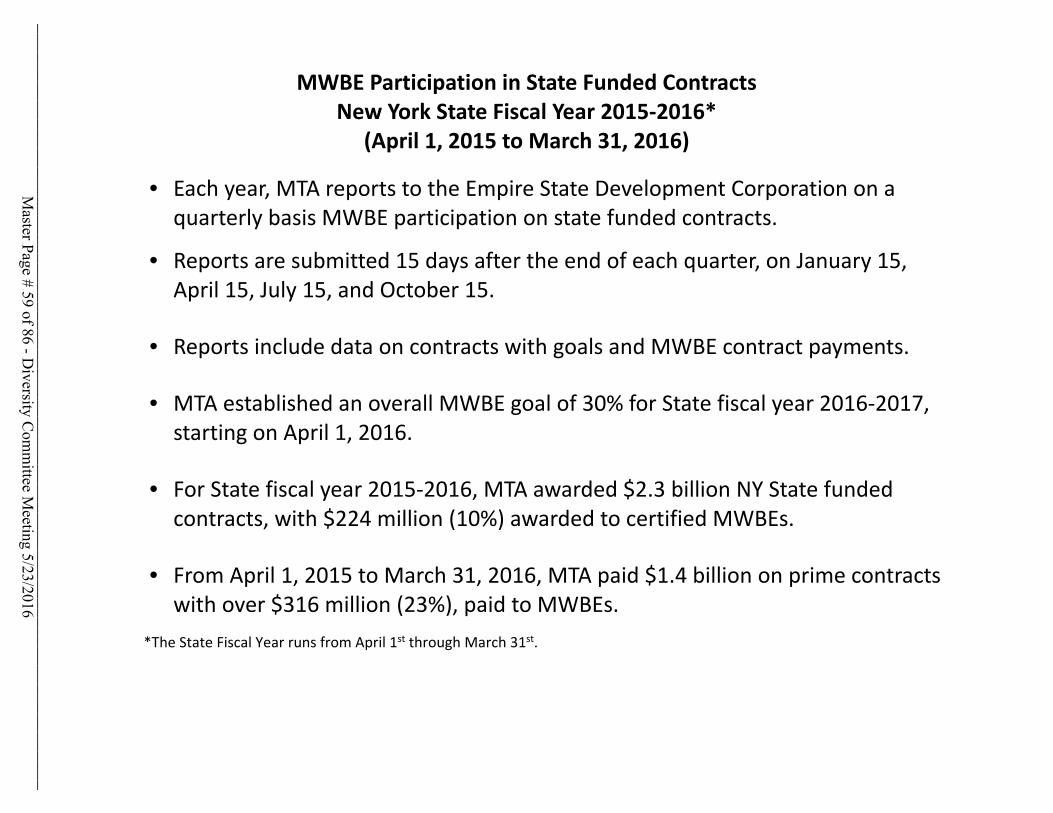
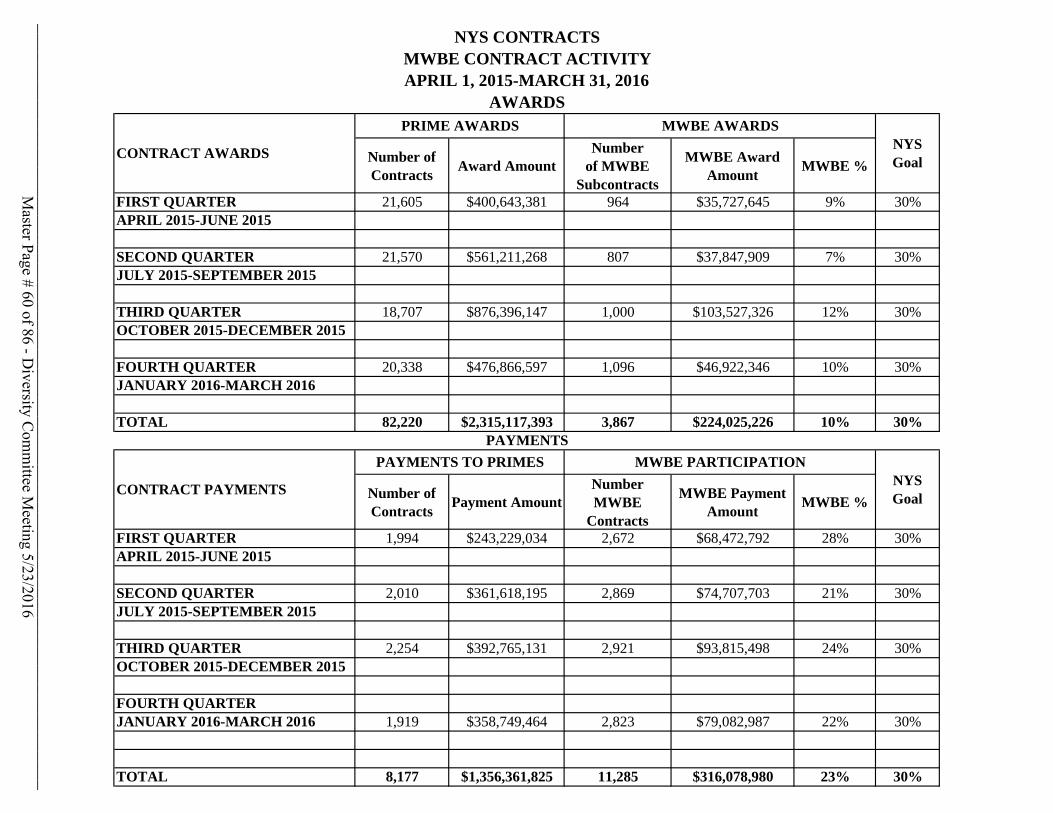
MWBE Participation in State Funded Contracts
New York State Fiscal Year 2015‐2016*
(April 1, 2015 to March 31, 2016)
• Each year, MTA reports to the Empire State Development Corporation on a quarterly basis MWBE participation on state funded contracts.
• Reports are submitted 15 days after the end of each quarter, on January 15, April 15, July 15, and October 15.
• Reports include data on contracts with goals and MWBE contract payments.
• MTA established an overall MWBE goal of 30% for State fiscal year 2016‐2017, starting on April 1, 2016.
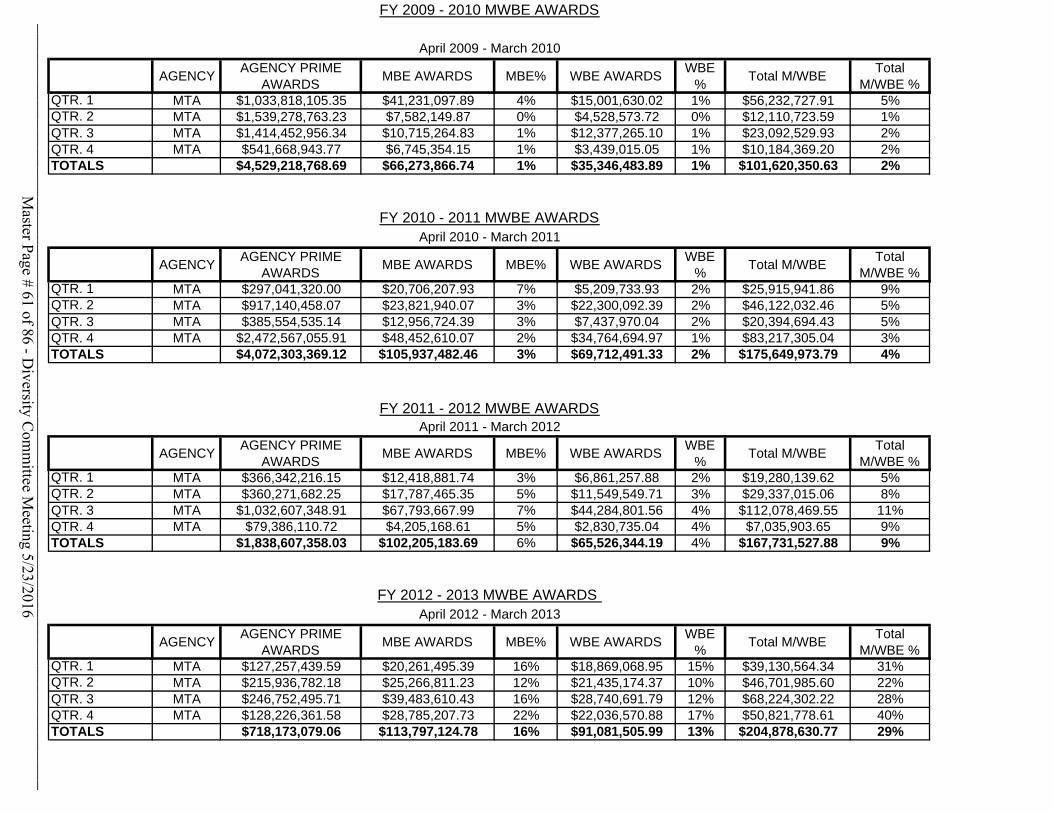
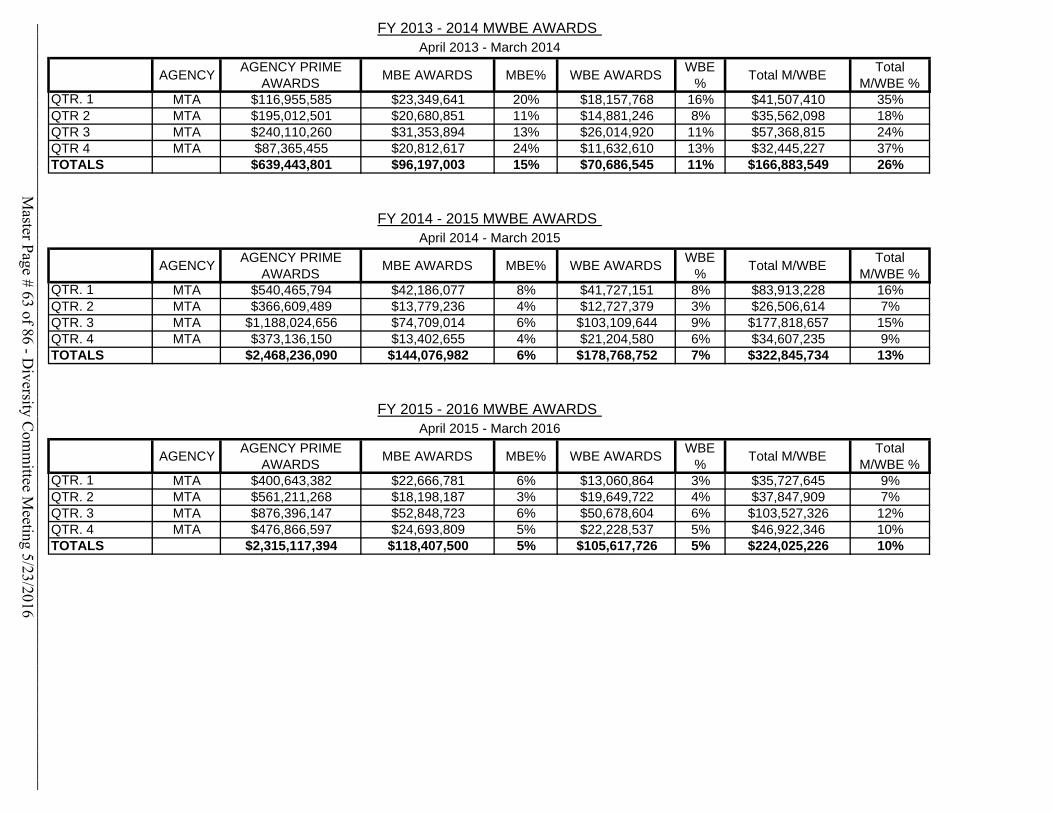
• For State fiscal year 2015‐2016, MTA awarded $2.3 billion NY State funded contracts, with $224 million (10%) awarded to certified MWBEs.
• From April 1, 2015 to March 31, 2016, MTA paid $1.4 billion on prime contracts with over $316 million (23%), paid to MWBEs.
*The State Fiscal Year runs from April 1st through March 31st.
Master Page # 59 of 86 - D
iversity Com
mittee M
eeting 5/23/2016________________________________________________________________________________
Number of Contracts
Award AmountNumber
of MWBESubcontracts
MWBE Award Amount
MWBE %
FIRST QUARTER 21,605 $400,643,381 964 $35,727,645 9% 30%APRIL 2015-JUNE 2015
SECOND QUARTER 21,570 $561,211,268 807 $37,847,909 7% 30%JULY 2015-SEPTEMBER 2015
THIRD QUARTER 18,707 $876,396,147 1,000 $103,527,326 12% 30%OCTOBER 2015-DECEMBER 2015
FOURTH QUARTER 20,338 $476,866,597 1,096 $46,922,346 10% 30%JANUARY 2016-MARCH 2016
TOTAL 82,220 $2,315,117,393 3,867 $224,025,226 10% 30%
Number of Contracts
Payment AmountNumber MWBE
Contracts
MWBE Payment Amount
MWBE %
FIRST QUARTER 1,994 $243,229,034 2,672 $68,472,792 28% 30%APRIL 2015-JUNE 2015
SECOND QUARTER 2,010 $361,618,195 2,869 $74,707,703 21% 30%JULY 2015-SEPTEMBER 2015
THIRD QUARTER 2,254 $392,765,131 2,921 $93,815,498 24% 30%OCTOBER 2015-DECEMBER 2015
FOURTH QUARTERJANUARY 2016-MARCH 2016 1,919 $358,749,464 2,823 $79,082,987 22% 30%
TOTAL 8,177 $1,356,361,825 11,285 $316,078,980 23% 30%
PAYMENTS
CONTRACT PAYMENTS
PAYMENTS TO PRIMES MWBE PARTICIPATIONNYS Goal
NYS CONTRACTSMWBE CONTRACT ACTIVITYAPRIL 1, 2015-MARCH 31, 2016
AWARDS
CONTRACT AWARDS
PRIME AWARDS MWBE AWARDSNYS Goal
Master Page # 60 of 86 - D
iversity Com
mittee M
eeting 5/23/2016________________________________________________________________________________
AGENCYAGENCY PRIME
AWARDSMBE AWARDS MBE% WBE AWARDS
WBE %
Total M/WBE Total
M/WBE %QTR. 1 MTA $1,033,818,105.35 $41,231,097.89 4% $15,001,630.02 1% $56,232,727.91 5%QTR. 2 MTA $1,539,278,763.23 $7,582,149.87 0% $4,528,573.72 0% $12,110,723.59 1%QTR. 3 MTA $1,414,452,956.34 $10,715,264.83 1% $12,377,265.10 1% $23,092,529.93 2%QTR. 4 MTA $541,668,943.77 $6,745,354.15 1% $3,439,015.05 1% $10,184,369.20 2%TOTALS $4,529,218,768.69 $66,273,866.74 1% $35,346,483.89 1% $101,620,350.63 2%
AGENCYAGENCY PRIME
AWARDSMBE AWARDS MBE% WBE AWARDS
WBE %
Total M/WBE Total
M/WBE %QTR. 1 MTA $297,041,320.00 $20,706,207.93 7% $5,209,733.93 2% $25,915,941.86 9%QTR. 2 MTA $917,140,458.07 $23,821,940.07 3% $22,300,092.39 2% $46,122,032.46 5%QTR. 3 MTA $385,554,535.14 $12,956,724.39 3% $7,437,970.04 2% $20,394,694.43 5%QTR. 4 MTA $2,472,567,055.91 $48,452,610.07 2% $34,764,694.97 1% $83,217,305.04 3%TOTALS $4,072,303,369.12 $105,937,482.46 3% $69,712,491.33 2% $175,649,973.79 4%
AGENCYAGENCY PRIME
AWARDSMBE AWARDS MBE% WBE AWARDS
WBE %
Total M/WBE Total
M/WBE %QTR. 1 MTA $366,342,216.15 $12,418,881.74 3% $6,861,257.88 2% $19,280,139.62 5%QTR. 2 MTA $360,271,682.25 $17,787,465.35 5% $11,549,549.71 3% $29,337,015.06 8%QTR. 3 MTA $1,032,607,348.91 $67,793,667.99 7% $44,284,801.56 4% $112,078,469.55 11%QTR. 4 MTA $79,386,110.72 $4,205,168.61 5% $2,830,735.04 4% $7,035,903.65 9%TOTALS $1,838,607,358.03 $102,205,183.69 6% $65,526,344.19 4% $167,731,527.88 9%
AGENCYAGENCY PRIME
AWARDSMBE AWARDS MBE% WBE AWARDS
WBE %
Total M/WBE Total
M/WBE %QTR. 1 MTA $127,257,439.59 $20,261,495.39 16% $18,869,068.95 15% $39,130,564.34 31%QTR. 2 MTA $215,936,782.18 $25,266,811.23 12% $21,435,174.37 10% $46,701,985.60 22%QTR. 3 MTA $246,752,495.71 $39,483,610.43 16% $28,740,691.79 12% $68,224,302.22 28%QTR. 4 MTA $128,226,361.58 $28,785,207.73 22% $22,036,570.88 17% $50,821,778.61 40%TOTALS $718,173,079.06 $113,797,124.78 16% $91,081,505.99 13% $204,878,630.77 29%
FY 2009 - 2010 MWBE AWARDS
April 2009 - March 2010
FY 2012 - 2013 MWBE AWARDS April 2012 - March 2013
FY 2010 - 2011 MWBE AWARDSApril 2010 - March 2011
FY 2011 - 2012 MWBE AWARDSApril 2011 - March 2012
Master Page # 61 of 86 - D
iversity Com
mittee M
eeting 5/23/2016________________________________________________________________________________

AGENCYAGENCY PRIME
AWARDSMBE AWARDS MBE% WBE AWARDS
WBE %
Total M/WBE Total
M/WBE %QTR. 1 MTA $1,033,818,105.35 $41,231,097.89 4% $15,001,630.02 1% $56,232,727.91 5%QTR. 2 MTA $1,539,278,763.23 $7,582,149.87 0% $4,528,573.72 0% $12,110,723.59 1%QTR. 3 MTA $1,414,452,956.34 $10,715,264.83 1% $12,377,265.10 1% $23,092,529.93 2%QTR. 4 MTA $541,668,943.77 $6,745,354.15 1% $3,439,015.05 1% $10,184,369.20 2%TOTALS $4,529,218,768.69 $66,273,866.74 1% $35,346,483.89 1% $101,620,350.63 2%
AGENCYAGENCY PRIME
AWARDSMBE AWARDS MBE% WBE AWARDS
WBE %
Total M/WBE Total
M/WBE %QTR. 1 MTA $297,041,320.00 $20,706,207.93 7% $5,209,733.93 2% $25,915,941.86 9%QTR. 2 MTA $917,140,458.07 $23,821,940.07 3% $22,300,092.39 2% $46,122,032.46 5%QTR. 3 MTA $385,554,535.14 $12,956,724.39 3% $7,437,970.04 2% $20,394,694.43 5%QTR. 4 MTA $2,472,567,055.91 $48,452,610.07 2% $34,764,694.97 1% $83,217,305.04 3%TOTALS $4,072,303,369.12 $105,937,482.46 3% $69,712,491.33 2% $175,649,973.79 4%
AGENCYAGENCY PRIME
AWARDSMBE AWARDS MBE% WBE AWARDS
WBE %
Total M/WBE Total
M/WBE %QTR. 1 MTA $366,342,216.15 $12,418,881.74 3% $6,861,257.88 2% $19,280,139.62 5%QTR. 2 MTA $360,271,682.25 $17,787,465.35 5% $11,549,549.71 3% $29,337,015.06 8%QTR. 3 MTA $1,032,607,348.91 $67,793,667.99 7% $44,284,801.56 4% $112,078,469.55 11%QTR. 4 MTA $79,386,110.72 $4,205,168.61 5% $2,830,735.04 4% $7,035,903.65 9%TOTALS $1,838,607,358.03 $102,205,183.69 6% $65,526,344.19 4% $167,731,527.88 9%
AGENCYAGENCY PRIME
AWARDSMBE AWARDS MBE% WBE AWARDS
WBE %
Total M/WBE Total
M/WBE %QTR. 1 MTA $127,257,439.59 $20,261,495.39 16% $18,869,068.95 15% $39,130,564.34 31%QTR. 2 MTA $215,936,782.18 $25,266,811.23 12% $21,435,174.37 10% $46,701,985.60 22%QTR. 3 MTA $246,752,495.71 $39,483,610.43 16% $28,740,691.79 12% $68,224,302.22 28%QTR. 4 MTA $128,226,361.58 $28,785,207.73 22% $22,036,570.88 17% $50,821,778.61 40%TOTALS $718,173,079.06 $113,797,124.78 16% $91,081,505.99 13% $204,878,630.77 29%
FY 2009 - 2010 MWBE AWARDS
April 2009 - March 2010
FY 2012 - 2013 MWBE AWARDS April 2012 - March 2013
FY 2010 - 2011 MWBE AWARDSApril 2010 - March 2011
FY 2011 - 2012 MWBE AWARDSApril 2011 - March 2012
Master Page # 62 of 86 - D
iversity Com
mittee M
eeting 5/23/2016________________________________________________________________________________
AGENCYAGENCY PRIME
AWARDSMBE AWARDS MBE% WBE AWARDS
WBE %
Total M/WBE Total
M/WBE %QTR. 1 MTA $116,955,585 $23,349,641 20% $18,157,768 16% $41,507,410 35%QTR 2 MTA $195,012,501 $20,680,851 11% $14,881,246 8% $35,562,098 18%QTR 3 MTA $240,110,260 $31,353,894 13% $26,014,920 11% $57,368,815 24%QTR 4 MTA $87,365,455 $20,812,617 24% $11,632,610 13% $32,445,227 37%TOTALS $639,443,801 $96,197,003 15% $70,686,545 11% $166,883,549 26%
AGENCYAGENCY PRIME
AWARDSMBE AWARDS MBE% WBE AWARDS
WBE %
Total M/WBE Total
M/WBE %QTR. 1 MTA $540,465,794 $42,186,077 8% $41,727,151 8% $83,913,228 16%QTR. 2 MTA $366,609,489 $13,779,236 4% $12,727,379 3% $26,506,614 7%QTR. 3 MTA $1,188,024,656 $74,709,014 6% $103,109,644 9% $177,818,657 15%QTR. 4 MTA $373,136,150 $13,402,655 4% $21,204,580 6% $34,607,235 9%TOTALS $2,468,236,090 $144,076,982 6% $178,768,752 7% $322,845,734 13%
AGENCYAGENCY PRIME
AWARDSMBE AWARDS MBE% WBE AWARDS
WBE %
Total M/WBE Total
M/WBE %QTR. 1 MTA $400,643,382 $22,666,781 6% $13,060,864 3% $35,727,645 9%QTR. 2 MTA $561,211,268 $18,198,187 3% $19,649,722 4% $37,847,909 7%QTR. 3 MTA $876,396,147 $52,848,723 6% $50,678,604 6% $103,527,326 12%QTR. 4 MTA $476,866,597 $24,693,809 5% $22,228,537 5% $46,922,346 10%TOTALS $2,315,117,394 $118,407,500 5% $105,617,726 5% $224,025,226 10%
April 2014 - March 2015
FY 2015 - 2016 MWBE AWARDS April 2015 - March 2016
FY 2013 - 2014 MWBE AWARDS April 2013 - March 2014
FY 2014 - 2015 MWBE AWARDS
Master Page # 63 of 86 - D
iversity Com
mittee M
eeting 5/23/2016________________________________________________________________________________

AGENCYAGENCY
EXPENDICTUREMBE Utilization MBE% WBE Utilization
WBE %
Total M/WBE Total
M/WBE %QTR. 1 MTA $382,669,490.62 $13,773,909.62 4% $9,240,401.08 2% $23,014,310.70 6%QTR. 2 MTA $393,033,477.22 $14,069,415.72 4% $20,421,084.73 5% $34,490,500.45 9%QTR. 3 MTA $469,871,392.80 $19,105,078.35 4% $10,304,934.97 2% $29,410,013.32 6%QTR. 4 MTA $432,322,534.77 $11,598,278.58 3% $9,754,557.34 2% $21,352,835.92 5%TOTALS $1,677,896,895.41 $58,546,682.27 3% $49,720,978.12 3% $108,267,660.39 6%
AGENCYAGENCY
EXPENDICTUREMBE Utilization MBE% WBE Utilization
WBE %
Total M/WBE Total
M/WBE %QTR. 1 MTA $414,102,581.35 $15,612,913.87 4% $14,763,548.46 4% $30,376,462.33 7%QTR. 2 MTA $424,177,910.35 $14,061,508.46 3% $9,170,294.18 2% $23,231,802.64 5%QTR. 3 MTA $542,212,151.16 $24,538,471.02 5% $13,589,937.39 3% $38,128,408.41 7%QTR. 4 MTA $461,104,816.60 $15,032,845.43 3% $8,214,176.56 2% $23,247,021.99 5%TOTALS $1,841,597,459.45 $69,245,738.78 4% $45,737,956.59 2% $114,983,695.37 6%
AGENCYAGENCY
EXPENDICTUREMBE Utilization MBE% WBE Utilization
WBE %
Total M/WBE Total
M/WBE %QTR. 1 MTA $209,773,476.37 $21,098,721.89 10% $9,293,370.71 4% $30,392,092.60 14%QTR. 2 MTA $253,958,630.00 $17,459,063.82 7% $16,619,780.35 7% $34,078,844.17 13%QTR. 3 MTA $338,892,027.99 $21,567,860.35 6% $20,427,398.26 6% $41,995,258.61 12%QTR. 4 MTA $271,257,277.77 $23,657,516.59 9% $28,459,076.23 10% $52,116,592.82 19%TOTALS $1,073,881,412.13 $83,783,162.65 8% $74,799,625.55 7% $158,582,788.20 15%
AGENCYAGENCY
EXPENDICTUREMBE Utilization MBE% WBE Utilization
WBE %
Total M/WBE Total
M/WBE %QTR. 1 MTA $359,164,511.76 $30,152,592.82 8% $35,714,722.73 10% $65,867,315.55 18%QTR. 2 MTA $279,965,924.79 $33,642,857.51 12% $32,348,288.72 12% $65,991,146.23 24%QTR. 3 MTA $267,401,198.55 $37,756,662.97 14% $26,350,594.79 10% $64,107,257.76 24%QTR. 4 MTA $303,256,313.54 $34,305,801.85 11% $30,939,263.99 10% $65,245,065.84 22%TOTALS $1,209,787,948.63 $135,857,915.15 11% $125,352,870.23 10% $261,210,785.37 22%
FY 2012 - 2013 MWBE PAYMENTS April 2012 - March 2013
FY 2009- 2010 MWBE PAYMENTSApril 2009 - March 2010
FY 2010 - 2011 MWBE PAYMENTSApril 2010 - March 2011
FY 2011 - 2012 MWBE PAYMENTSApril 2011 - March 2012
Master Page # 64 of 86 - D
iversity Com
mittee M
eeting 5/23/2016________________________________________________________________________________

AGENCY EXPENDITURE
MBE Utilization MBE% WBE UtilizationWBE
%Total M/WBE
Total M/WBE %
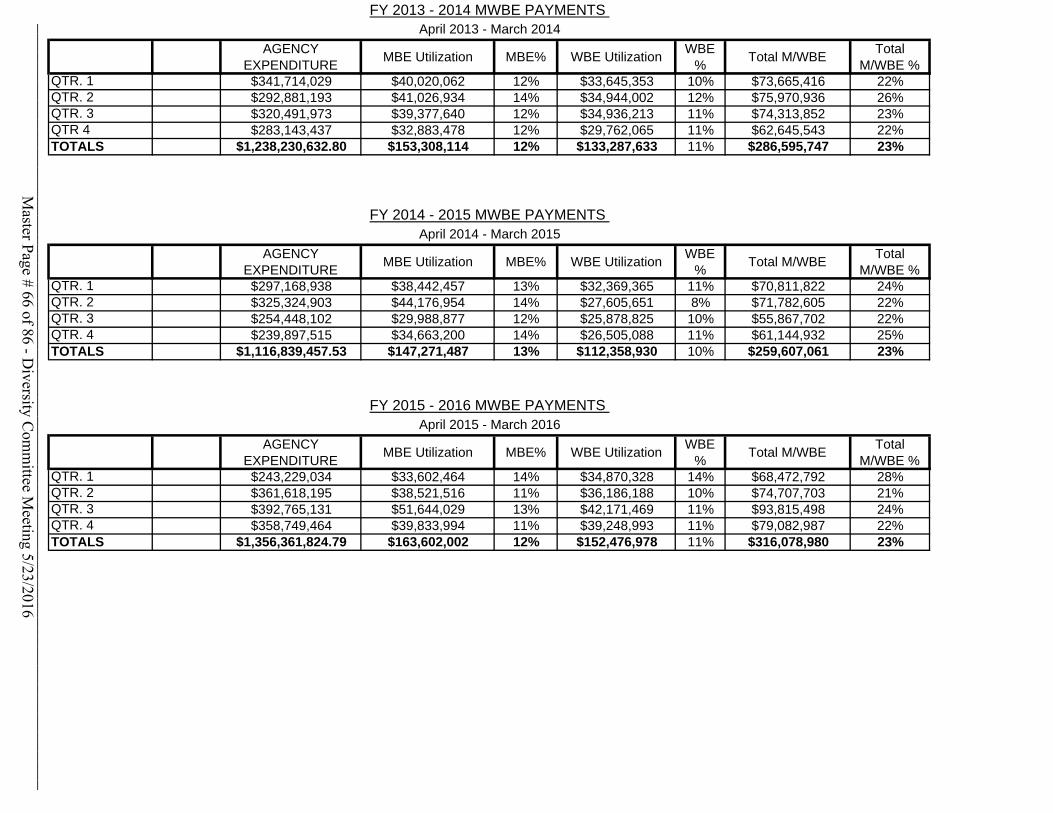
QTR. 1 $341,714,029 $40,020,062 12% $33,645,353 10% $73,665,416 22%QTR. 2 $292,881,193 $41,026,934 14% $34,944,002 12% $75,970,936 26%QTR. 3 $320,491,973 $39,377,640 12% $34,936,213 11% $74,313,852 23%QTR 4 $283,143,437 $32,883,478 12% $29,762,065 11% $62,645,543 22%TOTALS $1,238,230,632.80 $153,308,114 12% $133,287,633 11% $286,595,747 23%
AGENCY EXPENDITURE
MBE Utilization MBE% WBE UtilizationWBE
%Total M/WBE
Total M/WBE %
QTR. 1 $297,168,938 $38,442,457 13% $32,369,365 11% $70,811,822 24%QTR. 2 $325,324,903 $44,176,954 14% $27,605,651 8% $71,782,605 22%QTR. 3 $254,448,102 $29,988,877 12% $25,878,825 10% $55,867,702 22%QTR. 4 $239,897,515 $34,663,200 14% $26,505,088 11% $61,144,932 25%TOTALS $1,116,839,457.53 $147,271,487 13% $112,358,930 10% $259,607,061 23%
AGENCY EXPENDITURE
MBE Utilization MBE% WBE UtilizationWBE
%Total M/WBE
Total M/WBE %
QTR. 1 $243,229,034 $33,602,464 14% $34,870,328 14% $68,472,792 28%QTR. 2 $361,618,195 $38,521,516 11% $36,186,188 10% $74,707,703 21%QTR. 3 $392,765,131 $51,644,029 13% $42,171,469 11% $93,815,498 24%QTR. 4 $358,749,464 $39,833,994 11% $39,248,993 11% $79,082,987 22%TOTALS $1,356,361,824.79 $163,602,002 12% $152,476,978 11% $316,078,980 23%
FY 2013 - 2014 MWBE PAYMENTS
FY 2014 - 2015 MWBE PAYMENTS April 2014 - March 2015
FY 2015 - 2016 MWBE PAYMENTS April 2015 - March 2016
April 2013 - March 2014
Master Page # 65 of 86 - D
iversity Com
mittee M
eeting 5/23/2016________________________________________________________________________________
AGENCY EXPENDITURE
MBE Utilization MBE% WBE UtilizationWBE
%Total M/WBE
Total M/WBE %
QTR. 1 $341,714,029 $40,020,062 12% $33,645,353 10% $73,665,416 22%QTR. 2 $292,881,193 $41,026,934 14% $34,944,002 12% $75,970,936 26%QTR. 3 $320,491,973 $39,377,640 12% $34,936,213 11% $74,313,852 23%QTR 4 $283,143,437 $32,883,478 12% $29,762,065 11% $62,645,543 22%TOTALS $1,238,230,632.80 $153,308,114 12% $133,287,633 11% $286,595,747 23%
AGENCY EXPENDITURE
MBE Utilization MBE% WBE UtilizationWBE
%Total M/WBE
Total M/WBE %
QTR. 1 $297,168,938 $38,442,457 13% $32,369,365 11% $70,811,822 24%QTR. 2 $325,324,903 $44,176,954 14% $27,605,651 8% $71,782,605 22%QTR. 3 $254,448,102 $29,988,877 12% $25,878,825 10% $55,867,702 22%QTR. 4 $239,897,515 $34,663,200 14% $26,505,088 11% $61,144,932 25%TOTALS $1,116,839,457.53 $147,271,487 13% $112,358,930 10% $259,607,061 23%
AGENCY EXPENDITURE
MBE Utilization MBE% WBE UtilizationWBE
%Total M/WBE
Total M/WBE %
QTR. 1 $243,229,034 $33,602,464 14% $34,870,328 14% $68,472,792 28%QTR. 2 $361,618,195 $38,521,516 11% $36,186,188 10% $74,707,703 21%QTR. 3 $392,765,131 $51,644,029 13% $42,171,469 11% $93,815,498 24%QTR. 4 $358,749,464 $39,833,994 11% $39,248,993 11% $79,082,987 22%TOTALS $1,356,361,824.79 $163,602,002 12% $152,476,978 11% $316,078,980 23%
FY 2013 - 2014 MWBE PAYMENTS
FY 2014 - 2015 MWBE PAYMENTS April 2014 - March 2015
FY 2015 - 2016 MWBE PAYMENTS April 2015 - March 2016
April 2013 - March 2014
Master Page # 66 of 86 - D
iversity Com
mittee M
eeting 5/23/2016________________________________________________________________________________
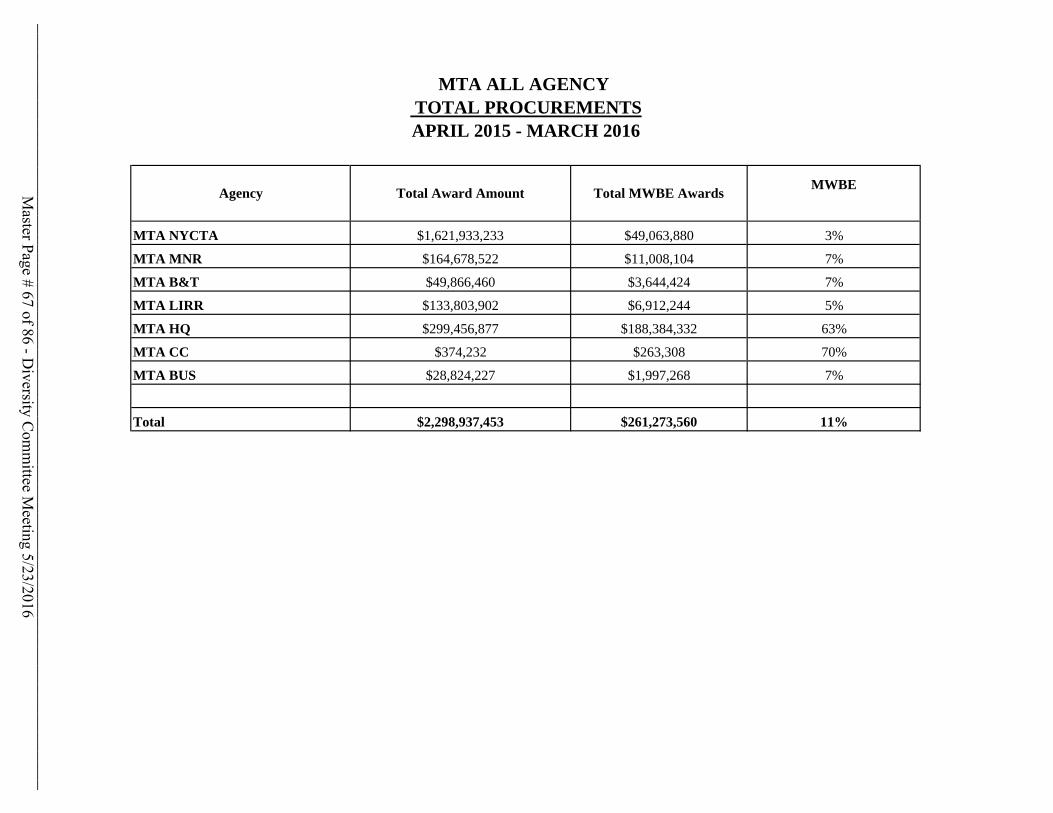
MTA NYCTA $1,621,933,233 $49,063,880 3%
MTA MNR $164,678,522 $11,008,104 7%
MTA B&T $49,866,460 $3,644,424 7%
MTA LIRR $133,803,902 $6,912,244 5%
MTA HQ $299,456,877 $188,384,332 63%
MTA CC $374,232 $263,308 70%
MTA BUS $28,824,227 $1,997,268 7%
Total $2,298,937,453 $261,273,560 11%
MTA ALL AGENCY TOTAL PROCUREMENTSAPRIL 2015 - MARCH 2016
Agency Total Award Amount Total MWBE AwardsMWBEM
aster Page # 67 of 86 - Diversity C
omm
ittee Meeting 5/23/2016
________________________________________________________________________________
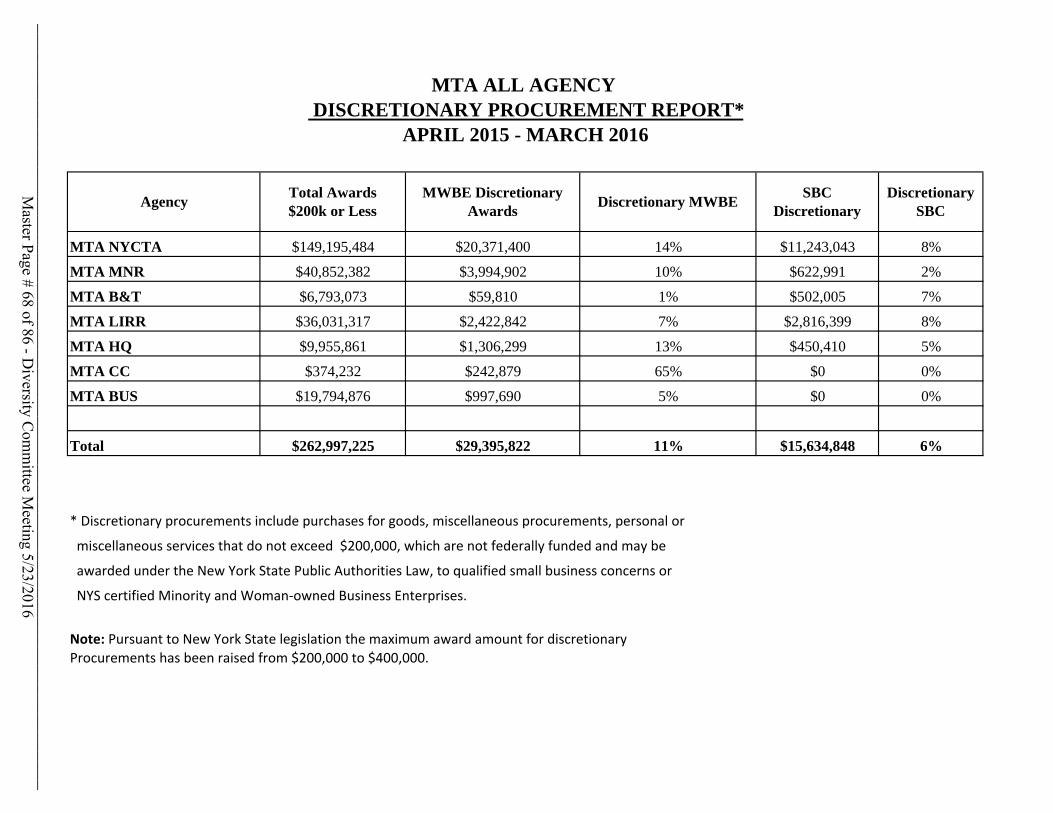
MTA NYCTA $149,195,484 $20,371,400 14% $11,243,043 8%
MTA MNR $40,852,382 $3,994,902 10% $622,991 2%
MTA B&T $6,793,073 $59,810 1% $502,005 7%
MTA LIRR $36,031,317 $2,422,842 7% $2,816,399 8%
MTA HQ $9,955,861 $1,306,299 13% $450,410 5%
MTA CC $374,232 $242,879 65% $0 0%
MTA BUS $19,794,876 $997,690 5% $0 0%
Total $262,997,225 $29,395,822 11% $15,634,848 6%
* Discretionary procurements include purchases for goods, miscellaneous procurements, personal or
miscellaneous services that do not exceed $200,000, which are not federally funded and may be
awarded under the New York State Public Authorities Law, to qualified small business concerns or
NYS certified Minority and Woman‐owned Business Enterprises.
Note: Pursuant to New York State legislation the maximum award amount for discretionaryProcurements has been raised from $200,000 to $400,000.
MTA ALL AGENCY DISCRETIONARY PROCUREMENT REPORT*
APRIL 2015 - MARCH 2016
AgencyTotal Awards $200k or Less
MWBE Discretionary Awards
Discretionary MWBESBC
DiscretionaryDiscretionary
SBC
Master Page # 68 of 86 - D
iversity Com
mittee M
eeting 5/23/2016________________________________________________________________________________
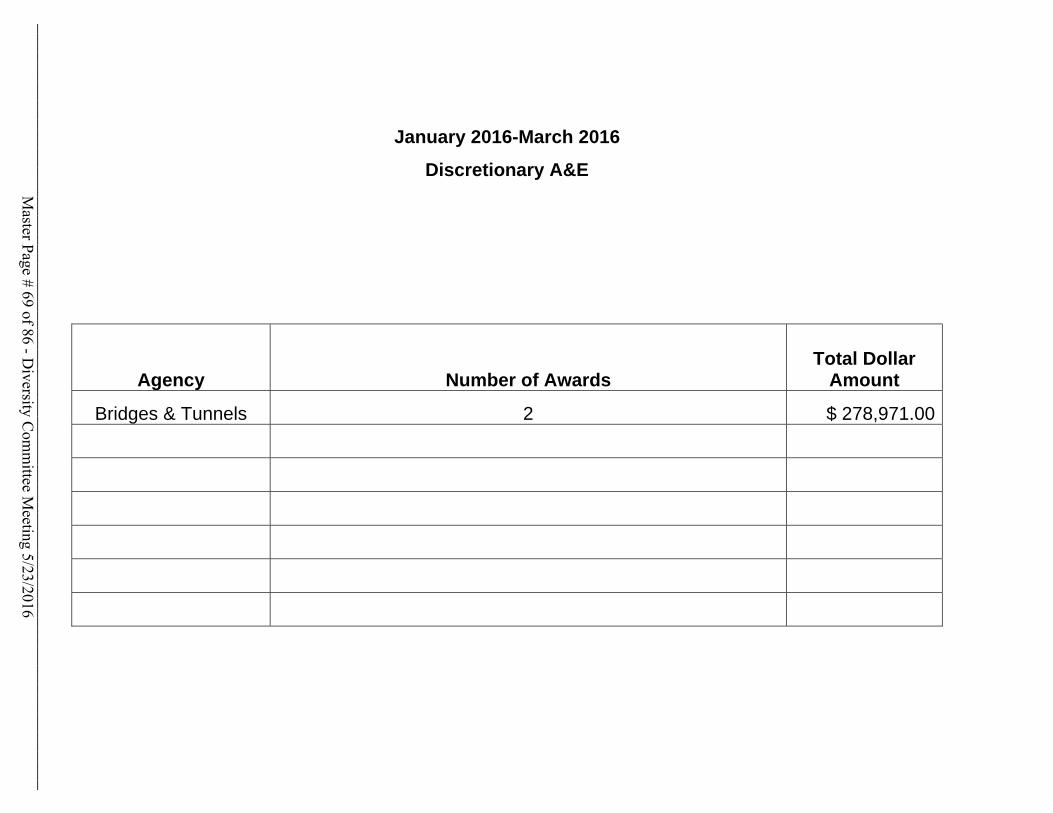
January 2016-March 2016
Discretionary A&E
Agency Number of Awards Total Dollar
Amount
Bridges & Tunnels 2 $ 278,971.00
Master Page # 69 of 86 - D
iversity Com
mittee M
eeting 5/23/2016________________________________________________________________________________
Metropolitan Transportation Authority Department of Diversity and Civil Rights
Status of Inactive ContractsAugust 2014 – April 2016
Master Page # 70 of 86 - D
iversity Com
mittee M
eeting 5/23/2016________________________________________________________________________________
2
MTA HeadquartersDDCR Update
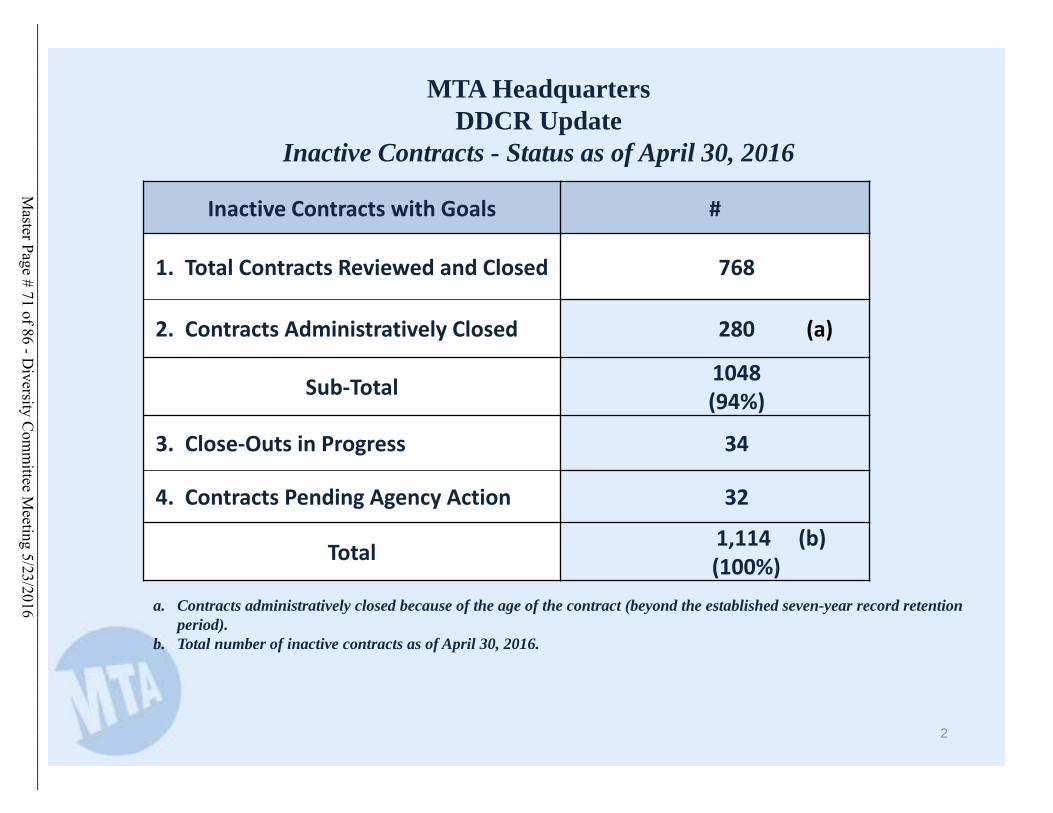
Inactive Contracts - Status as of April 30, 2016
Inactive Contracts with Goals #
1. Total Contracts Reviewed and Closed 768
2. Contracts Administratively Closed 280 (a)
Sub‐Total 1048(94%)
3. Close‐Outs in Progress 34
4. Contracts Pending Agency Action 32
Total 1,114 (b)(100%)
a. Contracts administratively closed because of the age of the contract (beyond the established seven-year record retention period).
b. Total number of inactive contracts as of April 30, 2016.
Master Page # 71 of 86 - D
iversity Com
mittee M
eeting 5/23/2016________________________________________________________________________________
3
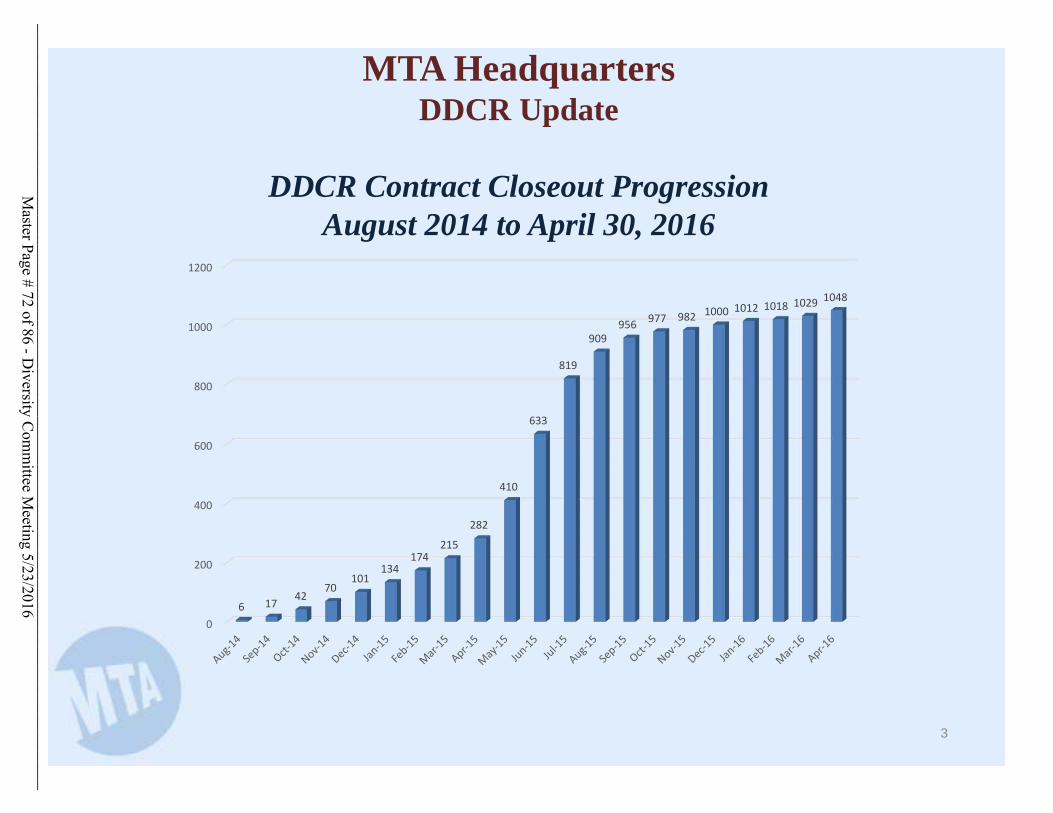
MTA HeadquartersDDCR Update
DDCR Contract Closeout Progression August 2014 to April 30, 2016
0
200
400
600
800
1000
1200
6 17 4270
101134
174215
282
410
633
819
909956 977 982 1000 1012 1018 1029 1048
Master Page # 72 of 86 - D
iversity Com
mittee M
eeting 5/23/2016________________________________________________________________________________
Metropolitan Transportation Authority Department of Diversity and Civil Rights
Project Site Visits
September 2015 – April 2016
Master Page # 73 of 86 - D
iversity Com
mittee M
eeting 5/23/2016________________________________________________________________________________
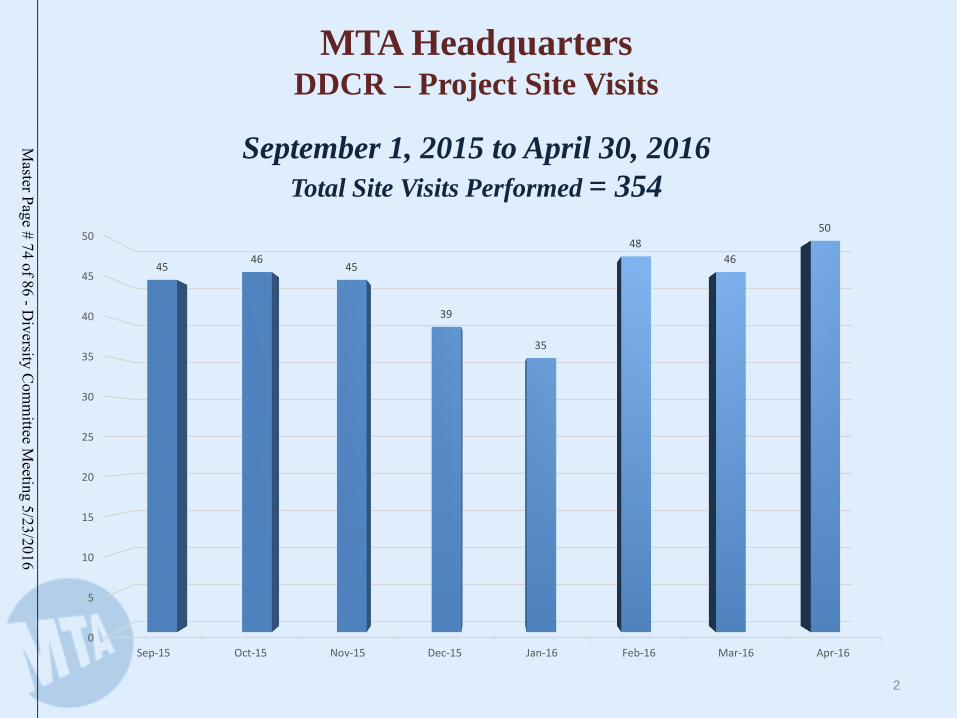
2
MTA HeadquartersDDCR – Project Site Visits
September 1, 2015 to April 30, 2016
Total Site Visits Performed = 354
0
5
10
15
20
25
30
35
40
45
50
Sep-15 Oct-15 Nov-15 Dec-15 Jan-16 Feb-16 Mar-16 Apr-16
4546
45
39
35
48
46
50
Master Page # 74 of 86 - D
iversity Com
mittee M
eeting 5/23/2016________________________________________________________________________________
FINANCIAL AND LEGALSERVICES
May 23, 2016
Master Page # 75 of 86 - D
iversity Com
mittee M
eeting 5/23/2016________________________________________________________________________________
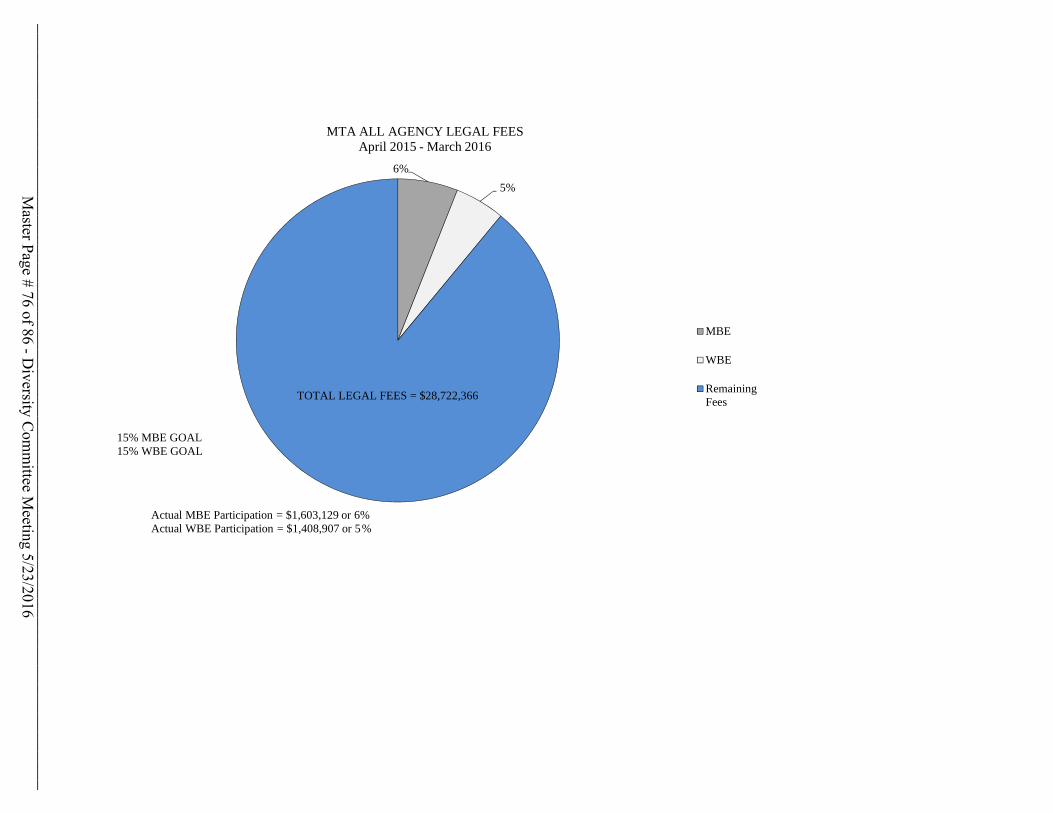
6%
5%
MBE
WBE
RemainingFees
Actual MBE Participation = $1,603,129 or 6%Actual WBE Participation = $1,408,907 or 5%
TOTAL LEGAL FEES = $28,722,366
15% MBE GOAL15% WBE GOAL
MTA ALL AGENCY LEGAL FEESApril 2015 - March 2016
Master Page # 76 of 86 - D
iversity Com
mittee M
eeting 5/23/2016________________________________________________________________________________
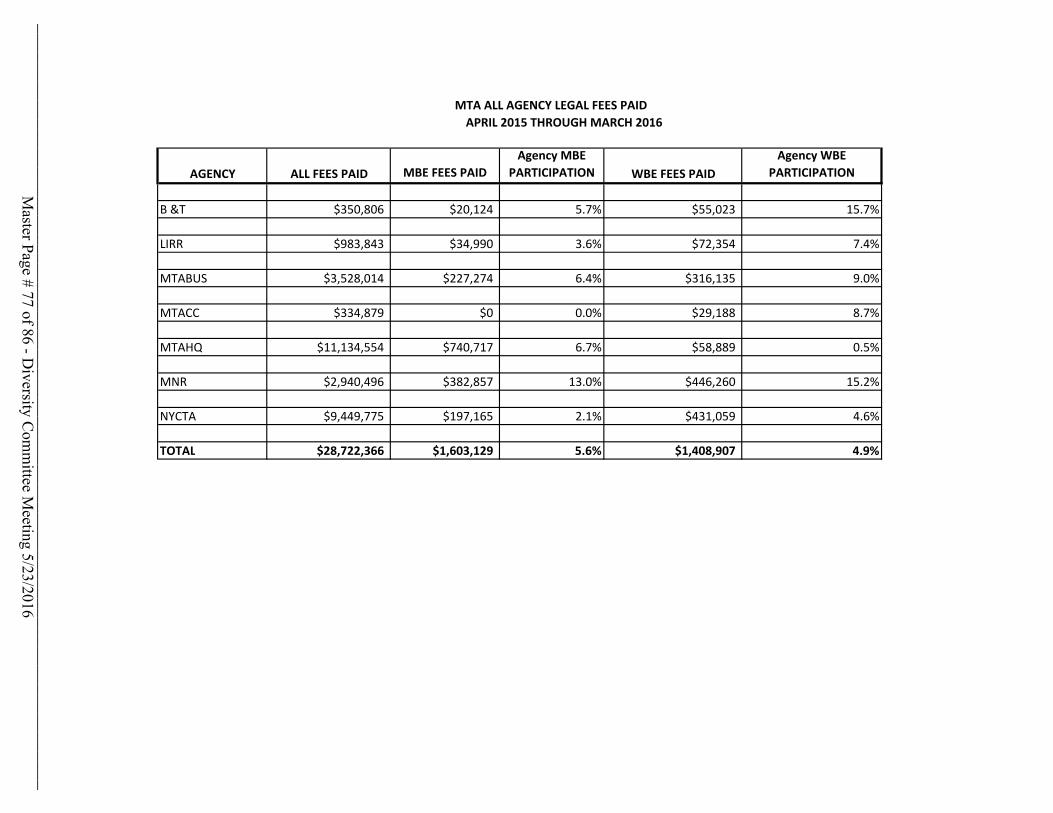
AGENCY ALL FEES PAID MBE FEES PAIDAgency MBE
PARTICIPATION WBE FEES PAIDAgency WBE
PARTICIPATION
B &T $350,806 $20,124 5.7% $55,023 15.7%
LIRR $983,843 $34,990 3.6% $72,354 7.4%
MTABUS $3,528,014 $227,274 6.4% $316,135 9.0%
MTACC $334,879 $0 0.0% $29,188 8.7%
MTAHQ $11,134,554 $740,717 6.7% $58,889 0.5%
MNR $2,940,496 $382,857 13.0% $446,260 15.2%
NYCTA $9,449,775 $197,165 2.1% $431,059 4.6%
TOTAL $28,722,366 $1,603,129 5.6% $1,408,907 4.9%
MTA ALL AGENCY LEGAL FEES PAID APRIL 2015 THROUGH MARCH 2016
Master Page # 77 of 86 - D
iversity Com
mittee M
eeting 5/23/2016________________________________________________________________________________
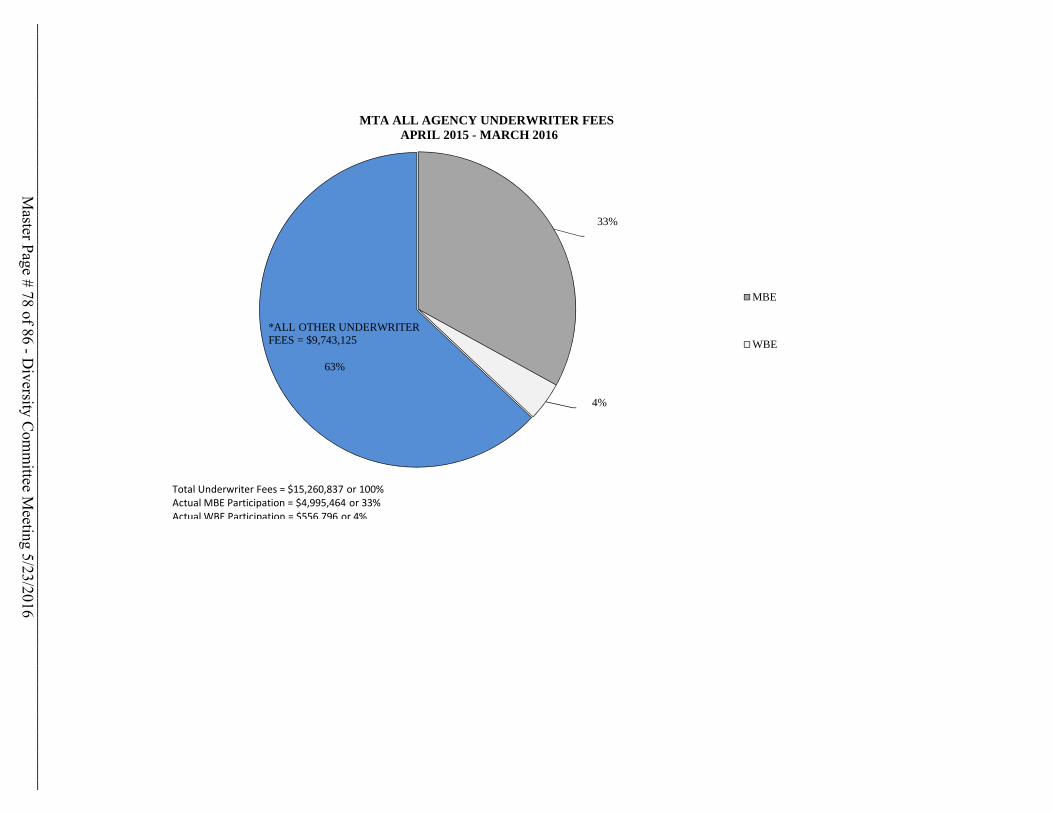
33%
4%
63%
MBE
WBE
Total Underwriter Fees = $15,260,837 or 100%Actual MBE Participation = $4,995,464 or 33%Actual WBE Participation = $556,796 or 4%
*ALL OTHER UNDERWRITER FEES = $9,743,125
MTA ALL AGENCY UNDERWRITER FEESAPRIL 2015 - MARCH 2016
Master Page # 78 of 86 - D
iversity Com
mittee M
eeting 5/23/2016________________________________________________________________________________
MTA ASSET FUND MANAGERS
May 23, 2016
Master Page # 79 of 86 - D
iversity Com
mittee M
eeting 5/23/2016________________________________________________________________________________
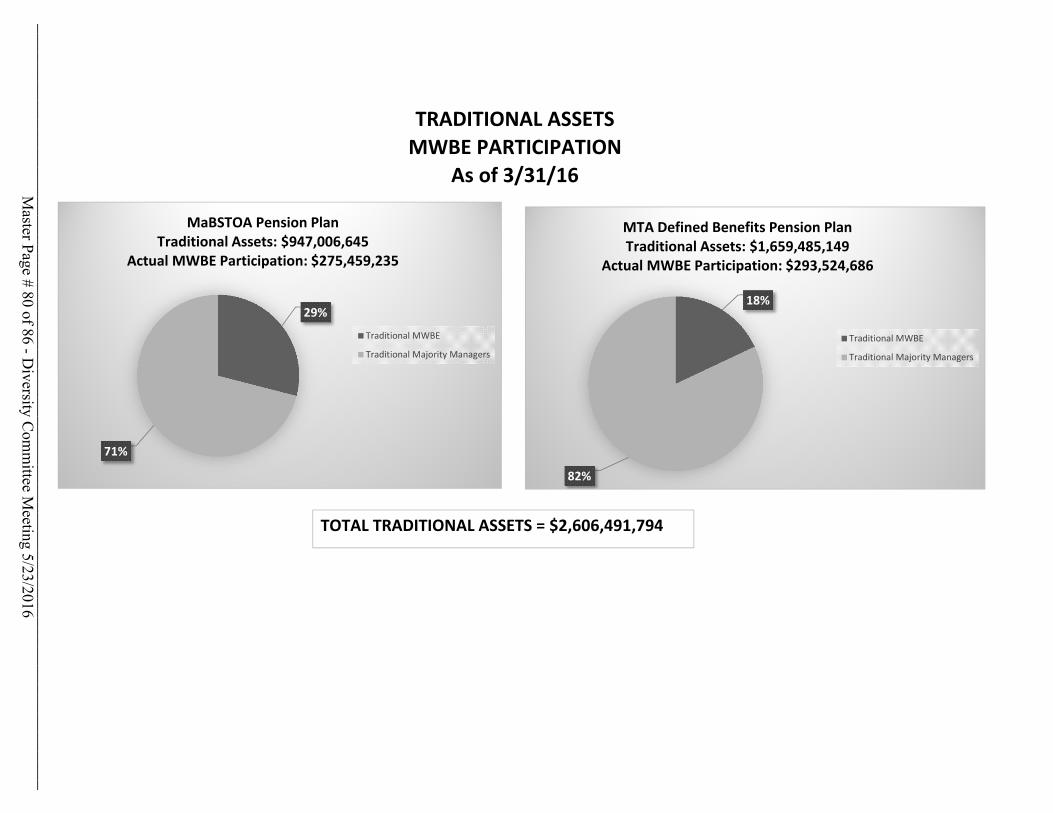
TRADITIONAL ASSETSMWBE PARTICIPATION
As of 3/31/16
18%
82%
Traditional MWBE
Traditional Majority Managers
MTA Defined Benefits Pension PlanTraditional Assets: $1,659,485,149
Actual MWBE Participation: $293,524,686
TOTAL TRADITIONAL ASSETS = $2,606,491,794
29%
71%
Traditional MWBE
Traditional Majority Managers
MaBSTOA Pension PlanTraditional Assets: $947,006,645
Actual MWBE Participation: $275,459,235
Master Page # 80 of 86 - D
iversity Com
mittee M
eeting 5/23/2016________________________________________________________________________________
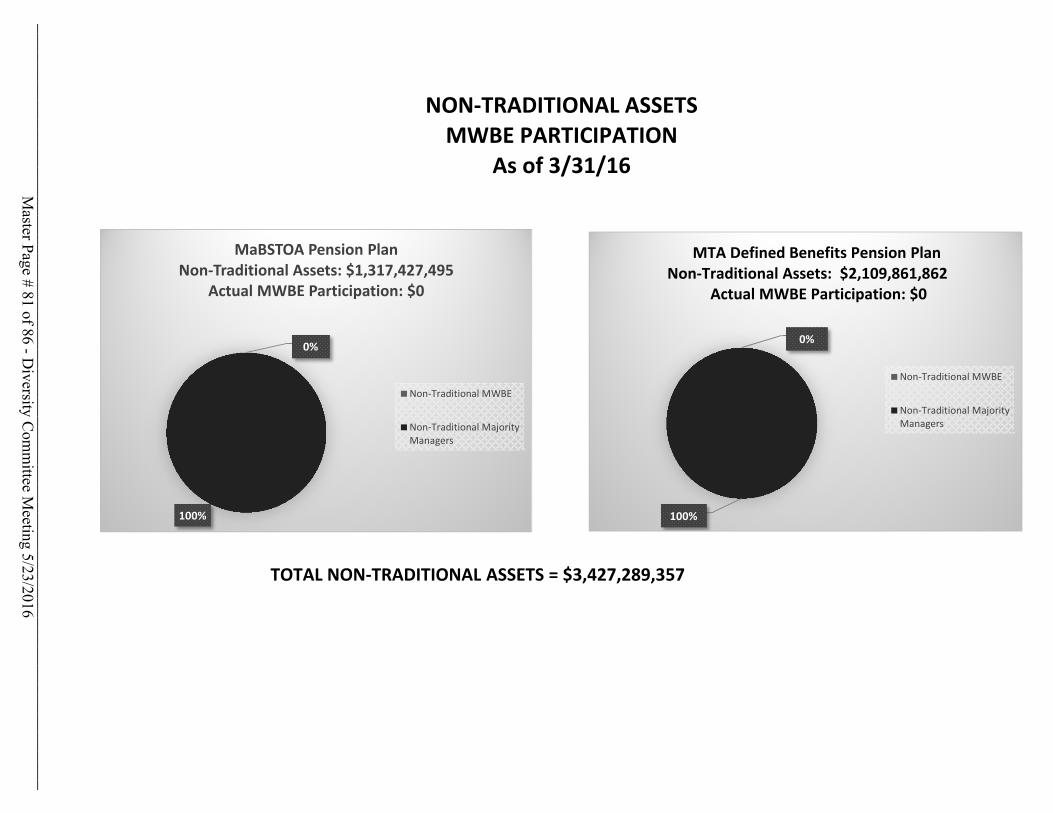
NON‐TRADITIONAL ASSETSMWBE PARTICIPATION
As of 3/31/16
0%
100%
MaBSTOA Pension PlanNon‐Traditional Assets: $1,317,427,495
Actual MWBE Participation: $0
Non‐Traditional MWBE
Non‐Traditional MajorityManagers
0%
100%
Non‐Traditional MWBE
Non‐Traditional MajorityManagers
MTA Defined Benefits Pension PlanNon‐Traditional Assets: $2,109,861,862
Actual MWBE Participation: $0
TOTAL NON‐TRADITIONAL ASSETS = $3,427,289,357
Master Page # 81 of 86 - D
iversity Com
mittee M
eeting 5/23/2016________________________________________________________________________________
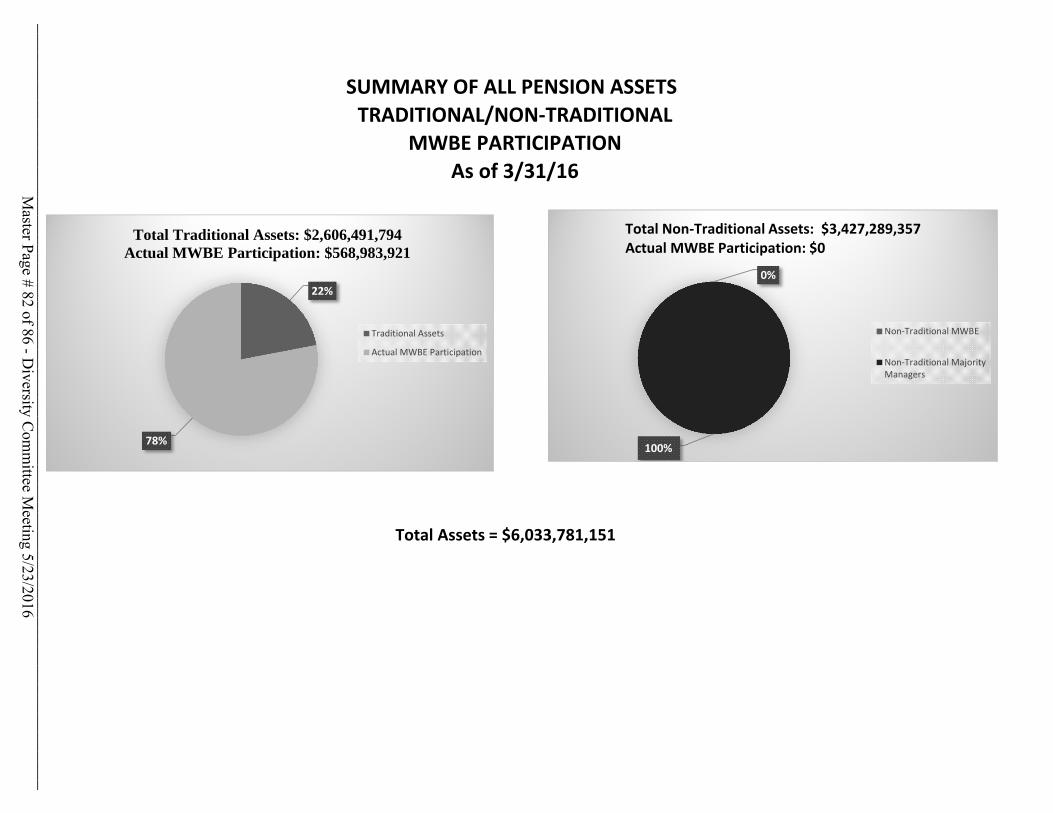
SUMMARY OF ALL PENSION ASSETSTRADITIONAL/NON‐TRADITIONAL
MWBE PARTICIPATIONAs of 3/31/16
0%
100%
Non‐Traditional MWBE
Non‐Traditional MajorityManagers
Total Non‐Traditional Assets: $3,427,289,357Actual MWBE Participation: $0
Total Assets = $6,033,781,151
22%
78%
Traditional Assets
Actual MWBE Participation
Total Traditional Assets: $2,606,491,794Actual MWBE Participation: $568,983,921
Master Page # 82 of 86 - D
iversity Com
mittee M
eeting 5/23/2016________________________________________________________________________________
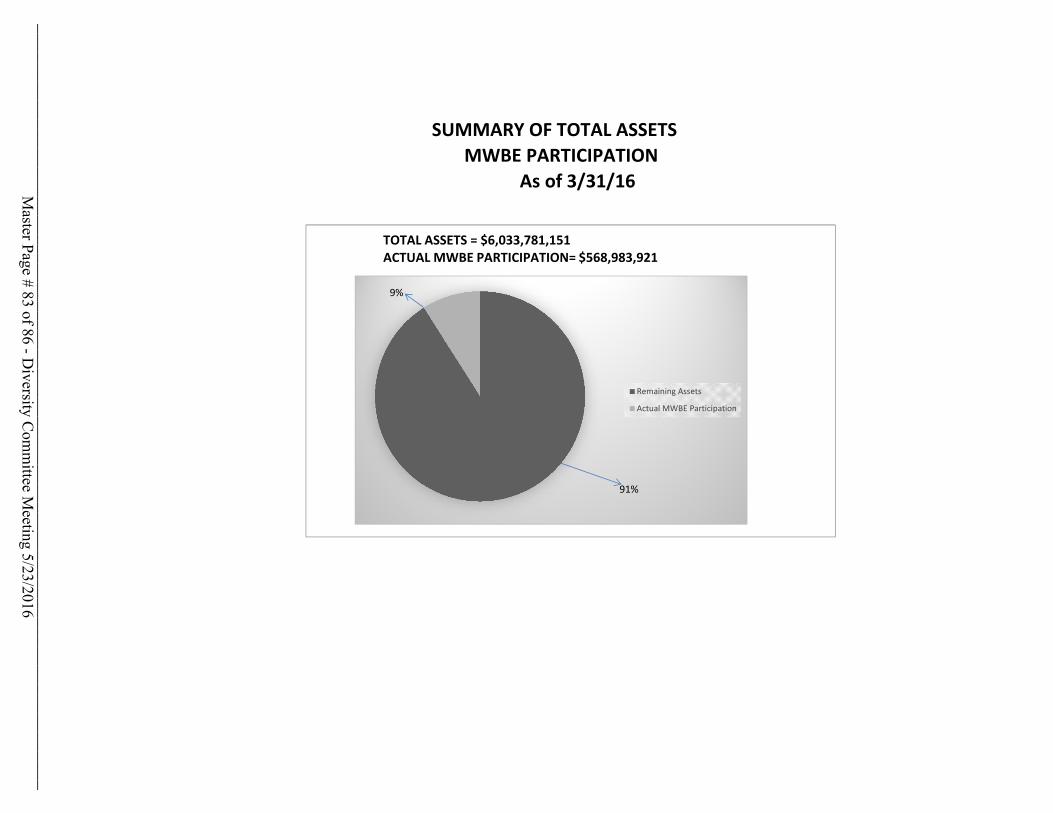
Remaining Assets 91Actual MWBE Participation 9
SUMMARY OF TOTAL ASSETS MWBE PARTICIPATION As of 3/31/16
11%
89%
TOTAL ASSETS = $6,033,781,151ACTUAL MWBE PARTICIPATION= $568,983,921
Remaining Assets
Actual MWBE Participation
9%
91%
Master Page # 83 of 86 - D
iversity Com
mittee M
eeting 5/23/2016________________________________________________________________________________
MTA CAPITAL PROJECTSM/W/DBE AWARDS
May 23, 2016
Master Page # 84 of 86 - D
iversity Com
mittee M
eeting 5/23/2016________________________________________________________________________________
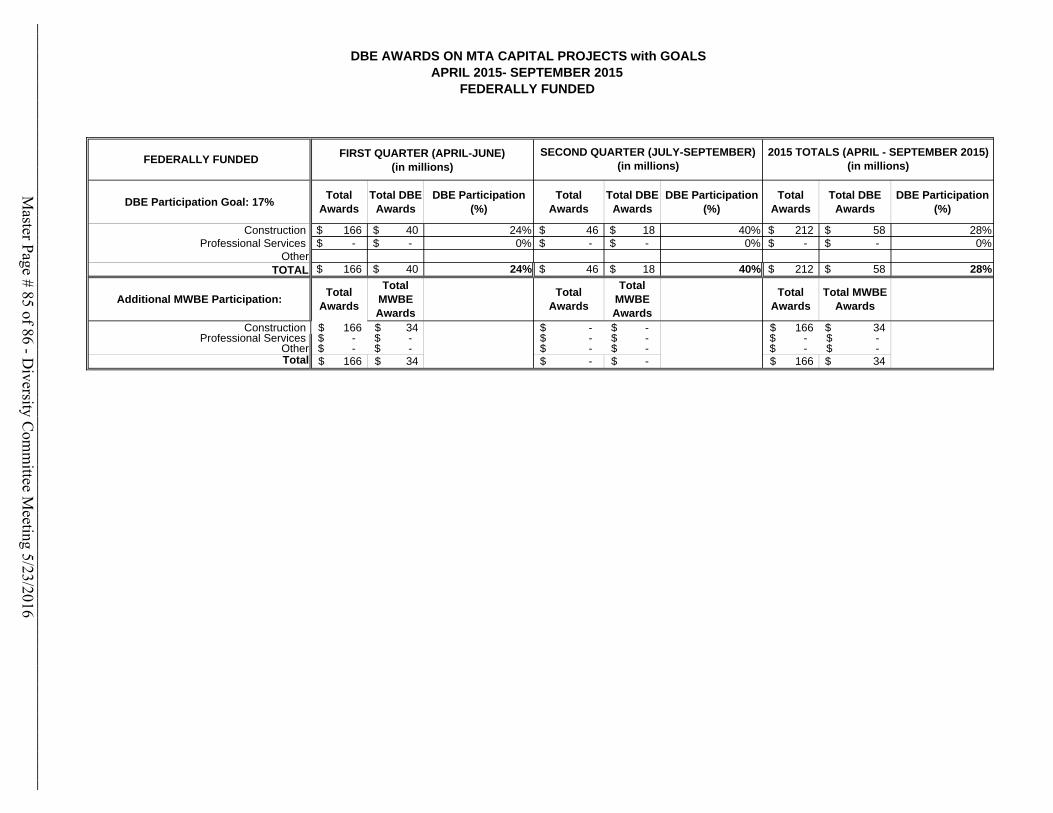
DBE AWARDS ON MTA CAPITAL PROJECTS with GOALSAPRIL 2015- SEPTEMBER 2015
FEDERALLY FUNDED
FEDERALLY FUNDED
DBE Participation Goal: 17%Total
AwardsTotal DBE
AwardsDBE Participation
(%)Total
AwardsTotal DBE
AwardsDBE Participation
(%)Total
AwardsTotal DBE
AwardsDBE Participation
(%)
Construction 166$ 40$ 24% 46$ 18$ 40% 212$ 58$ 28%Professional Services -$ -$ 0% -$ -$ 0% -$ -$ 0%
OtherTOTAL 166$ 40$ 24% 46$ 18$ 40% 212$ 58$ 28%
Additional MWBE Participation:Total
Awards
Total MWBE Awards
Total Awards
Total MWBE Awards
Total Awards
Total MWBE Awards
Construction 166$ 34$ -$ -$ 166$ 34$ Professional Services -$ -$ -$ -$ -$ -$
Other -$ -$ -$ -$ -$ -$ Total 166$ 34$ -$ -$ 166$ 34$
FIRST QUARTER (APRIL-JUNE) (in millions)
SECOND QUARTER (JULY-SEPTEMBER) (in millions)
2015 TOTALS (APRIL - SEPTEMBER 2015) (in millions)
Master Page # 85 of 86 - D
iversity Com
mittee M
eeting 5/23/2016________________________________________________________________________________
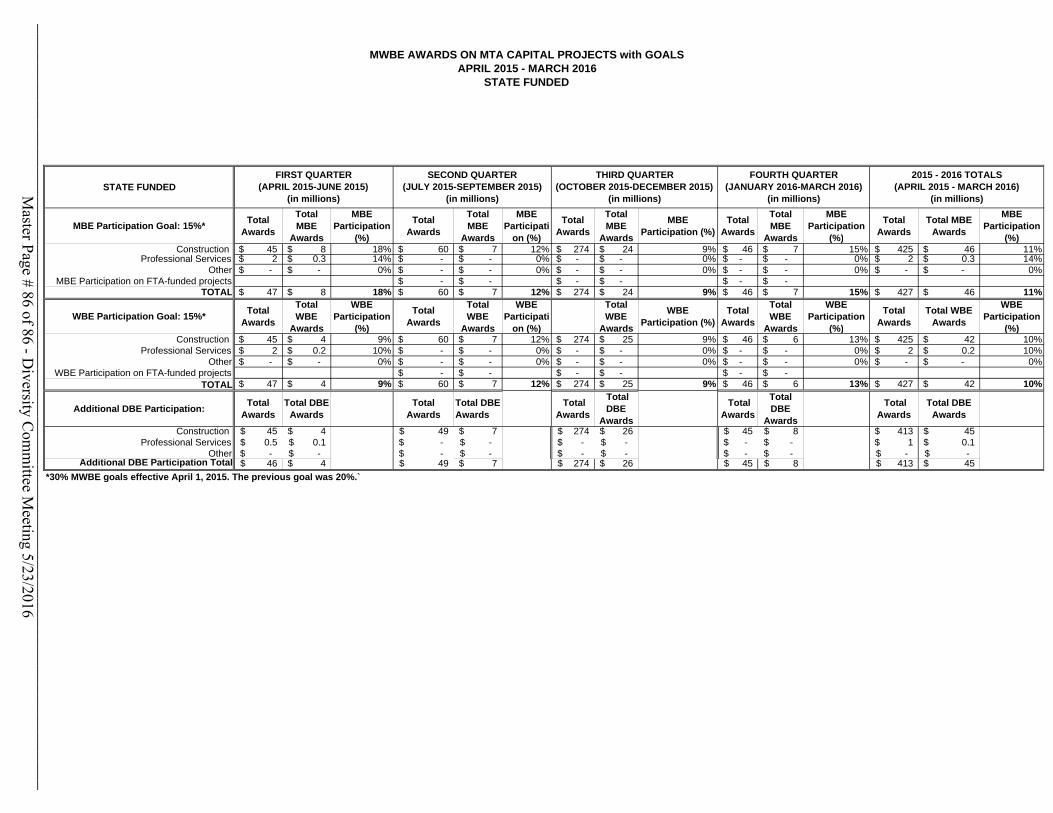
MWBE AWARDS ON MTA CAPITAL PROJECTS with GOALSAPRIL 2015 - MARCH 2016
STATE FUNDED
STATE FUNDED
MBE Participation Goal: 15%*Total
Awards
Total MBE
Awards
MBE Participation
(%)
Total Awards
Total MBE
Awards
MBE Participati
on (%)
Total Awards
Total MBE
Awards
MBE Participation (%)
Total Awards
Total MBE
Awards
MBE Participation
(%)
Total Awards
Total MBE Awards
MBE Participation
(%)Construction 45$ 8$ 18% 60$ 7$ 12% 274$ 24$ 9% 46$ 7$ 15% 425$ 46$ 11%
Professional Services 2$ 0.3$ 14% -$ -$ 0% -$ -$ 0% -$ -$ 0% 2$ 0.3$ 14%Other -$ -$ 0% -$ -$ 0% -$ -$ 0% -$ -$ 0% -$ -$ 0%
MBE Participation on FTA-funded projects -$ -$ -$ -$ -$ -$ TOTAL 47$ 8$ 18% 60$ 7$ 12% 274$ 24$ 9% 46$ 7$ 15% 427$ 46$ 11%
WBE Participation Goal: 15%*Total
Awards
Total WBE
Awards
WBE Participation
(%)
Total Awards
Total WBE
Awards
WBE Participati
on (%)
Total WBE
Awards
WBE Participation (%)
Total Awards
Total WBE
Awards
WBE Participation
(%)
Total Awards
Total WBE Awards
WBE Participation
(%)Construction 45$ 4$ 9% 60$ 7$ 12% 274$ 25$ 9% 46$ 6$ 13% 425$ 42$ 10%
Professional Services 2$ 0.2$ 10% -$ -$ 0% -$ -$ 0% -$ -$ 0% 2$ 0.2$ 10%Other -$ -$ 0% -$ -$ 0% -$ -$ 0% -$ -$ 0% -$ -$ 0%
WBE Participation on FTA-funded projects -$ -$ -$ -$ -$ -$ TOTAL 47$ 4$ 9% 60$ 7$ 12% 274$ 25$ 9% 46$ 6$ 13% 427$ 42$ 10%
Additional DBE Participation:Total
AwardsTotal DBE
AwardsTotal
AwardsTotal DBE Awards
Total Awards
Total DBE
Awards
Total Awards
Total DBE
Awards
Total Awards
Total DBE Awards
Construction 45$ 4$ 49$ 7$ 274$ 26$ 45$ 8$ 413$ 45$ Professional Services 0.5$ 0.1$ -$ -$ -$ -$ -$ -$ 1$ 0.1$
Other -$ -$ -$ -$ -$ -$ -$ -$ -$ -$ Additional DBE Participation Total 46$ 4$ 49$ 7$ 274$ 26$ 45$ 8$ 413$ 45$
*30% MWBE goals effective April 1, 2015. The previous goal was 20%.`
2015 - 2016 TOTALS (APRIL 2015 - MARCH 2016)
(in millions)
FOURTH QUARTER (JANUARY 2016-MARCH 2016)
(in millions)
THIRD QUARTER (OCTOBER 2015-DECEMBER 2015)
(in millions)
SECOND QUARTER (JULY 2015-SEPTEMBER 2015)
(in millions)
FIRST QUARTER (APRIL 2015-JUNE 2015)
(in millions)
Master Page # 86 of 86 - D
iversity Com
mittee M
eeting 5/23/2016________________________________________________________________________________


![MTA - Unopomp · TM01 8522 0300 MTA 3 MTA 4 L[mm] 35 45 TM01 8657 0600 TM01 8658 0600 TM01 9076 1000 10 L 10 125 45 Min. 20 mm General data MTA. 6 Technical data MTA 3 MTA 4 ... 105](https://img.pdfslide.us/doc/110x75/5be789d309d3f246788ca2ff/mta-tm01-8522-0300-mta-3-mta-4-lmm-35-45-tm01-8657-0600-tm01-8658-0600-tm01.jpg)