Embed Size (px)
Citation preview

/) n :__s _ />/?,J..1"-7-
/h' - ,S L/ -"O
FATIGUEe PILOT DEVIATIONS AND TIME OF DAY
Susan P. Baker, M.P.H., Prlncipal Investigator
The Johns Hopkins School of Public Health
Injury Prevention Center
Hampton House, 5th Floor
624 North Broadway
Baltimore, Maryland 21205
Grant Period
July 15, 1988 - January 14, 1989
(extended to June 30, 1989)
Grant No, NCC 2-555
NASA Technical officer
Dr. R. Curtis Graeber, NASA (AMES)
Aviation Systems Research Branch, 239-21
June 23, 1989
(NASA-Cq-IB5369) FATIGUE, PILOT DEVIATIONS
ANO TIMF OF OAY Report, 15 Jul. 198B- 30Jun. 1989 (JHU) 36 p CSCL 05H
G3154
N90-13035
https://ntrs.nasa.gov/search.jsp?R=19900003719 2020-05-10T17:21:27+00:00Z

SUMMARY
This study examined She relationships between pilot fatigue,
pilot deviations, reported incidents, and time of day. Part I of
the study used data from NASA's Aviation Safety Reporting System
(ASRS), which is based on voluntary reports by flight crews, airtraffic controllers, etc. Part II was based on the FAA PilotDeviation data and incident data.
=
In Part I we analyzed a sample of 200 reports from 1985 and200 reports from 1987, plus i00 reports from late 1987 and early
1988 that had been selected because of possible association with
fatigue. (These sample sizes were reduced somewhat by
eliminating reports about planes with gross takeoff weights of
less than 5,000 pounds, to eliminate general aviation cases.)
Cases in all three samples were classified with regard to type of
deviation (e.g., altitude deviation, runway incursion) and
reported contributing factors (e.g., fatigue, distraction). Inaddition, a special tabulatlon of 9,398 ASRS cases from 1988 was
analyzed to identify the characteristics of cases chosen by ASRS
investigators for detailed computer entry with narrativesections. (All ASRS cases were entered in detail in 1985, but
not in 1987 and 1988.)
The main findings in Part I were:
*Cases selected for detailed entry in the ASRS file were
especially likely to involve conflicts and air traffic control
problems, and less likely to involve altitude and headingdeviations than cases not so selected.
*Distraction was disproportionately involved as a factor in
altitude deviations. In 1985 (the most representative sample, in
which almost half of all cases were altitude deviations),
distraction was the primary factor in 31% of the altitude
deviations, compared to 11% of other cases.
*Cases in the late night and evening hours disproportionately
involved fatigue as one of the contributing factors (67% and 39%,
respectively, compared to 20% in the daytime).
*Runway transgressions occurred disproportionately in the evening
(43% of all runway transgressions occurred between 1800 and 2359
hrs).
*Fatigue was especially likely to be a factor in smaller aircraft
(small, light, and medium transport aircraft): 40% of cases in
the fatigue set were smaller aircraft, compared to 14% of cases
in the 1985 Sample. Fatigue was also associated with smaller
aircraft in the 1985 Sample.
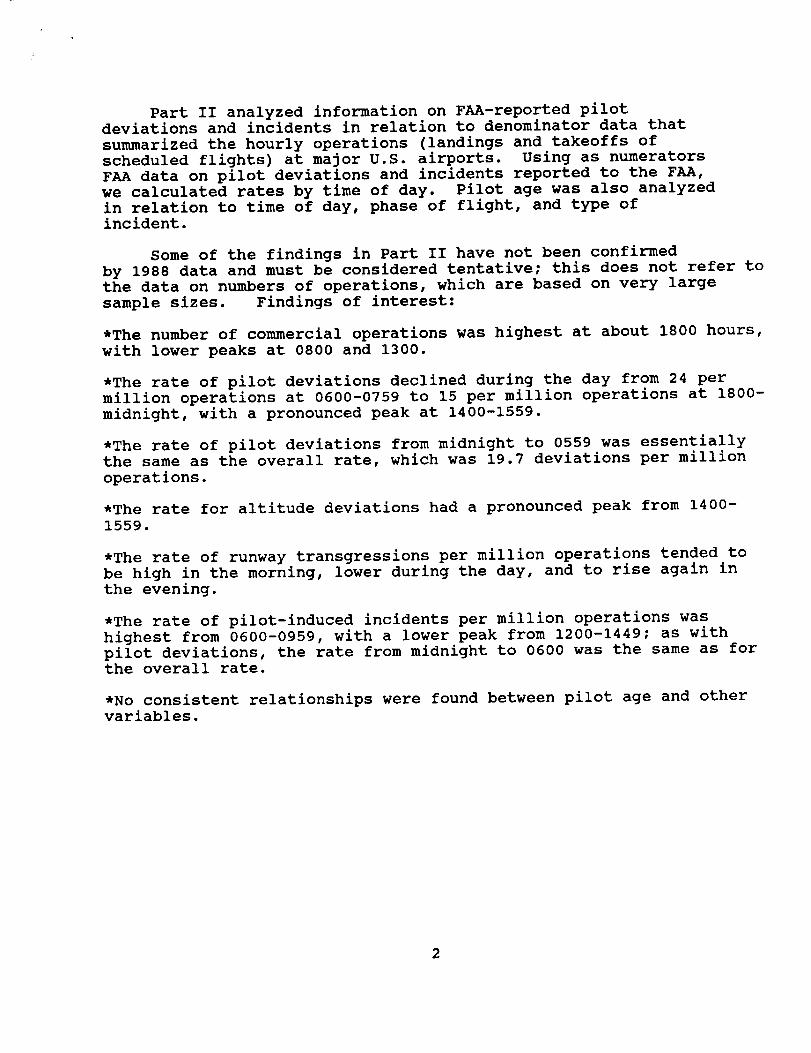
Part II analyzed information on FAA-reported pilotdeviations and incidents in relation to denominator data thatsummarized the hourly operations (landings and takeoffs ofscheduled flights) at major U.S. airports. Using as numerators
FAA data on pilot deviations and incidents reported to the FAA,we calculated rates by time of day. Pilot age was also analyzed
in relation to time of day, phase of flight, and type of
incident.
Some of the findings in Part II have not been confirmed
by 1988 data and must be considered tentative; this does not refer tothe data on numbers of operations, which are based on very large
sample sizes. Findings of interest:
*The number of commercial operations was highest at about 1800 hours,
with lower peaks at 0800 and 1300.
*The rate of pilot deviations declined during the day from 24 per
million operations at 0600-0759 to 15 per million operations at 1800-
midnight, with a pronounced peak at 1400-1559.
*The rate of pilot deviations from midnight to 0559 was essentiallythe same as the overall rate, which was 19.7 deviations per million
operations.
*The rate for altitude deviations had a pronounced peak from 1400-
1559.
*The rate of runway transgressions per million operations tended to
be high in the morning, lower during the day, and to rise again in
the evening.
*The rate of pilot-induced incidents per million operations was
highest from 0600-0959, with a lower peak from 1200-1449; as with
pilot deviations, the rate from midnight to 0600 was the same as forthe overall rate.
*No consistent relationships were found between pilot age and other
variables.
2

BACKGROUND
NASA researchers have compared the performance of air transport
crews after a three-day, high-intensity duty cycle with crews that
had just had at least three days off-duty (i). In simulated flight
scenarios, crews performed even better in the post-duty (more
fatigued) state than in the pre-duty state, apparently because of thebetter communications and coordination among crew members who have
worked together for several days.
Despite the great importance of crew coordination, fatigue
se remains an important subject, as it is known to be associated with
deterioration in performance under experimental conditions. Analysisof data from the NASA Aviation Safety Reporting System (ASRS) from1976-1980 revealed that 21% of air transport crew errors were either
directly or indirectly attributed to fatigue (2). In another studyof U.S. Naval aircraft mishaps, fighter and helicopter pilots who had
worked at least i0 hours in the previous 24 hours were significantly
more likely to have been among pilots causally linked to the mishap
(3).
Of importance to many aircrew members are the effects of sleep
disruption which result from attempts to accommodate to an unusualwork schedule. These effects are cumulative and the risk of
performance error due to a sudden, overpowering sleepiness increaseswith continued sleep loss or "sleep debt" (4). Although many experts
do not equate sleepiness with fatigue, sleepiness is viewed by manyaviators as the most operationally significant aspect of air crew
fatigue (5). The timing of trips and not necessarily the length of
duty day or number of segments flown appeared to contribute more to
the development of fatigue among the short haul pilots studied (6).
With computers now available to develop new schedules thatmaximize the work load within legal limits, it is urgent to pursue
research on the effects of long duty hours and fatigue. In
particular, research is needed on real world incidents such asaltitude deviations and runway incursions as they relate to fatigue
and crew schedules.
NASA's Aviation Safety Reporting System (ASRS) allows pilots to
anonymously report incidents such as altitude or course deviations,failure to follow instructions of controllers, and errors or
confusion when approaching destination airports. Some ASRS reports
cite fatigue, lack of sleep, or long periods on duty as factors
contributing to the incident. The relationship between fatigue of
flight crews and airplane crashes or other incidents has not been
directly measured. However, data from other modes of travel show theadverse effects of long duty hours. For example, the risk of crashes
among tractor trailer drivers who have been on duty for more than 8hours has been shown to be almost double the risk of truck drivers as
a whole (7). Analysis of the temporal distribution of 6,000 single
3
vehicle traffic crashes attributed to "falling asleep at the wheel"revealed a major peak between I:00 a.m. and 4:00 a.m.; a smallsecondary peak was evident between i:00 p.m. and 4:00 p.m. (4).(Circadian rhythm effects are greatest during the hours ofapproximately 2:00 to 7:00 a.m. and to a lesser extent during amidafternoon period from approximately 2:00 to 5:00 p.m.).
Although hour of the day is not a surrogate for pilot fatigue,there are at least four reasons for a relationship between the twovariables: I) the later it is in the day, the more hours are likelyto have elapsed since a pilot slept; 2) there is some correlationbetween number of hours on duty and time of day: i.e., early in themorning, most pilots will have just come on duty, and pilots flyinglate in the evening will generally have flown for a number of hours;3) a "low spot" often occurs at 3-5 p.m. when people are apt to feeldrowsy or less alert; 4) at certain hours of the day when air trafficis heaviest, a pilot's workload may be heavier, resulting in morefatigue.
In 1986, the total number of pilot deviations (PDs) was highestat 3-4 p.m. (i). Hourly counts were not separately examined for aircarriers, however; this step is important since air carriers accountfor less than 15% of the reported PDs and therefore are "masked" bythe far larger number of general aviation PDs. Nor had rates of
pilot deviations or incidents per million operations been calculatedin relation to local time; such an analysis was needed in order to
know whether hourly differences in the number of events are simplydue to differences in the number of flights.
The present study provides the first data on rates of pilot
deviations by hour of the day, using an innovative procedure for
developing denominator data. The study was designed to answer the
following questions:
- What are the characteristics of reported pilot deviations?
- How do the ASRS cases selected for detailed computer entry
differ from the 1985 cases, all of which were entered?
- How do the "fatigue" cases differ from other cases with
regard to type of incident and other variables?
- How do position deviations differ from other cases with
regard to potentially contributing factors?
Do airline pilot deviations reported to the
FAA occur disproportionately at any hour of the day?
Is there any relationship between pilot age and phaseof operation, time of incident, or type of incident?
4

PART I_ ASRS DATA
METHODS AND MATERIALS
The following sets of data were used in our analyses of ASRS cases:
i. 1985 SAMPLE. A sample of 200 cases from 1985 was drawn as every
nth case, to provide representative cases throughout the year. After
eliminating reports on aircraft weighing less than 5,000 pounds
(likely to be general aviation cases) and reports warning of a hazardthat did not affect the crew reporting the hazard, there were 177
cases.
2. 1987 SAMPLE. Similar to the 1985 Sample except that it excluded
all abbreviated records without narratives. (In 1985, virtually all
cases contained narratives.) After exclusions similar to the ones
for the 1985 Sample, there were 148 cases.
3. FATIGUE SET. This group of cases contained i00 reports sent toDr. R. Curtis Graeber involving flight crew fatigue, from April 1987
through March 1988. After exclusions similar to those above, therewere 93 cases.
4. 1988 TABLES. The first 9,398 cases filed in 1988 (January
through June, with some cases from July and August) were summarizedin tables that differentiated between cases with narratives ('Short
Forms') and those without ('Abbreviated Forms').
5. OPERATIONS SAMPLE. A sample of 56,298 operations during January
and July, 1986 was drawn based on the 35 U.S. airports with the
largest numbers of operations (landings and takeoffs). The localtime of these operations was used as a national denominator, to give
the hourly distribution of operations in the U.S. The methodology
for this sample is described more fully in the section on pilotdeviations.
Each case in the 1985 and 1987 Samples and the Fatigue Set wasreviewed and the data were coded. Most coding was straightforward,
since the ASRS categories of anomalies, aircraft type, etc. were usedwithout revision.
The only variable that required the use of judgment and understanding
of the pilot's task in order to code it was our variable called'Factor.' This referred to the contributing factor that appeared to
be most important. The major groups of contributing factors were
communication problems, distraction, fatigue, errors, and
malfunctioning equipment. Up to four factors could be coded for each
5

case. (For example, in one case a heading deviation occurred becausea first officer who was unfamiliar with the task had loaded the wrong
route description into the computer; this was coded as both an error
and as fatigue, since he mentioned fatigue and a poor night's sleep
the previous night.) Contributing factors were coded by an
experienced pilot who reviewed each case. Factors are described on
Table i.
RESULTS
SELECTION FACTORS FOR ASRS CASES CHOSEN FOR DETAILED COMPUTER ENTRY
Two sets of data suggest the factors that influence the cases chosenfor detailed computer entry, complete with narratives. The first ofthese data sets were the 1988 Tables. The major differences (Table
2) were:
*Altitude and heading deviations and non-adherence to requirements or
clearances made up 60% of cases without narratives, but only 22% of
cases selected for narrative reports.
*Conflicts, including near midair collisions, made up 18% of cases
with narratives but only 2% of those without.
*Air traffic control problems made up 24% of the primary problems incases selected for narratives, compared to 3% of cases not selected.
The second set of comparison data that reflected the influence ofcase selection on the cases chosen for detailed entry was the
comparison of 1985 vs 1987 cases -- since all cases were described in
narratives in 1985, but only selected cases were described in 1987.
In light of the data in Table 2 on the 1988 cases, the differences
between the 1985 and 1987 samples (Table 3) are not surprising:
*Altitude deviations made up 4% of the cases in the 1985 Sample, but
only 17% in the 1987 Sample.
*Equipment problems were more common among the 1987 Sample than in
the 1985 Sample.
*Runway transgressions were more common in the 1987 Sample. (In 1988,on the other hand, runway cases appeared in similar proportions incases with and without narratives. Therefore it is surprising that
they appeared to be over represented in the 1987 narrative cases; the
difference may result from small numbers.)
6

FACTORS CONTRIBUTING TO ANOMALIES
Table 4 shows the distribution of the primary factor listed in each
sample. As would be expected, fatigue was the primary factor in 81%of the cases in the Fatigue Set. Only 2% of cases in the 1987 sample
were categorized with fatigue as the primary factor, compared to 6%in 1985, suggesting that the selection factors that influenced whichof the 1987 cases were chosen for detailed ("Short Form") reports
operated to reduce the chance of selecting a case in which crew
fatigue was a factor.
Communication and distraction were especially prominent factors in
the 1985 Sample, compared to the other two samples. Altitudedeviations made up half of this sample, and were disproportionately
attributed to distractions (Table 5): distraction was the primary
factor in 31% of (26/83) ?f all altitude deviations compared to 11%
(10/94) of other cases (X_ = 11.6, p < 0.01). It should be
emphasized that this finding is for the 1985 sample, which is the
most representative of the three samples.
All cases in which fatigue was coded as the primary factor were
further subdivided as to the apparent cause of the fatigue (Table 6).
Although the numbers are small, they indicate that flight time/duty
time and end-of-day tiredness were the major factors.
Table 7 shows the percentage of cases in which fatigue was coded as
any of the contributing factors, in relation to the anomaly.
TIME OF DAY
Late night hours were over-represented in the fatigue set. The
national sample of operations showed that 2% of all operations occur
at night between 0000 and 0559 hours. In contrast, 13% of the cases
in the Fatigue Set (12 out of 93) occurred during this period (p <
0.01). Fatigue cases were also slightly more likely to occur in the
evening (1800-2359 hours) than were cases in general (Table 8).
Disproportionately, the anomalies in the 12 late night fatigue caseswere deviations. Seven of the 12 cases (58%) that occurred at night
were either altitude, track, or heading deviations. In contrast,
only 37% of al_ cases in the fatigue set (34 out of 93) weredeviations (X = 2.8, p = 0.i reflecting only borderline
significance).
When all cases from the three sets were combined, those cases in
which fatigue was noted as a contributing factor (not necessarily the
primary factor), cases in the late night and evening hours were
especially likely to involve fatigue (67% and 39%, respectively,
compared to 20% in the daytime) (Table 9).
Runway transgressions seemed to occur disproportionately in the
7

evening, in both the fatigue set and the 1987 sample. In the fatigue
set, 40% of the runway transgressions (4/10) occurred between 1800and 2359 hours, and in the 1987 sample, 60% (6/10). For the three
samples combined, 43% of all runway transgressions occurred in theevening, compared to 23% for all anomalles combined. (X = 5.4, p <
o.o25)
TYPE OF AIRCRAFT
Fatigue was most likely to be a factor in smaller aircraft (i.e.,
small, light, and medium transport aircraft, with gross takeoff
weights of 5,000 - 60,000 ibs) (Table i0). Forty percent of allaircraft in the Fatigue Set (37/93) were smaller aircraft, compared
with 14% of aircraft in the 1985 Sample (believed to be the most
representative of the three samples). The relationship was also
apparent within the 1985 sample, in which 45% (5/11) of the cases inwhich fatigue was listed as the first factor were smaller aircraft,
compared with 14% of all the cases in this sample (X2= 10.2, p <
0.01). The 1987 Sample had too few (only 3) fatigue-related cases
for a corresponding analysis.
Although some of the numbers involved are small, the finding isconsistent with the workload and taxing schedules of pilots of
commuter aircraft, and suggest the need for further investigation.
8

PART IZ: PZLOT DEVI_TZON8 AND ZNCIDENT8
METHOD8 AND MATERIAL8
Pilot Deviations: Computerized data on pilot deviations were
provided by the FAA for the years 1985-87. Data for 1985 were
incomplete because the data system was not fully implemented until
the latter half of 1985; therefore, analyses were based on 1986-87
data. Variables used in the analyses included hour of the day, typeof deviation, phase of flight, and pilot age. Air carriers and
commuters were combined for purposes of calculating rates, since thenumber of operations (the denominator) were determined for allscheduled carriers.
Incidents: Tabulations of pilot-induced incidents for 1984-86
were provided by the FAA. These were examined for relationships bytime of day, flight phase, and pilot age.
Operations: Denominator data for calculating rates were derived
from raw data provided by the FAA: the numbers of arrivals and
departures during each hour of the day for 38 major airports. From
the list we selected the 35 busiest airports in the contiguous United
States. For these 35 airports, the number of commercial departures
on an average day in January, 1986, ranged from 163 at FortLauderdale to about ii00 at Atlanta and O'Hare.
Samples were drawn from each of two one-week periods that beganJanuary 16 and July 15, 1986. The sample included, for each of the
35 airports, all arrivals during one day during each period and all
departures during another day from each period. Thus, for eachairport, data were used from four different days. The seven days of
the week were equally represented. Time was converted from GMT to
local time and the numbers were entered into a computer for summationand analyses.
The sample contained 56,298 scheduled operations (arrivals and
departures). There were 33,934,000 scheduled operations nationwide
in 1986-87 by U.S. airlines and commuters; therefore each operation
in the sample was multiplied by 602.8 (33,934,000 divided by 56,298)
to provide an estimate of the number of operations in the United
States at each hour of the day.
RESULTS
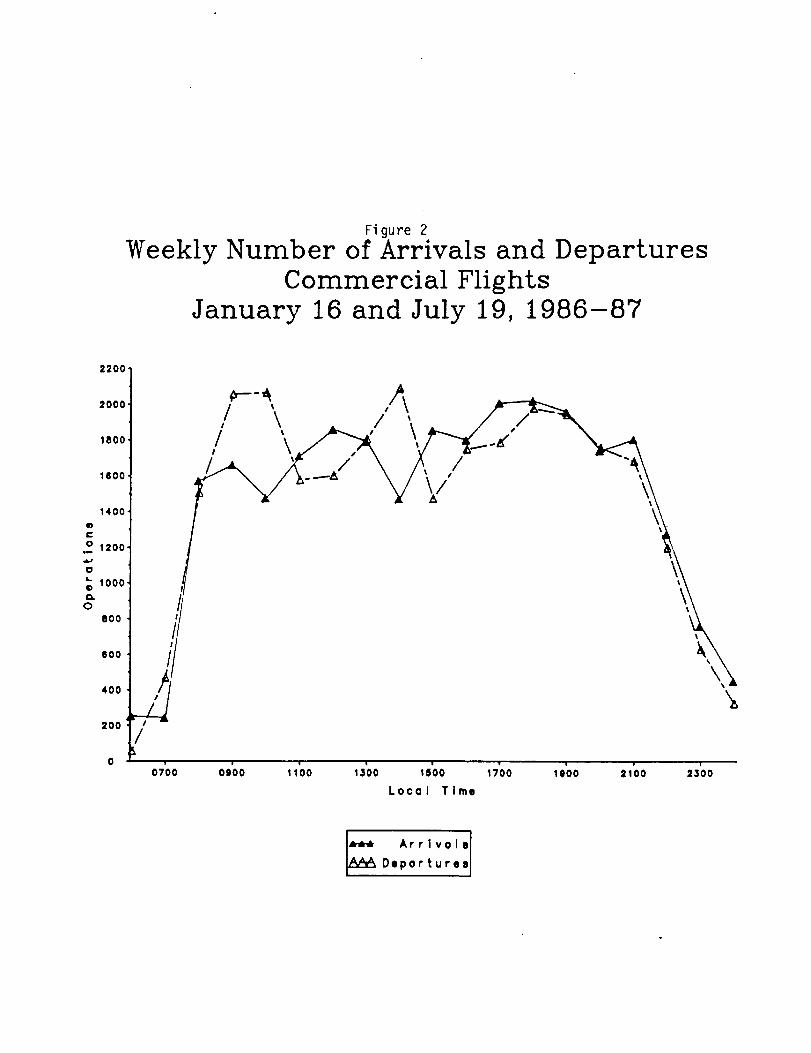
Operations. The number of operations was 6% larger in July than
in January, but the two distributions did not differ markedly; both
showed a peak at 1800 hours, with slightly lower peaks at 0800 and
1300 (Figure I). Departures differed from arrivals primarily in the
larger numbers during the two-hour period beginning at 0800 and also
9
at 1400; both showed a peak at about 1800 hours (Figure 2).
Pilot deviations: (Note: many of the following findings have
not been confirmed by 1988 data; until further analyses are done,
they should be regarded as tentative and possibly the result ofchance variations associated with small numbers.)
There were 820 pilot deviations in 1986-87, and the time of day
was recorded for 757 (91%). The temporal distribution for pilot
deviations differed markedly from the distribution of operations. In
comparison with the number of operations, there were more pilotdeviations than would have been expected from about 0600 to 1600
hours, and fewer than expected from about 1800 to midnight (Table
11).
These differences are reflected in the overall rates of pilot
deviations, which declined through the day from about 24 per million
operations at 0600-0759 to 15 per million at 1800-midnight, with a
pronounced peak at 1400-1559 (Figure 3).
The rate for altitude deviations showed a pronounced peak for
1400-1559 hours (Figure 4). The rate of runway transgressions, on the
other hand, was high in the early morning and declined during the
day, rising somewhat in the evening.
For all hours and all types of pilot deviations combined, the
rate was 19.7 deviations per million operations. During the late
night hours, between midnight and 0559, the rate was 18.8,essentially the same as for all other hours combined. The rate forthese hours is not shown on the Figures because it was calculated for
a 6-hour period (rather than two-hour intervals) due to the small
numbers (only 15 deviations occurred in the 6-hour period.
No relationship was found between pilot age and phase of flight.
Correlations between pilot age and time of day appeared likely to be
related to seniority -- i.e., older pilots were less likely to be
involved in cases at night or before 0800, and more likely to be
involved at the hours likely to be chosen by senior pilots, between0800 and 1600.
Incidents: Data were provided for 731 'pilot-induced' incidents
during 1984-1986. About half were due to either altitude deviations
(30%) or failure to follow approved procedures or instructions (17%).This file has since been changed to eliminate the pilot deviations,
so the two files no longer overlap. Until 1985, this was the only
source of information on pilot deviations. While we consider the
more recent, and larger, body of data on pilot deviations to be more
relevant, the review of the incident data tabulations is included
because it was specified in our proposal.
The rate per million operations was highest from 0600-0959, then
decreased, then had an intermediate 'peak' from 1200-1559 (Figure 5).
i0

As in the case of pilot deviations, the number of incidents between
midnight and 0559 was close to the average rate for all hourscombined.
There appeared to be a correlation between pilot age and phase
of flight, with pilots age 46-55 especially apt to be involved in
climb-to-cruise cases and pilots age 56+ over-involved in descents.
Since the pilot deviation cases showed no such relationship, it is
likely that the finding in this data set was spurious.
COMMENT
Several general conclusions are suggested by these analyses ofdata from NASA's ASRS file and the FAA.
i. Although the numbers are small, the pilot deviation data
from FAA suggest that there are marked variations in rates ofdeviations, in relation to time of day. These variations cannot be
studied when data are presented in 6-hour periods. Hour of the day
(at least the first two digits of local military time) should be made
a part of ASRS records. If this cannot be accomplished in thepresent system without compromising anonymity, it would be possible
to create two ASRS files -- one including hour of the day but not
airport facility or state, and the other including such geographic
data but not hour of the day. Because of the large numbers of casesin the ASRS file and the information available in the narratives, it
would be an ideal -- and perhaps the only -- source of good data on
some of the specific things happening at various times of day.
2. Because of the selection factors that influence the choice
of ASRS records for detailed investigation ('short form'), with
narratives, it is difficult to interpret data based on cases based on
these investigations. Consideration should be given to routinely
doing a detailed form for a sample of cases -- perhaps everyhundredth case -- so that it will always be possible to know what the
universe of cases looks like, rather than just the most interesting
ones.
3. One finding that is not surprising nevertheless merits
further attention: the relationship between fatigue and smaller
aircraft suggests the need for attention to the demanding tasks and
schedules of commuter pilots.
ii

!*/
lo
o
•
•
o
•
.
REFERENCES
Foushee, H.E., Lauber, J.K., Baetge, M.M., and Acomb, D.B. Crew
Factors in Flight Operations III: The Operational Significance
of Exposure to Short-haul Air Transport Operations. NASATechnical Memorandum 88322.
Lyman, E.G., and Orlady, H.W. Fatigue and Associated
Performance Decrements in Air Transport Operations. NASA
Contract NAS2-10060, 1980.
Borowsky, M.S., and Wall, R. Naval Aviation Mishaps and
Fatigue. Aviation Space and Environment Medicine 54:535-538,1983.
Mitler, M. Catastrophes, Sleep and Public Policy:
Report. _/_ ii:I00, 1988.
Consensus
Graeber, R.C. Aircrew Fatigue and Circadian Rhythmicity. In E.
Wiener and D.C. Nagel (Eds.), Human Factors in Aviation, NewYork: Academic Press, 1987
Gander, P.H., Graeber, R.C., Foushee, H.C., et al. Crew Factors
in Flight Operations II. Psych•physiological Responses to Short
Haul Air Transport Operations. NASA Technical Memorandum, 1987.
Insurance Institute for Highway Safety, Double-Trailer Trucks
More Than Double Danger on Highways. Status Repo_: 22:1:1,3,1987.
Acknowledgements:
Robert Dodd reviewed each of the ASRS reports and assigned factor
codes• Daniel Webster produced the graphs. They and Jean Langlois
collaborated in the computer analysis of the various data files.
Candy Taylor typed the tables. Their assistance is greatlyappreciated.
12

Table 1
Factors
NASA ASRS REPORT CODING KEY
Revised 3/6/89
Distraction
DU - Unknown
DI - Inoperative aircraft system
DC - Communication difficulty
DA - ATC anomaly
DT - Conflict
DX - Weather
DK - Workload
DZ - Interruption
DP - Cockpit confusion
DO - Other
# coded as Ist Factor
Fatigue 1985 1987
set sample
1 1 0
0 5 0
0 3 2
0 1 0
0 4 2
0 3 3
0 ii 7
0 3 2
0 3 0
1 2 1
Communication
CU - Unknown
CI - Inattention, pilot or controller
CC - Technique, controller
CM - Misunderstood clearance or readback
CB - Between flightdeck crewmembers
CO - Other
0 0 1
0 3 1
0 7 2
3 22 9
3 1 1
0 7 4
Fatique
FF - Flight time/duty time.
FS - Sleep lack
FW - Workload
FE - End of Day
FU - Unknown
FO - Other
Table 1 (cont.)
# coded as ist Factor
Fatigue 1985 1987
set _ample sample
32 6 1
8 1 0
7 0 1
14 3 1
12 1 0
2 0 0
Mal_unction
MU - Unknown
MI - Inoperative autopilot system
ML - MEL item
ME - Engine, or engine component failure
MR - Radios
MN - Navigation radios or component
MH - Altimeters
MO - Other
0 0 2
0 9 5
0 1 1
0 0 5
0 0 1
0 1 1
0 0 3
0 6 8
Error
ER - Setting radios
EN - Navigation
EI - Inattention, crew
EM - Failure to monitor
EC - Controller
EH - Setting Altimeters
EO - Other
3 5 1
0 6 5
2 22 16
1 7 5
2 14 33
0 0 0
2 3 i0

See, Failure To
SV - Poor Visibility
SM - Failure to monitor
SU - Unknown
Table 1 (cont.)
# coded as ist Factor
Fatigue 1985 1987
set sample sample
0 2 1
0 0 1
0 3 2
o_her
RS - Safety Report, General
RT - Training Report
UN - Unknown or no contributing factors
OT - Other
NA - Not Applicable
No Factor Coded
Total
0 4 2
0 1 0
0 1 1
0 4 3
0 1 0
93 177 148

Table 2
Summary of Major Differences Between Abbreviated and Short Forms
(Cases entered in ASRS data base 1/1/88 - 10/7/88)
Type of Anomaly
Altitude/hdg deviation
Non-adherence reqmt/clnc
Conflict (all categories)
Acft equip problem
Less than legal sep
% Qf Abbreviated
(no narrative)
% of Short Forms
(with narrative)
35.2 12.2
24.5 10.2
1.8 17.7
3.4 8.8
0.6 7.2
Type of All Traffic Incident
Pilot deviation
Emergency
NMAC
Operational deviation of error
75.6 35.8
0.0 6.1
0.0 9.4
0.0 16.1
Type of Primary Problem
Flight Crew
Aircraft
AirportAir Traffic Control
81.5 48.4
2.2 12.5
0.7 3.9
3.0 24.2
Type of Reporter
Flight crew
Controller
99.4 87.7
0.3 10.9
Time of Occurrence
0001-0600 1.9 2.4
For detailed tables from which this summary was derived see Appendix A.

Table 3
Anomalies in ASRS Reports
Percent Distribution
Fatigue Set 1985 Sample 1987 Sample
(N=93) (N=177) (N=148)
Alt. Deviation 22 47 17
Track/Hdg Dev 15 i0 i0
Non Adherence 5 5 3
Conflict 12 17 24
Rwy Trans II 2 7
Weather 1 2 4
Equipment 3 5 ii
Other 31 13 24
Total 100% 101% 100%

Table 4Primary Contributing Factor in ASRS Cases
Percent Distribution
Fatigue Sample 1985 Sample 1987 Sample
(N=93) (N=177) (N=148)
Communication 6 23 12
Distraction 2 20 12
Error ii 32 47
Fatigue 81 6 2
Malfunction 0 i0 18
Other ___ 9
100% 100% 100%

Table 5
Anomaly by Primary Contributing Factor
1985 Sample of ASRS Data
corn Dis Err Fat Mal Oth Total
Alt. Deviation 17 26 26 5 9 0 83
Track/Hdg Dev 5 3 8 1 1 0 18
Non Adherence 4 1 0 3 0 0 8
Conflict 4 4 13 1 0 8 30
Rwy Trans 0 0 3 0 0 0 3
Weather 2 0 1 0 0 1 4
Equipment 0 1 1 0 6 0 8
Other 8 _!i 5 _!I _! _/7 23
Total 40 36 57 ii 17 16 177
Key: Com = Communication, Dis = Distraction, Err = Error,
Fat = Fatigue, Mal = Malfunction, Oth = Other
Table 6Cause of Fatigue in Cases where Fatigue was Primary Factor
ASRS Data
Fatiuue Set
(N=75) (N=II)
_987 Sample
(N=3)
Cause of Fatique
Flight/duty time 43 55 33
Sleep lack ii 9 0
Workload 9 0 33
End of day 19 27 33
Unknown/other 19 _ 0
Total 101% 100% 99%
NOTE: For each data set the table includes only the cases in which
fatigue was coded as the primary factor. These percents are based on
very small numbers; they are converted to percentages only for the
purposes of comparison.

Anomalv
Alt. Deviation
Track/Hdg Dev.
Non Adherence
Conflict
Rwy Trans.
Weather
Equipment
Other
Total
Table 7
Fatigue Coded as Any Contributory Factor
Proportion of Cases
ASRS Data
1985 Sample 1987 Sample
(N=177) (N=148)
7/83 1/25
2/18 2/13
3/8 0/4
1/30 2/36
o/3 1/9
0/4 0/6
0/8 0/16
1/23 2_./36
14/177 8/145

Fatigue Set
(N=93)
Table 8
Time of Day
Percent Distribution
ASRS Data
1985 Sample
(N=173.)1987 Sample
(N=145.*)
Operations
Sample
(N=56,298)
* excludes 4 cases, time unknown
** excludes 3 cases, time unknown
Time
0000-0559 13 1 1 2
0600-1159 27 31 35 32
1200-1759 29 47 42 39
1800-2359 31 21 22 28
lOO% lOO% lOO% lOI%
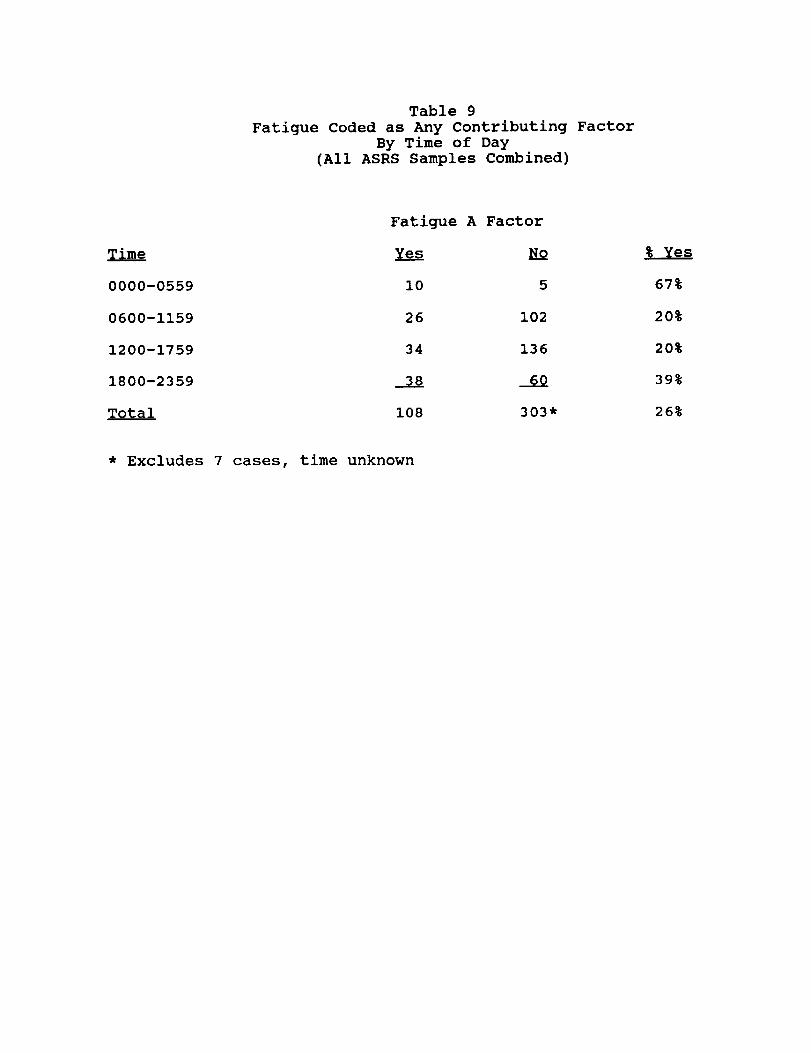
Table 9
Fatigue Coded as Any Contributing Factor
By Time of Day
(All ASRS Samples Combined)
Time
0000-0559
0600-1159
1200-1759
1800-2359
Total
Fatigue A Factor
Yes No LXes
i0 5 67%
26 102 20%
34 136 20%
38 60 39%
108 303* 26%
* Excludes 7 cases, time unknown
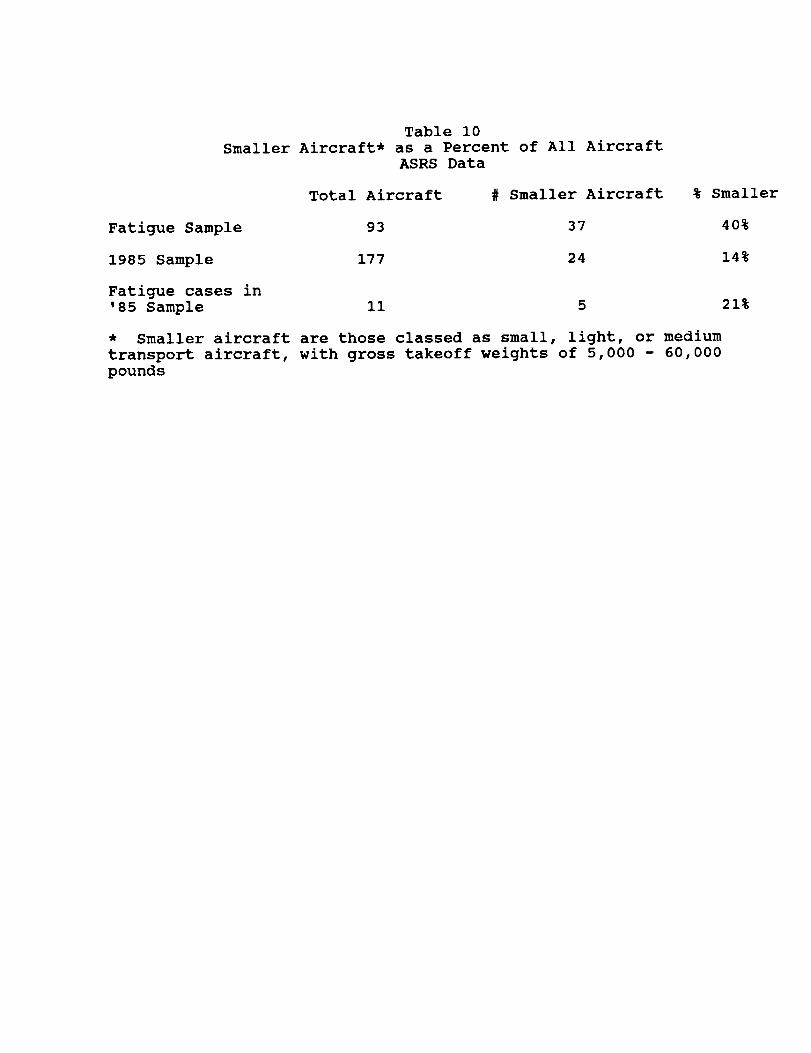
Table I0Smaller Aircraft* as a Percent of All Aircraft
ASRS Data
Fatigue Sample
1985 Sample
Fatigue cases in
'85 Sample
Total Aircraft # Smaller Aircraft
93 37
177 24
% Smaller
40%
14%
Ii 5 21%
* Smaller aircraft are those classed as small, light, or medium
transport aircraft, with gross takeoff weights of 5,000 - 60,000
pounds

Operations and PilotTable iiDeviations by Time of Day
Reported AnnualOperations Pilot Rate per
Per Year Deviations Million1986-1987 Operations
Time
0000-0559 399,000 15
0600-0759 1,294,000 62
0800-0959 2,477,000 106
1000-1159 2,303,000 103
1200-1359 2,441,000 99
1400-1559 2,344,000 110
1600-1759 2,656,000 i00
1800-1959 2,520,000 79
2000-2159 2,029,000 61
2200-2359 735,000 22
Total 19,200,000 757
18.8
23.9
21.4
22.4
20.3
23.5
18.8
15.7
15.0
15.0
19.7
Raw data supplied by the Federal Aviation Administration

Fi gure I
Weekly Number of Commercial
January 16 and July 19,
Operations1986
2200]
2000 1
1800, I •
600
4O0
2O0
\
0700 oo_o ,,_0 ,;oo _5'oo
Locol Time
JAN. 16IJULY 19
Fi gure 2
Weekly Number of Arrivals and DeparturesCommercial Flights
January 16 and July 19, 1986-87
2200"
2000
1800
1600
600
4OO
2OO
/
0700 'o ' ' ' 'o ' 'o '06 0 1100 1300 1500 17 0 I000 21 0 23oo
Locol Time
Deporture

Figure 3
Pilot Deviation Rate by Hour of Day
Air Carriers and Commuters, 1986-87
24,
mco 22
u_
k,.
0
co
-- 18
e
if)
" 14o
o
>12ID
0
10
m
'o ' ' 'o ' 'o ' " 'o07 0 0800 1100 13 0 1500 17 0 1900 9100 23 0
Locol Time

Figure 4
Pilot Deviation Rate by Hour of Day
Altitude and Runway DeviationsAir Carriers and Commuters, 1986-87
18
leW
r
O
.4.,14O
&_
e-
o
4_
8
a.
m 6t-
o
o_
6
02
A
07'00 09'00 1''00 13'00 '5'00 17'00 19'00 2"00 23'00
Locol Time
ALTITUDE DEVIATION IRUNWAY DEVIATION

Figure 5
Rate of Pilot-Induced Incidents
By Hour of Day
24-
m
c 22o
m
_ 2Oo.
O
C
o 18
16
m
.*.,14C
IP
,-12
10 v w !07'o0 o,'oo ,,oo ,_'oo .'oo 17oo 1,oo =,'oo _'ooLocol Time

Appendix A
TABLE i. Anomaly Breakdown by Type of Coding Form**
TYDe of Kuomalv Abbreviated Forms Short Forms# % # %
Acft Equipment Problem/Critical 2 0.0
Acft Equipment Problem/Less Severe 51 3.4
Alt Dev/Excursion from Assigned 785 5.1
Alt Dev/Overshoot on Clb or Des 2431 15.9
Alt Dev/Undershoot on Clb or Des 382 2.5
Alt Dev/Xing Restriction Not Met
Alt-Hdg Rule Deviation
Conflict/Airborne Less Severe
Conflict/Ground Critical
Conflict/Ground Less Severe
619 4.1
13 0.I
245 1.6
3 0.0
32 0.2
Conflict/Nmac ---Controlled Flt Toward Terrain 1
Erroneous Penetration of Exit Airspace 508
In-Flt Encounter/Other 15
In-Flt Encounter/Wx 299
Less than Legal Separation
Loss of Acft Control
No Specific Anomaly Occurred
Non Adherence Legal Rqmt/Clnc
Non Adherence Legal Rqmt/FAR
167 4.2
185 4.6
86 2.1
148 3.7
22 0.5
53 1.3
14 0.3
347 8.6
72 1.8
72 1.8
--- 221 5.5
0.0 34 0.8
3.3 162 4.0
0.i 20 0.5
2.0 116 2.9
84 0.6 288 7.2
...... 57 1.4
329 2.2 62 1.5
3747 24.5 412 10.2
1059 6.9 345 8.6
Non Adherence Legal Rqmt/Other 69 0.5 37 0.9
Non Adherence Legal Rqmt/Published Proc 485 3.2 154 3.8
Other 1728 11.3 554 13.8
Rwy or Txwy Excursion 34 0.2 24 0.6
Rwy Transgress/Other 225 1.7 115 2.9
Rwy Transgress/Unauth Lndg 252 1.7 23 0.6
Speed Deviation 167 i.i 13 0.3
Track of Hdg Deviation 1138 7.5 174 4.3
Unctrl Arpt Traffic Pattern Deviation 29 0.2 33 0.8Vfr in Imc 36 0.2 14 0.3
Total* 15263 i00.i 4024 99.8
*A single report may record more than one anomaly
** Covers those reports entered in the ASRS database between January i, and
October 7, 1988.

Appendix ATABLE 2. Air Traffic Incident Breakdown by Type of Coding Form**
TTPe of Air Traffic Incident Abbreviated Forms Short Forms
# % # %
Ambiguous (AMB) 672
Emergency (EMER) 1
Flight Assistance (FLTASSIST) ---
Interfacility Coordination (INTERCOORD) 22
Intrafacility Coordination (INTRACOORD) 6
Military Facility Deviation (MILFACDEV) ---
Miscellaneous (MISC) 997
Near Midair Collision (NMAC) ---
NONE 150
Operational Deviation (OPDEV) 3
Operational Error (OPERROR) 1
Pilot Deviation (PLTDEV) 5775
Entered Military Airspace (SPILLIN) 8
Exited Military Airspace (SPILLOUT) 3
8.8 47 2.0
0.0 142 6.1
0.3 6 0.3
0.0 45 1.9
0.i 34 1.5
0.0 1 0.0
13.1 588 25.3
--- 219 9.4
2.0 26 I.i
0.0 II0 4.7
0.0 266 11.4
75.6 833 35.8
0.i 4 0.2
0.0 4 0.2
Total* 7638 I00.0
*A single report may record more than one type
2325 99.9

Appendix ATABLE 3. Primary Problem Breakdown by Type of Coding Form*
Type of p_imar7 Problem Abbreviated Forms _hort Forms# % # %
Aircraft (ACFT) 166
Ambiguous (AMB) 708
Airport (ARPT) 52
Air Traffic Control (ATC) 225
Flight Crew (FLC) 6048
Navigational Aid (NAV) 18
Other (OTH) 93
Publication (PUB) ii
Weather (WX) i00
2.2 247 12.5
9.5 86 4.4
0.7 78 3.9
3.0 479 24.2
81.5 957 48.4
0.2 ii 0.6
1.3 59 3.0
0.I 13 0.7
1.3 47 2.4
Total 7421 99.8 1977 i00.i
** Covers those reports entered in the ASRS database between
January 1, 1988 and October 7, 1988.
Appendix A
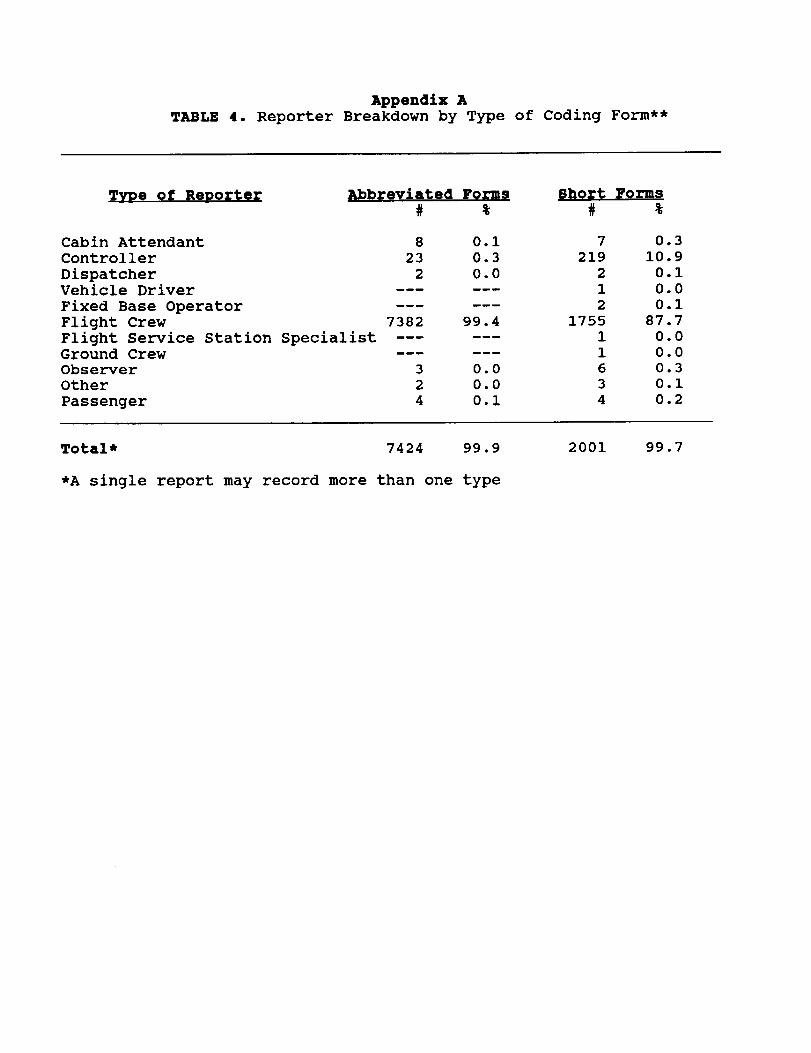
TABLE 4. Reporter Breakdown by Type of Coding Form**
T__e of Reporter Abbreviated Forms Short Forms
# % # %
Cabin Attendant 8 0.i
Controller 23 0.3
Dispatcher 2 0.0
Vehicle Driver ......
Fixed Base Operator ......
Flight Crew 7382 99.4
Flight Service Station Specialist ......
Ground Crew ......
Observer 3 0.0
Other 2 0.0
Passenger 4 0.i
7 0.3
219 10.9
2 0.I
1 0.0
2 0.I
1755 87.7
1 0.0
1 0.0
6 0.3
3 0.i
4 0.2
Total* 7424 99.9
*A single report may record more than one type
2001 99.7

TABLE 5.Appendix A
Time of Occurrence Breakdown by Type of Coding Form*
Time of Occurrence _bbreviated Forms Short Forms
0001-0600 Local Time (1)
0601-1200 Local Time (2)
1201-1800 Local Time (3)
1801-2400 Local Time (4)
144 1.9 47 2.4
2648 35.7 659 33.5
2970 40.0 823 41.9
1656 22.3 437 22.2
Total 7418 99.9 1966 i00.0
**Covers etc.