Embed Size (px)
Citation preview
Izumi MoriPh.D. Candidate in Education Policy Studies
Pennsylvania State University2010/6/5
Supplemental Education in the United States
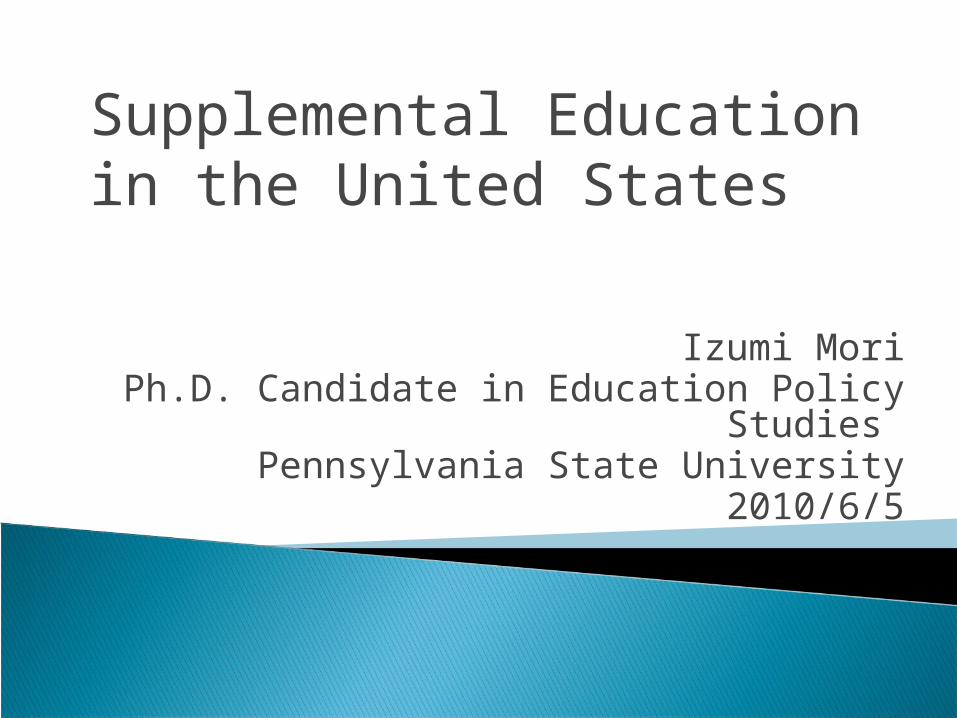
Typical stages: Elementary (1-5th), middle (6-8th), high (9-12th)
The ages for compulsory education vary by state. It begins from ages 5-8 and ends from ages 14-18.
Compulsory requirements can generally be satisfied by educating children in public schools, state-certified private schools, or an approved home school program.

◦ .3 - 4 years old: 52.8◦ .5 - 6 years old: 93.8◦ .7 - 9 years old: 98.3◦ .10 - 13 years old: 98.9◦ .14 - 15 years old: 98.6◦ .16 - 17 years old: 95.2◦ .18 - 19 years old: 66.0◦ .20 - 21 years old: 50.1◦ .22 - 24 years old: 28.2
Source: Current Population Survey 2008
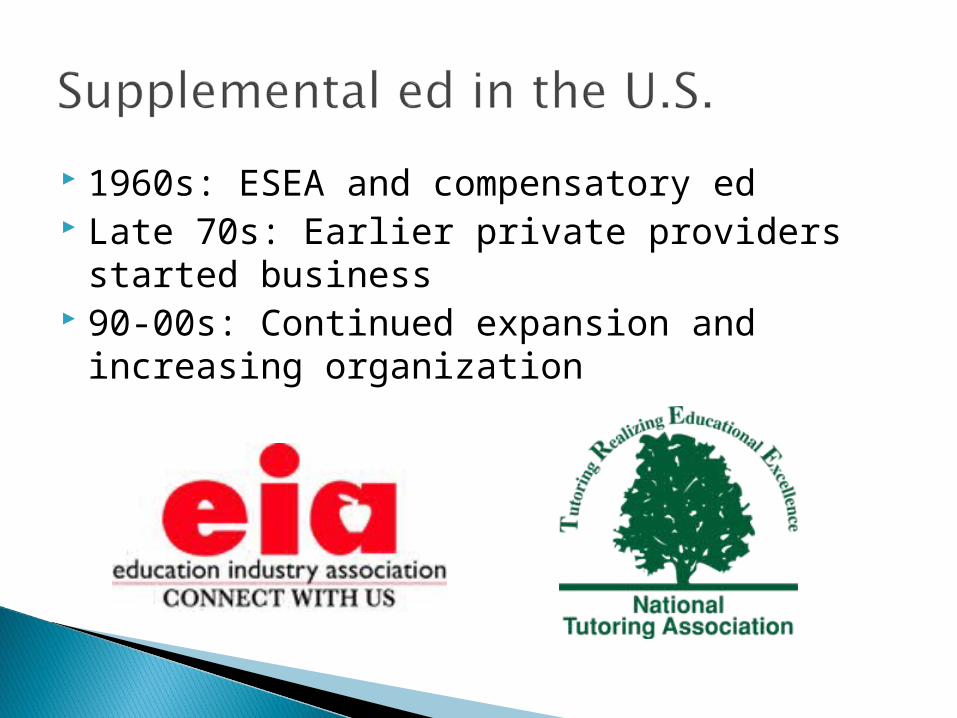
1960s: ESEA and compensatory ed Late 70s: Earlier private providers started
business 90-00s: Continued expansion and increasing
organization

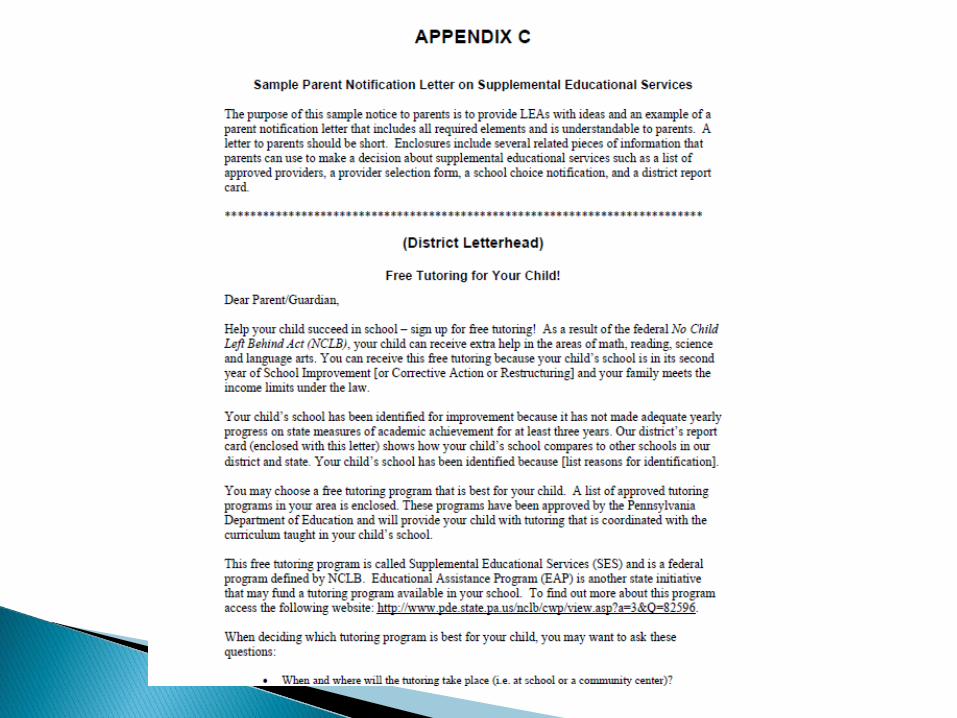
2002-: Districts provide free tutoring for failing schools under the NCLB◦ Federalism + Market-based education (Vergari
2007)◦ Parental choice of state-approved providers◦ Services include tutoring, after-school services
and summer school◦ Services may be provided by: for-profit and
nonprofit organizations, school districts, and faith-based organizations
◦ Districts should spend 20% of their Title I budget◦ Publicly funded, not “private” tutoring?

More African-American and Hispanic students Urban > suburban > rural Students in high poverty > low poverty Elementary > middle & high school
◦ 24-28% of eligible students in gr. 2-5 participate◦ Fewer than 5% of eligible high school students
participated
Source: U.S. Department of Education (2007 & 2009)
Cf. Buchmann et al. (forthcoming) – focus on SAT & college prep
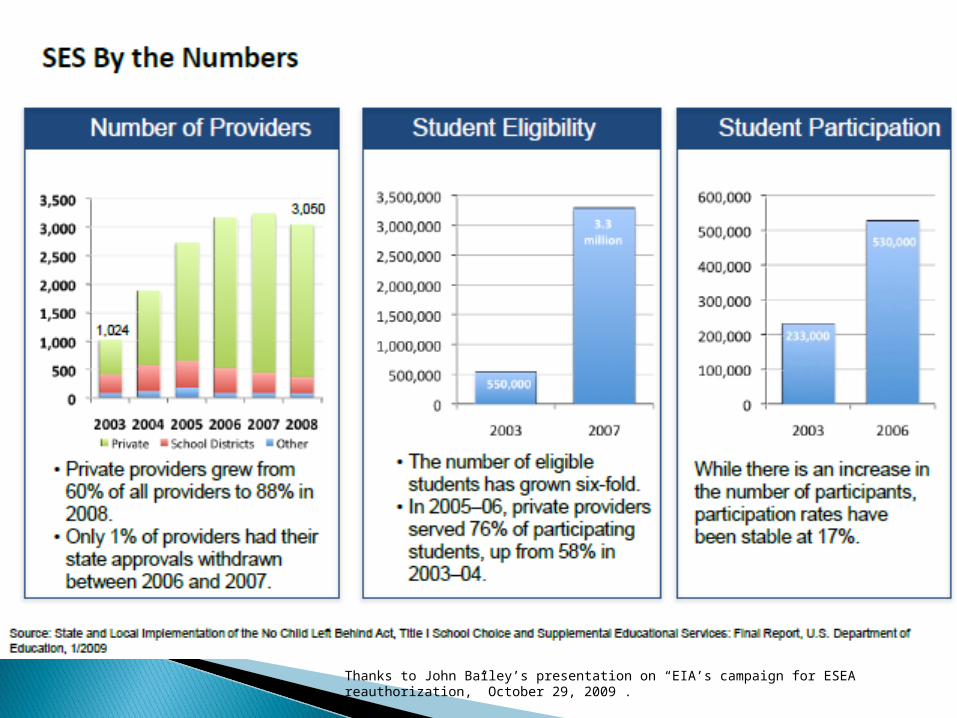
Thanks to John Bailey’s presentation on “EIA’s campaign for ESEA reauthorization,” October 29, 2009 .

Limited effect found Research design need to address causality Farkas (1996)
◦ Focus on teacher quality and one-on-one instruction U.S. Department of Ed (2007)
◦ Sample: 9 school districts◦ Using quasi-experimental difference-in-differences approach ◦ Positive effect on achievement
Munoz, Potter and Ross (2008)◦ Sample: one school district◦ Demographical matching between participants vs. non-
participants (both eligible for tutoring)◦ Non-significant and small effects for those who received
tutoring, both in reading and math

Still lower participation rates Insufficient communication with parents Some principals are against the idea of
“outsourcing” (Koyama 2009)
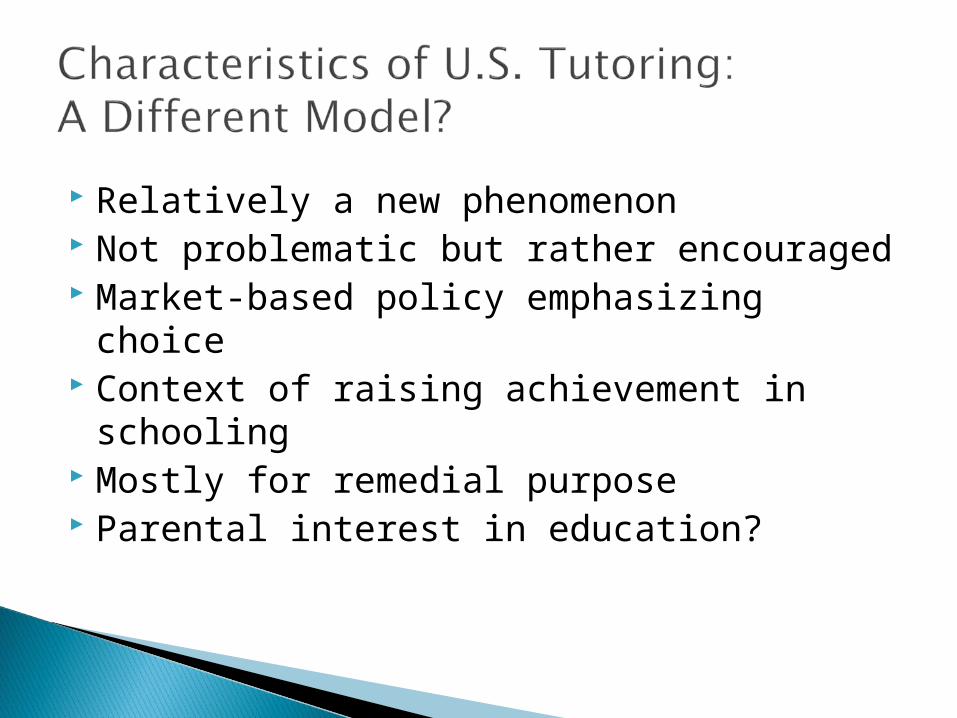
Relatively a new phenomenon Not problematic but rather encouraged Market-based policy emphasizing choice Context of raising achievement in schooling Mostly for remedial purpose Parental interest in education?

Supplemental ed
Schools/Ts
ProvidersParents
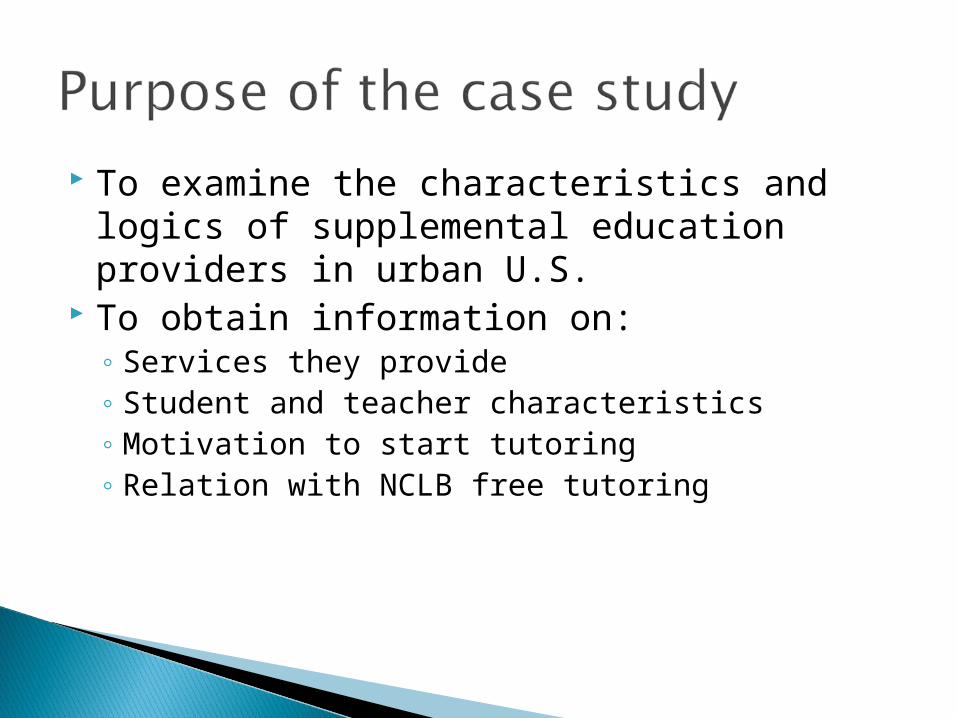
To examine the characteristics and logics of supplemental education providers in urban U.S.
To obtain information on:◦ Services they provide◦ Student and teacher characteristics◦ Motivation to start tutoring◦ Relation with NCLB free tutoring

Philadelphia July 5-8, 2009 Interviews with 5 providers (3 site visits, 2
phone interviews), 15-30 min each Document collection (instructional and
advertizing materials, pictures)


CentersScale ofoperation
Years ofoperation
Age ofmanager
Genderof
Grades
A franchise 20 60 female K-12B individual 43 72 male K-12C individual 3 25 female K-12
D individual 1 27 maleK-12,adults
E franchise 14 40 female K-12

Centers SubjectsTypes ofinstruction
FeeCurrentSchoolTs
NCLBapproved
A all one on one $60/hr Y Y
Breading,math
one on one $28/hr N N
C all one on one $35/hr N N but applying
D all one on one $50/hr YN butconsidering
Emath,reading
one on one,self study
$115/mo N Y but quit
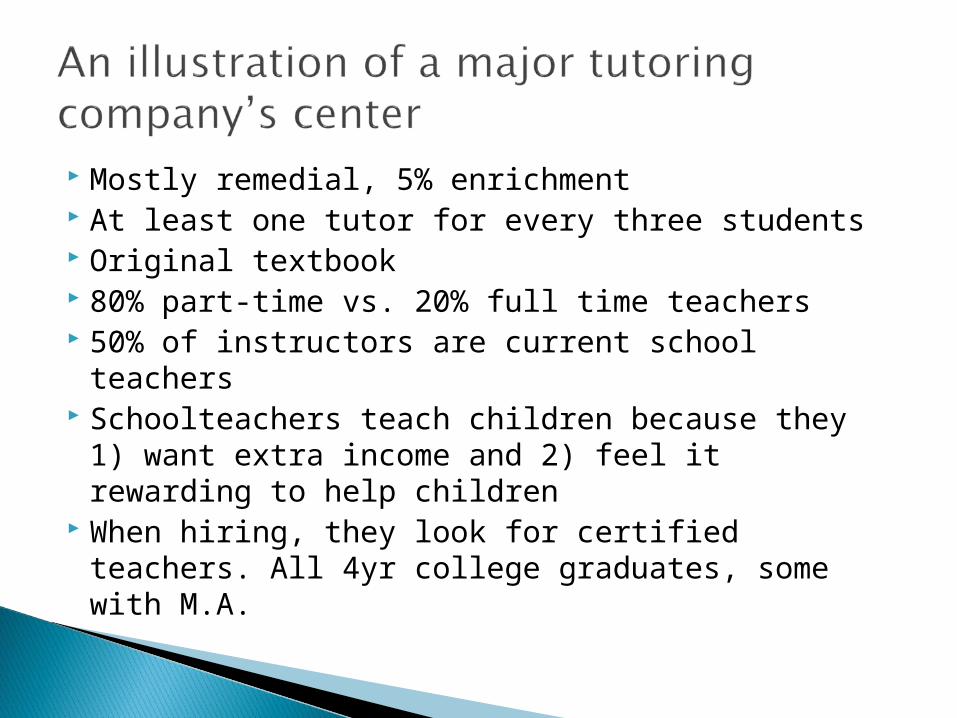
Mostly remedial, 5% enrichment At least one tutor for every three students Original textbook 80% part-time vs. 20% full time teachers 50% of instructors are current school teachers Schoolteachers teach children because they
1) want extra income and 2) feel it rewarding to help children
When hiring, they look for certified teachers. All 4yr college graduates, some with M.A.

Variation in years of operation, fees, and NCLB status
Focus on personalized & remedial instruction
Some school teachers work as tutors Emphasis on “qualified” teachers Teacher referrals Some connections with schools


Examine tutoring in the U.S. from a perspective of parenting
RQ: What are the family characteristics associated with child’s use of tutoring?◦ Does the mechanism differ by race?
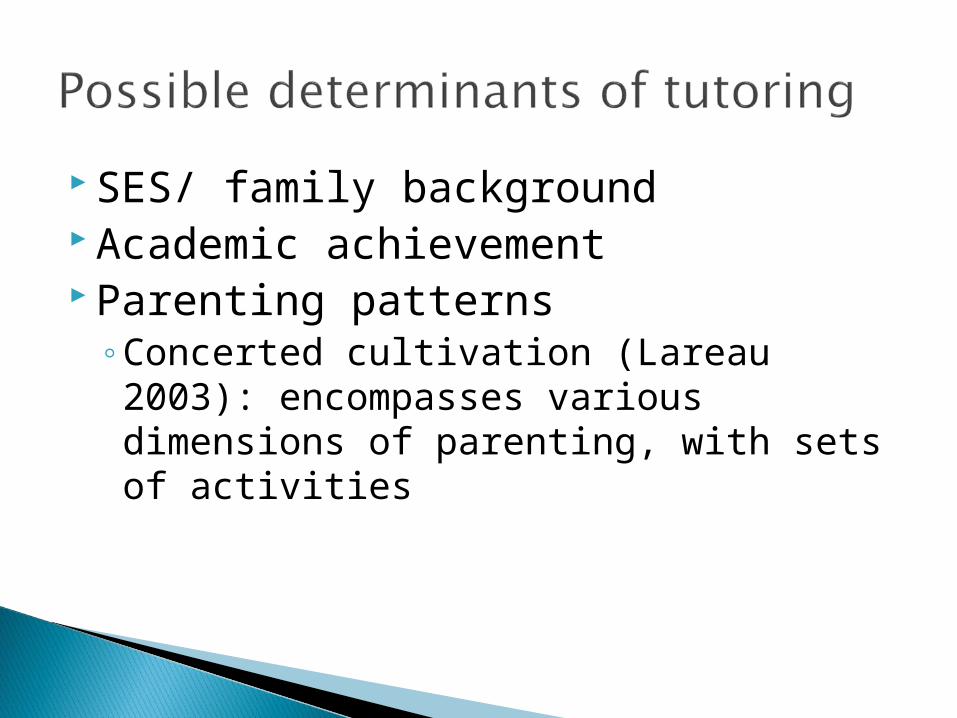
SES/ family background Academic achievement Parenting patterns
◦Concerted cultivation (Lareau 2003): encompasses various dimensions of parenting, with sets of activities

H1: Tutoring is more common among lower income students
H2: Tutoring is more common among lower-achieving students
H3: Tutoring is a part of concerted cultivation
Early Childhood Longitudinal Study Kindergarten Cohort (ECLS-K)
National survey, N =11347 Third grade wave of 2002 Parent questionnaire and child’s test scores

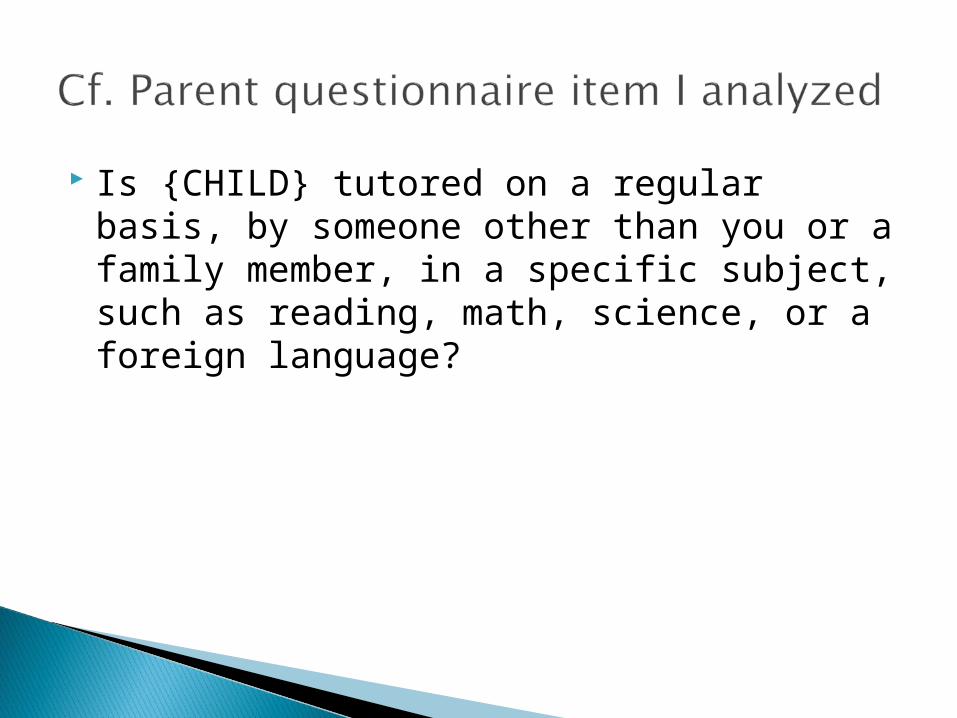
Is {CHILD} tutored on a regular basis, by someone other than you or a family member, in a specific subject, such as reading, math, science, or a foreign language?
Question for parents in the “home environment” section
13.5% (n=1808) answered “Yes.”◦ 9.9% in reading◦ 7.1% in math
Gender Location Family types Race/ ethnicity SES Educational expectation Concerted cultivation Child’s test scores

Parental perceptions of their responsibility (e.g. read, help homework)
Child’s leisure time (e.g. music, sports, library, museum)
School involvement (e.g. P-T conference, event, volunteer)
Number of children’s books at home
Logistic regression
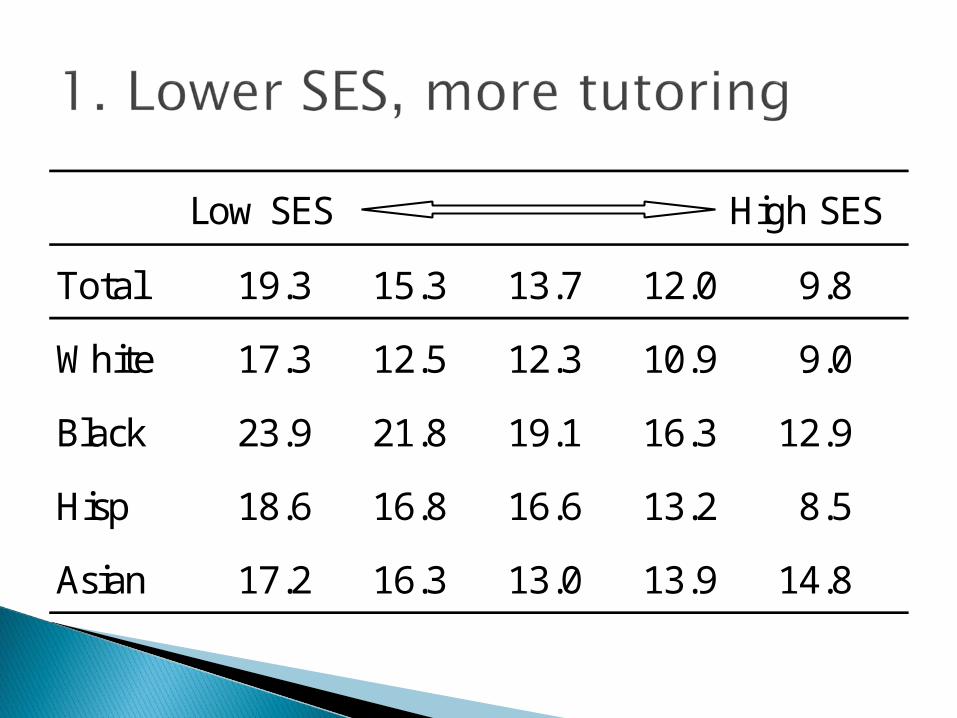
Total 19.3 15.3 13.7 12.0 9.8
White 17.3 12.5 12.3 10.9 9.0
Black 23.9 21.8 19.1 16.3 12.9
Hisp 18.6 16.8 16.6 13.2 8.5
Asian 17.2 16.3 13.0 13.9 14.8
High SESLow SES

Total 27.7 18.6 10.7 7.4 4.4
White 30.6 19.0 9.9 6.3 3.5
Black 29.6 18.5 15.0 10.3 9.0
Hisp 25.5 19.6 8.5 8.8 5.4
Asian 24.1 13.2 15.4 12.2 11.3
Low Score High Score

Model 1 Model 2Female -.15 ** -.13 *Urban .09 .10Rural -.03 -.05Single parent family .20 ** .19 *Other type family .13 .09Black .42 ** .46 **Hispanic .25 ** .33 **Asian .27 * .33 **SES -.24 ** -.17 **Educational expectiation -.16 **Parental responsibilityLeisure activitiesSchool involvementNumbers of books
(Constant) -2.03 -1.43 N 11686 11644Chi square 167.35 201.38

Model 3 Model 4Female -.13 * -.03 Urban .10 ^ .12 ^Rural -.07 -.09Single parent family .17 * .17 *Other type family .08 .08Black .48 ** .24 **Hispanic .38 ** .17 *Asian .42 ** .40 **SES -.22 ** -.01Educational expectiation -.18 ** -.08 **Parental responsibility .07 * .07 *Leisure activities .04 .04School involvement .11 ** .11 **Numbers of books .00 .00 ^Test score -.03 **
(Constant) -1.39 0.88N 11545 11347Chi square 242.59 613.85
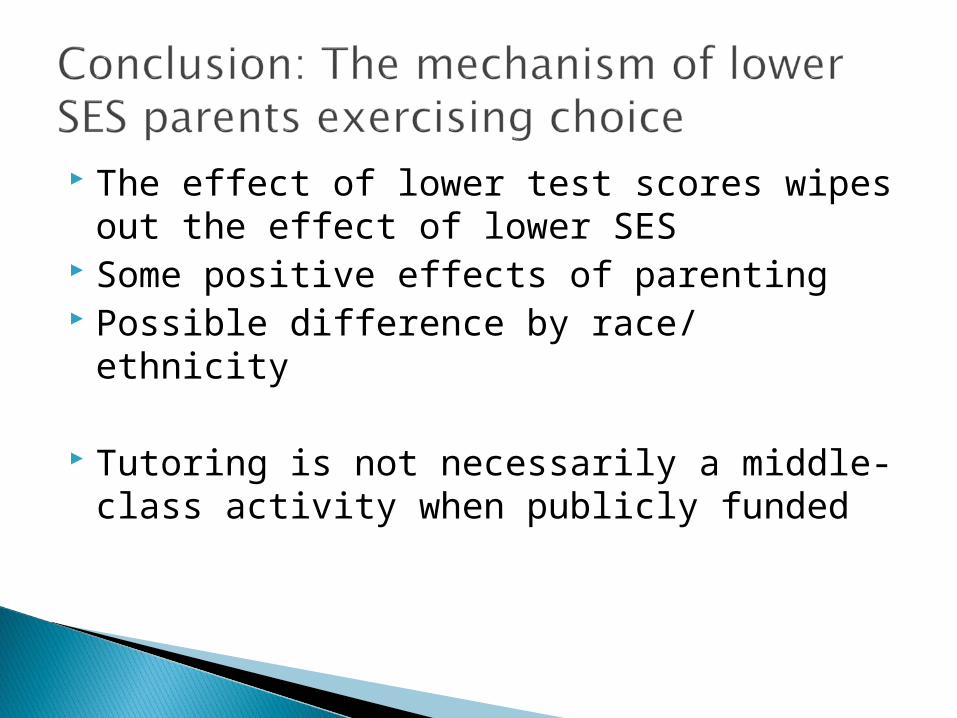
The effect of lower test scores wipes out the effect of lower SES
Some positive effects of parenting Possible difference by race/ ethnicity
Tutoring is not necessarily a middle-class activity when publicly funded
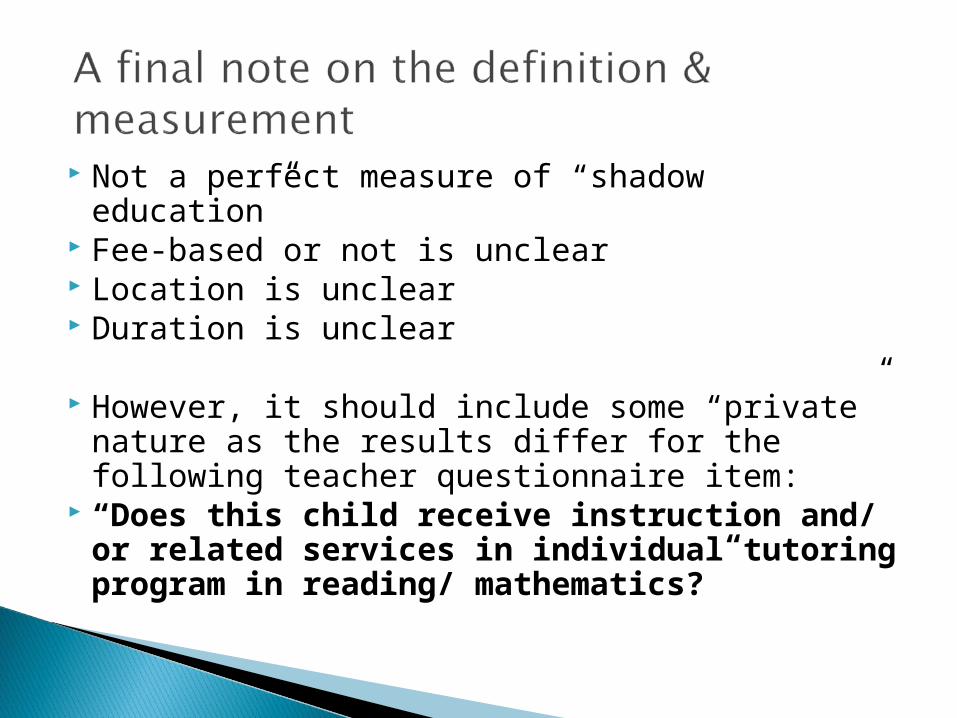
Not a perfect measure of “shadow education” Fee-based or not is unclear Location is unclear Duration is unclear
However, it should include some “private” nature as the results differ for the following teacher questionnaire item:
“Does this child receive instruction and/ or related services in individual tutoring program in reading/ mathematics?”
Is {CHILD} tutored on a regular basis, by someone other than you or a family member, in a specific subject, such as reading, math, science, or a foreign language?