Embed Size (px)
Citation preview
.
.
.
.
.
.
.
.
.
.
.
.
.
.
.
.
.
.
.
.
.
.
.
.
.
.
.
.
.
.
.
.
.
.
.
.
.
.
.
.
.
.
.
.
.
.
.
.
.
.
.
.
.
.
.
.
.
.
.
.
.
.
.
.
.
.
.
.
.
.
.
.
.
.
.
.
.
.
.
.
.
.
.
.
.
.
.
.
.
.
.
.
.
.
.
.
.
.
.
.
.
.
.
.
.
.
.
.
.
.
.
.
Living on a Restless Planet
Solid Earth Science
Working Group
Report
.
.
.
.
.
.
.
.
.
.
.
.
.
.
.
.
.
.
.
.
.
.
.
.
.
.
.
.
.
.
.
.
.
.
.
.
.
.
.
.
.
.
.
.
.
.
.
.
.
.
.
.
.
.
.
.
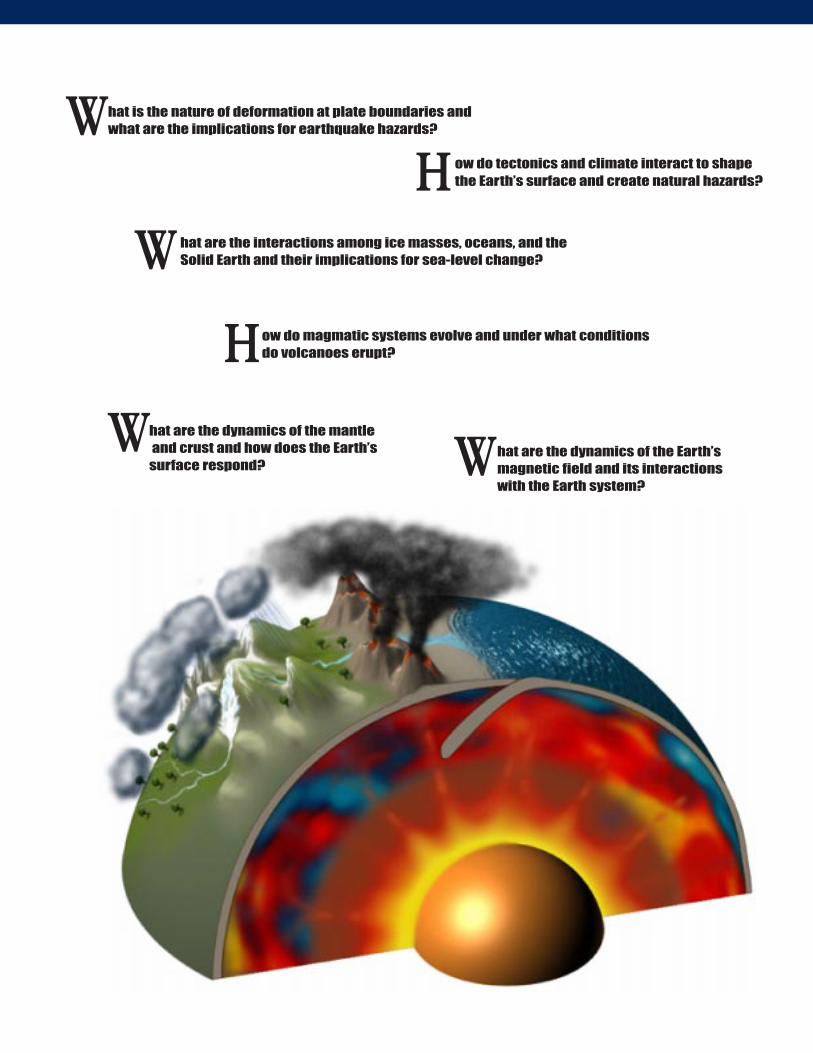
hat is the nature of deformation at plate boundaries andwhat are the implications for earthquake hazards?
ow do tectonics and climate interact to shapethe Earth’s surface and create natural hazards?
hat are the interactions among ice masses, oceans, and theSolid Earth and their implications for sea-level change?
ow do magmatic systems evolve and under what conditionsdo volcanoes erupt?
hat are the dynamics of the mantle and crust and how does the Earth’ssurface respond?
W
W
H
H
W What are the dynamics of the Earth’smagnetic field and its interactionswith the Earth system?
Living on a Restless Planet
Solid Earth Science
Working Group
Report
2002
.
.
.
.
.
.
.
.
.
.
.
.
.
.
.
.
.
.
.
.
.
.
.
.
.
.
.
.
.
.
.
.
.
.
.
.
.
.
.
.
.
.
.
.
.
.
.
.
.
.
.
.
.
.
.
.
Web site: http://solidearth.jpl.nasa.gov
.
.
.
.
.
.
.
.
.
.
.
.
.
.
.
.
.
.
.
.
.
.
.
.
.
.
.
.
.
.
.
.
.
.
.
.
.
.
.
.
.
.
.
.
.
.
.
.
.
.
.
.
.
.
.
.
To the Reader,
The surface of the Earth is where we live. Yet our planet is a restless home, sub-
ject to earthquakes, volcanic eruptions, destructive floods, landslides, and other
natural hazards. The Earth’s surface is always changing, in response to processes
deep in the planet’s interior as well as to a complex suite of interactions among
the solid Earth, atmosphere, oceans, hydrosphere, and biosphere. Understand-
ing these changes poses a deep scientific challenge, but meeting that challenge
can reap enormous practical benefit.
NASA has an opportunity to make key observations that can revolutionize our
ability to characterize, monitor, and forecast changes in our planet’s surface. In
recognition of that opportunity, Dr. Ghassem Asrar, the NASA Associate Admin-
istrator for the Office of Earth Science, appointed a Solid Earth Science Working
Group (SESWG) in the summer of 2000. The SESWG was charged “to guide the
science community in the development of a recommended long-term vision and
strategy for solid-Earth science at NASA.”
In the course of our deliberations, the working group sought the advice of ex-
perts both within NASA and from other organizations. We briefed our scientific
colleagues at two national scientific meetings, and we maintained reports of
our progress on an open Web site to invite comments and suggestions from the
broad scientific community.
This report is the working group’s response to our charge. We hope you agree
that this “long-term vision and strategy for solid-Earth science at NASA” not
only is scientifically compelling but offers the potential to improve humankind’s
ability to thrive on our restless planet.
Sincerely,
Sean C. Solomon
SESWG Chair
2002
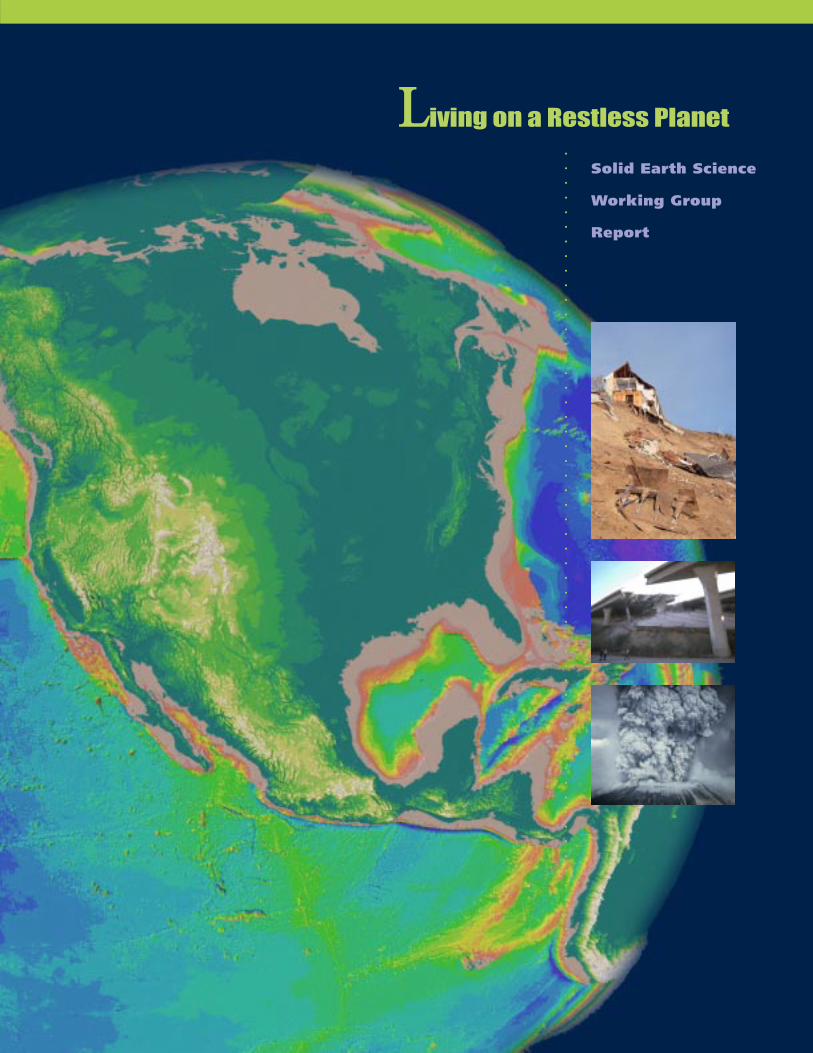
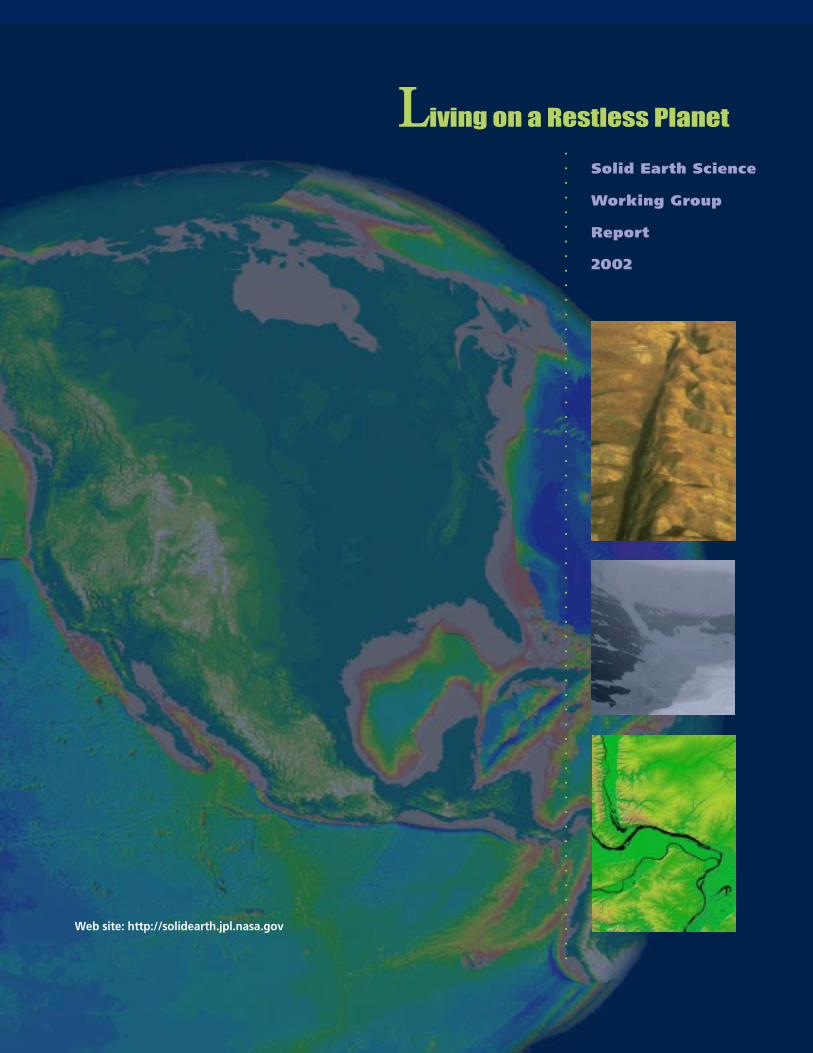
Cover:
Topography of the Earth with the oceans
drained reveals spreading ocean ridges
(East Pacific Rise), subduction zones
(Middle America Trench), and the
transform fault boundary
(San Andreas fault) between the Pacific
and North American plates.
Inset, top to bottom: A landslide that has
destroyed a residential home; a massive
section collapsed from the four-lane I-5
freeway — Northridge earthquake, 1994;
catastrophic eruption of Mount
St. Helens in 1980.
Title page, top to bottom: Aerial view of
the San Andreas fault slicing
through the Carrizo Plain in the
Temblor Range east of the city of San
Luis Obispo, California.
In Ice Fields Parkway, Alberta, Canada,
glacial crevasses (deep cracks in the ice)
open from the downslope movement
of the glacier; as glaciers move, they
quarry and pluck away at the lead sur-
face on valley floors and along the sides.
The confluence of the Mississippi, Mis-
souri, and Illinois rivers are shown in this
view of the St. Louis area from the
Shuttle Radar Topography Mission. The
rivers themselves appear black. The
floodplains, colored green, are at
particular risk during times of flooding.
Color coding is directly related to topo-
graphic height, with blue and green at
the lower elevations, rising through
yellow and brown to white at the
highest elevations.
.
.
.
.
.
.
.
.
.
.
.
.
.
.
.
.
.
.
.
.
.
.
.
.
.
.
.
.
.
.
.
.
.
.
.
.
.
.
.
.
.
.
.
.
.
.
.
.
.
.
.
.
.
.
.
.
Contents
Fragile Foundations 2
Global Perspectives 6
Scientific Imperatives 10
Essential Partnerships 13
What Is the Nature of Deformation at Plate Boundaries andWhat Are the Implications for Earthquake Hazards? 16
How Do Tectonics and Climate Interact to Shape the Earth’sSurface and Create Natural Hazards? 18
What Are the Interactions among Ice Masses, Oceans, and theSolid Earth and Their Implications for Sea-Level Change? 20
How Do Magmatic Systems Evolve and Under What ConditionsDo Volcanoes Erupt? 22
What Are the Dynamics of the Mantle and Crust and How Doesthe Earth’s Surface Respond? 24
What Are the Dynamics of the Earth’s Magnetic Field and ItsInteractions with the Earth System? 26
Recommendations for an Integrated Program for Solid-EarthScience 28
Summary 57
Credits 62
Solid Earth Science Working Group (SESWG) 63
.
.
.
.
.
.
.
.
.
.
.
.
.
.
.
.
.
.
.
.
.
.
.
.
.
.
.
.
.
.
.
.
.
.
.
.
.
.
.
.
.
.
.
.
.
.
.
.
.
.
.
.
.
.
.
.
OFragile Foundations
2
ver the past several decades, Earth science as a discipline has begun to recognize
the dynamic, interconnected nature of the Earth as a system. Each component —
oceans, atmosphere, biosphere, and solid Earth — interacts in fundamentally complex
ways. Forcings from each component continually drive responses in the other components.
Despite the familiar stability implied in “being on solid ground,” the solid Earth is actually a
dynamic component of the Earth system. From core motions at the center, through mantle
convection, plate tectonics, volcanic eruptions, and land surface evolution, the solid Earth is
always changing. Measurements collected in the last decade have shown that it is now
possible to study these fluctuations accurately and systematically from space across a wide
range of time scales. Space-based technologies are revolutionizing our understanding of
the solid Earth, as previously unrecognized subtle changes are revealed on regional to glo-
bal scales.
Investigating the behavior of the solid Earth yields direct societal benefits. Combining
space-based and terrestrial measurements has the potential to reduce significantly the
losses due to inevitable natural disasters. NASA-sponsored activities will contribute sub-
stantially to our understanding of the processes leading to earthquakes, volcanic eruptions,
sea-level rise, floods, landslides, and other hazards. NASA observations and analyses, inte-
grated into ongoing hazards programs in federal, state, and international agencies, will re-
duce the loss of life and property through improved planning, improved response, and
more efficient post-event recovery. In addition, by understanding the underlying forces, we
can determine to what extent such natural hazards are predictable. Combining state-of-the-
art measurements with advanced modeling techniques will lead to increasingly refined pre-
dictive capabilities for the entire Earth science community.
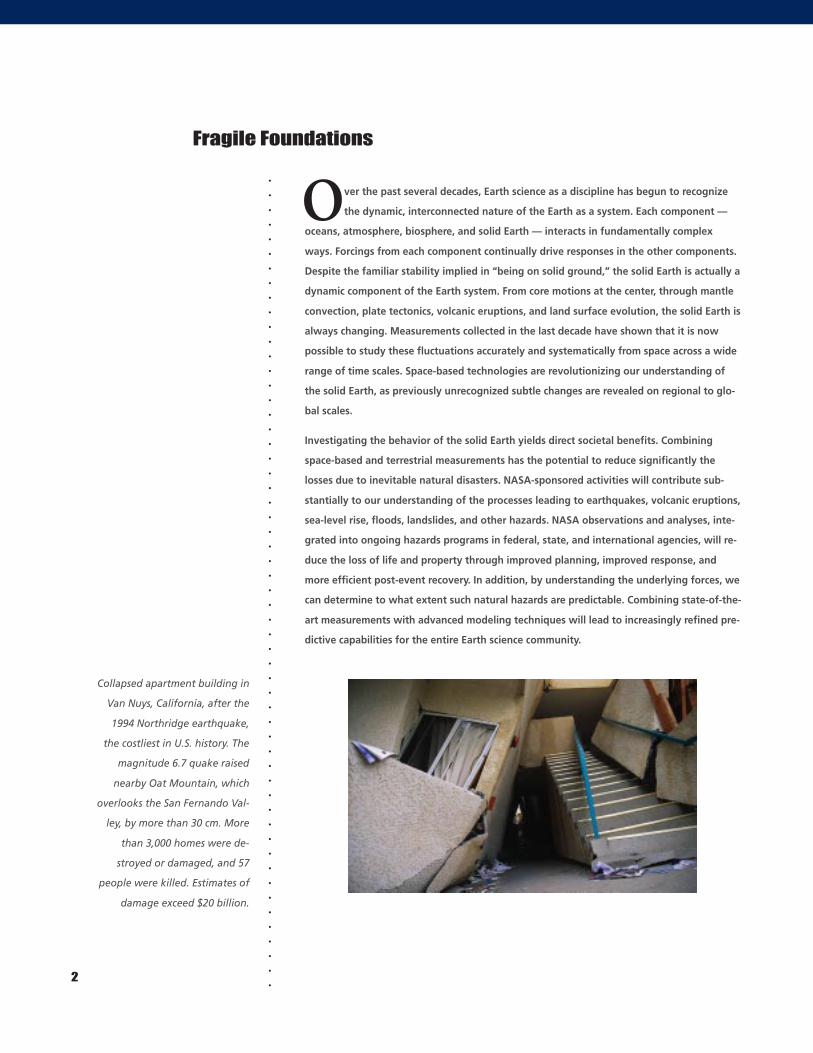
Collapsed apartment building in
Van Nuys, California, after the
1994 Northridge earthquake,
the costliest in U.S. history. The
magnitude 6.7 quake raised
nearby Oat Mountain, which
overlooks the San Fernando Val-
ley, by more than 30 cm. More
than 3,000 homes were de-
stroyed or damaged, and 57
people were killed. Estimates of
damage exceed $20 billion.
.
.
.
.
.
.
.
.
.
.
.
.
.
.
.
.
.
.
.
.
.
.
.
.
.
.
.
.
.
.
.
.
.
.
.
.
.
.
.
.
.
.
.
.
.
.
.
.
.
.
.
.
.
.
.
. 3
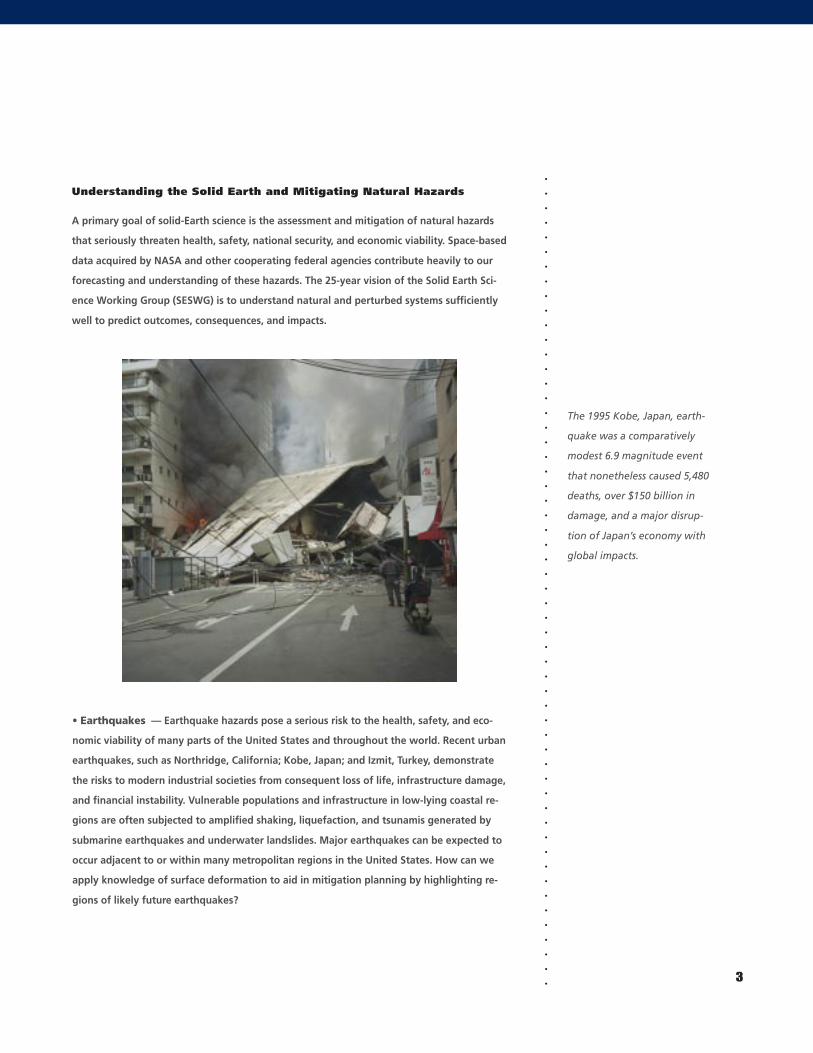
The 1995 Kobe, Japan, earth-
quake was a comparatively
modest 6.9 magnitude event
that nonetheless caused 5,480
deaths, over $150 billion in
damage, and a major disrup-
tion of Japan’s economy with
global impacts.
Understanding the Solid Earth and Mitigating Natural Hazards
A primary goal of solid-Earth science is the assessment and mitigation of natural hazards
that seriously threaten health, safety, national security, and economic viability. Space-based
data acquired by NASA and other cooperating federal agencies contribute heavily to our
forecasting and understanding of these hazards. The 25-year vision of the Solid Earth Sci-
ence Working Group (SESWG) is to understand natural and perturbed systems sufficiently
well to predict outcomes, consequences, and impacts.
• Earthquakes — Earthquake hazards pose a serious risk to the health, safety, and eco-
nomic viability of many parts of the United States and throughout the world. Recent urban
earthquakes, such as Northridge, California; Kobe, Japan; and Izmit, Turkey, demonstrate
the risks to modern industrial societies from consequent loss of life, infrastructure damage,
and financial instability. Vulnerable populations and infrastructure in low-lying coastal re-
gions are often subjected to amplified shaking, liquefaction, and tsunamis generated by
submarine earthquakes and underwater landslides. Major earthquakes can be expected to
occur adjacent to or within many metropolitan regions in the United States. How can we
apply knowledge of surface deformation to aid in mitigation planning by highlighting re-
gions of likely future earthquakes?
.
.
.
.
.
.
.
.
.
.
.
.
.
.
.
.
.
.
.
.
.
.
.
.
.
.
.
.
.
.
.
.
.
.
.
.
.
.
.
.
.
.
.
.
.
.
.
.
.
.
.
.
.
.
.
.
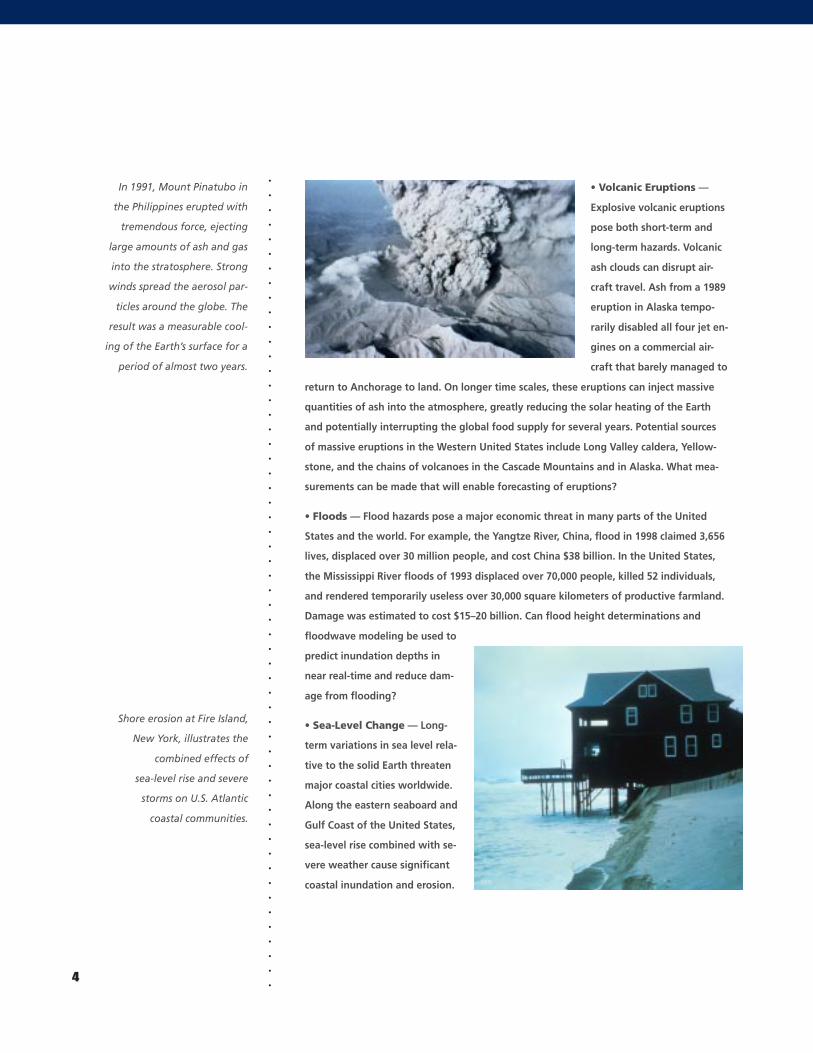
In 1991, Mount Pinatubo in
the Philippines erupted with
tremendous force, ejecting
large amounts of ash and gas
into the stratosphere. Strong
winds spread the aerosol par-
ticles around the globe. The
result was a measurable cool-
ing of the Earth’s surface for a
period of almost two years.
Shore erosion at Fire Island,
New York, illustrates the
combined effects of
sea-level rise and severe
storms on U.S. Atlantic
coastal communities.
4
• Volcanic Eruptions —
Explosive volcanic eruptions
pose both short-term and
long-term hazards. Volcanic
ash clouds can disrupt air-
craft travel. Ash from a 1989
eruption in Alaska tempo-
rarily disabled all four jet en-
gines on a commercial air-
craft that barely managed to
return to Anchorage to land. On longer time scales, these eruptions can inject massive
quantities of ash into the atmosphere, greatly reducing the solar heating of the Earth
and potentially interrupting the global food supply for several years. Potential sources
of massive eruptions in the Western United States include Long Valley caldera, Yellow-
stone, and the chains of volcanoes in the Cascade Mountains and in Alaska. What mea-
surements can be made that will enable forecasting of eruptions?
• Floods — Flood hazards pose a major economic threat in many parts of the United
States and the world. For example, the Yangtze River, China, flood in 1998 claimed 3,656
lives, displaced over 30 million people, and cost China $38 billion. In the United States,
the Mississippi River floods of 1993 displaced over 70,000 people, killed 52 individuals,
and rendered temporarily useless over 30,000 square kilometers of productive farmland.
Damage was estimated to cost $15–20 billion. Can flood height determinations and
floodwave modeling be used to
predict inundation depths in
near real-time and reduce dam-
age from flooding?
• Sea-Level Change — Long-
term variations in sea level rela-
tive to the solid Earth threaten
major coastal cities worldwide.
Along the eastern seaboard and
Gulf Coast of the United States,
sea-level rise combined with se-
vere weather cause significant
coastal inundation and erosion.
.
.
.
.
.
.
.
.
.
.
.
.
.
.
.
.
.
.
.
.
.
.
.
.
.
.
.
.
.
.
.
.
.
.
.
.
.
.
.
.
.
.
.
.
.
.
.
.
.
.
.
.
.
.
.
. 5
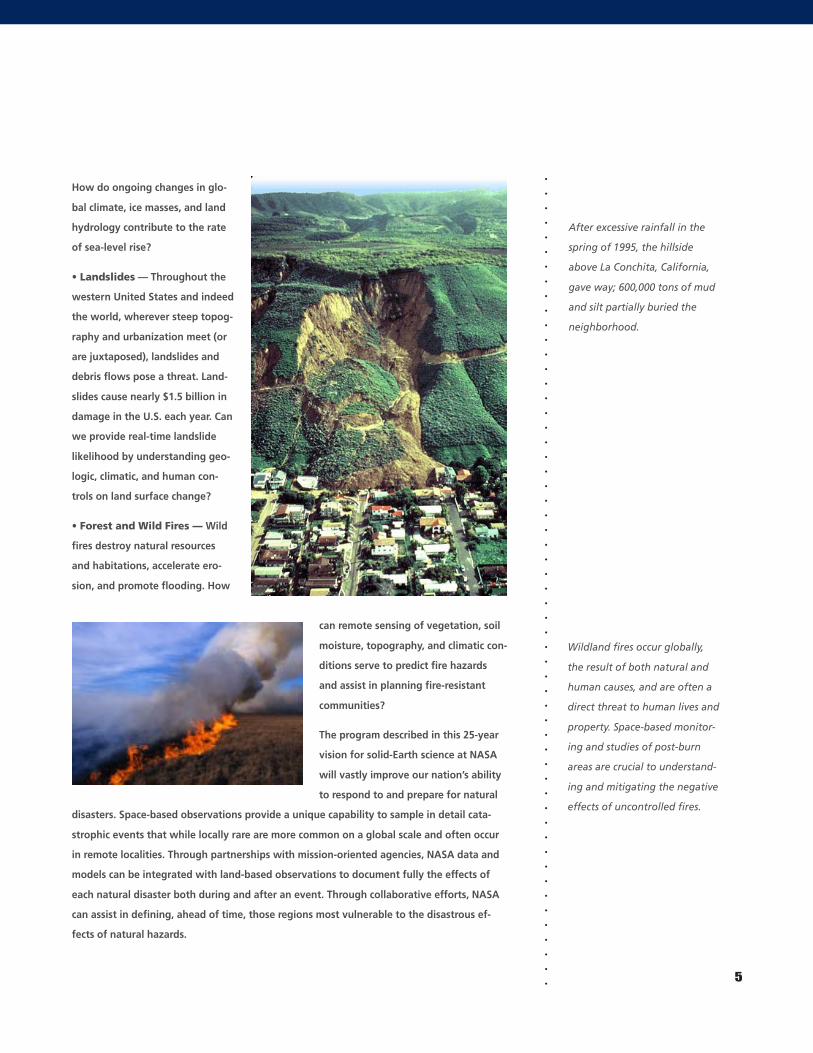
After excessive rainfall in the
spring of 1995, the hillside
above La Conchita, California,
gave way; 600,000 tons of mud
and silt partially buried the
neighborhood.
How do ongoing changes in glo-
bal climate, ice masses, and land
hydrology contribute to the rate
of sea-level rise?
• Landslides — Throughout the
western United States and indeed
the world, wherever steep topog-
raphy and urbanization meet (or
are juxtaposed), landslides and
debris flows pose a threat. Land-
slides cause nearly $1.5 billion in
damage in the U.S. each year. Can
we provide real-time landslide
likelihood by understanding geo-
logic, climatic, and human con-
trols on land surface change?
• Forest and Wild Fires — Wild
fires destroy natural resources
and habitations, accelerate ero-
sion, and promote flooding. How
can remote sensing of vegetation, soil
moisture, topography, and climatic con-
ditions serve to predict fire hazards
and assist in planning fire-resistant
communities?
The program described in this 25-year
vision for solid-Earth science at NASA
will vastly improve our nation’s ability
to respond to and prepare for natural
disasters. Space-based observations provide a unique capability to sample in detail cata-
strophic events that while locally rare are more common on a global scale and often occur
in remote localities. Through partnerships with mission-oriented agencies, NASA data and
models can be integrated with land-based observations to document fully the effects of
each natural disaster both during and after an event. Through collaborative efforts, NASA
can assist in defining, ahead of time, those regions most vulnerable to the disastrous ef-
fects of natural hazards.
Wildland fires occur globally,
the result of both natural and
human causes, and are often a
direct threat to human lives and
property. Space-based monitor-
ing and studies of post-burn
areas are crucial to understand-
ing and mitigating the negative
effects of uncontrolled fires.
.
.
.
.
.
.
.
.
.
.
.
.
.
.
.
.
.
.
.
.
.
.
.
.
.
.
.
.
.
.
.
.
.
.
.
.
.
.
.
.
.
.
.
.
.
.
.
.
.
.
.
.
.
.
.
.
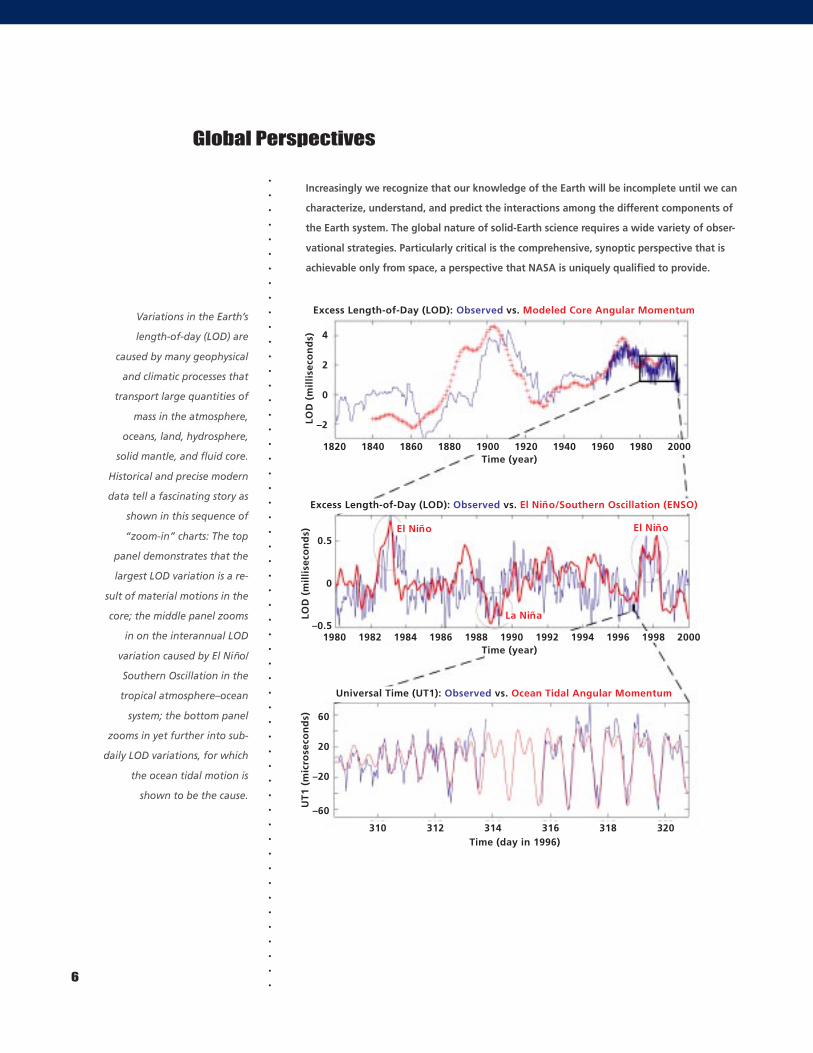
Variations in the Earth’s
length-of-day (LOD) are
caused by many geophysical
and climatic processes that
transport large quantities of
mass in the atmosphere,
oceans, land, hydrosphere,
solid mantle, and fluid core.
Historical and precise modern
data tell a fascinating story as
shown in this sequence of
“zoom-in” charts: The top
panel demonstrates that the
largest LOD variation is a re-
sult of material motions in the
core; the middle panel zooms
in on the interannual LOD
variation caused by El Niño/
Southern Oscillation in the
tropical atmosphere–ocean
system; the bottom panel
zooms in yet further into sub-
daily LOD variations, for which
the ocean tidal motion is
shown to be the cause.
Global Perspectives
6
Increasingly we recognize that our knowledge of the Earth will be incomplete until we can
characterize, understand, and predict the interactions among the different components of
the Earth system. The global nature of solid-Earth science requires a wide variety of obser-
vational strategies. Particularly critical is the comprehensive, synoptic perspective that is
achievable only from space, a perspective that NASA is uniquely qualified to provide.
198019601940192019001880186018401820 2000Time (year)
19961994199219901988198619841982 2000Time (year)
1998
320318316314312310Time (day in 1996)
Excess Length-of-Day (LOD): Observed vs. Modeled Core Angular Momentum
Excess Length-of-Day (LOD): Observed vs. El Niño/Southern Oscillation (ENSO)
Universal Time (UT1): Observed vs. Ocean Tidal Angular Momentum
4
2
0
–2LOD
(m
illi
seco
nd
s)
1980
0.5
0
–0.5
LOD
(m
illi
seco
nd
s)
60
20
–20
–60
UT1
(m
icro
seco
nd
s)
La Niña
El NiñoEl Niño
.
.
.
.
.
.
.
.
.
.
.
.
.
.
.
.
.
.
.
.
.
.
.
.
.
.
.
.
.
.
.
.
.
.
.
.
.
.
.
.
.
.
.
.
.
.
.
.
.
.
.
.
.
.
.
.7
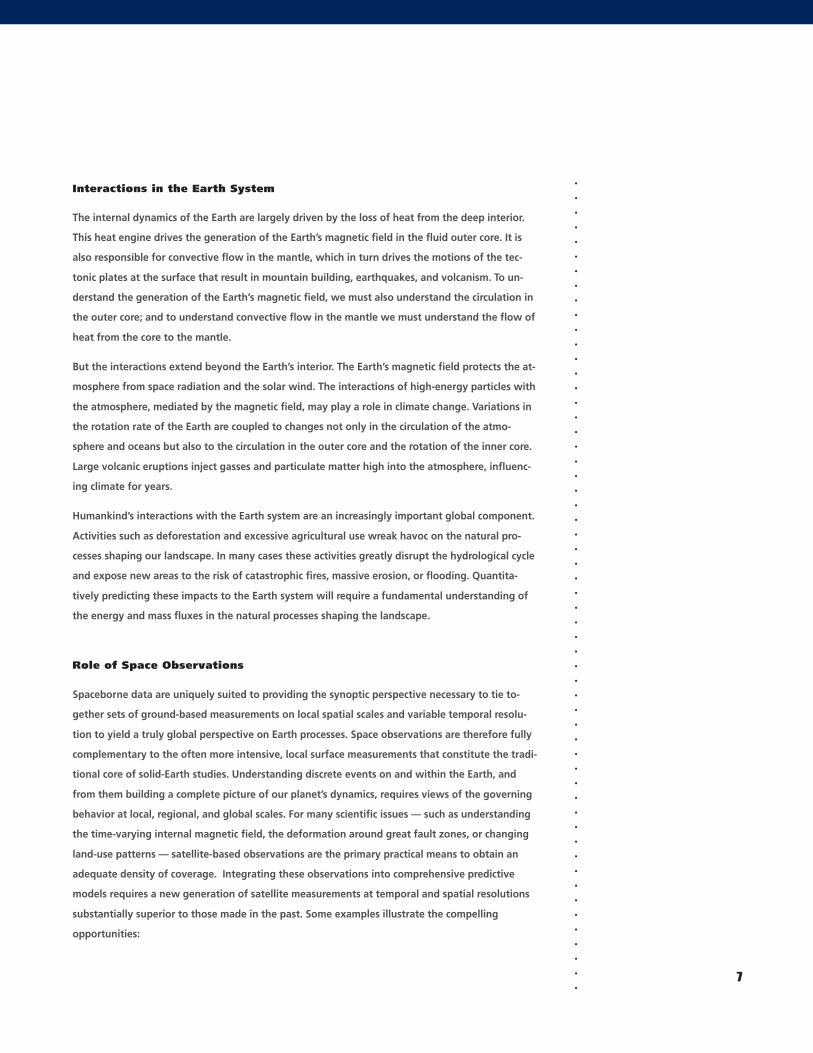
The internal dynamics of the Earth are largely driven by the loss of heat from the deep interior.
This heat engine drives the generation of the Earth’s magnetic field in the fluid outer core. It is
also responsible for convective flow in the mantle, which in turn drives the motions of the tec-
tonic plates at the surface that result in mountain building, earthquakes, and volcanism. To un-
derstand the generation of the Earth’s magnetic field, we must also understand the circulation in
the outer core; and to understand convective flow in the mantle we must understand the flow of
heat from the core to the mantle.
But the interactions extend beyond the Earth’s interior. The Earth’s magnetic field protects the at-
mosphere from space radiation and the solar wind. The interactions of high-energy particles with
the atmosphere, mediated by the magnetic field, may play a role in climate change. Variations in
the rotation rate of the Earth are coupled to changes not only in the circulation of the atmo-
sphere and oceans but also to the circulation in the outer core and the rotation of the inner core.
Large volcanic eruptions inject gasses and particulate matter high into the atmosphere, influenc-
ing climate for years.
Humankind’s interactions with the Earth system are an increasingly important global component.
Activities such as deforestation and excessive agricultural use wreak havoc on the natural pro-
cesses shaping our landscape. In many cases these activities greatly disrupt the hydrological cycle
and expose new areas to the risk of catastrophic fires, massive erosion, or flooding. Quantita-
tively predicting these impacts to the Earth system will require a fundamental understanding of
the energy and mass fluxes in the natural processes shaping the landscape.
Role of Space Observations
Spaceborne data are uniquely suited to providing the synoptic perspective necessary to tie to-
gether sets of ground-based measurements on local spatial scales and variable temporal resolu-
tion to yield a truly global perspective on Earth processes. Space observations are therefore fully
complementary to the often more intensive, local surface measurements that constitute the tradi-
tional core of solid-Earth studies. Understanding discrete events on and within the Earth, and
from them building a complete picture of our planet’s dynamics, requires views of the governing
behavior at local, regional, and global scales. For many scientific issues — such as understanding
the time-varying internal magnetic field, the deformation around great fault zones, or changing
land-use patterns — satellite-based observations are the primary practical means to obtain an
adequate density of coverage. Integrating these observations into comprehensive predictive
models requires a new generation of satellite measurements at temporal and spatial resolutions
substantially superior to those made in the past. Some examples illustrate the compelling
opportunities:
Interactions in the Earth System
.
.
.
.
.
.
.
.
.
.
.
.
.
.
.
.
.
.
.
.
.
.
.
.
.
.
.
.
.
.
.
.
.
.
.
.
.
.
.
.
.
.
.
.
.
.
.
.
.
.
.
.
.
.
.
.
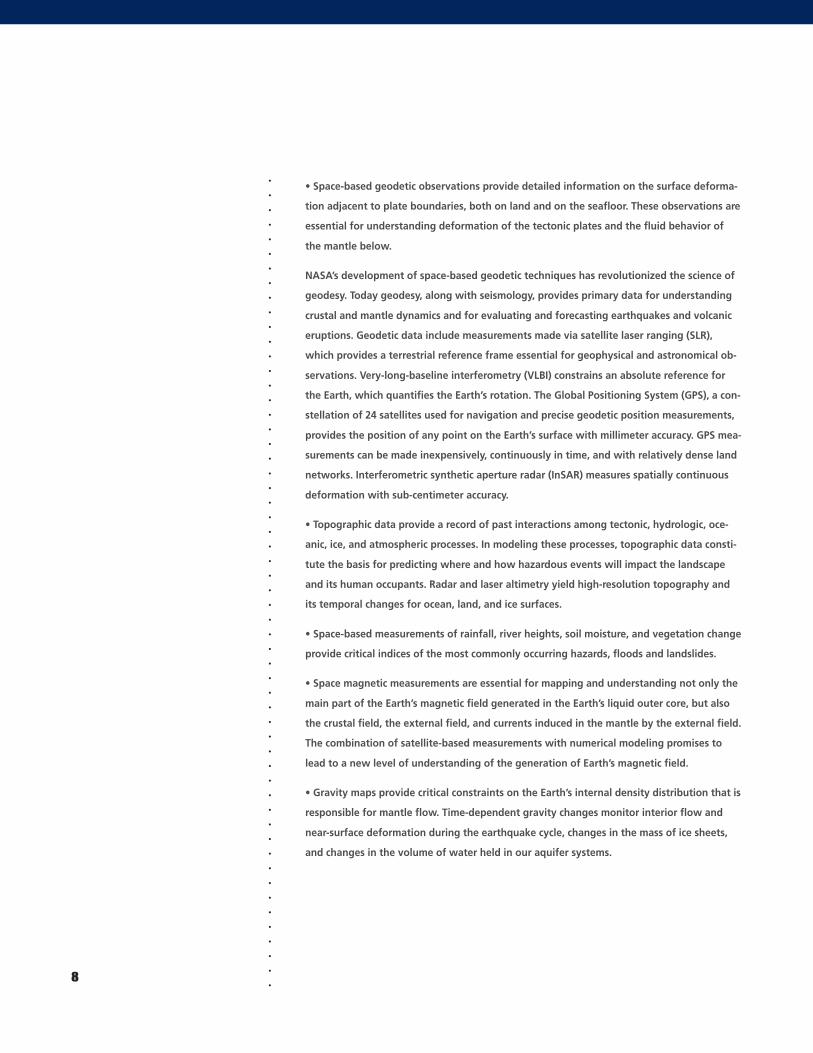
• Space-based geodetic observations provide detailed information on the surface deforma-
tion adjacent to plate boundaries, both on land and on the seafloor. These observations are
essential for understanding deformation of the tectonic plates and the fluid behavior of
the mantle below.
NASA’s development of space-based geodetic techniques has revolutionized the science of
geodesy. Today geodesy, along with seismology, provides primary data for understanding
crustal and mantle dynamics and for evaluating and forecasting earthquakes and volcanic
eruptions. Geodetic data include measurements made via satellite laser ranging (SLR),
which provides a terrestrial reference frame essential for geophysical and astronomical ob-
servations. Very-long-baseline interferometry (VLBI) constrains an absolute reference for
the Earth, which quantifies the Earth’s rotation. The Global Positioning System (GPS), a con-
stellation of 24 satellites used for navigation and precise geodetic position measurements,
provides the position of any point on the Earth’s surface with millimeter accuracy. GPS mea-
surements can be made inexpensively, continuously in time, and with relatively dense land
networks. Interferometric synthetic aperture radar (InSAR) measures spatially continuous
deformation with sub-centimeter accuracy.
• Topographic data provide a record of past interactions among tectonic, hydrologic, oce-
anic, ice, and atmospheric processes. In modeling these processes, topographic data consti-
tute the basis for predicting where and how hazardous events will impact the landscape
and its human occupants. Radar and laser altimetry yield high-resolution topography and
its temporal changes for ocean, land, and ice surfaces.
• Space-based measurements of rainfall, river heights, soil moisture, and vegetation change
provide critical indices of the most commonly occurring hazards, floods and landslides.
• Space magnetic measurements are essential for mapping and understanding not only the
main part of the Earth’s magnetic field generated in the Earth’s liquid outer core, but also
the crustal field, the external field, and currents induced in the mantle by the external field.
The combination of satellite-based measurements with numerical modeling promises to
lead to a new level of understanding of the generation of Earth’s magnetic field.
• Gravity maps provide critical constraints on the Earth’s internal density distribution that is
responsible for mantle flow. Time-dependent gravity changes monitor interior flow and
near-surface deformation during the earthquake cycle, changes in the mass of ice sheets,
and changes in the volume of water held in our aquifer systems.
8
.
.
.
.
.
.
.
.
.
.
.
.
.
.
.
.
.
.
.
.
.
.
.
.
.
.
.
.
.
.
.
.
.
.
.
.
.
.
.
.
.
.
.
.
.
.
.
.
.
.
.
.
.
.
.
.9
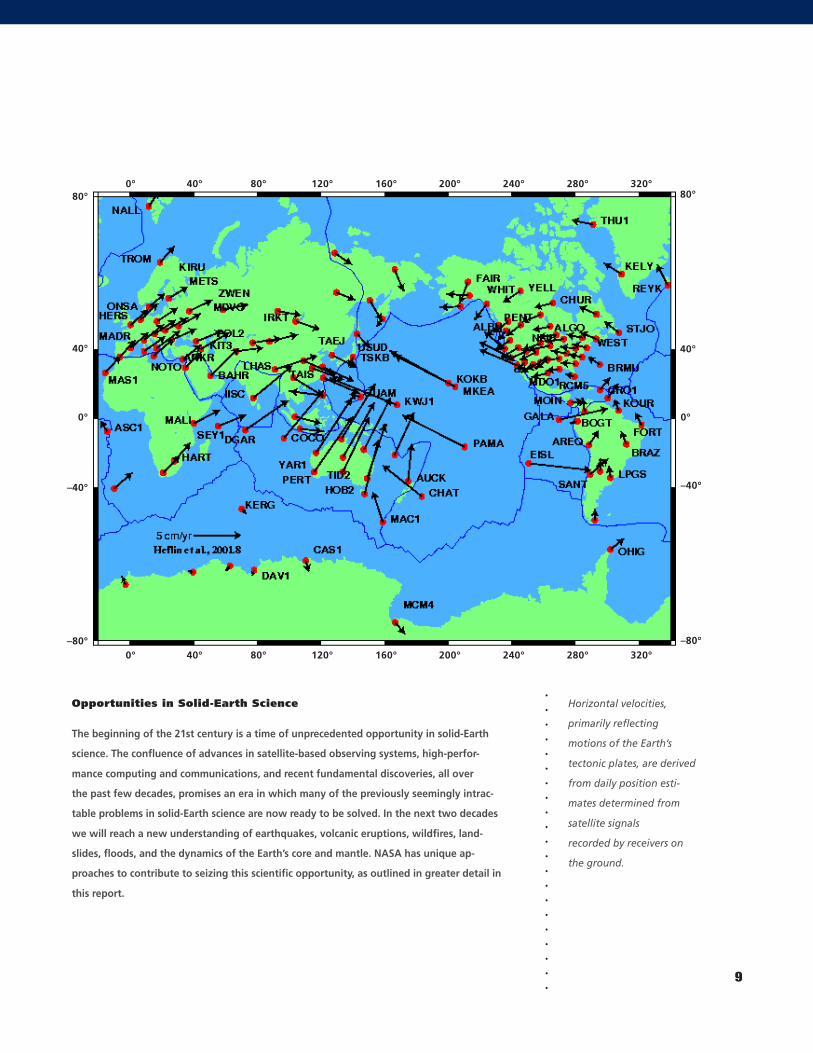
Horizontal velocities,
primarily reflecting
motions of the Earth’s
tectonic plates, are derived
from daily position esti-
mates determined from
satellite signals
recorded by receivers on
the ground.
Opportunities in Solid-Earth Science
The beginning of the 21st century is a time of unprecedented opportunity in solid-Earth
science. The confluence of advances in satellite-based observing systems, high-perfor-
mance computing and communications, and recent fundamental discoveries, all over
the past few decades, promises an era in which many of the previously seemingly intrac-
table problems in solid-Earth science are now ready to be solved. In the next two decades
we will reach a new understanding of earthquakes, volcanic eruptions, wildfires, land-
slides, floods, and the dynamics of the Earth’s core and mantle. NASA has unique ap-
proaches to contribute to seizing this scientific opportunity, as outlined in greater detail in
this report.
80°
40°
0°
–40°
–80°
80°
40°
0°
–40°
–80°320°280°240°200°160°120°80°40°0°
320°280°240°200°160°120°80°40°0°
.
.
.
.
.
.
.
.
.
.
.
.
.
.
.
.
.
.
.
.
.
.
.
.
.
.
.
.
.
.
.
.
.
.
.
.
.
.
.
.
.
.
.
.
.
.
.
.
.
.
.
.
.
.
.
.
S
10
Scientific Imperatives
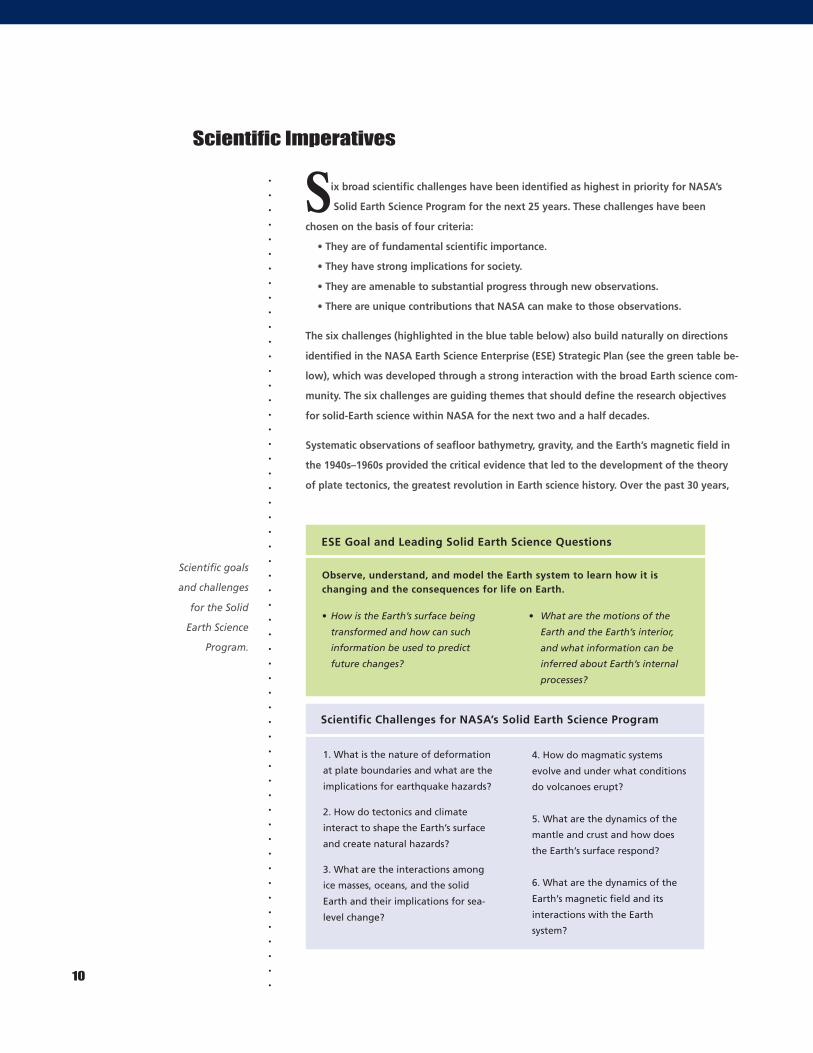
Scientific goals
and challenges
for the Solid
Earth Science
Program.
4. How do magmatic systems
evolve and under what conditions
do volcanoes erupt?
5. What are the dynamics of the
mantle and crust and how does
the Earth’s surface respond?
6. What are the dynamics of the
Earth’s magnetic field and its
interactions with the Earth
system?
Observe, understand, and model the Earth system to learn how it ischanging and the consequences for life on Earth.
• How is the Earth’s surface being
transformed and how can such
information be used to predict
future changes?
• What are the motions of the
Earth and the Earth’s interior,
and what information can be
inferred about Earth’s internal
processes?
1. What is the nature of deformation
at plate boundaries and what are the
implications for earthquake hazards?
2. How do tectonics and climate
interact to shape the Earth’s surface
and create natural hazards?
3. What are the interactions among
ice masses, oceans, and the solid
Earth and their implications for sea-
level change?
ix broad scientific challenges have been identified as highest in priority for NASA’s
Solid Earth Science Program for the next 25 years. These challenges have been
chosen on the basis of four criteria:
• They are of fundamental scientific importance.
• They have strong implications for society.
• They are amenable to substantial progress through new observations.
• There are unique contributions that NASA can make to those observations.
The six challenges (highlighted in the blue table below) also build naturally on directions
identified in the NASA Earth Science Enterprise (ESE) Strategic Plan (see the green table be-
low), which was developed through a strong interaction with the broad Earth science com-
munity. The six challenges are guiding themes that should define the research objectives
for solid-Earth science within NASA for the next two and a half decades.
Systematic observations of seafloor bathymetry, gravity, and the Earth’s magnetic field in
the 1940s–1960s provided the critical evidence that led to the development of the theory
of plate tectonics, the greatest revolution in Earth science history. Over the past 30 years,
ESE Goal and Leading Solid Earth Science Questions
Scientific Challenges for NASA’s Solid Earth Science Program
11
.
.
.
.
.
.
.
.
.
.
.
.
.
.
.
.
.
.
.
.
.
.
.
.
.
.
.
.
.
.
.
.
.
.
.
.
.
.
.
.
.
.
.
.
.
.
.
.
.
.
.
.
.
.
.
.
many details of plate
tectonics have been
worked out, although
we have come to recog-
nize that the Earth is a
complex, interconnected
system involving the
solid Earth, the atmo-
sphere, hydrosphere,
cryosphere, and bio-
sphere. We are still in
the infancy stage of un-
derstanding this system.
Our focus now is understanding the processes that drive plate motions, deform the Earth’s
surface, and influence climate. Our goal is to construct predictive models that can forecast
change or catastrophic events and predict the consequences of such changes and events
through a concerted effort to address the defining challenges identified in this report.
All of these challenges, at least in part, address the processes that transform the Earth’s sur-
face. Nearly all of the changes to the Earth’s surface are driven, in one manner or another,
by the internal heat transport and dynamics of the Earth’s interior.
Plate tectonic theory explains the large-scale motions of the outer surface of the Earth. In
most cases these motions are associated with the cumulative displacement of earthquakes
occurring along and near plate boundaries. What loading processes control the spatial and
temporal patterns of earthquakes? How do fault systems interact and over what time
scales? How broadly is plate “boundary” deformation distributed?
Earthquakes are just one of a number of
natural processes that shape the land-
scape. Landslides, floods, tsunamis, de-
bris flows, storm surges, and volcanic
eruptions sculpt and deform the land as
well. How do biologic and climatic in-
puts modulate the effects of tectonic
processes acting on the Earth’s surface?
What properties should be monitored
remotely to provide real-time prediction
of natural hazards and their impacts?
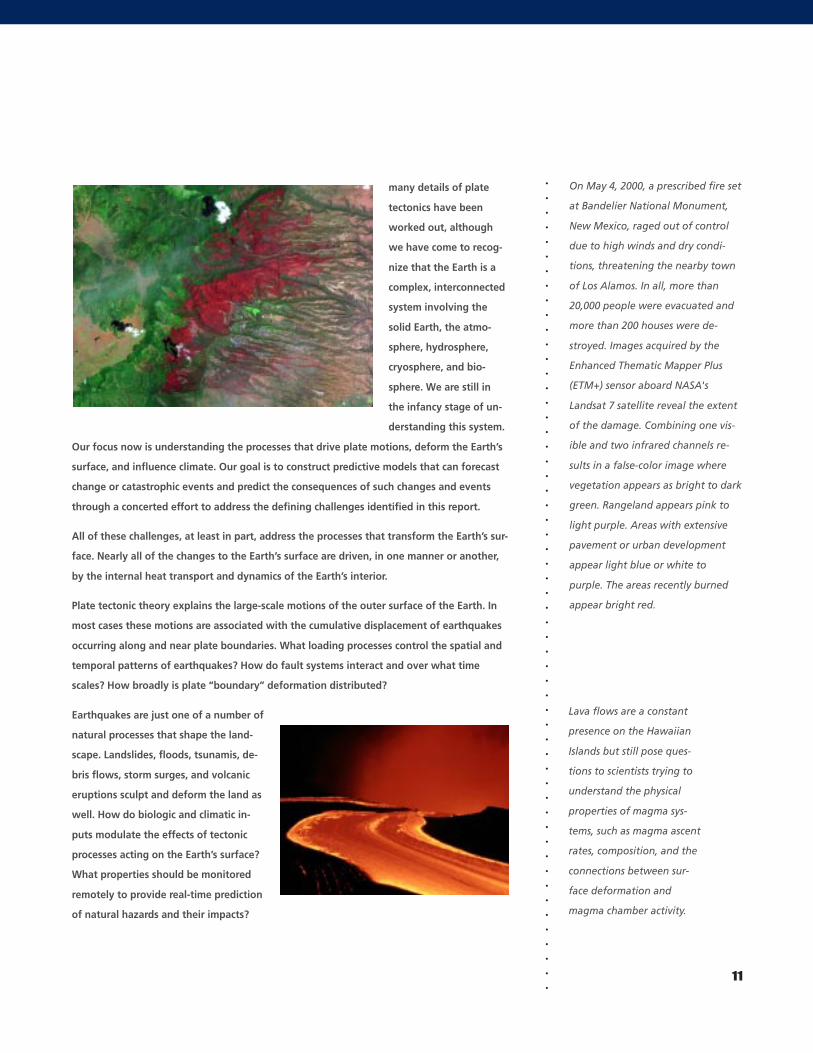
On May 4, 2000, a prescribed fire set
at Bandelier National Monument,
New Mexico, raged out of control
due to high winds and dry condi-
tions, threatening the nearby town
of Los Alamos. In all, more than
20,000 people were evacuated and
more than 200 houses were de-
stroyed. Images acquired by the
Enhanced Thematic Mapper Plus
(ETM+) sensor aboard NASA's
Landsat 7 satellite reveal the extent
of the damage. Combining one vis-
ible and two infrared channels re-
sults in a false-color image where
vegetation appears as bright to dark
green. Rangeland appears pink to
light purple. Areas with extensive
pavement or urban development
appear light blue or white to
purple. The areas recently burned
appear bright red.
Lava flows are a constant
presence on the Hawaiian
Islands but still pose ques-
tions to scientists trying to
understand the physical
properties of magma sys-
tems, such as magma ascent
rates, composition, and the
connections between sur-
face deformation and
magma chamber activity.
.
.
.
.
.
.
.
.
.
.
.
.
.
.
.
.
.
.
.
.
.
.
.
.
.
.
.
.
.
.
.
.
.
.
.
.
.
.
.
.
.
.
.
.
.
.
.
.
.
.
.
.
.
.
.
.
Global sea-level change has the potential for
a devastating transformation of the Earth’s
surface worldwide. Sea level is the result of a
delicate balance among competing geophysical
processes within the solid Earth–atmosphere–
hydrosphere–cryosphere system. Can we model
the coupled processes that result in the natural
variability in sea level? How can we recognize
and model the effects of human activity amidst
this natural variability? How do feedbacks af-
fect the natural processes?
Processes occurring deep within the Earth drive much of the deformation and change that
occurs at the Earth’s surface. How does the mantle flow at depth? How do the forces in the
mantle and crust cause surface changes? The connections between the core and the Earth’s
surface through the mantle and crust offer the keys to answering these questions.
The removal of heat from the core by the convecting mantle drives the geodynamo that
generates the Earth’s magnetic field. Much recent progress has been made in modeling the
dynamo process, yet much remains to be understood. How is the magnetic field evolving on
annual to decadal time scales? For how much longer will the current rate of decay of the
field, sufficiently rapid to eliminate the dipole in 2000 years, be maintained? What role does
the core play in the angular momentum balance of the Earth on decadal time scales? How
important is the magnetic field in modulating the possible effects of space weather on the
atmosphere, and hence on climate?
The goal of this report is to expand on the NASA Earth Science Research Strategy by recom-
mending a long-term vision and strategy for solid-Earth science at NASA. The accompanying
integrated program described in this report provides critical input for the next great revolu-
tion in Earth sciences, just as the military-driven data sets of the last century led to the
theory of plate tectonics. This next revolution will involve development of predictive mod-
els of complex, interconnected Earth processes. For these models to be successful, particu-
larly for an understanding of hazards, high-resolution, global observations with real-time or
near-real-time data streams and processing will be required. Integrating the huge quantities
of data and information being collected into forecast models will demand that information
technology resources be developed in concert with advanced sensor and detection capabili-
ties. Understanding the complex dynamics of the solid Earth will require sustained aggres-
sive investments in science and technology over the next decades.
12
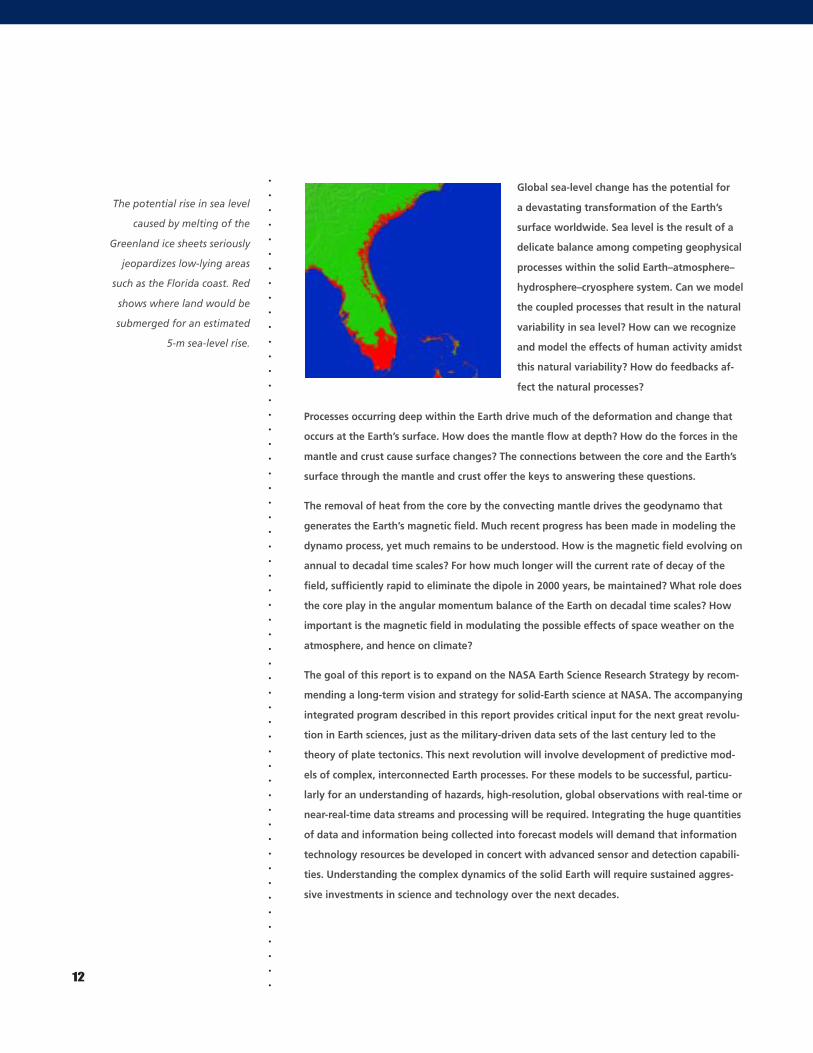
The potential rise in sea level
caused by melting of the
Greenland ice sheets seriously
jeopardizes low-lying areas
such as the Florida coast. Red
shows where land would be
submerged for an estimated
5-m sea-level rise.
The 25-year scientific program outlined in
this report is extremely ambitious. The scien-
tific challenges are broad, and they address
goals common to the entire solid-Earth sci-
ence community. Our success in meeting
these challenges will depend on the close
coordination and collaboration with other
programs within NASA, with other federal
agencies, and with international space
agencies.
Partnering with Other NASAPrograms
Within NASA there is a significant diversity
of research and application programs. The
Solid Earth Science Program works closely
with other agency programs to achieve common goals. For example, by combining re-
search, observation, and modeling efforts with another ESE program, Cryospheric Sciences,
we expect to make significant advances in our understanding of ice mass balance and sea-
level change. Additional examples include the overlapping interests and capabilities of
those programs addressing hydrologic and biogeochemical cycles, soil properties, and land
cover and surface change. The breadth of NASA’s research programs benefits especially
those scientific challenges where cross-cutting interests focus attention and resources. Of
no less importance is the role of the agency’s Technology and Applications programs. The
ESE Technology Program supports research by developing advanced technology and tools
associated with orbital and suborbital missions using innovative remote-sensing technolo-
gies. The mission of the ESE Applications Program is to expand and accelerate the realiza-
tion of societal and economic benefits from Earth science, information, and technology.
Partnering with Other Federal Agencies
Solid-Earth science initiatives sponsored by other federal agencies will enhance NASA’s ef-
forts to meet the scientific challenges outlined in this report and will allow the develop-
ment of a predictive capability for our restless Earth. For example, NASA partners with the
National Science Foundation (NSF), the U.S. Geological Survey (USGS), and the National
Oceanic and Atmospheric Administration (NOAA) on a number of programs that address in
a complementary fashion the goals of solid-Earth science at NASA. Interagency cooperation
within these programs promises to advance significantly our understanding of the Earth’s
crust and mantle, earthquakes, and volcanoes. Among these programs are:
.
.
.
.
.
.
.
.
.
.
.
.
.
.
.
.
.
.
.
.
.
.
.
.
.
.
.
.
.
.
.
.
.
.
.
.
.
.
.
.
.
.
.
.
.
.
.
.
.
.
.
.
.
.
.
.13
Essential Partnerships
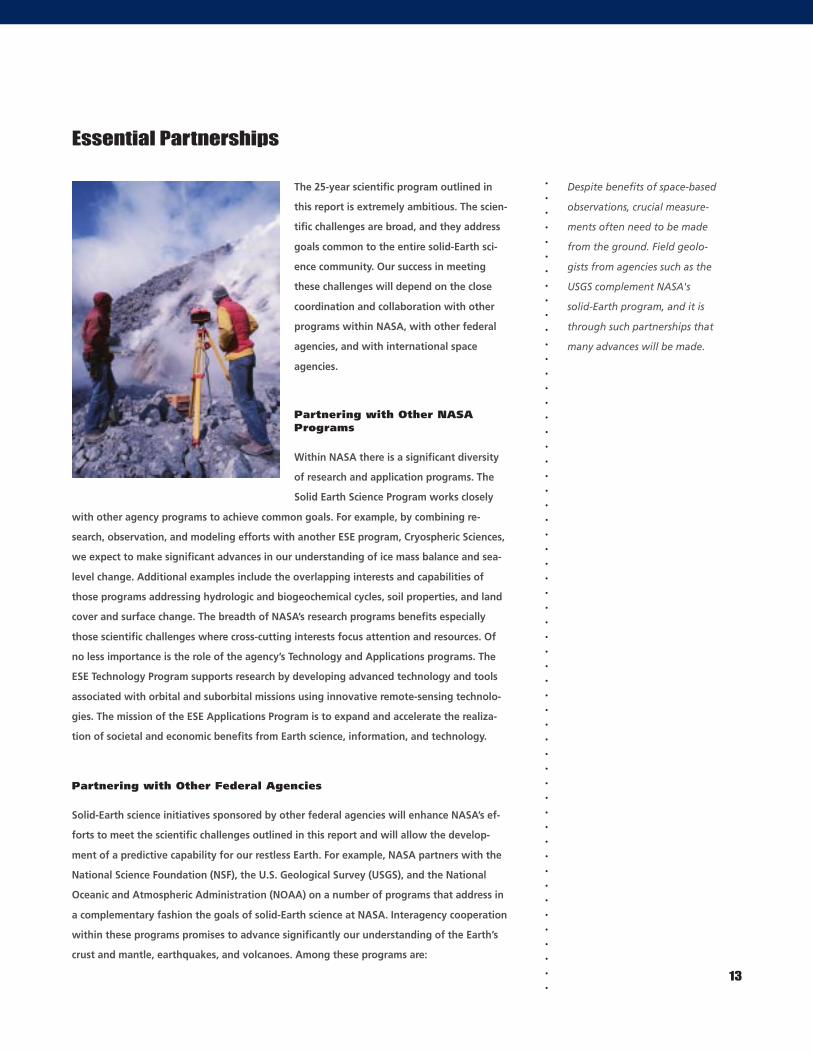
Despite benefits of space-based
observations, crucial measure-
ments often need to be made
from the ground. Field geolo-
gists from agencies such as the
USGS complement NASA's
solid-Earth program, and it is
through such partnerships that
many advances will be made.
.
.
.
.
.
.
.
.
.
.
.
.
.
.
.
.
.
.
.
.
.
.
.
.
.
.
.
.
.
.
.
.
.
.
.
.
.
.
.
.
.
.
.
.
.
.
.
.
.
.
.
.
.
.
.
.
The NSF EarthScope initiative involves four integrated components: USArray, a moving ar-
ray of broadband seismic instruments; the San Andreas Fault Observatory at Depth
(SAFOD), involving deep drilling and instrumentation at depth; the Plate Boundary Obser-
vatory (PBO), primarily an array of continuous GPS stations and strainmeters to be de-
ployed in the western U.S.; and a dedicated InSAR mission for obtaining synoptic informa-
tion about crustal deformation globally. The first three components of EarthScope are ex-
pected to be led by NSF, but NASA can contribute to PBO through its accumulated expertise
in space-based geodesy and GPS. NASA should be the lead for a dedicated InSAR mission.
The NSF seafloor observatory initiative, Dynamics of Earth and Ocean Systems (DEOS), in-
cludes as its largest component the North East Pacific Time-series Undersea Networked Ex-
periments (NEPTUNE) project to instrument the Juan de Fuca plate offshore of the Pacific
northwest. For this and other such initiatives, seafloor geodesy will be one of the techno-
logical and scientific frontiers.
NOAA’s Geostationary Operational Environmental Satellites (GOES) provide the frequent
(at least once per hour) spaceborne observations of the western hemisphere that are im-
portant for the detection of both volcanic plumes and lava flow hotspots. In addition, via
agreements with foreign counterparts, NOAA provides NASA with prompt access to similar
geostationary data covering most of the rest of the world. Sites of volcanic activity outside
the field of view of GOES are also being monitored daily with the Advanced Very High
Resolution Radiometer (AVHRR) on the NOAA polar orbiting satellites. This capability is re-
inforced by NASA’s own Advanced Spaceborne Thermal Emission and Reflection Radiom-
eter (ASTER) and Moderate Resolution Imaging Spectrometer (MODIS) instruments on the
14
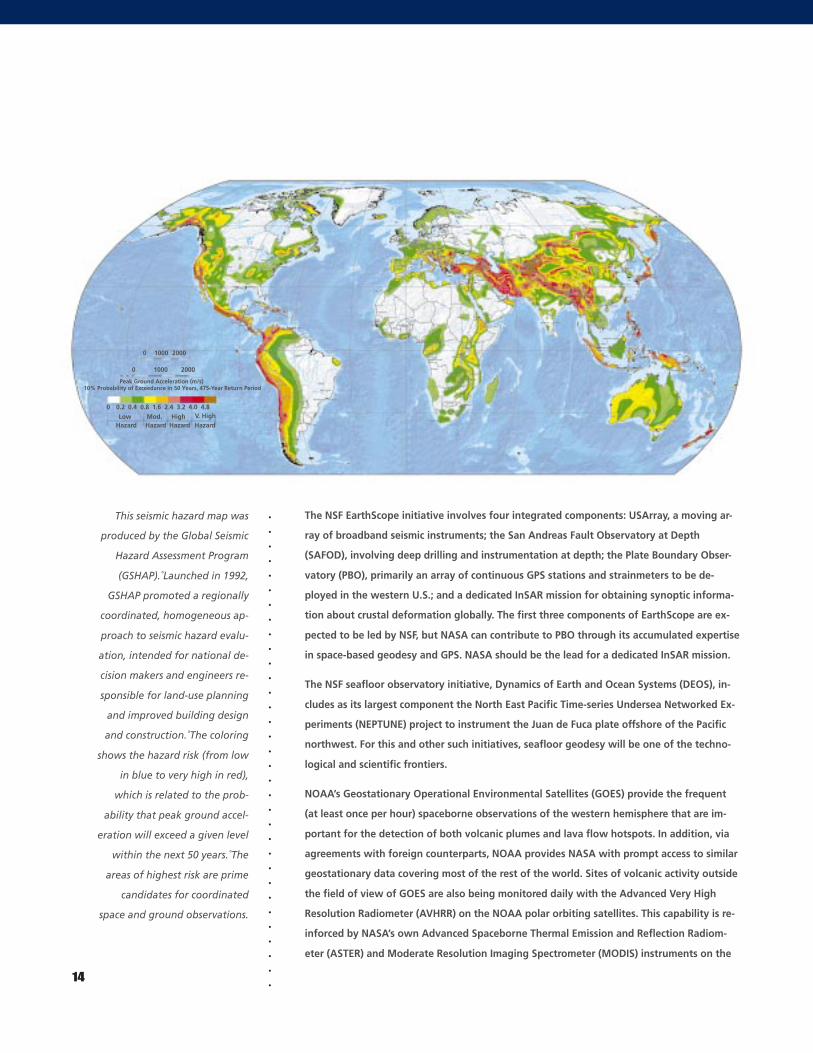
This seismic hazard map was
produced by the Global Seismic
Hazard Assessment Program
(GSHAP).␣ Launched in 1992,
GSHAP promoted a regionally
coordinated, homogeneous ap-
proach to seismic hazard evalu-
ation, intended for national de-
cision makers and engineers re-
sponsible for land-use planning
and improved building design
and construction.␣ The coloring
shows the hazard risk (from low
in blue to very high in red),
which is related to the prob-
ability that peak ground accel-
eration will exceed a given level
within the next 50 years.␣ The
areas of highest risk are prime
candidates for coordinated
space and ground observations.
0 1000 2000
0 1000 2000
Low
Peak Ground Acceleration (m/s)10% Probability of Exceedance in 50 Years, 475-Year Return Period
0 0.2 0.4 0.8 1.6 2.4 3.2 4.0 4.8
HazardMod.Hazard
HighHazard
V. HighHazard
.
.
.
.
.
.
.
.
.
.
.
.
.
.
.
.
.
.
.
.
.
.
.
.
.
.
.
.
.
.
.
.
.
.
.
.
.
.
.
.
.
.
.
.
.
.
.
.
.
.
.
.
.
.
.
.15
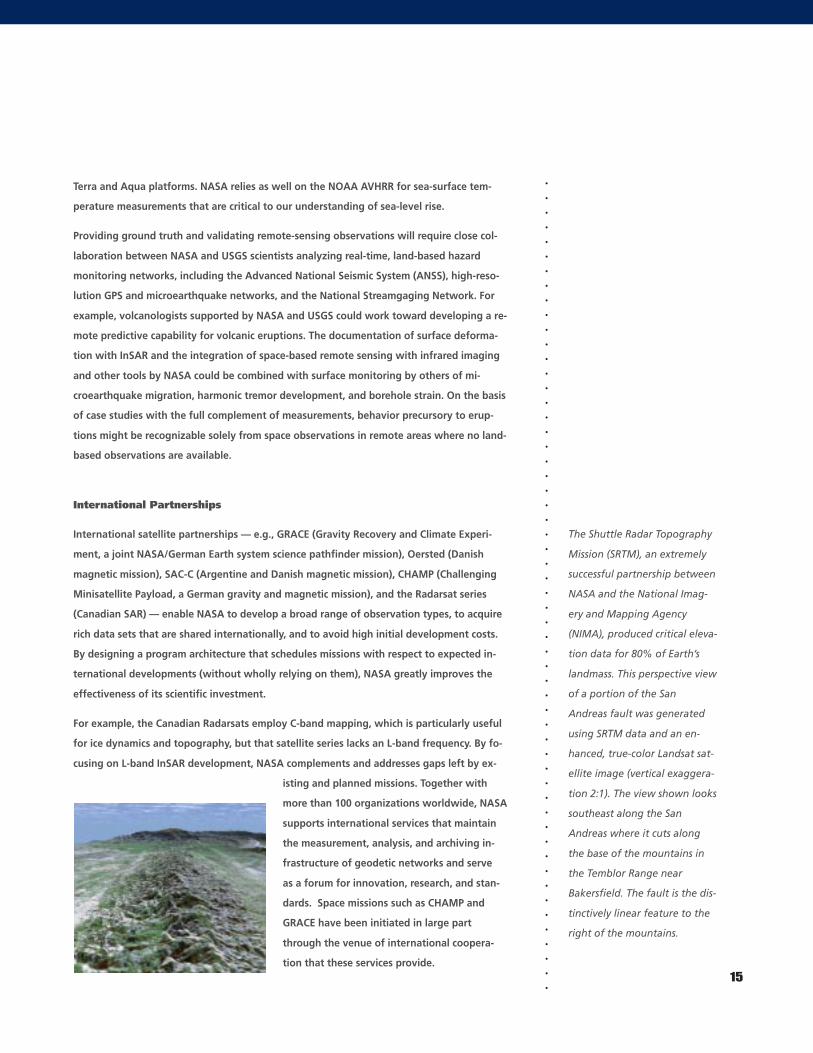
The Shuttle Radar Topography
Mission (SRTM), an extremely
successful partnership between
NASA and the National Imag-
ery and Mapping Agency
(NIMA), produced critical eleva-
tion data for 80% of Earth’s
landmass. This perspective view
of a portion of the San
Andreas fault was generated
using SRTM data and an en-
hanced, true-color Landsat sat-
ellite image (vertical exaggera-
tion 2:1). The view shown looks
southeast along the San
Andreas where it cuts along
the base of the mountains in
the Temblor Range near
Bakersfield. The fault is the dis-
tinctively linear feature to the
right of the mountains.
Terra and Aqua platforms. NASA relies as well on the NOAA AVHRR for sea-surface tem-
perature measurements that are critical to our understanding of sea-level rise.
Providing ground truth and validating remote-sensing observations will require close col-
laboration between NASA and USGS scientists analyzing real-time, land-based hazard
monitoring networks, including the Advanced National Seismic System (ANSS), high-reso-
lution GPS and microearthquake networks, and the National Streamgaging Network. For
example, volcanologists supported by NASA and USGS could work toward developing a re-
mote predictive capability for volcanic eruptions. The documentation of surface deforma-
tion with InSAR and the integration of space-based remote sensing with infrared imaging
and other tools by NASA could be combined with surface monitoring by others of mi-
croearthquake migration, harmonic tremor development, and borehole strain. On the basis
of case studies with the full complement of measurements, behavior precursory to erup-
tions might be recognizable solely from space observations in remote areas where no land-
based observations are available.
International Partnerships
International satellite partnerships — e.g., GRACE (Gravity Recovery and Climate Experi-
ment, a joint NASA/German Earth system science pathfinder mission), Oersted (Danish
magnetic mission), SAC-C (Argentine and Danish magnetic mission), CHAMP (Challenging
Minisatellite Payload, a German gravity and magnetic mission), and the Radarsat series
(Canadian SAR) — enable NASA to develop a broad range of observation types, to acquire
rich data sets that are shared internationally, and to avoid high initial development costs.
By designing a program architecture that schedules missions with respect to expected in-
ternational developments (without wholly relying on them), NASA greatly improves the
effectiveness of its scientific investment.
For example, the Canadian Radarsats employ C-band mapping, which is particularly useful
for ice dynamics and topography, but that satellite series lacks an L-band frequency. By fo-
cusing on L-band InSAR development, NASA complements and addresses gaps left by ex-
isting and planned missions. Together with
more than 100 organizations worldwide, NASA
supports international services that maintain
the measurement, analysis, and archiving in-
frastructure of geodetic networks and serve
as a forum for innovation, research, and stan-
dards. Space missions such as CHAMP and
GRACE have been initiated in large part
through the venue of international coopera-
tion that these services provide.
.
.
.
.
.
.
.
.
.
.
.
.
.
.
.
.
.
.
.
.
.
.
.
.
.
.
.
.
.
.
.
.
.
.
.
.
.
.
.
.
.
.
.
.
.
.
.
.
.
.
.
.
.
.
.
.
The Challenge
Earthquakes are among nature’s most
complex phenomena, threatening many of
the world’s population centers. A great
Pacific Rim earthquake near a major eco-
nomic area might cause damages well in
excess of one trillion dollars and tens of
thousands of casualties. Reaching an un-
derstanding of earthquake fault systems is
required in order to address the issue of
their predictability, with the goal of miti-
gating their impact.
16
W
Expected Accomplishments
• Characterization of motions of
the Earth’s surface and their
variability on a global scale
• Understanding of fault inter-
actions and transfer of stress
through the crust
• Models that predict the behav-
ior of earthquake systems
Benefits for the Nation
• Enabling of rapid response to
seismic disasters worldwide
• Enhanced global maps of
natural hazards to support
mitigation strategies
• Determination of the existence
of local and regional precur-
sors to earthquakes
“The laws of nature are written deep in the
folds and faults of the earth.”
John Joseph Lynch, former
president of the New York
Academy of Sciences, 1963
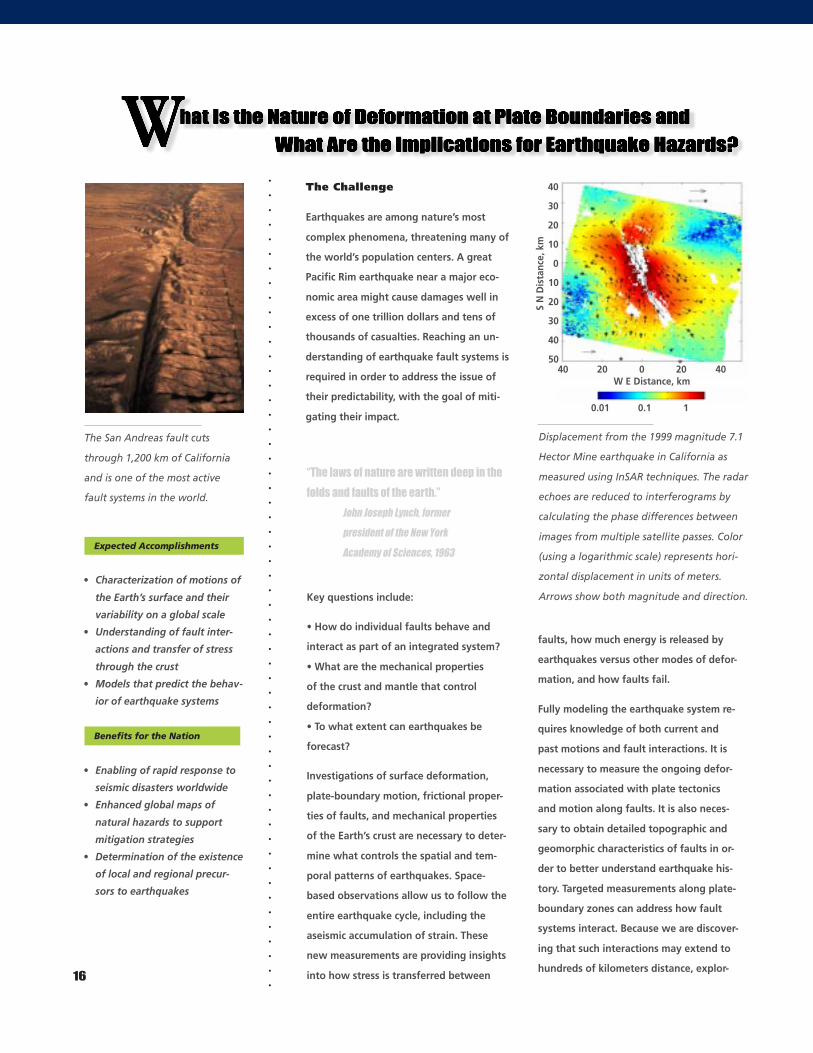
40
30
20
10
0
40 20 0 20
Displacement from the 1999 magnitude 7.1
Hector Mine earthquake in California as
measured using InSAR techniques. The radar
echoes are reduced to interferograms by
calculating the phase differences between
images from multiple satellite passes. Color
(using a logarithmic scale) represents hori-
zontal displacement in units of meters.
Arrows show both magnitude and direction.
The San Andreas fault cuts
through 1,200 km of California
and is one of the most active
fault systems in the world.
Key questions include:
• How do individual faults behave and
interact as part of an integrated system?
• What are the mechanical properties
of the crust and mantle that control
deformation?
• To what extent can earthquakes be
forecast?
Investigations of surface deformation,
plate-boundary motion, frictional proper-
ties of faults, and mechanical properties
of the Earth’s crust are necessary to deter-
mine what controls the spatial and tem-
poral patterns of earthquakes. Space-
based observations allow us to follow the
entire earthquake cycle, including the
aseismic accumulation of strain. These
new measurements are providing insights
into how stress is transferred between
faults, how much energy is released by
earthquakes versus other modes of defor-
mation, and how faults fail.
Fully modeling the earthquake system re-
quires knowledge of both current and
past motions and fault interactions. It is
necessary to measure the ongoing defor-
mation associated with plate tectonics
and motion along faults. It is also neces-
sary to obtain detailed topographic and
geomorphic characteristics of faults in or-
der to better understand earthquake his-
tory. Targeted measurements along plate-
boundary zones can address how fault
systems interact. Because we are discover-
ing that such interactions may extend to
hundreds of kilometers distance, explor-
10
20
30
40
5040
S N
Dis
tanc
e, k
m
W E Distance, km
0.01 0.1 1
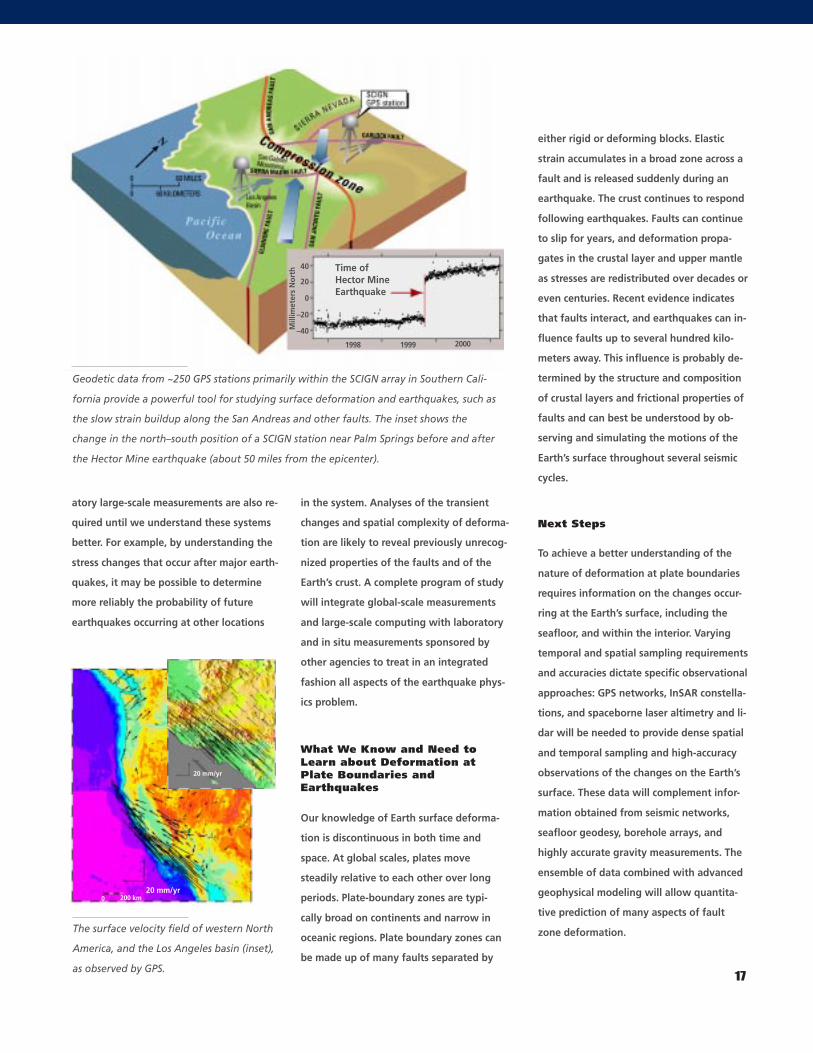
Geodetic data from ~250 GPS stations primarily within the SCIGN array in Southern Cali-
fornia provide a powerful tool for studying surface deformation and earthquakes, such as
the slow strain buildup along the San Andreas and other faults. The inset shows the
change in the north–south position of a SCIGN station near Palm Springs before and after
the Hector Mine earthquake (about 50 miles from the epicenter).
17
What We Know and Need toLearn about Deformation atPlate Boundaries andEarthquakes
Our knowledge of Earth surface deforma-
tion is discontinuous in both time and
space. At global scales, plates move
steadily relative to each other over long
periods. Plate-boundary zones are typi-
cally broad on continents and narrow in
oceanic regions. Plate boundary zones can
be made up of many faults separated by
The surface velocity field of western North
America, and the Los Angeles basin (inset),
as observed by GPS.
Time ofHector MineEarthquake
40
20
–20
–40Mill
imet
ers
Nor
th0
1998 1999 2000
atory large-scale measurements are also re-
quired until we understand these systems
better. For example, by understanding the
stress changes that occur after major earth-
quakes, it may be possible to determine
more reliably the probability of future
earthquakes occurring at other locations
either rigid or deforming blocks. Elastic
strain accumulates in a broad zone across a
fault and is released suddenly during an
earthquake. The crust continues to respond
following earthquakes. Faults can continue
to slip for years, and deformation propa-
gates in the crustal layer and upper mantle
as stresses are redistributed over decades or
even centuries. Recent evidence indicates
that faults interact, and earthquakes can in-
fluence faults up to several hundred kilo-
meters away. This influence is probably de-
termined by the structure and composition
of crustal layers and frictional properties of
faults and can best be understood by ob-
serving and simulating the motions of the
Earth’s surface throughout several seismic
cycles.
Next Steps
To achieve a better understanding of the
nature of deformation at plate boundaries
requires information on the changes occur-
ring at the Earth’s surface, including the
seafloor, and within the interior. Varying
temporal and spatial sampling requirements
and accuracies dictate specific observational
approaches: GPS networks, InSAR constella-
tions, and spaceborne laser altimetry and li-
dar will be needed to provide dense spatial
and temporal sampling and high-accuracy
observations of the changes on the Earth’s
surface. These data will complement infor-
mation obtained from seismic networks,
seafloor geodesy, borehole arrays, and
highly accurate gravity measurements. The
ensemble of data combined with advanced
geophysical modeling will allow quantita-
tive prediction of many aspects of fault
zone deformation.
in the system. Analyses of the transient
changes and spatial complexity of deforma-
tion are likely to reveal previously unrecog-
nized properties of the faults and of the
Earth’s crust. A complete program of study
will integrate global-scale measurements
and large-scale computing with laboratory
and in situ measurements sponsored by
other agencies to treat in an integrated
fashion all aspects of the earthquake phys-
ics problem.
20 mm/yr200 km0
20 mm/yr
The Challenge
In order to lessen the impact of natural
hazards, we need to characterize, under-
stand, and predict the phenomena that
cause them. The land surface is the dy-
namic interface between the lithosphere,
hydrosphere, and biosphere. It is where
interactions represent the most direct
and commonly occurring impacts of solid-
Earth science on humans. Landslides,
floods, tsunamis, debris flows, storm
surges, earthquakes, and volcanic erup-
tions sculpt and deform the land. The
Earth’s surface constitutes the geomor-
phic record of past tectonic–climatic inter-
actions and is the topographic template
upon which new natural hazards are
generated. The challenge presented by
the land surface is three-fold: to unravel
the record of past interactions embedded
in this surface, to determine the relative
roles of natural and human-induced
change, and to understand processes
that act on this surface in order to predict
and mitigate natural hazards. Reconstruc-
tion of past erosion, deformation, and
deposition and quantification of tectonic,
climatic, and biologic inputs to the evolv-
ing landscape will underpin the ability to
develop a process-based understanding
of the Earth’s dynamic surface.
Expected Accomplishments
• Development of a process-based understanding of the tectonic–
climatic–biotic interactions that create landscapes
• Quantification of natural baselines and rates of change of the land surface
• Quantification of the causes, magnitude, and development in time and
space of natural hazards
• Assessment of the relative roles of natural and human-induced changes
Benefits for the Nation
• Real-time prediction of the progression of floods, landslides, and coastal
erosion
• Assessment of susceptibility to damage by natural hazards
• Quantification of watershed dynamics, hydrology, and landscape response
• Definition of the human role in influencing the landscape and abating and
aggravating hazards
.
.
.
.
.
.
.
.
.
.
.
.
.
.
.
.
.
.
.
.
.
.
.
.
.
.
.
.
.
.
.
.
.
.
.
.
.
.
.
.
.
.
.
.
.
.
.
.
.
.
.
.
.
.
.
.
What We Know and Need toLearn about Land SurfaceChange and Natural Hazards
We know the land surface evolves as tec-
tonic forces cause deformation and as
transient hydrologic and biologic forces
mediate erosion and deposition on the
surface. The majority of the destructive
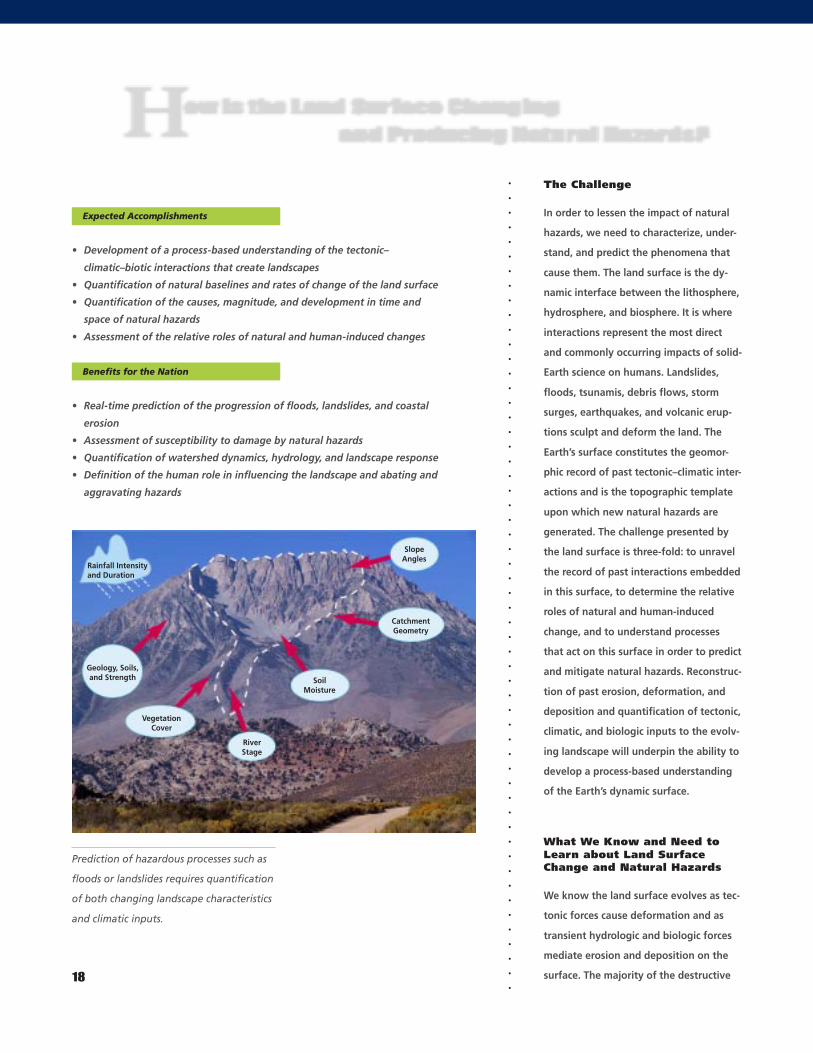
Prediction of hazardous processes such as
floods or landslides requires quantification
of both changing landscape characteristics
and climatic inputs.
18
Rainfall Intensityand Duration
Geology, Soils,and Strength
VegetationCover
RiverStage
SoilMoisture
CatchmentGeometry
SlopeAngles
U.S. earthquakes of the last twenty years
occurred on faults that did not rupture the
surface, although they deformed the land
surface above the fault and promoted new
patterns of erosion. Interpretation of the
deformed land surface allows us to con-
struct rates of fault growth and past seis-
mic activity. As large storms rain upon the
land, topography, soils, vegetation, and
rainfall intensity determine how floods
and landslides are generated. We know
that the amount of antecedent rainfall,
soil cohesion and water content, recent
fire history, water routing through the
landscape, and hillslope angles all interact
to determine where and when a landslide
will occur. Similar interactions determine
how flood waves will migrate through a
catchment and how much sediment will
be eroded, transported, and deposited
during a storm.
Next Steps
Remotely sensed data play an integral role
in reconstructing the recent history of the
land surface and in predicting hazards due
to events such as floods and landslides.
Because land-surface properties change
through time, remote sensing of such
changes yields critical time control on
landscape evolution. Remotely sensed
data can determine properties of the sur-
face and atmosphere in real time and with
a high spatial resolution. Recognition that
destructive floods or landslides can be
launched by intense, short-lived storm
cells a few kilometers in width pinpoints
the need for higher spatial and temporal
resolution of remotely sensed data. At
present, even “well monitored” river
catchments commonly have only a few
gauges measuring precipitation and dis-
charge. Few data exist on soil moisture, 19
thickness, and strength, or on vegetation
cover, fire history, or detailed topography.
The only practical way to gather these
data is through implementation of a
broad-based remote-sensing program. The
height and width of rivers, as well as rain-
fall intensity and amounts, need to be
measured hourly during storms. Develop-
ing a process-based understanding of
natural hazards depends on studies of the
character of previous and ongoing events.
Information needed to address the chal-
lenges falls into the categories of surface,
subsurface, and hydrologic characteriza-
tion. These categories have diverse obser-
vational requirements. Those that change
rapidly, such as river stage or precipita-
tion, call for hourly measurements,
whereas others, such as vegetation, com-
“A man should examine for himself the great piles of superimposed strata, and watch the rivu-
lets bringing down mud, and the waves wearing away the sea-cliffs, in order to comprehend
something about the duration of past time, the monuments of which we see all around us.”
Charles Darwin, from the Origin of Species
monly require seasonal measurements. Oc-
casional (5–10 yr) quantification of soil
composition and thickness would suffice
in areas governed by gradual processes,
but more frequent measurements will be
needed in areas affected by such dynamic
events as flooding or landsliding. The re-
mote sensors that will provide these data
include InSAR, GPS, visible and near infra-
red/thermal infrared (VNIR/TIR) imaging,
multi-parameter SAR, laser altimetry, and
microwave imaging. These observations
will need to be augmented with extensive
land-based measurements and data from
existing and new hydrologic, seismologic,
and geodetic arrays. By means of fre-
quent, high-resolution remote sensing, a
new capability will emerge for predicting
hazards caused by tectonic–climate–land
surface interactions.
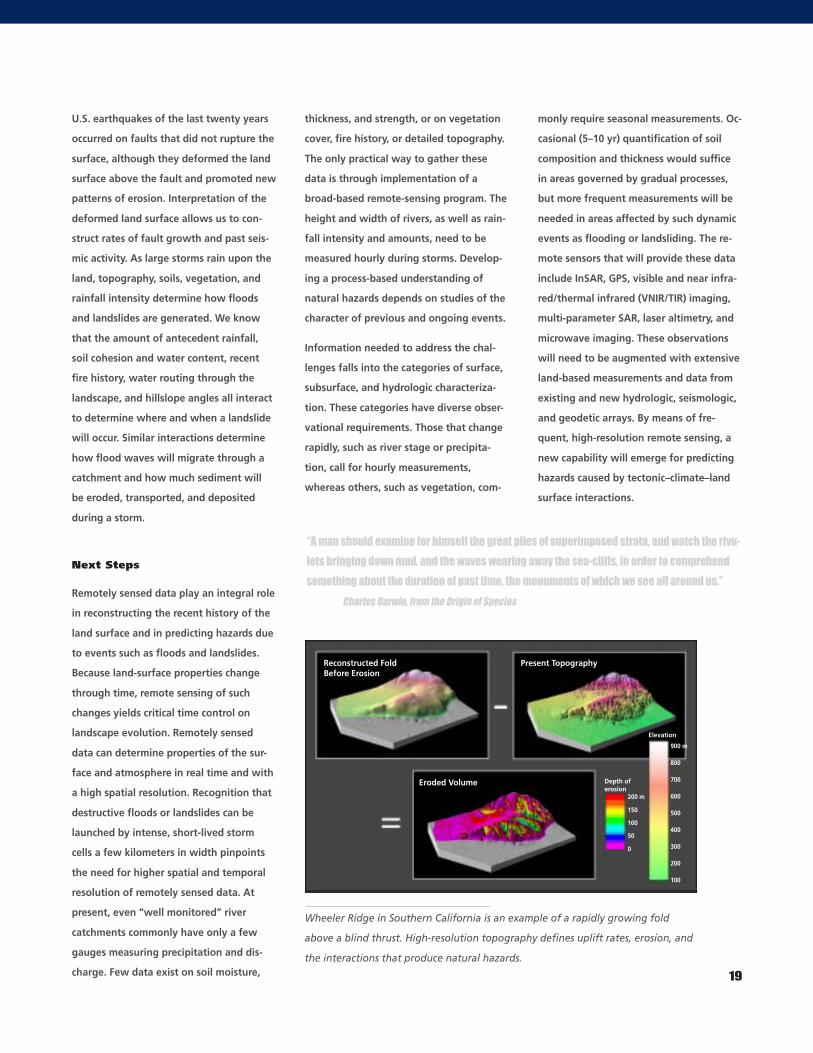
Wheeler Ridge in Southern California is an example of a rapidly growing fold
above a blind thrust. High-resolution topography defines uplift rates, erosion, and
the interactions that produce natural hazards.
Reconstructed FoldBefore Erosion
Present Topography
Eroded Volume Depth oferosion
200 m
0
50
100
150
100
900 m
200
300
400
500
600
700
800
Elevation
.
.
.
.
.
.
.
.
.
.
.
.
.
.
.
.
.
.
.
.
.
.
.
.
.
.
.
.
.
.
.
.
.
.
.
.
.
.
.
.
.
.
.
.
.
.
.
.
.
.
.
.
.
.
.
.
Expected Accomplishments
• Accurate estimation and prediction
of global hydrological mass fluxes,
including those of ice sheets and
glaciers.
• Separation and prediction of steric
(thermal and salinity) and mass-bud-
get contributions in sea-level change.
• Separation of solid-Earth vertical mo-
tion (tectonic, post-glacial rebound,
and environmental) from true sea-
level change.
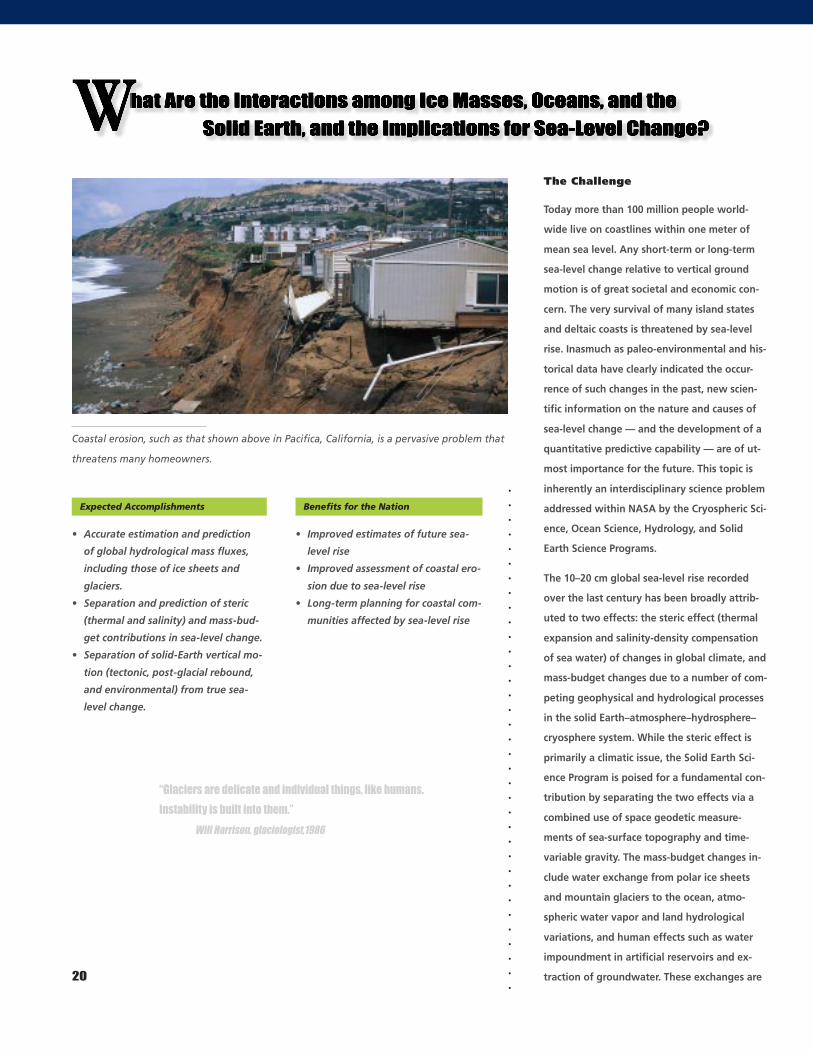
Coastal erosion, such as that shown above in Pacifica, California, is a pervasive problem that
threatens many homeowners.
“Glaciers are delicate and individual things, like humans.
Instability is built into them.”
Will Harrison, glaciologist,1986
20
W
Benefits for the Nation
• Improved estimates of future sea-
level rise
• Improved assessment of coastal ero-
sion due to sea-level rise
• Long-term planning for coastal com-
munities affected by sea-level rise
The Challenge
Today more than 100 million people world-
wide live on coastlines within one meter of
mean sea level. Any short-term or long-term
sea-level change relative to vertical ground
motion is of great societal and economic con-
cern. The very survival of many island states
and deltaic coasts is threatened by sea-level
rise. Inasmuch as paleo-environmental and his-
torical data have clearly indicated the occur-
rence of such changes in the past, new scien-
tific information on the nature and causes of
sea-level change — and the development of a
quantitative predictive capability — are of ut-
most importance for the future. This topic is
inherently an interdisciplinary science problem
addressed within NASA by the Cryospheric Sci-
ence, Ocean Science, Hydrology, and Solid
Earth Science Programs.
The 10–20 cm global sea-level rise recorded
over the last century has been broadly attrib-
uted to two effects: the steric effect (thermal
expansion and salinity-density compensation
of sea water) of changes in global climate, and
mass-budget changes due to a number of com-
peting geophysical and hydrological processes
in the solid Earth–atmosphere–hydrosphere–
cryosphere system. While the steric effect is
primarily a climatic issue, the Solid Earth Sci-
ence Program is poised for a fundamental con-
tribution by separating the two effects via a
combined use of space geodetic measure-
ments of sea-surface topography and time-
variable gravity. The mass-budget changes in-
clude water exchange from polar ice sheets
and mountain glaciers to the ocean, atmo-
spheric water vapor and land hydrological
variations, and human effects such as water
impoundment in artificial reservoirs and ex-
traction of groundwater. These exchanges are
all superimposed on the vertical motions
of the solid Earth due to tectonics, re-
bound of the lithosphere from past and
present deglaciation, and other local
ground motions. A number of space geo-
detic measurements of sea-surface topog-
raphy, ice mass, gravity, and ground mo-
tions are directly relevant. A complete
knowledge of sea-level change will then
emerge and be used for the development
of predictive global and regional models.
What We Know and Needto Learn about the MassBalance of Earth’s Ice Coverand Sea-Level Change
Globally sea level is estimated to rise by
1.5–2 mm/year, but few details are known.
The relative contributions of the steric and
mass-budget effects are under debate, as
are their spatial and temporal variations.
We are presently not certain whether
Greenland and Antarctica are gaining or
losing net ice mass. Estimates of mountain
glacier melting are incomplete. The global
land hydrological budget is not well
known. Even the amount of artificial reser-
voir water impoundment is uncertain by
perhaps a factor of two. If global warming
continues, a most immediate and poten-
tially dominant mass-budget contribution
to sea-level change is likely to come from
the melting of ice masses. The melting of
temperate glaciers could raise sea level by
a few tens of centimeters; the melting of
the ice sheets in West Antarctica could
raise sea level by several meters. Global
and temporally continuous monitoring of
sea-surface topography, ice mass, gravity,
and ground motions is needed. Knowing
how the present ocean “container” de-
forms is also necessary to predict the con-
sequences of sea-level change. On a global
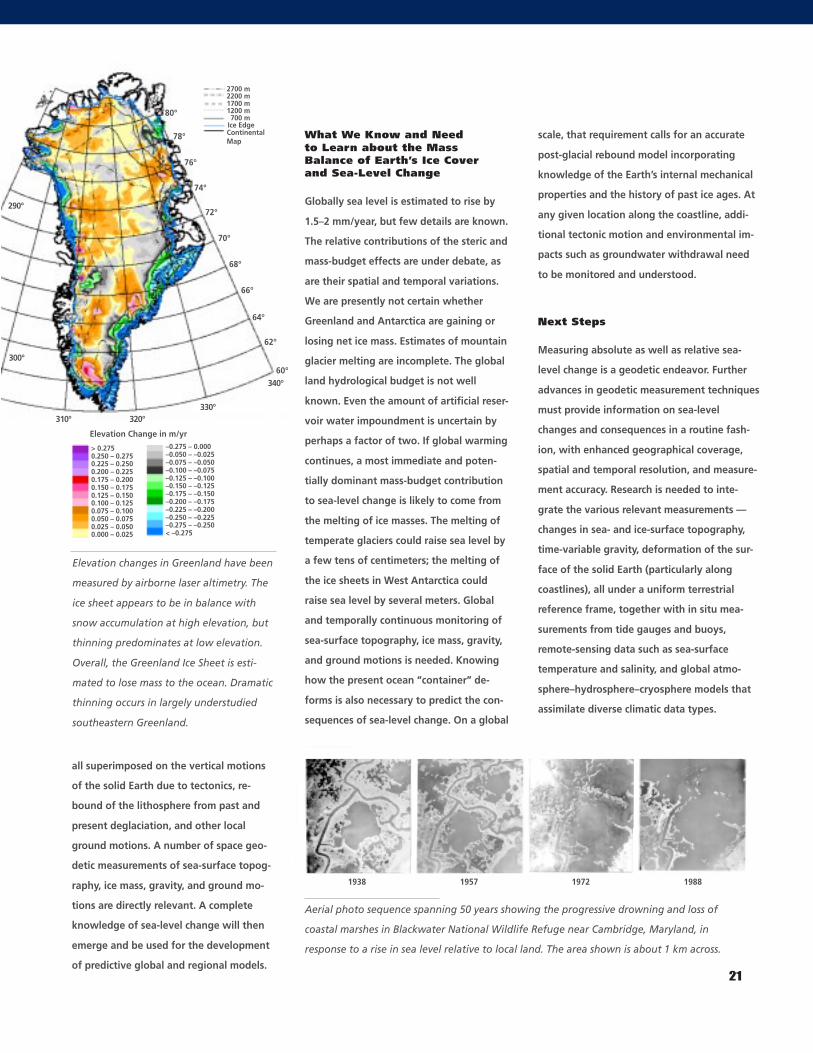
Elevation changes in Greenland have been
measured by airborne laser altimetry. The
ice sheet appears to be in balance with
snow accumulation at high elevation, but
thinning predominates at low elevation.
Overall, the Greenland Ice Sheet is esti-
mated to lose mass to the ocean. Dramatic
thinning occurs in largely understudied
southeastern Greenland.
Next Steps
Measuring absolute as well as relative sea-
level change is a geodetic endeavor. Further
advances in geodetic measurement techniques
must provide information on sea-level
changes and consequences in a routine fash-
ion, with enhanced geographical coverage,
spatial and temporal resolution, and measure-
ment accuracy. Research is needed to inte-
grate the various relevant measurements —
changes in sea- and ice-surface topography,
time-variable gravity, deformation of the sur-
face of the solid Earth (particularly along
coastlines), all under a uniform terrestrial
reference frame, together with in situ mea-
surements from tide gauges and buoys,
remote-sensing data such as sea-surface
temperature and salinity, and global atmo-
sphere–hydrosphere–cryosphere models that
assimilate diverse climatic data types.
21
62°
66°
70°
74°
80°
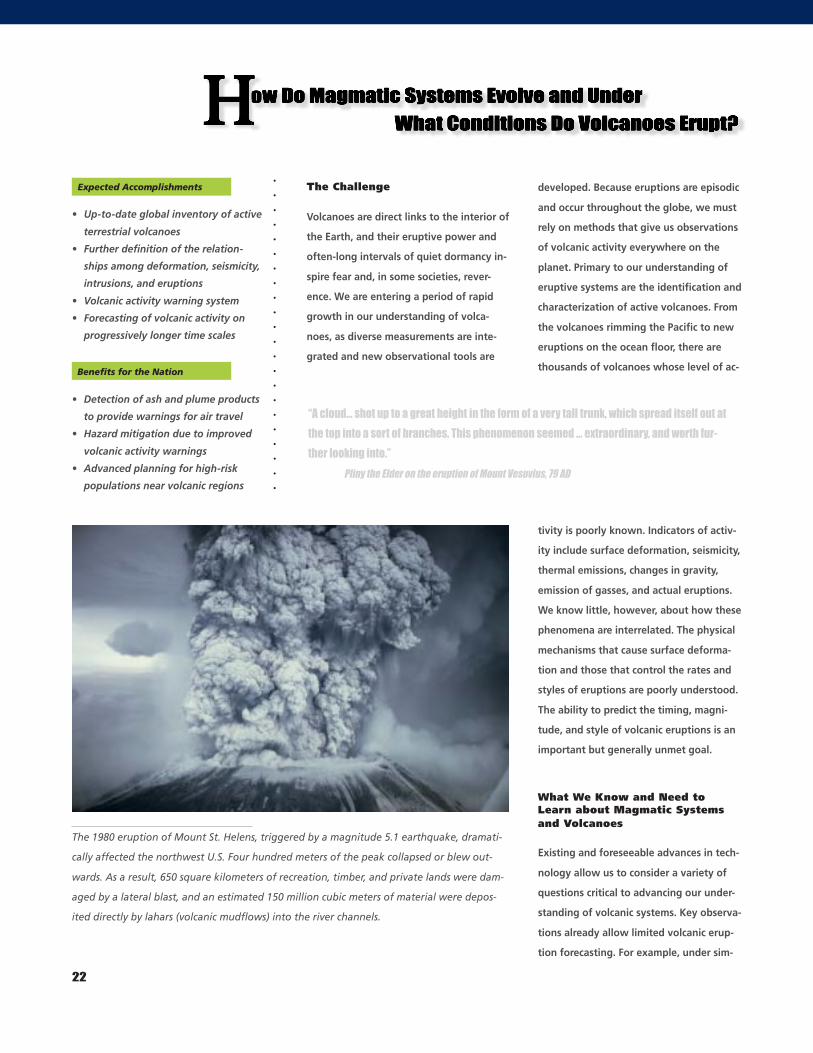
Aerial photo sequence spanning 50 years showing the progressive drowning and loss of
coastal marshes in Blackwater National Wildlife Refuge near Cambridge, Maryland, in
response to a rise in sea level relative to local land. The area shown is about 1 km across.
1938 1957 1972 1988
scale, that requirement calls for an accurate
post-glacial rebound model incorporating
knowledge of the Earth’s internal mechanical
properties and the history of past ice ages. At
any given location along the coastline, addi-
tional tectonic motion and environmental im-
pacts such as groundwater withdrawal need
to be monitored and understood.
64°
68°
72°
76°
78°
60°
1200 m1700 m2200 m2700 m
ContinentalMap
Ice Edge 700 m
0.225 – 0.2500.200 – 0.2250.175 – 0.2000.150 – 0.1750.125 – 0.1500.100 – 0.1250.075 – 0.1000.050 – 0.0750.025 – 0.0500.000 – 0.025
> 0.2750.250 – 0.275
–0.275 – 0.000–0.050 – –0.025–0.075 – –0.050–0.100 – –0.075–0.125 – –0.100–0.150 – –0.125–0.175 – –0.150–0.200 – –0.175–0.225 – –0.200–0.250 – –0.225–0.275 – –0.250< –0.275
310° 320°330°
340°
300°
290°
Elevation Change in m/yr
.
.
.
.
.
.
.
.
.
.
.
.
.
.
.
.
.
.
.
.
.
.
.
.
.
.
.
.
.
.
.
.
.
.
.
.
.
.
.
.
.
.
.
.
.
.
.
.
.
.
.
.
.
.
.
.
.
.
.
.
.
.
.
.
.
.
.
.
.
.
.
.
.
.
.
.
.
.
.
.
.
.
.
.
.
.
.
.
.
.
.
.
.
.
.
.
.
.
.
.
.
.
.
.
.
.
.
.
.
.
.
.
Expected Accomplishments
• Up-to-date global inventory of active
terrestrial volcanoes
• Further definition of the relation-
ships among deformation, seismicity,
intrusions, and eruptions
• Volcanic activity warning system
• Forecasting of volcanic activity on
progressively longer time scales
Benefits for the Nation
• Detection of ash and plume products
to provide warnings for air travel
• Hazard mitigation due to improved
volcanic activity warnings
• Advanced planning for high-risk
populations near volcanic regions
22
The 1980 eruption of Mount St. Helens, triggered by a magnitude 5.1 earthquake, dramati-
cally affected the northwest U.S. Four hundred meters of the peak collapsed or blew out-
wards. As a result, 650 square kilometers of recreation, timber, and private lands were dam-
aged by a lateral blast, and an estimated 150 million cubic meters of material were depos-
ited directly by lahars (volcanic mudflows) into the river channels.
developed. Because eruptions are episodic
and occur throughout the globe, we must
rely on methods that give us observations
of volcanic activity everywhere on the
planet. Primary to our understanding of
eruptive systems are the identification and
characterization of active volcanoes. From
the volcanoes rimming the Pacific to new
eruptions on the ocean floor, there are
thousands of volcanoes whose level of ac-
tivity is poorly known. Indicators of activ-
ity include surface deformation, seismicity,
thermal emissions, changes in gravity,
emission of gasses, and actual eruptions.
We know little, however, about how these
phenomena are interrelated. The physical
mechanisms that cause surface deforma-
tion and those that control the rates and
styles of eruptions are poorly understood.
The ability to predict the timing, magni-
tude, and style of volcanic eruptions is an
important but generally unmet goal.
What We Know and Need toLearn about Magmatic Systems
Existing and foreseeable advances in tech-
nology allow us to consider a variety of
questions critical to advancing our under-
standing of volcanic systems. Key observa-
tions already allow limited volcanic erup-
tion forecasting. For example, under sim-
The Challenge
Volcanoes are direct links to the interior of
the Earth, and their eruptive power and
often-long intervals of quiet dormancy in-
spire fear and, in some societies, rever-
ence. We are entering a period of rapid
growth in our understanding of volca-
noes, as diverse measurements are inte-
grated and new observational tools are
“A cloud... shot up to a great height in the form of a very tall trunk, which spread itself out at
the top into a sort of branches. This phenomenon seemed ... extraordinary, and worth fur-
ther looking into.”
Pliny the Elder on the eruption of Mount Vesuvius, 79 AD
and Volcanoes
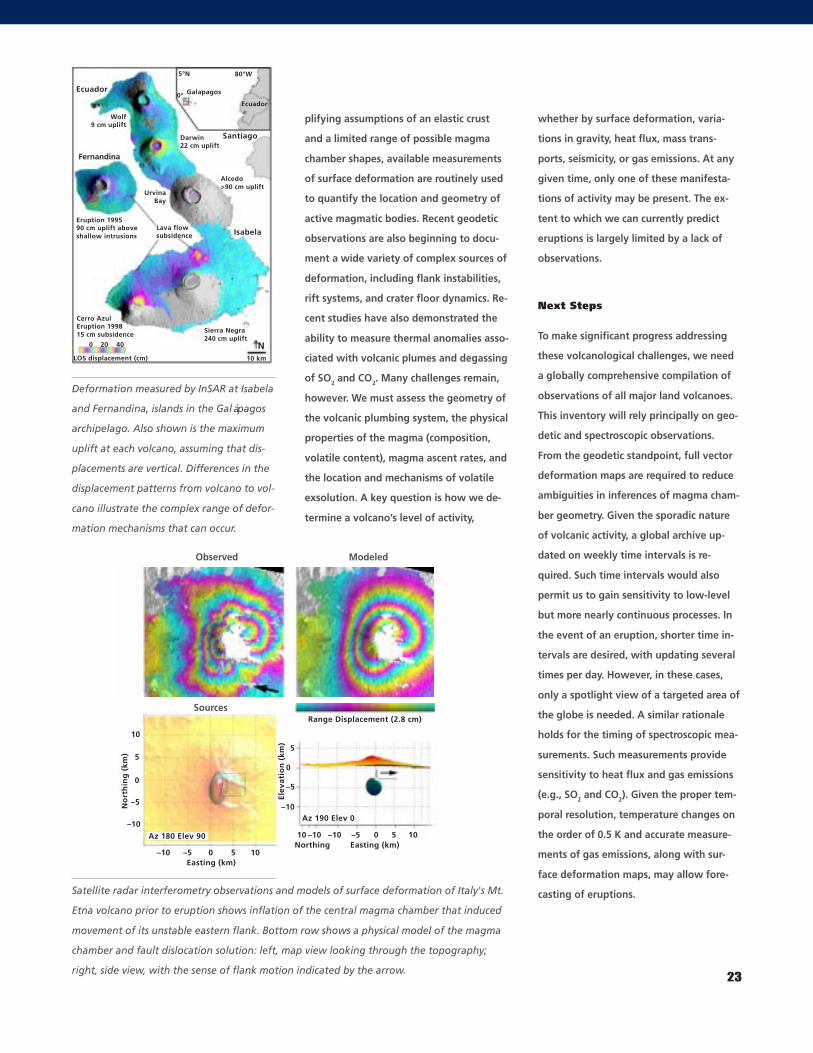
Deformation measured by InSAR at Isabela
and Fernandina, islands in the Galápagos
archipelago. Also shown is the maximum
uplift at each volcano, assuming that dis-
placements are vertical. Differences in the
displacement patterns from volcano to vol-
cano illustrate the complex range of defor-
mation mechanisms that can occur.
plifying assumptions of an elastic crust
and a limited range of possible magma
chamber shapes, available measurements
of surface deformation are routinely used
to quantify the location and geometry of
active magmatic bodies. Recent geodetic
observations are also beginning to docu-
ment a wide variety of complex sources of
deformation, including flank instabilities,
rift systems, and crater floor dynamics. Re-
cent studies have also demonstrated the
ability to measure thermal anomalies asso-
ciated with volcanic plumes and degassing
of SO2 and CO2. Many challenges remain,
however. We must assess the geometry of
the volcanic plumbing system, the physical
properties of the magma (composition,
volatile content), magma ascent rates, and
the location and mechanisms of volatile
exsolution. A key question is how we de-
termine a volcano’s level of activity,
whether by surface deformation, varia-
tions in gravity, heat flux, mass trans-
ports, seismicity, or gas emissions. At any
given time, only one of these manifesta-
tions of activity may be present. The ex-
tent to which we can currently predict
eruptions is largely limited by a lack of
observations.
Next Steps
To make significant progress addressing
these volcanological challenges, we need
a globally comprehensive compilation of
observations of all major land volcanoes.
This inventory will rely principally on geo-
detic and spectroscopic observations.
From the geodetic standpoint, full vector
deformation maps are required to reduce
ambiguities in inferences of magma cham-
ber geometry. Given the sporadic nature
of volcanic activity, a global archive up-
dated on weekly time intervals is re-
quired. Such time intervals would also
permit us to gain sensitivity to low-level
but more nearly continuous processes. In
the event of an eruption, shorter time in-
tervals are desired, with updating several
times per day. However, in these cases,
only a spotlight view of a targeted area of
the globe is needed. A similar rationale
holds for the timing of spectroscopic mea-
surements. Such measurements provide
sensitivity to heat flux and gas emissions
(e.g., SO2 and CO2). Given the proper tem-
poral resolution, temperature changes on
the order of 0.5 K and accurate measure-
ments of gas emissions, along with sur-
face deformation maps, may allow fore-
casting of eruptions.Satellite radar interferometry observations and models of surface deformation of Italy's Mt.
Etna volcano prior to eruption shows inflation of the central magma chamber that induced
movement of its unstable eastern flank. Bottom row shows a physical model of the magma
chamber and fault dislocation solution: left, map view looking through the topography;
right, side view, with the sense of flank motion indicated by the arrow.23
Observed Modeled
Sources
Ecuador
Fernandina
Eruption 199590 cm uplift aboveshallow intrusions
Cerro AzulEruption 199815 cm subsidence
Lava flowsubsidence
Wolf9 cm uplift
Darwin22 cm uplift
Alcedo>90 cm uplift
Sierra Negra240 cm uplift
UrvinaBay
LOS displacement (cm)
0 20 40
Santiago
Isabela
10 km
N
Galapagos
Ecuador
80°W5°N
0°
Range Displacement (2.8 cm)
–10
–5
0
5
Elev
atio
n (
km)
–10
–5
0
No
rth
ing
(km
)
10
5
–10 –5 0 105Easting (km)
–10 –5 0 105Easting (km)
10 –10Northing
Az 190 Elev 0
Az 180 Elev 90
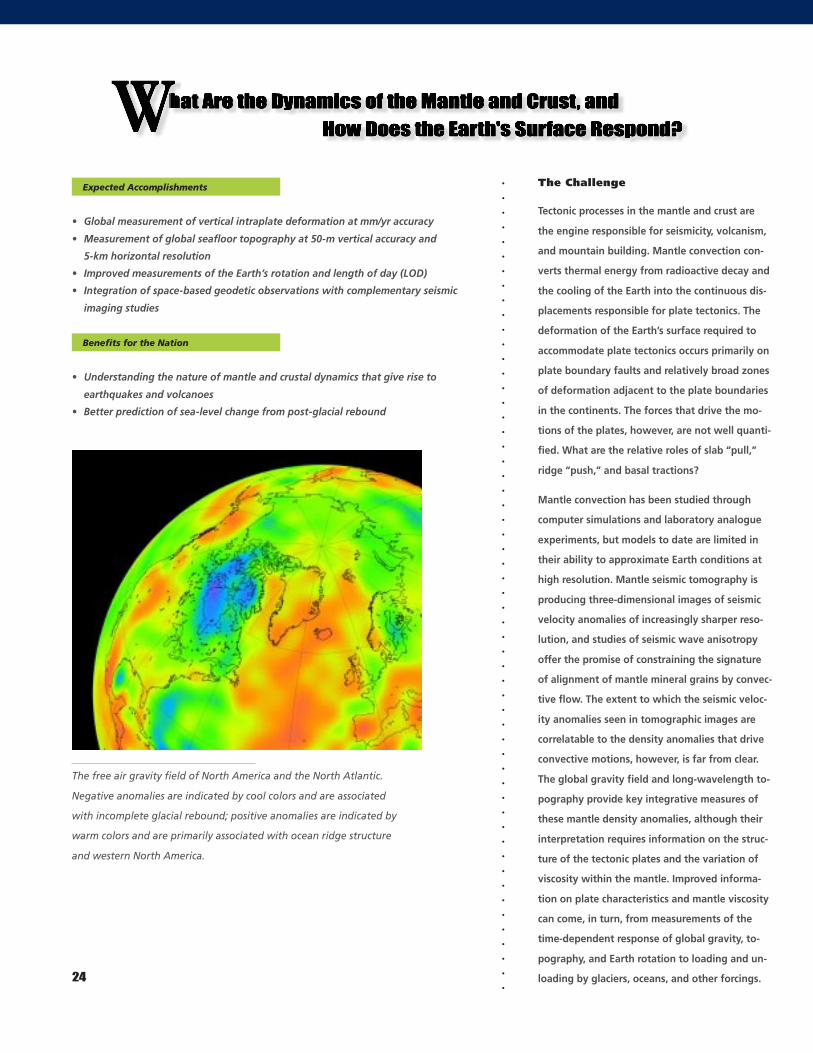
The Challenge
Tectonic processes in the mantle and crust are
the engine responsible for seismicity, volcanism,
and mountain building. Mantle convection con-
verts thermal energy from radioactive decay and
the cooling of the Earth into the continuous dis-
placements responsible for plate tectonics. The
deformation of the Earth’s surface required to
accommodate plate tectonics occurs primarily on
plate boundary faults and relatively broad zones
of deformation adjacent to the plate boundaries
in the continents. The forces that drive the mo-
tions of the plates, however, are not well quanti-
fied. What are the relative roles of slab “pull,”
ridge “push,” and basal tractions?
Mantle convection has been studied through
computer simulations and laboratory analogue
experiments, but models to date are limited in
their ability to approximate Earth conditions at
high resolution. Mantle seismic tomography is
producing three-dimensional images of seismic
velocity anomalies of increasingly sharper reso-
lution, and studies of seismic wave anisotropy
offer the promise of constraining the signature
of alignment of mantle mineral grains by convec-
tive flow. The extent to which the seismic veloc-
ity anomalies seen in tomographic images are
correlatable to the density anomalies that drive
convective motions, however, is far from clear.
The global gravity field and long-wavelength to-
pography provide key integrative measures of
these mantle density anomalies, although their
interpretation requires information on the struc-
ture of the tectonic plates and the variation of
viscosity within the mantle. Improved informa-
tion on plate characteristics and mantle viscosity
can come, in turn, from measurements of the
time-dependent response of global gravity, to-
pography, and Earth rotation to loading and un-
loading by glaciers, oceans, and other forcings.
Expected Accomplishments
• Global measurement of vertical intraplate deformation at mm/yr accuracy
• Measurement of global seafloor topography at 50-m vertical accuracy and
5-km horizontal resolution
• Improved measurements of the Earth’s rotation and length of day (LOD)
• Integration of space-based geodetic observations with complementary seismic
imaging studies
Benefits for the Nation
• Understanding the nature of mantle and crustal dynamics that give rise to
earthquakes and volcanoes
• Better prediction of sea-level change from post-glacial rebound
.
.
.
.
.
.
.
.
.
.
.
.
.
.
.
.
.
.
.
.
.
.
.
.
.
.
.
.
.
.
.
.
.
.
.
.
.
.
.
.
.
.
.
.
.
.
.
.
.
.
.
.
.
.
.
.
W
The free air gravity field of North America and the North Atlantic.
Negative anomalies are indicated by cool colors and are associated
with incomplete glacial rebound; positive anomalies are indicated by
warm colors and are primarily associated with ocean ridge structure
and western North America.
24
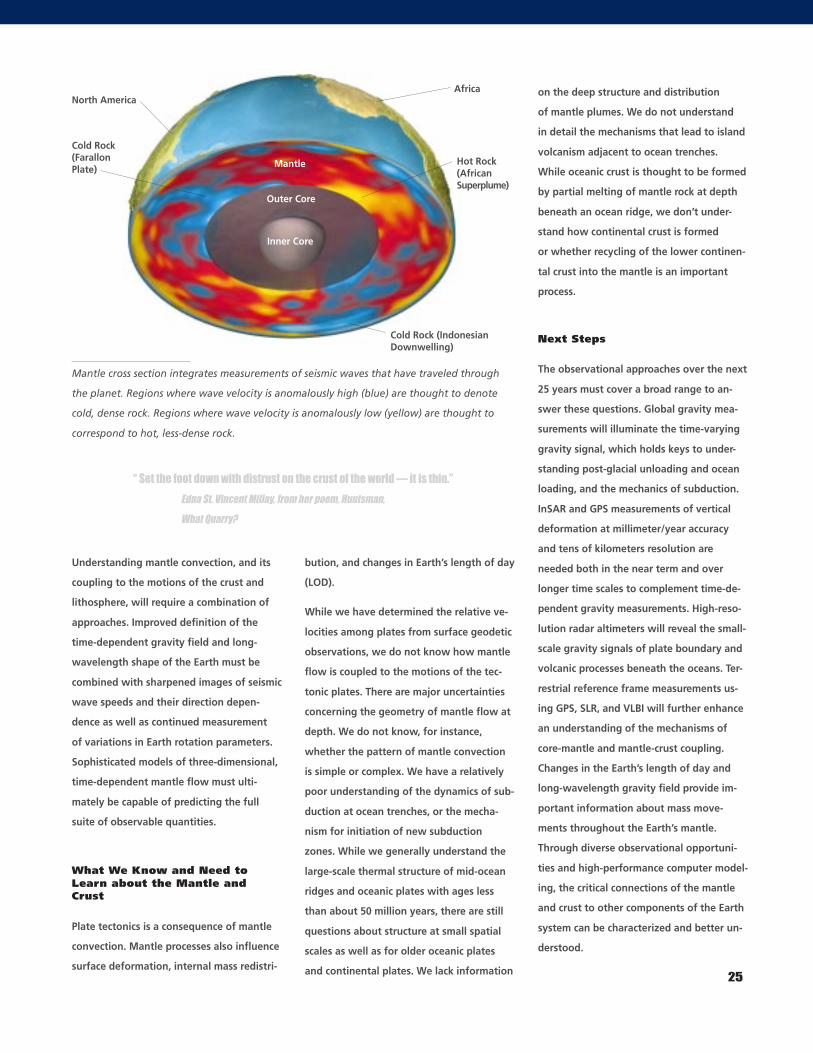
“ Set the foot down with distrust on the crust of the world — it is thin.”
Edna St. Vincent Millay, from her poem, Huntsman,
What Quarry?
Mantle cross section integrates measurements of seismic waves that have traveled through
the planet. Regions where wave velocity is anomalously high (blue) are thought to denote
cold, dense rock. Regions where wave velocity is anomalously low (yellow) are thought to
correspond to hot, less-dense rock.
Understanding mantle convection, and its
coupling to the motions of the crust and
lithosphere, will require a combination of
approaches. Improved definition of the
time-dependent gravity field and long-
wavelength shape of the Earth must be
combined with sharpened images of seismic
wave speeds and their direction depen-
dence as well as continued measurement
of variations in Earth rotation parameters.
Sophisticated models of three-dimensional,
time-dependent mantle flow must ulti-
mately be capable of predicting the full
suite of observable quantities.
What We Know and Need toLearn about the Mantle andCrust
Plate tectonics is a consequence of mantle
convection. Mantle processes also influence
surface deformation, internal mass redistri-
bution, and changes in Earth’s length of day
(LOD).
While we have determined the relative ve-
locities among plates from surface geodetic
observations, we do not know how mantle
flow is coupled to the motions of the tec-
tonic plates. There are major uncertainties
concerning the geometry of mantle flow at
depth. We do not know, for instance,
whether the pattern of mantle convection
is simple or complex. We have a relatively
poor understanding of the dynamics of sub-
duction at ocean trenches, or the mecha-
nism for initiation of new subduction
zones. While we generally understand the
large-scale thermal structure of mid-ocean
ridges and oceanic plates with ages less
than about 50 million years, there are still
questions about structure at small spatial
scales as well as for older oceanic plates
and continental plates. We lack information
on the deep structure and distribution
of mantle plumes. We do not understand
in detail the mechanisms that lead to island
volcanism adjacent to ocean trenches.
While oceanic crust is thought to be formed
by partial melting of mantle rock at depth
beneath an ocean ridge, we don’t under-
stand how continental crust is formed
or whether recycling of the lower continen-
tal crust into the mantle is an important
process.
Next Steps
The observational approaches over the next
25 years must cover a broad range to an-
swer these questions. Global gravity mea-
surements will illuminate the time-varying
gravity signal, which holds keys to under-
standing post-glacial unloading and ocean
loading, and the mechanics of subduction.
InSAR and GPS measurements of vertical
deformation at millimeter/year accuracy
and tens of kilometers resolution are
needed both in the near term and over
longer time scales to complement time-de-
pendent gravity measurements. High-reso-
lution radar altimeters will reveal the small-
scale gravity signals of plate boundary and
volcanic processes beneath the oceans. Ter-
restrial reference frame measurements us-
ing GPS, SLR, and VLBI will further enhance
an understanding of the mechanisms of
core-mantle and mantle-crust coupling.
Changes in the Earth’s length of day and
long-wavelength gravity field provide im-
portant information about mass move-
ments throughout the Earth’s mantle.
Through diverse observational opportuni-
ties and high-performance computer model-
ing, the critical connections of the mantle
and crust to other components of the Earth
system can be characterized and better un-
derstood.
25
Cold Rock (IndonesianDownwelling)
Mantle
Cold Rock(FarallonPlate)
North America
Hot Rock(AfricanSuperplume)
Outer Core
Inner Core
Africa
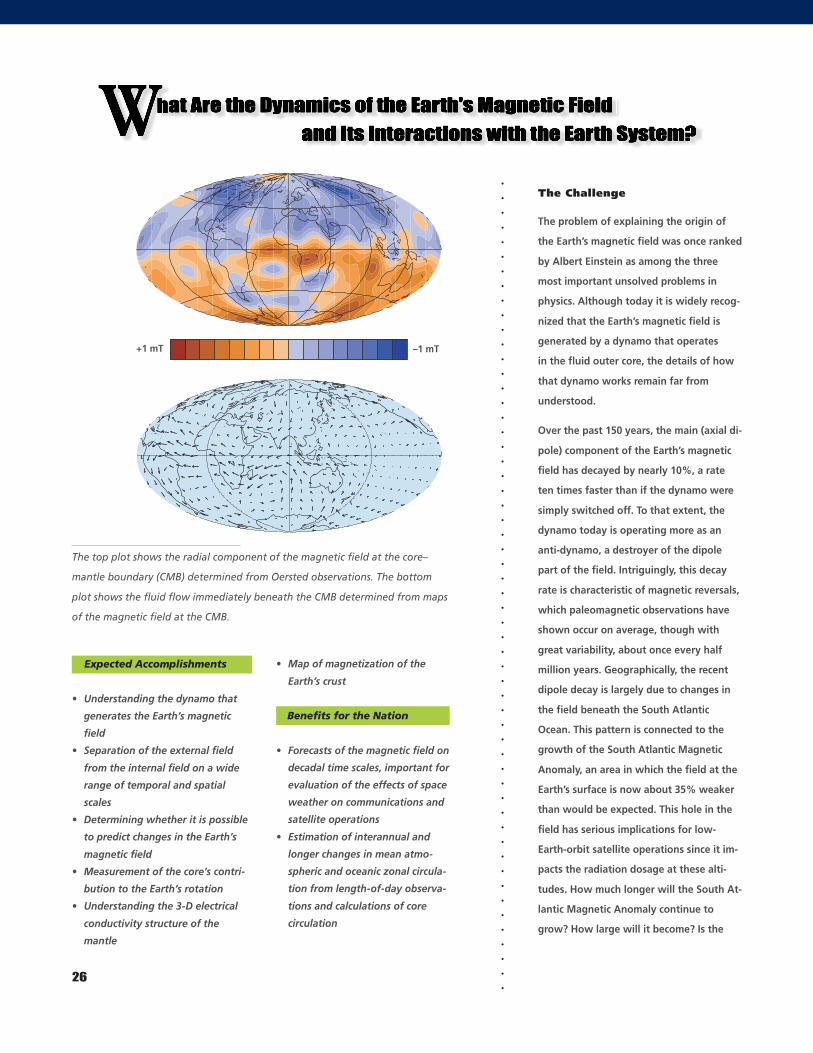
.
.
.
.
.
.
.
.
.
.
.
.
.
.
.
.
.
.
.
.
.
.
.
.
.
.
.
.
.
.
.
.
.
.
.
.
.
.
.
.
.
.
.
.
.
.
.
.
.
.
.
.
.
.
.
.
.
.
.
.
.
.
.
.
.
.
.
.
.
.
.
.
.
.
.
.
.
.
.
.
.
.
.
.
.
.
.
.
.
.
.
.
.
.
.
.
.
.
.
.
.
.
.
.
.
.
.
.
.
.
.
.26
W
• Map of magnetization of the
Earth’s crust
Benefits for the Nation
• Forecasts of the magnetic field on
decadal time scales, important for
evaluation of the effects of space
weather on communications and
satellite operations
• Estimation of interannual and
longer changes in mean atmo-
spheric and oceanic zonal circula-
tion from length-of-day observa-
tions and calculations of core
circulation
Expected Accomplishments
• Understanding the dynamo that
generates the Earth’s magnetic
field
• Separation of the external field
from the internal field on a wide
range of temporal and spatial
scales
• Determining whether it is possible
to predict changes in the Earth’s
magnetic field
• Measurement of the core’s contri-
bution to the Earth’s rotation
• Understanding the 3-D electrical
conductivity structure of the
mantle
The top plot shows the radial component of the magnetic field at the core–
mantle boundary (CMB) determined from Oersted observations. The bottom
plot shows the fluid flow immediately beneath the CMB determined from maps
of the magnetic field at the CMB.
The Challenge
The problem of explaining the origin of
the Earth’s magnetic field was once ranked
by Albert Einstein as among the three
most important unsolved problems in
physics. Although today it is widely recog-
nized that the Earth’s magnetic field is
generated by a dynamo that operates
in the fluid outer core, the details of how
that dynamo works remain far from
understood.
Over the past 150 years, the main (axial di-
pole) component of the Earth’s magnetic
field has decayed by nearly 10%, a rate
ten times faster than if the dynamo were
simply switched off. To that extent, the
dynamo today is operating more as an
anti-dynamo, a destroyer of the dipole
part of the field. Intriguingly, this decay
rate is characteristic of magnetic reversals,
which paleomagnetic observations have
shown occur on average, though with
great variability, about once every half
million years. Geographically, the recent
dipole decay is largely due to changes in
the field beneath the South Atlantic
Ocean. This pattern is connected to the
growth of the South Atlantic Magnetic
Anomaly, an area in which the field at the
Earth’s surface is now about 35% weaker
than would be expected. This hole in the
field has serious implications for low-
Earth-orbit satellite operations since it im-
pacts the radiation dosage at these alti-
tudes. How much longer will the South At-
lantic Magnetic Anomaly continue to
grow? How large will it become? Is the
+1 mT –1 mT
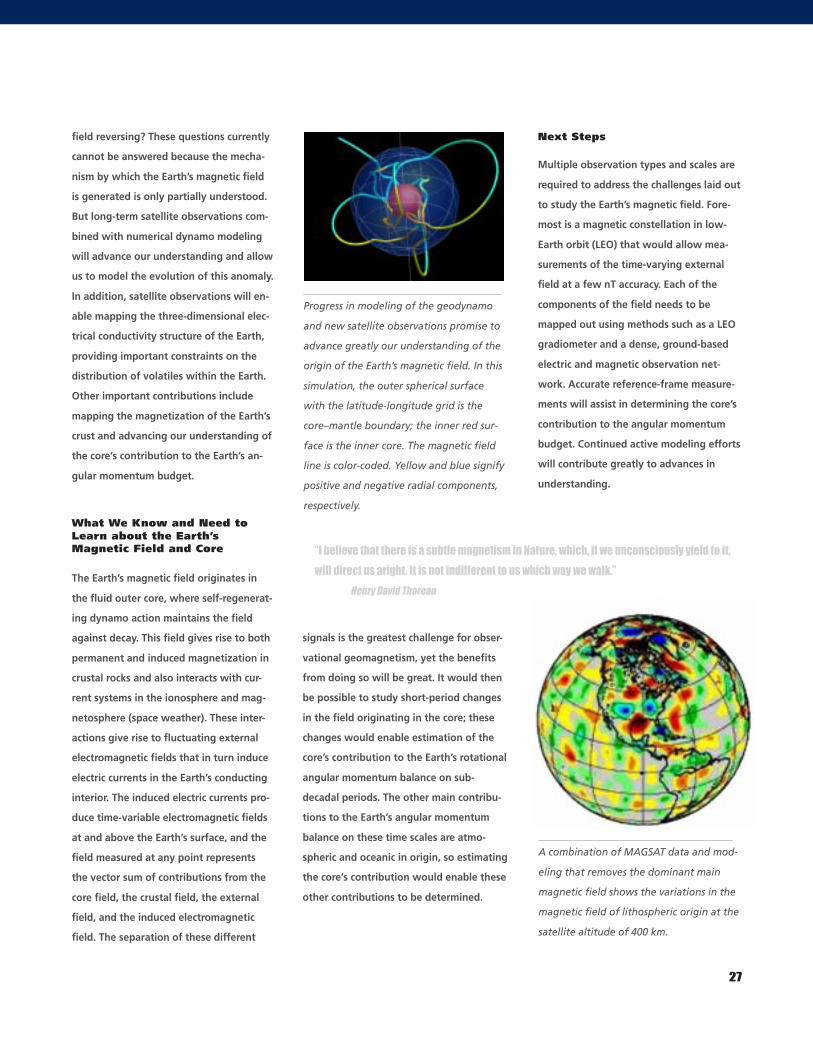
field reversing? These questions currently
cannot be answered because the mecha-
nism by which the Earth’s magnetic field
is generated is only partially understood.
But long-term satellite observations com-
bined with numerical dynamo modeling
will advance our understanding and allow
us to model the evolution of this anomaly.
In addition, satellite observations will en-
able mapping the three-dimensional elec-
trical conductivity structure of the Earth,
providing important constraints on the
distribution of volatiles within the Earth.
Other important contributions include
mapping the magnetization of the Earth’s
crust and advancing our understanding of
the core’s contribution to the Earth’s an-
gular momentum budget.
What We Know and Need toLearn about the Earth’sMagnetic Field and Core
The Earth’s magnetic field originates in
the fluid outer core, where self-regenerat-
ing dynamo action maintains the field
against decay. This field gives rise to both
permanent and induced magnetization in
crustal rocks and also interacts with cur-
rent systems in the ionosphere and mag-
netosphere (space weather). These inter-
actions give rise to fluctuating external
electromagnetic fields that in turn induce
electric currents in the Earth’s conducting
interior. The induced electric currents pro-
duce time-variable electromagnetic fields
at and above the Earth’s surface, and the
field measured at any point represents
the vector sum of contributions from the
core field, the crustal field, the external
field, and the induced electromagnetic
field. The separation of these different
signals is the greatest challenge for obser-
vational geomagnetism, yet the benefits
from doing so will be great. It would then
be possible to study short-period changes
in the field originating in the core; these
changes would enable estimation of the
core’s contribution to the Earth’s rotational
angular momentum balance on sub-
decadal periods. The other main contribu-
tions to the Earth’s angular momentum
balance on these time scales are atmo-
spheric and oceanic in origin, so estimating
the core’s contribution would enable these
other contributions to be determined.
“I believe that there is a subtle magnetism in Nature, which, if we unconsciously yield to it,
will direct us aright. It is not indifferent to us which way we walk.”
Henry David Thoreau
Next Steps
Multiple observation types and scales are
required to address the challenges laid out
to study the Earth’s magnetic field. Fore-
most is a magnetic constellation in low-
Earth orbit (LEO) that would allow mea-
surements of the time-varying external
field at a few nT accuracy. Each of the
components of the field needs to be
mapped out using methods such as a LEO
gradiometer and a dense, ground-based
electric and magnetic observation net-
work. Accurate reference-frame measure-
ments will assist in determining the core’s
contribution to the angular momentum
budget. Continued active modeling efforts
will contribute greatly to advances in
understanding.
27
Progress in modeling of the geodynamo
and new satellite observations promise to
advance greatly our understanding of the
origin of the Earth’s magnetic field. In this
simulation, the outer spherical surface
with the latitude-longitude grid is the
core–mantle boundary; the inner red sur-
face is the inner core. The magnetic field
line is color-coded. Yellow and blue signify
positive and negative radial components,
respectively.
A combination of MAGSAT data and mod-
eling that removes the dominant main
magnetic field shows the variations in the
magnetic field of lithospheric origin at the
satellite altitude of 400 km.
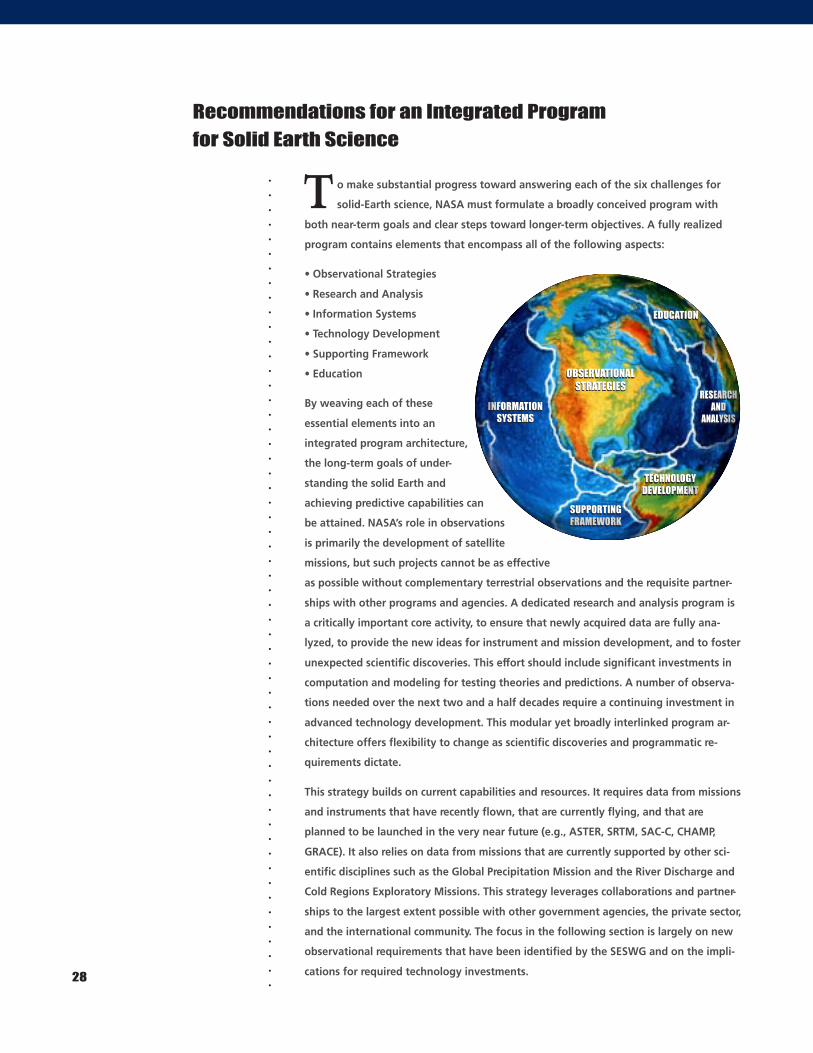
.
.
.
.
.
.
.
.
.
.
.
.
.
.
.
.
.
.
.
.
.
.
.
.
.
.
.
.
.
.
.
.
.
.
.
.
.
.
.
.
.
.
.
.
.
.
.
.
.
.
.
.
.
.
.
.
o make substantial progress toward answering each of the six challenges for
solid-Earth science, NASA must formulate a broadly conceived program with
both near-term goals and clear steps toward longer-term objectives. A fully realized
program contains elements that encompass all of the following aspects:
• Observational Strategies
• Research and Analysis
• Information Systems
• Technology Development
• Supporting Framework
• Education
By weaving each of these
essential elements into an
integrated program architecture,
the long-term goals of under-
standing the solid Earth and
achieving predictive capabilities can
be attained. NASA’s role in observations
is primarily the development of satellite
missions, but such projects cannot be as effective
as possible without complementary terrestrial observations and the requisite partner-
ships with other programs and agencies. A dedicated research and analysis program is
a critically important core activity, to ensure that newly acquired data are fully ana-
lyzed, to provide the new ideas for instrument and mission development, and to foster
unexpected scientific discoveries. This effort should include significant investments in
computation and modeling for testing theories and predictions. A number of observa-
tions needed over the next two and a half decades require a continuing investment in
advanced technology development. This modular yet broadly interlinked program ar-
chitecture offers flexibility to change as scientific discoveries and programmatic re-
quirements dictate.
This strategy builds on current capabilities and resources. It requires data from missions
and instruments that have recently flown, that are currently flying, and that are
planned to be launched in the very near future (e.g., ASTER, SRTM, SAC-C, CHAMP,
GRACE). It also relies on data from missions that are currently supported by other sci-
entific disciplines such as the Global Precipitation Mission and the River Discharge and
Cold Regions Exploratory Missions. This strategy leverages collaborations and partner-
ships to the largest extent possible with other government agencies, the private sector,
and the international community. The focus in the following section is largely on new
observational requirements that have been identified by the SESWG and on the impli-
cations for required technology investments.
Recommendations for an Integrated Program
for Solid Earth Science
28
T
INFORMATIONSYSTEMS
INFORMATIONSYSTEMS
RESEARCHAND
ANALYSIS
RESEARCHAND
ANALYSIS
EDUCATIONEDUCATION
TECHNOLOGYDEVELOPMENTTECHNOLOGY
DEVELOPMENT
SUPPORTINGFRAMEWORKSUPPORTINGFRAMEWORK
OBSERVATIONALSTRATEGIES
OBSERVATIONALSTRATEGIES
.
.
.
.
.
.
.
.
.
.
.
.
.
.
.
.
.
.
.
.
.
.
.
.
.
.
.
.
.
.
.
.
.
.
.
.
.
.
.
.
.
.
.
.
.
.
.
.
.
.
.
.
.
.
.
.
Observational Strategies
Understanding the solid Earth and moving toward predictive capabilities where appro-
priate requires a broad observational strategy, incorporating numerous methodologies
(including spaceborne and ground measurements), technological advances, and
complementarity among observations. The SESWG recommends the following seven
observational strategies to address the fundamental solid-Earth questions that frame
this report.
1. Surface Deformation
The land surface deforms both vertically and horizontally as a result of a number of
geological and geophysical processes, many of which have significant implications for
natural hazards. Episodic deformations arise from earthquakes and volcanic activities
whose measurements are essential to understanding and mitigating these natural haz-
ards. Aseismic deformation before and after earthquakes can now be measured as a re-
sult of space technologies and are key to understanding earthquakes and the Earth’s in-
ternal dynamics. Post-glacial rebound occurs by slow, large-scale deformation that pro-
vides great insight into the mechanical properties of the solid Earth. Local land subsid-
ence due to groundwater withdrawal, river and coastal erosion and deposition, land-
slides, and debris flows all impact the land surface and affect human livelihood. Con-
tinuous perturbations arise from solid-Earth tides and loading by variations in atmo-
spheric pressure, oceanic circulation, and the distribution of water and ice.
Centimeter to millimeter/year accuracies are necessary to make meaningful detection
of these land changes. The space geodetic techniques of satellite laser ranging, very-
long-baseline interferometry, and geodetic GPS have in the past decade successfully
measured relative horizontal motions among tectonic plates, as well as differential
crustal movements along many active plate boundaries. In recent years they have also
detected the postglacial rebound signal and the coseismic and postseismic deforma-
tions associated with several large earthquakes.
29
1. Surface Deformation
2. High-Resolution Topography
3. Variability of Earth’sMagnetic Field
4. Variability of Earth’sGravity Field
Recommended Observational Strategies
5. Imaging Spectroscopy ofEarth’s Changing Surface
6. Space Geodetic Networks andthe International TerrestrialReference Frame
7. Promising Techniques andObservations
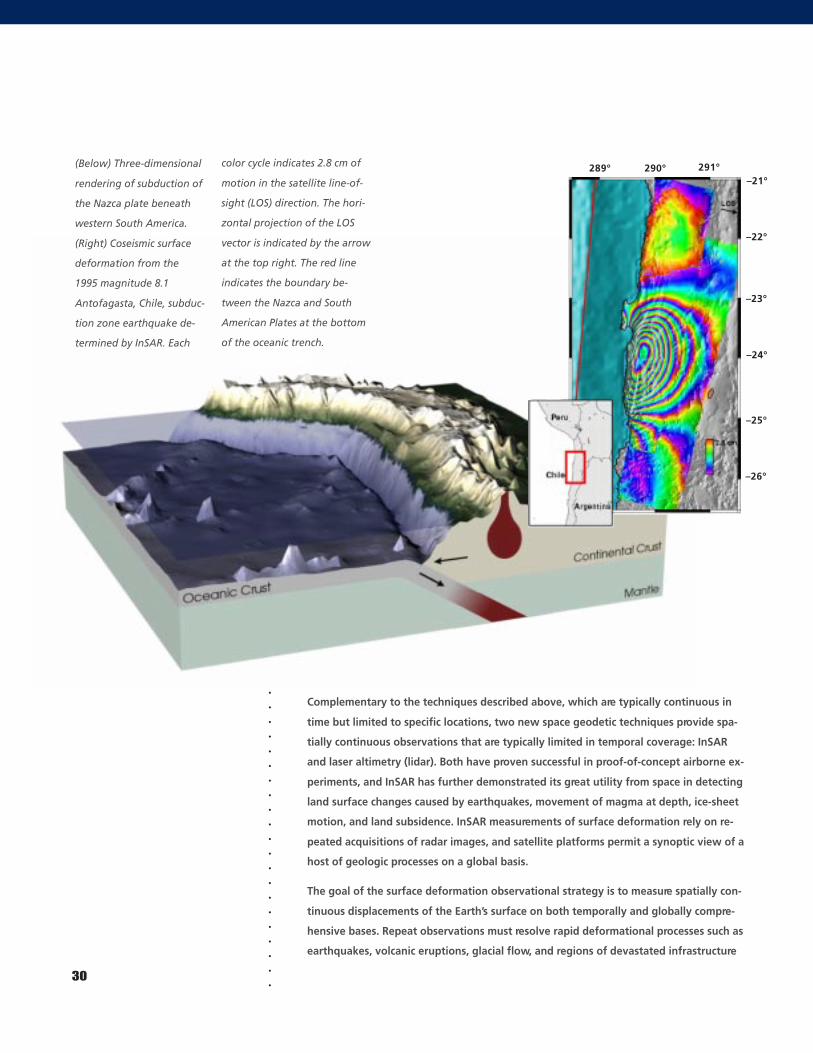
.
.
.
.
.
.
.
.
.
.
.
.
.
.
.
.
.
.
.
.
.
.
.
.
.
.
.
.
.
.
.
.
.
.
.
.
.
.
.
.
.
.
.
.
.
.
.
.
.
.
.
.
.
.
.
.30
–21°
–22°
–23°
–24°
–25°
–26°
289° 290° 291°(Below) Three-dimensional
rendering of subduction of
the Nazca plate beneath
western South America.
(Right) Coseismic surface
deformation from the
1995 magnitude 8.1
Antofagasta, Chile, subduc-
tion zone earthquake de-
termined by InSAR. Each
color cycle indicates 2.8 cm of
motion in the satellite line-of-
sight (LOS) direction. The hori-
zontal projection of the LOS
vector is indicated by the arrow
at the top right. The red line
indicates the boundary be-
tween the Nazca and South
American Plates at the bottom
of the oceanic trench.
Complementary to the techniques described above, which are typically continuous in
time but limited to specific locations, two new space geodetic techniques provide spa-
tially continuous observations that are typically limited in temporal coverage: InSAR
and laser altimetry (lidar). Both have proven successful in proof-of-concept airborne ex-
periments, and InSAR has further demonstrated its great utility from space in detecting
land surface changes caused by earthquakes, movement of magma at depth, ice-sheet
motion, and land subsidence. InSAR measurements of surface deformation rely on re-
peated acquisitions of radar images, and satellite platforms permit a synoptic view of a
host of geologic processes on a global basis.
The goal of the surface deformation observational strategy is to measure spatially con-
tinuous displacements of the Earth’s surface on both temporally and globally compre-
hensive bases. Repeat observations must resolve rapid deformational processes such as
earthquakes, volcanic eruptions, glacial flow, and regions of devastated infrastructure
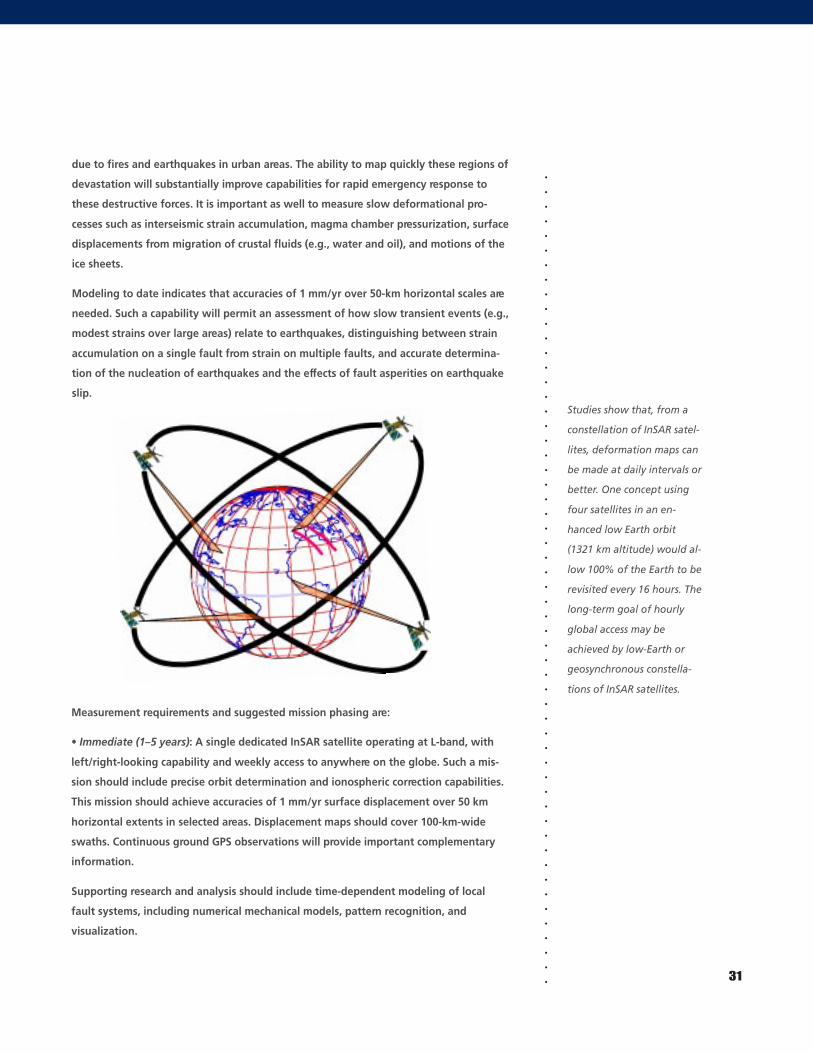
.
.
.
.
.
.
.
.
.
.
.
.
.
.
.
.
.
.
.
.
.
.
.
.
.
.
.
.
.
.
.
.
.
.
.
.
.
.
.
.
.
.
.
.
.
.
.
.
.
.
.
.
.
.
.
.
due to fires and earthquakes in urban areas. The ability to map quickly these regions of
devastation will substantially improve capabilities for rapid emergency response to
these destructive forces. It is important as well to measure slow deformational pro-
cesses such as interseismic strain accumulation, magma chamber pressurization, surface
displacements from migration of crustal fluids (e.g., water and oil), and motions of the
ice sheets.
Modeling to date indicates that accuracies of 1 mm/yr over 50-km horizontal scales are
needed. Such a capability will permit an assessment of how slow transient events (e.g.,
modest strains over large areas) relate to earthquakes, distinguishing between strain
accumulation on a single fault from strain on multiple faults, and accurate determina-
tion of the nucleation of earthquakes and the effects of fault asperities on earthquake
slip.
31
Measurement requirements and suggested mission phasing are:
• Immediate (1–5 years): A single dedicated InSAR satellite operating at L-band, with
left/right-looking capability and weekly access to anywhere on the globe. Such a mis-
sion should include precise orbit determination and ionospheric correction capabilities.
This mission should achieve accuracies of 1 mm/yr surface displacement over 50 km
horizontal extents in selected areas. Displacement maps should cover 100-km-wide
swaths. Continuous ground GPS observations will provide important complementary
information.
Supporting research and analysis should include time-dependent modeling of local
fault systems, including numerical mechanical models, pattern recognition, and
visualization.
Studies show that, from a
constellation of InSAR satel-
lites, deformation maps can
be made at daily intervals or
better. One concept using
four satellites in an en-
hanced low Earth orbit
(1321 km altitude) would al-
low 100% of the Earth to be
revisited every 16 hours. The
long-term goal of hourly
global access may be
achieved by low-Earth or
geosynchronous constella-
tions of InSAR satellites.
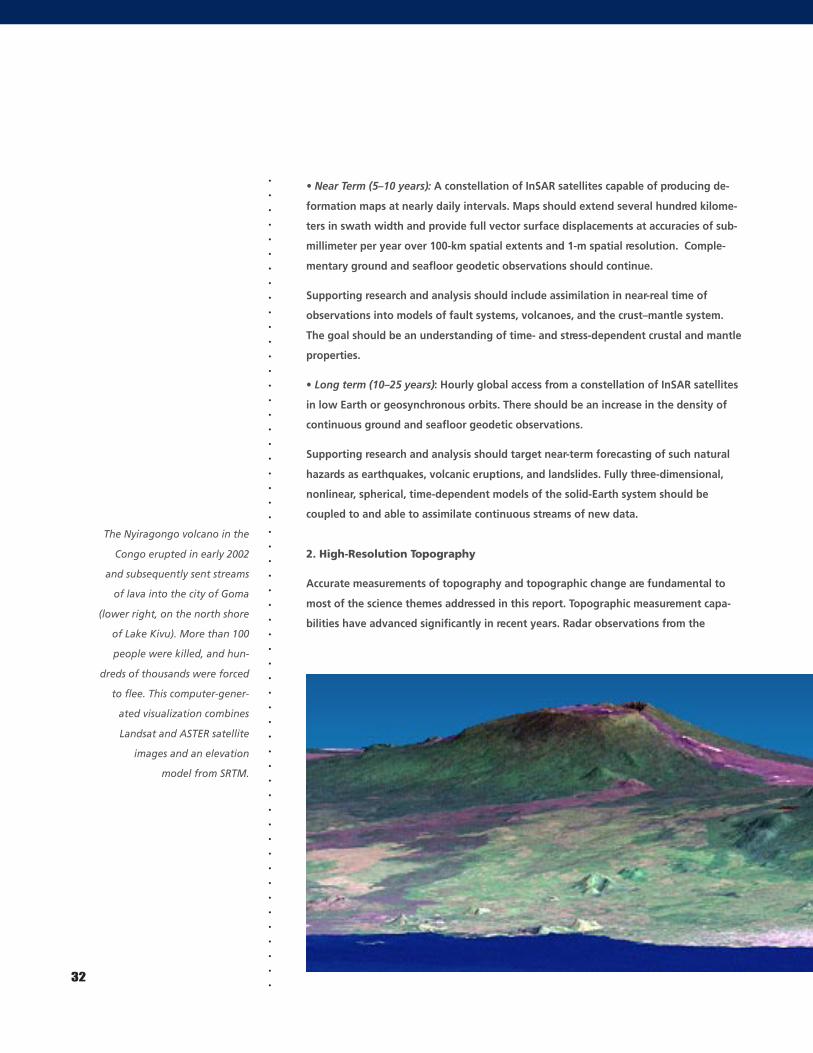
.
.
.
.
.
.
.
.
.
.
.
.
.
.
.
.
.
.
.
.
.
.
.
.
.
.
.
.
.
.
.
.
.
.
.
.
.
.
.
.
.
.
.
.
.
.
.
.
.
.
.
.
.
.
.
.32
• Near Term (5–10 years): A constellation of InSAR satellites capable of producing de-
formation maps at nearly daily intervals. Maps should extend several hundred kilome-
ters in swath width and provide full vector surface displacements at accuracies of sub-
millimeter per year over 100-km spatial extents and 1-m spatial resolution. Comple-
mentary ground and seafloor geodetic observations should continue.
Supporting research and analysis should include assimilation in near-real time of
observations into models of fault systems, volcanoes, and the crust–mantle system.
The goal should be an understanding of time- and stress-dependent crustal and mantle
properties.
• Long term (10–25 years): Hourly global access from a constellation of InSAR satellites
in low Earth or geosynchronous orbits. There should be an increase in the density of
continuous ground and seafloor geodetic observations.
Supporting research and analysis should target near-term forecasting of such natural
hazards as earthquakes, volcanic eruptions, and landslides. Fully three-dimensional,
nonlinear, spherical, time-dependent models of the solid-Earth system should be
coupled to and able to assimilate continuous streams of new data.
2. High-Resolution Topography
Accurate measurements of topography and topographic change are fundamental to
most of the science themes addressed in this report. Topographic measurement capa-
bilities have advanced significantly in recent years. Radar observations from the
The Nyiragongo volcano in the
Congo erupted in early 2002
and subsequently sent streams
of lava into the city of Goma
(lower right, on the north shore
of Lake Kivu). More than 100
people were killed, and hun-
dreds of thousands were forced
to flee. This computer-gener-
ated visualization combines
Landsat and ASTER satellite
images and an elevation
model from SRTM.
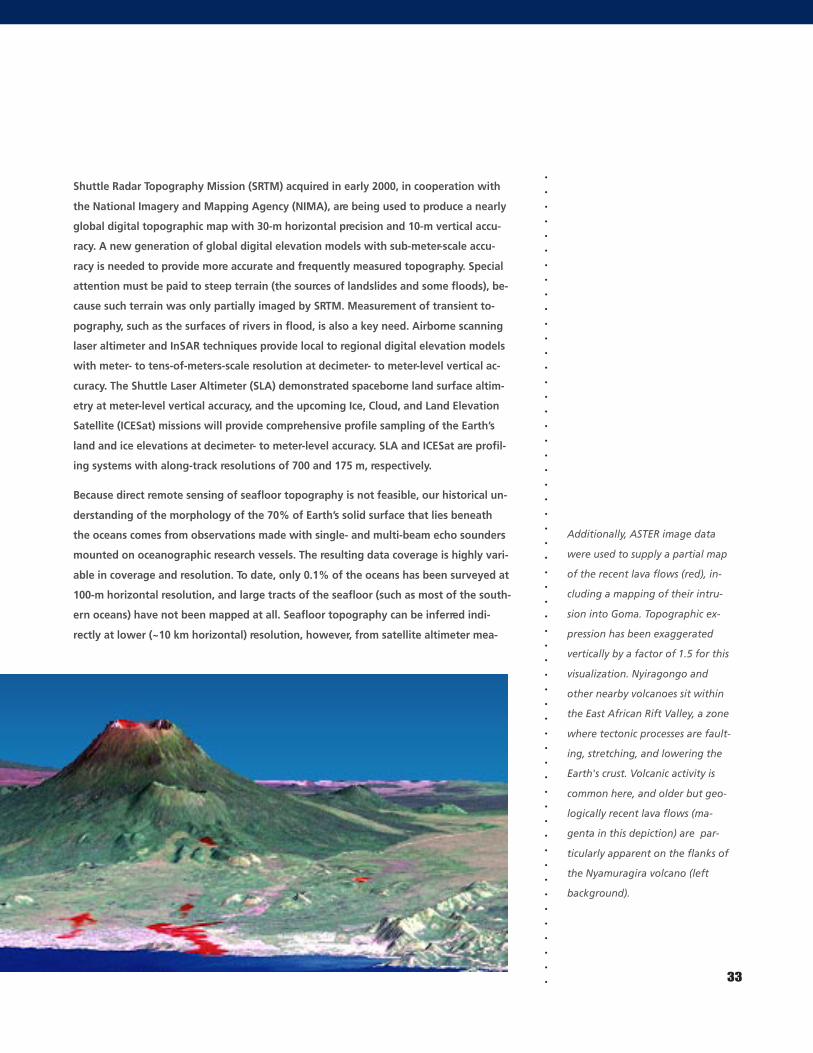
.
.
.
.
.
.
.
.
.
.
.
.
.
.
.
.
.
.
.
.
.
.
.
.
.
.
.
.
.
.
.
.
.
.
.
.
.
.
.
.
.
.
.
.
.
.
.
.
.
.
.
.
.
.
.
. 33
Additionally, ASTER image data
were used to supply a partial map
of the recent lava flows (red), in-
cluding a mapping of their intru-
sion into Goma. Topographic ex-
pression has been exaggerated
vertically by a factor of 1.5 for this
visualization. Nyiragongo and
other nearby volcanoes sit within
the East African Rift Valley, a zone
where tectonic processes are fault-
ing, stretching, and lowering the
Earth's crust. Volcanic activity is
common here, and older but geo-
logically recent lava flows (ma-
genta in this depiction) are par-
ticularly apparent on the flanks of
the Nyamuragira volcano (left
background).
Shuttle Radar Topography Mission (SRTM) acquired in early 2000, in cooperation with
the National Imagery and Mapping Agency (NIMA), are being used to produce a nearly
global digital topographic map with 30-m horizontal precision and 10-m vertical accu-
racy. A new generation of global digital elevation models with sub-meter-scale accu-
racy is needed to provide more accurate and frequently measured topography. Special
attention must be paid to steep terrain (the sources of landslides and some floods), be-
cause such terrain was only partially imaged by SRTM. Measurement of transient to-
pography, such as the surfaces of rivers in flood, is also a key need. Airborne scanning
laser altimeter and InSAR techniques provide local to regional digital elevation models
with meter- to tens-of-meters-scale resolution at decimeter- to meter-level vertical ac-
curacy. The Shuttle Laser Altimeter (SLA) demonstrated spaceborne land surface altim-
etry at meter-level vertical accuracy, and the upcoming Ice, Cloud, and Land Elevation
Satellite (ICESat) missions will provide comprehensive profile sampling of the Earth’s
land and ice elevations at decimeter- to meter-level accuracy. SLA and ICESat are profil-
ing systems with along-track resolutions of 700 and 175 m, respectively.
Because direct remote sensing of seafloor topography is not feasible, our historical un-
derstanding of the morphology of the 70% of Earth’s solid surface that lies beneath
the oceans comes from observations made with single- and multi-beam echo sounders
mounted on oceanographic research vessels. The resulting data coverage is highly vari-
able in coverage and resolution. To date, only 0.1% of the oceans has been surveyed at
100-m horizontal resolution, and large tracts of the seafloor (such as most of the south-
ern oceans) have not been mapped at all. Seafloor topography can be inferred indi-
rectly at lower (~10 km horizontal) resolution, however, from satellite altimeter mea-
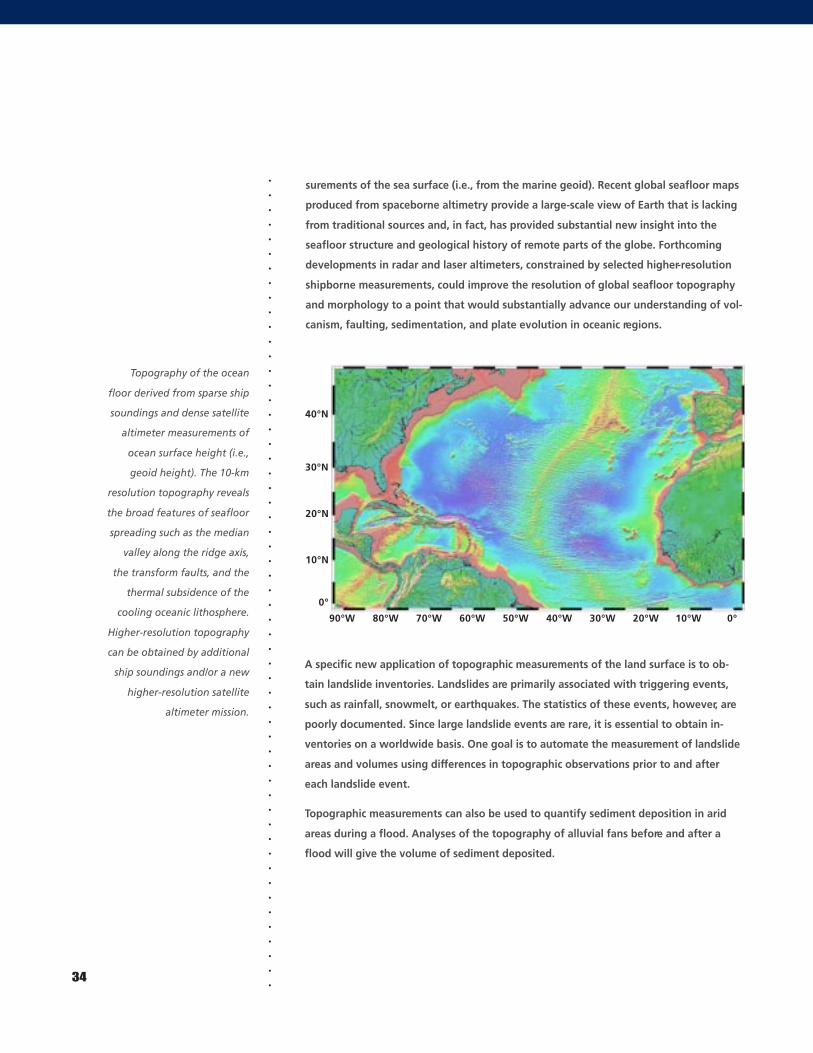
.
.
.
.
.
.
.
.
.
.
.
.
.
.
.
.
.
.
.
.
.
.
.
.
.
.
.
.
.
.
.
.
.
.
.
.
.
.
.
.
.
.
.
.
.
.
.
.
.
.
.
.
.
.
.
.
surements of the sea surface (i.e., from the marine geoid). Recent global seafloor maps
produced from spaceborne altimetry provide a large-scale view of Earth that is lacking
from traditional sources and, in fact, has provided substantial new insight into the
seafloor structure and geological history of remote parts of the globe. Forthcoming
developments in radar and laser altimeters, constrained by selected higher-resolution
shipborne measurements, could improve the resolution of global seafloor topography
and morphology to a point that would substantially advance our understanding of vol-
canism, faulting, sedimentation, and plate evolution in oceanic regions.
34
A specific new application of topographic measurements of the land surface is to ob-
tain landslide inventories. Landslides are primarily associated with triggering events,
such as rainfall, snowmelt, or earthquakes. The statistics of these events, however, are
poorly documented. Since large landslide events are rare, it is essential to obtain in-
ventories on a worldwide basis. One goal is to automate the measurement of landslide
areas and volumes using differences in topographic observations prior to and after
each landslide event.
Topographic measurements can also be used to quantify sediment deposition in arid
areas during a flood. Analyses of the topography of alluvial fans before and after a
flood will give the volume of sediment deposited.
40°N
30°N
20°N
10°N
0°
90°W 80°W 70°W 60°W 50°W 40°W 30°W 20°W 10°W 0°
Topography of the ocean
floor derived from sparse ship
soundings and dense satellite
altimeter measurements of
ocean surface height (i.e.,
geoid height). The 10-km
resolution topography reveals
the broad features of seafloor
spreading such as the median
valley along the ridge axis,
the transform faults, and the
thermal subsidence of the
cooling oceanic lithosphere.
Higher-resolution topography
can be obtained by additional
ship soundings and/or a new
higher-resolution satellite
altimeter mission.
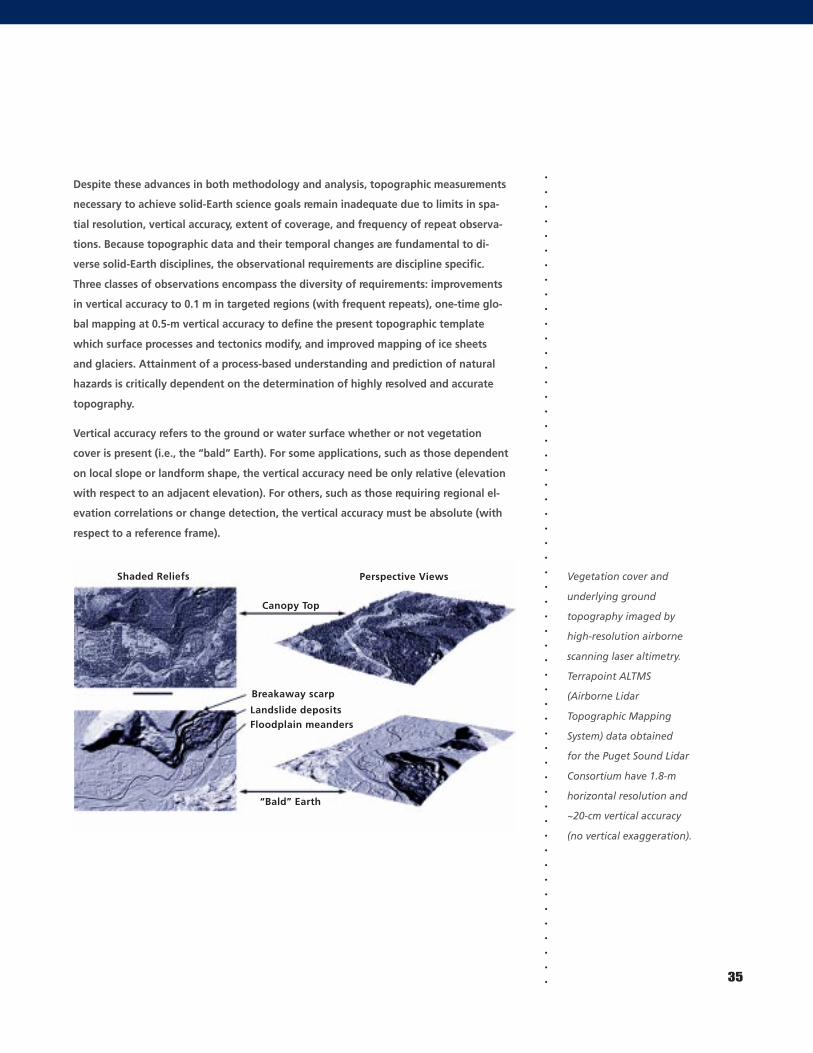
.
.
.
.
.
.
.
.
.
.
.
.
.
.
.
.
.
.
.
.
.
.
.
.
.
.
.
.
.
.
.
.
.
.
.
.
.
.
.
.
.
.
.
.
.
.
.
.
.
.
.
.
.
.
.
.
Despite these advances in both methodology and analysis, topographic measurements
necessary to achieve solid-Earth science goals remain inadequate due to limits in spa-
tial resolution, vertical accuracy, extent of coverage, and frequency of repeat observa-
tions. Because topographic data and their temporal changes are fundamental to di-
verse solid-Earth disciplines, the observational requirements are discipline specific.
Three classes of observations encompass the diversity of requirements: improvements
in vertical accuracy to 0.1 m in targeted regions (with frequent repeats), one-time glo-
bal mapping at 0.5-m vertical accuracy to define the present topographic template
which surface processes and tectonics modify, and improved mapping of ice sheets
and glaciers. Attainment of a process-based understanding and prediction of natural
hazards is critically dependent on the determination of highly resolved and accurate
topography.
Vertical accuracy refers to the ground or water surface whether or not vegetation
cover is present (i.e., the “bald” Earth). For some applications, such as those dependent
on local slope or landform shape, the vertical accuracy need be only relative (elevation
with respect to an adjacent elevation). For others, such as those requiring regional el-
evation correlations or change detection, the vertical accuracy must be absolute (with
respect to a reference frame).
35
Vegetation cover and
underlying ground
topography imaged by
high-resolution airborne
scanning laser altimetry.
Terrapoint ALTMS
(Airborne Lidar
Topographic Mapping
System) data obtained
for the Puget Sound Lidar
Consortium have 1.8-m
horizontal resolution and
~20-cm vertical accuracy
(no vertical exaggeration).
Shaded Reliefs Perspective Views
Canopy Top
“Bald” Earth
Breakaway scarp
Landslide depositsFloodplain meanders
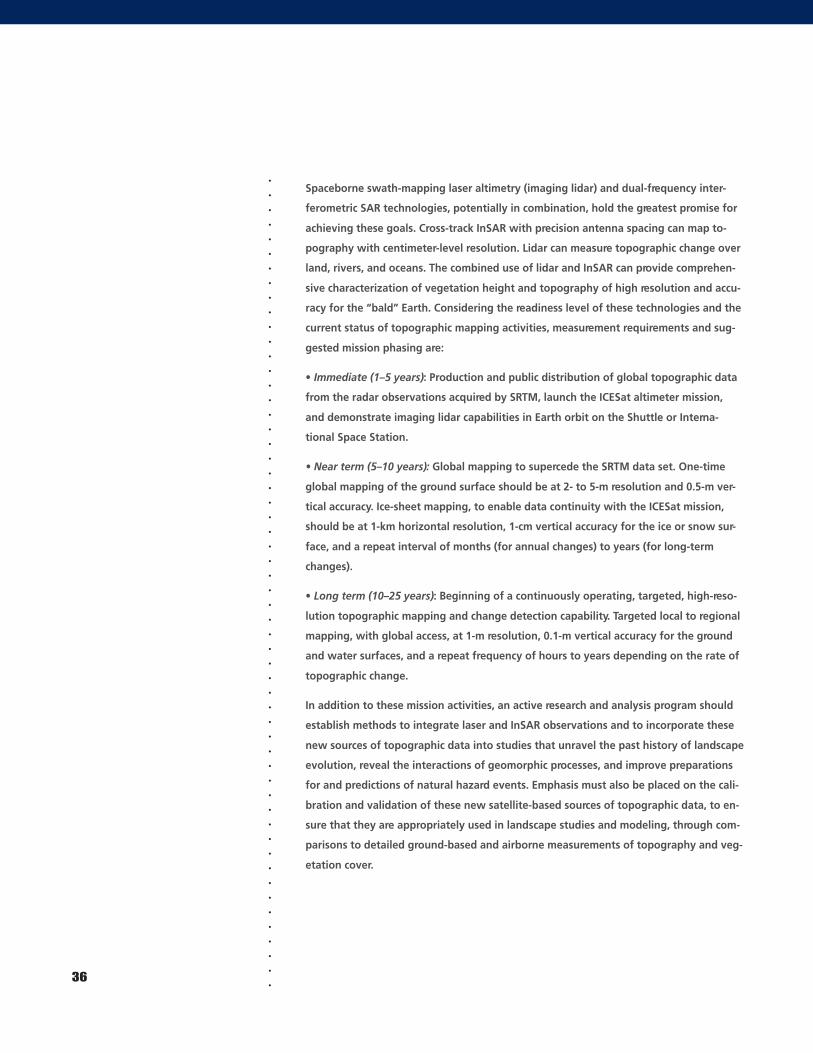
.
.
.
.
.
.
.
.
.
.
.
.
.
.
.
.
.
.
.
.
.
.
.
.
.
.
.
.
.
.
.
.
.
.
.
.
.
.
.
.
.
.
.
.
.
.
.
.
.
.
.
.
.
.
.
.36
Spaceborne swath-mapping laser altimetry (imaging lidar) and dual-frequency inter-
ferometric SAR technologies, potentially in combination, hold the greatest promise for
achieving these goals. Cross-track InSAR with precision antenna spacing can map to-
pography with centimeter-level resolution. Lidar can measure topographic change over
land, rivers, and oceans. The combined use of lidar and InSAR can provide comprehen-
sive characterization of vegetation height and topography of high resolution and accu-
racy for the “bald” Earth. Considering the readiness level of these technologies and the
current status of topographic mapping activities, measurement requirements and sug-
gested mission phasing are:
• Immediate (1–5 years): Production and public distribution of global topographic data
from the radar observations acquired by SRTM, launch the ICESat altimeter mission,
and demonstrate imaging lidar capabilities in Earth orbit on the Shuttle or Interna-
tional Space Station.
• Near term (5–10 years): Global mapping to supercede the SRTM data set. One-time
global mapping of the ground surface should be at 2- to 5-m resolution and 0.5-m ver-
tical accuracy. Ice-sheet mapping, to enable data continuity with the ICESat mission,
should be at 1-km horizontal resolution, 1-cm vertical accuracy for the ice or snow sur-
face, and a repeat interval of months (for annual changes) to years (for long-term
changes).
• Long term (10–25 years): Beginning of a continuously operating, targeted, high-reso-
lution topographic mapping and change detection capability. Targeted local to regional
mapping, with global access, at 1-m resolution, 0.1-m vertical accuracy for the ground
and water surfaces, and a repeat frequency of hours to years depending on the rate of
topographic change.
In addition to these mission activities, an active research and analysis program should
establish methods to integrate laser and InSAR observations and to incorporate these
new sources of topographic data into studies that unravel the past history of landscape
evolution, reveal the interactions of geomorphic processes, and improve preparations
for and predictions of natural hazard events. Emphasis must also be placed on the cali-
bration and validation of these new satellite-based sources of topographic data, to en-
sure that they are appropriately used in landscape studies and modeling, through com-
parisons to detailed ground-based and airborne measurements of topography and veg-
etation cover.
.
.
.
.
.
.
.
.
.
.
.
.
.
.
.
.
.
.
.
.
.
.
.
.
.
.
.
.
.
.
.
.
.
.
.
.
.
.
.
.
.
.
.
.
.
.
.
.
.
.
.
.
.
.
.
. 37
3. Variability of Earth’s Magnetic Field
Geomagnetism provides one of three space-based techniques to probe the Earth’s inte-
rior. (The other two are gravity and Earth rotation.) Geomagnetic studies are currently
limited by a paucity of observations and attendant difficulty in their interpretation. Re-
cent advances in nanosatellite technology hold the promise for cost-effective geomag-
netic constellation operations. The International Decade of Geopotential Research en-
dorsed by the International Association of Geomagnetism and Aeronomy (IAGA) and
the International Association of Geodesy (IAG) has played a major role in encouraging
programs that have led to the launch of Oersted, Sunsat, CHAMP, and SAC-C over the
last five years.
2000
1900
The South Atlantic Magnetic
Anomaly strength at 500-km alti-
tude has increased significantly
over the last 100 years. In 2000, the
magnetic field was about 35%
weaker in the South Atlantic than
would be expected from a dipole
field. This weakness in the field has
serious implications for low-Earth-
orbit satellite operations, because
it impacts the radiation dosage at
these altitudes. How much longer
will the South Atlantic Magnetic
Anomaly continue to grow? How
deep will it become? Long-term
satellite observations will allow us
to model the future evolution of
this anomaly.
1980
+15,000 nT –15,000 nT
.
.
.
.
.
.
.
.
.
.
.
.
.
.
.
.
.
.
.
.
.
.
.
.
.
.
.
.
.
.
.
.
.
.
.
.
.
.
.
.
.
.
.
.
.
.
.
.
.
.
.
.
.
.
.
.38
Constellation measurements provide a number of advantages over single-satellite
measurements, including improved tracking of external field variability with local time
and latitude, by observing the field simultaneously at a range of local times; improved
observation of the main field and short-period temporal variations; and magnetic gra-
dient measurements for the determination of magnetospheric and ionospheric current
systems and the determination of an accurate external field model.
The density of the constellation is determined by the requirement to be able to sepa-
rate spatial and temporal variability of the different components of the field, espe-
cially variability of the external field. Furthermore, better measurements of the exter-
nal field components will lead to higher resolution electromagnetic induction studies
of the mid- to deep-mantle and facilitate studies of the relationship between space
weather and the Earth’s atmosphere. High-resolution main field observations will pro-
vide an improved determination of core field secular variation.
Measurement requirements and suggested mission phasing are:
• Immediate (1–5 years): Support of analysis of geomagnetic observations from current
satellite missions. A modularized instrument package should be developed to facilitate
taking advantage of missions of opportunity.
• Near term (5–10 years): Constellation of 4–6 satellites at a range of local times in po-
lar orbit at approximately 800-km altitude.
• Long term (10–25 years): Establishment of a more complete, 12-satellite constellation
by adding satellites at lower altitude (300 km) in polar orbits (to enhance study of the
crustal field) and at 800 km in a low-inclination orbit (to enhance recovery of mantle
electrical conductivity). Technological advancements should include the incorporation
of star trackers on magnetometers and improved lifetimes at low altitudes.
4. Variability of Earth’s Gravity Field
Satellite gravity measurements have demonstrated the clear importance of determin-
ing the spatial and temporal variability of the Earth’s global gravity field. The first
measurements of spatial and seasonal gravity variability at scales of thousands of kilo-
meters were obtained by laser-tracked geodetic satellites such as LAGEOS I and II.
Seasat and subsequent ocean altimetry satellites provided the first high-resolution sat-
ellite-derived gravity field over the oceans and yielded the most complete map yet of
ocean floor bathymetry. There are now three dedicated high-resolution gravity mis-
sions — GRACE, CHAMP, and the European Space Agency’s Gravity Field and Steady
State Ocean Circulation Explorer (GOCE) — either in orbit or planned. Each mission
makes use of a different technique for gravity measurement. The 1997 National Re-
search Council report “Satellite Gravity and the Geosphere” outlined in detail the com-
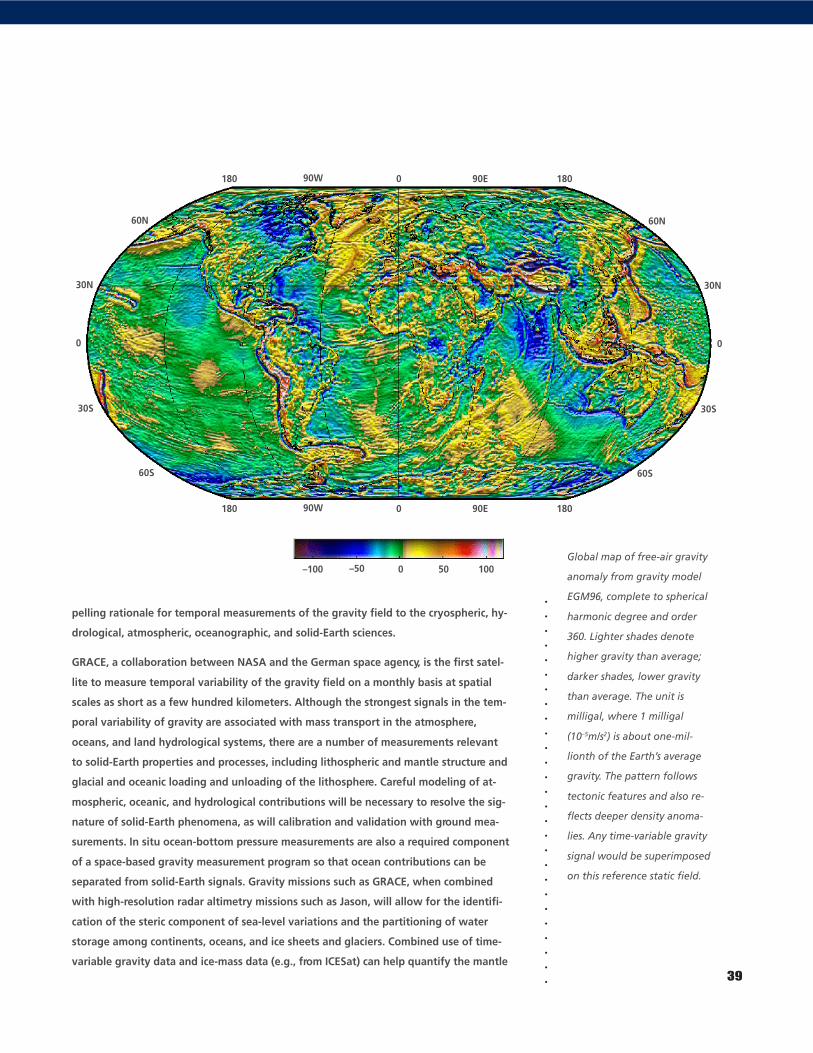
.
.
.
.
.
.
.
.
.
.
.
.
.
.
.
.
.
.
.
.
.
.
.
.
.
.
.
.
.
.
.
.
.
.
.
.
.
.
.
.
.
.
.
.
.
.
.
.
.
.
.
.
.
.
.
. 39
pelling rationale for temporal measurements of the gravity field to the cryospheric, hy-
drological, atmospheric, oceanographic, and solid-Earth sciences.
GRACE, a collaboration between NASA and the German space agency, is the first satel-
lite to measure temporal variability of the gravity field on a monthly basis at spatial
scales as short as a few hundred kilometers. Although the strongest signals in the tem-
poral variability of gravity are associated with mass transport in the atmosphere,
oceans, and land hydrological systems, there are a number of measurements relevant
to solid-Earth properties and processes, including lithospheric and mantle structure and
glacial and oceanic loading and unloading of the lithosphere. Careful modeling of at-
mospheric, oceanic, and hydrological contributions will be necessary to resolve the sig-
nature of solid-Earth phenomena, as will calibration and validation with ground mea-
surements. In situ ocean-bottom pressure measurements are also a required component
of a space-based gravity measurement program so that ocean contributions can be
separated from solid-Earth signals. Gravity missions such as GRACE, when combined
with high-resolution radar altimetry missions such as Jason, will allow for the identifi-
cation of the steric component of sea-level variations and the partitioning of water
storage among continents, oceans, and ice sheets and glaciers. Combined use of time-
variable gravity data and ice-mass data (e.g., from ICESat) can help quantify the mantle
Global map of free-air gravity
anomaly from gravity model
EGM96, complete to spherical
harmonic degree and order
360. Lighter shades denote
higher gravity than average;
darker shades, lower gravity
than average. The unit is
milligal, where 1 milligal
(10–5m/s2) is about one-mil-
lionth of the Earth’s average
gravity. The pattern follows
tectonic features and also re-
flects deeper density anoma-
lies. Any time-variable gravity
signal would be superimposed
on this reference static field.
180 180090W 90E
180 180090W 90E
30N
60N
60S
30S
0
30N
60N
60S
30S
0
–100 1000–50 50
.
.
.
.
.
.
.
.
.
.
.
.
.
.
.
.
.
.
.
.
.
.
.
.
.
.
.
.
.
.
.
.
.
.
.
.
.
.
.
.
.
.
.
.
.
.
.
.
.
.
.
.
.
.
.
.40
response to past and present glaciation. Because Earth-rotation parameters and gravity
anomaly measurements are both manifestations of mass redistribution, geodetic and
gravity measurements are excellent examples of synergy, allowing a better under-
standing of global mass transport in the Earth system.
Future gravity missions using laser interferometric or other high-resolution
gradiometry techniques should achieve a sensitivity 100 to 1000 times that of GRACE.
With that sensitivity it will be possible to resolve crustal deformation signals, such as
mass displacement due to undersea lithospheric strain, vertical motions associated with
lithospheric loading and unloading, changes induced by earthquake and volcanic pro-
cesses, and subsurface aquifer and oil reservoir withdrawal.
Measurement requirements and suggested mission phasing are:
• Immediate (1–5 years): Monthly estimation to within 10 millimeters of surface water-
equivalent load at a few hundred kilometers spatial resolution using existing satellites
such as GRACE.
• Near term (5–10 years): GRACE follow-on mission demonstrating satellite-to-satellite
laser interferometry technology.
• Long term (10–25 years): Gravity measurement improved by 2–3 orders of magnitude
in sensitivity using satellite-to-satellite laser interferometry or spaceborne gradiometer
technology.
5. Imaging Spectroscopy of Earth’s Changing Surface
The Earth’s surface is the interface between the atmosphere, hydrosphere, and the
solid Earth and is the interface of greatest importance to humankind. Imaging spectros-
copy (or “hyperspectral” imaging) can resolve the surface attributes and expression of
many of the processes related to natural and human-induced landscape change, volcan-
ism, tectonics, and ice dynamics. Because near-surface materials and their properties of-
ten determine a region’s susceptibility to such natural hazards as earthquakes, severe
storms, wildfires, and volcanic activity, characterizing these materials will contribute
significantly to global hazard mapping.
Even in aerial photographs, which represent perhaps the simplest form of remote sens-
ing, it is possible to recognize fire scars, landslides, old ice, and fresh lava. Imaging
spectroscopy, in both the solar-reflected (0.4 to 2.5 µm) and thermal portions (3–5 µm
and 8-12 µm) of the spectrum, raises this science to a new level because it permits the
identification, separation, and measurement of subtle variations reflecting the overlap-
ping molecular absorption and constituent scattering signatures of materials present
on the Earth’s surface. Hundreds of spectral bands are sometimes required to resolve
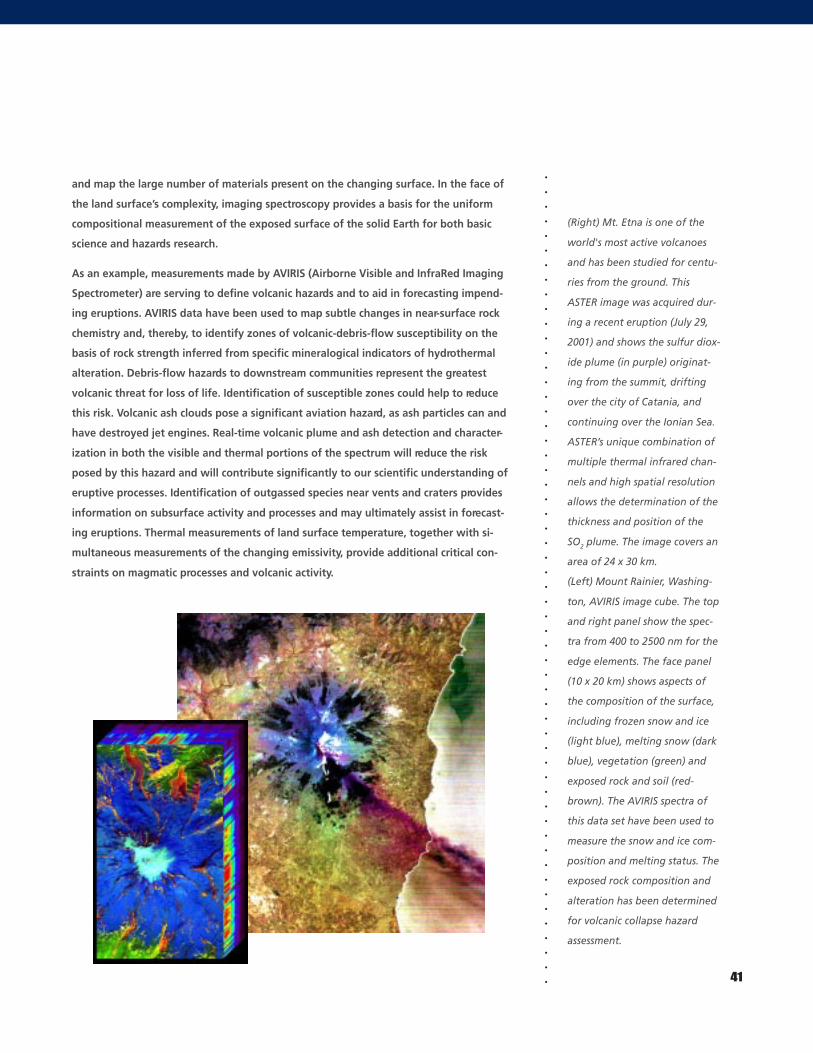
.
.
.
.
.
.
.
.
.
.
.
.
.
.
.
.
.
.
.
.
.
.
.
.
.
.
.
.
.
.
.
.
.
.
.
.
.
.
.
.
.
.
.
.
.
.
.
.
.
.
.
.
.
.
.
. 41
and map the large number of materials present on the changing surface. In the face of
the land surface’s complexity, imaging spectroscopy provides a basis for the uniform
compositional measurement of the exposed surface of the solid Earth for both basic
science and hazards research.
As an example, measurements made by AVIRIS (Airborne Visible and InfraRed Imaging
Spectrometer) are serving to define volcanic hazards and to aid in forecasting impend-
ing eruptions. AVIRIS data have been used to map subtle changes in near-surface rock
chemistry and, thereby, to identify zones of volcanic-debris-flow susceptibility on the
basis of rock strength inferred from specific mineralogical indicators of hydrothermal
alteration. Debris-flow hazards to downstream communities represent the greatest
volcanic threat for loss of life. Identification of susceptible zones could help to reduce
this risk. Volcanic ash clouds pose a significant aviation hazard, as ash particles can and
have destroyed jet engines. Real-time volcanic plume and ash detection and character-
ization in both the visible and thermal portions of the spectrum will reduce the risk
posed by this hazard and will contribute significantly to our scientific understanding of
eruptive processes. Identification of outgassed species near vents and craters provides
information on subsurface activity and processes and may ultimately assist in forecast-
ing eruptions. Thermal measurements of land surface temperature, together with si-
multaneous measurements of the changing emissivity, provide additional critical con-
straints on magmatic processes and volcanic activity.
(Right) Mt. Etna is one of the
world's most active volcanoes
and has been studied for centu-
ries from the ground. This
ASTER image was acquired dur-
ing a recent eruption (July 29,
2001) and shows the sulfur diox-
ide plume (in purple) originat-
ing from the summit, drifting
over the city of Catania, and
continuing over the Ionian Sea.
ASTER’s unique combination of
multiple thermal infrared chan-
nels and high spatial resolution
allows the determination of the
thickness and position of the
SO2 plume. The image covers an
area of 24 x 30 km.
(Left) Mount Rainier, Washing-
ton, AVIRIS image cube. The top
and right panel show the spec-
tra from 400 to 2500 nm for the
edge elements. The face panel
(10 x 20 km) shows aspects of
the composition of the surface,
including frozen snow and ice
(light blue), melting snow (dark
blue), vegetation (green) and
exposed rock and soil (red-
brown). The AVIRIS spectra of
this data set have been used to
measure the snow and ice com-
position and melting status. The
exposed rock composition and
alteration has been determined
for volcanic collapse hazard
assessment.
.
.
.
.
.
.
.
.
.
.
.
.
.
.
.
.
.
.
.
.
.
.
.
.
.
.
.
.
.
.
.
.
.
.
.
.
.
.
.
.
.
.
.
.
.
.
.
.
.
.
.
.
.
.
.
.42
In arid environments, dust storms, sand storms, and migrating dunes pose hazards that
can be effectively tracked via imaging spectroscopy. Although toxic chemicals can occur
naturally, they can pose a hazard extending far beyond their source, if the weathering
products become airborne, as is common in arid regions. For example, Owens Valley in
eastern California is now recognized as the most significant source of toxic alkali dust
in the western U.S. Understanding the spatial distribution of sources of naturally occur-
ring toxins, the spread of contaminants from these source areas, and the correlation of
contaminant distribution events with atmospheric winds and soil moisture (which con-
trols susceptibility to wind shear) is possible through imaging spectroscopy.
By combining determination of soil composition and moisture from imaging spectros-
copy with other measurements, such as high-resolution topography and precipitation,
we may be able to achieve real-time prediction of short-term surface-change events
such as landsliding. Liquid water absorption in highly susceptible super-saturated soils,
as well as seasonal, fire-induced, or human-induced changes in vegetation and related
soil strength, are key determinants of landslide susceptibility that can be revealed via
spectroscopy. In order to quantify snow accumulation, snowmelt, and surface runoff
where winter snows persist, simultaneous, real-time measurement via imaging spec-
troscopy of the three phases of water in melting snow and ice provides an otherwise
unattainable window on the causative factors of major spring floods. Frequent obser-
vations from space are required for such transient situations.
The measurement of subtle differences in the mineralogy of surface rock and soil units
serve to delineate the surface expression of earthquake faults. These same types of
measurements can identify those naturally occurring minerals that acidify water and
mobilize toxic heavy metals in water sources. Many materials in nature are harmful to
man and often occur near population centers. The molecular absorption of a range of
asbestos minerals, for instance, has been measured with AVIRIS in both natural and hu-
man-altered environments. For asbestos and other spectrally unique materials, spatial
concentrations of less than one percent of a pixel can be resolved. The key characteris-
tics required to enable such results are a high signal-to-noise ratio, stability of the
instrument’s radiometric and spectral calibration, and orthogonal spatial and spectral
characteristics (such that all wavelengths for a given spectrum come from the same
area on the surface).
In the solar-reflected spectrum, imaging spectroscopy of the solid Earth from space has
taken an important first step with the Hyperion technology-demonstration sensor on
the New Millennium Program Earth Observing (EO-1) spacecraft. Although Hyperion
has a signal-to-noise ratio about one-fifth that of airborne AVIRIS, the success of its im-
aging capabilities and analysis of its limitations will aid the development of the next-
generation spaceborne imaging spectrometers.
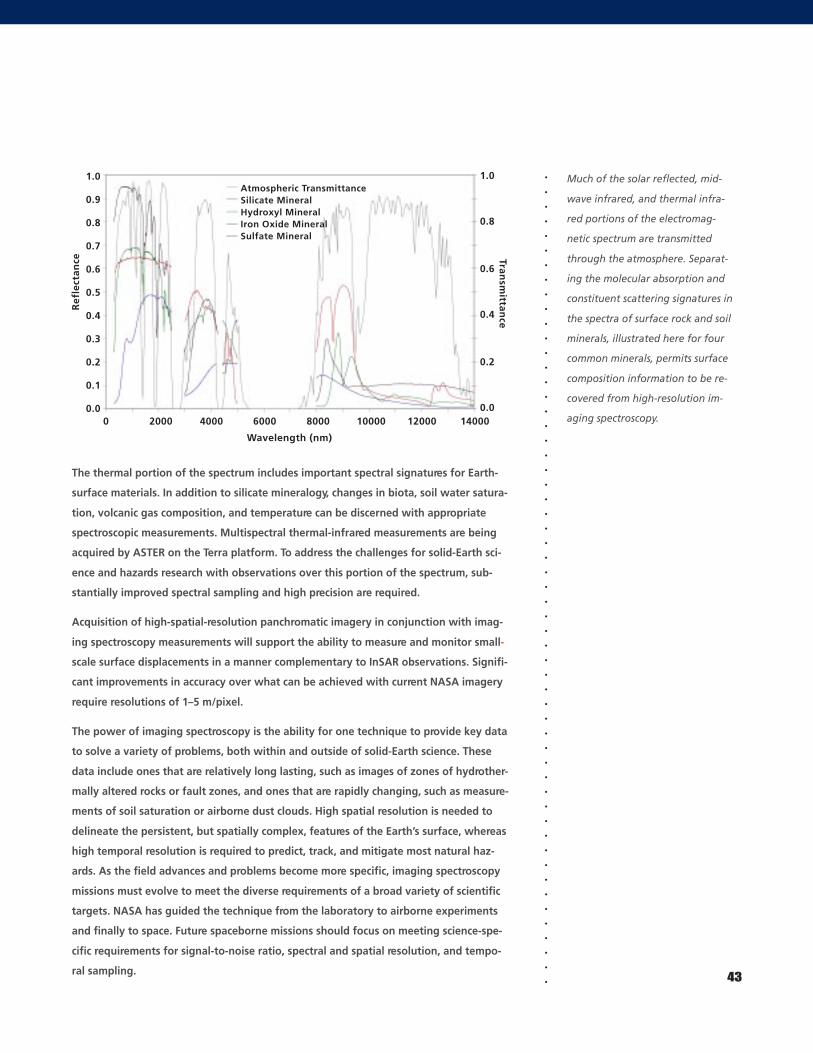
.
.
.
.
.
.
.
.
.
.
.
.
.
.
.
.
.
.
.
.
.
.
.
.
.
.
.
.
.
.
.
.
.
.
.
.
.
.
.
.
.
.
.
.
.
.
.
.
.
.
.
.
.
.
.
. 43
The thermal portion of the spectrum includes important spectral signatures for Earth-
surface materials. In addition to silicate mineralogy, changes in biota, soil water satura-
tion, volcanic gas composition, and temperature can be discerned with appropriate
spectroscopic measurements. Multispectral thermal-infrared measurements are being
acquired by ASTER on the Terra platform. To address the challenges for solid-Earth sci-
ence and hazards research with observations over this portion of the spectrum, sub-
stantially improved spectral sampling and high precision are required.
Acquisition of high-spatial-resolution panchromatic imagery in conjunction with imag-
ing spectroscopy measurements will support the ability to measure and monitor small-
scale surface displacements in a manner complementary to InSAR observations. Signifi-
cant improvements in accuracy over what can be achieved with current NASA imagery
require resolutions of 1–5 m/pixel.
The power of imaging spectroscopy is the ability for one technique to provide key data
to solve a variety of problems, both within and outside of solid-Earth science. These
data include ones that are relatively long lasting, such as images of zones of hydrother-
mally altered rocks or fault zones, and ones that are rapidly changing, such as measure-
ments of soil saturation or airborne dust clouds. High spatial resolution is needed to
delineate the persistent, but spatially complex, features of the Earth’s surface, whereas
high temporal resolution is required to predict, track, and mitigate most natural haz-
ards. As the field advances and problems become more specific, imaging spectroscopy
missions must evolve to meet the diverse requirements of a broad variety of scientific
targets. NASA has guided the technique from the laboratory to airborne experiments
and finally to space. Future spaceborne missions should focus on meeting science-spe-
cific requirements for signal-to-noise ratio, spectral and spatial resolution, and tempo-
ral sampling.
Much of the solar reflected, mid-
wave infrared, and thermal infra-
red portions of the electromag-
netic spectrum are transmitted
through the atmosphere. Separat-
ing the molecular absorption and
constituent scattering signatures in
the spectra of surface rock and soil
minerals, illustrated here for four
common minerals, permits surface
composition information to be re-
covered from high-resolution im-
aging spectroscopy.
1.0
0
0.9
0.8
0.7
0.6
0.5
0.4
0.3
0.2
0.1
0.0
Ref
lect
ance
2000 4000 6000 8000 10000 12000 14000
Wavelength (nm)
0.8
1.0
0.4
0.6
0.0
0.2
Transm
ittance
Atmospheric TransmittanceSilicate MineralHydroxyl MineralIron Oxide MineralSulfate Mineral
.
.
.
.
.
.
.
.
.
.
.
.
.
.
.
.
.
.
.
.
.
.
.
.
.
.
.
.
.
.
.
.
.
.
.
.
.
.
.
.
.
.
.
.
.
.
.
.
.
.
.
.
.
.
.
.44
To address the challenges for solid-Earth science, measurement requirements and sug-
gested mission phasing are:
• Immediate (1–5 years): Continued spaceborne and airborne imaging in the solar-re-
flected portion of the spectrum. An airborne capability in the thermal portion of the
spectrum (3–5 µm and 8–12 µm with 30-nm spectral sampling) should be developed.
• Near term (5–10 years): An improved-precision solar-reflected spaceborne imaging
spectrometer with a 100-km swath and 30-m spatial resolution. A high-spatial-resolu-
tion panchromatic capability should be included. A thermal imaging spectrometer
(3–5 µm and 8–12 µm with 30-nm spectral sampling) having high signal-to-noise ratio,
good calibration stability, and spectral–spatial orthogonality should be flown as a
space demonstration project.
• Long term (10–25 years): Continuous spaceborne, wide-swath, full-spectrum, high-
performance imaging spectroscopy. There should be a nested narrow-swath, high-spa-
tial-resolution, full-spectrum capability to target transient events.
6. Space Geodetic Networks and the International Terrestrial Reference Frame
In cooperation with many international partners, NASA’s Solid Earth Science Program
plays a key role in establishing, maintaining, and operating global geodetic networks.
Currently the networks include SLR, VLBI, and the GPS ground system. Relevant data
products and valuable services are provided to the worldwide research community
through the International Laser Ranging Service, the International VLBI Service, and the
International GPS Service, respectively. Precise 3-D crustal motions are determined by
all three networks, with dense GPS arrays particularly useful for regional tectonic and
earthquake cycle studies. Beyond their scientific value, these data, together with pre-
cise determination of the 3-D geocenter motion by SLR and GPS, constitute the geo-
detic elements that define the International Terrestrial Reference Frame (ITRF), which is
the basis for all geodetic measurements described in this report. The ITRF is geometri-
cally connected to the Celestial Reference Frame via Earth Orientation Parameter (EOP)
time series, which are determined primarily by the VLBI technique and contain a wealth
of geophysical and climatic information. The ITRF and EOP, and hence the networks,
should continue to be maintained and improved and their data routinely acquired at
the best possible accuracy and temporal resolution.
7. Promising Techniques and Observations
A number of other promising observations that are either developing or expanding
into the field of solid-Earth science offer additional methods to achieve the goals of
the Solid Earth Science Program.
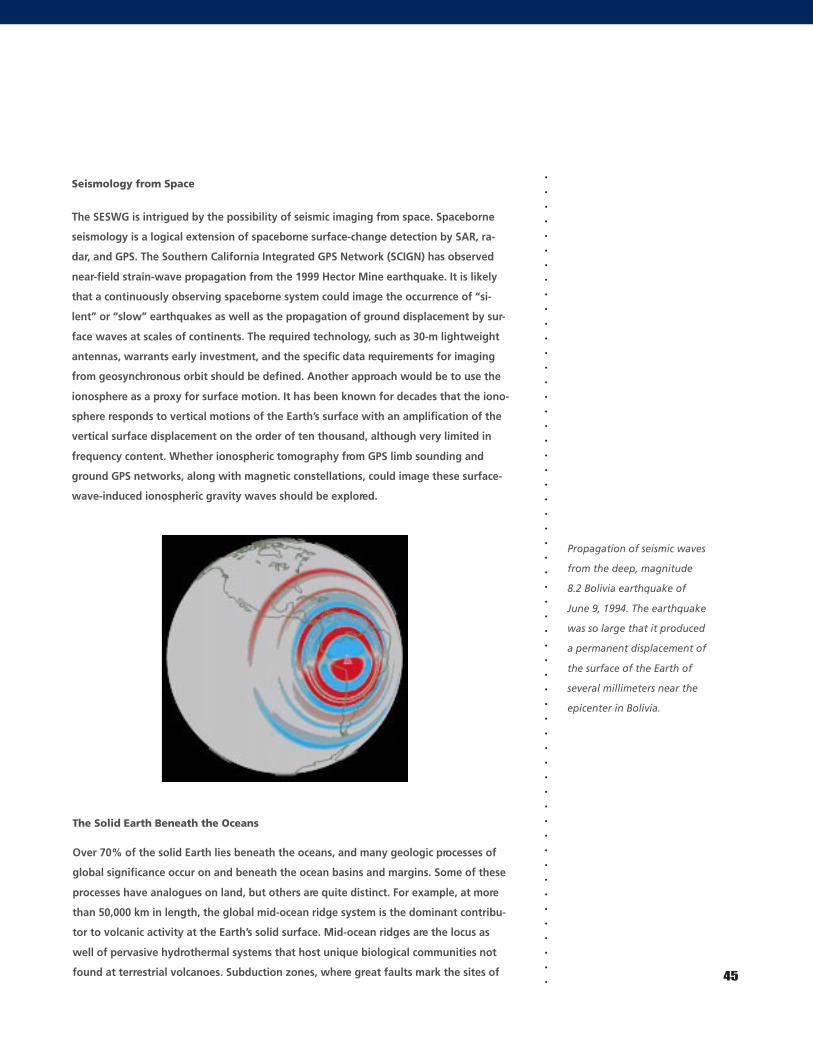
.
.
.
.
.
.
.
.
.
.
.
.
.
.
.
.
.
.
.
.
.
.
.
.
.
.
.
.
.
.
.
.
.
.
.
.
.
.
.
.
.
.
.
.
.
.
.
.
.
.
.
.
.
.
.
. 45
Seismology from Space
The SESWG is intrigued by the possibility of seismic imaging from space. Spaceborne
seismology is a logical extension of spaceborne surface-change detection by SAR, ra-
dar, and GPS. The Southern California Integrated GPS Network (SCIGN) has observed
near-field strain-wave propagation from the 1999 Hector Mine earthquake. It is likely
that a continuously observing spaceborne system could image the occurrence of “si-
lent” or “slow” earthquakes as well as the propagation of ground displacement by sur-
face waves at scales of continents. The required technology, such as 30-m lightweight
antennas, warrants early investment, and the specific data requirements for imaging
from geosynchronous orbit should be defined. Another approach would be to use the
ionosphere as a proxy for surface motion. It has been known for decades that the iono-
sphere responds to vertical motions of the Earth’s surface with an amplification of the
vertical surface displacement on the order of ten thousand, although very limited in
frequency content. Whether ionospheric tomography from GPS limb sounding and
ground GPS networks, along with magnetic constellations, could image these surface-
wave-induced ionospheric gravity waves should be explored.
Propagation of seismic waves
from the deep, magnitude
8.2 Bolivia earthquake of
June 9, 1994. The earthquake
was so large that it produced
a permanent displacement of
the surface of the Earth of
several millimeters near the
epicenter in Bolivia.
The Solid Earth Beneath the Oceans
Over 70% of the solid Earth lies beneath the oceans, and many geologic processes of
global significance occur on and beneath the ocean basins and margins. Some of these
processes have analogues on land, but others are quite distinct. For example, at more
than 50,000 km in length, the global mid-ocean ridge system is the dominant contribu-
tor to volcanic activity at the Earth’s solid surface. Mid-ocean ridges are the locus as
well of pervasive hydrothermal systems that host unique biological communities not
found at terrestrial volcanoes. Subduction zones, where great faults mark the sites of
.
.
.
.
.
.
.
.
.
.
.
.
.
.
.
.
.
.
.
.
.
.
.
.
.
.
.
.
.
.
.
.
.
.
.
.
.
.
.
.
.
.
.
.
.
.
.
.
.
.
.
.
.
.
.
.46
convergence between two tectonic plates, are found almost exclusively beneath the
seafloor. Tsunamis, with their frequently devastating effects at coastal regions, origi-
nate by motion at the Earth–ocean interface.
Spaceborne observations have made significant contributions to the study of the solid
Earth beneath the oceans. This generalization has been especially true in geodesy and
seafloor mapping. Space geodetic techniques based on GPS combined with precise
(centimeter-level) acoustic ranging provide the only means to place deep ocean bench-
marks in an absolute reference frame, and hence integrate seafloor plate motions into
the terrestrial (e.g., VLBI) deformation field. Satellite altimetry has been used to infer
seafloor bathymetry from linear inversion of the global gravity field. While the result-
ing product has lower spatial resolution than can be achieved with shipborne swath-
mapping systems, it has provided the first global view of the shape of the ocean floor
and the first comprehensive coverage in the remote southern oceans.
Future satellite missions will extend observations of the solid Earth beneath the oceans
to smaller spatial scales and will enhance global understanding of temporal variability.
For example, high-accuracy gravity measurements from GRACE follow-on missions
might be capable of observing intermediate-wavelength gravity anomalies generated
by the accumulation of strain at locked convergent margins. Making such measure-
ments in situ is costly and dependent on the serendipitous concurrence of seafloor in-
strumentation with tectonic activity. Although some solid-Earth missions will have lim-
ited application to submarine processes, NASA should be watchful for future opportu-
nities to ensure that spaceborne measurements are utilized to their full capacity.
Over the coming two and a half decades, the biological, chemical, and geological
oceanography communities will increasingly focus on understanding episodic oceanic
processes through the use of seafloor observatories. These will of necessity focus on
the intensive study of relatively small regions, ranging from the scale of a mid-ocean
ridge vent field up to that of the smallest (e.g., Juan de Fuca) tectonic plate.
Spaceborne measurements that resolve temporal changes in the solid Earth beneath
the seafloor will provide an essential global dimension to seafloor observatory efforts
and should be coordinated with planned and future ocean observatory programs.
Subsurface Imaging
Spaceborne subsurface imaging was first demonstrated in radar images from the
Spaceborne Imaging Radar (SIR-A and SIR-B) missions, from which sub-Saharan drain-
age channels were identified beneath desert sands. Applications of this capability
range from the estimation of ice cap thicknesses to the determination of subsurface
properties such as geological structure, lithology, and soil moisture. Radar subsurface
imaging combined with hyperspectral imaging could prove extremely valuable for re-
motely mapping shallow subsurface characteristics that would make a region more vul-
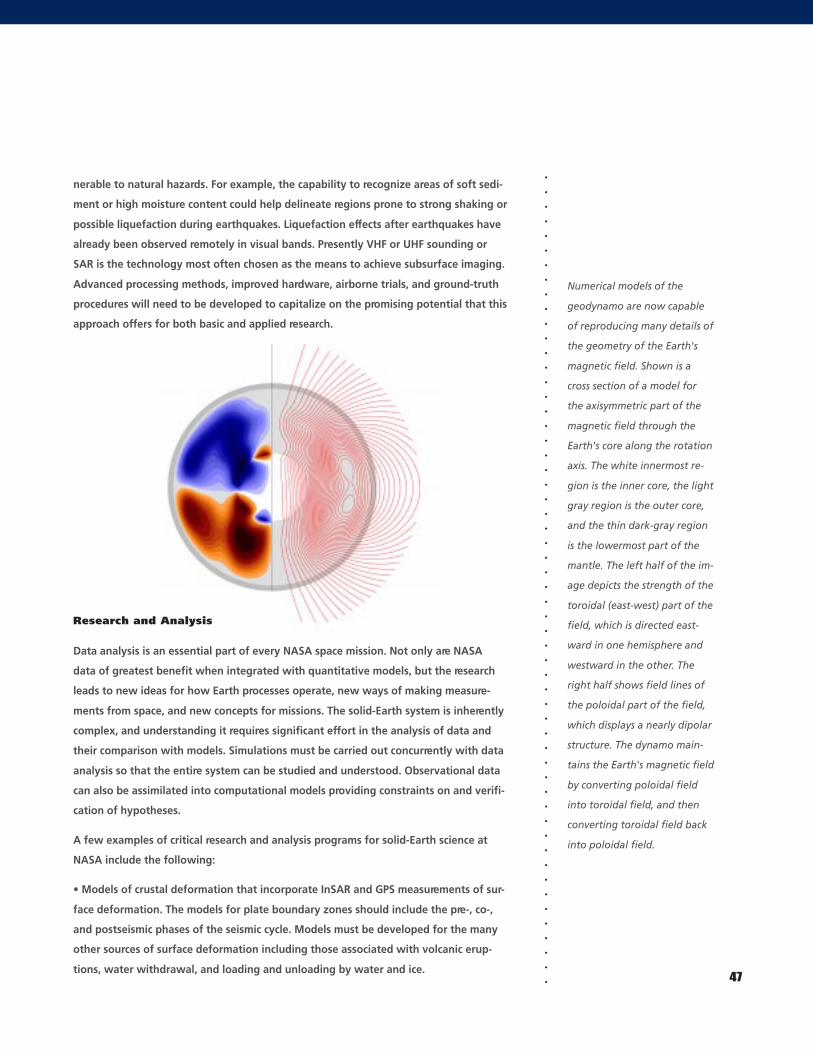
.
.
.
.
.
.
.
.
.
.
.
.
.
.
.
.
.
.
.
.
.
.
.
.
.
.
.
.
.
.
.
.
.
.
.
.
.
.
.
.
.
.
.
.
.
.
.
.
.
.
.
.
.
.
.
. 47
nerable to natural hazards. For example, the capability to recognize areas of soft sedi-
ment or high moisture content could help delineate regions prone to strong shaking or
possible liquefaction during earthquakes. Liquefaction effects after earthquakes have
already been observed remotely in visual bands. Presently VHF or UHF sounding or
SAR is the technology most often chosen as the means to achieve subsurface imaging.
Advanced processing methods, improved hardware, airborne trials, and ground-truth
procedures will need to be developed to capitalize on the promising potential that this
approach offers for both basic and applied research.
Numerical models of the
geodynamo are now capable
of reproducing many details of
the geometry of the Earth's
magnetic field. Shown is a
cross section of a model for
the axisymmetric part of the
magnetic field through the
Earth's core along the rotation
axis. The white innermost re-
gion is the inner core, the light
gray region is the outer core,
and the thin dark-gray region
is the lowermost part of the
mantle. The left half of the im-
age depicts the strength of the
toroidal (east-west) part of the
field, which is directed east-
ward in one hemisphere and
westward in the other. The
right half shows field lines of
the poloidal part of the field,
which displays a nearly dipolar
structure. The dynamo main-
tains the Earth's magnetic field
by converting poloidal field
into toroidal field, and then
converting toroidal field back
into poloidal field.
Research and Analysis
Data analysis is an essential part of every NASA space mission. Not only are NASA
data of greatest benefit when integrated with quantitative models, but the research
leads to new ideas for how Earth processes operate, new ways of making measure-
ments from space, and new concepts for missions. The solid-Earth system is inherently
complex, and understanding it requires significant effort in the analysis of data and
their comparison with models. Simulations must be carried out concurrently with data
analysis so that the entire system can be studied and understood. Observational data
can also be assimilated into computational models providing constraints on and verifi-
cation of hypotheses.
A few examples of critical research and analysis programs for solid-Earth science at
NASA include the following:
• Models of crustal deformation that incorporate InSAR and GPS measurements of sur-
face deformation. The models for plate boundary zones should include the pre-, co-,
and postseismic phases of the seismic cycle. Models must be developed for the many
other sources of surface deformation including those associated with volcanic erup-
tions, water withdrawal, and loading and unloading by water and ice.
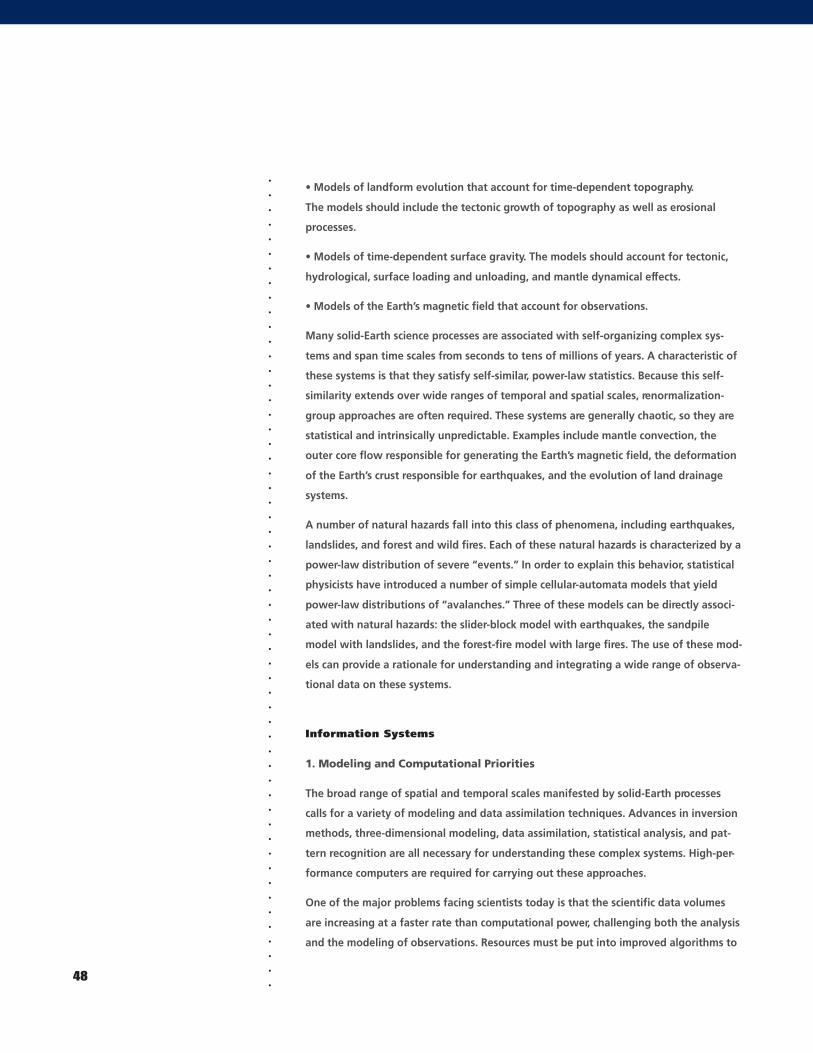
.
.
.
.
.
.
.
.
.
.
.
.
.
.
.
.
.
.
.
.
.
.
.
.
.
.
.
.
.
.
.
.
.
.
.
.
.
.
.
.
.
.
.
.
.
.
.
.
.
.
.
.
.
.
.
.48
• Models of landform evolution that account for time-dependent topography.
The models should include the tectonic growth of topography as well as erosional
processes.
• Models of time-dependent surface gravity. The models should account for tectonic,
hydrological, surface loading and unloading, and mantle dynamical effects.
• Models of the Earth’s magnetic field that account for observations.
Many solid-Earth science processes are associated with self-organizing complex sys-
tems and span time scales from seconds to tens of millions of years. A characteristic of
these systems is that they satisfy self-similar, power-law statistics. Because this self-
similarity extends over wide ranges of temporal and spatial scales, renormalization-
group approaches are often required. These systems are generally chaotic, so they are
statistical and intrinsically unpredictable. Examples include mantle convection, the
outer core flow responsible for generating the Earth’s magnetic field, the deformation
of the Earth’s crust responsible for earthquakes, and the evolution of land drainage
systems.
A number of natural hazards fall into this class of phenomena, including earthquakes,
landslides, and forest and wild fires. Each of these natural hazards is characterized by a
power-law distribution of severe “events.” In order to explain this behavior, statistical
physicists have introduced a number of simple cellular-automata models that yield
power-law distributions of “avalanches.” Three of these models can be directly associ-
ated with natural hazards: the slider-block model with earthquakes, the sandpile
model with landslides, and the forest-fire model with large fires. The use of these mod-
els can provide a rationale for understanding and integrating a wide range of observa-
tional data on these systems.
Information Systems
1. Modeling and Computational Priorities
The broad range of spatial and temporal scales manifested by solid-Earth processes
calls for a variety of modeling and data assimilation techniques. Advances in inversion
methods, three-dimensional modeling, data assimilation, statistical analysis, and pat-
tern recognition are all necessary for understanding these complex systems. High-per-
formance computers are required for carrying out these approaches.
One of the major problems facing scientists today is that the scientific data volumes
are increasing at a faster rate than computational power, challenging both the analysis
and the modeling of observations. Resources must be put into improved algorithms to
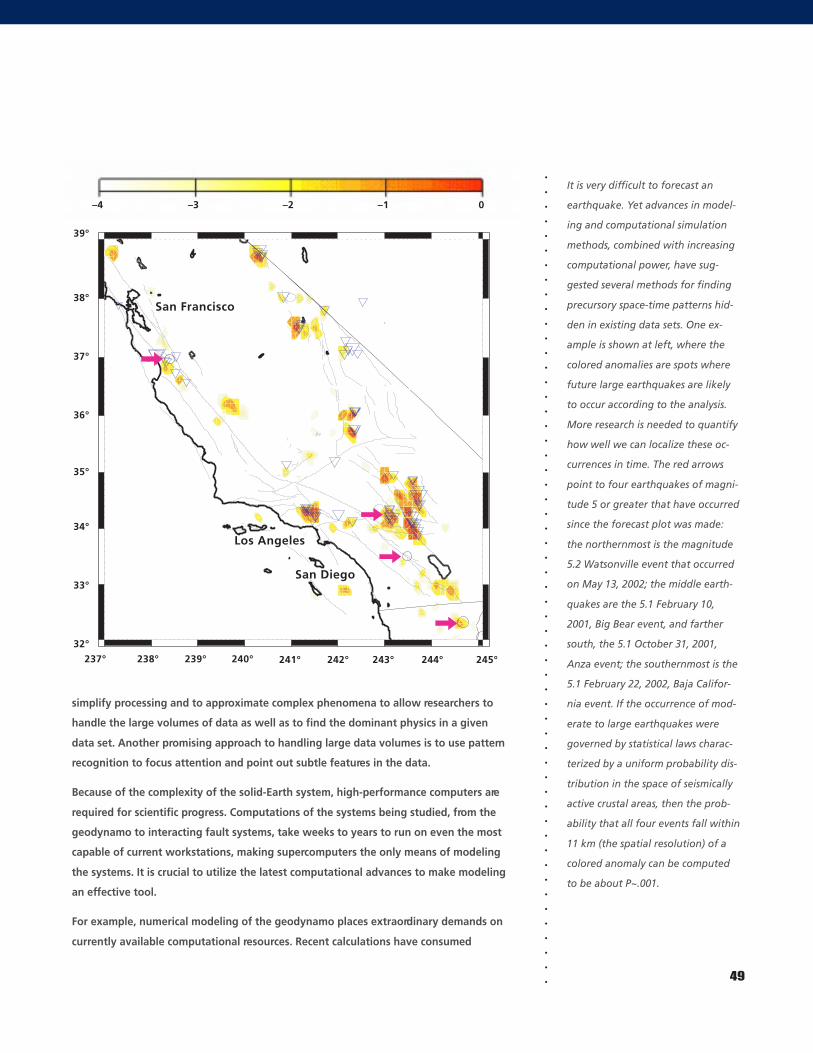
.
.
.
.
.
.
.
.
.
.
.
.
.
.
.
.
.
.
.
.
.
.
.
.
.
.
.
.
.
.
.
.
.
.
.
.
.
.
.
.
.
.
.
.
.
.
.
.
.
.
.
.
.
.
.
. 49
simplify processing and to approximate complex phenomena to allow researchers to
handle the large volumes of data as well as to find the dominant physics in a given
data set. Another promising approach to handling large data volumes is to use pattern
recognition to focus attention and point out subtle features in the data.
Because of the complexity of the solid-Earth system, high-performance computers are
required for scientific progress. Computations of the systems being studied, from the
geodynamo to interacting fault systems, take weeks to years to run on even the most
capable of current workstations, making supercomputers the only means of modeling
the systems. It is crucial to utilize the latest computational advances to make modeling
an effective tool.
For example, numerical modeling of the geodynamo places extraordinary demands on
currently available computational resources. Recent calculations have consumed
39°
38°
37°
36°
35°
34°
33°
32°
–4 –3 –2 –1 0
237° 238° 239° 240° 241° 242° 243° 244° 245°
It is very difficult to forecast an
earthquake. Yet advances in model-
ing and computational simulation
methods, combined with increasing
computational power, have sug-
gested several methods for finding
precursory space-time patterns hid-
den in existing data sets. One ex-
ample is shown at left, where the
colored anomalies are spots where
future large earthquakes are likely
to occur according to the analysis.
More research is needed to quantify
how well we can localize these oc-
currences in time. The red arrows
point to four earthquakes of magni-
tude 5 or greater that have occurred
since the forecast plot was made:
the northernmost is the magnitude
5.2 Watsonville event that occurred
on May 13, 2002; the middle earth-
quakes are the 5.1 February 10,
2001, Big Bear event, and farther
south, the 5.1 October 31, 2001,
Anza event; the southernmost is the
5.1 February 22, 2002, Baja Califor-
nia event. If the occurrence of mod-
erate to large earthquakes were
governed by statistical laws charac-
terized by a uniform probability dis-
tribution in the space of seismically
active crustal areas, then the prob-
ability that all four events fall within
11 km (the spatial resolution) of a
colored anomaly can be computed
to be about P~.001.
San Francisco
Los Angeles
San Diego
.
.
.
.
.
.
.
.
.
.
.
.
.
.
.
.
.
.
.
.
.
.
.
.
.
.
.
.
.
.
.
.
.
.
.
.
.
.
.
.
.
.
.
.
.
.
.
.
.
.
.
.
.
.
.
.50
months to years of CPU time on supercomputers. Yet these numerical models operate
far from the parameter regime of the Earth. There is the potential for great progress
when computational resources reach the stage where data assimilation and sensitivity
analysis become feasible. However, to achieve this goal will demand an entirely new
approach to the provision of computational resources in the solid-Earth sciences, most
likely with massive computational grids being made available.
A three-dimensional finite
element grid for modeling
mantle flow and crustal de-
formation along a subduc-
tion zone. Such modeling
techniques are extremely
computationally intensive.
2. Distributed Receiving and Processing Systems
An important aspect of data collection is to create distributed centers for processing
and storing unique data sets. Developing the infrastructure to compare and use
complementary data sets, such as ice topography and sea-level changes, opens the
door to interdisciplinary research. It is also important to create the infrastructure to ac-
cess other non-NASA datasets such as seismic and geologic data. These supporting
data sets are critical for modeling and understanding the complete system. These dis-
tributed data centers are particularly important in the event of natural disasters, when
not only can they support disaster management but they also enable real-time scien-
tific experiments dependent on time-sensitive observations. Such centers will become
more important as multiple data types are fused into integrated models. Characteristics
of a system of centers should include distributed data at thousands of sites, each with
data volumes of 1 TB–1 PB; multitier architecture for staging of the data; middleware
to control integrity and versioning; support standards developed within the commu-
nity; and high-performance user access of 100-GB files from 40-TB data sets within 5
minutes and program-to-program communication in milliseconds using staging,
streaming, and advanced cache replication.
N
S W
E2890
670
0
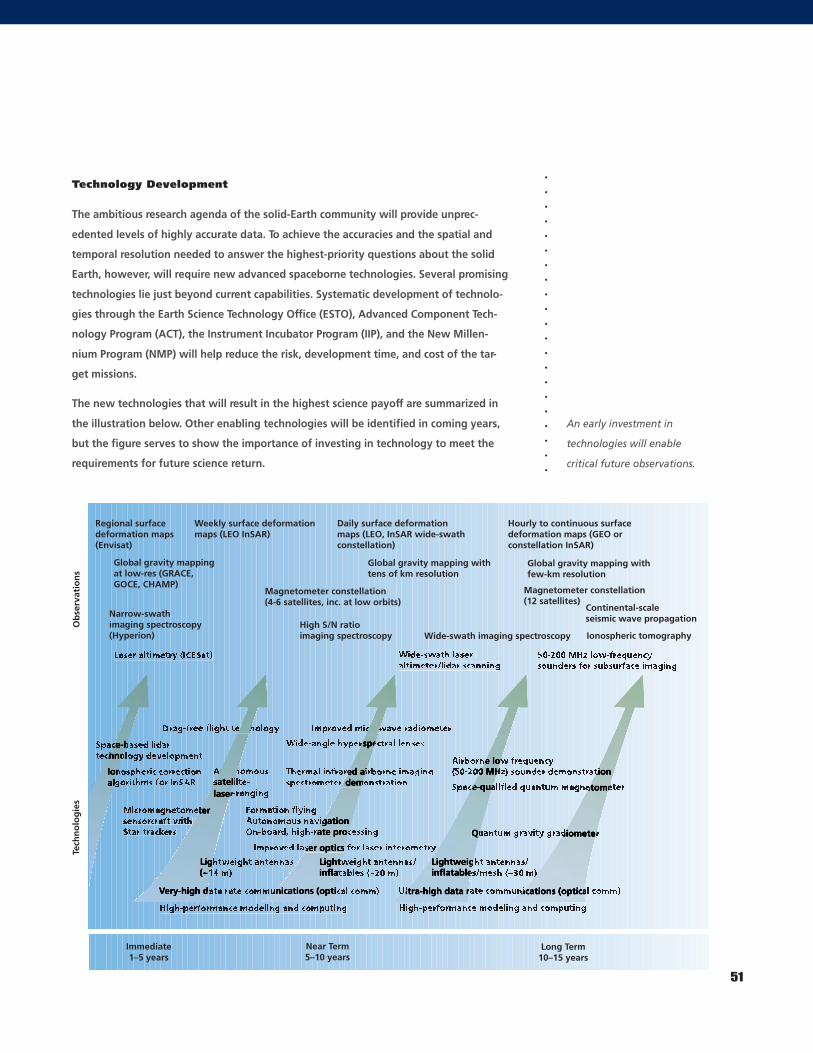
.
.
.
.
.
.
.
.
.
.
.
.
.
.
.
.
.
.
.
.
.
.
.
.
.
.
.
.
.
.
.
.
.
.
.
.
.
.
.
.
.
.
.
.
.
.
.
.
.
.
.
.
.
.
.
. 51
Technology Development
The ambitious research agenda of the solid-Earth community will provide unprec-
edented levels of highly accurate data. To achieve the accuracies and the spatial and
temporal resolution needed to answer the highest-priority questions about the solid
Earth, however, will require new advanced spaceborne technologies. Several promising
technologies lie just beyond current capabilities. Systematic development of technolo-
gies through the Earth Science Technology Office (ESTO), Advanced Component Tech-
nology Program (ACT), the Instrument Incubator Program (IIP), and the New Millen-
nium Program (NMP) will help reduce the risk, development time, and cost of the tar-
get missions.
The new technologies that will result in the highest science payoff are summarized in
the illustration below. Other enabling technologies will be identified in coming years,
but the figure serves to show the importance of investing in technology to meet the
requirements for future science return.
An early investment in
technologies will enable
critical future observations.
Ob
serv
atio
ns
Regional surfacedeformation maps(Envisat)
Global gravity mappingat low-res (GRACE,GOCE, CHAMP)
Narrow-swathimaging spectroscopy (Hyperion)
Weekly surface deformationmaps (LEO InSAR)
Magnetometer constellation(4-6 satellites, inc. at low orbits)
Daily surface deformation maps (LEO, InSAR wide-swathconstellation)
Global gravity mapping with tens of km resolution
Hourly to continuous surface deformation maps (GEO or constellation InSAR)
Continental-scaleseismic wave propagation
Global gravity mapping with few-km resolution
Magnetometer constellation(12 satellites)
Wide-swath imaging spectroscopy Ionospheric tomographyHigh S/N ratioimaging spectroscopy
Tech
no
log
ies
Immediate1–5 years
Near Term5–10 years
Long Term10–15 years
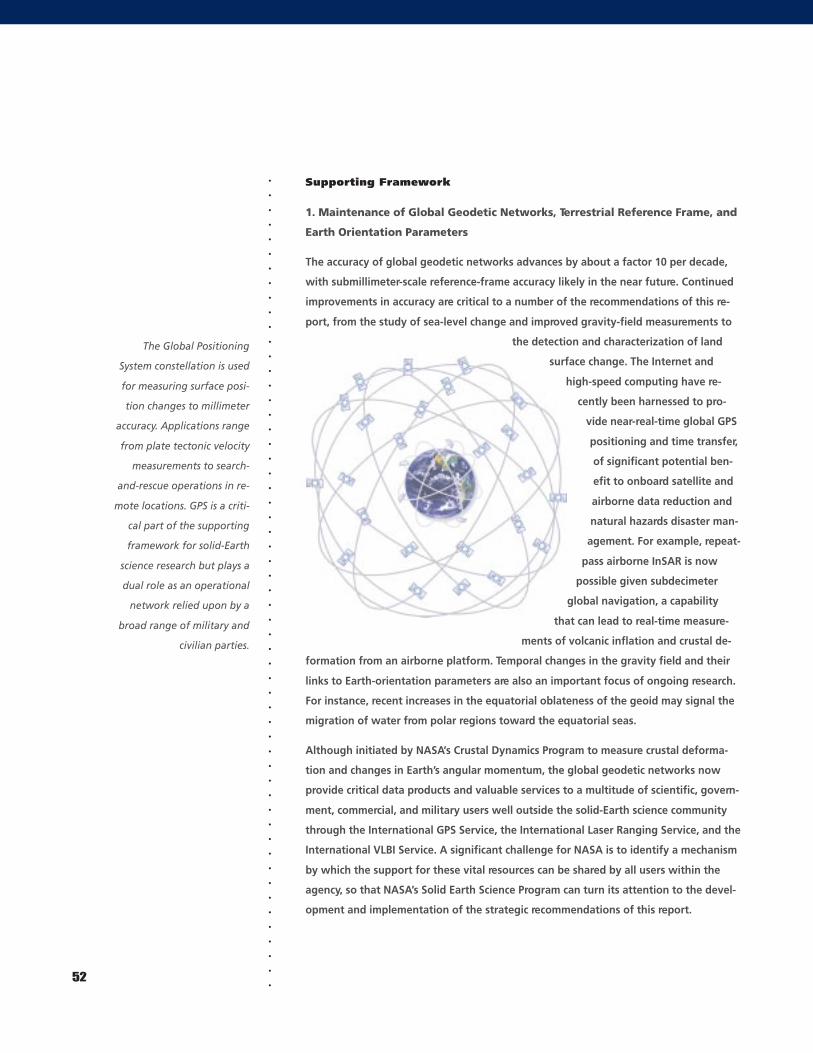
.
.
.
.
.
.
.
.
.
.
.
.
.
.
.
.
.
.
.
.
.
.
.
.
.
.
.
.
.
.
.
.
.
.
.
.
.
.
.
.
.
.
.
.
.
.
.
.
.
.
.
.
.
.
.
.52
Supporting Framework
1. Maintenance of Global Geodetic Networks, Terrestrial Reference Frame, and
Earth Orientation Parameters
The accuracy of global geodetic networks advances by about a factor 10 per decade,
with submillimeter-scale reference-frame accuracy likely in the near future. Continued
improvements in accuracy are critical to a number of the recommendations of this re-
port, from the study of sea-level change and improved gravity-field measurements to
the detection and characterization of land
surface change. The Internet and
high-speed computing have re-
cently been harnessed to pro-
vide near-real-time global GPS
positioning and time transfer,
of significant potential ben-
efit to onboard satellite and
airborne data reduction and
natural hazards disaster man-
agement. For example, repeat-
pass airborne InSAR is now
possible given subdecimeter
global navigation, a capability
that can lead to real-time measure-
ments of volcanic inflation and crustal de-
formation from an airborne platform. Temporal changes in the gravity field and their
links to Earth-orientation parameters are also an important focus of ongoing research.
For instance, recent increases in the equatorial oblateness of the geoid may signal the
migration of water from polar regions toward the equatorial seas.
Although initiated by NASA’s Crustal Dynamics Program to measure crustal deforma-
tion and changes in Earth’s angular momentum, the global geodetic networks now
provide critical data products and valuable services to a multitude of scientific, govern-
ment, commercial, and military users well outside the solid-Earth science community
through the International GPS Service, the International Laser Ranging Service, and the
International VLBI Service. A significant challenge for NASA is to identify a mechanism
by which the support for these vital resources can be shared by all users within the
agency, so that NASA’s Solid Earth Science Program can turn its attention to the devel-
opment and implementation of the strategic recommendations of this report.
The Global Positioning
System constellation is used
for measuring surface posi-
tion changes to millimeter
accuracy. Applications range
from plate tectonic velocity
measurements to search-
and-rescue operations in re-
mote locations. GPS is a criti-
cal part of the supporting
framework for solid-Earth
science research but plays a
dual role as an operational
network relied upon by a
broad range of military and
civilian parties.
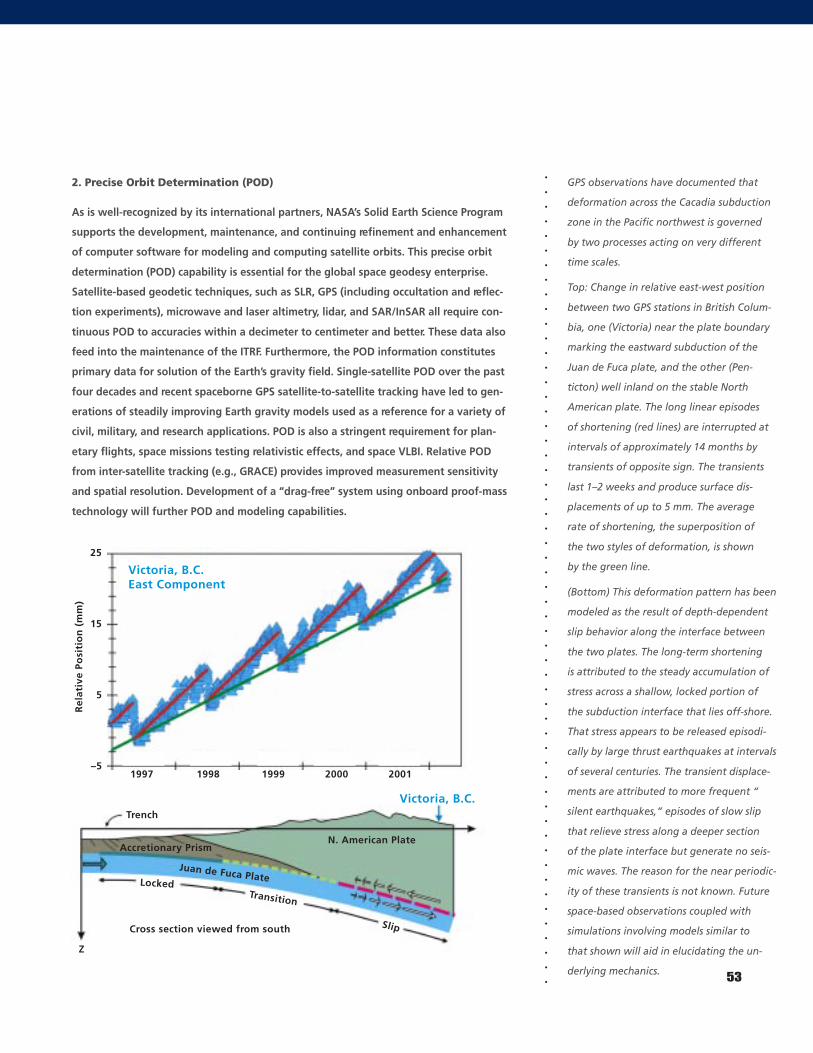
.
.
.
.
.
.
.
.
.
.
.
.
.
.
.
.
.
.
.
.
.
.
.
.
.
.
.
.
.
.
.
.
.
.
.
.
.
.
.
.
.
.
.
.
.
.
.
.
.
.
.
.
.
.
.
. 53
2. Precise Orbit Determination (POD)
As is well-recognized by its international partners, NASA’s Solid Earth Science Program
supports the development, maintenance, and continuing refinement and enhancement
of computer software for modeling and computing satellite orbits. This precise orbit
determination (POD) capability is essential for the global space geodesy enterprise.
Satellite-based geodetic techniques, such as SLR, GPS (including occultation and reflec-
tion experiments), microwave and laser altimetry, lidar, and SAR/InSAR all require con-
tinuous POD to accuracies within a decimeter to centimeter and better. These data also
feed into the maintenance of the ITRF. Furthermore, the POD information constitutes
primary data for solution of the Earth’s gravity field. Single-satellite POD over the past
four decades and recent spaceborne GPS satellite-to-satellite tracking have led to gen-
erations of steadily improving Earth gravity models used as a reference for a variety of
civil, military, and research applications. POD is also a stringent requirement for plan-
etary flights, space missions testing relativistic effects, and space VLBI. Relative POD
from inter-satellite tracking (e.g., GRACE) provides improved measurement sensitivity
and spatial resolution. Development of a “drag-free” system using onboard proof-mass
technology will further POD and modeling capabilities.
GPS observations have documented that
deformation across the Cacadia subduction
zone in the Pacific northwest is governed
by two processes acting on very different
time scales.
Top: Change in relative east-west position
between two GPS stations in British Colum-
bia, one (Victoria) near the plate boundary
marking the eastward subduction of the
Juan de Fuca plate, and the other (Pen-
ticton) well inland on the stable North
American plate.␣ The long linear episodes
of shortening (red lines) are interrupted at
intervals of approximately 14 months by
transients of opposite sign.␣ The transients
last 1–2 weeks and produce surface dis-
placements of up to 5 mm.␣ The average
rate of shortening, the superposition of
the two styles of deformation, is shown
by the green line.
(Bottom) This deformation pattern has been
modeled as the result of depth-dependent
slip behavior along the interface between
the two plates. The long-term shortening
is attributed to the steady accumulation of
stress across a shallow, locked portion of
the subduction interface that lies off-shore.
That stress appears to be released episodi-
cally by large thrust earthquakes at intervals
of several centuries.␣ The transient displace-
ments are attributed to more frequent “
silent earthquakes,” episodes of slow slip
that relieve stress along a deeper section
of the plate interface but generate no seis-
mic waves. The reason for the near periodic-
ity of these transients is not known.␣ Future
space-based observations coupled with
simulations involving models similar to
that shown will aid in elucidating the un-
derlying mechanics.
25
15
5
–5
Rel
ativ
e Po
siti
on
(m
m)
1997 1998 1999 2000 2001
Trench
Victoria, B.C.East Component
Victoria, B.C.
N. American PlateAccretionary Prism
Juan de Fuca PlateLockedTransition
Slip
Z
Cross section viewed from south
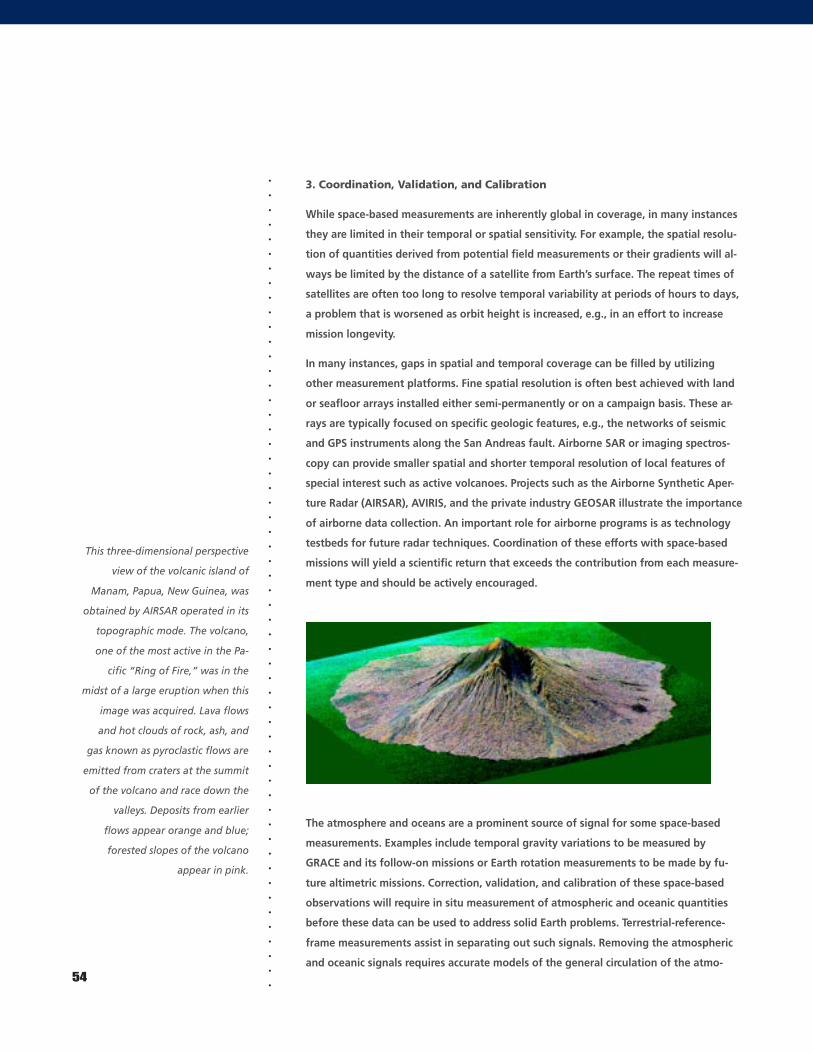
.
.
.
.
.
.
.
.
.
.
.
.
.
.
.
.
.
.
.
.
.
.
.
.
.
.
.
.
.
.
.
.
.
.
.
.
.
.
.
.
.
.
.
.
.
.
.
.
.
.
.
.
.
.
.
.
3. Coordination, Validation, and Calibration
While space-based measurements are inherently global in coverage, in many instances
they are limited in their temporal or spatial sensitivity. For example, the spatial resolu-
tion of quantities derived from potential field measurements or their gradients will al-
ways be limited by the distance of a satellite from Earth’s surface. The repeat times of
satellites are often too long to resolve temporal variability at periods of hours to days,
a problem that is worsened as orbit height is increased, e.g., in an effort to increase
mission longevity.
In many instances, gaps in spatial and temporal coverage can be filled by utilizing
other measurement platforms. Fine spatial resolution is often best achieved with land
or seafloor arrays installed either semi-permanently or on a campaign basis. These ar-
rays are typically focused on specific geologic features, e.g., the networks of seismic
and GPS instruments along the San Andreas fault. Airborne SAR or imaging spectros-
copy can provide smaller spatial and shorter temporal resolution of local features of
special interest such as active volcanoes. Projects such as the Airborne Synthetic Aper-
ture Radar (AIRSAR), AVIRIS, and the private industry GEOSAR illustrate the importance
of airborne data collection. An important role for airborne programs is as technology
testbeds for future radar techniques. Coordination of these efforts with space-based
missions will yield a scientific return that exceeds the contribution from each measure-
ment type and should be actively encouraged.
54
This three-dimensional perspective
view of the volcanic island of
Manam, Papua, New Guinea, was
obtained by AIRSAR operated in its
topographic mode. The volcano,
one of the most active in the Pa-
cific “Ring of Fire,” was in the
midst of a large eruption when this
image was acquired. Lava flows
and hot clouds of rock, ash, and
gas known as pyroclastic flows are
emitted from craters at the summit
of the volcano and race down the
valleys. Deposits from earlier
flows appear orange and blue;
forested slopes of the volcano
appear in pink.
The atmosphere and oceans are a prominent source of signal for some space-based
measurements. Examples include temporal gravity variations to be measured by
GRACE and its follow-on missions or Earth rotation measurements to be made by fu-
ture altimetric missions. Correction, validation, and calibration of these space-based
observations will require in situ measurement of atmospheric and oceanic quantities
before these data can be used to address solid Earth problems. Terrestrial-reference-
frame measurements assist in separating out such signals. Removing the atmospheric
and oceanic signals requires accurate models of the general circulation of the atmo-
.
.
.
.
.
.
.
.
.
.
.
.
.
.
.
.
.
.
.
.
.
.
.
.
.
.
.
.
.
.
.
.
.
.
.
.
.
.
.
.
.
.
.
.
.
.
.
.
.
.
.
.
.
.
.
. 55
sphere and ocean combined with assimilated global in situ measurements. Calibration
and validation of GRACE-like missions requires the contemporaneous measurement of
fluctuations of seafloor pressure. In the past, these supporting measurements have
often been neglected or eliminated to accommodate budget shortfalls. Lack of such
supporting data, however, reduces confidence in space-based measurements and in
some instances can lead to incorrect inferences due to inherent measurement inaccu-
racy. Greater attention to validation and calibration is urged for all future mission
planning.
Education
The discoveries and new knowledge gained from over 40 years of Earth remote sens-
ing conducted by NASA have revolutionized our understanding of how the Earth func-
tions as a system. This growing understanding is increasingly needed to inform politi-
cal and economic decisions of local, national, and global impact.
The solid-Earth perspectives on life on a restless planet highlighted by this report offer
exciting and engaging possibilities for education. To capitalize on these opportunities,
the Solid Earth Science Program will collaborate with the NASA Earth Science Enter-
prise Education Program to stimulate broad public interest, appreciation, and under-
standing of Earth’s interrelated systems, and encourage young scholars to consider ca-
reers in science and technology.
The Solid Earth Science Education Program (SESEP) will develop educational activities
based on the three objectives identified by the ESE: informal education, formal educa-
tion, and a work-force initiative in Earth Science Applications.
Informal education is considered an “out-of-classroom” educational opportunity such
as those found in museums, science and technology centers, and similar nonprofit
education organizations that provide significant educational activities for learners of
all ages. Planned program components in this area include contributing new solid-
Earth content and playing a consultative role for current and future development of
exhibits, displays, and other non-classroom activities. For example, the California Sci-
ence Center noticed that children’s attendance in their Plate Tectonics area was down,
likely because of a lack of appreciation among children (and probably their parents)
that plate tectonics affects their lives. SESEP’s remedy will be to develop hands-on ac-
tivities to show the connection between plate tectonics and earthquakes and to create
an enjoyable family learning experience. For existing NASA center partners, such as
the interactive museum The Dynamic Earth, SESEP will arrange guest lecturers during
Family Science nights and coordinate participatory demonstrations of topics such as
earthquake simulation. SESEP will contribute to the NASA Earth Science Enterprise
Museum Support workshops and conferences targeting the needs of informal educa-
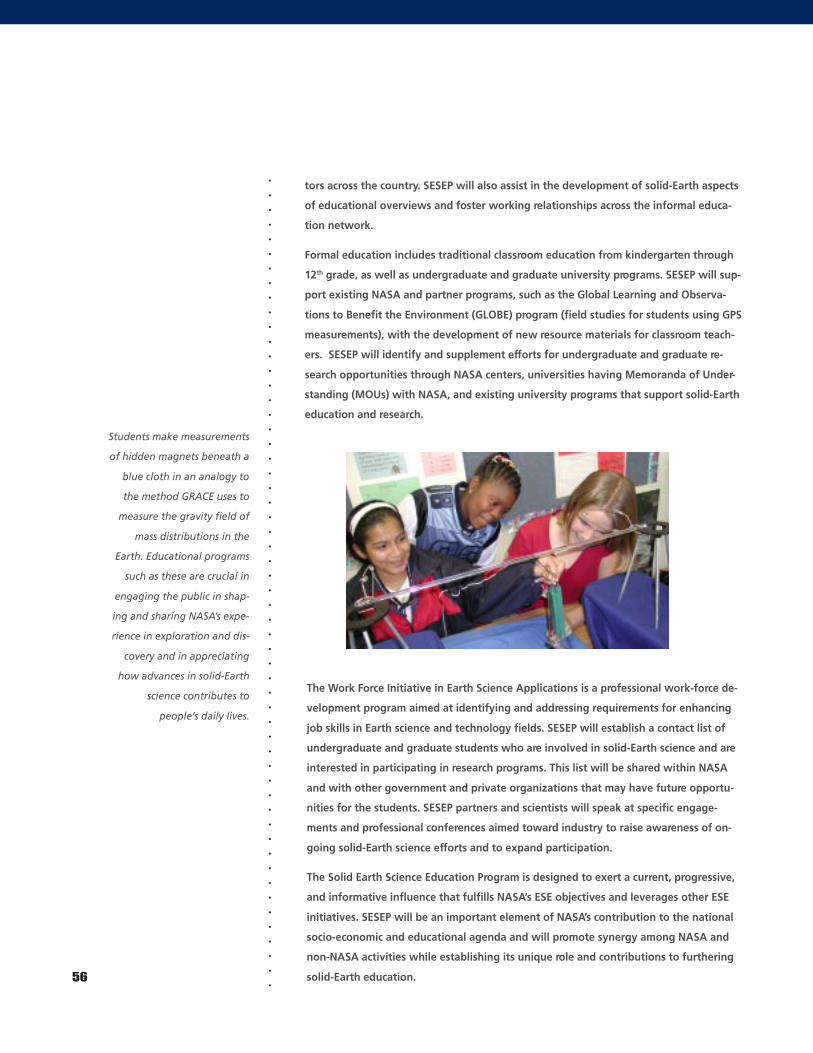
.
.
.
.
.
.
.
.
.
.
.
.
.
.
.
.
.
.
.
.
.
.
.
.
.
.
.
.
.
.
.
.
.
.
.
.
.
.
.
.
.
.
.
.
.
.
.
.
.
.
.
.
.
.
.
.56
tors across the country. SESEP will also assist in the development of solid-Earth aspects
of educational overviews and foster working relationships across the informal educa-
tion network.
Formal education includes traditional classroom education from kindergarten through
12th grade, as well as undergraduate and graduate university programs. SESEP will sup-
port existing NASA and partner programs, such as the Global Learning and Observa-
tions to Benefit the Environment (GLOBE) program (field studies for students using GPS
measurements), with the development of new resource materials for classroom teach-
ers. SESEP will identify and supplement efforts for undergraduate and graduate re-
search opportunities through NASA centers, universities having Memoranda of Under-
standing (MOUs) with NASA, and existing university programs that support solid-Earth
education and research.
Students make measurements
of hidden magnets beneath a
blue cloth in an analogy to
the method GRACE uses to
measure the gravity field of
mass distributions in the
Earth. Educational programs
such as these are crucial in
engaging the public in shap-
ing and sharing NASA’s expe-
rience in exploration and dis-
covery and in appreciating
how advances in solid-Earth
science contributes to
people’s daily lives.
The Work Force Initiative in Earth Science Applications is a professional work-force de-
velopment program aimed at identifying and addressing requirements for enhancing
job skills in Earth science and technology fields. SESEP will establish a contact list of
undergraduate and graduate students who are involved in solid-Earth science and are
interested in participating in research programs. This list will be shared within NASA
and with other government and private organizations that may have future opportu-
nities for the students. SESEP partners and scientists will speak at specific engage-
ments and professional conferences aimed toward industry to raise awareness of on-
going solid-Earth science efforts and to expand participation.
The Solid Earth Science Education Program is designed to exert a current, progressive,
and informative influence that fulfills NASA’s ESE objectives and leverages other ESE
initiatives. SESEP will be an important element of NASA’s contribution to the national
socio-economic and educational agenda and will promote synergy among NASA and
non-NASA activities while establishing its unique role and contributions to furthering
solid-Earth education.
.
.
.
.
.
.
.
.
.
.
.
.
.
.
.
.
.
.
.
.
.
.
.
.
.
.
.
.
.
.
.
.
.
.
.
.
.
.
.
.
.
.
.
.
.
.
.
.
.
.
.
.
.
.
.
.
Summary
57
Earth science as a discipline now recognizes the dynamic, interconnected nature of the
Earth as a system. Each component — oceans, atmosphere, biosphere, and solid Earth
— interacts with the others in ways only partially understood and over a broad range
of time scales. The solid Earth is a dynamic and essential component of the Earth sys-
tem. From the motions in the core that generate the Earth’s magnetic field, through
mantle convection, plate tectonics, volcanic eruptions, and land surface evolution, the
solid Earth is always changing.
A primary goal of solid-Earth science is the assessment and mitigation of natural haz-
ards that seriously threaten health, safety, national security, and economic viability.
Space-based data acquired by NASA and other cooperating Federal agencies contribute
heavily to our understanding and forecasting of volcanic eruptions, sea-level rise,
floods, landslides, earthquakes, and other hazards. The 25-year vision of the Solid
Earth Science Working Group (SESWG) is to understand natural and perturbed systems
well enough to predict outcomes, consequences, and impacts.
Understanding the discrete events that shape the Earth, and from them building a
complete picture of our planet’s dynamics, requires views of the governing behavior at
local, regional, and global scales. For many scientific issues, satellite-based observa-
tions are the primary practical means to obtain an adequate density of coverage. Inte-
grating the complementary and often more intensive, local ground-based measure-
ments into comprehensive predictive models requires a new generation of satellite
measurements at temporal and spatial resolutions substantially superior to those made
in the past.
Six broad scientific challenges have been identified as the highest in priority for NASA’s
Solid Earth Science Program for the next 25 years. These challenges are of fundamental
scientific importance, have strong implications for society, are amenable to substantial
progress through a concerted series of scientific observations from space, and build
naturally on directions identified in the NASA Earth Science Enterprise Strategic Plan.
The six science challenges are
• What is the nature of deformation at plate boundaries and what are the implications
for earthquake hazards?
• How do tectonics and climate interact to shape the Earth’s surface and create natural
hazards?
• What are the interactions among ice masses, oceans, and the solid Earth and their im-
plications for sea-level change?
• How do magmatic systems evolve and under what conditions do volcanoes erupt?
• What are the dynamics of the mantle and crust and how does the Earth’s surface
respond?
.
.
.
.
.
.
.
.
.
.
.
.
.
.
.
.
.
.
.
.
.
.
.
.
.
.
.
.
.
.
.
.
.
.
.
.
.
.
.
.
.
.
.
.
.
.
.
.
.
.
.
.
.
.
.
.
• What are the dynamics of the Earth’s magnetic field and its interactions with the
Earth system?
These six challenges are guiding themes that should define the research objectives for
solid-Earth science within NASA for the next two and a half decades. Each challenge,
once met, offers a series of significant expected accomplishments and clear benefits to
the nation. On the basis of current knowledge, the next steps needed to address each
challenge can be readily defined.
The six scientific challenges are also extremely ambitious and address goals common to
the entire solid-Earth science community. Success in meeting these challenges will de-
pend on the close coordination and collaboration with other NASA programs, with
other federal agencies, and with international partners.
To make substantial progress toward answering each of the six challenges, NASA must
formulate a broadly conceived program with both near-term goals and clear steps to-
ward longer-term objectives. A fully realized program contains elements that encom-
pass not only new observations, but also sustained investment in research and analy-
sis, information systems, new technologies, supporting infrastructure, and education.
While NASA’s role in observations is primarily the development of satellite missions,
such projects cannot be their most effective without complementary terrestrial obser-
vations and the requisite partnerships with other programs and agencies. A dedicated
research and analysis program is critical to insure that newly acquired data are fully
analyzed, to provide the new ideas for instrument and mission development, and to
foster unexpected scientific discoveries. This effort should include significant invest-
ments in computation and modeling for testing theories and predictions. A number of
observations needed over the next two decades require a continuing investment in
advanced technology development. A modular yet broadly interlinked program archi-
tecture offers flexibility to change as scientific discoveries and programmatic require-
ments dictate.
The recommended plan for new observations from space to meet the scientific chal-
lenges for solid-Earth science builds on current capabilities and on data from missions
and instruments that have recently flown, are currently flying, or are planned for the
very near future. It also relies on data from missions currently supported by other sci-
entific disciplines within NASA, and it leverages collaborations with federal, private,
and international partners.
The plan is cast in terms of five observational campaigns or strategies, each of which
addresses multiple scientific challenges. These strategies include
• deformation of the land surface,
• high-resolution topography and topographic change,58
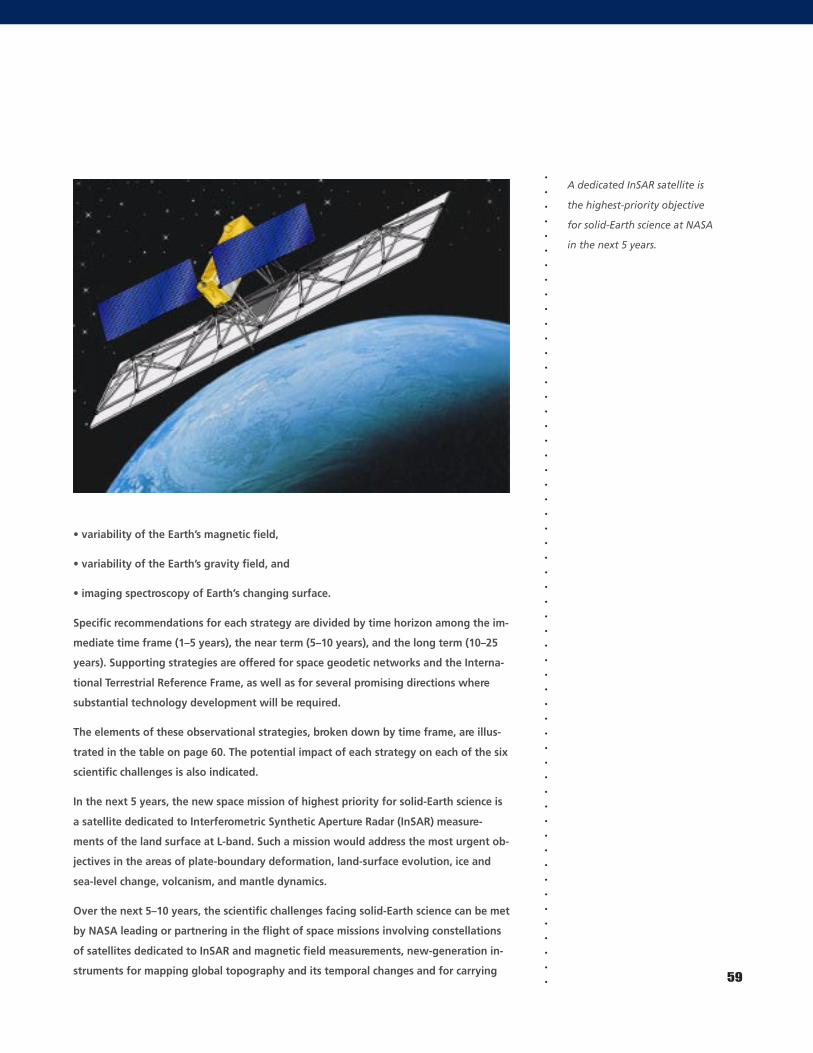
.
.
.
.
.
.
.
.
.
.
.
.
.
.
.
.
.
.
.
.
.
.
.
.
.
.
.
.
.
.
.
.
.
.
.
.
.
.
.
.
.
.
.
.
.
.
.
.
.
.
.
.
.
.
.
.
• variability of the Earth’s magnetic field,
• variability of the Earth’s gravity field, and
• imaging spectroscopy of Earth’s changing surface.
Specific recommendations for each strategy are divided by time horizon among the im-
mediate time frame (1–5 years), the near term (5–10 years), and the long term (10–25
years). Supporting strategies are offered for space geodetic networks and the Interna-
tional Terrestrial Reference Frame, as well as for several promising directions where
substantial technology development will be required.
The elements of these observational strategies, broken down by time frame, are illus-
trated in the table on page 60. The potential impact of each strategy on each of the six
scientific challenges is also indicated.
In the next 5 years, the new space mission of highest priority for solid-Earth science is
a satellite dedicated to Interferometric Synthetic Aperture Radar (InSAR) measure-
ments of the land surface at L-band. Such a mission would address the most urgent ob-
jectives in the areas of plate-boundary deformation, land-surface evolution, ice and
sea-level change, volcanism, and mantle dynamics.
Over the next 5–10 years, the scientific challenges facing solid-Earth science can be met
by NASA leading or partnering in the flight of space missions involving constellations
of satellites dedicated to InSAR and magnetic field measurements, new-generation in-
struments for mapping global topography and its temporal changes and for carrying59
A dedicated InSAR satellite is
the highest-priority objective
for solid-Earth science at NASA
in the next 5 years.
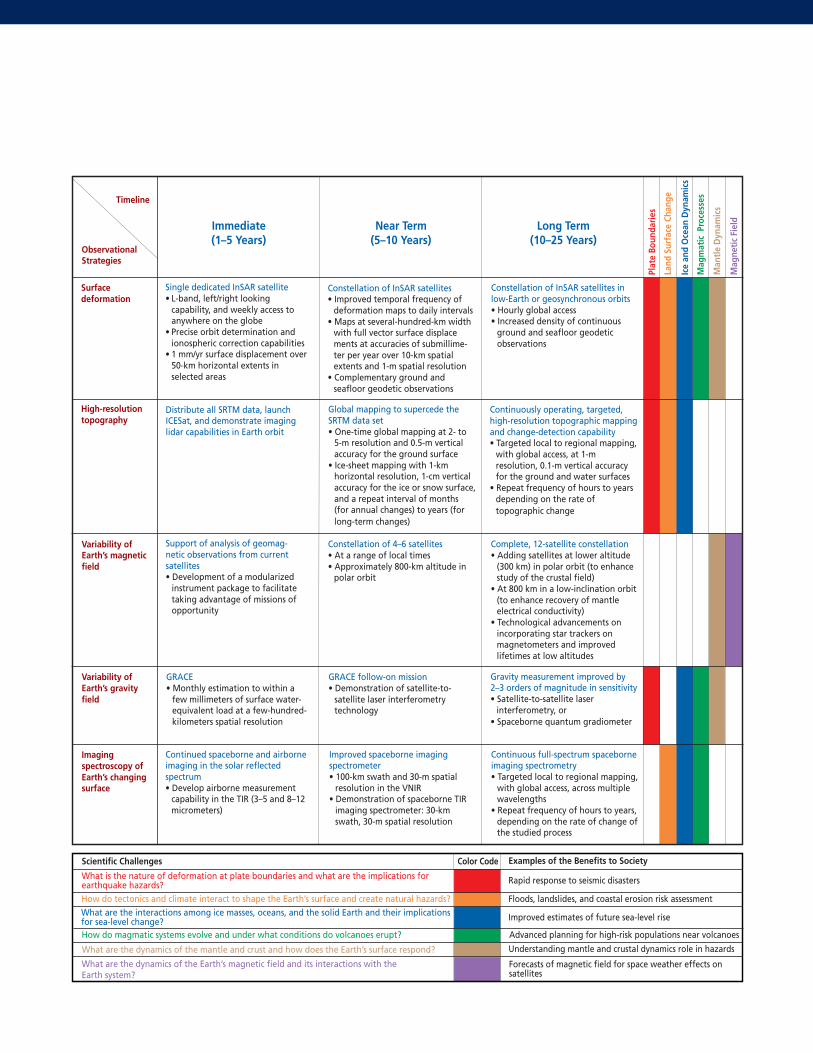
.
.
.
.
.
.
.
.
.
.
.
.
.
.
.
.
.
.
.
.
.
.
.
.
.
.
.
.
.
.
.
.
.
.
.
.
.
.
.
.
.
.
.
.
.
.
.
.
.
.
.
.
.
.
.
.
Surfacedeformation
Timeline
ObservationalStrategies
Ice
and
Oce
an D
ynam
ics
Immediate(1–5 Years)
Single dedicated InSAR satellite• L-band, left/right looking
capability, and weekly access toanywhere on the globe
• Precise orbit determination andionospheric correction capabilities
• 1 mm/yr surface displacement over50-km horizontal extents inselected areas
Constellation of InSAR satellites• Improved temporal frequency of
deformation maps to daily intervals• Maps at several-hundred-km width
with full vector surface displacements at accuracies of submillime-ter per year over 10-km spatialextents and 1-m spatial resolution
• Complementary ground andseafloor geodetic observations
Constellation of InSAR satellites inlow-Earth or geosynchronous orbits• Hourly global access• Increased density of continuous
ground and seafloor geodeticobservations
Plat
e Bo
unda
ries
Land
Sur
face
Cha
nge
Mag
mat
ic P
roce
sses
Man
tle
Dyn
amic
s
Mag
neti
c Fi
eld
Global mapping to supercede theSRTM data set• One-time global mapping at 2- to
5-m resolution and 0.5-m verticalaccuracy for the ground surface
• Ice-sheet mapping with 1-kmhorizontal resolution, 1-cm verticalaccuracy for the ice or snow surface,and a repeat interval of months(for annual changes) to years (forlong-term changes)
Continuously operating, targeted,high-resolution topographic mappingand change-detection capability• Targeted local to regional mapping,
with global access, at 1-mresolution, 0.1-m vertical accuracyfor the ground and water surfaces
• Repeat frequency of hours to yearsdepending on the rate oftopographic change
Complete, 12-satellite constellation• Adding satellites at lower altitude
(300 km) in polar orbit (to enhancestudy of the crustal field)
• At 800 km in a low-inclination orbit(to enhance recovery of mantleelectrical conductivity)
• Technological advancements onincorporating star trackers onmagnetometers and improvedlifetimes at low altitudes
Gravity measurement improved by2–3 orders of magnitude in sensitivity• Satellite-to-satellite laser
interferometry, or• Spaceborne quantum gradiometer
Continuous full-spectrum spaceborneimaging spectrometry• Targeted local to regional mapping,
with global access, across multiplewavelengths
• Repeat frequency of hours to years,depending on the rate of change ofthe studied process
Improved spaceborne imagingspectrometer• 100-km swath and 30-m spatial
resolution in the VNIR• Demonstration of spaceborne TIR
imaging spectrometer: 30-kmswath, 30-m spatial resolution
Forecasts of magnetic field for space weather effects onsatellites
What is the nature of deformation at plate boundaries and what are the implications forearthquake hazards?How do tectonics and climate interact to shape the Earth’s surface and create natural hazards?What are the interactions among ice masses, oceans, and the solid Earth and their implicationsfor sea-level change?How do magmatic systems evolve and under what conditions do volcanoes erupt?
What are the dynamics of the mantle and crust and how does the Earth’s surface respond?
What are the dynamics of the Earth’s magnetic field and its interactions with theEarth system?
Rapid response to seismic disasters
Floods, landslides, and coastal erosion risk assessment
Improved estimates of future sea-level rise
Advanced planning for high-risk populations near volcanoes
Understanding mantle and crustal dynamics role in hazards
Color Code Examples of the Benefits to SocietyScientific Challenges
High-resolutiontopography
Variability ofEarth’s magneticfield
Variability ofEarth’s gravityfield
Imagingspectroscopy ofEarth’s changingsurface
Near Term(5–10 Years)
Long Term(10–25 Years)
Distribute all SRTM data, launchICESat, and demonstrate imaginglidar capabilities in Earth orbit
Support of analysis of geomag-netic observations from currentsatellites• Development of a modularized
instrument package to facilitatetaking advantage of missions ofopportunity
Constellation of 4–6 satellites• At a range of local times• Approximately 800-km altitude in
polar orbit
GRACE• Monthly estimation to within a
few millimeters of surface water-equivalent load at a few-hundred-kilometers spatial resolution
GRACE follow-on mission• Demonstration of satellite-to-
satellite laser interferometrytechnology
Continued spaceborne and airborneimaging in the solar reflectedspectrum• Develop airborne measurement
capability in the TIR (3–5 and 8–12micrometers)
.
.
.
.
.
.
.
.
.
.
.
.
.
.
.
.
.
.
.
.
.
.
.
.
.
.
.
.
.
.
.
.
.
.
.
.
.
.
.
.
.
.
.
.
.
.
.
.
.
.
.
.
.
.
.
. 61
out imaging spectroscopy across a broad portion of the electromagnetic spectrum, and
a GRACE follow-on to improve the resolution of temporal changes in Earth’s gravity
field.Several techniques and observations offer the promise to contribute in a major
fashion to solid-Earth science but require substantial technology development. Among
these are imaging of propagating seismic waves from space, linking space observa-
tions to processes occurring on and within the solid Earth beneath the oceans, and
subsurface imaging from space with ground-penetrating radar.
The solid Earth is inherently complex, and understanding it requires significant effort
in the analysis of data and their comparison with models. Simulations must be carried
out concurrently with data analysis so that the entire system can be studied and un-
derstood. High-performance computers dedicated to solid-Earth science are required to
carry out these calculations, as well as to manage the large volumes of scientific data
that the recommended observational strategies will yield. Distributed centers are the
preferred mode for processing, storing, and retrieving the needed data. Each observa-
tional strategy calls for new technologies, and the time frames when each new tech-
nology will be needed dictate the level and pace of required investment. All of the rec-
ommendations for solid-Earth science are predicated on maintaining NASA’s special ca-
pabilities in updating the terrestrial reference frame, monitoring Earth orientation pa-
rameters, and carrying out precise orbit determination. Each recommendation also calls
for ground-based validation and calibration measurements that are closely coordi-
nated with the spaceborne observations. Finally, the expected new knowledge to be
gained about the solid Earth and its natural hazards provides compelling material with
which to inform and engage students at all educational levels.
The beginning of the 21st century is a time of unprecedented opportunity in solid-
Earth science. The confluence of advances in satellite-based observing systems, high-
performance computing and communications, and recent fundamental discoveries, all
over the past few decades, promises an era in which many of the previously seemingly
intractable problems in Earth science are now ready to be solved. In the next two de-
cades we will be in a position to reach new insights into earthquakes, volcanic erup-
tions, wildfires, landslides and floods, and the dynamics of the Earth’s core and mantle.
NASA has a unique and essential role to play in seizing this opportunity to understand
and manage the restless planet on which we all live.
.
.
.
.
.
.
.
.
.
.
.
.
.
.
.
.
.
.
.
.
.
.
.
.
.
.
.
.
.
.
.
.
.
.
.
.
.
.
.
.
.
.
.
.
.
.
.
.
.
.
.
.
.
.
.
.62
Credits
Cover: Land topography from GTOPO30,USGS EROS Data Center, 1996. Walter Smithand David Sandwell, Science, vol. 277, no.5334, pp. 1956–1962, September 26, 1997.Cover inset, top to bottom: Eyewire Images;courtesy of Robert Eplett, OES CA; courtesyof Austin Post, USGS/Cascade VolcanoObservatory.Title page, top to bottom: courtesy ofRobert E. Wallace, USGS; NOAA/NGDC;NASA/JPL/NIMA.Pg. 2: Corbis.Pg. 3: courtesy of Roger Hutchison.Pg. 4: top, Getty Images; bottom, courtesyof Steve Leatherman, Florida InternationalUniversity.Pg. 5: top, courtesy of Robert Schuster,USGS; bottom, Corbis.Pg. 6: courtesy of Ben Chao, Chopo Ma, andRichard Ray, GSFC, and Richard Holme, GFZPotsdam.Pg. 9: courtesy of Michael Heflin et al., JPL/Caltech.Pg. 11: top, courtesy of Robert Simmon,GSFC; bottom, Getty Images.Pg. 13: Getty Images.Pg. 14: GSHAP.Pg. 15: NASA/JPL/NIMA.Pg. 16: left, Robert E. Wallace, USGS; right,courtesy of Yuri Fialko, Mark Simons, andDuncan Agnew, Geophysical Research Let-ters, vol. 28, no. 16, pp. 3063–3066, August15, 2001.Pg. 17: top, SCIGN collaboration / MarcWong, CalTrans; bottom, courtesy of TomHerring.Pg. 18: courtesy of Doug Burbank.Pg. 19: courtesy of Doug Burbank.Pg. 20: Corbis.Pg. 21: top, William Krabill et al., Science,vol. 289, no. 5478, pp. 428–430, July 21, 2000,courtesy of Jay Zwally, GSFC; bottom, cour-tesy of Steve Leatherman, Florida Interna-tional University.Pg. 22: Getty Images.Pg. 23: top, Falk Amelung, Sjonni Jonsson,Howard Zebker, and Paul Segall, Nature,vol. 407, no. 6807, pp. 993–996, October 26,2000; bottom, courtesy of Paul Lundgren,JPL/Caltech.Pg. 24: courtesy of Mark Simons.Pg. 25: courtesy of David Fierstein.Pg. 26: courtesy of Jeremy Bloxham.
Pg. 27: top, Weijia Kuang and Jeremy Blox-ham, Nature, vol. 389, no. 6649, pp. 371–374,September 25, 1997; bottom, courtesy ofMichael Purucker, Raytheon/GSFC.Pg. 30: Nazca plate subduction courtesy ofRobert Simmon, GSFC; InSAR interferogramcourtesy of Matthew Pritchard, MarkSimons, Paul Rosen, Scott Hensley, and FrankWebb, Geophys. J. Int., vol. 150, pp. 362–376, 2002.Pg. 32–33: NASA/JPL/NIMA.Pg. 34: courtesy of David Sandwell, UCSD.Pg. 35: Data acquired by Terrapoint, LLC, forthe Puget Sound Lidar Consortium, imagecourtesy of David Harding, GSFC.Pg. 37: courtesy of Jeremy Bloxham.Pg. 39: courtesy of Frank Lemoine, GSFC.Pg. 41: right, NASA/GSFC/MITI/ERSDAC/JAROS, and U.S./Japan ASTER Science Team;left, courtesy of Robert Green, JPL/Caltech.Pg. 43: courtesy of Robert Green,JPL/Caltech.Pg. 45: Dimitri Komatitsch and Jeroen Tromp,2001, Proceedings, Supercomputing 2001Conference.Pg. 47: courtesy of Jeremy Bloxham.Pg. 49: courtesy of Kristy Tiampo and JohnRundle, University of Colorado, Boulder.Pg. 50: courtesy of Michael Gurnis, Caltech.Pg. 52: courtesy of Tom Yunck, JPL/Caltech.Pg. 53: courtesy of Herb Dragert, GeologicalSurvey of Canada.Pg. 54: NASA/JPL.Pg. 55: courtesy of the Texas Space GrantConsortium.
References:Chao, Ben et.al., 2002: Computation Tech-nology Workshop: Solid Earth Summary.ESE, 1996: Mission to Planet Earth Edu-cation Strategy.ESE, 2000: Exploring Our Home Planet: NASAEarth Science Enterprise Strategic Plan.ESE, 2000: Research Strategy for 2000-2010.NRC, 1997: Satellite Gravity and the Geo-sphere; National Research Council, Commit-tee on Global Earth Gravity from Space;National Academy Press, Washington, DC.
Editor: Jeff Booth, JPL/CaltechDesign & production: JPL Design Services –David Hinkle, Adriane Jach, Marilyn Morgan,Audrey Steffan
.
.
.
.
.
.
.
.
.
.
.
.
.
.
.
.
.
.
.
.
.
.
.
.
.
.
.
.
.
.
.
.
.
.
.
.
.
.
.
.
.
.
.
.
.
.
.
.
.
.
.
.
.
.
.
.
Solid Earth Science Working Group (SESWG)
Sean C. Solomon (Chair)
Carnegie Institution of Washington
Victor R. Baker
University of Arizona
Jeremy Bloxham
Harvard University
Douglas Burbank
University of California, Santa Barbara
Benjamin F. Chao
NASA Goddard Space Flight Center
Alan Chave
Woods Hole Oceanographic Institution
Andrea Donnellan
Jet Propulsion Laboratory, California Insti-
tute of Technology
Alan Gillespie
University of Washington
Thomas Herring
Massachusetts Institute of Technology
Raymond Jeanloz
University of California, Berkeley
Bernard Minster
University of California, San Diego
Walter C. Pitman, III
Lamont Doherty Earth Observatory,
Columbia University
Eric Rignot
Jet Propulsion Laboratory, California Insti-
tute of Technology
Mark Simons
California Institute of Technology
Donald L. Turcotte
Cornell University
Mary Lou C. Zoback
U.S. Geological Survey
John LaBrecque (ex-officio)
NASA HQ
Charles Elachi (ex-officio)
Jet Propulsion Laboratory, California Insti-
tute of Technology
Diane Evans (ex-officio)
Jet Propulsion Laboratory, California Insti-
tute of Technology
63

.
.
.
.
.
.
.
.
.
.
.
.
.
.
.
.
.
.
.
.
.
.
.
.
.
.
.
.
.
.
.
.
.
.
.
.
.
.
.
.
.
.
.
.
.
.
.
.
.
.
.
.
.
.
.
.
National Aeronautics andSpace Administration
Jet Propulsion LaboratoryCalifornia Institute of TechnologyPasadena, California
Web site: http://solidearth.jpl.nasa.gov
JPL 400-1040 11/02