Embed Size (px)
Citation preview

Page 6 February 2003
INDUSTRYREVIEW

Page 1 February 2003
THE SHIFT IN AIR CANADA’SDOMESTIC SEAT CAPACITYWith the introduction of Tango and Zip operating under the Air Canada umbrella, there has been anoticeable shift in domestic seat capacity away from Air Canada trunk operations to its newlybranded travel products in Tango and Zip.
Tango began operations on a limited number of domestic routes in November 2001 offeringtravelers a “no-frills” option to Air Canada’s full-service travel offering. Zip, which began operationsin September 2002, has its route network focussed primarily on Western Canada – although thelow cost carrier has plans toexpand services to EasternCanada in February 2003.
Over the past two years, therehas been a definite shift indomestic seat capacity from AirCanada trunk operations andJazz to its other b randedproducts of Tango and Zip. Infuture months, with Zip’s plans tomove into Eastern Canada,capacity will continue to bereallocated from Air Canadatrunk.
Air Canada Domestic Seat Capacity Breakdown
Carrier January 2001 January 2002 January 2003Air Canada Trunk 58.4% 59.5% 51.9%Regional/Jazz 41.6% 36.8% 32.8%Tango - 3.7% 10.5%Zip - - 4.8%Total Domestic SeatCapacity 2,506,049 2,222,703 2,247,368
% Change in TotalDomestic Seat Capacityfrom 2001
- -11.3% -10.3%
Source: OAG Max January 2001, January 2002, January 2003; Tango Timetable 2001 andJanuary 2003, Air Canada Zip website.
Observations:
• Both Air Canada Trunk and Jazz have seen a drop in their share of AC total domestic seatcapacity.
• Tango and Zip now account for 15.3% of total capacity.• Note that the seat capacity of Tango and Zip is now equal to 44.5% of the seat capacity of
WestJet.• The largest drop has been at Jazz, which lost 8.8% share of total capacity. In absolute terms,
Jazz has seen a decline in seat capacity of –29.3%.
Doris Mak
Senior Market Analyst
AC Domestic Seat Capacity Shares
0 %
20%
40%
60%
80%
100%
Jan 2001 Jan 2002 Jan 2003
Air Canada Trunk Regional/Jazz Tango Zip

Page 2 February 2003
-15%
-10%
-5%
0%
5%
10%
15%
20%
25%
Feb-02
Mar Apr May J u n Jul Aug S e p Oct N o v Dec Jan-03
Dom RPKDom ASK
January 2003 RPKs are 8.8% below January 2001 levels
Air Canada DomesticAir Canada Domestic
-10%
-5%
0%
5%
10%
15%
20%
25%
Feb-02
Mar Apr May Jun Jul Aug Sep Oct Nov D e c Jan-03
Int'l RPK
Int'l ASK
January 2003 RPKs are 0.6% below January 2001 levels
Air Canada InternationalAir Canada International
AIRLINE DATA - CANADA Traffic and Load Factors on Canada’s Major Air Carriers – January 2003
Passenger TrafficRevenue Passenger Kilometres
CapacityAvailable Seat Kilometres
Load Factor
Air Carrier% Changeover 2002
% Changeover 2001
% Changeover 2002
% Changeover 2001
%Change
over 2002
%Change
over 2001
Air Canada1 -2.1% -3.0% +1.6% -7.6% -2.6 pts(to70.4%)
+3.3 pts
Domestic -12.7% -8.8% -3.4% -8.5% -7.2 pts(to 67.3% -0.3 pts
International& Charter +2.6% -0.6% +3.7% -7.2% -0.7 pts
(to 71.7%) +4.8 pts
WestJet +51.8% +132.6% +61.4% +149.1% -5.8 pts(to 61.3%)
-4.3 pts
The following graphs highlight the year-over-year change in Air Canada’s mainline domestic andinternational passenger traffic and capacity.
Air Canada’s domestic traffic has continued its downward trend which began in November 2002into the first quarter, traditionally the weakest months for the air travel industry. Domestic traffichas shown year-over-year declines for three consecutive months with traffic down 12.7% inJanuary. Although Air Canada launched its winter seat sale event in January, domestic loadfactors were at 67.3% (down 7.2 pts) on 3.4% less capacity compared to a year ago. Air Canada’stransborder operations were up marginally (+0.8%) in January with a load factor of 64.2%.Capacity increased by 2.2% compared to one year ago.
Although WestJet continues to show strong growthwith traffic up 51.8% in January compared to thesame month last year, the airline’s share price hasbeen punished in the recent weeks. Investors viewthat the recent fare war between Air Canada Zipand WestJet will result in lower yields for the airlinein the near future. WestJet capacity increased61.4% for the month. With excess capacity in thesystem, load factor was down 5.8% from a yearago.
1 Air Canada Mainline consists of all Air Canada with the exception of Jazz.
NEW CARRIERS:LOAD FACTORS
Jetsgo: 69%Zip: not reported
CanJet: not reported
0 %
10%
20%
30%
40%
50%
60%
70%
80%
F e b -02
Mar Apr May Jun Jul Aug Sep Oct Nov Dec Jan-03
RPK
ASK
WestJetWestJet

Page 3 February 2003
AIRLINE DATA – USUS AIRLINES 2002 FINANCIAL AND TRAFFIC FIGURES
Airline2002 Net Income(US$ - Millions)
2001 NetIncome (US$ -
Millions)
LoadFactor
Traffic(RPMs –millions)
Capacity(ASMs –millions)
1
$3,511 incl.special items
$2,018 excl.special items
LOSS
$1,762 incl.special items
$1,407 excl.special items
LOSS
70.4%
á1.8 pts
125,900
á1.2%
178,800
â1.3%
2 $169
LOSS
$76
LOSS
72.8%
â3.2 pts
12,400
á6.1%
17,600
á8.7%
3$451
LOSS$95
LOSS
73.3%
á1.5pts
59,300
â2.9%
80,100
â5.2%
$1,272LOSS
$1,216LOSS
72.0%
á3.2 pts
102,000
á0.3%
141,700
â4.1%
$55
PROFIT
$39
PROFIT
83.0%
á5.0 pts
6,800
á108.3%
8,200
á95.8%
$798LOSS
$423LOSS
77.1%
á2.8 pts
72,000
â1.5%
93,400
â5.0%
$241PROFIT
$511PROFIT
65.9%
â2.2 pts
45,392
á2.0%
68,887
á5.5%
$3,212LOSS
$2,131LOSS
73.5%
á2.7 pts
109,500
â6.2%
148,800
â9.7%
5 $1,646LOSS
$2,117LOSS
71.0%
á2.2 pts
40,000
â12.9%
56,400
â15.5%
Notes: 1 Passengers carried data only includes up to June 2002.2 Includes American Airlines and American Eagle3 Scheduled Service –Total only4 Includes Continental Express.5 Load factor includes scheduled service only.
Source: Carrier financial/traffic reports.
The largest US airlines lost more than US$11 billion in 2002, a US$7.5 billion improvement fromthe year before. From the above chart, American Airlines experienced the largest loss while onlySouthwest Airlines and JetBlue Airways were profitable for the year.

Page 4 February 2003
WestJet Monthly Load Factor Growth/Decline: 2002 vs. 2001
(4.0)
(3.0)
(2.0)
(1.0)
-
1.0
2.0
3.0
Jan-
02
Feb-
02
Mar
-02
Apr
-02
May
-02
Jun-
02
Jul-0
2
Aug
-02
Sep
-02
Oct
-02
Nov
-02
Dec
-02
Ch
ang
e in
L.F
. o
ver
Pre
vio
us
Yea
r (P
ts.)
WESTJET OUTLOOK FOR 2003Continued Growth in a Difficult YearFor several years, many Canadian airports have looked to WestJet as their best opportunity forimproving air services by bringing competition, flights, destinations, or jet aircraft to their markets.While WestJet is likely still the best hope for a strong and competitive industry in Canada, there areseveral indicators that the year ahead may be the most turbulent in its history.
For starters, WestJet has introduced a fuel surcharge on its flightsfor the first time. Fuel prices are not significantly higher thanthey were when Air Canada, Canada 3000 and Air Transat added surcharges in May 2001, but theaggressive fuel hedging program which helped WestJet avoid following suit during the last fuelspike will account for less than 30% of its fuel needs in 2003.
In addition, WestJet continues to feel the pinch on its ultra short haul routes, largely due to thedestimulative effect of the Air Travellers Security Charge in these markets. Although the ATSCis expected to be reduced somewhat in the next federal budget, the structure of the fee is unlikelyto change, meaning that short haul (lower fare) routes will continue to be disproportionatelyaffected. To its credit WJ is leading by example, collecting its NavCanada and fuel surcharges ona tiered basis, mitigating the effect on short haul routes. Note that WestJet is also critical of AirportImprovement Fees, most of which also have a greater impact on short haul travel.
While fuel prices, security charges and the pending conflict in Iraq will continue to have anegative impact, the emergence of low cost competition in all regions of the country is probablyof greater concern to WestJet right now. With load factors stuck in the mid-50% range, Zip initiateda fare war in Western Canada. Seat sale prices between Vancouver/Victoria and Calgary are aslow as $37.49 one way. WestJet had little choice but to match ZIP’s fares. In the east, the repeatof the Milton-Leblanc-Rowe battle has deteriorated, as it did in 2001, into money losing seat sales.The result is downward pressure on WestJet yields in both Eastern and Western Canada.
In spite of a less-than-optimal operatingenvironment, WestJet will continue itsindustry-leading growth, taking delivery of 11new aircraft in 2003. It is important to notethat unlike its first several years of operation,WestJet’s traffic growth is no longer keepingpace with its capacity growth. In 10 of thepast 12 months, WestJet has posted monthlydeclines in year-over-year load factors, withonly September and October showingimprovements over the severely depressedlevels of 2001. Although the falling load factoris due in part to the addition of new markets,one hopes that WestJet can avoid the flaw of growing too quickly, which has been fatal for manycarriers in the past.
Although the year ahead will be one of the most challenging so far for WestJet, it remains in thebest shape among the large domestic carriers. WestJet is profitable, maintaining a solid balancesheet and strict cost controls. Investors may continue to see a depressed share value, andemployees might be less excited than usual on profit-sharing day, but WestJet will continue to leadthe growth of the Canadian airline industry in 2003.
John Weatherill
Senior Airline Analyst

Page 5 February 2003
Summary of Total Year-Over-Year Passenger Traffic Performance at Selected Airports - 2002
2002 VancouverMontreal-Dorval Calgary Edmonton Ottawa Winnipeg Halifax Victoria Kelowna Saskatoon Regina St. John’s
January -10.3% -15.2% -4.3% -11.8% -11.4% -20.1% -5.6% -12.1% -3.0% -4.0% -8.4% -9.3%February -9.2% -12.4% +1.1% -12.0% -10.1% -17.2% -16.4% -6.8% -0.1% -8.5% -6.2% -9.8%
March -7.0% -13.1% -2.0% -11.4% -12.9% -12.4% -17.2% -6.5% -3.0% -7.6% -7.8% -11.8%1st Quarter -8.8% -13.6% -1.8% -11.7% -11.5% -16.5% -13.6% -8.4% -2.1% -6.7% -7.5% -10.3%April -9.2% -13.5% -5.2% -8.1% -13.1% -9.3% -12.3% -6.4% -5.7% -13.4% -12.6% -11.0%
May -9.3% -9.5% -2.3% -4.9% -11.4% -5.7% -4.7% -5.1% -3.8% -3.0% -7.2% -7.3%June -7.4% -9.8% -4.0% -7.0% -12.3% -6.0% -1.2% -7.4% -8.8% -9.7% -13.2% -16.8%2nd Quarter -8.6% -10.9% -3.8% -6.7% -12.3% -6.9% -6.0% -6.3% -6.1% -8.7% -11.1% -11.9%
July -7.2% -8.3% -3.6% -9.4% -6.6% -5.1% +4.4% -13.1% -6.3% -9.5% -13.0% -7.0%August -7.7% -7.9% -2.3% -7.5% -8.8% -2.8% +7.5% -8.8% -1.7% -13.6% -10.5% -8.0%September +12.6% +22.4% +20.1% +7.6% +23.7% +16.4% +26.1% +13.2% +11.8% +12.6% +10.5% +20.0%
3rd Quarter -2.5% -0.2% +2.9% -4.4% +0.50% +1.2% +11.2% -4.8% +0.2% -5.4% -5.8% -0.8%October +12.5% +15.3% +14.3% -0.1% +6.4% +5.9% +7.9% +0.1% +5.7% +1.7% +4.4% -0.7%November +4.7% +5.3% +0.6% +9.4% +3.0% +5.7% +5.7% +0.1% -1.4% +0.2% +1.2% -2.3%
December n/a n/a +6.9% +11.7% +6.3% +15.2% +8.1% +1.4% +4.3% +1.5% +3.2% +2.2%4th Quarter n/a n/a +7.5% +6.9% -5.1% +8.9% +7.3% +0.5% +3.0% +1.1% +3.0% -0.3%
Notes: Toronto does not report monthly or quarterly traffic level.St. John’s International Airport Authority figures in the January issue were reported as month-over-month % change. These figures have been revised to reflect year-over-year %change.

Page 6 February 2003
NEWS ARTICLESAIR CANADA UPDATEAIR CANADA 2002 FINANCIALSIMPROVEAir Canada reported an unaudited operatingloss of C$288 million for the quarter endedDecember 31, 2002, a C$20 millionimprovement fromthe same periodlast year. For theyear, the company’s operating loss amountedto C$218 million, an improvement of C$513million from 2001. Net loss for the quarteramounted to C$364 million while net loss forthe year totaled C$428 million. Air Canadaattributes several factors to the improvedperformance, including:
• Increased participation and more effectivecompetition in the low fare market
• On-going cost reductions• Improved customer service• Advanced strategy to enhance value of
core assets and subsidiary operations
Air Canada Financial Results – 2000-2002Operating Loss
(C$ Millions)Net Loss
(C$ Millions)Q4 Full
YearQ4 Full
Year2002 ($288) ($218) ($364) ($428)2001 ($308) ($731) ($277) ($1,315)2000 ($395) $83 ($274) ($82)
Although Air Canada showed improvement in2001, the carrier’s figures have not improvedover 2000 levels.
AIR CANADA WINS REGULATORYCASEOn January 16, the Quebec Court of Appealruled to strike down a provision of theCompetition Act which would have given theCompetition Commissioner unlimited power toorder Air Canada to raise fares whensuspected of predatory behaviour. TheCommissioner is considering an appeal.
AIR CANADA SELLS 35% OFAEROPLAN, CONSIDERS SALE OFOPERATING UNITSAir Canada will sell 35% of Aeroplan toprivate investor, Onex Corporation for C$245million. Air Canada will hold a C$200 millionnote payable by Aeroplan and Onex will hold aC$52.5 million note from Aeroplan. Inaddition, the company intends to sell up to49% interest in Air Canada Technical Servicesand a significant stake in Air Canada GroundHandling Services, once it is set up as a standalone entity. As well, the company isconsidering the sale of Air Canada Jazz. Withthe sale of these divisions, the carrier hopes todevelop several of its operating units as standalone businesses with the objective of drivingnew revenue opportunities and attractinginvestment from financial and strategicpartners.
AIR CANADA REDUCES WINTERSCHEDULE, FOCUS ON PROFITAir Canada has cut its February and Marchdomestic flight schedules by more than 6%.Overall, it has cut capacity across itsworldwide network by 3-4% through acombination of shifting to smaller aircraft andreducing flight frequencies.
LONDON, ON JOINS ZIP’S NETWORKBeginning March 2, Zip Air Inc. will offer dailyservice from London, Ontario to Vancouver,Calgary, and Abbotsford using a fleet of 737-200s.
Page 7 February 2003
NEWS ARTICLES.OTHER CANADIAN AIRLINESWESTJET, ZIP LOWER FARES IN WESTWestJet and Zip Air have reduced fares fortravel between January 18 - February 28, onWestern Canada routes where they competehead-to-head. Fares start as low as:
Zip WestJetCalgary-Victoria
(one-way) $39.99 $37.50
Winnipeg-Abbotsford(one-way)
$79.99 $77.50
WESTJET ADDS EASTERN ROUTESEffective April 1, WestJet will offer non-stopservice every business day betweenWinnipeg-Windsor as well as weekend servicebetween Windsor-Calgary. On April 24, thecarrier will launch service from Calgary toMontreal with further enhancements to theschedule in late July. Apart from Montreal andWindsor, the carrier will offer four weekly non-stop flights between Moncton-St. John’sbeginning on June 15. On June 16, threeweekly non-stops between Moncton-Ganderwill also be offered.
JETSGO BEGINS OTTAWA SERVICE,IMPROVES SERVICEStarting March 2, Jetsgo will offer a weekdayOttawa-Toronto service with twice-daily returnflights, plus one return flight on Sundays. Thecarrier has added a seventh Boeing MD-83 toits fleet for the extended service. On March 3,the carrier will add three weekly Vancouver-Toronto flights.
CANJET OFFERS 50% OFF DOMESTICFARESOn January 22, CanJet launched a “WinterSizzler Sale” offering 50% off regular domesticfares. The sale was in effect until January 31for travel up to April 30.
BEARSKIN OFFERS LOW FARESBearskin Airlines has introduced low faresand enhanced schedules to and fromWinnipeg. Roundtrip fares between Winnipeg-Kenora are C$99 if booked at least 60 days inadvance.
US & INTERNATIONALAIRLINESUS MAJORS WIN CODESHARINGAPPROVALOn January 17, Delta, Northwest andContinental were given approval by the USDOT and the Justice Department to sell seatson each other’s flights through a code-sharearrangement.
DELTA’S NEW SONGOn January 29, Song, Delta’s new low-fareairline service was unveiled. Effectively, this isa re-launch of Delta Express, a Tango-likecarrier which Delta had operated for someyears prior to September 2001. Song willinitially service US Northeast to Florida routesand will begin service on April 15 from NewYork to West Palm Beach. The carrier plansto provide 144 daily flights with a fleet of 36Boeing 757 aircraft by October 2003.
NW TO FURLOUGH PILOTSNorthwest plans to furlough an additional 60pilots. The carrier has also asked the pilotsunion to postpone payments to its pensionplan.
FRONTIER AIRLINES IMPLEMENTSTEMPORARY FUEL SURCHARGEOn January 15, Frontier Airlinesimplemented a temporary $10 fuel surchargefor all domestic U.S. flights.

Page 8 February 2003
CARGOUS CARGO INCREASESUS Air Transport Association figures forDecember show a 7.1% increase in revenueton-miles for domestic cargo. Internationalcargo increased by 9.7%. Although overallcargo increased 8.4% it was still down 9.7%from December 2000. Total freight volume forthe year increased 3.7% but was still down7.4% from 2000.
UPS 4TH QUARTER EARNINGSIMPROVEFor the 4th quarter endedDecember 31, 2002, UPSrevenue was up 3.3% fromthe same period last year.Net income rose 133% to US$1.5 billion. Forthe full year, revenue totalled US$31.3 billion,an increase of 3.1% from the prior year.
AIRBORNE NET INCOME IMPROVESAirborne, Inc. reported fourth quarter netincome of US$12.2 million up from US$2.2million in the fourth quarter of 2001. For theyear Airborne reported US$14.8 million in netearnings, compared to a net loss of US$19.5million the previous year.
AIRPORTSWAA STRONG 4TH QUARTER RESULTSWinnipeg Airports Authority reported fourthquarter revenues of $11.0million, an increase of 11%from the previous year.Revenues exceeded expensesby $3.2 million. Passenger traffic for thequarter reached 666,000, an increase of 9.9%from 2001. For 2002, revenues totalled $42.4million and expenses worth $56.6 million.Annual passenger traffic reached 2.7 million,dropping 3.6% from 2001.
PRINCE GEORGE AIRPORT FINALLYTRANSFERS TO LOCAL CONTROLPrince George Airport Authority has signedan agreement to transfer control of PrinceGeorge Airport from the Government of
Canada to the airport authority. PrinceGeorge is the last of the 26 National AirportsSystem airports to be transferred and withlocal control. Transfer will take place onMarch 31, 2003.
AIRCRAFTMANUFACTURERSBOEING REPORTS DECLINE IN NETEARNINGSBoeing reported net earnings of US$590million for the fourth quarter 2002 withrevenues of US$13.7 billion. Net earnings forthe full year totalled US$2.3 billion.
BOEING TO LAYOFF 650 EMPLOYEESOn March 21, Boeing will layoff 650employees from its Commercial AirplanesGroup as part of the division’s overall plans toeliminate 5,000 positions this year throughlayoffs and attrition. In total, Boeing plans tolay off 6,000-7,000 employees from theCommercial Airplanes Group and the SharedServices group this year.
GOVERNMENT ANDREGULATORYONLY HALF OF U.S. SECURITY FEESTO BE FUNDED BY USERSThe Bush Administration is requesting US$4.8billion to fund the Transportation SecurityAgency for FY2004. Of this, only half ($2.4billion) will be derived from security fees leviedon passenger tickets and airline fees.
PEOPLE IN THE NEWSGRAD JOINS YVRAS JAMAICACurtis Grad, Airport Manager at AbbotsfordAirport, will be joining YVR Airport Services astheir new Vice President of Operations inMontego Bay, Jamaica.
ANDRUSIAK JOINS CATSAOwen Andrusiak has left his position asManager of North Bay and has joinedCATSA’s Regulations & Knowledgedepartment.
CRUDE OIL PRICES RISING
Crude Oil Price:
Spot – US$35.12 up 10% fromJanuary.
Future• 6 month - US$30.22• 12 month - US$27.26• 2 year - US$24.11• 5 year - US$23.47
FUEL PRICESFebruary 7, 2003

Page 9 February 2003
Roland DorsayRegional Vice President
Ottawa
THE OTTAWA SCENE 10 February 2003
Federal Budget. Finance Minister John Manley tables the 2003 federal budget in the House ofCommons on February 18 at 4pm. Information about the Budget contents will be available fromthe Finance Department’s web site www.fin.gc.ca once the Minister begins his address.
ATSC. Changes to the $24 Air Transportation Security Charge will likely be announced at thattime. Also worth watching out for is the Government’s response to VIA Rail’s request for $3 Billionto help fund high-speed rail in the Quebec City-Windsor corridor. The Budget may also acceleratethe Government’s multi-sector regulatory reform initiative as part of its Innovation agenda.
Canada’s Airline Industry. Following the release of Air Canada’s 4 th Quarter 2002 results lastweek, Transport Minister David Collenette acknowledged that the Government is concerned aboutthe financial fragility of Canada’s airline industry and that consideration is being given to whetherthe Government has a role in providing relief, possibly through reduced airport rents, a reduction inNAV Canada charges and/or security fees. Mr. Collenette noted that no decision has been made.
Security. On the security front, Immigration Minister Denis Codere has asked the House ofCommons Immigration Committee to consider the introduction of a biometric national identity card.This is opposed by Canada’s Privacy Commissioner and others. Nonetheless, Minister Coderebelieves that a national identity card would help Canadians avoid the brunt of upcoming US entry/exit tracking requirements.
The Canadian Government remains concerned that Canadian citizens may not be exempt fromU.S. entry/exit tracking which is to be phased in by 2005 and is seeking assurances that Canadiancitizens will not be affected. If as a result of mounting security pressures in the U.S., Canadiansare not exempted, the impact on cross border travel and trade would be considerable, particularlyfor the land border.
U.S. Trade Act. The U.S. Trade Act of 2002 requires U.S. Customs to develop regulations toprovide for the mandatory collection of electronic information on cargo prior to importation in orexportation out of the U.S. Late last year, U.S. Customs issued “Straw Man” regulations for publiccomment. They proposed that the data be supplied 8 hours prior to lading for air courier shipmentsand 12 hours prior to lading for other air cargo shipments. For trucks, the requirement is to provideelectronic information 4 hours before lading. More recently, U.S. Customs extended the commentperiod on its proposed regulations to February 18, 2003. Foreign Affairs anticipates that theseadvance notice time lines will be reduced somewhat when the regulations are finalized but isencouraging affected stakeholders to make their views known.
VIA Rail Legislation. The government has announced its initiation to table legislation on VIA Railthe week of February 17. We expect that this legislation will create a statutory base for VIA Rail,which is neither a crown corporation nor a government agency. This legislation will likely define arole for VIA and clarify its financial relationship with the Federal Government.

Page 10 February 2003
The TSA & CATSA:Key Differences in SecurityManagement
As the reorganization of Customs, INS andother agencies into the Department ofHomeland Security (DHS) accelerates in thefirst half of 2003, some of the key differencesbetween the U.S. and Canadian approachesto transportation and border security arebecoming increasingly apparent. At the frontline is the delivery of services to protect thecommercial air transport system by theCanadian Air Transport Security Authority(CATSA) and the U.S. Transportation SecurityAdministration (TSA). The key differences ineach organization's structure are outlined inthis article.
Same Purpose, Different Scope
Both CATSA and the TSA were created toaddress shortcomings in security processes.CATSA focuses on airports but the TSA wascharged with a multi-modal scope. As its workin aviation security matures, the TSA is nowadvancing security measures for other modessuch as cruiseships. CATSA, on the otherhand, has a narrow mandate for screening ofpassengers, personnel and their goodspassing into restricted areas at airports. Thebalance of other transportation securitymeasures (marine, rail, and other facets ofaviation) remain largely with carriers andfacility operators.
Integrated Service Delivery
A criticism of the TSA thus is its investment insystem enhancements (e.g. biometrics)independent from other U.S. and Canadianagencies.
With the TSA destined to be part of the DHSBorder and Transportation SecurityDirectorate, agency coordination shouldgreatly improve. As of March 1, 2003, theU.S. Customs Service and Immigration andNaturalization Service (INS) and other borderagencies will become the new Bureau ofCustoms and Border Protection (BCBP) andBureau of Immigration and CustomsEnforcement (BICE). A reorganized TSA is
anticipated to be incorporated as a sisterorganization to these two bureaus, andprovide greater coordination in transportationinitiatives.
CATSA is currently in the preliminary stages ofdefining its enhanced biometric restricted areapass system. Its efforts are coordinatedthrough a federal inter-departmentalcommittee, including the Canada Customs andRevenue Agency and Citizenship andImmigration Canada.
Separation of Regulatory Authority
There are significant differences in eachorganization's ability to advance regulatorychanges. The TSA issues and administersfederal Transportation Security Regulations(TSR), formerly administered by the FAA.TSR cover all modes including rules forcarriers, aerodrome and transportationinformation. It is anticipated that TSR will becoordinated closely between the reorganizedTSA, and its sister organizations in the DHSBorder and Transportation SecurityDirectorate.
By comparison, CATSA can only formrecommendations to Transport Canada forchanges to federal regulations such as theSecurity Screening Order or the Air CarrierSecurity Measures (ACSM).
Solomon WongDirector
Security & Planning

Page 11 February 2003
The TSA & CATSA: Key Differences in Security Management -Continued
Future Directions
As Canada and the U.S. develop their structures for delivery of air transportation security, someimportant questions need to be addressed for long term solutions:
§ How will risk management and security for different modes be applied?§ Will security agencies be able to integrate initiatives with other passenger and goods
processing functions?§ Will these entities have sufficient regulatory authority to evolve their processes?§ How will Canada and the U.S. increase greater cooperation and coordination in delivering
optimal security for the continent?
AT A GLANCETSA CATSA
Formation Nov 2001 Apr 2002Airports 429 89Workforce 50,000+, federal >100 federal, >3,000
contractor screenersBudget US$4.8 billion in
FY2003CAD$2.2 billion over
5 years
Page 12 February 2003
ECONOMIC OUTLOOK10 February 2003
Increased risk of recession in the U.S. The chance that the US will slip back into recession wasupgraded to 1-in-3 last week. Unemployment is high and rising fuel prices are a costly burden forhouseholds and businesses.
At the start of 2003, US consumers were clearly worried. Behind the decline in the University ofMichigan Consumer Sentiment Index (www.sca.isr.umich.edu) reading for January 2003 is awidely held view that jobs are scarce. This is supported by the current number of weekly claims forunemployment insurance which indicate that the number of jobs nation-wide is not increasing.
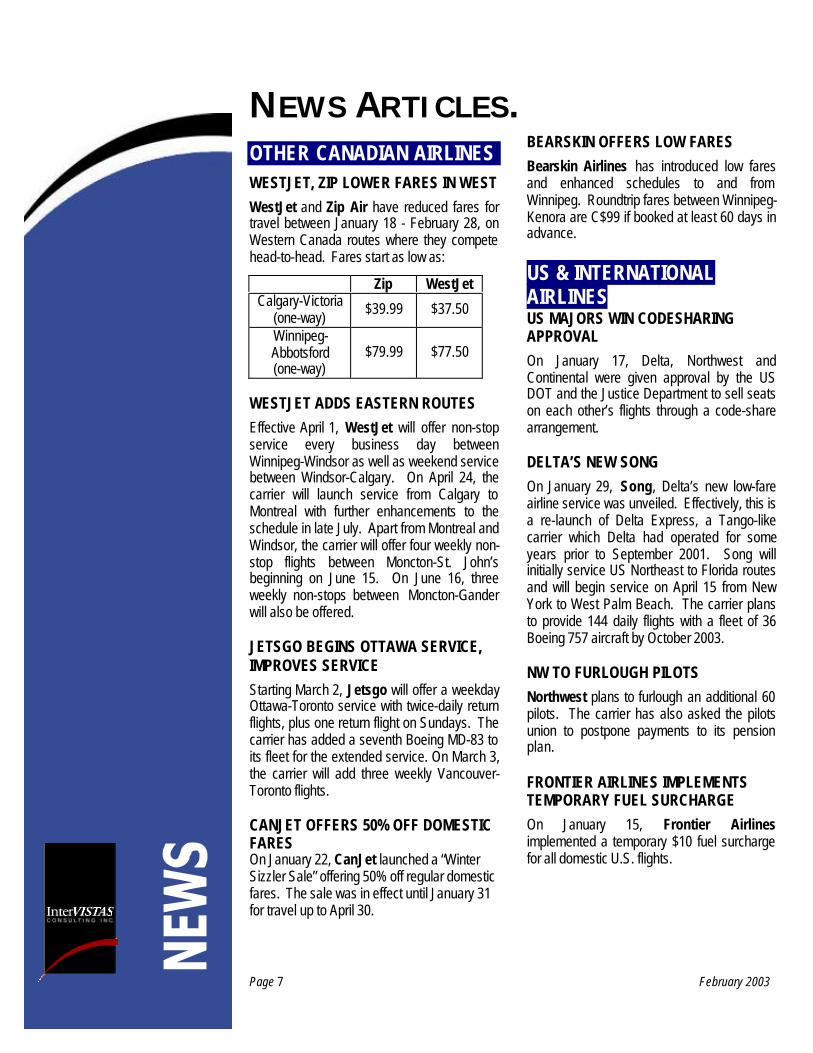
The manufacturing economy isalso showing signs ofsluggishness compared toDecember. The Institute forSupply Management’s USProduction Index (PMI)(www.ism.ws) fell to 53.9percent, down 1.3 percentagepoints from December.Nonetheless, the value of thisindex signifies that themanufacturing economy is stillexpanding. The Institute for Supply Management reports that the overall economy, like themanufacturing economy, was still growing in January 2003 – but at a reduced rate.
A quick and successful end to the standoff with Iraq would bring relief to the US economy throughlower fuel prices and reduced uncertainty. As well, continued decline in the value of the US dollarwill be some remedy to the current situation. This is because, as the dollar falls and importsbecome relatively more expensive, US industries will experience an increase in domestic demand.Greater domestic demand will encourage the business sector to start investing, making purchasesfrom their suppliers and hiring back workers. In spite of its apparent weakness, the U.S. economyis expected to grow at a healthy 3-3.5 % during the first half of 2003.
Canada – still bucking the trend, for now. Growth in employment in Canada during 2002reached a 15-year high at 3.7%. Low interest rates (although expected to increase) and increasedincome will keep consumers spending in 2003. To keep inflation low, the Bank of Canada isexpected to make its first interest rate increase of the year on April 15. Analysts predict that theovernight rate will be up 150 basis points to 4.25% by the end of the year. The value of theCanadian dollar is higher than it has been in the last 8 moths or so, but the outlook for the rest ofthe year is uncertain.
Allison PadovaManager
Economic Services7 5
8 0
8 5
9 0
9 5
100
'Sept-0
2 Oct
Nov DecJan
-02 Feb Mar Apl May Jun Jul Aug Sep Oct NovDec-
02
Jan-03
35
40
45
50
55
60
Consumer Confidence
PMI

Page 13 February 2003
WHAT’S HAPPENING14 February 2003
Massive Bankruptcies? Will the U.S. air carriers and AirCanada all file for bankruptcy protection should the U.S. invadeIraq or should there be a terrorism incident? This certainly is arealistic possibility. A month ago, not much credibility would havebeen given to this scenario, but today the word on the street isthat it is now a likely outcome.
The best way to emerge from bankruptcy protection is to enter it and with as much cash aspossible. If there is armed conflict and/or a terrorism incident, air travel demand will drop. It isunlikely that any of the major network carriers could withstand another drop in traffic and revenues,such as was witnessed after 911. If bankruptcy is inevitable, then the sooner protection is sought,the better. Such a decision must be viewed as a rationale decision by airline’s boards of directors.(The decision to enter bankruptcy is a decision for the board, not management.)
An immediate filing for bankruptcy protection also sends a strong signal to government about theneed to compensate the airlines for the commercial impacts of decisions involving armed conflictand terrorism. With current financial conditions of the industry, the alternative may be substantialdisruption of airline services, and major impacts on the general economy.
One might speculate that a drop in traffic the second time around may be less than after 911.Those travellers who are the most skittish left the market 17 months ago. The remaining travellersare either those who are a bit more inured or who understand the essential high safety nature of airtransport relative to the alternatives. On the other hand, while a single major event, such as 911,might be dismissed as an anomaly, a second within two years allows a straight line trend to bedrawn.
Airport implications. Airports should take seriously the possibility that most, if not all, of the majornetwork airlines will seek bankruptcy protection. Unpaid airport fees will either be lost or be tied upfor a considerable period. You will have to be ready to promptly file claims with a number ofbankruptcy courts. As well, you will want to be ready to work out pay-as-you-go or otherarrangements for ongoing operations after the bankruptcy filing.
Don’t Kill that Goose That Lays the Golden Egg. When Canada 3000’s board decided to file forbankruptcy protection, it was reported that its original intent was not to liquidate the company, butto continue flying. However, almost immediately after the decision, two airports were reported tohave seized Canada 3000 aircraft. This prompted the board to decide to proceed to liquidation.This likely was not done out of spite for the airport’s powers, but rather because the boardrecognised that without aircraft they could not fly their way through the bankruptcy re-organisation.The challenge is that a policy to keep the carriers flying requires that all airports agree to not seizeaircraft.
Michael TrethewayVice President & Chief Economist

Page 14 February 2003
CARGO CAPERS10 February 2003
Double, double toil and trouble; Fire burn and cauldron bubble. The chant of the threewitches from Act IV of MacBeth seems eerily prophetic as the U.S. and its allies gear up for thesecond act in the effort to eliminate terrorism’s access to suspected nuclear, chemical and otherweapons of mass destruction in the Middle East. But will this in fact turn out to be a tragedy for theair cargo industry, or might there be a silver lining in the threatening storm clouds?
Certainly many of the passenger carriers (i.e., the full-cost full-service carriers such as United andAmerican) are struggling to reposition themselves and another war will likely push many over theedge. But their problems go well beyond the war or 9/11. While these events certainly harmedthem, they really exacerbated the fact that the carriers missed the boat on what consumers werelooking for – low fares and reliable service. The carriers that provide such a service (Southwest inthe U.S., WestJet in Canada, Ryanair in Europe) are doing quite well, thank you very much.
Prognosis. So what is the prognosis for air cargo in this time of high fuel prices, increased securitycosts, and imminent war? Frankly, who can say with any certainty! But a few thoughts forconsideration:
• most freight operators long ago recognized the changing dynamics of the global supply chainand have already re-invented themselves (e.g., FedEx long ago built up its surface network,UPS entered marine transport, Emery ditched its air fleet and contracted out lift to others;Airborne built up a large ground network to supplement its air operations);
• many international freight operators are far smaller than their behemoth passengercounterparts, and are able to quickly respond to changes, both good and bad;
• air cargo is less intimidated bythreats than passengers: whilepassenger enplanements in theU.S. have yet to approach 2000levels, freight and expressexceeded 2000 levels in three of thelast six months of last yearaccording to ATA statistics;
• air cargo in the Pacific Rim beganits recovery soon after 9/11, withcargo up 10% in the first six monthsof 2002, and even the morevulnerable North Atlantic corridorhas shown some positive signs of late (e.g., KLM reported 6% growth in January 2003);
• air cargo is driven by economic growth and world trade, and despite the threat of war, mostrecent forecasts show continued growth (e.g., South Korea is expecting 7.5% growth this year;China 7.5-7.8%, Taiwan 3.6%, Canada 3-3.8%);
• the imminent retirement of key older freighter types, such as the 747-200 and DC-10, as wellas restrictions on non-Stage 3 compliant Russian freighters, will mitigate concerns about an“oversupply” of cargo lift.
US Domestic Air Cargo Traffic
-30
-20
-10
0
10
20
30
Jan-
01 Mar
May Ju
l
Sep Nov
Jan-
02 Mar
May Ju
l
Sep Nov
Total cargoExcludes Mail
Robert Andriulaitis
Director,Cargo and Logistics Studies
Page 15 February 2003
CARGO CAPERS - CONTINUEDThis suggests that a relatively healthy air cargo industry should be a target for Canadian airports inthe uncertain year to come.
Also, although Canada and Europe are certainly not immune from backlash coming from theconflict, it can be expected that the U.S. would bear the brunt of any actions. This suggests thatCanadian airports have an opportunity to capitalize on security concerns and act as relativelysecure cargo gateways from Asia and Europe to the U.S., both for air service and/or surfacetransport from Canadian airports to U.S. destinations. Obtaining fifth freedom rights for cargowould enhance the attractiveness of service via Canadian points. Canadian airports have inherentadvantages as effective gateways to NAFTA, and while it may be distasteful to some, the pendingconflict might be the event that allows them to turn that theoretical advantage into reality.
This is a collection of information gathered from public sources, such as press releases, mediaarticles, etc., information from Confidential sources, and items heard on the street. Thus some of theinformation is speculative and may not materialize. Information contained herein is provided for theuse of TradePort International Corporation only, and may not be distributed beyond the Corporation.
Prepared by InterVISTAS Consulting Inc.