Embed Size (px)
Citation preview

Ivan PerkovicHead of Economic Research
Economy Update
Economic Analysis, Market Intelligence & Evaluation – where it is all going?
June 2011
Business Support Briefing Session
Overview
1. Economy Update– Output– Prices and inflation– Labour market – Confidence– Outlook– Key challenges ahead
2. SEEDA Economic Analysis, Market Intelligence and Evaluation– What we did and – Where it is all going
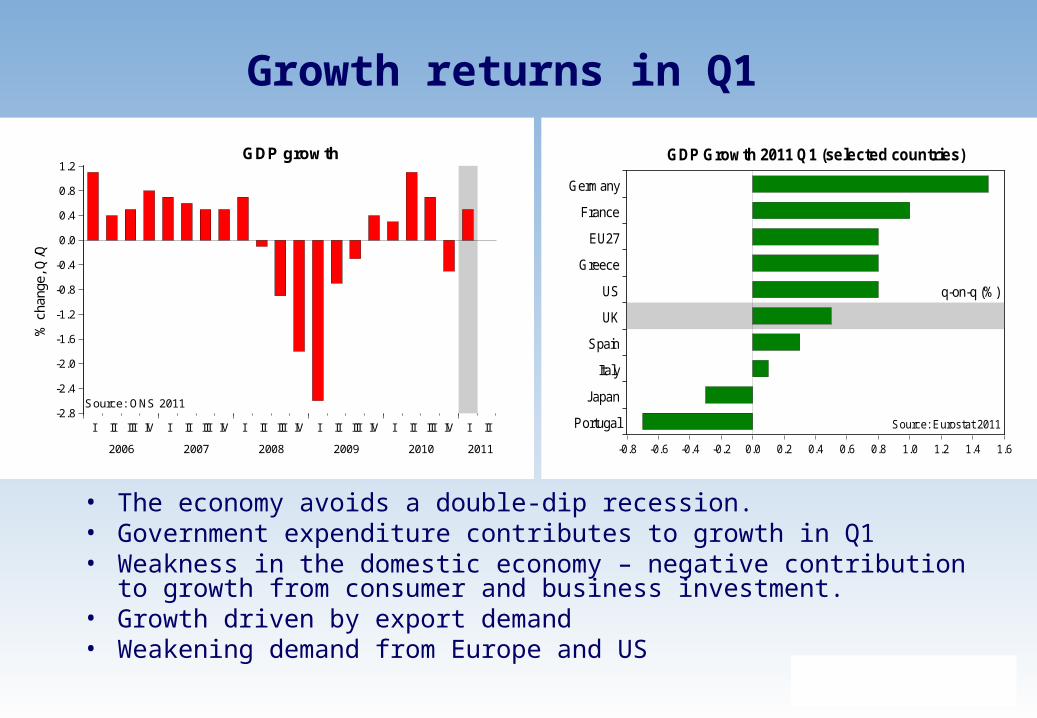
• The economy avoids a double-dip recession. • Government expenditure contributes to growth in Q1• Weakness in the domestic economy – negative contribution to growth
from consumer and business investment.• Growth driven by export demand• Weakening demand from Europe and US
Growth returns in Q1
-2.8
-2.4
-2.0
-1.6
-1.2
-0.8
-0.4
0.0
0.4
0.8
1.2
I II III IV I II III IV I II III IV I II III IV I II III IV I II
2006 2007 2008 2009 2010 2011
GDP growth
% c
hang
e, Q
/Q
Source: ONS 2011
-0.8 -0.6 -0.4 -0.2 0.0 0.2 0.4 0.6 0.8 1.0 1.2 1.4 1.6
Germany
France
EU27
Greece
US
UK
Spain
Italy
Japan
Portugal
GDP Growth 2011 Q1 (selected countries)
Source: Eurostat 2011
q-on-q (%)
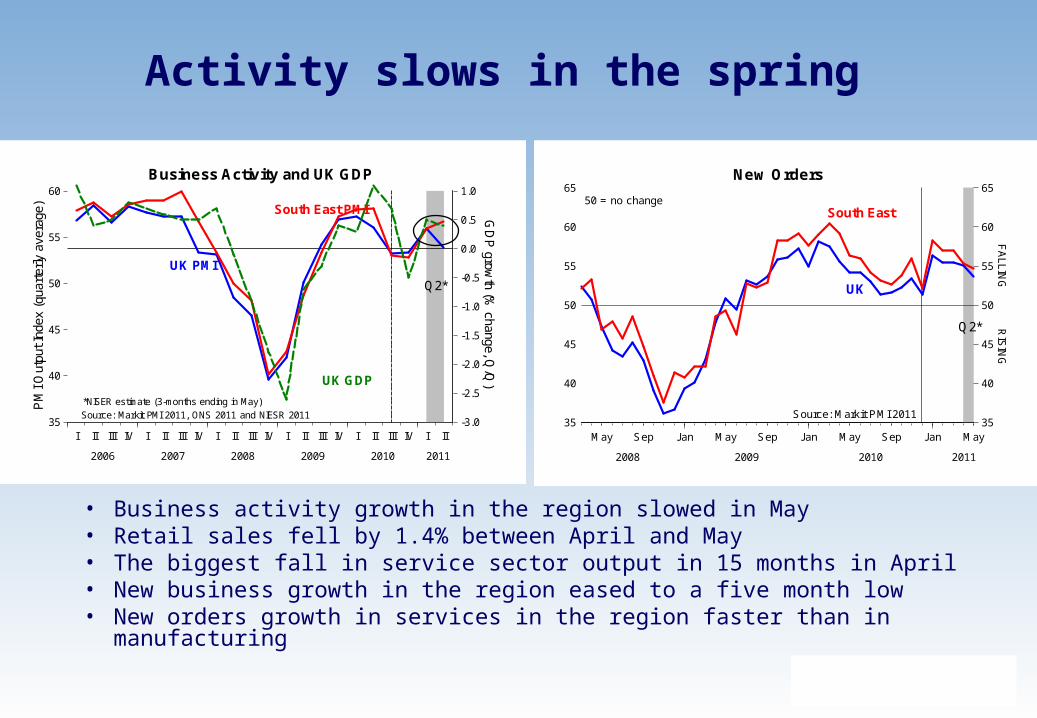
• Business activity growth in the region slowed in May• Retail sales fell by 1.4% between April and May• The biggest fall in service sector output in 15 months in April• New business growth in the region eased to a five month low• New orders growth in services in the region faster than in manufacturing
Activity slows in the spring
35
40
45
50
55
60
-3.0
-2.5
-2.0
-1.5
-1.0
-0.5
0.0
0.5
1.0
I II III IV I II III IV I II III IV I II III IV I II III IV I II
2006 2007 2008 2009 2010 2011
UK GDP
South East PMI
UK PMI
PM
I Out
put I
ndex
(qu
arte
rly a
vera
ge)
GD
P grow
th (% change, Q
/Q)
Business Activity and UK GDP
Source: Markit PMI 2011, ONS 2011 and NIESR 2011
Q2*
*NISER estimate (3-months ending in May)
35
40
45
50
55
60
65
35
40
45
50
55
60
65
May Sep Jan May Sep Jan May Sep Jan May
2008 2009 2010 2011
FA
LLING
RIS
ING
50 = no change
New Orders
South East
UK
Source: Markit PMI 2011
Q2*
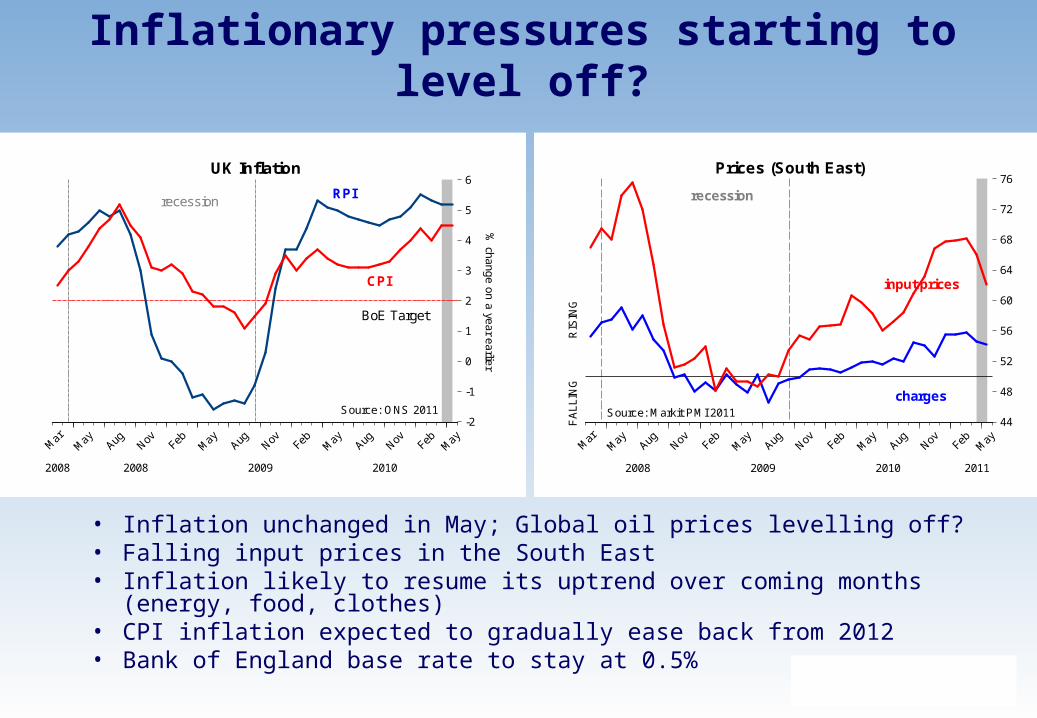
• Inflation unchanged in May; Global oil prices levelling off?• Falling input prices in the South East • Inflation likely to resume its uptrend over coming months (energy, food,
clothes)• CPI inflation expected to gradually ease back from 2012• Bank of England base rate to stay at 0.5%
Inflationary pressures starting to level off?
-2
-1
0
1
2
3
4
5
6
-2
-1
0
1
2
3
4
5
6
Mar
May Aug Nov Feb M
ay Aug Nov Feb May Aug Nov Feb M
ay
2008 2008 2009 2010
% ch
an
ge
on
a ye
ar e
arlie
r
Source: ONS 2011
RPI
CPI
UK Inflation
BoE Target
recession
44
48
52
56
60
64
68
72
76
44
48
52
56
60
64
68
72
76
Mar
May Aug Nov Feb M
ay Aug Nov Feb May Aug Nov Feb M
ay
2008 2009 2010 2011
Prices (South East)
FA
LL
ING
RIS
ING
input prices
charges
recession
Source: Markit PMI 2011
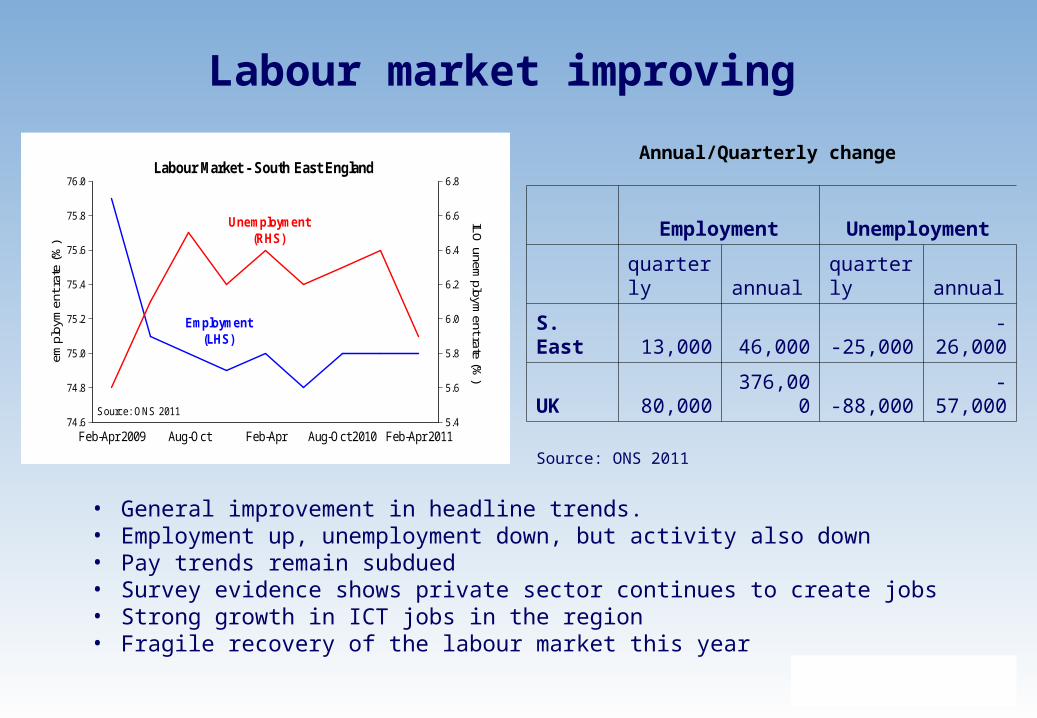
Labour market improving
• General improvement in headline trends.• Employment up, unemployment down, but activity also down • Pay trends remain subdued• Survey evidence shows private sector continues to create jobs• Strong growth in ICT jobs in the region• Fragile recovery of the labour market this year
74.6
74.8
75.0
75.2
75.4
75.6
75.8
76.0
5.4
5.6
5.8
6.0
6.2
6.4
6.6
6.8
Feb-Apr 2009 Aug-Oct Feb-Apr Aug-Oct 2010 Feb-Apr 2011
Employment(LHS)
Unemployment(RHS)
Labour Market - South East England
Source: ONS 2011
empl
oym
ent r
ate
(%)
ILO unem
ployment rate (%
)
Employment Unemployment
quarterly annual quarterly annual
S. East 13,000 46,000 -25,000 -26,000
UK 80,000 376,000 -88,000 -57,000
Source: ONS 2011
Annual/Quarterly change
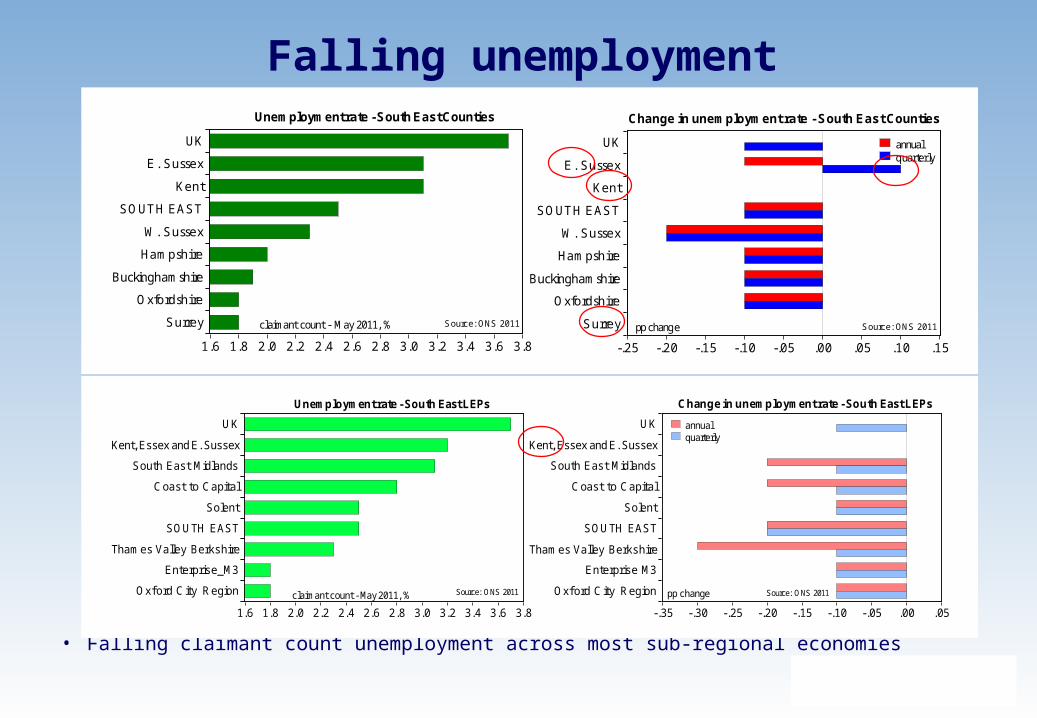
• Falling claimant count unemployment across most sub-regional economies
Falling unemployment
1.6 1.8 2.0 2.2 2.4 2.6 2.8 3.0 3.2 3.4 3.6 3.8
UK
E. Sussex
Kent
SOUTH EAST
W. Sussex
Hampshire
Buckinghamshire
Oxfordshire
Surrey Source: ONS 2011
Unemployment rate - South East Counties
claimant count - May 2011, %
-.25 -.20 -.15 -.10 -.05 .00 .05 .10 .15
UK
E. Sussex
Kent
SOUTH EAST
W. Sussex
Hampshire
Buckinghamshire
Oxfordshire
Surrey
annualquarterly
pp change Source: ONS 2011
Change in unemployment rate - South East Counties
1.6 1.8 2.0 2.2 2.4 2.6 2.8 3.0 3.2 3.4 3.6 3.8
UK
Kent, Essex and E. Sussex
South East Midlands
Coast to Capital
Solent
SOUTH EAST
Thames Valley Berkshire
Enterprise_M3
Oxf ord City Region Source: ONS 2011claimant count - May 2011, %
-.35 -.30 -.25 -.20 -.15 -.10 -.05 .00 .05
UK
Kent, Essex and E. Sussex
South East Midlands
Coast to Capital
Solent
SOUTH EAST
Thames Valley Berkshire
Enterprise M3
Oxf ord City Region
annualquarterly
Change in unemployment rate - South East LEPs
Source: ONS 2011pp change
Unemployment rate - South East LEPs
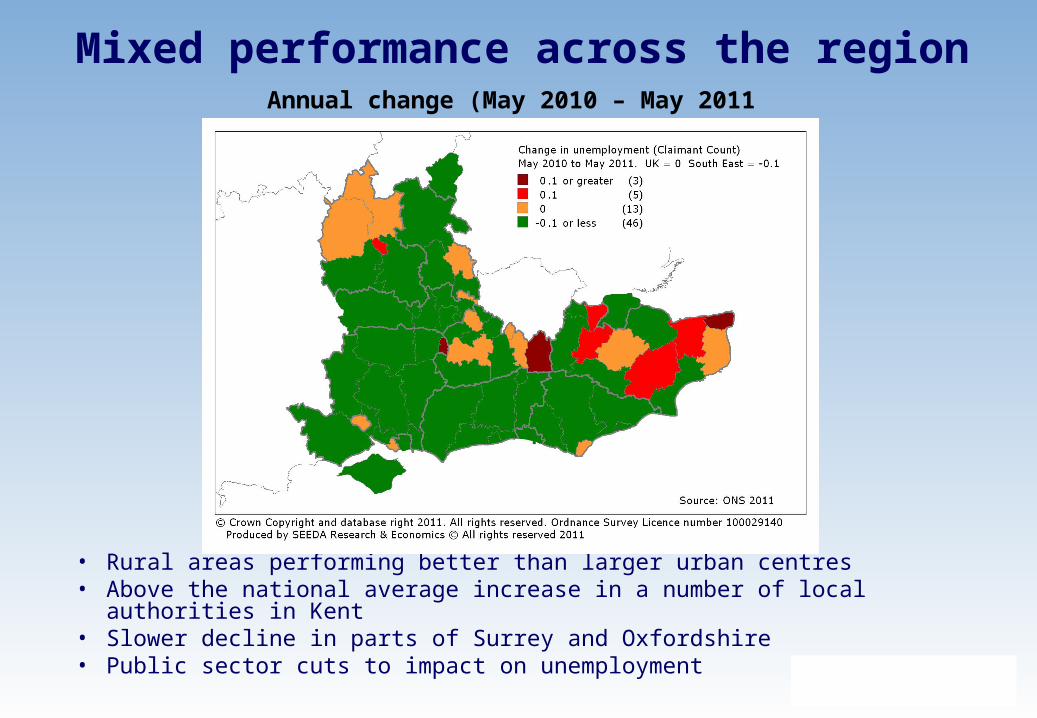
• Rural areas performing better than larger urban centres• Above the national average increase in a number of local authorities in Kent• Slower decline in parts of Surrey and Oxfordshire• Public sector cuts to impact on unemployment
Mixed performance across the regionAnnual change (May 2010 – May 2011
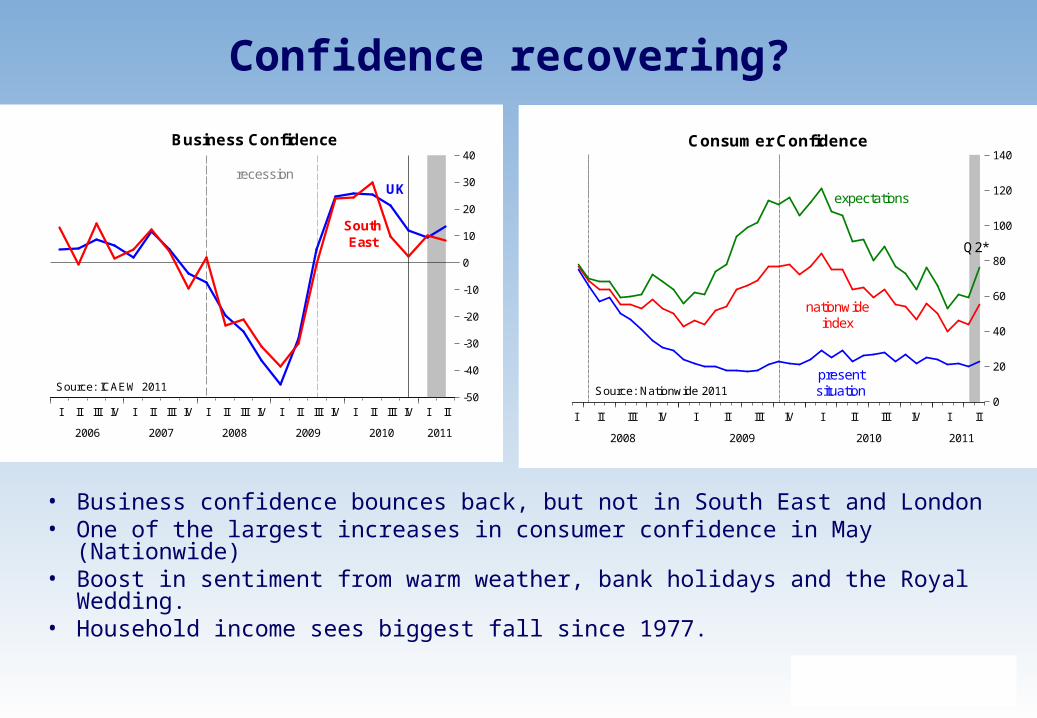
• Business confidence bounces back, but not in South East and London• One of the largest increases in consumer confidence in May (Nationwide)• Boost in sentiment from warm weather, bank holidays and the Royal
Wedding.• Household income sees biggest fall since 1977.
Confidence recovering?
-50
-40
-30
-20
-10
0
10
20
30
40
-50
-40
-30
-20
-10
0
10
20
30
40
I II III IV I II III IV I II III IV I II III IV I II III IV I II
2006 2007 2008 2009 2010 2011
SouthEast
UK
Business Confidence
Source: ICAEW 2011
recession
0
20
40
60
80
100
120
140
0
20
40
60
80
100
120
140
I II III IV I II III IV I II III IV I II
2008 2009 2010 2011
nationwideindex
presentsituation
expectations
Q2*
Consumer Confidence
Source: Nationwide 2011
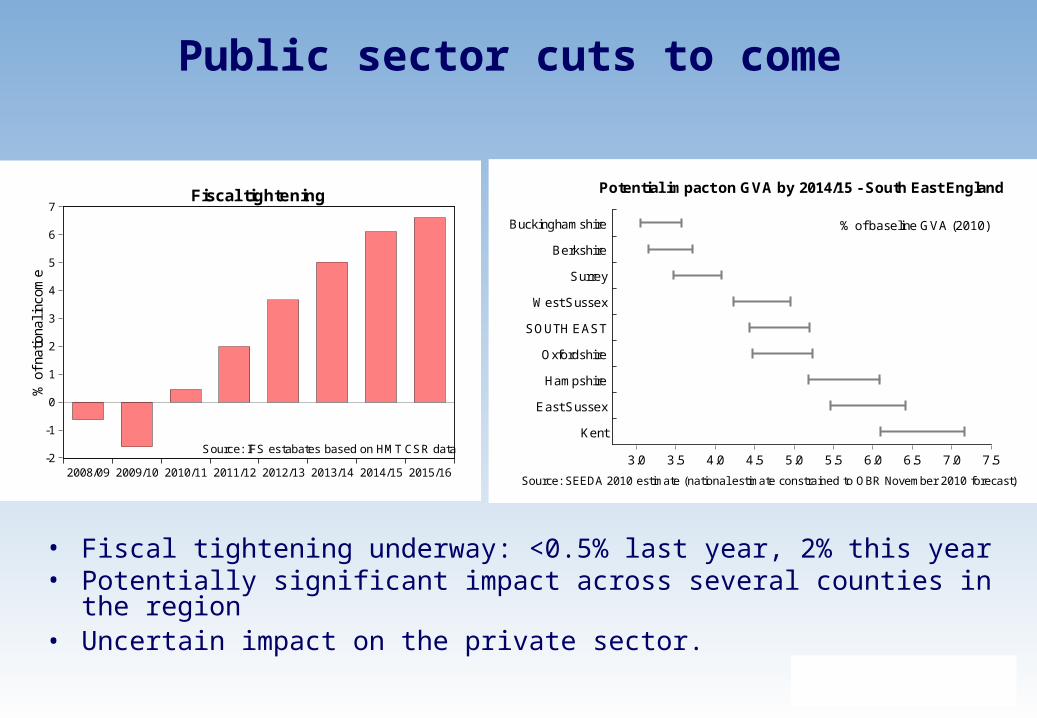
• Fiscal tightening underway: <0.5% last year, 2% this year• Potentially significant impact across several counties in the region • Uncertain impact on the private sector.
Public sector cuts to come
-2
-1
0
1
2
3
4
5
6
7
2008/09 2009/10 2010/11 2011/12 2012/13 2013/14 2014/15 2015/16
% o
f nat
iona
l inc
ome
Fiscal tightening
Source: IFS estabates based on HMT CSR data3.0 3.5 4.0 4.5 5.0 5.5 6.0 6.5 7.0 7.5
Buckinghamshire
Berkshire
Surrey
West Sussex
SOUTH EAST
Oxfordshire
Hampshire
East Sussex
Kent
% of baseline GVA (2010)
Source: SEEDA 2010 estimate (national estimate constrained to OBR November 2010 forecast)
Potential impact on GVA by 2014/15 - South East England
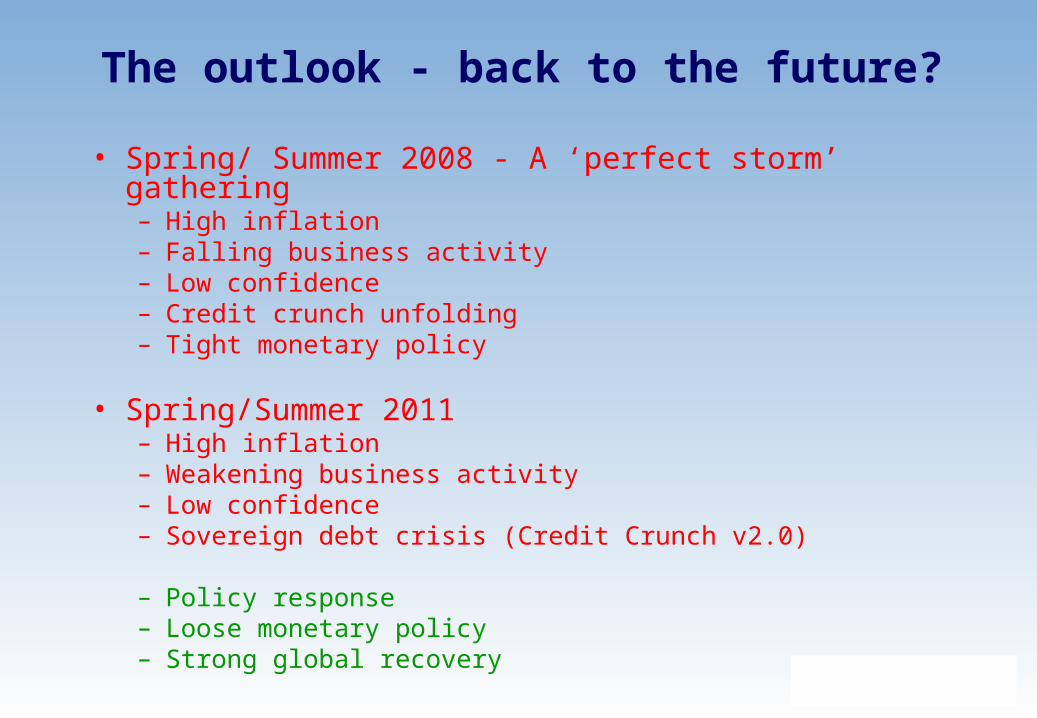
The outlook - back to the future?
• Spring/ Summer 2008 - A ‘perfect storm’ gathering– High inflation– Falling business activity– Low confidence– Credit crunch unfolding– Tight monetary policy
• Spring/Summer 2011– High inflation– Weakening business activity– Low confidence– Sovereign debt crisis (Credit Crunch v2.0)
– Policy response– Loose monetary policy– Strong global recovery
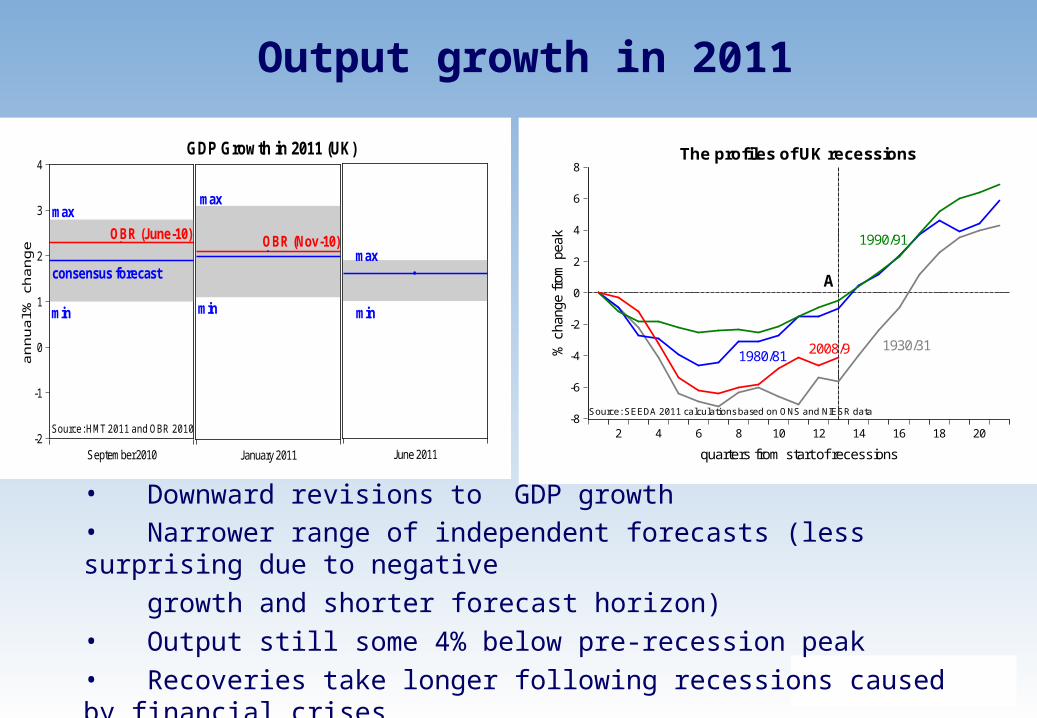
Output growth in 2011
• Downward revisions to GDP growth• Narrower range of independent forecasts (less surprising due to negative
growth and shorter forecast horizon)• Output still some 4% below pre-recession peak• Recoveries take longer following recessions caused by financial crises
-2
-1
0
1
2
3
4
September 2010
max
min
consensus forecast
OBR (June-10)
January 2011
OBR (Nov-10)
max
min
June 2011
max
min
GDP Growth in 2011 (UK)
an
nu
al %
ch
an
ge
Source: HMT 2011 and OBR 2010-8
-6
-4
-2
0
2
4
6
8
2 4 6 8 10 12 14 16 18 20
1930/312008/91980/81
1990/91
The profiles of UK recessions
quarters from start of recessions
Source: SEEDA 2011 calculations based on ONS and NIESR data
% c
hang
e fr
om p
eak
A
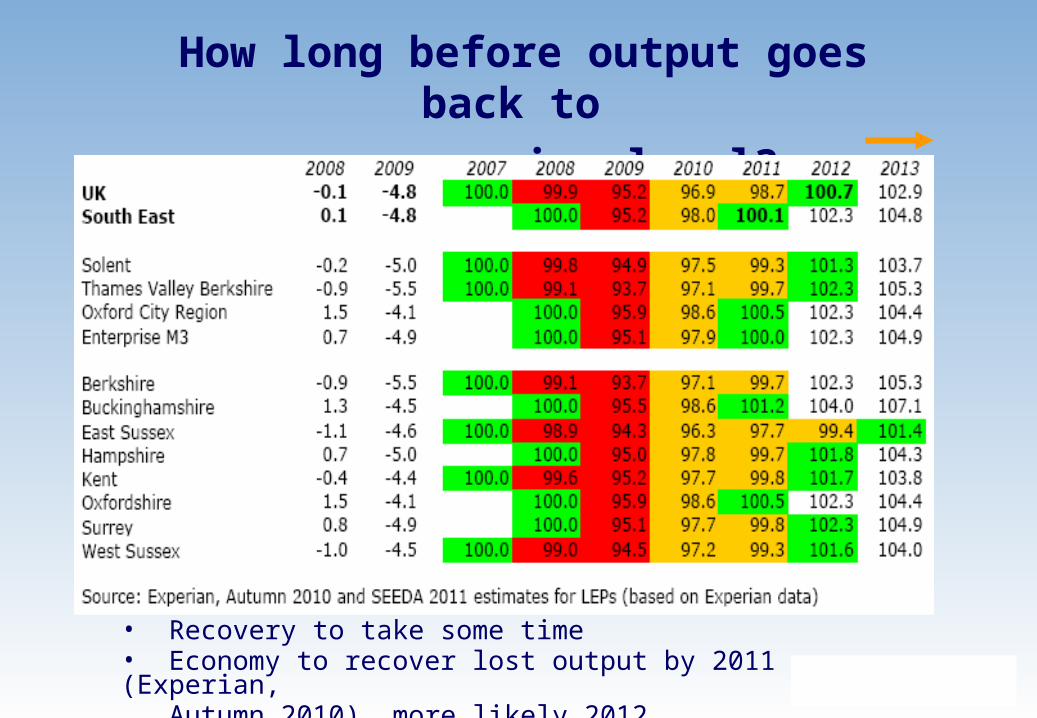
How long before output goes back to
pre-recession level?
• Recovery to take some time• Economy to recover lost output by 2011 (Experian, Autumn 2010), more likely 2012.
Key challenges ahead
• Sovereign debt crisis and possibility of the Credit Crunch v2.0
• Slowdown in demand from US and Eurozone economies
• Business investment fails to materialise
• Tighter monetary policy (when it arrives) and its impact on the housing market
• Consumer spending ~2/3 of demand. How will UK consumer react?

Economic Analysis, Market Intelligence & Evaluation
What we did and where it is all going?
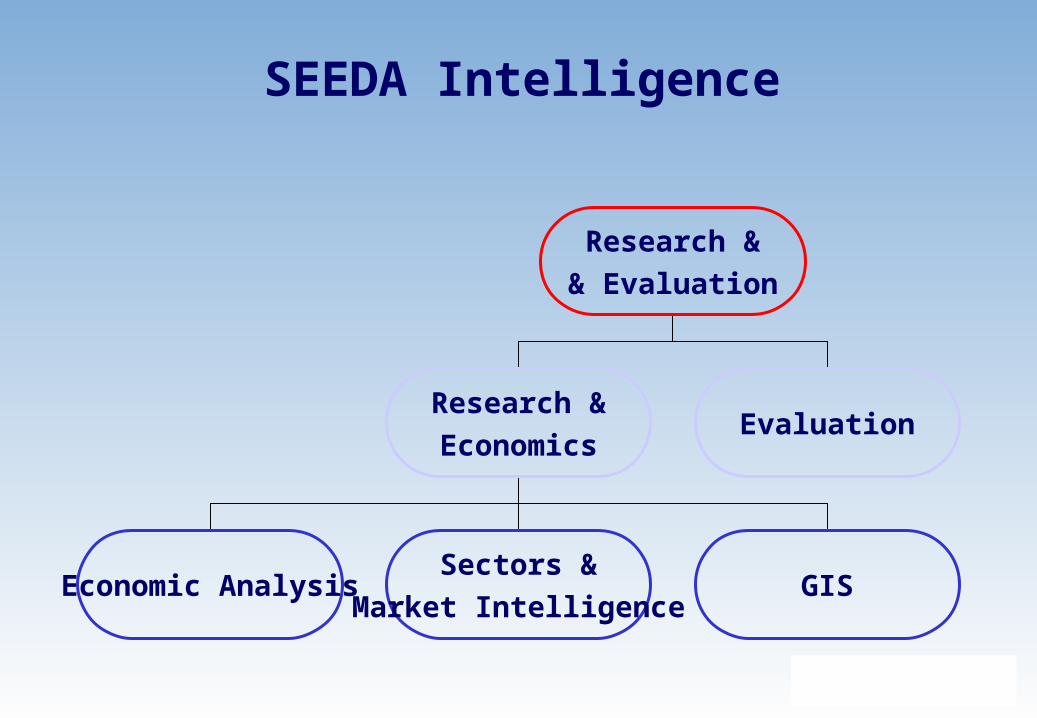
SEEDA Intelligence
Research &
& Evaluation
Research &
EconomicsEvaluation
Economic AnalysisSectors &
Market IntelligenceGIS
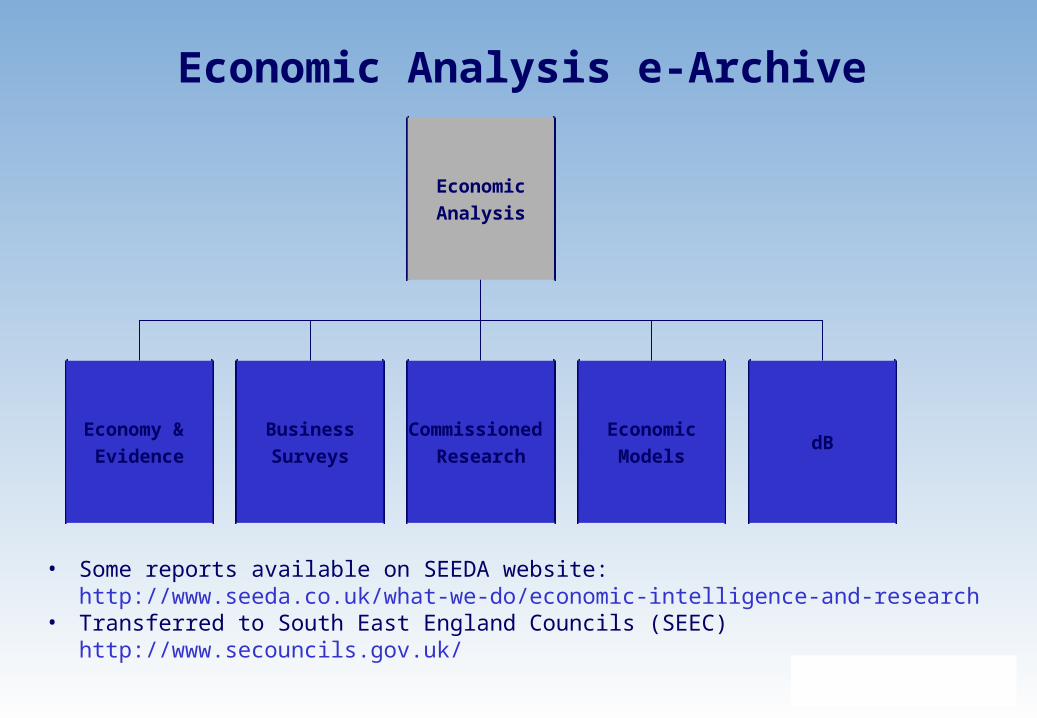
Economic Analysis e-Archive
Economic
Analysis
Economy &
Evidence
Business
Surveys
Commissioned
ResearchdB
Economic
Models
• Some reports available on SEEDA website:http://www.seeda.co.uk/what-we-do/economic-intelligence-and-research
• Transferred to South East England Councils (SEEC)http://www.secouncils.gov.uk/
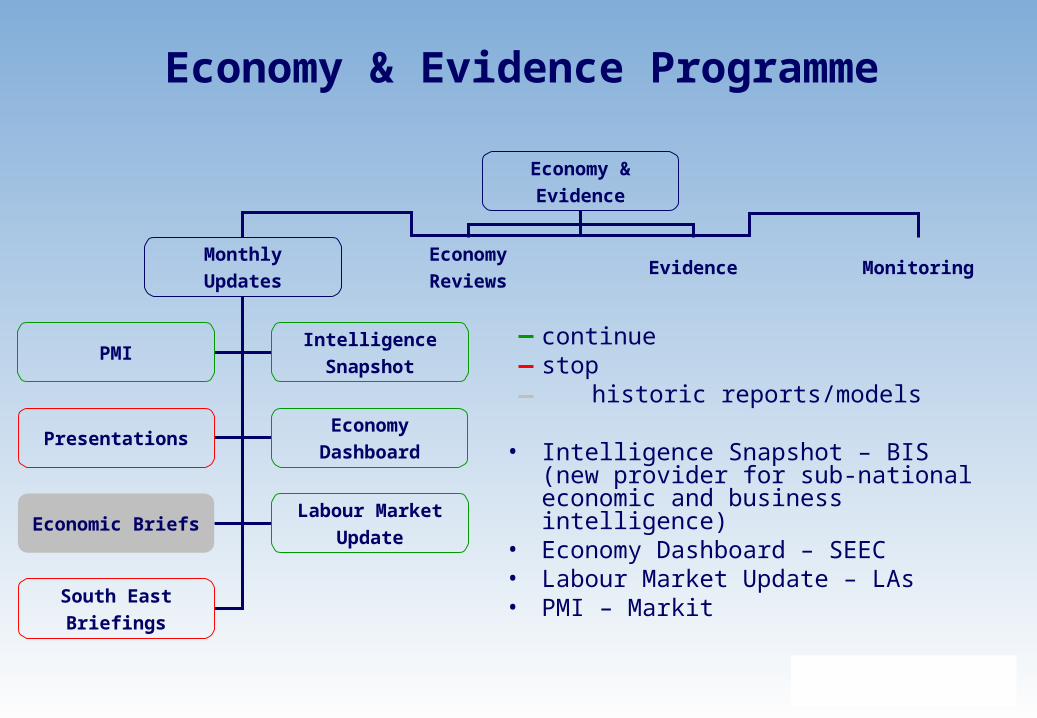
Economy & Evidence Programme
Economy &
Evidence
Monthly
Updates
Economy
ReviewsEvidence Monitoring
PMIIntelligence
Snapshot
PresentationsEconomy
Dashboard
Economic BriefsLabour Market
Update
South East
Briefings
continue stop historic reports/models
• Intelligence Snapshot – BIS (new provider for sub-national economic and business intelligence)
• Economy Dashboard – SEEC• Labour Market Update – LAs• PMI – Markit
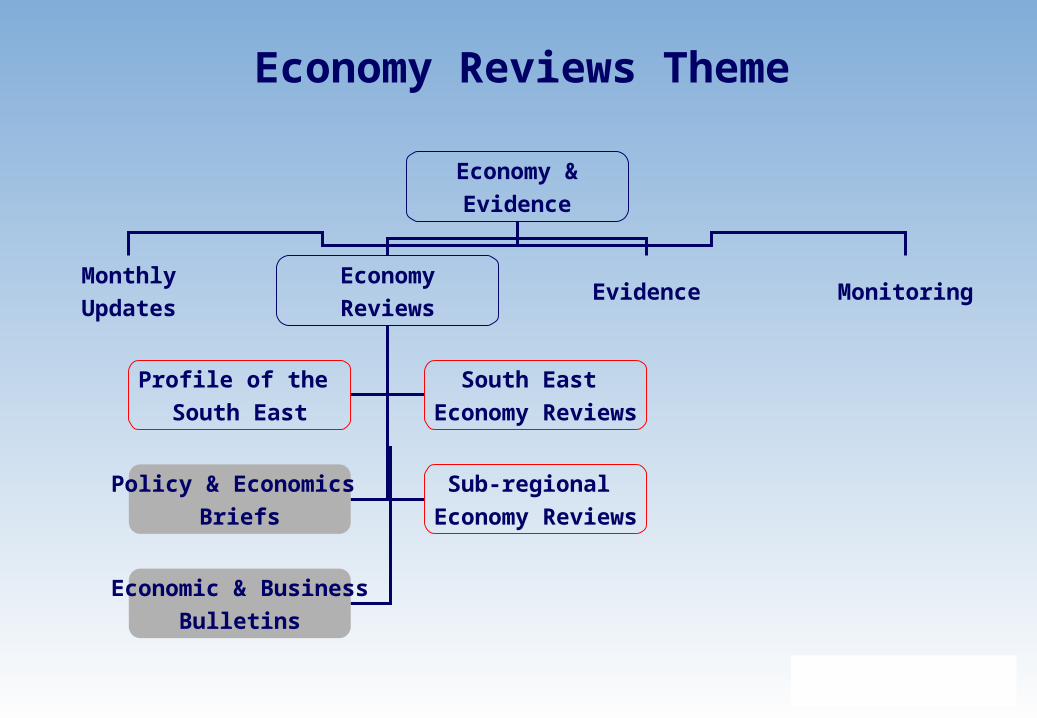
Economy Reviews Theme
Economy &
Evidence
Monthly
Updates
Economy
ReviewsEvidence Monitoring
Profile of the
South East
South East
Economy Reviews
Policy & Economics
Briefs
Sub-regional
Economy Reviews
Economic & Business
Bulletins
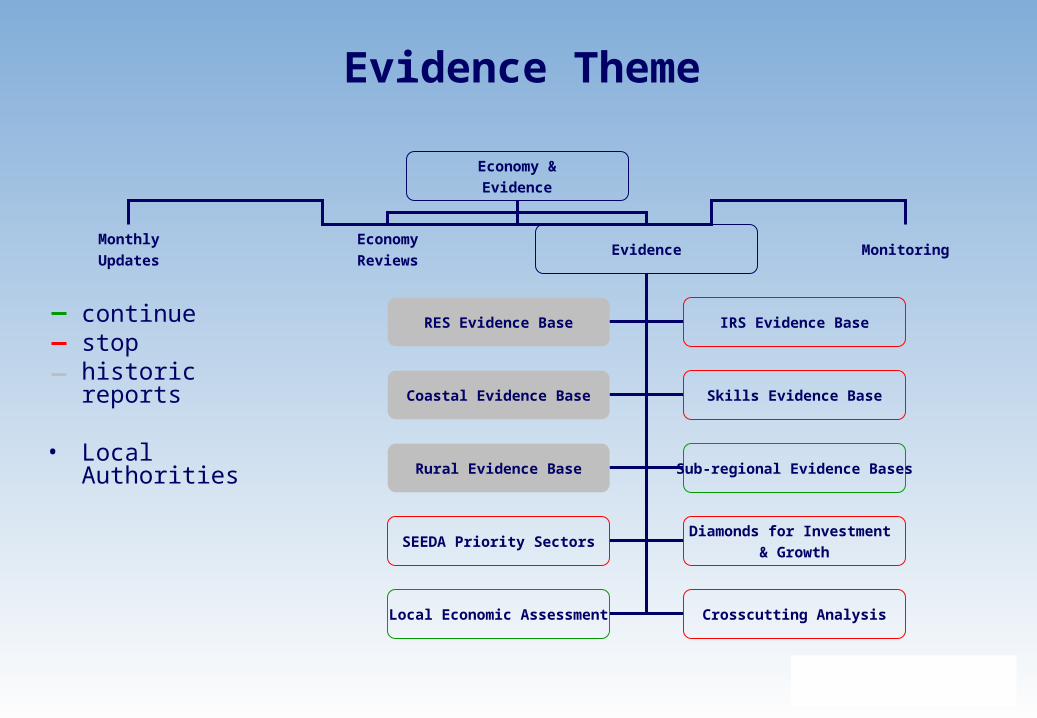
Evidence Theme
Economy &
Evidence
Monthly
Updates
Economy
ReviewsEvidence Monitoring
RES Evidence Base IRS Evidence Base
Coastal Evidence Base Skills Evidence Base
Rural Evidence Base Sub-regional Evidence Bases
SEEDA Priority SectorsDiamonds for Investment
& Growth
Local Economic Assessment Crosscutting Analysis
continue stop
historic reports
• Local Authorities
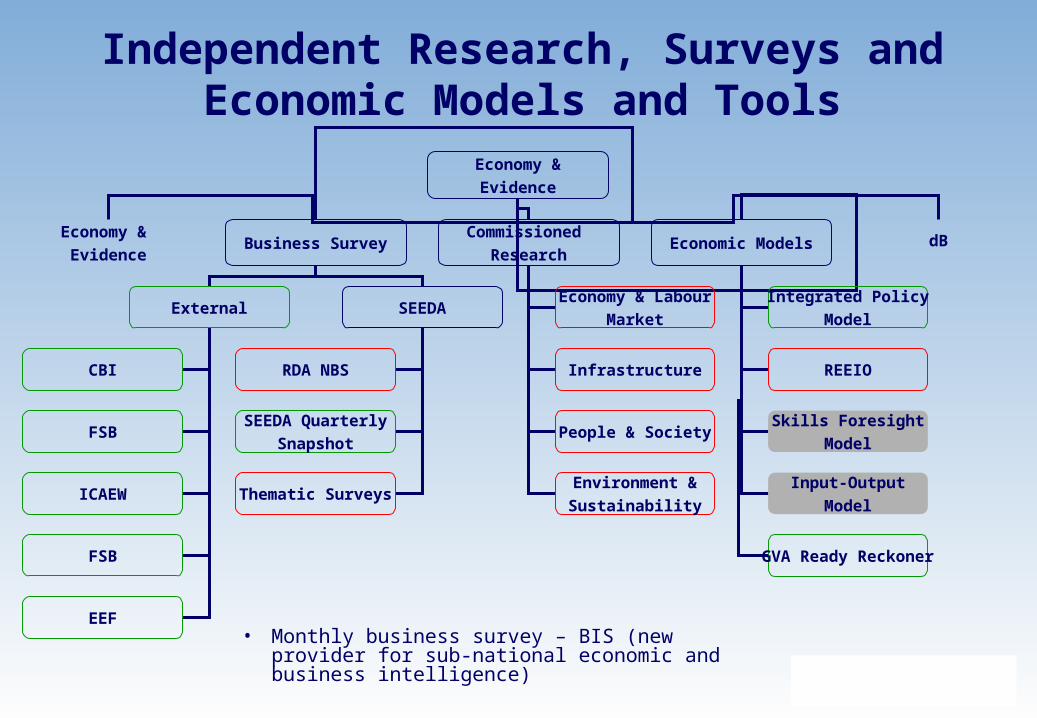
Independent Research, Surveys and Economic Models and Tools
Economy &
Evidence
Economy &
EvidenceBusiness Survey
Commissioned
ResearchEconomic Models dB
External SEEDA
CBI
FSB
ICAEW
FSB
EEF
RDA NBS
SEEDA Quarterly
Snapshot
Economy & Labour
Market
Infrastructure
Thematic Surveys
People & Society
Environment &
Sustainability
Integrated Policy
Model
REEIO
Skills Foresight
Model
Input-Output
Model
GVA Ready Reckoner
• Monthly business survey – BIS (new provider for sub-national economic and business intelligence)

Sectors & Market Intelligence
• Sector-related material• Regional/sub-regional propositions• Business support, access to finance and regional profile
guides• Performance Monitors
• Transferred to the new provider PA Consulting and UKTI:
http://www.ukti.gov.uk
http://www.paconsulting.co.uk/
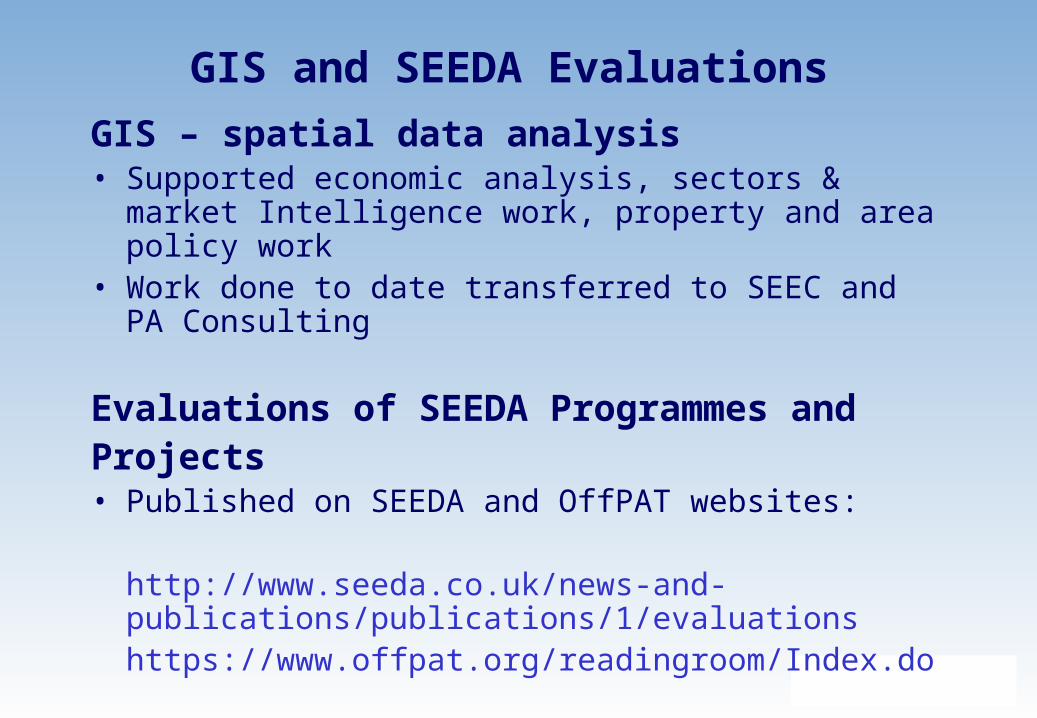
GIS and SEEDA Evaluations
GIS – spatial data analysis• Supported economic analysis, sectors & market
Intelligence work, property and area policy work• Work done to date transferred to SEEC and PA
Consulting
Evaluations of SEEDA Programmes andProjects• Published on SEEDA and OffPAT websites:
http://www.seeda.co.uk/news-and-publications/publications/1/evaluationshttps://www.offpat.org/readingroom/Index.do

Thank you
SEEDA Research & Economics
Email: [email protected]
www: http://www.seeda.co.uk/what-we-do/economic-intelligence-and-research