Embed Size (px)
Citation preview
This paper discusses soil salinity.R.J.Oosterbaan On website www.waterlog.info March 2003
I. Saline soils in briefII. Soil salinity and plant growthIII. Further informationIV. Salt tolerance of crops
I. SALINE SOILS IN BRIEF
Soils can be saline due to geo-historical processes or they can be man-made. The formation is determined by the water and salt balance, just like in oceans and seas where more salt comes in than goes out. Here, the incoming waters from the land bring salts that remain because there is no outlet and the evaporating water does not contain salts so that the salinity increases.
Geo-historically formed saline soils can be found along the seacoast, at lakesides, or in dry lands that were previously under marine or lacustrine conditions.
Man-made saline soils are mostly found in (semi) arid lands as the result of the introduction of irrigation for agriculture. All irrigation water brings salts even when the water is of good quality. For example, fresh irrigation water with an electric conductivity of 0.5 dS/m (corresponding to a salt concentration of 0.3 g/l = 0.3 kg/m3) applied in irrigations of 10000 m3/ha per year bring 3000 kg salt per ha per year, mainly sodium chloride. When the irrigated land is insufficiently drained, the salts accumulate in the root zone.
Saline soils have a very limited agricultural production and often they areabandoned, leaving a bare surface with occasional shrubs. Details on the agricultural production of saline soils are given in chapter 2.
The estimates of the occurrence of saline soils in the world run in the hundreds of millions of hectares (R.Brinkman in Land Reclamation and Water Management, in ILRI (ed.), ILRI publication 27, Wageningen, The Netherlands, *) and many irrigation projects suffer from salinisation in 10to 30% of the land. Further, irrigation of high lands may cause water logging and/or salinisation in adjacent (or even far away) lowlands as the deep percolation losses of the irrigation water, and the salts dissolved herein, can be transported down slope through an underground aquifer.
Prevention and reclamation of soil salinity consists of improving the salt balance and increasing the salt export to where it does no harm, e.g. the sea. To maintain a proper salt balance of the soil one must assure that it is flushed once in a while and that the flushing water is removed. If the natural drainage to the underground is impeded, which is noticeable when the water table after an irrigation is close to the soil surface, it must be supplemented by an artificial drainage system, e.g. ditches, drain pipesor wells (chapter 3). A proper outlet for the drain and well water must be assured and, in the absence of a gravity outlet, the drain water must be lifted.
One can accomplish the flushing by applying additional irrigation water (i.e. additional to the crop consumptive use), if available, or making use of occasional rainfall if occurring in sufficient quantity.
*) http://content.alterra.wur.nl/Internet/webdocs/ilri-publicaties/publicaties/Pub27/pub27-h1.pdf
Technically, with properly designed drainage systems, it is almost alwayspossible to desalinise the land. The socio-economic feasibility and theenvironmental desirability of land drainage for salinity control, however,entirely depend on local conditions and it is difficult to give generalstatements. In many irrigated lands, the available irrigation water isscarce and its distribution irregular, so that for many farmers it isdifficult to establish a proper salinity control regime.
See also R.J. Oosterbaan, 1992. Agricultural land drainage: a widerapplication through caution and restraint. In: Annual Report 1991, p. 9 - 21.ILRI, Wageningen, The Netherlands. This paper can be downloaded fromwww.waterlog.info/annrep.htm In the paper www.waterlog.info/pdf/balances.pdf an explanation is given of how flushing (leaching) and drainage of the soilaccomplishes desalinization.
Sometimes, a distinction is made between saline soils and saline-sodic soils, whereby the latter soils have a higher pH. However, almost all saline soils have a pH < 8.5 which is harmless. As the dominant salt, like in the oceans, invariably is NaCl (sodium chloride), the distinction mentioned is immaterial. (See also www.waterlog.info/pdf/chacupe.pdf showing data of the reclamation of a saline soil with high sodicity resulting in a non-saline non-sodic, non-alkaline soil).
II SOIL SALINITY AND PLANT GROWTH
Soil salinity refers to the presence of high concentrations of soluble salts
in the soil moisture of the root zone. These concentrations of soluble salts,
through their high osmotic pressures, affect plant growth by restricting the
uptake of water by the roots. All plants are subject to this influence, but
sensitivity to high osmotic pressures varies widely among plants species.
Salinity can also affect plant growth because the high concentration of salts
in the soil solution interferes with a balanced absorption of essential
nutritional ions by the plants.
The main effects of salinity on plant growth and crop production are:
- Slow and insufficient germination of seeds, a patchy
stand of the crop;
- Physiologic drought, wilting, and desiccation of
plants;
- Stunted growth, small leaves, short stems and branches;
- Blue-green leaf colour;
- Retarded flowering, fewer flowers, sterility, and
smaller seeds;
- Growth of salt-tolerant or halophilous weed plants;
- As a result of all these unfavourable factors, low
yields of seeds and other plant parts.
Soil salinity can be expressed as the salt concentration of an extract of a
saturated paste of the soil expressed in:
- g salt per 100 g water (%, percent or parts per hundred),
- g salt per l water (i.e. parts per mil or per thousand) or: mg salt per
l water (parts per million, 1 ppm = 0.001 per mil and 1 ppm = 0.0001 %);
- eq. (equivalent, eq.) or milli eq. (meq.) salt per l water;
- electric conductivity (ECe) at 25 degrees C in milli mho/cm (mmho/cm)
or, with the same value, dS/m (deci Siemens per m).
The relation between the above magnitudes is roughly:
- 1 g/l ̃ 1.7 m mho/cm ̃ 17 m eq/l
- 1 m mho/cm ̃ 0.6 g/l ̃ 10 m eq/l
- 1 m eq/l ̃ 0.1 m mho/cm ̃ 0.06 g/l
(nowadays the unit dS/m is often used instead of mmho/cm their numerical
value being the same).
The relation between the salt concentration of the extract of a saturated paste (ECe)
and the salt concentration of the soil moisture at field capacity is about 1:2 (i.e.
the soil moisture content of the paste is about twice the content at field capacity),
whereas the relation of ECe and the salt concentration of the soil moisture at
complete saturation is roughly 1:1.5 as the fully saturated soil contains more water
than at field capacity roughly in the ratio 4:3.
The relation between the ECe and the soil salinity expressed in g salt per 100
g soil is about 20:1.
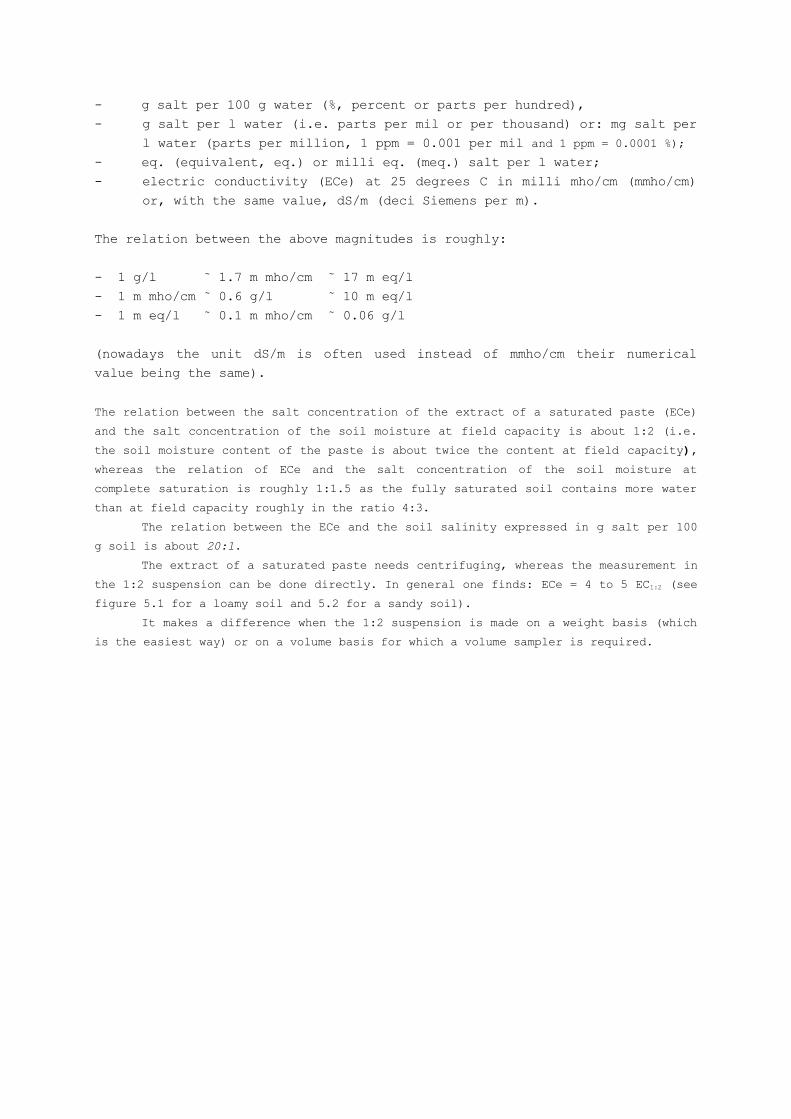
The extract of a saturated paste needs centrifuging, whereas the measurement in
the 1:2 suspension can be done directly. In general one finds: ECe = 4 to 5 EC1:2 (see
figure 5.1 for a loamy soil and 5.2 for a sandy soil).
It makes a difference when the 1:2 suspension is made on a weight basis (which
is the easiest way) or on a volume basis for which a volume sampler is required.
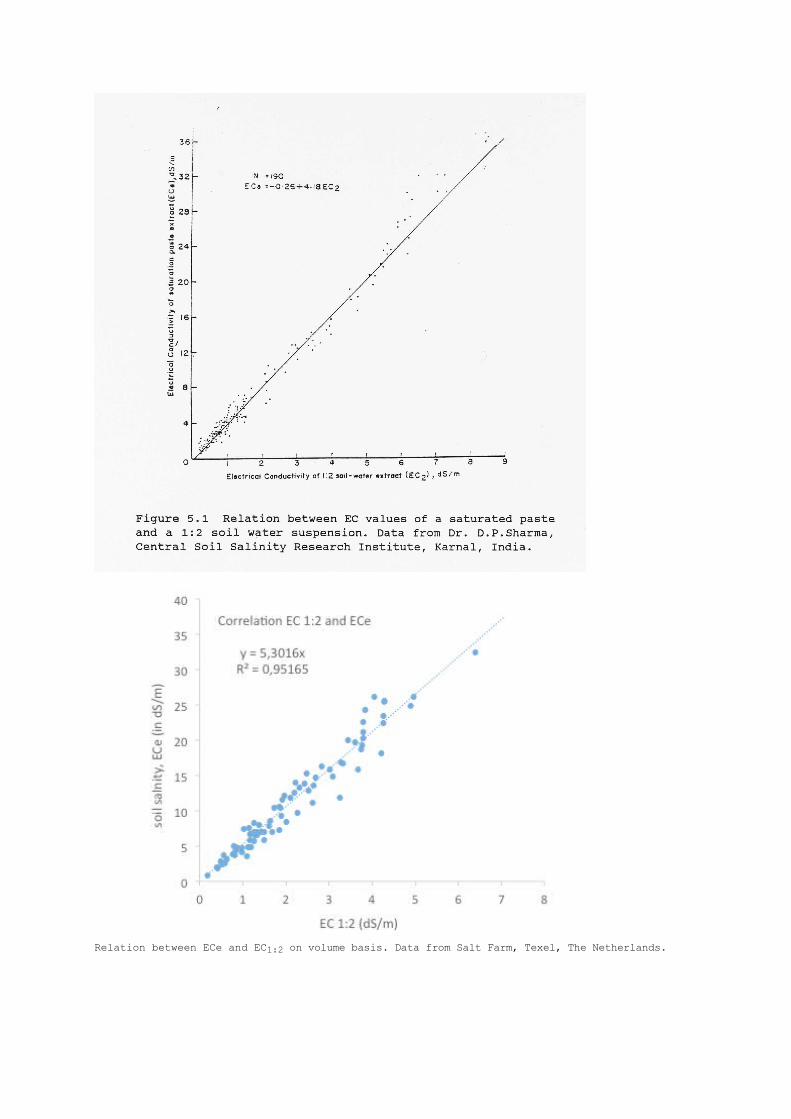
Relation between ECe and EC1:2 on volume basis. Data from Salt Farm, Texel, The Netherlands.
The term 'salt tolerance' indicates the degree of salinity a plant can
withstand without being appreciably affected in its growth or development. In
field experiments with some principal crops Bernstein (Bernstein L. 1974.
Crop growth and salinity. In: Drainage for Agriculture. J. van Schilfgaarde
(ed.). Agronomy 17: 39-54.) determined the salinity levels causing yield
reduction of 10%, 25% and 50%. For comparison, rice showed a reduction in
yield of 10%, 25% and 50% at an ECe of 5, 6 and 8 respectively, whereas the
same yield reductions for barley were found at higher ECe values of 12, 16
and 18 respectively.
Bernstein made the following classification based on ECe in dS/m:
ECe 0-2 non saline
ECe 2-4 slightly saline, yield of sensitive crops reduce
ECe 4-8 moderately saline, yield reduction of many crops
ECe 8-16 saline, normal yield for salt tolerant crops only
ECe > 16, reasonable crop yields only for very tolerant crops
From this, a salt tolerance classification of crops can be derived:
Yield reduction starts at ECe <2: extremely sensitive crops
Yield reduction starts at ECe >2 and <4: sensitive crops
Yield reduction starts at ECe >4 and <6: slightly tolerant crops
Yield reduction starts at ECe >6 and <8: moderately tolerant crops
Yield reduction starts at ECe >8 and <10: tolerant crops
Yield reduction starts at ECe >10 and <12: quite tolerant crops
Yield reduction starts at ECe >12 and <16: very tolerant crops
Yield reduction starts at ECe >16 and <20: extremely tolerant crops
Yield reduction starts at ECe >20: salt loving crops
It appeared that most field crops (e.g. wheat, oats, rice and rye) have a
salt tolerance of ECe of 4 to 8 mmho/cm.
Some field crops (barley, sugar beet, cotton), vegetables (garden
beets, kale, spinach, asparagus), and fruit crops (date palm, mulberry, olive
pomegranate, jujube) have a higher salt tolerance of ECe 8 to 16 mmho/cm.
Some grasses such as Sporobolus, Pucinellia, Cynodon dactylon (Bermuda
grasses), Chloris gayana (Rhodes grass) and Agropyron elongatum (tall
wheatgrass) also have a high salt tolerance (ECe 8 to 16 mmho/cm).
Beans are salt-sensitive, having a salt tolerance of ECe = 2 - 4 dS/m.
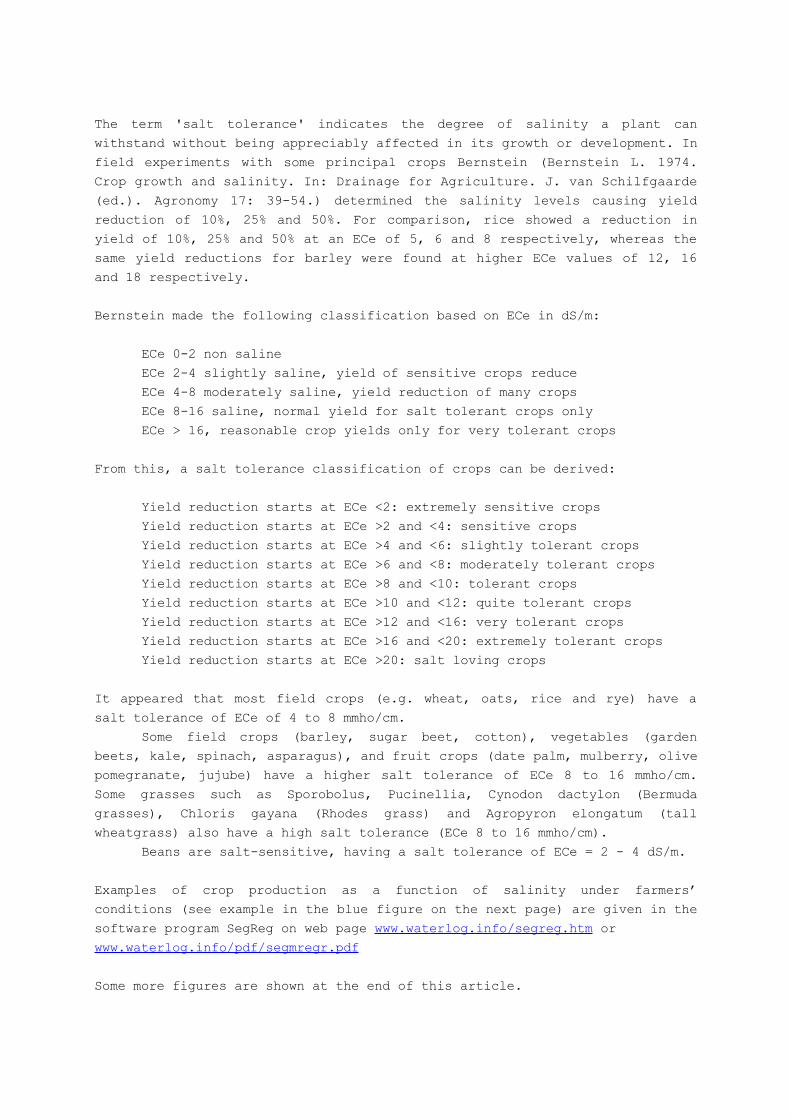
Examples of crop production as a function of salinity under farmers’
conditions (see example in the blue figure on the next page) are given in the
software program SegReg on web page www.waterlog.info/segreg.htm or
www.waterlog.info/pdf/segmregr.pdf
Some more figures are shown at the end of this article.
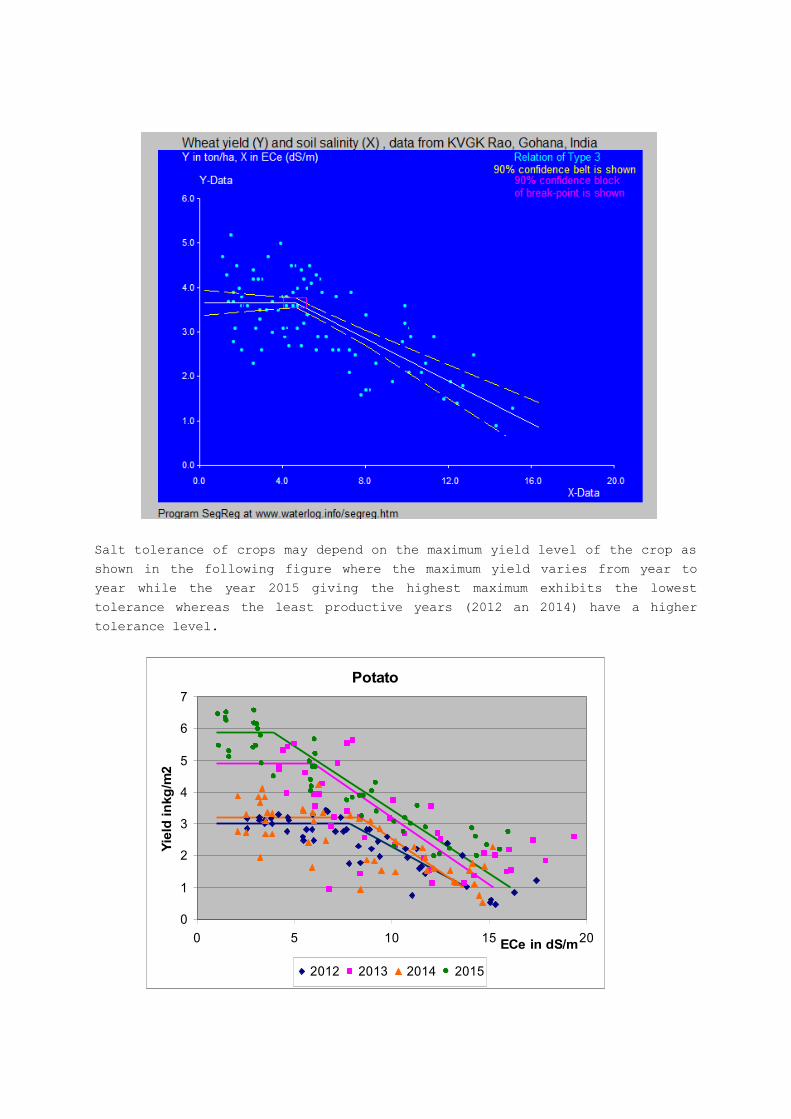
Salt tolerance of crops may depend on the maximum yield level of the crop as
shown in the following figure where the maximum yield varies from year to
year while the year 2015 giving the highest maximum exhibits the lowest
tolerance whereas the least productive years (2012 an 2014) have a higher
tolerance level.
Potato
0
1
2
3
4
5
6
7
0 5 10 15 20ECe in dS/m
Yie
ld in
kg
/m2
2012 2013 2014 2015
Data from Mexico, Carrizo irrigation district, on wheat yield (Y) and soil
salinity (ECe, dS/m) measured at 0-30 cm (EC1) and 30-60 cm (EC2) depth
yielded the following multiple regression equation (data from IMTA,
Cuernavaca, Mexico, (see www.waterlog.info/pdf/mexican.pdf ):
Y = 7.8 - 0.49 x EC1 + 0.02 x EC2.
The standard error of the regression coefficient of EC1 is 0.09, hence it is
highly significant. The regression coefficient of EC2 is relatively small and
insignificant. This means that measurement of EC1 is sufficient to
characterize the soil salinity and that the first soil layer (0-30 cm) exerts
more influence than the second (30-60 cm).
If the land is liable to become saline, adequate irrigation, if
necessary together with drainage (when natural drainage is insufficient),
will remove or reduce these dangers, thus ensuring a better crop production.
If the land is already saline it can be reclaimed with a good
combination of drainage and irrigation. Often the introduction of a
reclamation crop will accelerate the process of reclamation.
For example, lowland rice is often used during reclamation in sub-
tropical and tropical climates. The flooded conditions of the fields promote
a continuous leaching of salt from the soil, and also a dilution of the salt
in the soil water. Moreover the fact that rice seedlings may be grown in
nurseries, under less saline conditions, makes it possible to grow the more
tolerant transplanted rice during the early phase of reclamation.
Grasses (Bermuda grass or tall wheat grass) and barley may be chosen as
reclamation crops in climates less favourable for rice production.
III. FURTHER INFORMATION
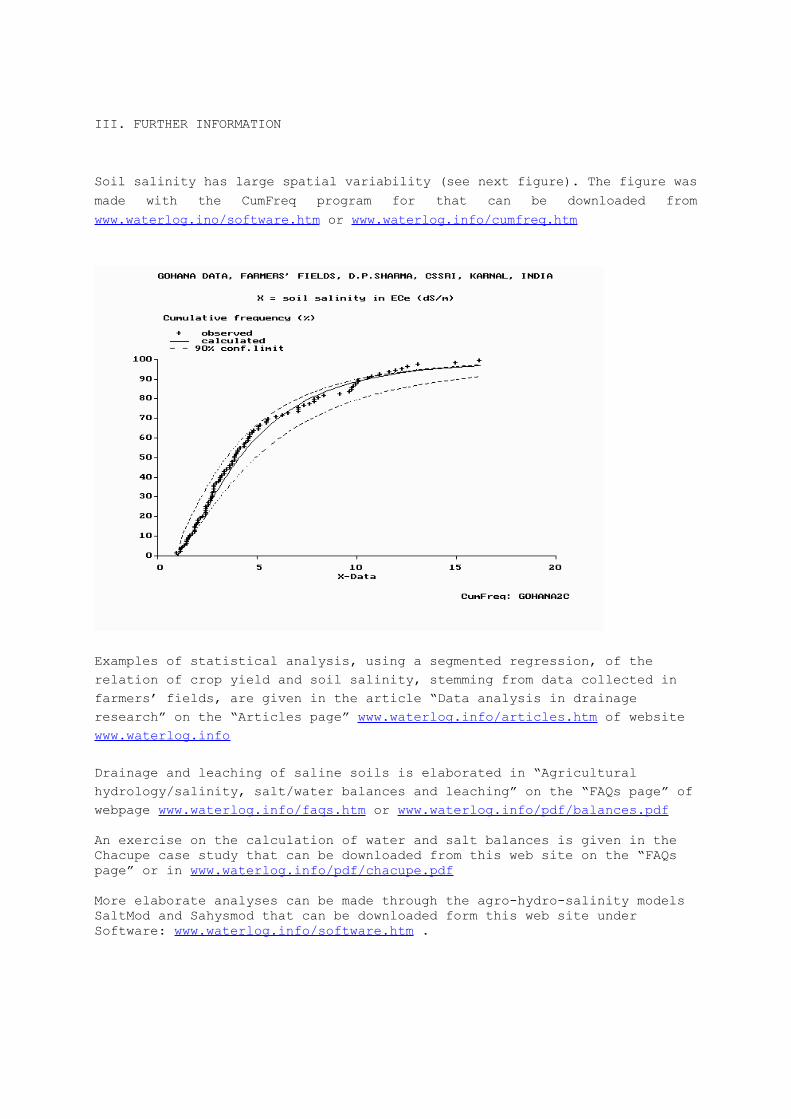
Soil salinity has large spatial variability (see next figure). The figure was
made with the CumFreq program for that can be downloaded from
www.waterlog.ino/software.htm or www.waterlog.info/cumfreq.htm
Examples of statistical analysis, using a segmented regression, of the relation of crop yield and soil salinity, stemming from data collected in farmers’ fields, are given in the article “Data analysis in drainage research” on the “Articles page” www.waterlog.info/articles.htm of website www.waterlog.info
Drainage and leaching of saline soils is elaborated in “Agricultural hydrology/salinity, salt/water balances and leaching” on the “FAQs page” ofwebpage www.waterlog.info/faqs.htm or www.waterlog.info/pdf/balances.pdf
An exercise on the calculation of water and salt balances is given in the Chacupe case study that can be downloaded from this web site on the “FAQs page” or in www.waterlog.info/pdf/chacupe.pdf
More elaborate analyses can be made through the agro-hydro-salinity models SaltMod and Sahysmod that can be downloaded form this web site under Software: www.waterlog.info/software.htm .
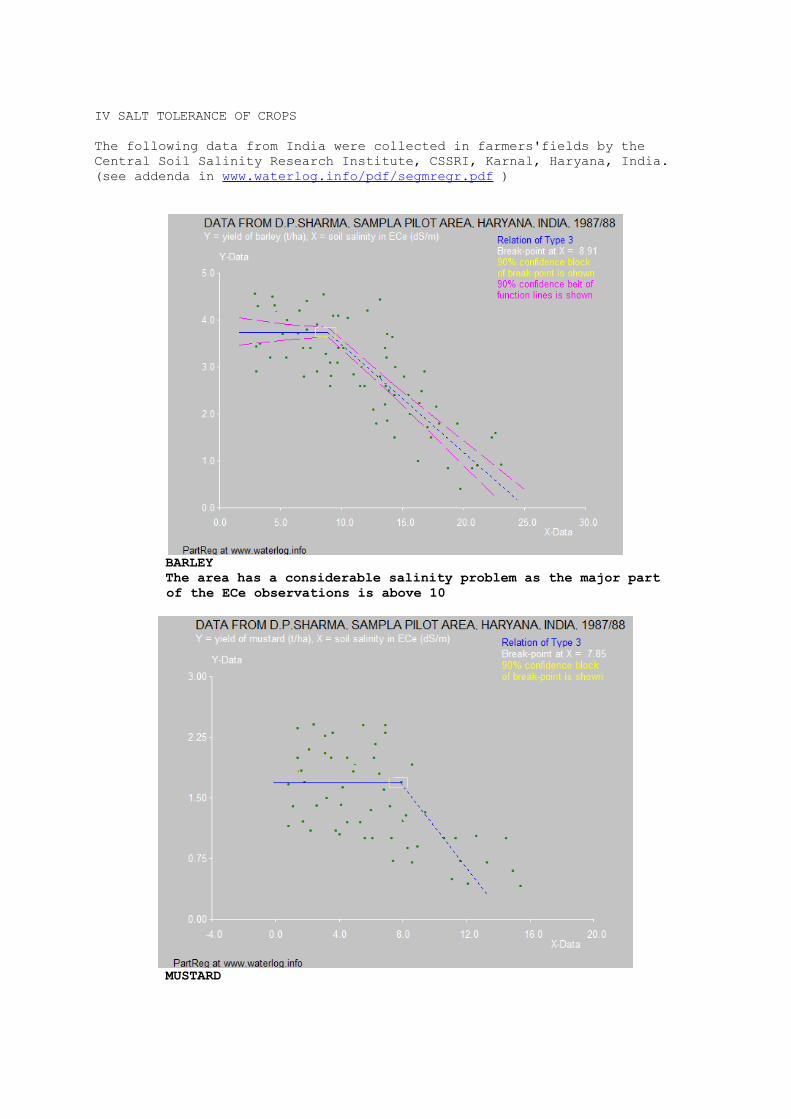
IV SALT TOLERANCE OF CROPS
The following data from India were collected in farmers'fields by the Central Soil Salinity Research Institute, CSSRI, Karnal, Haryana, India.(see addenda in www.waterlog.info/pdf/segmregr.pdf )
BARLEY The area has a considerable salinity problem as the major part
of the ECe observations is above 10
MUSTARD
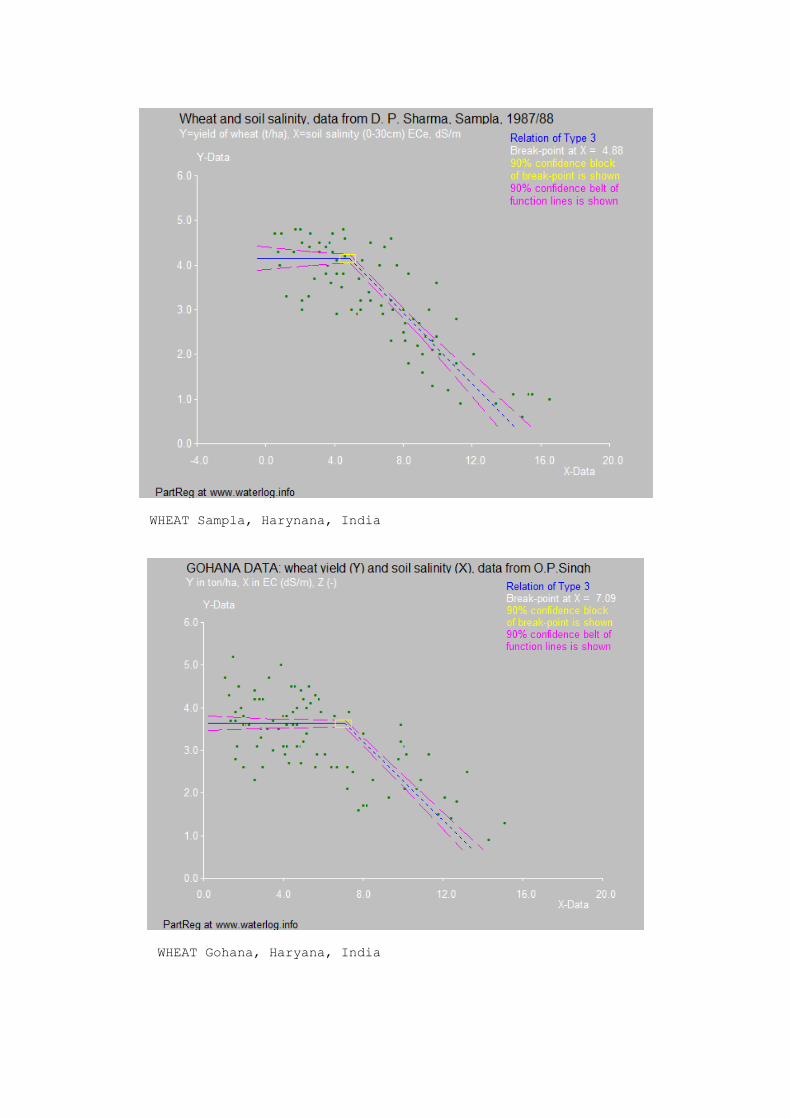
WHEAT Sampla, Harynana, India
WHEAT Gohana, Haryana, India
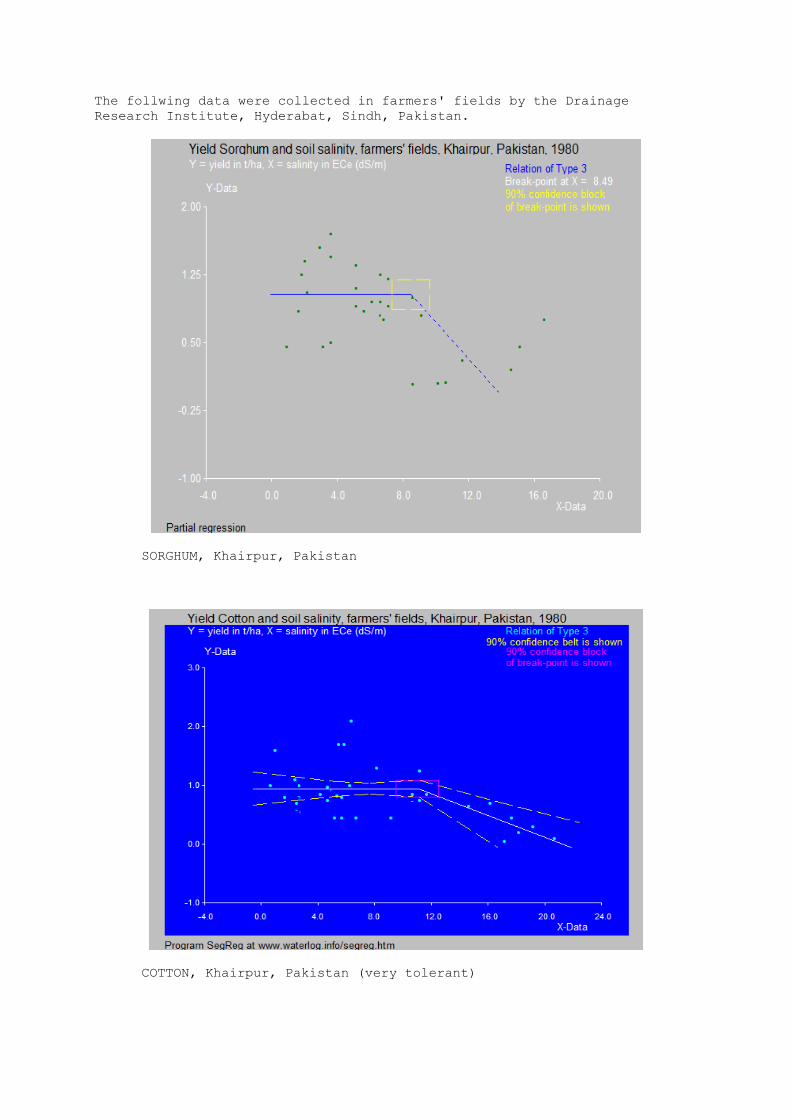
The follwing data were collected in farmers' fields by the Drainage Research Institute, Hyderabat, Sindh, Pakistan.
SORGHUM, Khairpur, Pakistan
COTTON, Khairpur, Pakistan (very tolerant)
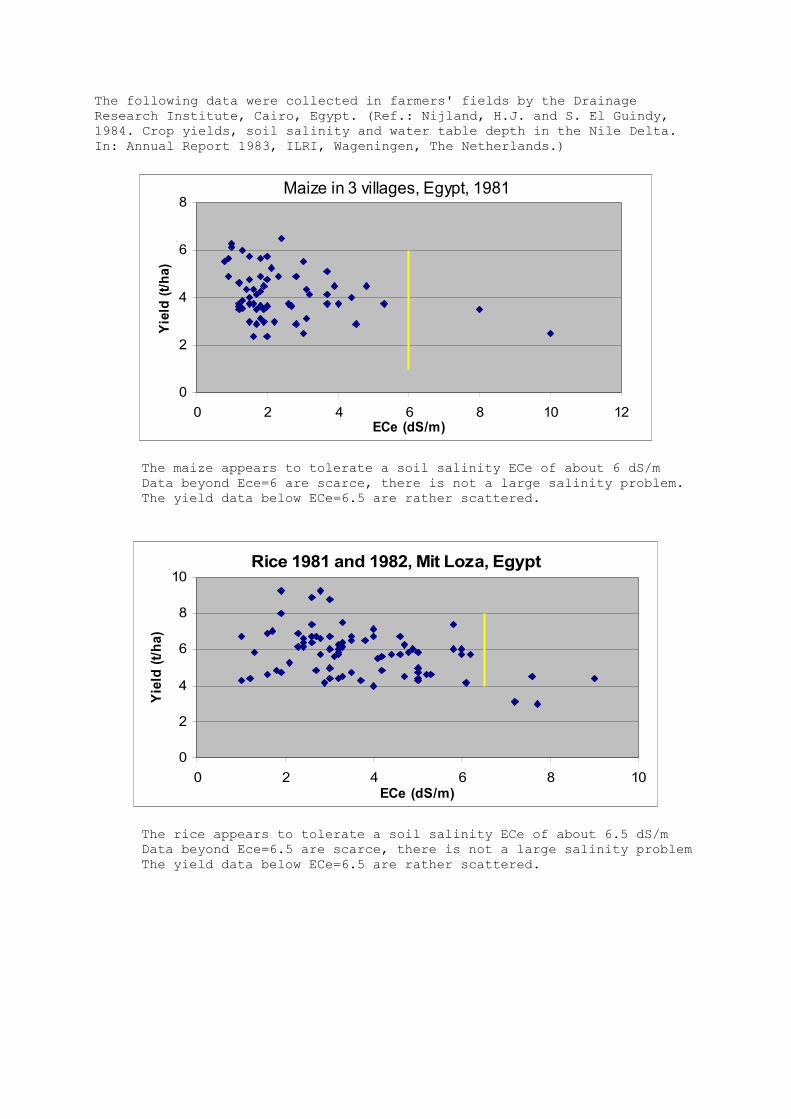
The following data were collected in farmers' fields by the Drainage Research Institute, Cairo, Egypt. (Ref.: Nijland, H.J. and S. El Guindy, 1984. Crop yields, soil salinity and water table depth in the Nile Delta. In: Annual Report 1983, ILRI, Wageningen, The Netherlands.)
The maize appears to tolerate a soil salinity ECe of about 6 dS/mData beyond Ece=6 are scarce, there is not a large salinity problem.The yield data below ECe=6.5 are rather scattered.
The rice appears to tolerate a soil salinity ECe of about 6.5 dS/mData beyond Ece=6.5 are scarce, there is not a large salinity problemThe yield data below ECe=6.5 are rather scattered.
Rice 1981 and 1982, Mit Loza, Egypt
0
2
4
6
8
10
0 2 4 6 8 10ECe (dS/m)
Yie
ld (
t/h
a)
Maize in 3 villages, Egypt, 1981
0
2
4
6
8
0 2 4 6 8 10 12ECe (dS/m)
Yie
ld (
t/h
a)
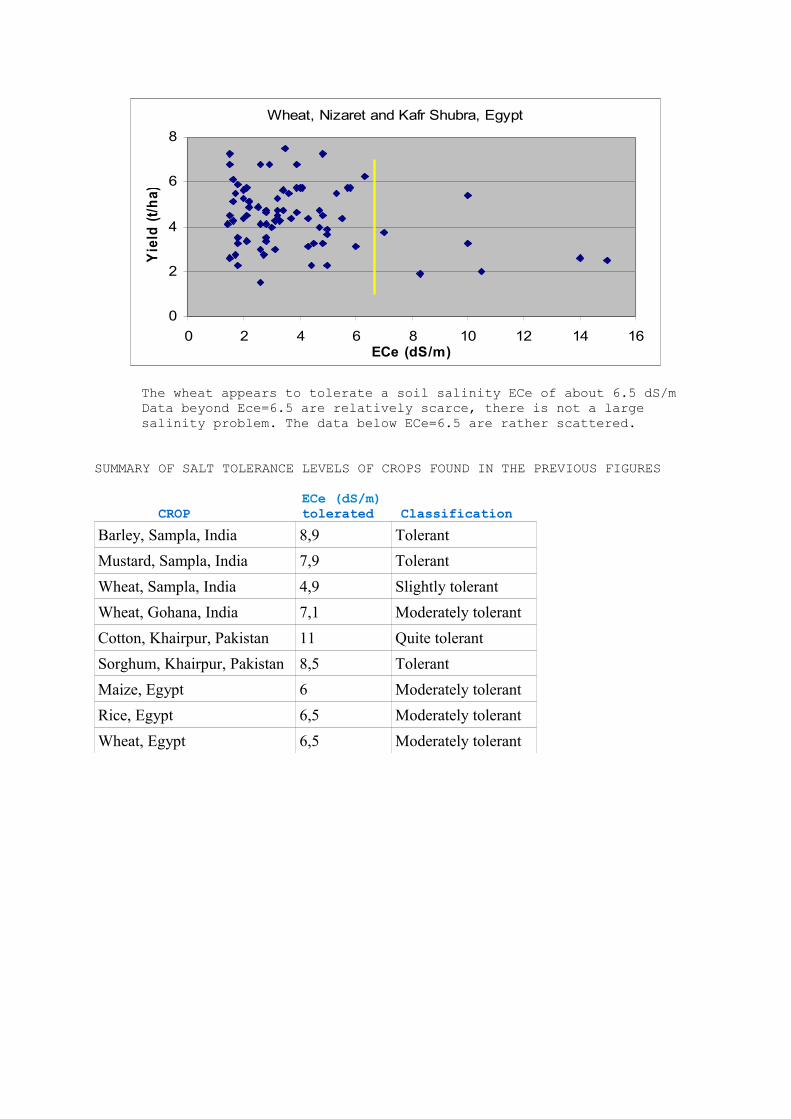
The wheat appears to tolerate a soil salinity ECe of about 6.5 dS/mData beyond Ece=6.5 are relatively scarce, there is not a largesalinity problem. The data below ECe=6.5 are rather scattered.
SUMMARY OF SALT TOLERANCE LEVELS OF CROPS FOUND IN THE PREVIOUS FIGURES
ECe (dS/m) CROP tolerated Classification
Barley, Sampla, India 8,9 Tolerant
Mustard, Sampla, India 7,9 Tolerant
Wheat, Sampla, India 4,9 Slightly tolerant
Wheat, Gohana, India 7,1 Moderately tolerant
Cotton, Khairpur, Pakistan 11 Quite tolerant
Sorghum, Khairpur, Pakistan 8,5 Tolerant
Maize, Egypt 6 Moderately tolerant
Rice, Egypt 6,5 Moderately tolerant
Wheat, Egypt 6,5 Moderately tolerant
Wheat, Nizaret and Kafr Shubra, Egypt
0
2
4
6
8
0 2 4 6 8 10 12 14 16ECe (dS/m)
Yie
ld (
t/h
a)