Embed Size (px)
Citation preview

IuteCredit reports unaudited results for 6M/2021 Returning to real growth
Operational Highlights
• Loan payouts increasing y-o-y with record-high months in May and June with Balance sheet up 6,1% to 123,7 million EUR.
• Number of loans signed up y-o-y 47,9% to 137.367 (6M/2020: 92.880) steadily increasing as of June. • Principal amount of loans issued increased 49,7% to 74.723 million EUR (6M/2020: 49.914 million EUR). • Gross loan portfolio up 8,7% to 103,3 million EUR (31 December 2020: 95,0 million EUR). • Repayment discipline (Customer Performance Index, CPI30) further improving to 86,9%. • Net loan portfolio up 11.3% to 88,1 million EUR (31 December 2020: 79,2 million EUR). • EUR 3.0 million cash inflow from court-appointed liquidator of the business activities in Kosovo.
Strategic Highlights
• Increasing geographical and product diversification. • Next successful steps for an extraordinary customer experience in an IuteCredit ecosystem with additional
services, such as insurance brokerage, certain data certificates, etc. • Strong growth in the digitalization of IuteCredit countries towards a fully digital customer journey and the
imminent breakthrough of online shopping.
Financial Highlights
• Interest and commission fee income up 3,0% to 23,4 million EUR (6M/2020: 22,7 million EUR) affected by steadily increasing payouts compared to the 13,9% increase in the average net loan portfolio.
• Net interest and commission fee income down 1,1% to 17,0 million EUR (6M/2020: 17,1 million EUR) in connection with bond issue related to expected business growth.
• Total income up 1,1% to 29,2 million EUR (6M/2020: 28,9 million EUR). • Cost to income ratio at 36,0% (6M/2020: 27,1%) as result of recovering business activity and the related
normalization of costs. • EBITDA increased by 13,9% to 11,3 million EUR (6M/2020: 9,9 million EUR). • Net profit more than doubled to 3,0 million EUR (6M/2020: 1,3 million EUR). • Strong capitalization and profitability exceeding Eurobond covenants.

IFRS UNAUDITED CONSOLIDATED 6M/2021 REPORT
2
Statement of the Management
Q2/2021 is the first quarter of real growth we have eagerly expected since last autumn. Exceeding 29 mEUR for all financial services of the Group in H1/2021, we even achieved a new record in total revenue. The trend of irreversible and constantly accelerating digitalization is also reflected in the flourishing business of IuteCredit. In the first six months of 2021, we generated more than 6% of total revenue from various services related to payments, cards and cash transactions via IuteCredit’s proprietary ATMs that can be accessed easily and fast with a smartphone. All without the need for a debit or credit card. And even more, over 20% of all customers signings in the Q2/2021 were smartphone-based, using either one-time-passwords or biometrics. And last but not least, MyIute app has already been downloaded by more than 50,000 people, even though it was not launched until Q1/2021. Having said that, our customers continued to take out and repay more loans. The ongoing breakthrough of digitalization is directly reflected in improving IuteCredit’s profitability. As a result, we are able to reduce product pricing and decrease the margins even in the face of competition, while at the same time increasing business volume. We make more money with economies of scale that result in an improved revenue/OPEX ratio. Consolidated assets climbed from 116 million EUR to 123 million EUR as the net loan portfolio grew from 81 million EUR to 88 million EUR. Similar growth applied to the gross loan portfolio. In contrast, liabilities to investors only increased from 94 million EUR to 98 million EUR. In short, IuteCredit makes money with the right mix of product parameters, customer experience, digitalization, risk management and the winning team of 438 people. At the same time, the interest rate structures, and maturities of our products are changing. Currently, newly issued loans’ average APR stands just above 50% while maturity is longer than 20 months. In the same period of the previous year, we were still at about 60% and about 16 months. Loan repayment discipline, measurable as a ratio of actual incoming repayments cashflow versus expected repayments cashflow, with maximum delay tolerance of 30 days, remains close to 90%. We recover more than 40% of defaulted principal within the first 180 days from the date of default. Free cash position at 15 million EUR remains high as we continue to actively seek growth opportunities. Investment priority for IuteCredit is our mission to offer extraordinary experience in the field of personal finance. In other words, people need instant payment solutions and other services, which are not offered by today’s banks. At the same time, our experience from the end of the previous year has shown that investors are also willing to place more capital at work into IuteCredit at short notice if an appropriate opportunity arises. As to seeking growth, we follow potato farming in our approach. We only take action, if we see a realistic way of recovering the invested capital faster than in a lifetime and can reach ambitious gains beyond the capital invested. The markets are returning to cautious optimism, which is visible in loan applications increase. We look impatiently forward to Q3/2021 and expect it to offer new opportunities for the Company and its investors. Given the past performance and prudent future projections, we are even more optimistic that 2021 total revenue will exceed 55 million EUR while the net profit should surpass 6 million EUR. An increase in total assets to 170 million EUR by the end of 2021 also remains a realistic target. Tarmo Sild CEO of IuteCredit Group

IFRS UNAUDITED CONSOLIDATED 6M/2021 REPORT
3
Key consolidated financial figures 30 Jun 2021 31 Dec 2020 ∆ in %
Capitalization
Gross loan portfolio (in thousand EUR) 103.344 95.046 8,7%
Net loan portfolio (in thousand EUR) 88.115 79.186 11,3%
Assets (in thousand EUR) 123.730 116.619 6,1%
Equity (in thousand EUR 22.956 21.488 6,8%
Equity to assets ratio 18,6% 18,4% 0,1%
Capitalization ratio 26,1% 27,1% -1,1%
Interest coverage ratio 2,0 1,9 6,1%
6M/2021 6M/2020 ∆ in %
Profitability
Interest income 23.413 22.720 3,0%
Net interest margin 20,3% 23,5% -3,2%
Cost to income ratio 36,0% 27,1% 8,9%
Post-allowances operating profit margin 14,2% 12,6% 1,7%
EBITDA 11.319 9.940 13,9%
Profit margin before tax 14,2% 12,1% 17,4%
Net profit 3.026 1.305 132,0%
Return on assets 2,5% 1,3% 1,2%
Return on equity 13,6% 7,0% 6,7% 30 Jun 2021 31 Dec 2020 ∆ in %
Asset quality
Cost of risk 17,4% 20,0% -13,0%
Impairment coverage ratio 75,4% 71,1% 4,3%
Gross NPL ratio 19,5% 23,5% -4,0%
Net NPL ratio 11,8% 16,6% -4,8%

IFRS UNAUDITED CONSOLIDATED 6M/2021 REPORT
4
Contact:
IuteCredit Kristel Kurvits, Group Chief Financial Officer (CFO) Email: [email protected] Phone: +372 50 88 77 0 Aalto Capital (Investor Relations) Sven Pauly, Consultant Email: [email protected] Phone: +49 89 898 67 77 0 About IuteCredit:
IuteCredit - established in 2008 - is a leading European personal finance company. The Group is specialized in consumer credits via its 100% subsidiaries using equity and loan capital. IuteCredit serves customers currently in Moldova, Albania, North Macedonia, Bulgaria as well as Bosnia and Herzegovina. IuteCredit's loan products are unsecured consumer loans with maturities between 1 month and 36 months and car-secured loans with maturities up to 60 months. The mission of IuteCredit is to create the extraordinary experience in personal finance by exceeding customers' expectations. www.iutecredit.com

IFRS UNAUDITED CONSOLIDATED 6M/2021 REPORT
5
MANAGEMENT REPORT
Company Overview
AS IuteCredit Europe (ICE) is a holding company that issues consumer credits and offers personal finance services via its 100% owned operating subsidiaries in local markets (Subsidiaries). As of 30 June 2021, ICE had eight operating subsidiaries: ICS OMF IuteCredit SRL (ICM) in Moldova, IuteCredit Albania SHA (ICA), IuteCredit Macedonia DOOEL–Skopje (ICMK) in North Macedonia, IutePay Bulgaria EOOD (IutePay Bulgaria) and IuteCredit Bulgaria EOOD (ICBG), MKD IuteCredit BH d.o.o. Sarajevo (ICBH) in Bosnia and Herzegovina as well as IuteCredit Finance S.a.r.l. (ICF) in Luxembourg and VeloxPay SH.P.K (Velox) in Albania. IutePay Albania SH.P.K. (IutePay Albania), incorporated on 2 July 2018, remained in inactive status until the liquidation date of 15 September 2020. At the beginning of July 2019, ICG acquired IuteCredit Finance S.a.r.l. to act as a financing intermediary for the entire Group. In July 2019, IuteCredit Finance S.a.r.l. (Luxembourg), for the first time, issued 40 million EUR of senior secured bonds (hereafter referred to as Eurobond) listed on the Frankfurt Stock Exchange, followed in November 2020 by a EUR 10 million tap. The Subsidiaries and ICE together form the IuteCredit Group (ICG). ICG consisted of nine companies, regardless that one of them was unconsolidated and reclassified. ICE is responsible for strategic management, including:
• Strategic targeting • Organizational structure and manning of the management teams • Human resource and customer experience framework rules and targeting guidance • Financial management framework rules and targeting guidance • Sales and marketing framework rules and targeting guidance • Service process design and technological development • Risk management, including loan products approval and general compliance framework • Data harvesting • Technology development and outsourcing • The Group's financing and investor relations
Subsidiaries implement the processes designed by ICE and offer customers the services. Furthermore, the individual subsidiaries develop the business in the local competition field according to strategic guidance and targets, financing, and technology provided by ICE. Finally, subsidiaries consist of local teams, local customers, local loan portfolios, and develop local investor relations and relations with regulatory authorities and partners.
IFRS UNAUDITED CONSOLIDATED 6M/2021 REPORT
6
Business Model
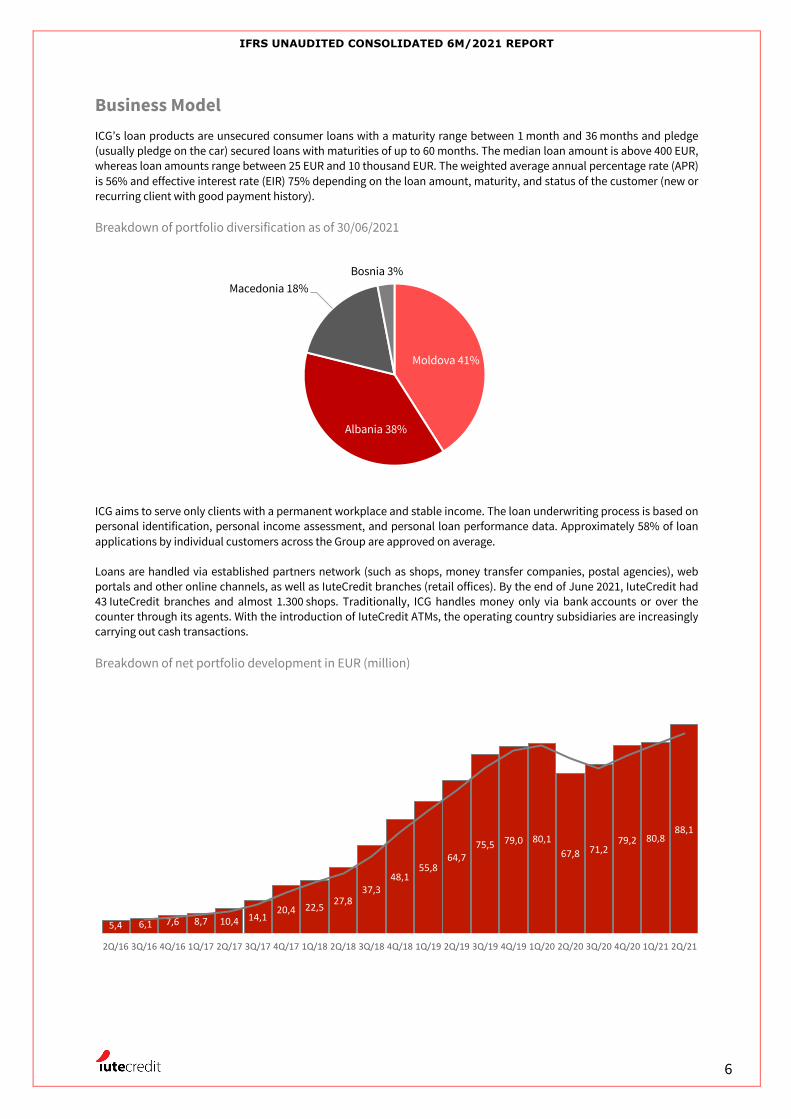
ICG’s loan products are unsecured consumer loans with a maturity range between 1 month and 36 months and pledge (usually pledge on the car) secured loans with maturities of up to 60 months. The median loan amount is above 400 EUR, whereas loan amounts range between 25 EUR and 10 thousand EUR. The weighted average annual percentage rate (APR) is 56% and effective interest rate (EIR) 75% depending on the loan amount, maturity, and status of the customer (new or recurring client with good payment history). Breakdown of portfolio diversification as of 30/06/2021
ICG aims to serve only clients with a permanent workplace and stable income. The loan underwriting process is based on personal identification, personal income assessment, and personal loan performance data. Approximately 58% of loan applications by individual customers across the Group are approved on average. Loans are handled via established partners network (such as shops, money transfer companies, postal agencies), web portals and other online channels, as well as IuteCredit branches (retail offices). By the end of June 2021, IuteCredit had 43 IuteCredit branches and almost 1.300 shops. Traditionally, ICG handles money only via bank accounts or over the counter through its agents. With the introduction of IuteCredit ATMs, the operating country subsidiaries are increasingly carrying out cash transactions. Breakdown of net portfolio development in EUR (million)
Moldova 41%
Albania 38%
Macedonia 18%Bosnia 3%
5,4 6,1 7,6 8,7 10,4 14,1 20,4 22,5 27,8
37,3 48,1
55,8 64,7
75,5 79,0 80,1 67,8 71,2
79,2 80,8 88,1
2Q/16 3Q/16 4Q/16 1Q/17 2Q/17 3Q/17 4Q/17 1Q/18 2Q/18 3Q/18 4Q/18 1Q/19 2Q/19 3Q/19 4Q/19 1Q/20 2Q/20 3Q/20 4Q/20 1Q/21 2Q/21

IFRS UNAUDITED CONSOLIDATED 6M/2021 REPORT
7
Earnings, financial and asset position Condensed statement of profit and loss (in thousand EUR) 6M/2021 6M/2020 ∆ in %
Interest and similar income 23.413 22.720 3,0% Interest and similar expense -6.463 -5.575 15,9% Net interest and commission fee income 16.950 17.145 -1,1% Loan administration fees and penalties 4.294 3.267 31,4% Total loan administration fees and penalties 4.294 3.267 31,4% Other income 1.499 2.888 -48,1% Allowances for loan impairment -8.612 -11.859 -27,4% Net operating income 14.131 11.441 23,5% Personnel expenses -4.146 -3.901 6,3% Depreciation/amortization charge -1.239 -754 64,4% Other operating expenses -5.129 -3.175 61,5% Total operating expenses -10.514 -7.829 34,3% Foreign exchange gains/losses -297 -868 -65,7% Total foreign exchange gains/losses -297 -868 -65,7% Profit before tax 3.319 2.744 21,0% Income tax expense -293 -1.439 -79,6% Net profit for the period 3.026 1.305 131,9%
IuteCredit's business model is focused on performing customers and avoiding poorly performing or defaulting customers. Accordingly, fee income predominantly results from performing customers and primary fees. Primary loan agreement commission fees are charged for receiving, processing loan applications and issuing loans, or modifying valid loan conditions. Interest is charged on the outstanding principal loan amounts. Other primary fees are charged for various services. Secondary fees are applied as a consequence of non-performance of loan repayment payments on the due date. Secondary fees are used to offset the Group's exposure to payments past due related to the original loan agreements. Secondary fees are accounted as collected, whereas primary fees are accounted as accrued. Total income
Total income before expenses consisting of interest income and similar income, penalties and similar income, and other income increased by 1,1% to 29.206 thousand EUR (6M/2020: 28,875 thousand EUR). Breakdown of total income
(in thousand EUR) 6M/2021 6M/2020 ∆ in %
Interest and similar income 23.413 22.720 3,0% Penalties and similar income 4.294 3.267 31,4% Other income 1.499 2.888 -48,1% Total income 29.206 28.875 1,1%

IFRS UNAUDITED CONSOLIDATED 6M/2021 REPORT
8
Other income
Other income in 6M/2021 of 1.499 thousand EUR included, in particular, income of 777 thousand EUR from sales of defaulted loan portfolio and extraordinary income from debt collectors of 637 thousand EUR. Interest income
Interest income for the period increased by 3,0% to 23.413 thousand EUR (6M/2020: 22.720 thousand EUR), affected by steadily increasing payouts compared to the 13,9% increase in the average net loan portfolio. Breakdown of interest income
(in thousand EUR) 6M/2021 6M/2020 ∆ in %
Total value of loan principal issued 74.723 49.914 49,7% Average net loan portfolio 83.651 73.418 13,9%
Principal 87.838 75.575 16,2% Accrued interest 15.507 14.395 7,7%
Average annualized interest rate on net portfolio 56,3% 56,2% 0,1% Interest income 23.413 22.720 3,0%
Breakdown of interest income by countries
6M/2021 Total share in % 6M/2020 Total share in % ∆ in %
Moldova 10.022 42,8% 12.367 54,4% -19,0% Albania 8.976 38,3% 7.755 34,1% 15,7% Macedonia 3.458 14,8% 1.927 8,5% 79,4% Bosnia 936 4,0% 671 3,0% 39,4% Bulgaria 22 0,1% 0 0,0% n/a Total 23.413 100,0% 22.720 100,0% 3,0%
The change in interest income in Moldova resulted from the implementation of legally impermissible charging of interest after the termination of a loan agreement. Interest expense
Interest expense increased by 15.9% to 6.463 thousand EUR (6M/2020: 5.575 thousand EUR), in connection with the borrowing related to the expected growth of business. Most notably, was the tap issue of 10 million EUR to the four-year corporate bond 2019/23 in November 2020. Breakdown of interest expense
(in thousand EUR) 6M/2021 6M/2020 ∆ in %
Interest on amounts due to creditors -2.950 -2.828 4,3% Interest on financial lease liabilities -62 -48 29,3% Interest on bonds -3.452 -2.699 27,9% Total -6.463 -5.575 15,9%

IFRS UNAUDITED CONSOLIDATED 6M/2021 REPORT
9
Loan administration fees and penalties
Income from other fees and penalties increased by 31,1% to 4.294 thousand EUR (6M/2020: 3.267 thousand EUR) reflecting penalties and delay interests, resigns, deduction by dealer bonuses, and other secondary fees. Breakdown of administration fees and penalties
(in thousand EUR) 6M/2021 6M/2020 ∆ in %
Penalties under loans and delay interests 4.716 3.251 45,1% Resigns under customer loans 186 273 -31,8% Dealer bonuses -648 -257 152,3% Other fees from additional services 40 0 n/a Total 4.294 3.267 31,4%
Allowances for loan impairment
Change in allowances for loan impairment decreased to 8.612 thousand EUR (6M/2020: 11.915 thousand EUR) in line with an intentionally more conservative provisioning approach as a response to the COVID-19 pandemic creating an additional risk buffer. Breakdown of allowances for loan impairment
(in thousand EUR) 6M/2021 6M/2020 ∆ in %
At the beginning of the period -15.859 -13.100 21,1% Allowances for loan impairment -8.612 -11.915 -27,7% Utilized 9.270 2.818 228,9% Exchange differences -27 58 -146,6% At the end of the period -15.229 -22.139 -31,2%
(in thousand EUR) 6M/2021 6M/2020 ∆ in %
Impairment charges on loans -9.441 -11.915 -20,8% Recovery from written-off loans 829 56 >1.000% Net impairment charges -8.612 -11.859 -27,4%
With the start of monthly amortization from October 2020, the figures are not comparable between the periods. In 6M/2021, the amount utilized is split between the sale of defaulted ICA loan portfolio with 2,7 million EUR and monthly write-offs. The prior-year period solely included the sale of defaulted ICA loan portfolio. Overall net impairment losses represented 36,8% of interest income (6M/2020: 52,2%). The cost of risk, expressed as net impairment charges to average gross loan portfolio, equaled 8,7% (31 December 2020: 20,0%).

IFRS UNAUDITED CONSOLIDATED 6M/2021 REPORT
10
Operating expenses
Operating expenses for the period increased by 31,1% to 9.275 thousand EUR (6M/2020: 7.076 thousand EUR) related to the recovery of business activity. Advertising expenses accounted for 9,8% (6M/2020: 8,2%) of operating expenses. The cost to income ratio for the period increased to 36,0% (6M/2020: 27,1%). Breakdown of operating expenses
(in thousand EUR) 6M/2021 6M/2020 ∆ in %
Personnel -4.146 -3.901 6,3% Advertising expenses -908 -578 57,2% IT -767 -551 39,2% Debt collection -420 -155 171,1% Legal and consulting -333 -282 18,1% Rent and utilities -109 2 >-1.000% Taxes -1.136 -612 85,7% Travel -237 -105 125,7% Other -1.218 -894 36,2% Total -9.275 -7.076 31,1%
Excluding personnel expenses, operating expenses increased by 61,5% to 5.129 thousand EUR (6M/2020: 3.175 thousand EUR). Personnel expenses
Personnel expenses, mainly salaries and bonuses, and social security expenses increased less than the build-up in headcount by 6,3% to 4.146 thousand EUR (6M/2020: 3.901 thousand EUR), mostly related to the employment of highly qualified specialists (in-house IT department). The average staff number in full-time equivalents increased by 17,0% to 420 employees (6M/2020: 359 employees). Breakdown of personnel expenses
(in thousand EUR) 6M/2021 6M/2020 ∆ in %
Salaries and bonuses -3.588 -3.277 9,5% Social security expenses -451 -525 -14,0% Medical insurance expenses -78 -47 64,2% Other expenses -29 -51 -43,5% Total -4.146 -3.901 6,3% Number of employees adjusted to full-time 420 359 17,0%

IFRS UNAUDITED CONSOLIDATED 6M/2021 REPORT
11
Foreign exchange gains/losses
Foreign exchange movements resulted in a loss of 297 thousand EUR (6M/2020: 868 thousand EUR) reflecting, in particular, EUR/MDL and EUR/ALL conversion rates. Profit before tax
Consolidated profit before tax increased by 21,0% to 3.319 thousand EUR (6M/2020: 2.744 thousand EUR). The profit margin before tax equaled 14,2% (6M/2020: 12,1%). Income tax expense
Income tax expense decreased by 131,9% to 239 thousand EUR (6M/2020: 1.439 thousand EUR), in particular, as a result of different taxation regulations in home markets, i.e., differences between provisions accounting in national GAAP and IFRS. Breakdown of income tax
(in thousand EUR) 6M/2021 6M/2020 ∆ in %
Consolidated profit before tax 3.319 2.744 21,0% Current income tax expense -293 -1.439 -79,6% Net profit for the period 3.026 1.305 131,9%
Profit for the period
Net profit for the period increased by 131,9% to 3.026 thousand EUR (6M/2020: 1.305 thousand EUR). Transition statement of non-IFRS measures EBITDA and Adjusted EBITDA Breakdown of transition to adjusted EBITDA (in thousand EUR) 6M/2021 6M/2020 ∆ in %
Profit for the period 3.026 1.305 131,9% Provision for corporate income tax 293 1.439 -79,6% Interest expense 6.463 5.575 15,9% Depreciation and amortization 1.239 754 64,3% EBITDA 11.022 9.073 21,5% Adjustments -297 -868 -65,7% Adjusted EBITDA 11.319 9.940 13,9%
Breakdown of adjustments to EBITDA
(in thousand EUR) 6M/2021 6M/2020 ∆ in %
Foreign exchange gains/losses -297 -868 -65,7% Adjustments -297 -868 -65,7%

IFRS UNAUDITED CONSOLIDATED 6M/2021 REPORT
12
Condensed statement of financial position (in thousand EUR) 30 Jun 2021 31 Dec 2020 ∆ in %
ASSETS
Cash and bank accounts 14.927 19.453 -23,3% Loans to customers 88.115 79.187 11,3% Prepayments 2.584 1.297 99,2% Other assets 4.008 2.702 48,3% Other financial investments 5.963 7.196 -17,1% Property, plant and equipment 1.107 978 13,2% Right-of-use assets 2.053 2.113 -2,8% Intangible assets 4.973 3.693 34,7% Total assets 123.730 116.619 6,1% LIABILITIES AND EQUITY Liabilities Loans and bonds from investors 97.563 91.434 6,7% Trade and other payables 1.036 1.051 -1,5% Current income tax liabilities 5 238 -98,1% Deferred tax liabilities 395 655 -39,7% Other liabilities 1.776 1.753 1,3% Total liabilities 100.775 95.131 5,9% Equity Share capital 10.000 10.000 0,0% Legal reserve 537 537 0,0% Unrealized foreign exchange differences -1.747 -1.689 3,4% Retained earnings 14.166 12.640 12,1% Total equity 22.956 21.488 6,8% Total equity and liabilities 123.730 116.619 6,1%

IFRS UNAUDITED CONSOLIDATED 6M/2021 REPORT
13
Assets
Total assets increased by 6,1% to 123.730 thousand EUR as of 30 June 2021 (31 December 2020: 116.619 thousand EUR), among other things as a result of the cash inflow of EUR 3.0 million from the court-appointed liquidator of the business activities in Kosovo. Loan portfolio
The net loan portfolio increased by 11.3% to 88.115 thousand EUR as of 30 June 2021 (31 December 2020: 79.186 thousand EUR). Breakdown of net portfolio (in thousand EUR) 30 Jun 2021 Total in % 31 Dec 2020 Total in % ∆ in %
Moldova 35.758 40,6% 35.139 44,4% 1,8% Albania 33.865 38,4% 30.037 37,9% 12,7% Macedonia 15.461 17,5% 11.315 14,3% 36,6% Bosnia 2.828 3,2% 2.695 3,4% 4,9% Bulgaria 203 0,2% 0 0,0% n/a Total net loan portfolio 88.115 100,0% 79.186 100,0% 11,3%
Breakdown of loan applications
6M/2021 6M/2020 ∆ in %
in pcs Processed Approved Paid out
Approval rate %
Active rate % Processed Approved Paid
out Approval
rate% Active rate % Processed Approved Approval
rate%
Moldova 98.285 60.076 56.922 61,1% 92,1% 79.082 46.365 41.756 58,6% 40,2% 24,3% 29,6% 4,3%
Albania 76.292 54.830 54.215 71,7% 94,4% 58.217 36.473 34.157 62,7% 41,0% 31,0% 50,3% 14,4%
Macedonia 37.629 22.508 22.575 59,8% 98,9% 25.516 14.921 14.545 58,5% 38,7% 47,5% 50,8% 2,3%
Bosnia 8.101 3.288 3.196 40,4% 97,0% 6.079 2.486 2.422 40,9% 69,8% 33,3% 32,3% -1,3%
Bulgaria 4.902 528 459 13,8% 100,0% 0 0 0 0,0% 0,0% n/a n/a n/a
In total 225.209 141.230 137.367 62,7% 96,5% 168.894 100.245 92.880 59,4% 92,7% 33,3% 40,9% 5,6%
Breakdown of issued loans APR on country level
(in %) 6M/2021 6M/2020 ∆ in %
Moldova 58,7% 55,2% 6,4% Albania 60,8% 63,1% -3,7% Macedonia 43,5% 38,9% 11,8% Bosnia 59,7% 63,4% -5,8% Bulgaria 40,9% 0,0% n/a ICG weighted average 56,3% 56,2 0,1%
The increase in average annual percentage rates (APR) at group level in 6M/2021 despite the shift to longer loan maturities and the increasing share of repeating customers is attributable to, in particular, in Moldova, the lower proportion of dealers compared with the previous year due to lockdowns, while cash loans had higher APRs with lower payouts.

IFRS UNAUDITED CONSOLIDATED 6M/2021 REPORT
14
Breakdown of customer performance index (CPI30)
The following table sets out the ratio of actual loan repayments compared to expected repayments according to loan repayment schedules, plus 30 days tolerance, i.e., Customer Performance Index (CPI30). (in %) 6M/2021 6M/2020 ∆ in %
Moldova 85,9% 83,7% 2,6% Albania 89,8% 81,0% 10,9% Macedonia 86,5% 88,7% -2,5% Bosnia 70,2% 73,6% -4,6% ICG weighted average 86,9% 82,9% 4,8%
Customer repayment discipline (Customer Performance Index, CPI30) was driven by the shift to longer loan maturities and a growing share of repeating customers. Breakdown of portfolio classification
The following tables set out the classification of the Group’s net loan portfolio in terms of overdue buckets as well as the total impairment coverage ratio. Non-performing loans are recorded according to DPD+50.
30 Jun 2021
31 Dec 2020 (in thousand EUR)
Gross amount
Provisions Net amount
% of net portfolio
Gross
amount Provisions Net
amount % of net portfolio
Performing 83.144 -5.446 77.698 88,2% 72.751 -6.746 66.005 83,4% Non-Performing
20.200 -9.783 10.417 11,8% 22.295 -9.113 13.182 16,6%
Total portfolio 103.344 -15.229 88.115 100,0% 95.046 -15.859 79.187 100,0%
(in thousand EUR) 30 Jun 2021 Total share in % 31 Dec 2020 Total share in
% Stage 1 75.910 86,1% 64.796 81,8% Stage 2 1.788 2,0% 1.209 1,5% Stage 3 10.417 11,8% 13.182 16,6% Total net portfolio 88.115 100,0% 79.187 100,0% Gross NPL ratio 19,5% 23,5%
Impairment coverage ratio 75,4% 71,1%
The total share of poorly performing loan portfolio (Stage 3) decreased starting monthly depreciation of fully impaired loans DPD 365 in October 2020. Distribution principles between stages
30 Jun 2021 31 Dec 2020
Stage 1 DPD <=30 DPD <=30 Stage 2 30 < DPD <=50 30 < DPD <=50 Stage 3 DPD > 50 DPD > 50

IFRS UNAUDITED CONSOLIDATED 6M/2021 REPORT
15
Other assets and prepayments
Breakdown of other assets and prepayments
(in thousand EUR) 30 Jun 2021 31 Dec 2020 ∆ in %
Deferred tax assets 270 104 159,7% Prepayments of rent 70 77 -9,7% Prepayment of taxes 1.940 1.011 91,9% Prepayments to suppliers and deferred expenses 304 105 189,3% Prepayments in total 2.584 1.297 99,2% Receivables from collection companies 624 292 113,5% Other receivables 288 73 294,7% Deposit receivables from partners 3.112 2.337 33,2% Trade and other receivables in total 4.024 2.702 48,9% TOTAL 6.607 3.999 65,2%
The increase in advance tax payments is based on the 2020 audited financial statements. Corresponding adjustments are to be incurred on the basis of the audited 2021 financial statements. Liabilities
As of 30 June 2021, total liabilities increased by 5,9% to 100.775 thousand EUR (31 December 2020: 95.131 thousand EUR). The changes mainly relate to the tap issue of 10 million EUR to the four-year corporate bond 2019/23 in November 2020. Breakdown of loans and borrowings Loans and borrowings increased by 6,7% to 97.563 thousand EUR (31 December 2020: 91.434 thousand EUR), accounting for 96,8% of all liabilities (31 December 2020: 96,1%). (in thousand EUR) 30 Jun 2021 31 Dec 2020 ∆ in %
Loans from investors 44.848 41.852 7,2% Due date during next 12 months 21.714 23.803 -8,8%
Due date after 12 months 23.135 18.049 28,2% Bond liabilities 47.812 44.596 7,2%
Due date during next 12 months 0 0 n/a Due date after 12 months 47.812 44.596 7,2%
Lease liabilities 2.053 2.121 -3,2% Due date during next 12 months 875 860 1,8%
Due date after 12 months 1.178 1.261 -6,5% Accrued interest 2.849 2.866 -0,6% TOTAL 97.563 91.434 6,7%
weighted average interest rate 12,9% 13,1% currency EUR, MDL, USD;
ALL; MKD EUR, MDL, USD;
ALL; MKD
Loans from investors increased to 44.848 thousand EUR (31 December 2020: 41.852 thousand EUR), of which 36.050 thousand EUR (31 December 2020: 32.232 thousand EUR) is accounted for by P2P loans from the Mintos platform. IuteCredit Finance S.a.r.l., wholly owned Luxembourg subsidiary of ICG, issued and placed in August 2019 40 million EUR senior secured bonds (Eurobond), with a maturity of 4 years and a coupon of 13%, guaranteed by ICG and its subsidiaries.

IFRS UNAUDITED CONSOLIDATED 6M/2021 REPORT
16
In November 2020, a 10 million EUR tap at a price of 97 per cent followed. After the tap issue, the total amount outstanding of IuteCredit's 13% corporate bonds 2019/2023 amounts to 50 million EUR. The bonds are listed on the Regulated Market Frankfurt of Stock Exchange. Eurobond covenant ratios 30 Jun 2021 31 Dec 2020 ∆ in %
Capitalization
Capitalization ratio (equity/net loan portfolio) 26,1% 27,1% -4,0%
Financial covenant at least 15% 6M/2021 6M/2020 ∆ in %
Profitability
Interest coverage ratio (ICR), times 2,0 1,8 13,1% (adjusted EBITDA/interest expenses)
Financial covenant at least 1,5
Distribution of investor loan (Mintos)
Mintos loans
Net loan portfolio
(in thousand EUR)
30 Jun 2021
31 Dec 2020 ∆ in %
30 Jun 2021
Total share in %
31 Dec 2020 Total share in %
Moldova 10.974 12.770 -14,1% 35.758 30,7% 35.139 36,3% Albania 17.228 15.274 12,8% 33.865 50,9% 30.037 50,9% Macedonia 7.848 4.188 87,4% 15.461 50,8% 11.315 37,0% Bosnia 0 0 0,0% 2.828 0,0% 2.695 0,0% Bulgaria 0 0 0,0% 203 0,0% 0 0,0% Total 36.050 32.232 11,8% 88.115 42,3% 79.186 42,1%
IFRS UNAUDITED CONSOLIDATED 6M/2021 REPORT
17
Other liabilities
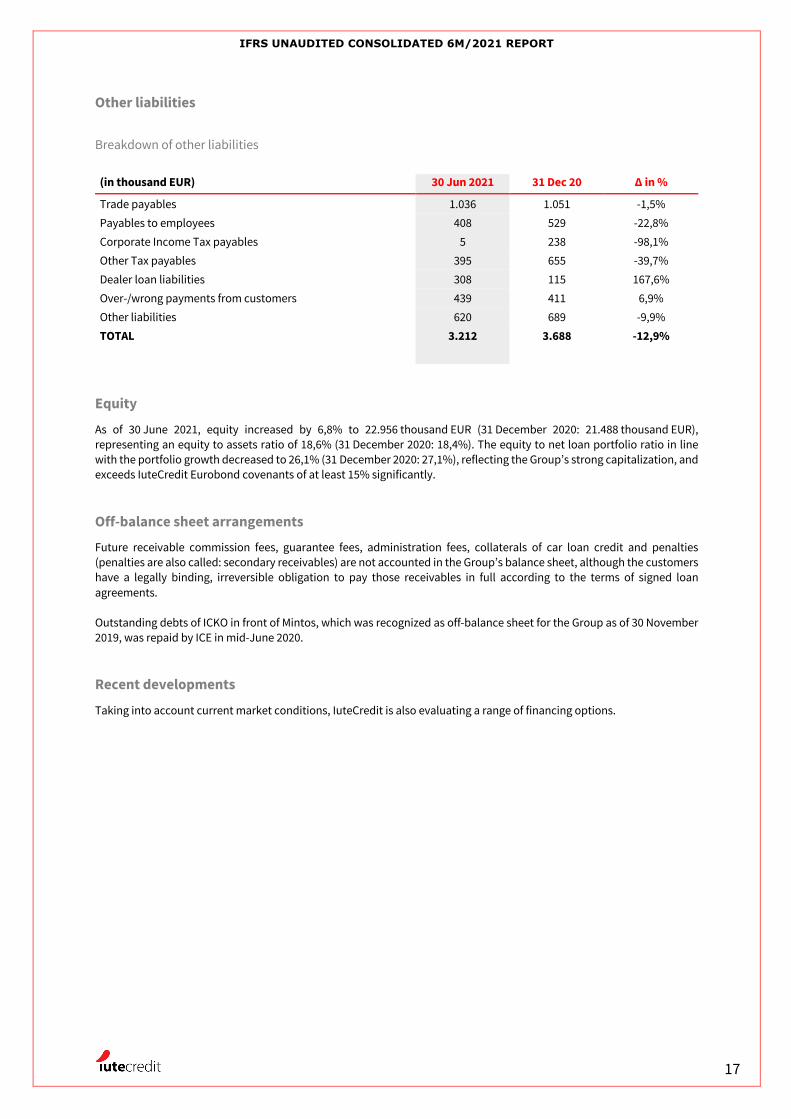
Breakdown of other liabilities
(in thousand EUR) 30 Jun 2021 31 Dec 20 ∆ in %
Trade payables 1.036 1.051 -1,5% Payables to employees 408 529 -22,8% Corporate Income Tax payables 5 238 -98,1% Other Tax payables 395 655 -39,7% Dealer loan liabilities 308 115 167,6% Over-/wrong payments from customers 439 411 6,9% Other liabilities 620 689 -9,9% TOTAL 3.212 3.688 -12,9%
Equity
As of 30 June 2021, equity increased by 6,8% to 22.956 thousand EUR (31 December 2020: 21.488 thousand EUR), representing an equity to assets ratio of 18,6% (31 December 2020: 18,4%). The equity to net loan portfolio ratio in line with the portfolio growth decreased to 26,1% (31 December 2020: 27,1%), reflecting the Group’s strong capitalization, and exceeds IuteCredit Eurobond covenants of at least 15% significantly. Off-balance sheet arrangements
Future receivable commission fees, guarantee fees, administration fees, collaterals of car loan credit and penalties (penalties are also called: secondary receivables) are not accounted in the Group’s balance sheet, although the customers have a legally binding, irreversible obligation to pay those receivables in full according to the terms of signed loan agreements. Outstanding debts of ICKO in front of Mintos, which was recognized as off-balance sheet for the Group as of 30 November 2019, was repaid by ICE in mid-June 2020. Recent developments
Taking into account current market conditions, IuteCredit is also evaluating a range of financing options.

IFRS UNAUDITED CONSOLIDATED 6M/2021 REPORT
18
CONSOLIDATED FINANCIAL STATEMENTS Consolidated statement of comprehensive income
(in thousand EUR) 6M/2021 6M/2020 ∆ in %
Interest and similar income 23.413 22.720 3,0% Interest and similar expense -6.463 -5.575 15,9% Net interest and commission fee income 16.950 17.145 -1,1% Loan administration fees and penalties 4.294 3.267 31,4% Loan administration fees and penalties in total 4.294 3.267 31,4% Other income 1.499 2.888 -48,1% Allowances for loan impairment -8.612 -11.859 -27,4% Net operating income 14.131 11.441 23,5% Personnel expenses -4.146 -3.901 6,3% Depreciation/amortization charge -1.239 -754 64,4% Other operating expenses -5.129 -3.175 61,5% Total operating expenses -10.514 -7.829 34,3% Foreign exchange gains/losses -297 -868 -65,7% Total foreign exchange gains/losses -297 -868 -65,7% Profit before tax 3.319 2.744 21,0% Income tax expense -293 -1.439 -79,6% Profit for the reporting period 3.026 1.305 132,0% Other comprehensive income Other comprehensive income to be classified to profit or loss in subsequent periods:
Exchange differences on translation of foreign operations -58 -227 -74,7% Other comprehensive income total 2.969 1.078 175,5% Profit attributable to: Equity holders 2.969 1.078 175,5% Total comprehensive income attributable to: Equity holders 2.969 1.078 175,5%
IFRS UNAUDITED CONSOLIDATED 6M/2021 REPORT
19
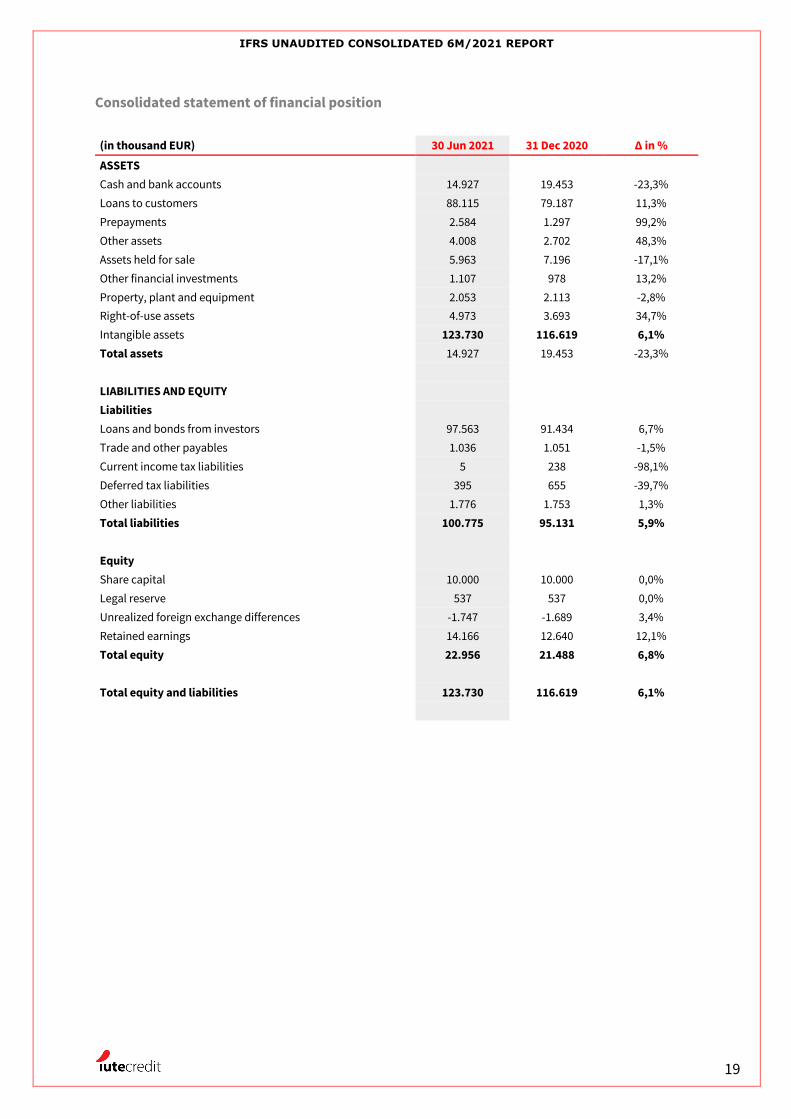
Consolidated statement of financial position
(in thousand EUR) 30 Jun 2021 31 Dec 2020 ∆ in %
ASSETS
Cash and bank accounts 14.927 19.453 -23,3% Loans to customers 88.115 79.187 11,3% Prepayments 2.584 1.297 99,2% Other assets 4.008 2.702 48,3% Assets held for sale 5.963 7.196 -17,1% Other financial investments 1.107 978 13,2% Property, plant and equipment 2.053 2.113 -2,8% Right-of-use assets 4.973 3.693 34,7% Intangible assets 123.730 116.619 6,1% Total assets 14.927 19.453 -23,3% LIABILITIES AND EQUITY Liabilities Loans and bonds from investors 97.563 91.434 6,7% Trade and other payables 1.036 1.051 -1,5% Current income tax liabilities 5 238 -98,1% Deferred tax liabilities 395 655 -39,7% Other liabilities 1.776 1.753 1,3% Total liabilities 100.775 95.131 5,9% Equity Share capital 10.000 10.000 0,0% Legal reserve 537 537 0,0% Unrealized foreign exchange differences -1.747 -1.689 3,4% Retained earnings 14.166 12.640 12,1% Total equity 22.956 21.488 6,8% Total equity and liabilities 123.730 116.619 6,1%

IFRS UNAUDITED CONSOLIDATED 6M/2021 REPORT
20
Consolidated statement of cash flows (in thousand EUR) 6M/2021 6M/2020 ∆ in %
Paid prepayments (-) -10.726 -4.101 161,6% Received pre- and overpayments (+) 15.257 22.168 -31,2% Paid trade payables outside the Group (-) -7.785 -5.589 39,3% Received debts from buyers and received other claims (+) 1.732 142 >1.000% Received from collection companies (+) 11.891 11.558 2,9% Paid net salaries (-) -3.103 -2.858 8,6% Paid tax liabilities, exc. CIT (-) -2.527 -1.425 77,4% Corporate income tax paid (-) -818 -827 -1,0% Paid out to customers outside the Group (-) -32.374 -20.511 57,8% Change in MasterCard settlement account (+/-) -8.457 -2.170 289,7% Principal repayments from customers outside the Group (+) 21.845 15.662 39,5% Loan principal repayments from customers related to MasterCard (+) 5.031 1.268 296,7% Interest, commission and other fees received outside the Group (+) 9.209 6.899 33,5% NET CASH FLOWS FROM OPERATING ACTIVITIES -825 20.216 -104,1%
Purchase of fixed assets outside the Group, incl. prepayments (-) -810 -153 429,7% Payments for other financial investments (-) -170 -1.511 -88,7% Receipts from other financial investments (+) 6.750 504 100,0% NET CASH FLOWS FROM INVESTING ACTIVITIES 5.769 -1.160 -597,3% Loans received from investors outside the Group (+) 18.020 18.367 -1,9% Repaid loans to investors outside the Group (-) -20.815 -22.927 -9,2% Change in overdraft (+/-) 0 -5.162 -100,0%
Principal payments of financial lease contracts (-) -487 -420 16,0% Interests paid outside the Group (-) -4.735 -4.090 15,8% Dividends paid outside the Group (-) -1.499 -499 200,3% Payments for other financing activities (-) 0 -38 100,0% Receipts from other financing activities (+) 0 3 100,0% NET CASH FLOWS FROM FINANCING ACTIVITIES -9.516 -14.766 -35,6% Change in cash and cash equivalents -4.572 4.290 -206,6% Cash and cash equivalents at the beginning of the period 19.453 6.734 188,9% Change in cash and cash equivalents -4.572 4.290 -206,6%
Net foreign exchange difference 46 -206 -122,2% Cash and cash equivalents at the end of the period 14.927 10.818 38,0%
Cash and cash equivalents comprise 6M/2021 6M/2020 ∆ in %
Cash on hand 418 5 >1.000% Non-restricted current account 14.509 10.813 34,2%

IFRS UNAUDITED CONSOLIDATED 6M/2021 REPORT
21
Consolidated statement of changes in equity
(in thousand EUR) Share
capital Legal
reserve Share
premium Unrealized
foreign exchange
differences
Retained earnings
Total
01/01/20 10.000 398 0 72 8.035 18.505 Profit for the year 0 0 0 0 1.305 1.305 Other comprehensive income Foreign currency translation 0 0 0 -227 0 -227 Total comprehensive income 0 0 0 -227 1.305 1.078 Contribution to share capital 0 139 0 0 -139 0 Dividends 0 0 0 0 -638 -638 30/06/20 10.000 537 0 -155 8.563 18.945
01/01/21 10.000 537 0 -1.689 12.639 21.487 Profit for the period 0 0 0 0 3.026 3.026 Other comprehensive income Foreign currency translation 0 0 0 -58 0 -58 Total comprehensive income 0 0 0 -58 3.026 2.969 Allocation to reserves 0 0 0 0 0 0 Dividends 0 0 0 0 -1.500 -1.500 30/06/21 10.000 537 0 -1.747 14.165 22.956

IFRS UNAUDITED CONSOLIDATED 6M/2021 REPORT
22
Additional key performance indicators
Profitability 6M/2021 6M/2020 ∆ in %
Return on average assets 2,5% 1,3% 1,2% Return on average equity 13,6% 7,0% 6,7% Interest income/Average interest earning assets 22,3% 22,5% -0,3% Interest income/Average gross loan portfolio 23,6% 25,0% -1,4% Interest income/Average net loan portfolio 26,7% 30,1% -3,4% Interest expense/Interest income 27,6% 24,5% 3,1% Cost of funds 6,6% 6,7% -0,1% Cost of interest-bearing liabilities 6,8% 7,0% -0,2% Net interest margin 20,3% 23,5% -3,2% Net effective annualized yield 28,0% 37,9% -9,9% Net impairment/interest income 36,8% 52,2% -15,4% Net fee and commission income/Total operating income 94,9% 90,0% 4,9% Earnings before taxes/Average total assets 2,8% 2,7% 0,1% Efficiency 6M/2021 6M/2020 ∆ in %
Total assets/Employee (in thousand EUR) 295 316 -6,8%
Total operating income/Employee (in thousand EUR) 70 80 -13,1%
Cost/Income ratio 36,0% 27,1% 8,9%
Total recurring operating costs/Average total assets 1,9% 1,0% 0,9%
Total operating income/ Average total assets 24,3% 28,4% -4,1%
Personnel costs/Total recurring operating costs 184,1% 389,3% -205,2%
Personnel costs/Total operating income 14,2% 13,5% 0,7%
Net operating income/Total operating income 48,4% 39,6% 8,8%
Net income (Loss)/Total operating income 10,4% 4,5% 5,8%
Profit before tax (Loss)/Interest income 14,2% 12,1% 2,1%
Liquidity 6M/2021 6M/2020 ∆ in %
Net loan receivables/Total assets 71,2% 67,9% 3,3%
Average net loan receivables/Average total assets 73,1% 74,5% -1,4%
Net loan receivables/Total liabilities 87,4% 83,2% 4,2%
Interest earning assets/Total assets 85,0% 86,4% -1,4%
Average interest earning assets/Average total assets 85,7% 82,3% 3,4%
Liquid assets/Total assets 16,9% 22,9% -6,0%
Liquid assets/Total liabilities 20,7% 28,0% -7,3%
Total deposits/Total assets 0,6% 0,1% 0,5%
Total deposits/Total liabilities 0,7% 0,1% 0,6%
Total deposits/Shareholders’ equity 3,1% 0,6% 2,5%
Tangible common equity/Tangible assets 15,1% 15,8% -0,6%
Tangible common equity/Net receivables 20,4% 22,5% -2,1%
Net Loan Receivables/Equity (times) 3,8 3,7 4,2%
Asset quality 6M/2021 31 Dec 2020 ∆ in %
Loan loss reserve/Gross receivables from client 14,7% 16,7% -2,0%
Average loan loss reserve/Average gross receivables from clients 15,7% 15,5% 0,2%
Cost of risk 8,7% 20,0% -11,3%
Gross NPL ratio 19,5% 23,5% -4,0%
Impairment coverage ratio 75,4% 71,1% 4,3%
Selected operating data 6M/2021 6M/2020 ∆ in %
Number of employees (adjusted to full-time) 420 359 17,0%
Average monthly gross salary in group (in EUR) 712 1.520 -53,2%

IFRS UNAUDITED CONSOLIDATED 6M/2021 REPORT
23
DEFINITIONS EBITDA – EBITDA means for the reporting period prior the calculation date, the consolidated net earnings of the Borrower prepared in accordance with the IFRS before any provision on account of taxation, depreciation and amortization, any interest, commissions, discounts and other fees incurred in respect of any financial debt or any interest earned on debts
Adjusted EBITDA – a non-IFRS measure that represents EBITDA (profit for the period plus tax, plus interest expense, plus depreciation and amortization) adjusted for income/loss from discontinued operations, non-cash gains and losses attributable to movement in the mark-to-market valuation of hedging obligations under IFRS, goodwill write-offs and certain other one-off or non-cash items
Adjusted interest coverage – Adjusted EBITDA / interest expense
Cost of risk – Annualized net impairment charges / average gross loan portfolio (total gross loan portfolio as of the start and end of each period divided by two)
Cost/income ratio – Operating costs / operating income
Equity/assets ratio – Total equity / total assets
Equity/net loan portfolio – Total equity / net customer receivables (including accrued interest)
Gross NPL ratio – Non-performing loan portfolio (including accrued interest) with a delay of over 50 days / gross loan portfolio (including accrued interest)
Gross loan portfolio – Total amount receivable from customers, including principal and accrued interest, after deduction of deferred income
Impairment coverage ratio – Total impairment / Gross NPL (+50 days overdue)
Intangible assets – Intangible IT assets (software and developments costs)
Interest and similar income - generated from our customer loan portfolio
Loss given default – Loss on non-performing loan portfolio (i.e., 1 - recovery rate) based on recoveries during the appropriate time window for the specific product, reduced by costs of collection, discounted at the weighted average effective interest rate
Net effective annualized yield – annualized interest income (excluding penalties) / average net loan principal
Net impairment to interest income ratio – Net impairment charges on loans and receivables / interest income
Net interest margin – Annualized net interest income / average gross loan principal (total gross loan principal as of the start and end of each period divided by two)
Net loan portfolio – Gross loan portfolio (including accrued interest) less impairment provisions
Non-performing loans (NPLs) – Loan principal or receivables (as applicable) that are over 50 days past due
Overall provision coverage – Allowance account for provisions / non-performing receivables
Profit before tax margin – Profit before tax / interest income
Performing customers – Online lending customers with open loans that are up to 30 days past due
Poorly performing customers – Online lending customers with open loans that are over 30 days and less than 50 days past due
Return on average assets – Annualized profit from continuing operations / average assets (total assets as of the start and end of each period divided by two)
Return on average equity – Annualized profit from continuing operations / average equity (total equity as of the start and end of each period divided by two)
Tangible equity – Total equity minus intangible assets
STAGE 1 – The 12MECL is calculated as the portion of LTECLs that represent the ECLs that result from default events on a financial instrument that are possible within the 12 months after the reporting date. The Group calculates the 12MECL allowance based on the expectation of a default occurring in the 12 months following the reporting date. These expected 12-month default probabilities are applied to a forecast EAD and multiplied by the expected LGD and discounted by an approximation to the original EIR.
STAGE 2 – When a loan has shown a significant increase in credit risk since origination, the Group records an allowance for the LTECLs. The mechanics are similar to those explained above, including the use of multiple scenarios, but PDs and LGDs are estimated over the lifetime of the instrument. The expected cash shortfalls are discounted by an approximation to the original EIR.
STAGE 3 – For loans considered credit-impaired, the Group recognizes the lifetime expected credit losses for these loans. The method is similar for Stage 2 assets, with the PD set at 100%.

IFRS UNAUDITED CONSOLIDATED 6M/2021 REPORT
24
DISCLAIMER The information contained herein is not for release, publication or distribution, in whole or in part, directly or indirectly, in or into the United States, Australia, Canada, Hong Kong, Japan, New Zealand, South Africa or any other countries or otherwise in such circumstances in which the release, publication or distribution would be unlawful. The information contained herein does not constitute an offer to sell or the solicitation of an offer to buy, nor shall there be any sale of, the bonds in any jurisdiction in which such offer, solicitation or sale would be unlawful prior to registration, exemption from registration or qualification under the securities laws of any such jurisdiction. Persons into whose possession this announcement may come are required to inform themselves of and observe all such restrictions. This announcement does not constitute an offer of securities for sale in the United States. The bonds have not been and will not be registered under the Securities Act or under the applicable securities laws of any state of the United States and may not be offered or sold, directly or indirectly, within the United States or to, or for the account or benefit of, U.S. persons except pursuant to an applicable exemption from, or in a transaction not subject to, the registration requirements of the Securities Act. This announcement does not constitute a prospectus for the purposes of Directive 2003/71/EC, as amended (the "Prospectus Directive") and does not constitute a public offer of securities in any member state of the European Economic Area (the "EEA"). This announcement does not constitute an offer of bonds to the public in the United Kingdom. No prospectus has been or will be approved in the United Kingdom in respect of the bonds. Accordingly, this announcement is not being distributed to, and must not be passed on to, the general public in the United Kingdom. The communication of this announcement as a financial promotion may only be distributed to and is only directed at (i) persons who are outside the United Kingdom or (ii) investment professionals falling within Article 19(5) of the Financial Services and Markets Act 2000 (Financial Promotion) Order 2005 (the "Order") or (iii) high net worth companies, and other persons to whom it may lawfully be communicated, falling within Article 49(2)(a) to (d) of the Order (all such persons in (i), (ii) and (iii) above together being referred to as "Relevant Persons"). Any invitation, offer or agreement to subscribe, purchase or otherwise acquire such securities will be engaged in only with, Relevant Persons. Any person who is not a Relevant Person should not act or rely on this announcement or any of its contents. PROFESSIONAL INVESTORS ONLY – Manufacturer target market (MIFID II product governance) is eligible counterparties and professional clients only (all distribution channels). No PRIIPs key information document (KID) has been prepared as the bonds do not constitute packaged products and will be offered to eligible counterparties and professional clients only.
IMPRINT IuteCredit Finance S.a.r.l. 14, rue Edward Steichen 2540 Luxembourg Luxembourg www.iutecredit.com