Embed Size (px)
Citation preview
iullrttn nf tQr llluittrrntty of ~iuurnnta
ENGINEERING EXPERIMENT STATION
0. l\1. LELAND, Director
BULLETIN NO. 7
MANIFOLD PHENOMENA IN INTERNAL COMBUSTION ENGINES
BY
KALMAN J. DEJUHASZ
Vol. XXXIII No. 45 October r7, rg3o
MINNEAPOLIS
Entered at the post-office in Minneapolis as second-class matter Minneapolis, Minn_
Acceptance at special rate of postage provided for in E,e:::tion r 103,
Act of October 3, 1917, authorized July rz, rgrS

\1\ \\L
NOTE
The experiments described in this bulletin were performed in the Experimental Engineering Laboratories of the College of Engineering and Architecture at the University of Minnesota by Professor Kalman J. DeJuhasz/ while an instructor in mechanical engineering at the University of J\1innesota.
B. J. RoBERTsoN, Associate Professor of Internal Combustion Engines
1 Assistant professor, Pennsylvania State College, State College, Pa.
613720
CONTENTS Page
Introduction
The experiments Pressure variation in the intake manifold as shown by indicator cards . . . 14
Pressure drop caused by the carburetor \Tenturi . . . . . . . . . . . . . . . . . . . . . . . 16 \V ork expended in the exhaust and intake process 17
Determination of flow of gas through manifolds Small pressure differences . . . . . . . . . . . . . . . . . . . . . . . . . . . . . . . . . . . . . . . . . . . . 18
The equivalent orifice area of a system of orifices . . . . . . . . . . . . . . . . . . . . . . 19
The equivalent orifice of a poppet valve ............. ·. . . . . . . . . . . . . . . . . . . 21
The equivalent orifice of a manifold . . . . . . . . . . . . . . . . . . . . . . . . . . . . . . . . . . 22
Correction for change of density assuming isothermal expansion . . . . . . . . 22
Intake and exhaust under a given pressure difference, assuming adiabatic expansion . . . . . . . . . . . . . . . . . . . . . . . . . . . . . . . . . . . . . . . . . . . . . . . . . . . . . . . . 23
Effect of intermittent flow . . . . . . . . . . . . . . . . . . . . . . . . . . . . . . . . . . . . . . . . . . . . 25
Methods of computing the low press:tre card of an internal combustion engine
Conclusions
Bibliography
Plate
I.
II.
III.
I\T.
\T.
\TI.
\TIL
\Till.
IX.
X.
XI.
XII.
XIII.
XI\!.
X\T.
CUR\TES AND CHARTS
Intake system-Engine D ......................................... .
Intake system-Engine P ......................................... .
Intake system-Engine W ........................................ .
Actual indicator cards-Engine D ................................. .
Actual indicator cards-Engine D ................................. .
Actual indicator cards-Engine P ................................. .
Actual indicator cards-Engine W ................................ . Mean intake manifold pressure-Engine W ........................ .
Pressure drop in intake manifold (isothermal conditions) ........... .
Efflux curves .................................................... .
Pressure drop at constant specific volume ......................... .
Compression and intake pressure ( calculated)-Engine D .......... .
Light spring diagram (calculated)-Engine D ..................... .
Light spring diagram (calculated)-Engine D ..................... .
Intake pressure curves (calculated)-Engine W .................... .
27
38
39
4
5 6
10
II
12
13
18
24
26
29
31
32
35 37
Vl CONTENTS
ILLUSTRATIONS
Figure Page
I. Indicator as mounted on Engine P 8
2. Indicator as mounted on Engine W. . . . . . . . . . . . . . . . . . . . . . . . . . . . . . . . . . . . 9
3. Light spring card illustrating pumping losses . . . . . . . . . . . . . . . . . . . . . . . . . . 17
4· Orifices in parallel . . . . . . . . . . . . . . . . . . . . . . . . . . . . . . . . . . . . . . . . . . . . . . . . . . 19
s. Orifices in series . . . . . . . . . . . . . . . . . . . . . . . . . . . . . . . . . . . . . . . . . . . . . . . . . . . . 20
6. Method of graphical solution for orifices in series . . . . . . . . . . . . . . . . . . . . . 20
7. Poppet valve orifice . . . . . . . . . . . . . . . . . . . . . . . . . . . . . . . . . . . . . . . . . . . . . . . . . 21
8. Graphical solution for discharge coefficient of poppet valve . . . . . . . . . . . . . 21
9. Graphical solution for change of density (isothermal change) . . . . . . . . . . 23
IO. Graphical construction of expansion line . . . . . . . . . . . . . . . . . . . . . . . . . . . . . . . 33
MANIFOLD PHENOMENA IN INTERNAL COlVIBUSTION ENGINES
INTRODUCTION
The object of the experiments described in the following report was to collect material for a study of the pressure phenomena attending the exhaust and intake processes in high speed engines and to evaluate data upon which the computation of the light spring card may be based.
Actual indicator cards were taken on several engines in the laboratories with the author's high speed indicator under different load and speed conditions, and the results were evaluated from different points of view.
The report contains a survey of methods used for the determina-tion of a light spring card for a given engine from the design data. Two original methods are described.
By comparison of the recorded diagrams with those computed, it is shown that the actual conditions can be determined with a fair degree of approximation. It is also made evident that the accuracy may be increased by collecting more experimental data from different types of engmes.
The mean effective pressure and thermal efficiency of an internal combustion engine of the four-stroke cycle type are influenced, to a great extent, by the dimensions of the exhaust and intake systems, together with the Yalve timing, since these factors determine:
I. How thoroly the cylinder is purged from the products of the preceding combustion.
2. How completely the cylinder is filled with fresh combustible mixture.
3· The amount of negative work expended in these two processes. The light spring card, giving as it does the volume and pressure
of the cylinder contents, provides means for a direct and complete computation of item 3 and partial computaticns of items I and 2. The temperature should also be known if it is desired to determine the weight of the cylinder contents.
A method of predetermining the light spring card-especially the intake line-from the design data alone, would be of great value to
2 MANIFOLD PHENOMENA IN INTERNAL COMBUSTION ENGINES
the engine designer because it would enable him to design his engine to conform with a desired performance.
At present, the design of manifolding and valve timing is largely a cut and try process based upon meager empirical data and assumptions as to mean valve areas, mean speeds through valves, manifolds, etc. The theory is in a rudimentary stage and reliable experimental data are scarce. Briefly, the situation is unsatisfactory from a scientific engineering standpoint.
This is clue to the complexity of the phenomena occurring during the exhaust and intake strokes which are even less accessible to accurate theoretical investigation than the compression and expansion strokes. During compression and expansion the weight of the cylinder contents may be considered constant, but during the inlet and exhaust periods it undergoes a change due to the flow of gases between the varying cylinder volume and the manifolds. Both the pressure differences producing the flow and the valve areas through which it takes place are changing. The temperatures and specific volumes are also changing between wide limits on account of the variation in pressure and the heat interchange between the cylinder walls and the gases entering or leaving. Furthermore, the inertia of the moving gas column in the exhaust and intake pipes introduces pressure oscillations there, which again react on the pressure and specific volume of the cylinder contents.
To formulate a theory which takes all of these changes fully into consideration presents well-nigh insurmountable difficulties. Simplifying assumptions are necessary and actual experiments required to ascertain whether the errors introduced by the simplifications are permissible or not.
Until recently, the experimental investigation presented serious difficulties, owing to lack of pressure measuring instruments suitable for high speed use. These difficulties have been overcome, however, in the past few years by several types of pressure indicators which make it possible to take indicator cards with satisfactory accuracy and convenience.
The present study does not result in the development of a complete theory for the dimensioning of valves and manifolds. The author believes, however, that the experiments and theoretical investigations made represent a modest contribution towards a better under-standing of the phenomena in question.
MANIFOLD PRESSURE VARIATIONS 3
THE EXPERIMENTS
The following engines were used in the experiments: I. Engine D, a Delco one-cylinder engine. This engine was loaded
by a direct connected electric generator and was not arranged so that the torque and speed could be changed readily. For this reason, only full load and no load conditions could be investigated. Nevertheless, the results obtained form a valuable portion of our investigations because in a one-cylinder engine there is no interference from the exhaust and intake of other cylinders.
2. Engine P, a Packard twelve- (double six) cylinder aeronautical engine, loaded by its propeller. This did not afford the desired flexibility, for only one speed could be obtained at full throttle. Yet it seemed desirable to investigate this engine in order to study the interference of the intake of other cylinders upon the intake pressures of any one given cylinder using the same manifold. The condition here involved a maximum number of cylinders as compared to the Delco single cylinder.
3· Engine W, a Willys-Knight, a four-cylinder engine, loaded by a Sprague electric dynamometer. The load and speed conditions could be varied over a wide range, and the experiments performed on it form the basis for most of our calculations. Since it had a sleeve valve with an unobstructed port opening, there was no uncertain coefficient of discharge to be taken into account, as in the case of a poppet valve engine.
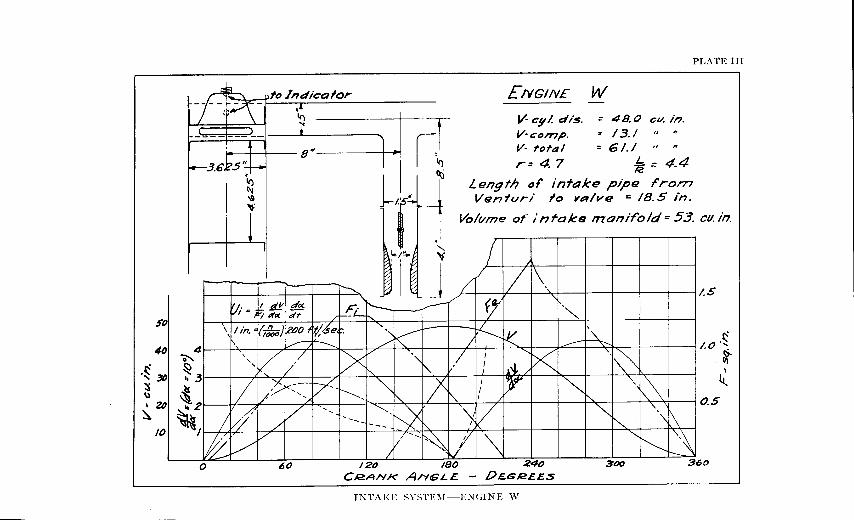
The design data of these engines are given in the Plates I, II, and III. The main dimensions of the cylinder, valves and ports, manifolds, and carburetor Venturi are given. The same plates also give, on a crank angle basis :
1. The valve lift in inches, (h), for intake and exhaust. 2. The gross valve areas, ( F 1 and Fe). 3. The effective valve areas, ( F 1 eff. and Fe eff.), calculated. See page 20.
4· The piston displacement, (V), in cu. in. 5. The rate of piston displacement per 10 degrees, dV /d a:, in cu. in. 6. The speed of an incompressible fluid through the intake valve at 1000
r.p.m., in ft. per sec. 7. The speed of an incompressible fluid through the carburetor Venturi, in ft.
per sec. .
It was intended to supply as complete information as possible with regard to the characteristics of the engines, in order to enable other investigators to evaluate the results of the experiments from points of view other than those of the author.
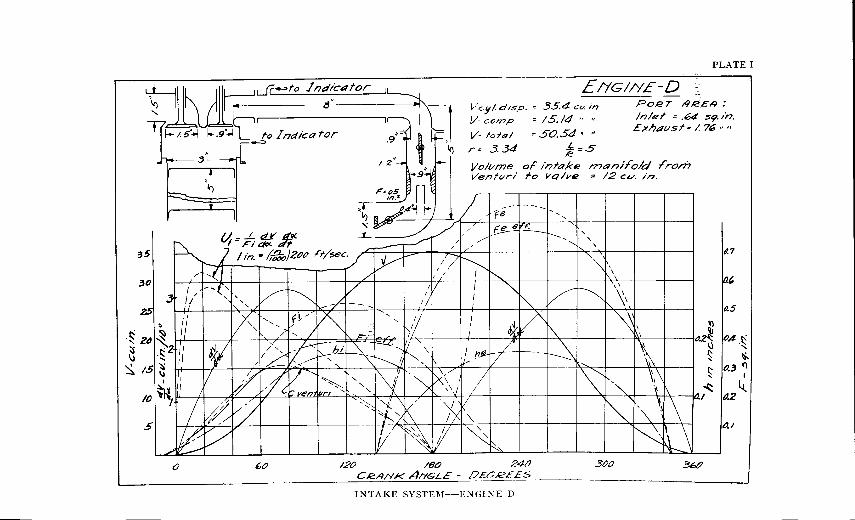
PLATE I
£1YGIN£-D - 35.4 cv. in ~to Jndicettor f'cyf.d,sp. : 15.14 ,, ..
CJb JC " V co~p 054 • "
~ ~ ll •5o. ~~ 3 34 .e ·rold !'rom ., r• . /??Pn/T< . ' ~~~~ ~ t' J: dicator of' infake • 12 cu. m. 11,.~ 9·~ to n Volvme. 1- va /ve
Po,er /I.e£~ :
35
.301
251
51
V Iota/ fr_ = 5 -
f-.;.5.., . ...=. Ventun o
"~··. :': t /nle f = .64 s9. in. Exhavsf=- 176""
r , . It)
I dV' A_«.
t.h = F-: ~ d't' .r~ /sec. I ' /n )2tJtJ . '/= I in ... f;Ooo.
0 60 120 160 240 ~()
C.eA/'IK A/YGL£ - OEGR.££5
INTAKE SYSTEl\1-ENGI~E D
1.7
~' P.5
~ d~ dAr-:
0 ·~
~ ~ ~ 0..3 V) ' I
~ 4_ .. / tJ.2
0.1
3M
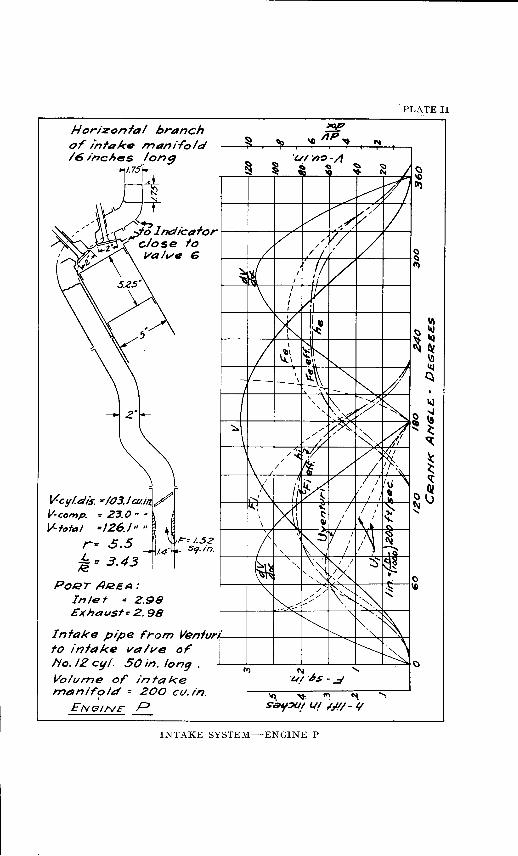
~;;:,~~s. :~:~~~.:-/~ V-fafa/ •/26./ 11
"
r .. r 5 ~=-1..52 v · ~,4 .. s9. in.
~:: 3.43
Po.er AI2EA:
Inlet :: Z.98 Exhavst= 2. 98
Intake pipe f'rom Venlvr. to inte:~ke valve of' lio. 12 cy!. 50 in. lon9 . Volvn7e of' in fake nu:~nlf'tpld = 200 cv. in.
ENGINE" p
PLATE II
~ ~ "GI.I ,~ -A ~
~ J ... (t ~ 'to
./~ V; /v v v""/ 1/ .....,/, t;;./
v /;- ~/ v /
~~ I 1/ v I I,
'\ I
~ I I I
~ 1: ., ~~~
I I
f.:~ ~\ _v __ I ~\ ""' ~ __ ,
""-I ', \ (:\ t"-~~
' ' r--/ ,.:,_~
-::::... ..... /;:x_' r~->( kff \ /~,;
\ / / .( If v~ w / / ;' ~~
.,X II .... / // I\) "\
li ~ ! !.. I I , ..... ,
M "' I I
~ I I I ~ / I\~ ~ ' ~
/, \~ 1Y / /~ I~ I ~
~~ \' k?< :$" ~ ', :\j ',~, /
"' /::-~~~ ~ -~
bx-=- :.....: ' ~/
"~ ' ~-"· ~ !'--.._
----~ ~ l'f) c.,. ' -~;·#s -.d
ltl. 't. Ctl "\ ........
S"B'f:JU_I Ll! I.P.I- ~
INTAKE SYSTEM-ENGINE P
$0
40
·~ 30 ~ \)
I ZD ~
/0
~ \9 'f
0 60
PLATE III
(\)
£NGIN£ W
v- c!/1. dis. = 48.0 cv. in. V·co~p. = 13.1 " " v- total = 61.1 r= 4. 7 ~ = 4.4
Length "' intake pipe f'rorn Venturi ~o valve = 18.5 in.
Vo/vme ot intaks manif'old =53. cu. in.
tltJ .-.--
120 180 240 3IJO
CICAIVI< ANGLE. - 1/E.G/2££.5
INTAKE SYSTE\T-ENGINE W
1.5
/.0 { ti
.11) I
4. 0.5
360
MANIFOLD PRESSURE VARIATIONS 7
The experiments were performed in such a manner that the pressures inside the cylinder, and, also, the static pressures in the intake manifold close to the valve, were recorded with the aid of a DeJuhasz indicator. This apparatus takes records of periodically recurring pressure phenomena, using a point-by-point method, each point on the pressure curve being taken from a different cycle. A valve element, positively driven by the engine under test, is interposed between the engine cylinder or other volume, where the pressures are being investigated, and a conventional indicator or other pressuremeasuring apparatus. The valve opens once in each cycle at a predetermined phase, for the duration of a very small fraction of the cycle. The pressure existing at the tested phase is recorded by the indicator. By changing the phase relation of the valve element of the indicator with respect to the cycle to be tested, the pressure at each phase of the cycle can be determined. The construction of the apparatus allows the pressures to be taken on either a crank angle or a piston stroke basis. For further description of this apparatus, reference is directed to the following publications :
The Automobile Engineer, May, 1922; Sept., 1925; Nov., 1925; Oct., 1926.
Automotive Industries, Feb. 7, 1924.
A. W. Judge, The Testing of High Speed Internal Combustion Engines.
P. M. Heldt, The Gasoline Engine, 1926.
The main advantage of this apparatus over other high speed indicators, which are based upon optical or electrical principles, lies in its easy operation and rugged construct1on, by virtue of which it is well adapted to commercial use. A complete diagram may be taken in about 30 seconds and is ready for immediate evaluation.
The arrangement of the experimental apparatus used on Engines P and W is shown in Figures I and 2.
A number of cards were taken with a heavy spring to show the general characteristics of the complete diagram. The majority of the cards shown are light spring diagrams, taken either on a piston stroke or a crank angle basis. Some of the cards were taken with the ignition shut off.
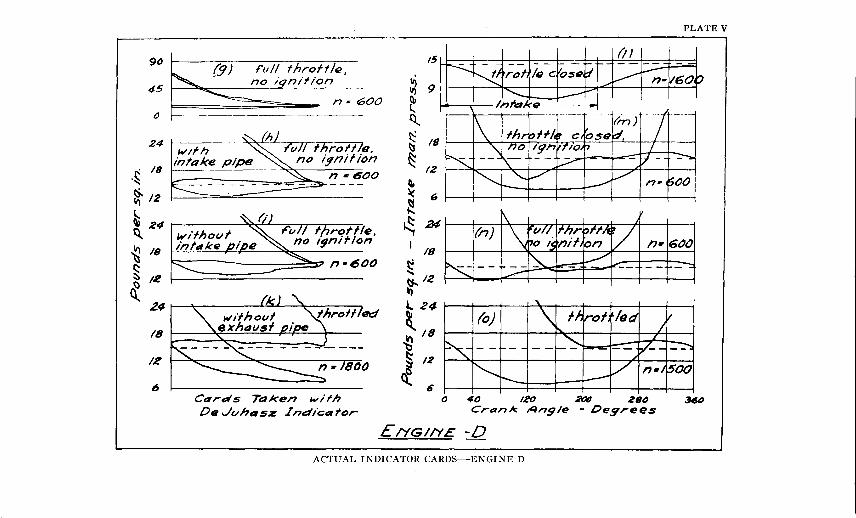
The cards are shown on Plates IV, V, VI, and VII. The spring scale and the speed and load conditions are noted on each card so that no further explanatory remarks are necessary, and we may confine ourselves to the discussion of some of the findings.
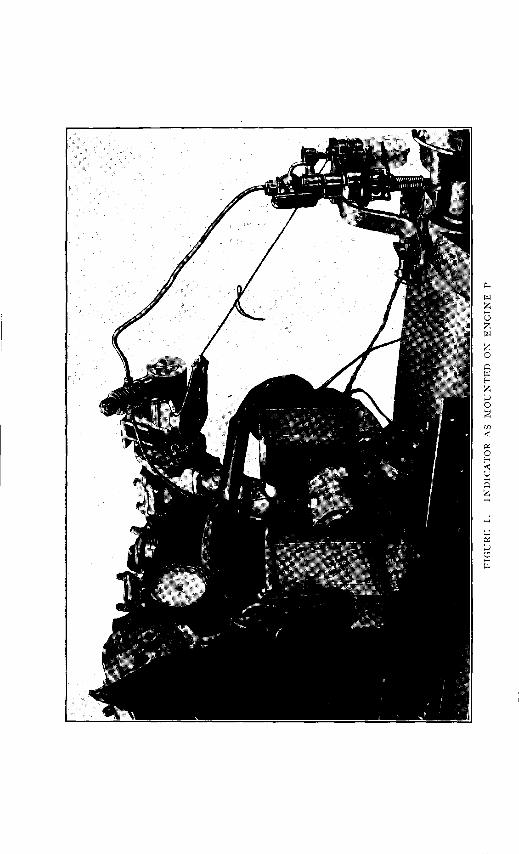
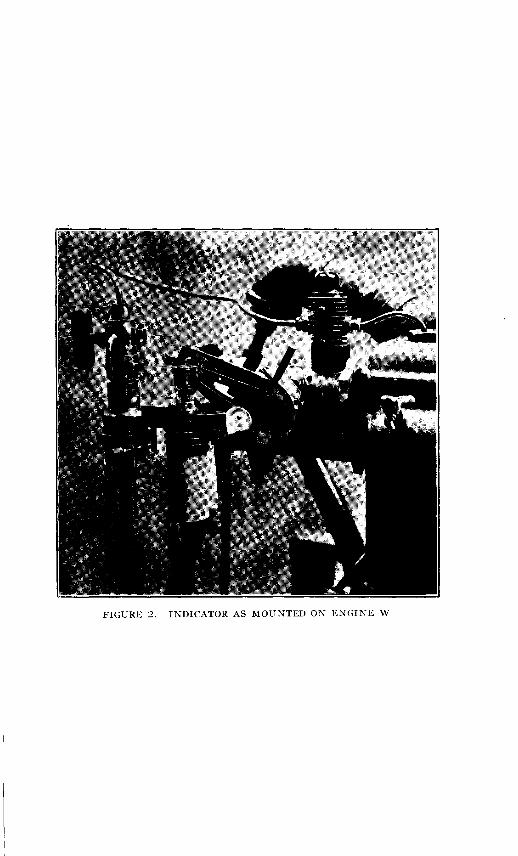
FIGURE 2. INDICATOR AS MOUNTED ON ENGINE W
180
13.5
90
45
·~ 0
~ It) 24
~ 18 ct
~ 12
§ ~ 24
18
12
----
(a)
throttle
n= 1400 Ct:7rds Taken with OeJvhasz Indicafor
PLATE IV
~ 15.
~ «::( /4.5
~ ~ 14. ~ ~ 13.5 ~
~~~- - -- -; v_\ ...c=o.. - ---- v ~ r-
i \ r-( lak. e I _j (d) v
\ / Full thr off e ~ n~ V20d7
~ 24 Ql
~ 18 ~
~ ~ 12
n=-/2(:)0
·~ ~
"' 1.5. 1 1 1 1 I I i I /,.,I I 4.. Ql tt
~ § ~
/4 1 '\\\\ t~~ ~r 11· -·rr-=:1_ --21-~,. 1
40 120 zoo 280 3~0 Crank An9/t12- Degrees
E. IYG/1'1£ -D
ACTUAL INDICATOR CARDS-ENGINE D
90
45
()
24
. 18 ·~ ~ 12
~ 24 ~
~ IIJ
§ 'I! ~ /.
~ 24
18
12
6
n« 600
_ :::..:;;.,.,_ n •600
k:: ~ n•600
Cetrds Taken wi!h OeJuhasz Indicatcr
PLATE V
15
~ 9' ~ t I lm'akfl · . ~ i 18 tK l~!'l1!;Qsel7)1 J J t;s
~ 12
' ~ 6
~ ~ 24 1 1 . . 1 \ bo. n I 1 > . I 1 • >:l /I I 1
18
~ ' tf.. 12 ., l24
~ /8
~ § IZ
~ 6 a 4() 120 .2rM zsa ~
CranJc. Angle - Oegrees
E!YGIIYE -D
ACTUAL INDICATOR CARDS-ENGINE D
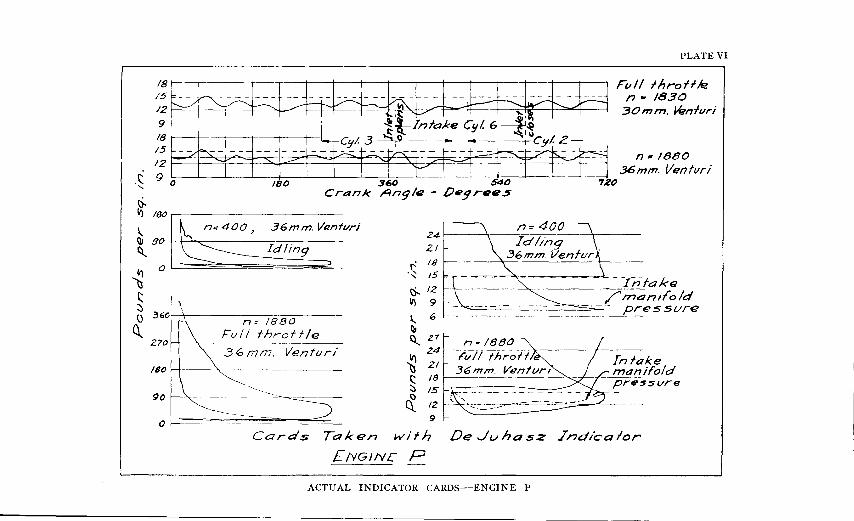
PLATE VI
18~--=r-T= ~:fl'f~bttHliF~ Fv/1 fhroff/e 18 ' ~ .p.~ nw/830
15 EEfjj---- -- -- ~Lc;. 3~Inhkf c;yl. 6~~ 30ml77. ~nfvri 12 - -~----_!I_--'-~ .. ~ ~ti~::::s:r::t=~~~-*~-~-~-- - , Cy!. z-.1:: 9 :,-- - - - - - -- -' 1so Y - - n • 1880
. 3~ ~ Crank An9
/e _ [) 540 .36mm. Venturi 180 .. :1r•e.s 720
' Ill go ~
~ 0
1:: ~ () .360
Q 270
/80
90
0
36mm. Venlvri
Idling
~ ,'
n =- 400 24~--~r---.-~------r------
ZI • 18 ~----~r=-=~:__:__-=-------t----
·~ ,s - -rn-fa k~ ().. 12 ,/" n?anif'old ~ 9 ------ pressure
r\ n:: 1880 Full throff/e
1.. b t----------
Ill ~ Z7
~ 24 ~~rv~/~/;~lh~r-o-l~l~------~--~~n-l-ake '\'S Zl ma!!_ifold ~ 18 pressvre ~ 6 -0 ~ 12 -
9
""\: 3 0 rnm. Venturi
~~~-- ---
~------------~ =s Cards Taken with
£/YGIN£ p De Juhasz Jnd/calor
ACTUAL. INDICATOR CARDS-ENGINE P
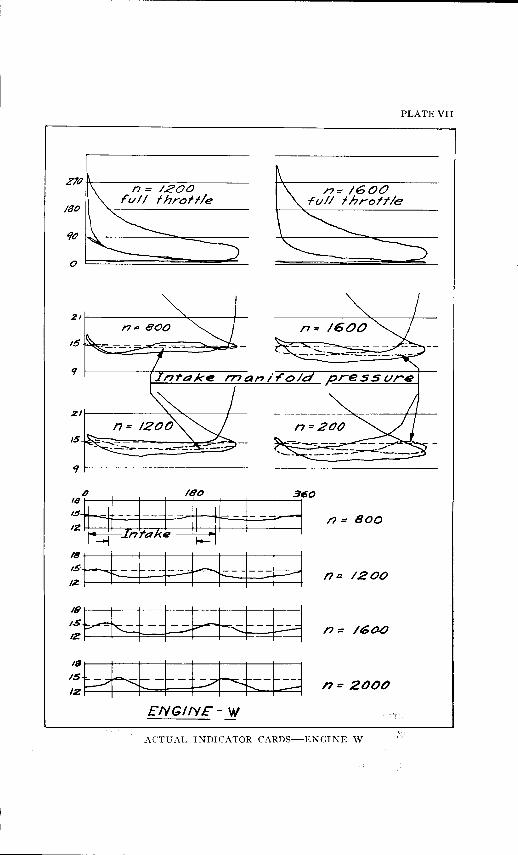
PLATE VII
n= Boo
17= 1200
n = /6tUJ
n = 2000
ENG/IV£- .J! l,·r:
ACTUAL INDICATOR CARDS-ENGINE W
14 MANIFOLD PHENOMENA IN INTERNAL COMBUSTION ENGINES
PRESSURE VARIATION IN THE INTAKE MA~IFOLD
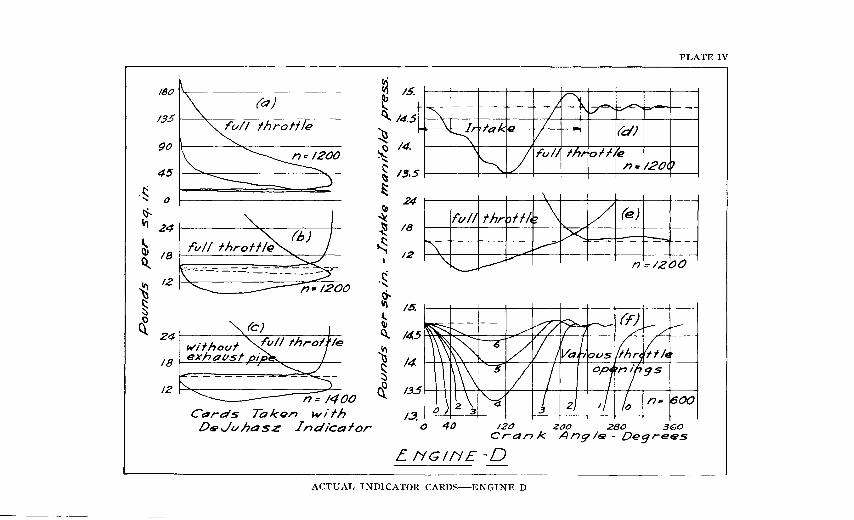
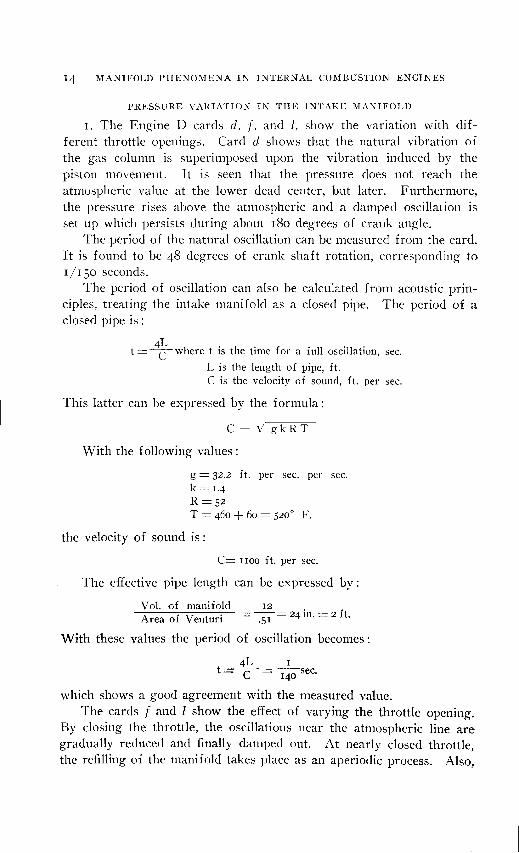
r. The Engine D cards d) f) and l) show the variation with different throttle openings. Carel d shows that the natural vibration of the gas column is superimposed upon the vibration induced by the piston movement. It is seen that the pressure does not reach the atmospheric value at the lower dead center, but later. Furthermore, the pressure rises above the atmospheric and a clamped oscillation is set up which persists during about I8o degrees of crank angle.
The period of the natural oscillation can be measured from the card. It is found to be 48 degrees of crank shaft rotation, corresponding to I/ I 50 seconds.
The period of oscillation can also be calculated from acoustic principles, treating the intake manifold as a closed pipe. The period of a closed pipe is :
t = 4~ where t is the time for a full oscillation, sec.
L is the length of pipe, ft. C is the velocity of sound, ft. per sec.
This latter can be expressed by the formula :
C=V'gkRT
With the following values:
g = 32.2 ft. per sec. per sec. k= I.4 R=52 T = 460 + 6o = 520 o F.
the velocity of sound is:
C= I IOO ft. per sec.
The effective pipe length can be expressed by:
Vol. of manifold 12
Area of Venturi = ~= 24 in. = 2 ft.
With these values the period of oscillation becomes :
4L I t=c-=
140 sec.
which shows a good agreement with the measured value. The cards f and l show the effect of varying the throttle opening.
By closing the throttle, the oscillations near the atmospheric line are gradually reduced and finally damped out. At nearly closed throttle, the refilling of the manifold takes place as an aperiodic process. Also,
MANIFOLD PRESSURE VARIATIONS IS
as is to be expected, the minimum value of the pressure decreases and reaches a value of about one half the atmospheric pressure when the throttle is nearly closed.
Other investigators have found empirically that, by increasing the length of the intake tube, the \·olumetric efficiency can be increased. (SeeR. Matthews and A. W. Gardiner, N. A. C. A., Techni~al Note No. I8o.) The cards described above supply the experime,n~~l 1 proof of such a possibility, and it would seem to be of inter~st t,o explore the effect of intake pipes of different lengths ~ith th~ in,dicator, in order to find the optimum proportions for different,spe~ds. , '
2. The Engine P cards show the pressure variation in the intake manifold close to the intake valve of cylinder No. 6, right side. Two Venturi sizes, one of them 30 mm., the other 36 mm., diameter, were investigated. ln the latter case, the pressure was also measured by means of a directly attached mercury column. This method of using the mercury column has been used frequently by other investigators and gives, of course, a certain mean pressure value.
These cards point out two salient facts. One is that the mean manifold pressure gives imperfect information as to the pressure conclition in the manifold. The difference between the maximum and minimum pressures is about 4 pounds per square inch. The other fact is that pressure curves given by the two Venturi agree in form but differ in magnitude. The pressure line corresponding to the smaller Venturi lies below that of the larger Venturi. These curves indicate clearly that the retransformation of velocity energy is far from being complete, even in the case of the comparati \·ely well-formed carbttretor Venturi used in Engine P.
3· The Engine W cards shO\v the intake manifold pressures at a number of speeds; i.e., 8oo, I200, I6oo, and 2000 r.p.m.
These show very clearly that the highest pressure in the intake manifold occurs later in the cycle, as the engine speed increases. The maximum pressure obtained also increases with the speed up to a certain point. In the present case, it reaches its maximum value, about I lb. per sq. in. above atmosphere, at about r6oo r.p.m. The maximum pressure in the intake manifold occurs 16 degrees after dead center at 8oo, and 40 degrees at I6oo r.p.m.
Altho these facts have been investigated by others, the experimental demonstration and the measurement of the actual values may be of interest.
It would be worth while to find the exact relation between the point where maximum intake manifold pressure occurs and the design
I6 MANIFOLD PHENOMENA IN INTERNAL COMBUSTION ENGINES
data of the engine. This would give the optimum timing of the intake valve from the standpoint of volumetric efficiency. The few experiments performed by the author do not, however, give a sufficient basis for the formulation of a quantitative relationship. This would require a large number of experiments.
PRESSURE DROP CAUSED BY THE CARBURETOR VENTURI
If there were no losses, the sum of the pressure energy plus velocity energy (heat energy assumed constant) should be the same throughout the whole intake system, in accordance with Bernouilli's theorem. Under actual conditions, part of the energy is dissipated in consequence of change of direction, of eddies, and wall friction.
The theoretical pressure drop in a frictionless fluid, when part of t~e pressure is transformed into velocity. can be expressed:
U 2 I I ~p =---zg · -v- · 144
Where U is velocity, ft. per sec. ~p is the pressure drop, lbs. per sq. in.
g is 32.2 ft. per sec. per sec. v is the cu. ft per lb. of fluid, about 13 for atr at average
atmospheric temperature and pressure.
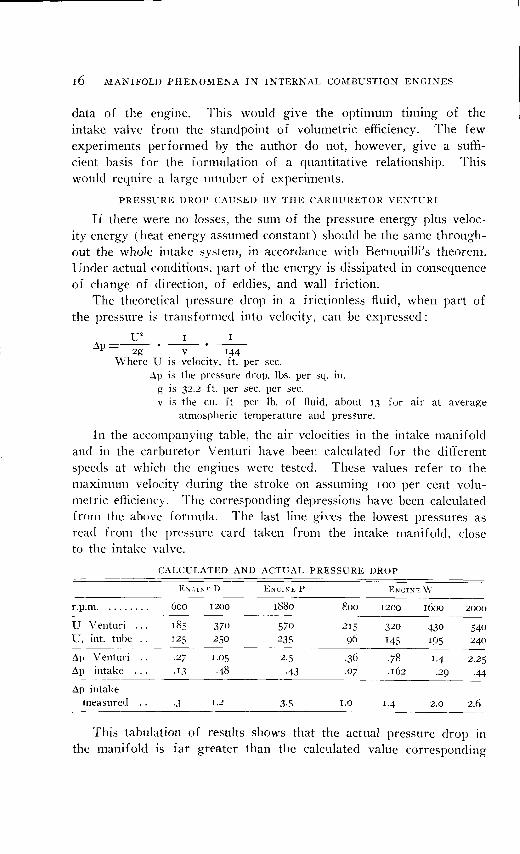
In the accompanying table, the air velocities in the intake manifold and in the carburetor Venturi have been calculated for the different speeds at which the engines were tested. These values refer to the maximum velocity during the stroke on assuming IOO per cent volumetric efficiency. The corresponding depressions have been calculated from the above formula. The last line gives the lowest pressures as read from the pressure card taken from the intake manifold, close to the intake valve.
CALCULATED AND ACTUAL PRESSURE DROP
Elli!:IN'' D ENGINE p ENGINE\\'
r.p.m. 0 0 •••••• 6oo 1200 188o E'oo 1200 16oo 2000
u Venturi ... ISS 370 570 215 320 430 540 U, int. tube I25 250 235 96 145 195 240
~[! Venturi .. .27 I. OS 2.5 ·36 .78 I.4 2.25 ~p intake . IJ -48 ·43 .07 .162 .29 ·44 ~p intake
measured .J I ,, 3-5 I.O 1.4 2.0 2.6
This tabulation of results shows that the actual pressure drop in the manifold is far greater than the calculated value corresponding
l
PRESSURE DROP THROUGH VENTURI
to the air velocity in the intake pipe and even exceeds that corresponding to the Venturi velocity. From this it may be concluded that the retransformation of velocity into pressure, while the combustible mixture passes through the Venturi into the intake pipe, takes place with low efficiency. Or, in other words, any pressure regained is lost again owing to the change of direction of the flow in the ·beuds, and friction of the manifold walls. It appears that taking simultaneous pressure readings at different points alongside the intake manifold would furnish valuable information as to where the pressure losses occur and would give a basis for the development of more efficient manifolds.
WORK EXPENDED IN THE EXHAUST AND lNTAKE PROCESS
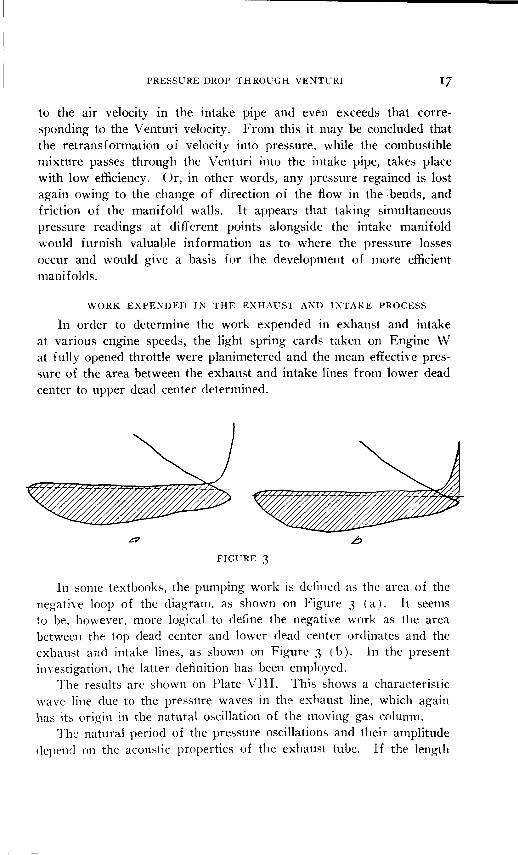
In order to determine the work expended in exhaust and intake at various engine speeds, the light spring cards taken on Engine W at fully opened throttle were planimetered and the mean effective pressure of the area between the exhaust and intake lines from lower dead center to upper dead center determined.
FIGURE 3
In some textbooks, the pumping work is defined as the area of the negative loop of the diagram, as shown on Figure 3 (a). It seems to be, however, more logical to define the negative work as the area between the top dead center and lower dead center ordinates and the exhaust and intake lines, as shown on Figure 3 l b). In the present itwestigation, the latter definition has been employed.
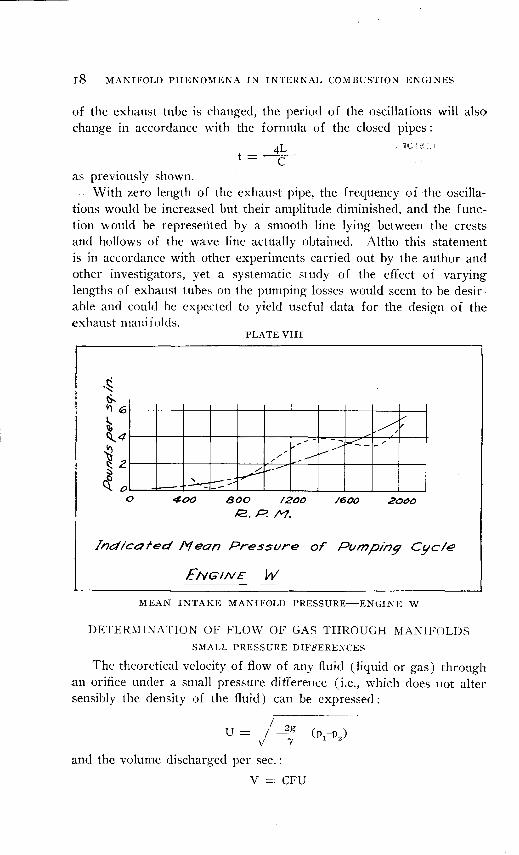
The results are shown on Plate VIII. This shows a characteristic wave line clue to the pressure waves in the exhaust line, which again has its origin in the natural oscillation of th~ moving gas column.
The natural period of the pressure oscillations and their amplitude depencl on the acoustic properties of the exhaust tube. If the length
-------------------------------------------------------------l
18 MANIFOLD PHENOMENA IN INTERNAL COMBUSTION ENGINES
of the exhaust tube is changed, the period of the oscillations will also change in accordance with the formula of the closed pipes:
4L t = -c--
f(~ it:'
as previously shown. , With zero length of the exhaust pipe, the frequency of the oscilla
tions would be increased but their amplitude diminished, and the function would be represented by a smooth line lying between the crests and hollows of the wave line actually obtained. Altho this statement is in accordance with other experiments carried out by the author and other investigators, yet a systematic study of the effect of varying lengths of exhaust tubes on the pumping losses would seem to be desirable and could be expected to yield useful data for the design of the exhaust manifolds.
PLATE VIII
-~j: -- -- --~-""-- -
/ -- ----~---/
v ~-----
- -~ ~:-:::::. 4otJ 800 1200 /600 20t>O
e. P.M.
Indicated /1ean Pressure or Pumping C!Jcle
ENGINE w MEAN INTAKE MANIFOLD PRESSURE-ENGINE W
DETERMINATION OF FLO\V OF GAS THROUGH MANIFOLDS
SMALL PRESSURE DIFFERENCES
The theoretical velocity of flow of any fluid (liquid or gas) through an orifice under a small pressure difference (i.e., which does not alter sensibly the density of the fluid) can be expressed:
I 2g u = I-- (p -p) v 'Y 1 2
and the volume discharged per sec. :
V = CFU
-~I
GAS FLOW THROUGH MANIFOLDS
The following notations are used :
U is the velocity of flow, ft. per sec. g is the acceleration of gravity, 32.2 ft. per sec. per sec. p1-p2 is the pressure difference, lbs. per sq. ft. 'Y is the density of fluid, lbs. per cu. ft. C is the coefficient of discharge. F is the area of the orifice, in sq. ft.
I9
The value of C is generally less than unity; in the case of a wellrounded orifice, it is I.
In hydraulic calculations, the concept of "equivalent orifice" is widely used, but, to the author's knowledge, it has not been applied to manifold problems.
THE EQUIVALENT ORIFICE AREA OF A SYSTEM OF ORIFICES
The equivalent orifice is the area of a well-rounded orifice, the volume discharge of which is the same as that of a giyen orifice or system of orifices. It can also be expressed in the case of a single orifice:
CF =Fe
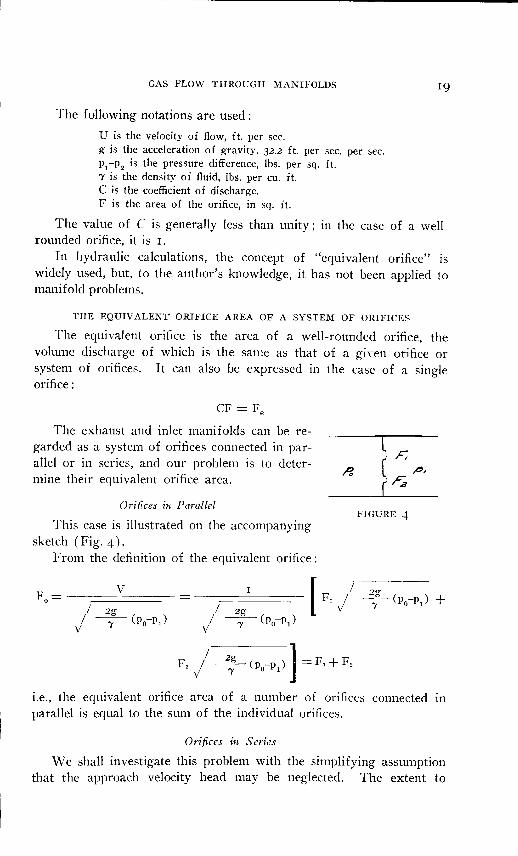
The exhaust and inlet manifolds can be regarded as a system of orifices connected in parallel or in series, and our problem is to determine their equivalent orifice area.
Orifices in Parallel
This case is illustrated on the accompanying sketch (Fig. 4).
From the definition of the equivalent orifice :
FIGURE 4
F = e v
[ F, ,/ 2~- (p,-p,) +
F, / 2.; (p,-p,) ] = F, + F,
i.e., the equivalent orifice area of a number of orifices connected m parallel is equal to the sum of the individual orifices.
Orifices in Series
We shall investigate this problem with the simplifying assumption that the approach velocity head may be neglected. The extent to
20 MANIFOLD PHENOMENA IN INTERNAL COMBUSTION ENGINES
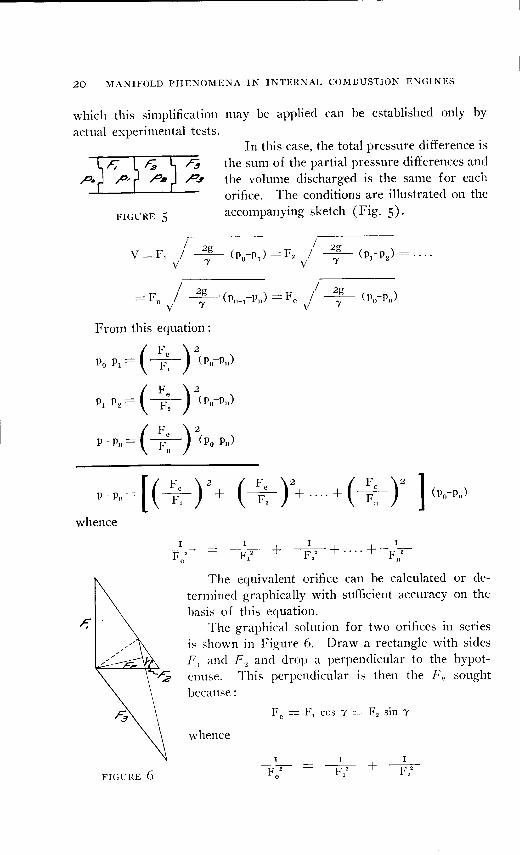
which this simplification may be applied can be established only by actual experimental tests.
FIGURE 5
In this case, the total pressure difference is the sum of the partial pressure differences and the volume discharged is the same for each orifice. The conditions are illustrated on the accompanying sketch (Fig. 5).
I 2 g I~ =Fn ,/ ---'-'Y~(pn-1-pn) =Fe j 'Y (po-Pn)
From this equation:
P,-P, = ( ~: ) 2
(P,-Po)
P,-P, = ( ~-: r(p,-p")
p -p" = ( ~: ) 2(p,-p")
[ ( F ) 2 ( F )2 ( F )2 ]
P -Pn = +, + +. + · · · · + +, whence
FIGURE 6
I I I I
I\: F/ + ~+····+-F~ 2 n
The equivalent orifice can be calculated or determined graphically with sufficient accuracy on the hasis of this equation.
The graphical solution for two orifices in series is shown in Figure 6. Draw a rectangle with sides F
1 and F 2 and drop a perpendicular to the hypot
enuse. This perpendicular is then the Fe sought because:
Fe = F 1 cos 'Y = F 2 sin 'Y
whence
I I
FT + FT
GAS FLOW THROUGH MANIFOLDS 2I
The equivalent orifice for any number of orifices can be obtained by repeating the process with the equivalent orifice thus found.
THE EQUIVALENT ORIFICE OF A POPPET VALVE
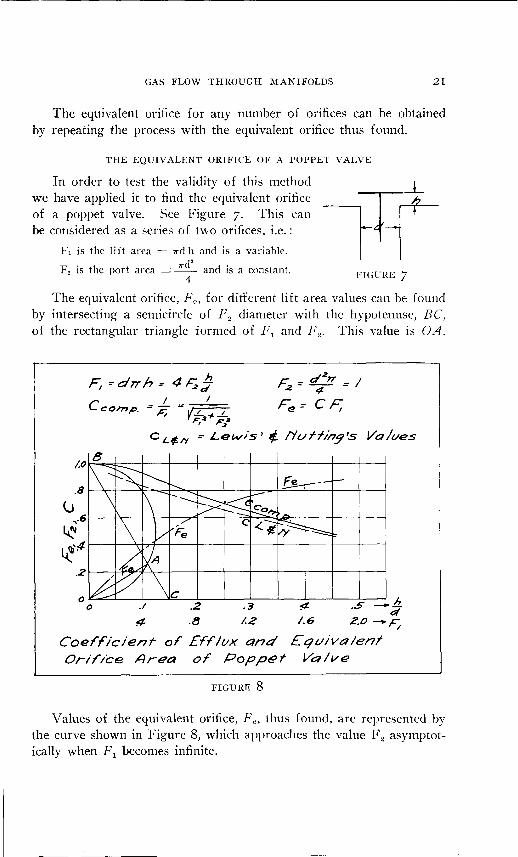
In order to test the validity of this method we have applied it to find the equivalent orifice of a poppet valve. See Figure 7· This can be considered as a series of two orifices, i.e.:
F1 is the lift area = rrd h and is a variable.
F . h rrd2 d . 2 ts t e port area = -- an ts a constant.
4 FIGURE 7
The equivalent orifice, Fe, for different lift area values can be found by intersecting a semicircle of F 2 diameter with the hypotenuse, BC, of the rectangular triangle formed of F 1 and F 2 • This value is OA.
(J
h F, ~drrh: 4F;;;;-t I
Cco1?7p. = F, =VL+ I
F/1 Fi'
~: ~2" =I
Fe: CF;
cl...¢1'1 =-Lewis' tf.. /'luffing's Valves
.8~~~~~~~~~-+---+~~=--r---r--~--~
~.6~~~~-+~--~---+--~~-a~~--~--~--~
~ lf!# .2~~~~~~--~---+---+---+---r---r--~--~
0 o .I .2 · 3 '!1- . .S - j
f1. .8 /.2 /.6 2.0-~
Coef'ficient of' £f'rlvx and £ qviva/ent Orif'/ce Area of' Popp~f Valve
FIGURE 8
Values of the equivalent orifice, Fe, thus found, are represented by the curve shown in Figure 8, which approaches the value F 2 asymptotically when F 1 becomes infinite.
22 l\IANIFOLD PHENOMENA IN INTERNAL COMBUSTION ENGINES
If we express Fe= CF11 then the discharge coefficient thus found can be represented as a function of the F 1 variable. If F 2 is chosen as unity, then the discharge coefficient is represented by AB because:
OA AB AB ---oc - ----oB
We have drawn up the discharge coefficients found experimentally by Lewis and Nutting on the same chart. (See Bibliography, p. 39·) The two curves show a fair agreement, altho the values found by experiment are lower throughout, owing, most probably, to frictional resistances which our calculations have not taken into account.
The results justify our assumption that the approach velocity head may be neglected, and show that the actual discharge is even less than that calculated by the method shown.
THE EQUIVALENT ORIFICE OF A MANIFOLD
The manifold contains a number of obstructions, such as the Venturi, throttle, and bends. If the equiYalent orifice area of each were known, then that of the complete manifold could be computed. Here is a wide field for research because actual test data are lacking.
From our limited number of tests, we arrived at the conclusion that the carburetor Venturi, as it is used in present clay carburetors, is a velocity-pressure transformer of very low efficiency, and any regain of energy is lost again in the subsequent turbulence of the flow, owing to bends and surface friction. Therefore, we assumed the Venturi throat area to be the equivalent orifice area of the manifold under fully opened throttle conditions. Even this assumption appears to be somewhat optimistic and gives too high discharge (or too small pressure drop) values.
CORRECTION FOR CHANGE OF DENSITY ASSUMING ISOTHERMAL EXPANSION
The pressure drop corresponding to a given velocity can be calculated from the following formula:
'Yl
During the expansion accompanying the pressure drop, heat is taken away, owing to the evaporation of the fuel, and heat is added by the conduction of the hot cylinder walls. The combined effect of both may nronuce any polytropic expansion curve under different engine con-
GAS FLOW THROUGH MANIFOLDS 23
ditions. In taking into consideration the effect of this heat interchange upon the density of the charge, the error is probably not great if an isothermal change of state is assumed. This appears to be justified on the ground of simplicity, and, all the more, because the pressure drop during the intake is generally not large enough to make the difference in the densities corresponding to the different polytropic expansions appreciable.
If an isothermal change is assumed :
and the above equation resolves to :
_P_I_ 'Yo
Po
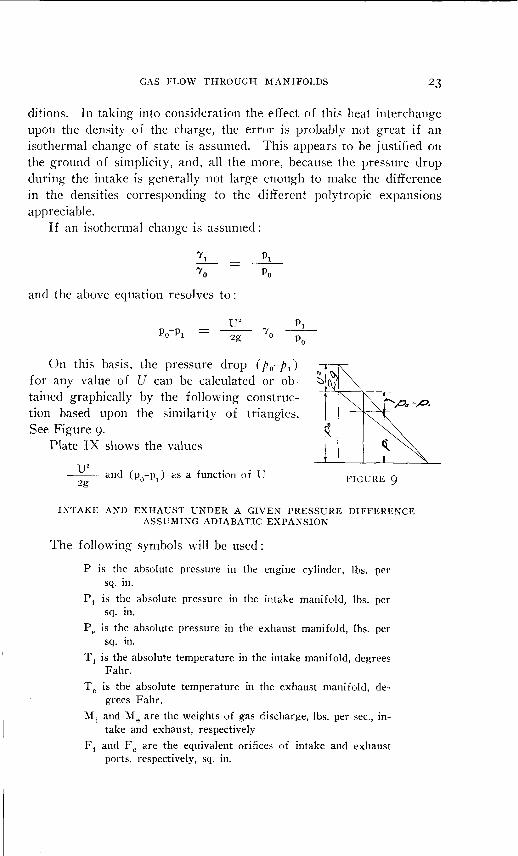
On this basis, the pressure drop (p 0-P 1 )
for any value of U can be calculated or obtained graphically by the following construction based upon the similarity of triangles. See Figure 9·
Plate IX shows the values
FIGURE 9
INTAKE AND EXHAUST UNDER A GIVEN PRESSURE DIFFERENCE ASSUMING ADIABATIC EXPANSION
The following symbols will be used:
P is the absolute pressure in the engine cylinder, lbs. per sq. in.
Pi is the absolute pressure in the intake manifold, lbs. per sq. in.
P e is the absolute pressure in the exhaust manifold, lbs. per sq. in.
T i is the absolute temperature in the intake manifold, degrees Fahr.
T e is the absolute temperature in the exhaust manifold, degrees Fahr.
M i and Me are the weights of gas discharge, lbs. per sec., intake and exhaust, respectively
F i and Fe are the equivalent orifices of intake and exhaust ports, respectively, sq. in.
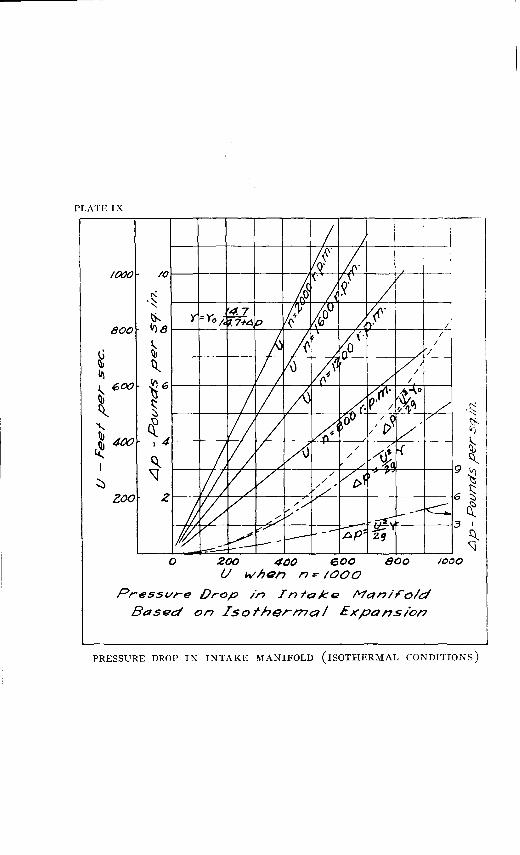
PLATE IX
Pr-essure Drop in Int-akfiil Manirold
.Based on Isothern?a/ Expansion
PRESSURE DROP IN INTAKE MANIFOLD (ISOTHERMAL CONDITIONS)
GAS FLOW THROUGH MANIFOLDS
Then for adiabatic flow, the following equations hold good (See :Vlechanical Engineering Handbooks by Marks and by Kent) when :
p > 0.53 pi'
p> I
0.53 P e 1
p < I 0.53 PC '
pi Mi =0.53Fi -----
VI~
VI (Pi-P)P
~--
v Ti
___ P __ ( Ppe )0.143 Me = 0.53 Fe
~--
v Te
( '; r·43 Assuming intake from, and exhaust into, the atmosphere, i.e.;
Pi = Pe = I4.7, the above equations can be brought to the following uniform expression :
Fe Me= 1.07 -----Y
~--v Te
On Plate X, the value of y for a given value of P can be read off directly, which greatly simplifies the calculations.
EFFECT OF INTERMITTENT FLOW
The above flow calculations refer to steady flow. The flow during exhaust and intake is, however, brought into being by the periodic movement of the piston, and is therefore not steady, but fluctuating. This flow can be characterized as a forced oscillation introduced by the piston, upon which the natural oscillations of the gas column are superimposed. Furthermore, the oscillations are influenced by the damping effect of the obstructions, heat interchange, and the interference of the events of one cylinder upon the other.
The computation of the fluctuations is difficult, but it has been done in some simple instances. (See H ort's cited work in the Bibliography
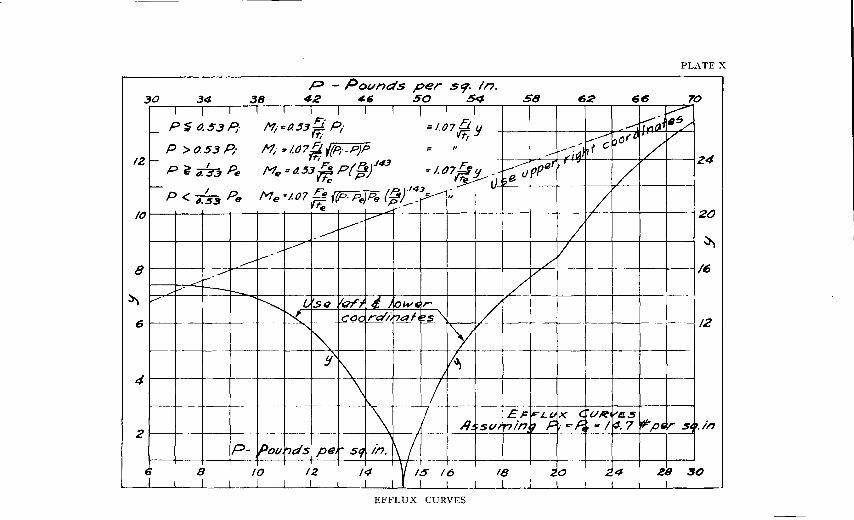
PLATE X
P - Povnds per Stf· ln . 30 34 38 42 ~~ 50 .54 58 62 645 ?0
I I I I I l I -, T 1 T r :_,..-
r- P~tJ..5.3P,· F:
=I.07fl !I ,....,.-"j r;;~1 .,'i M;=IJ..53'fi P; r,· Vt;
~ port~ /
P >0.53P; M;=I.07.Eiy(P,·-P)P = ,, --;;~J / 12 I- I 'ffi 143
~ pptJ' / Z4
P ~ 4.33 Pe Me=IJ..53f):PffJ)' "I.IJ7f,t!J / ~e u r- l"e ~t)
I Me '"/.07;;;, ({P-P.)Pe (~).!~y '~ P < 11.53 Pe / t"e -- --20 10 v /
-------
:_,..-' / ------
,.........-- I ~ ___.___.- / 8 ..................... // /6
...... ...-- ---~ v· ~ u ~Q 1(?rr .{I ow~ r / -T--
6 ~ coo rdi '?ah ~s '\
""" y --12
!i' \ ~ 4 ~
\ I \. --
\ I EF !f:'Lt.l X ( ·vR ~e..:s r'F"pli
2 R St/1' 'rlin 7 p ·I:"~ .. ; ~.7 ~ s~ ,,in
P- Pou '1ds pe, .. S9 1n. \I El 8 10 12 14 y 15 16 18 20 2..4 Zll !JO
I I I I I I I I I I ____L ___l_ I I l _L __ L -I I
EFFLUX CURVES
COMPUTATION OF LOW PRESSURE CARDS
which contains the calculations of Borth upon the oscillations in the intake of an air compressor.) In the more complicated case of an internal combustion engine, however, the difficulties are so great and the assumption of damping factor and heat interchange so uncertain that any results of calculations are of questionable value and may even be misleading. Our experimental results show that the laws of steady flow applied to the intermittent flow existing during the exhaust and intake strokes give non-negligible differences as compared with the actual values. The only solution of the problem seems to lie in the systematic collection of experimental data regarding the pressure changes existing in different parts of the engine, from different types of engines, and in applying the results thus obtained to similar types of engines.
The phenomena existing in the exhaust and intake manifolds are pressure and velocity changes of an elastic medium in a container having certain dimensions, and, thus, in many respects, resemble acoustic phenomena. The design of these parts of the engine can be, therefore, not unfittingly compared with the design of musical instruments. In both cases, experience of the designer is necessary to produce successful results. Nevertheless, exact measurements and their intelligent interpretation are of ,-aluable assistance in attaining this end.
METHODS OF COMPUTING THE LOW PRESSURE CARD OF AN INTERNAL COMBUSTION ENGINE
As explained in the foregoing, any form of computing the pressure changes in different parts of the engine is a more or less rough approximation of the actual facts. Even so, they are of value in giving a mental picture of the processes which take place, and form a basis for the comparison of different engines.
In the following, a few of these methods will be discussed:
METHOD A
(See Marks, The Airplane Engine) pp. 152-153·)
As a first approximation, the pressure drop past the valve, necessary to produce a giYen velocity, can be obtained from the formula:
U 2 1 -- -- = (p -p ) 144
2g v 1 2
and the velocity can be calculated from the following equation:
28 MANIFOLD PHENOMENA IN INTERNAL COMBUSTION ENGINES
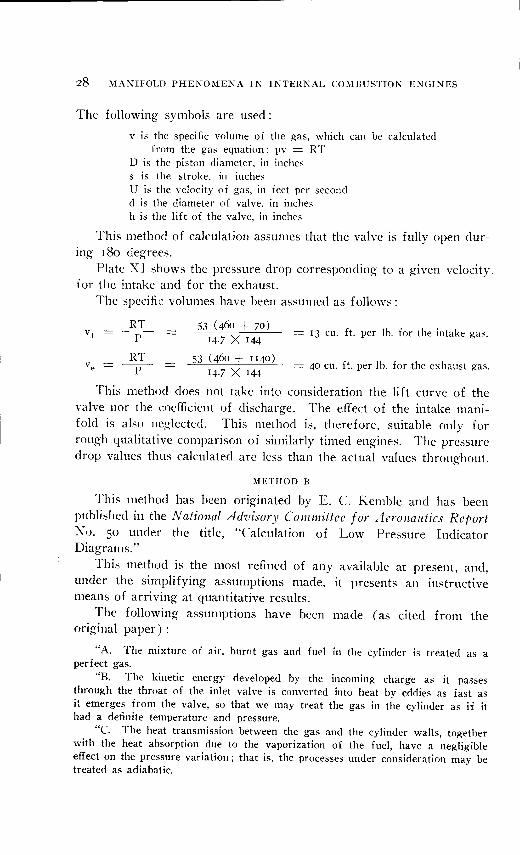
The following symbols are used:
v is the specific volume of the gas, which can be calculated from the gas equation: pv = RT
D is the piston diameter, in inches s is the stroke, in inches U is the velocity of gas, in feet per second d is the diameter of valve, in inches h is the lift of the valve, in inches
This method of calculation assumes that the valve is fully open during I So degrees.
Plate XI shows the pressure drop corresponding to a given velocity. for the intake and for the exhaust.
The specific volumes have been assumed as follows:
RT 53 (460 + 70) = 13 cu. ft. per lh. for the intake gas. vi p = 14.7 X 144
RT 53 (460 + 1140) = 40 cu. ft. per lb. for .the exhaust gas. ve = p 14.7 X 144
This method does not take into consideration the lift curve of the valve nor the coefficient of discharge. The effect of the intake manifold is also neglected. This method is, therefore, suitable only for rough qualitative comparison of similarly timed engines. The pressure drop values thus calculated are less than the actual values throughout.
METHOD B
This method has been originated by E. C. Kemble and has been published in the N at£onal Advisory C 01111nittee for Aeronautics Report No. 50 under the title, "Calculation of Low Pressure Indicator Diagrams."
This method is the most refined of any available at present, and, under the simplifying assumptions made, it presents an instructive means of arriving at quantitative results.
The following assumptions have been made (as cited from the original paper) :
"A. The mixture of air, burnt gas and fuel in the cylinder is treated as a perfect gas.
"B. The kinetic energy developed by the incoming charge as it passes through the throat of the inlet valve is converted into heat by eddies as fast as it emerges from the valve, so that we may treat the gas in the cylinder as if it had a definite temperature and pressure.
"C. The heat transmission between the gas and the cylinder walls, together with the heat absorption due to the vaporization of the fuel, have a negligible effect on the pressure variation; that is, the processes under consideration may be treated as adiabatic.
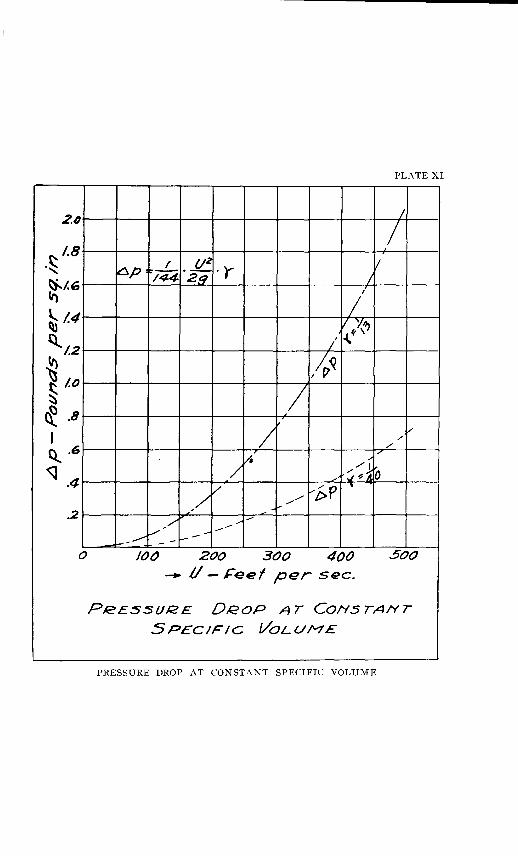
0
PLATE XI
100 200 300 400 500
.-.. l/- Feel per sec.
P,eessuRE D.eoP AT CoJYsTANT SPECIFIC VoLUME
PRESSURE DROP AT CONSTANT SPECIFIC VOLUME
30 MANIFOLD PHENOMENA IN INTERNAL COMBUSTION ENGINES
"D. The rate of air flow through the intake and exhaust valves may be calculated from the manifold pressures, the cylinder pressure, and the valve clear openings, by the ordinary formulas for steady flow through an orifice with the aid of determinable coefficients of efflux."
E. Furthermore, the manifold pressure at the point adjacent to the valves is considered as constant.
With these simplifying asmmptions, the differential equations for the pressure change are derived. These are not accessible to mathematical treatment and, therefore, an approximate graphical solution is given. This gives the logarithmic values of the pressures on a crank angle basis, from which the pressure-volume diagram can be obtained.
In the cited report, Kemble applies the formulas derived to a concrete numerical example and thus determines the light spring diagram for two different speeds.
The method is extremely interesting and gives an instructive mental picture of the exhaust and intake processes. However, admittedly the assumptions made (especially that under E) are so far from the actual conditions that the method cannot be expected to yield quantitatively accurate results. This could be improved by carrying the calculations through, with the effective orifice area of the manifold and valve, as shown in this paper, instead of with the valve opening alone.
From the point of view of fractical application, the method has an important shortcoming, viz., that the graphical integration involves laborious and tedious calculations. Unless a simpler procedure can be evolved (e.g., by means of curves in rectangular co-ordinates or alignment charts), these difficulties represent, in our opinion, a serious handicap to the adaptation of the method to engineering calculations. For further details, reference is made to the original report.
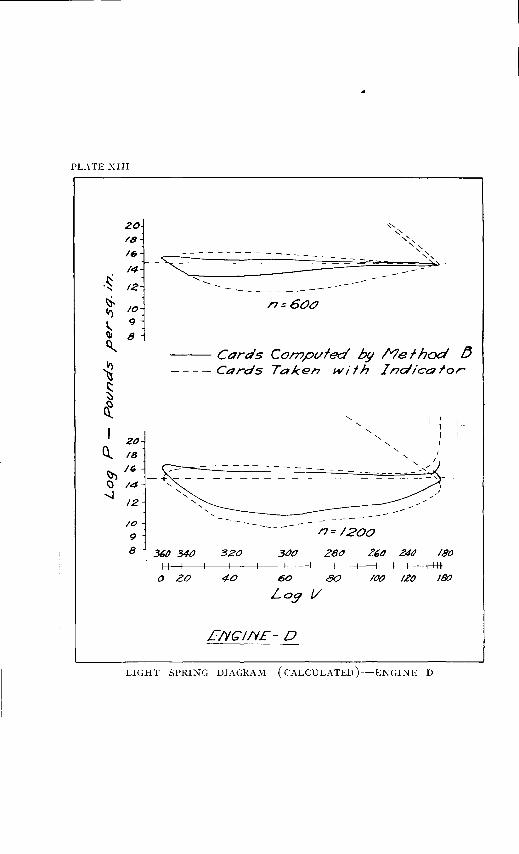
The author has applied this method to the Engine D. See Plates XII and XIII. While the general shape of the pressure curve shows a resemblance to the actual curves, the magnitude of the pressure drop is appreciably less than the real value.
METHOD C
This has been developed by the author, and with its aiel, the pressure line is drawn directly, step by step, on a piston stroke basis. The method consists in assuming that constant conditions persist during a short crank angle interval, figuring the influx or efflux during that intenal, and thus obtaining a new set of values wherewith to proceed during the next interval.
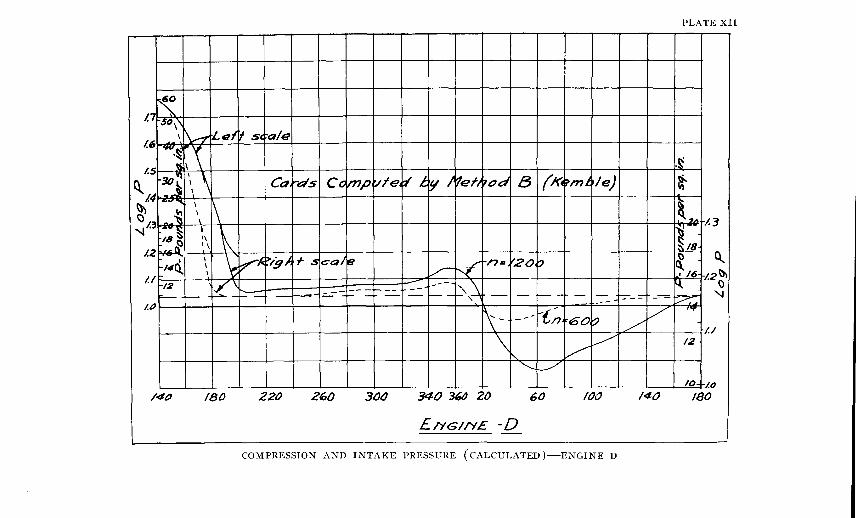
PLATE XII
I
I
1.1 ~ "5ii0 l£1 \~ Lei it sc ale -~~~,
/.5 ~\ .~
~t4 30¥'1\ \ Ca .,_ds Co mp r,tle ~i; ty) ?ef1 ~od f3 (M ~1711. !e) ~ ... r~ I
~
~ ""'"""'4. I
\ ~ .-t I - \ '"' 1.3 "-l/.3 -.... s ' ~
il ·-· 18 ~ ,,
1.2 ~ ,, §Is
~ 1 I
~ 1"';(:. 1>/g). t-.s cal ~ ~ -n= 'f20 :;) ~ 14Q. \ ~ I 16 1.2~ /.I
12 ~~ ~ -- ~<~ 4. . Q
::::-::::... --r-- ~ - ----=--= "'"" - -- -- '"="""-=- --~ 'J I.IJ --
~- ~(,~ / IV
-- 60, ~ / I./
\ / ~ 12
i'... ""'--_/'
/0...., /.()
/40 180 220 2fJO 3()() 340 3611 20 60 /00 140 180
£/YGIIYE -D ------ --~·~- ---
COMPRESSION AND INTAKE PRESSURE (CALCULATED )-ENGINE D
PL\TE XIII
20
/8
/6
14
·~ 12
~ Cr) /0
~ ; ct.
~ § ~ J 20
Q 18
~ /{,
<) 14 ...J
12
/0
9
----------
~'-='--------------
n= 60CJ
--Cards Co17Jpvfecl h!J /V1efhod /J ----Cards Taken with Indicator
' ' '-. I "- I
~---~ -~,~:;====---~;-'- ------
n=/200
8 36{) 34tJ 320 300 280 Z60 Md 180
0 zo 40 60 80
Log V
E/VG'I/'1£- D
/(}() IZtJ 180
LIGHT SPRING DIAGRAM (CALCULATED )--ENGINE D
COMPUTATION OF LOW PRESSURE CARDS 33
The following assumptions are made :
1. The change of state is assumed to be adiabatic. 2. The flow through the valves and manifolds is calculated, according to
equations on page 25, as tho taking place through the respective equivalent orifices obtained by the method outlined on page 21.
3. The pressure wave phenomena due to the natural oscillation of the gas column in the manifold is neglected.
In an adiabatic change:
PVk Con st., whence clP = -k p
v dV
dP -k
p clV or cl¢ = v d"¢
The change of volume can be expressed :
where: dV1 elM
'Y
dV = clV1 + clV2
the volume of gas leaving or entering the cylinder under the influence of the existing pressure difference ;
the volume change of the cylinder, as a function of the crank angle.
In the actual application of the method, a P V co-ordinate system is drawn, and the swept volume of the cylinder is divided into parts corresponding to equal crank angles (e.g., 5 or ro degrees). This crank angle interval is equivalent to
dt = ~ n
sec.
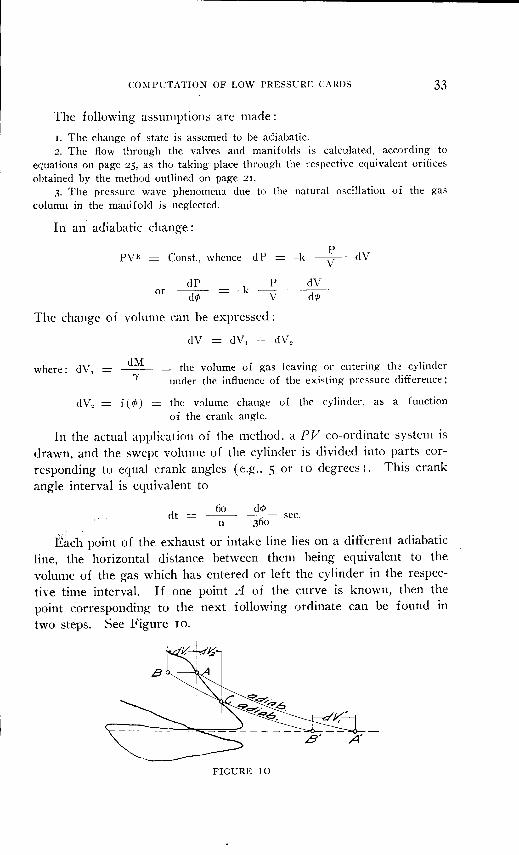
E~ch point of the exhaust or intake line lies on a different adiabatic line, the horizontal distance between them being equivalent to the volume of the gas which has entered or left the cylinder in the respecti,·e time interval. If one point A of the curve is known, then the point corresponding to the next following ordinate can be found in two steps. See Figure ro.
FIGURE IO
34 MANIFOLD PHENOMENA IN INTERNAL COMBUSTION ENGINES
I. Determine the volume entering or leaving the cylinder during the movement of the crankshaft, through the angle dcp.
Me dt
'Y
where the weight of gas leaving or entering the cylinder m unit time lS:
I.07 (See page 25)
,/ Te
Fe being the equivalent orifice area of the manifold and valves, and y
the density of the gas at the pressure and temperature existing in point A. Thus the point B is obtained.
2. Draw an adiabatic through point B. The intersection with the next ordinate gives C, the new point sought.
It is convenient to refer the weight of gas leaving or entering the cylinder to a definite pressure, e.g., atmospheric, and obtain point B' from point A' which is the intersection of the atmospheric (or other chosen) pressure line with the adiabatic through point A.
The practical application of the method is greatly facilitated by drawing a family of adiabatics, containing about IO or 20 equidistant curves in the PV diagram. Guided by these, an adiabatic can be easily drawn freehand through any point with a high degree of accuracy.
The diagram shown on Plate XIV was obtained by this method. 'l:'he agreement between the calculated and recorded values is better in the regions of high velocity, while the regions of low velocity show less pressure drop by calculation than the actual value.. In consequence of this, the value of the negative work shows a fairly good agreement with the recorded values, but the discrepancy existing at the end of the intake renders the calculated diagram somewhat uncertain as a means of computing the volumetric efficiency.
METHOD D
This is a simplified method developed by the author for finding the intake line, altho with some modification it can also be applied to the exhaust line.
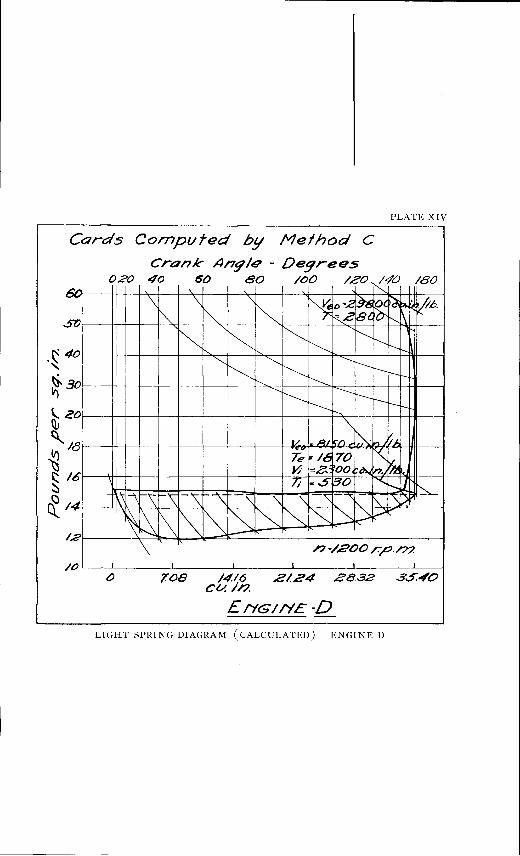
PLATE XIV -. ·---
Cards Computed b!J Method C
Crank An9/t:? - Degrees 020 40 60 80 /00 /Z0!-(40 lBO
~,. \ ......,.... \ \ "~ ~ o-=,2 I~ rc;: ~~
~· kkb. stJ ""' ""'
k..C: B~ I"- l\~ " ~ ~~ ~~ !'---1-
.~40 ~ f"-r---~ '-........ ---t----' I ~ ~ r-
~30 J"--.. ~ t---r-
............ r---.. .........._
r---r--.. r- t---r-\... 20 r----, Q] "' ~18 IL --AI. ~/),. ~-nJ ~)
~ ~ F /6 70 K ~~ J1 ~ 00 f~ ~ ~ 16 7; r-..5 ~0 ' 'J. ~ r--- ~ d: 14
- ~~ I\ "\ \ \ -""\ " " "' ""'\ -~
~ "'\ ~ ~- r-...
~ ~ L\ I'\ ~ ~~~~~~~ /2 .---\ n-=/200 r.p./7?.
/0 I I I I I _l
~ 70B /4.16 21Z4 .E832 .35..,0 cv. in.
£NGIIY£-D -LIGHT SPRING DIAGRAM (CALCULATED )-ENGINE D
36 i\IANIFOLD PHENOMENA IN INTEHNAL COMBUSTION ENGINES
The total pressure drop between the atmosphere Po and inside the cylinder is assumed to be the sum of the following velocity heads:
.:lp carburetor = p0-pc =
~p valve = Pe-P =
U/ 'Yc
2g pressure drop necessary to produce the air flow through the carburetor Venturi.
pressure drop necessary to produce the air flow through the valves.
The retransformation of velocity into pressure is neglected. Both of these pressure drops can be determined by the method outlined beginning on page 22, and their sum at any crank angle represents the total pressure drop between the atmosphere and the cylinder.
The velocity through the carburetor Venturi can be calculated from
the equation :
where:
elY clt
I
~ clV d¢
cl¢ dt
F c is the equivalent orifice area of the manifold, which can be assumed to be equal to the carburetor throat.
n is r.p.m.
d¢ ~d-t-
In a similar manner, the velocity through the valve can be expressed:
u- -~-~ v - Fv dt
where F v is the equivalent orifice area of the valve as determined according
to the method on page 20.
It must he considered that the pressure drop in the carburetor lags behind the cylinder pressures hy an angle depending upon the speed of the engine and the velocity through the carburetor Venturi. This lag may be taken into account on an empirical basis by comparison with similar engines. J\ correction must be applied to the curve thus obtained by drawing an adiabatic line from the clearance volume of the cylinder so as to cut off the upper dead center portion of the curve. EYidently, the pressure drop cannot be less than that corresponding to the expansion line drawn from the clearance volume.
This method of construction is executed for Engine W for four different speed conditions. The agreement of the curves thus obtained with the actual indicator cards is better at higher speed conditions than at low speeds. See Plate XV.
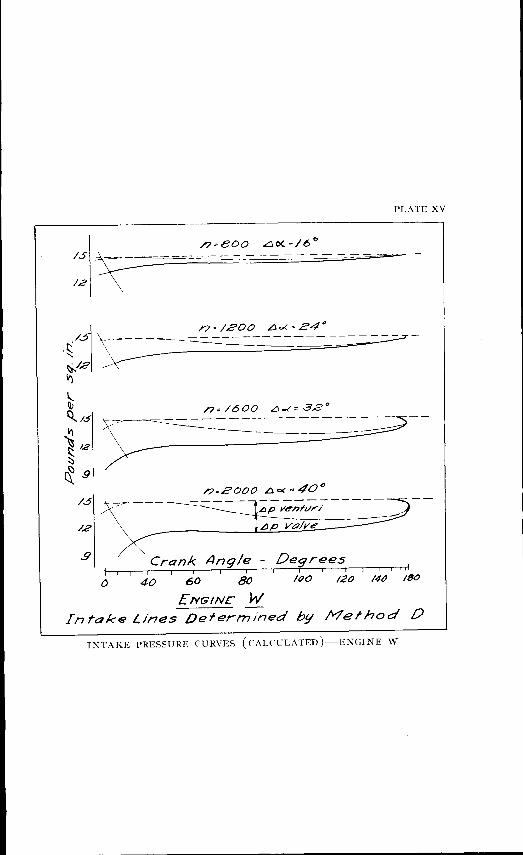
PLATE XV
/7:800 IS T-=.===----::_- -- -- --- -- -- -- -12\
-~--~=---::::-==-::::=__-------------- -----------
()
n=/600 LJ-<=3.2°
n~zooo ~ o< = 40 o
---::- --- -=--= -===-==--=---~
Crank Anqle - Degrees I I I I I I I
40 60
ENG INC
80
w /()0 /20
I I I d /4d /80
Inrake Lines Determined by Method 0
INTAKE PRESSURE CURVES (CALCULATED )-ENGINE W
38 MANIFOLD PHENOMENA IN INTERNAL COMBUSTION ENC;INES
CONCLUSIONS
The investigations in the foregoing are not regarded as final. The agreement between the calculated results and those obtained by experiment is only of limited accuracy, in many respects. Like methods commonly used in all fields of engineering, the calculations may be used as a guide but cannot wholly supplant experimental work.
Nevertheless, these investigations appear to hold out the probability that, by collecting more experimental data, the foregoing methods can be developed to a higher degree of accuracy.
The present research indicates the desirability of extending the experiments to :
I. Static pressures II. Dynamic pressures at several points of the
A. Intake B. Exhaust system of
a. One-cy lindered engmes (especially with variable timing)
b. Four, six, and other multi-cylindered engines under I. Steady flow 2. Intermittent flow conditions.
BIBLIOGRAPHY
D. BANKI. Energiaatalakulasok folyadekokban. Budapest, Hungary.
K. ]. DE}UHASZ. Versuche an emem Automohilmotor. PnrscllllllfJShcfte dcr Auto Tcchnik, Berlin, Heft No. 2.
A. GRAMB:<:RG. Technische Messungen. Berlin: Julius Springer. ~--~ Maschinenuntersuchungen. Berlin : Julius Springer.
HoRT. Technische Schwingungslehre. Berlin: Julius Springer.
E. C. KEMBLE. Calculation of low pressure indicator diagrams. N. A. C. A. Report No. so.
G. W. LEWIS and E. M. NUTTING. Air flow through poppet valves. N. A. C. A. Report No. 24.
C. E. LucKE and F. 0. WrLLHOEFFT. Carburetor design. N. A. C. A. Report
No. II.
L. S. MARKS. The airplane engine. New York: McGraw-Hill Co.
SANFORD Moss. Flow of air and gases under small pressure differences. Ameri
can Machinist. September 20, 27, 1906.
H. RICARDO. The high speed internal combustion engine. New York: D. Van
Nostrand.
P. H. ScHWEITZER. The tangent method of analysis for indicator cards. Penn. State College Bulletin No. 35.
Sc. TREVES. Study of a stock engine. Automoti·z•c Indnstries. September 23,
I926.

![!ER eourt. u. ORDS 1lappliedantitrust.com › 22_tying › 00_classic_cases › 09_kodak › ... · 2015-01-09 · ]n tqr §uprrmr qrnurt nf tl1r . jjhtitr~ :§tatr.a . october t](https://img.pdfslide.us/doc/110x75/5f0fb0517e708231d44565d8/er-eourt-u-ords-a-22tying-a-00classiccases-a-09kodak-a-2015-01-09.jpg)