Embed Size (px)
Citation preview
I n t e r n a t i o n a l T e l e c o m m u n i c a t i o n U n i o n
ITU-T K.70TELECOMMUNICATION STANDARDIZATION SECTOR OF ITU
(06/2007)
SERIES K: PROTECTION AGAINST INTERFERENCE
Mitigation techniques to limit human exposure to EMFs in the vicinity of radiocommunication stations
ITU-T Recommendation K.70

ITU-T Rec. K.70 (06/2007) i
ITU-T Recommendation K.70
Mitigation techniques to limit human exposure to EMFs in the vicinity of radiocommunication stations
Summary ITU-T Recommendation K.70 defines techniques which may be used by telecommunication operators to evaluate the cumulative (total) exposure ratio in the vicinity of transmitting antennas and to identify the main source of radiation. It offers guidance on mitigation methods which allow reduction of radiation level in order to comply with exposure limits. It also provides guidance on procedures necessary in the environment (on site) in which, in most cases, there is a simultaneous exposure to multiple frequencies from many different sources. Radiating sources may belong to many operators and may represent different radiocommunication services (e.g., cellular systems, trunking systems, broadcasting, radio relays, wireless access, etc.).
Source ITU-T Recommendation K.70 was approved on 29 June 2007 by ITU-T Study Group 5 (2005-2008) under the ITU-T Recommendation A.8 procedure.
Keywords EMF, exposure limits, intentional radiator, multiple sources environment, transmitting antenna.
ii ITU-T Rec. K.70 (06/2007)
FOREWORD
The International Telecommunication Union (ITU) is the United Nations specialized agency in the field of telecommunications. The ITU Telecommunication Standardization Sector (ITU-T) is a permanent organ of ITU. ITU-T is responsible for studying technical, operating and tariff questions and issuing Recommendations on them with a view to standardizing telecommunications on a worldwide basis.
The World Telecommunication Standardization Assembly (WTSA), which meets every four years, establishes the topics for study by the ITU-T study groups which, in turn, produce Recommendations on these topics.
The approval of ITU-T Recommendations is covered by the procedure laid down in WTSA Resolution 1.
In some areas of information technology which fall within ITU-T's purview, the necessary standards are prepared on a collaborative basis with ISO and IEC.
NOTE
In this Recommendation, the expression "Administration" is used for conciseness to indicate both a telecommunication administration and a recognized operating agency.
Compliance with this Recommendation is voluntary. However, the Recommendation may contain certain mandatory provisions (to ensure e.g., interoperability or applicability) and compliance with the Recommendation is achieved when all of these mandatory provisions are met. The words "shall" or some other obligatory language such as "must" and the negative equivalents are used to express requirements. The use of such words does not suggest that compliance with the Recommendation is required of any party.
INTELLECTUAL PROPERTY RIGHTS
ITU draws attention to the possibility that the practice or implementation of this Recommendation may involve the use of a claimed Intellectual Property Right. ITU takes no position concerning the evidence, validity or applicability of claimed Intellectual Property Rights, whether asserted by ITU members or others outside of the Recommendation development process.
As of the date of approval of this Recommendation, ITU had not received notice of intellectual property, protected by patents, which may be required to implement this Recommendation. However, implementers are cautioned that this may not represent the latest information and are therefore strongly urged to consult the TSB patent database at http://www.itu.int/ITU-T/ipr/.
© ITU 2008
All rights reserved. No part of this publication may be reproduced, by any means whatsoever, without the prior written permission of ITU.
ITU-T Rec. K.70 (06/2007) iii
CONTENTS
Page 1 Scope ............................................................................................................................ 1
2 References..................................................................................................................... 1
3 Terms and definitions ................................................................................................... 3
4 Abbreviations and acronyms ........................................................................................ 5
5 Evaluation of exposure levels....................................................................................... 6 5.1 Full-wave methods ......................................................................................... 7 5.2 Synthetic model .............................................................................................. 8 5.3 Point source model ......................................................................................... 8 5.4 Influence of the reflections............................................................................. 8 5.5 Uncertainty ..................................................................................................... 8
6 The EIRP and other parameters for the radiocommunication transmitting stations..... 9
7 Evaluation of the cumulative exposure ratio in multiple sources environment ........... 9
8 Identification of the main source of radiation............................................................... 10
9 Compliance distances ................................................................................................... 11
10 Description of the mitigation techniques...................................................................... 11
11 Conclusion .................................................................................................................... 12
Annex A – Radiation pattern of the transmitting antenna ....................................................... 13 A.1 Horizontal and vertical radiation patterns ...................................................... 13 A.2 HRP and VRP for typical radiocommunication and broadcasting antennas.. 14 A.3 Two levels approach....................................................................................... 14
Annex B – The point source model ......................................................................................... 15 B.1 Description of the point source model............................................................ 15 B.2 Applicability of the point source model ......................................................... 17
Annex C – Simplified method for the calculation of the compliance distances ...................... 21
Annex D – Examples of mitigation techniques ....................................................................... 22 D.1 Decrease in the transmitter power .................................................................. 22 D.2 Increase in the antenna height ........................................................................ 22 D.3 Decrease in the VRP downtilt ........................................................................ 23 D.4 Increase in the antenna gain ........................................................................... 25 D.5 Changes in the VRP........................................................................................ 27 D.6 Changes in the HRP........................................................................................ 29 D.7 Multiple methods applied simultaneously...................................................... 31
Appendix I – Software EMF-estimator.................................................................................... 32 I.1 Applicability of the EMF-estimator ............................................................... 32 I.2 Typical situation ............................................................................................. 33 I.3 Software description....................................................................................... 33 I.4 Compliance distances ..................................................................................... 37
iv ITU-T Rec. K.70 (06/2007)
Page I.5 Coefficient concerning transmitter power ...................................................... 37 I.6 Library – radiation patterns of the antenna systems....................................... 38 I.7 Examples of calculations................................................................................ 38 I.8 Additional comments...................................................................................... 38 I.9 System requirements ...................................................................................... 38
Appendix II – Parameters of typical radiocommunication systems ........................................ 39 II.1 Mobile base stations ....................................................................................... 39 II.2 Trunked radio and wireless access systems.................................................... 41 II.3 TV and DVB-T transmitting stations ............................................................. 41 II.4 FM and T-DAB transmitting stations............................................................. 42 II.5 AM and DRM transmitting stations ............................................................... 44 II.6 Radio relay links............................................................................................. 45
ITU-T Rec. K.70 (06/2007) v
Introduction The real sources of intentional EMFs are transmitting antennas – not transmitters themselves – because the radiation patterns of the transmitting antennas determine EMF distribution in the vicinity of a transmitting station. The compliance with unintentional radiation of the radiocommunication or broadcasting transmitters, such as around their enclosure (or in the case of an open enclosure for maintenance or tuning purposes), is not under the scope of this Recommendation.
The accuracy of calculations during the exposure assessment depends on the methodology used and on the information concerning radiating source. In this Recommendation, particular stress is laid on the guidance referring to radiating source characteristics, mainly the most important parameters, i.e., transmitting antenna radiation patterns. This Recommendation offers information on radiation patterns for a wide range of typical transmitting antennas used in radiocommunication and broadcasting. It also gives guidance on how to organize calculations, depending on accessible data.
This Recommendation presents the possible technical solutions to the problem when the reference levels are exceeded in the multiple sources environment. In the case when many operators have radiating sources in the considered area, the proper solution has to be found on the basis of an agreement between all parties. In the case when such an agreement is not possible, the operator who introduces the last change in the installations will be responsible for the appropriate limitation of the exposure level from his source of radiation so as not to exceed the allowed global limit.

ITU-T Rec. K.70 (06/2007) 1
ITU-T Recommendation K.70
Mitigation techniques to limit human exposure to EMFs in the vicinity of radiocommunication stations
1 Scope This Recommendation provides guidance on mitigation techniques for limiting the exposure from radiocommunication installations, especially in the multiple sources environment. This guidance presents methods for field strength distribution evaluation, cumulative exposure ratio evaluation, identification of the main source of radiation, and offers mitigation techniques – methods for reducing the levels of electromagnetic fields during simultaneous exposure in the multiple sources environment.
In this Recommendation, the following reference limits are used: electric field strength, magnetic field strength and power density. Since compliance with the reference limits guarantees the compliance with basic restrictions, this is a conservative approach. In the far-field region the use of the reference levels gives results which are very close to real radiation levels. In the near-field region the obtained results will overestimate or underestimate real radiation levels. Moreover, this Recommendation deals with reference levels calculated in free space, so EMF influence on human tissues or human body is not considered.
This Recommendation also gives guidance on identifying those areas in which the highest radiation levels should be expected. This piece of information may be helpful to define the area for measurements.
The guidance given in this Recommendation applies to any exposure limits; however, in the examples of calculations, the ICNIRP exposure limits are taken.
A software EMF-estimator (see Appendix I) is attached to this Recommendation in order to support its application. The software implements the methodology described in this Recommendation and gives the possibility to calculate the cumulative exposure for the reference levels. It also contains the library of the radiation patterns of transmitting antennas for a wide range of radiocommunication and broadcast services. The EMF-estimator is not appropriate for the equipment certification in order to put it on the market.
This Recommendation is intended for use when considering the EMFs in areas around transmitting stations, e.g., around transmitting antennas in their places of installation.
2 References The following ITU-T Recommendations and other references contain provisions which, through reference in this text, constitute provisions of this Recommendation. At the time of publication, the editions indicated were valid. All Recommendations and other references are subject to revision; users of this Recommendation are therefore encouraged to investigate the possibility of applying the most recent edition of the Recommendations and other references listed below. A list of the currently valid ITU-T Recommendations is regularly published. The reference to a document within this Recommendation does not give it, as a stand-alone document, the status of a Recommendation.
[ITU-T K.52] ITU-T Recommendation K.52 (2004), Guidance on complying with limits for human exposure to electromagnetic fields.
[ITU-T K.61] ITU-T Recommendation K.61 (2003), Guidance to measurement and numerical prediction of electromagnetic fields for compliance with human exposure limits for telecommunication installations.
ITU-T Rec. K.70 (06/2007) 2
[ITU-R BS.80-3] ITU-R Recommendation BS.80-3 (1990), Transmitting antennas in HF broadcasting.
[ITU-R BS 705-1] ITU-R Recommendation BS.705-1 (1995), HF transmitting and receiving antennas characteristics and diagrams.
[ITU-R BS.1195] ITU-R Recommendation BS.1195 (1995), Transmitting antenna characteristics at VHF and UHF.
[ITU-R BS.1386-1] ITU-R Recommendation BS.1386-1 (2001), LF and MF transmitting antennas characteristics and diagrams.
[ITU-R BS.1698] ITU-R Recommendation BS.1698 (2005), Evaluating fields from terrestrial broadcasting transmitting systems operating in any frequency band for assessing exposure to non-ionizing radiation.
[ITU-R F.1245-1] ITU-R Recommendation F.1245-1 (2000), Mathematical model of related radiation patterns for line-of-sight point-to-point radio-relay system antennas for use in certain coordination studies and interference assessment in the frequency range from 1 GHz to about 70 GHz.
[ITU-R F.1336-1] ITU-R Recommendation F.1336-1 (2007), Reference radiation patterns of omnidirectional, sectoral and other antennas in point-to-multipoint systems for use in sharing studies in the frequency range from 1 GHz to about 70 GHz.
[EN 50383] CENELEC EN 50383:2002, Basic standard for the calculation and measurement of electromagnetic field strength and SAR related to human exposure from radio base stations and fixed terminal stations for wireless telecommunication systems (110 MHz – 40 GHz).
[EN 50400] CENELEC EN 50400:2006, Basic standard to demonstrate the compliance of fixed equipment for radio transmission (110 MHz – 40 GHz) intended for use in wireless telecommunication networks with the basic restrictions or the reference levels related to general public exposure to radio frequency electromagnetic fields, when put into service.
[EN 50413] CENELEC 50413:2007, Basic standard on measurement and calculation procedures for human exposure to electric, magnetic and electromagnetic fields (0 Hz – 300 GHz).
[EN 50492] CENELEC 50492 (draft), Basic standard for in-situ measurement of electromagnetic field strength related to human exposure in the vicinity of base stations.
[ICNIRP] ICNIRP Guidelines (1998), Guidelines for limiting exposure to time-varying electric, magnetic and electromagnetic fields (up to 300 GHz).
[IEC/EN 62311] IEC/CENELEC 62311:2007, Assessment of electronic and electrical equipment related to human exposure restrictions for electromagnetic fields (0 Hz – 300 Hz).
[IEEE P1597.1] IEEE P1597.1 (draft), Draft Standard for Validation of Computational Electromagnetics (CEM) Computer Modelling and Simulation.
[UNCERT] ISO/IEC MISC UNCERT (1995), Guide to the expression of uncertainty in measurement.
ITU-T Rec. K.70 (06/2007) 3
3 Terms and definitions This Recommendation defines the following terms:
3.1 antenna: Device that serves as a transducer between a guided wave (e.g., coaxial cable) and a free space wave, or vice versa. It can be used to emit or receive a radio signal. In this Recommendation the term antenna is used only for emitting antenna(s).
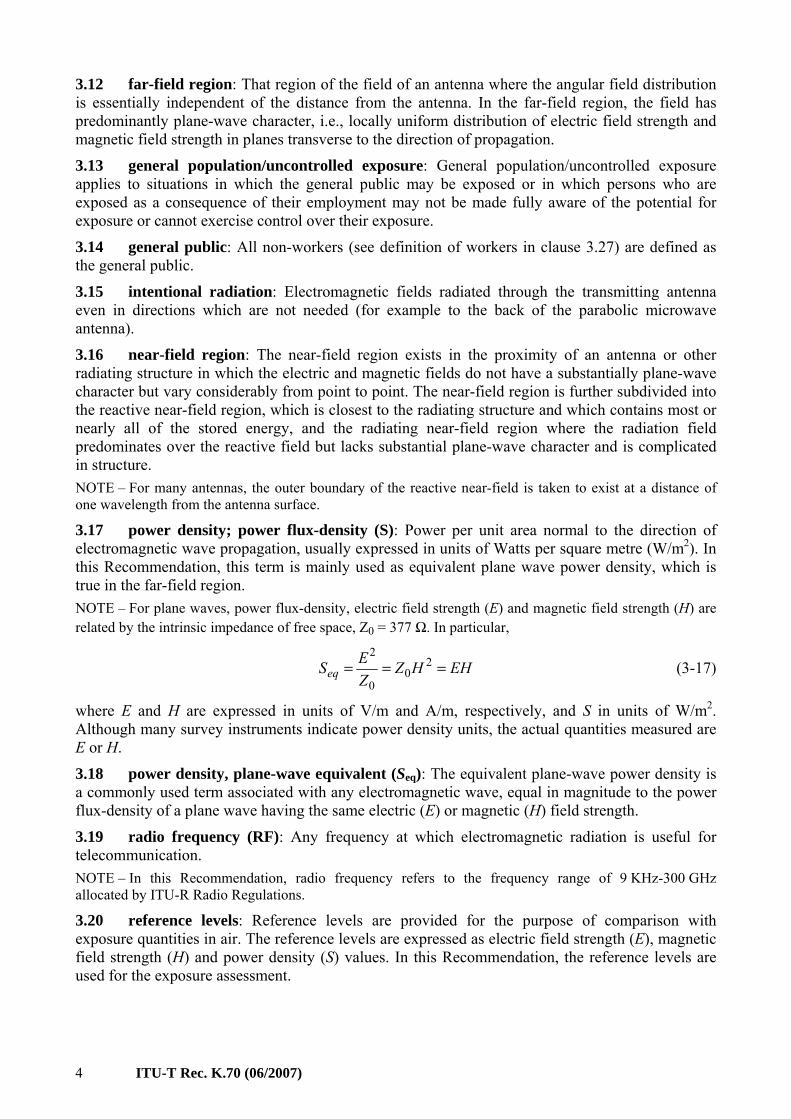
3.2 antenna gain: The antenna gain Gi (θ, φ) is the ratio of power radiated per unit solid angle multiplied by 4π to the total input power. The gain is frequently expressed in decibels with respect to an isotropic antenna (dBi). The formula defining the gain is:
Ω
⋅π=φθdd4),( r
ini
PP
G (3-2)
where: θ, φ are the angles in a polar coordinate system Pr is the radiated power in the (θ, φ) direction Pin is the total input power Ω an elementary solid angle in the direction of observation. NOTE – In manufacturers' catalogues, the antenna gain is understood as a maximum value of the antenna gain.
3.3 basic restrictions: Restrictions on exposure to time-varying electric, magnetic and electromagnetic fields that are based directly on established health effects. Depending upon the frequency of the field, the physical quantities used to specify these restrictions are: current density (J), specific absorption rate (SAR) and power density (S).
3.4 compliance distance: Minimum distance from the antenna to the point of investigation where the field level is deemed to be compliant to the limits.
3.5 controlled/occupational exposure: Controlled/occupational exposure applies to situations where persons are exposed as a consequence of their employment and in which those persons who are exposed have been made fully aware of the potential for exposure and can exercise control over their exposure. Occupational/controlled exposure also applies to the cases where the exposure is of transient nature as a result of incidental passage through a location where the exposure limits may be above the general population/uncontrolled limits, as long as the exposed person has been made fully aware of the potential for exposure and can exercise control over his or her exposure by leaving the area or by some other appropriate means.
3.6 directivity: Is the ratio of the power radiated per unit solid angle over the average power radiated per unit solid angle.
3.7 equivalent isotropically radiated power (eirp): The eirp is the product of the power supplied to the antenna and the maximum antenna gain relative to an isotropic antenna.
3.8 equivalent radiated power (ERP): The ERP is the product of the power supplied to the antenna and the maximum antenna gain relative to a half-wave dipole.
3.9 exposure: Exposure occurs wherever a person is subjected to electric, magnetic or electromagnetic fields or to contact currents other than those originating from physiological processes in the body or other natural phenomena.
3.10 exposure level: Value given in the appropriate quantity used when to express the degree of exposure of a person to electromagnetic fields or contact currents.
3.11 exposure limits: Values of the basic restrictions or reference levels acknowledged, according to obligatory regulations, as the limits for the permissible maximum level of the human exposure to the electromagnetic fields.
ITU-T Rec. K.70 (06/2007) 4
3.12 far-field region: That region of the field of an antenna where the angular field distribution is essentially independent of the distance from the antenna. In the far-field region, the field has predominantly plane-wave character, i.e., locally uniform distribution of electric field strength and magnetic field strength in planes transverse to the direction of propagation.
3.13 general population/uncontrolled exposure: General population/uncontrolled exposure applies to situations in which the general public may be exposed or in which persons who are exposed as a consequence of their employment may not be made fully aware of the potential for exposure or cannot exercise control over their exposure.
3.14 general public: All non-workers (see definition of workers in clause 3.27) are defined as the general public.
3.15 intentional radiation: Electromagnetic fields radiated through the transmitting antenna even in directions which are not needed (for example to the back of the parabolic microwave antenna).
3.16 near-field region: The near-field region exists in the proximity of an antenna or other radiating structure in which the electric and magnetic fields do not have a substantially plane-wave character but vary considerably from point to point. The near-field region is further subdivided into the reactive near-field region, which is closest to the radiating structure and which contains most or nearly all of the stored energy, and the radiating near-field region where the radiation field predominates over the reactive field but lacks substantial plane-wave character and is complicated in structure. NOTE – For many antennas, the outer boundary of the reactive near-field is taken to exist at a distance of one wavelength from the antenna surface.
3.17 power density; power flux-density (S): Power per unit area normal to the direction of electromagnetic wave propagation, usually expressed in units of Watts per square metre (W/m2). In this Recommendation, this term is mainly used as equivalent plane wave power density, which is true in the far-field region. NOTE – For plane waves, power flux-density, electric field strength (E) and magnetic field strength (H) are related by the intrinsic impedance of free space, Z0 = 377 Ω. In particular,
EHHZZESeq === 2
00
2 (3-17)
where E and H are expressed in units of V/m and A/m, respectively, and S in units of W/m2. Although many survey instruments indicate power density units, the actual quantities measured are E or H.
3.18 power density, plane-wave equivalent (Seq): The equivalent plane-wave power density is a commonly used term associated with any electromagnetic wave, equal in magnitude to the power flux-density of a plane wave having the same electric (E) or magnetic (H) field strength.
3.19 radio frequency (RF): Any frequency at which electromagnetic radiation is useful for telecommunication. NOTE – In this Recommendation, radio frequency refers to the frequency range of 9 KHz-300 GHz allocated by ITU-R Radio Regulations.
3.20 reference levels: Reference levels are provided for the purpose of comparison with exposure quantities in air. The reference levels are expressed as electric field strength (E), magnetic field strength (H) and power density (S) values. In this Recommendation, the reference levels are used for the exposure assessment.
ITU-T Rec. K.70 (06/2007) 5
3.21 relative field pattern (radiation pattern): The relative field pattern f(θ,φ) is defined in this Recommendation as the ratio of the absolute value of the field strength (arbitrarily taken to be the electric field) to the absolute value of the maximum field strength. It is related to the relative numeric gain (see clause 3.22) as follows:
),(),( φθ=φθ Ff
3.22 relative numeric gain (normalized antenna gain): The relative numeric gain F(θ,φ) is the ratio of the antenna gain at each angle to the maximum antenna gain. It is a value ranging from 0 to 1. It is also called antenna pattern.
3.23 specific absorption rate (SAR): The time derivative of the incremental energy (dW) absorbed by (dissipated in) an incremental mass (dm) contained in a volume element (dV) of a given mass density ( mρ ).
3.24 transmitter: A transmitter is an electronic device to generate the radio-frequency electromagnetic field for the purpose of communication. Transmitter output is connected via a feeding line to the transmitting antenna which is the real source of the intentional electromagnetic radiation.
3.25 unintentional radiation: Electromagnetic fields radiated unintentionally, for example through the transmitter enclosure or feeding line.
3.26 wavelength (λ): The wavelength of an electromagnetic wave is related to frequency (f) and velocity (v) of an electromagnetic wave by the following expression:
fν=λ (3-26)
In free space the velocity is equal to the speed of light (c) which is approximately 3 × 10⁸ m/s.
3.27 workers: Any person employed by an employer, including trainees and apprentices but excluding domestic servants.
4 Abbreviations and acronyms This Recommendation uses the following abbreviations and acronyms:
a.t.l. above the terrain level
AM Amplitude Modulation
ATSC Advanced Television Systems Committee
CDMA Code Division Multiple Access
CT-3 Cordless Telephony type 3
DECT Digital Enhanced Cordless Telecommunications
DRM Digital Radio Mondiale
DVB-T Digital Video Broadcasting – Terrestrial
EIRP Equivalent Isotropically Radiated Power
EMF ElectroMagnetic Field
ERP Equivalent Radiated Power
FM Frequency Modulation
GSM Global System for Mobile communications
ITU-T Rec. K.70 (06/2007) 6
HRP Horizontal Radiation Pattern
IBOC In Band On Channel
ICNIRP International Commission on Non-Ionizing Radiation Protection
IS95 Interim Standard 95
MMDS Multipoint Microwave Distribution System
NADC North American Digital Cellular
PHS Personal Handy phone System
T-DAB Terrestrial Digital Audio Broadcasting
TETRA TErrestrial Trunked RAdio
UHF Ultra High Frequency
UMTS Universal Mobile Telecommunication System
VHF Very High Frequency
VRP Vertical Radiation Pattern
WCDMA Wideband CDMA
5 Evaluation of exposure levels Basic restrictions on exposure to EMFs are based directly on established health effects. In many cases it is difficult to calculate them in real situations. Reference levels for human exposure to electric, magnetic and electromagnetic fields are derived from the basic restrictions using the realistic worst-case assumption about exposure. If the reference limits are met, then the basic restrictions will also be met; if reference levels are exceeded, that does not necessarily mean that the basic restrictions are exceeded. It means that the demand for the compliance with the reference levels is a conservative approach.
In this Recommendation, the compliance with the reference levels: electric field strength, magnetic field strength and power density is considered. According to [EN 50383], the calculation of the reference levels is recognized as the reference method in the far-field region as well as the alternative method in the radiating near-field region. So the reactive near field is the only region in which the methodology used in this Recommendation has not enough accuracy and in which this methodology should not be applied.
The real source of intentional EMF is the transmitting antenna – not the transmitter itself, because the transmitting antenna is the main source that determines EMF distribution in the vicinity of a transmitting station. The EMF distribution does not depend on the type of the transmitter used if the same type of a signal and the same output power is applied to the input of the antenna (more exactly, the input of the feeding system). In most cases the distance between a transmitter and a transmitting antenna is rather big (around 30 m to 100 m in radiocommunication and around 200 m to 1500 m in broadcasting). The radiation emitted by the transmitter enclosure is unintentional radiation and is not considered in this Recommendation. The radiation emitted by the transmitting antenna is the intentional radiation which is most important from the point of view of the exposure assessment and determines radiation levels in areas accessible to people.
The most important step in the exposure assessment is the evaluation of radiation levels in the considered area. In typical transmitting and base stations, many operating frequencies are used, so the cumulative exposure assessment is required. Depending on the accessible data, models and methods used for the evaluation, the results have a lower or higher accuracy. In general, more detailed information concerning the radiation sources and more sophisticated methods and models lead to higher accuracy. In some cases, the accuracy of the evaluation is limited because of the lack
ITU-T Rec. K.70 (06/2007) 7
of appropriate data concerning transmitting equipment (antennas). More detailed information concerning the influence of the radiation patterns of the transmitting antenna are provided in Annex A.
There are many methods of calculating the reference levels and then the cumulative exposure in the vicinity of transmitting stations [EN 50383], [EN 50400], [EN 50413], [IEC/EN 62311], [IEEE P1597.1], [ITU-R BS.1698], [ITU-T K.52] and [ITU-T K.61]. Depending on the method used and accessible data concerning radiating sources (antennas) and depending on the needs and required accuracy, in general three approach levels may be applied and may be efficient in cases met in practice. Most important features and applicability of these methods are described below.
5.1 Full-wave methods The highest accuracy of calculation of the reference levels will be achieved by the numerical modelling using one of the full-wave methods based on solving Maxwell's equations in frequency or time domain [EN 50383], [EN 50413], [IEC/EN 62311], [IEEE P1597.1], [ITU-R BS.1698] and [ITU-T K.61]. It includes the method of moments (MoM), finite-difference time domain (FDTD) and many others. Such methods of calculation may be used for any region of the EMF. They use detailed-segmented models of systems – the more detailed-segmented model is used, the better accuracy of the evaluated field distribution is achieved.
A typical transmitting station or base station consists of many transmitting antennas. The area required for consideration is usually big and inhomogeneous. In such a case, the method of moments (MoM) is more effective than other methods.
The application of numerical modelling, as described above, requires appropriate software, experience in electromagnetics and very detailed input data. There are many commercial packages available. In some cases, there are limitations concerning the number of unknowns (the number of segments) which may be used in calculations. The accuracy of the results of calculations strongly depends on the exactness and the range of accessible data concerning a transmitting antenna, which includes antenna geometry and its feeding arrangement. Many antennas (broadcasting antenna systems, cellular panels, etc.) contain a huge number of active radiating elements (up to 256) which are fed with different amplitudes and phases. Without such information, the calculation is impossible or may be used for a general assessment only. In many cases (for example, for the GSM panels which also consist of many dipoles), it is very difficult to obtain the required data – it is manufacturer know-how.
The methods such as MoM give also the possibility to take into account all other objects which have an influence on the radiation level as secondary sources causing reflections (for example, facings made of metallic elements, antenna towers and antenna supporting structures, ground, etc.).
In general, numerical modelling methods provide a good opportunity to take into account almost all substantial factors influencing radiation, but they are useful in rather simple cases only, or for reactive near-field regions in which other methods are not sufficiently accurate. It happens so because it is very difficult to collect all the data needed. Additionally, sophisticated software and experience in electromagnetics are required, together with huge computer resources.
ITU-T Rec. K.70 (06/2007) 8
5.2 Synthetic model In the synthetic model [EN 50383], [EN 50413] each antenna is considered to be a set of elementary sources which have identical parameters. Such an approach is natural, for example, for broadcast antennas which usually contain sets (up to 64) of identical panels operating as one transmitting antenna [ITU-R BS.1195]. In the case of GSM panels (or similar antennas), they can be divided into "patches" (usually containing one dipole with a screen) and each of them may be considered as a separate radiating source. This model may be employed for distances beyond the near-field distance calculated with respect to the maximum size of an elementary radiating source (patch in GSM, panel in broadcasting). The model leads to very accurate results, but the accuracy is lower than in numerical modelling because the coupling between radiating sources is neglected. In many cases (for example, for all the broadcasting antennas) this assumption is well fulfilled.
A disadvantage of this model is that exact information concerning the feeding arrangements of the system containing many radiating sources is required.
5.3 Point source model The point source model is a simple but very effective model which may be used in calculating the reference levels [EN 50383], [EN 50413], [IEC/EN 62311], [ITU-R BS.1698] and [ITU-T K.52]. It is assumed that the transmitting antenna is represented only by one point source, situated in the antenna electric centre and having a radiation pattern of the considered transmitting antenna. The accuracy of this model depends on the field region and on the antenna gain. The boundaries of the field regions are defined according to slightly different criteria which can be found in [EN 50383], [EN 50400], [EN 50413], [IEC/EN 62311], [ITU-R BS.1698], [ITU-T K.52] and [ITU-T K.61]. This model is fully applicable in the far-field region. Further information on the point source method and its domain of application are developed in Annex B.
A disadvantage of this model is in the immediate vicinity of the antenna, where the dimension of the antenna needs to be taken into account in the exposure assessment.
5.4 Influence of the reflections The radiation patterns (see Annex A) are provided for free space conditions. A reflection from the ground or from other structures, such as buildings or fencing (especially metallic objects), may lead to an increase in the value of the reference level. In a conservative approach, reflections from the ground can be taken into account as in Appendix II to [ITU-T K.52]. In typical cases, where an observation point is located up to a few metres above the terrain level, the electric field strength is multiplied by the factor 1.6 and it means that corresponding power density is multiplied by the factor 2.56.
Reflections from other structures are discussed in detail in Annex C to [EN 50400], together with information about factors which can be used in many situations. It should be noted that in a complex environment, with many reflections, only the one with the highest multiplication factor should be considered. In practice, the maximum value of the multiplication factor is 2 for the electric field strength which corresponds to 4 for the power density.
5.5 Uncertainty When performing the calculation, the uncertainty of the result has to be specified. The calculation of uncertainty with a 95% confidence interval should be done according to [EN 50383], [EN 50413] and [UNCERT]. The expanded uncertainty shall not exceed 3 dB for the power density. If the calculation uncertainty exceeds 3 dB, the limit values should be reduced, see clause 7.1.2 of [ITU-T K.61].
ITU-T Rec. K.70 (06/2007) 9
6 The eirp and other parameters for the radiocommunication transmitting stations The transmitters used in radiocommunication produce electromagnetic waves which, by feeding lines, are delivered to the transmitting antennas and radiated into the environment. The best situation is when the calculation is based on the exact information concerning the radiating sources (the ERP, radiation patterns, etc.). In many cases, it is very difficult to obtain such information. Therefore, the general data concerning the transmitting system under consideration may be helpful. General characteristics of the intentional radiation sources (transmitters and transmitting antennas) such as: transmitter power, transmitting antenna radiation patterns, antenna gain, antenna height and eirp are presented in Appendix II. Appendix II contains information concerning typical systems used in radiocommunication and broadcasting. The calculations based on limited data give only a general view on exposure levels in a considered site.
7 Evaluation of the cumulative exposure ratio in multiple sources environment In most cases, a typical transmitting station contains many transmitting systems operating on many frequencies. In this case, in the area around the antenna tower, the electromagnetic field has a complex structure with many components of different frequencies and different field strengths, varying from point to point. For example, a typical cellular base station contains transmitting antennas of two frequency ranges (e.g., 900 MHz and 1800 MHz), operating on many radio carriers and is frequently shared by several operators, which involves the presence of additional transmitting antennas and radio carriers. The cellular base stations are often mounted on broadcast antenna towers which usually contain transmitting equipment for the FM, VHF and UHF bands. In such multiple sources environments, the human body is exposed to radiation emitted simultaneously by all the radiating sources.
The exposure assessment in the multiple sources environment, according to the existing standards [EN 50400], [IEC/EN 62311] and [ITU-T K.52], requires the calculation of the cumulative exposure W (in some standards called also the total exposure ratio). All the operating frequencies must be considered in a weighted sum, where each individual source is pre-rated according to the limit applicable to its frequency.
For the frequency range above 100 kHz, in which the thermal effect is dominating the cumulative exposure, the coefficient Wt has the form (for the electric field strength) shown in equation 7-1:
1GHz300
kHz100
2
,≤⎟
⎟⎠
⎞⎜⎜⎝
⎛= ∑
=i il
it E
EW (7-1)
where: Ei is the electric field strength at frequency i El,i is the reference limit at frequency i
For the induced current density and electrical stimulation effect, relevant up to 10 MHz, and electric field strength as the reference level, the coefficient We has the form shown in equation 7-2:
1MHz10
Hz1 ,≤= ∑
=i il
ie E
EW (7-2)
For compliance with the regulations, both coefficients W of the cumulative exposure should be less than 1. For the radiocommunication and broadcasting transmitting stations, the condition (7-1) is much more restrictive than the condition 7-2. The conditions concerning electrical stimulation effects are important at very short distances from the transmitting antenna, usually with no access for people.
ITU-T Rec. K.70 (06/2007) 10
Equations 7-1 and 7-2 show that the exposure assessment in the multiple sources environment requires the prediction of the electric field strength for each operating frequency. Such prediction, including calculation of the coefficients W, can be done using methods described in clause 5.
8 Identification of the main source of radiation In the multiple sources environment, at each observation point, the components radiated from all transmitting antennas are present. In most cases, only one component is dominant and has the biggest influence on the total exposure level. Identification of the dominant radiation source is indispensable to consider the possibility of reducing the radiation level.
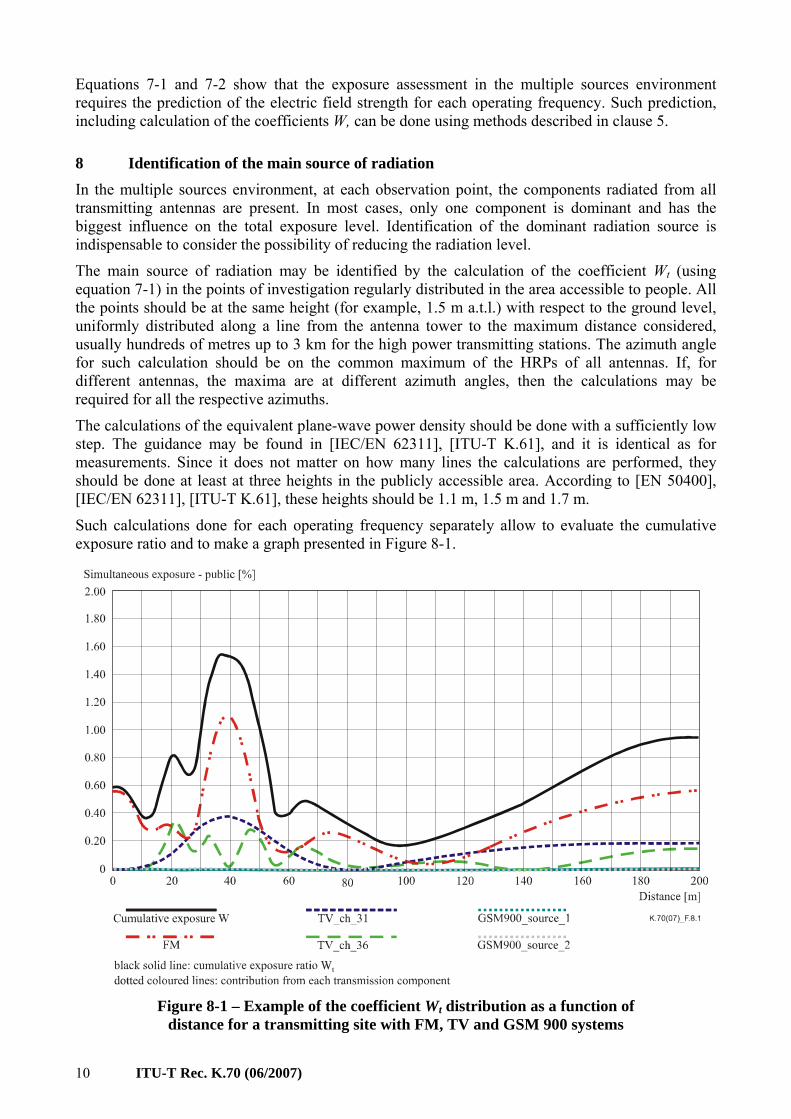
The main source of radiation may be identified by the calculation of the coefficient Wt (using equation 7-1) in the points of investigation regularly distributed in the area accessible to people. All the points should be at the same height (for example, 1.5 m a.t.l.) with respect to the ground level, uniformly distributed along a line from the antenna tower to the maximum distance considered, usually hundreds of metres up to 3 km for the high power transmitting stations. The azimuth angle for such calculation should be on the common maximum of the HRPs of all antennas. If, for different antennas, the maxima are at different azimuth angles, then the calculations may be required for all the respective azimuths.
The calculations of the equivalent plane-wave power density should be done with a sufficiently low step. The guidance may be found in [IEC/EN 62311], [ITU-T K.61], and it is identical as for measurements. Since it does not matter on how many lines the calculations are performed, they should be done at least at three heights in the publicly accessible area. According to [EN 50400], [IEC/EN 62311], [ITU-T K.61], these heights should be 1.1 m, 1.5 m and 1.7 m.
Such calculations done for each operating frequency separately allow to evaluate the cumulative exposure ratio and to make a graph presented in Figure 8-1.
Figure 8-1 – Example of the coefficient Wt distribution as a function of
distance for a transmitting site with FM, TV and GSM 900 systems
ITU-T Rec. K.70 (06/2007) 11
It can be seen that the procedure proposed provides an opportunity to identify easily the main source of radiation, which may be different for different observation points. In the example considered, the FM emission has the biggest contribution to the cumulative exposure, so it is the main source of radiation for this transmitting station. It can also be seen that the contribution from the GSM 900 base station is very small. This is a typical situation, where GSM or other radiocommunication transmitting systems coexist with broadcasting. A reduction of the exposure level should be done in such a way that it affects sufficiently the whole area in which the radiation limits are exceeded.
9 Compliance distances Taking into account the exposure limits given in [ICNIRP], it is possible to calculate distances to the transmitting antennas at which exposure limits are achieved. Such distances are different for different types of transmitting antennas. Compliance distances are also different for the general public and for the occupational exposure because of different limits for these two types of exposure.
Compliance distances may be evaluated in many ways, depending on the accuracy required and on the data available (see clause 5). It should be always assured that for distances greater than the compliance distance, the radiation level is under the limit. It means that if a lower amount of data concerning a radiating source is available, then the higher overestimation of the compliance distances is required.
In the first approach, the point source model with an isotropic antenna (which means that radiation pattern is assumed f(θ,φ) = 1) is used. The approach may be used in all cases, but it gives the highest overestimation. Annex C contains the expressions on which the calculation of the compliance distances (performed in such a way) is based. The level of overestimation depends on the directivity of the transmitting antenna and on the direction of the point of investigation in relation to the transmitting antenna. For an isotropic antenna or for a directional antenna, but at the direction with the highest radiation, this approach gives accurate results. For directional antennas (used in radiocommunication and broadcasting) and for points of investigation in directions different from the direction of the highest radiation, the compliance distances will be overestimated.
The second approach is to use the point source model but with the knowledge of the radiation patterns. Such an approach, with some simplifications and indirectly, is used in [ITU-T K.52]. This method is also applied in the software EMF-estimator. If radiation patterns are well known and compliance distances are located in the far-field region or close to it, the results of calculations are accurate. If compliance distances are located in the reactive near-field region, then overestimation as well as underestimation of the compliance distances is possible.
In all cases, the compliance distances may be evaluated very accurately if numerical methods based on Maxwell's equations are used (MoM, FDTD, etc.). The difficulty is that this approach requires very detailed data concerning transmitting antenna, special software and experience in the numerical modelling.
10 Description of the mitigation techniques Taking into account the protection against radiation, it is important to ensure sites are in compliance with human exposure safety guidelines. In locations directly in front of antennas (main beam), the radiation level can be greater and indeed it is usually much greater. It is because (from the radiocommunication point of view) the most important factor is the coverage area which is highest if most of the radiation is directed to long distances, namely in the directions approximately parallel to the ground. It is possible to reconcile these two contradictory goals by using transmitting antennas with directional radiation patterns: with a narrow vertical pattern where energy directed in downward directions is much less than the main beam. So the key point for the protection against radiation is to have proper radiation patterns of the transmitting antennas.
ITU-T Rec. K.70 (06/2007) 12
The radiation level in the area accessible to people can be reduced in many ways. Annex D provides the description of these methods and examples of results. Most mitigation techniques presented in this Recommendation can be applied for many different transmitting antennas used on base and transmitting stations (for example GSM, UMTS, TETRA, FM, TV, DVB-T, T-DAB, etc.).
In some cases, it can be necessary to apply more than one method to achieve the required reduction of the radiation level. All the methods described above are independent and in many cases they can be applied simultaneously.
11 Conclusion In this Recommendation, the guidelines for mitigation techniques concerning the reduction of the radiation levels in the area around transmitting stations are presented. Many practical applications of the mitigation techniques are illustrated by examples. Some actions which may lead to the reduction of exposure levels, especially in the multiple sources environment, are described.
The accuracy of the exposure assessment strongly depends on the data accessible during the evaluation. As the radiation emitted by the transmitting antennas is intentional, the accuracy of the assessment is as good as the data concerning the radiation patterns. Guidance is given concerning the parameters of the typical transmitting antennas and their influence on the radiation levels in the area accessible to people.
This Recommendation is addressed to telecommunication operators in order to keep the operation of telecommunication transmitting systems in compliance with regulations concerning environmental protection against non-ionizing radiation.
ITU-T Rec. K.70 (06/2007) 13
Annex A
Radiation pattern of the transmitting antenna (This annex forms an integral part of this Recommendation)
The transmitting antenna is represented by the 3D radiation pattern f(θ,φ) [ITU-R BS.1195]. The differences in radiation levels between the main direction (the maximum radiation one) and some other directions (for example, backwards from the parabolic antenna or GSM panel) may be on the level up to 40 dB. Therefore, the information concerning antenna radiation pattern is crucial for the human exposure assessment. In the numerical modelling (such as MoM or FDTD) the radiation pattern (or directivity) comes out indirectly and is hidden in the geometry and feeding arrangement of the transmitting antenna.
Radiation pattern is a function of frequency and, for a wideband antenna system, it substantially varies between the ends of the antenna band. For example, in UHF TV the radiation pattern is different for each TV channel. In the GSM system, the radiation pattern is suitable for each carrier used for downlink.
A.1 Horizontal and vertical radiation patterns In practice, transmitting antennas are not isotropic and radiate with ERP that depends on the direction between a transmitting antenna and an observation point. This is described by the antenna radiation pattern. In general, the radiation pattern f(θ,φ) is a function of the azimuth and elevation angles. The best accuracy can be achieved if the exact 3D radiation pattern f(θ,φ) is known and directly used in the calculation. However, in practice, the telecommunication operator knows two cross-sections of the radiation pattern: in a horizontal plane (called the horizontal radiation pattern − HRP):
max),()( θ=θφθ=φ fH (A.1)
where: H(φ) is the horizontal radiation pattern (HRP) f(θ,φ) is the normalized radiation pattern of the antenna φ is the azimuth angle θ is the elevation angle θmax elevation angle at which the maximum radiation occurs
and in a vertical plane (called the vertical radiation pattern – VRP):
max),()( φ=φφθ=θ fV (A.2)
where: V(θ) is the vertical radiation pattern (VRP) φmax is the azimuth angle at which the maximum radiation occurs
The actual values of the radiation pattern for any elevation and azimuth angles can be found by the relationship [ITU-R BS.1195]:
)()(),( θ⋅φ=φθ VHf (A.3)
ITU-T Rec. K.70 (06/2007) 14
The expression above is based on the assumption that any vertical or horizontal sections of the antenna pattern will have a shape similar to the vertical or horizontal cross-section. This assumption has been verified in practice [ITU-R BS.1195]. Equation A.3 is a very good approximation if the mechanical structure of the transmitting antenna is regular, for example, in the case of omnidirectional broadcast antennas which contain a set of panels placed in bays and faces. Generally, equation A.3 is a good approximation for the forward radiation and a sufficient approximation for the backward radiation, which is satisfactory from the point of view of exposure assessment.
Because of the importance of the radiation pattern for the determination of radiation levels, it is crucial to have a good knowledge of them. Appendix II presents some examples of the radiation patterns of the typical antenna systems used in radiocommunication and broadcasting.
The transmitting antennas used in telecommunication are described in more detail in [ITU-R BS.80-3], [ITU-R BS.705-1], [ITU-R BS.1386-1], [ITU-R F.1245-1], [ITU-R F.1336-1] and [ITU-R BS.1195].
A.2 HRP and VRP for typical radiocommunication and broadcasting antennas The HRP is a function of azimuth angle, representing a distribution of energy in a horizontal plane. For typical antennas used in radiocommunication and broadcasting, the HRPs are usually omnidirectional. It does not mean that the radiation for all azimuths is identical (a vertical dipole has an ideally isotropic HRP, but antennas used in practice are much more complex). The HRP is recognized as omnidirectional if the irregularity (the difference between maximum and minimum) is less than about 3 to 6 dB. In cellular systems, where a typical cell has three sectors at 120° with respect to each other, every sector is served by its own directional transmitting antenna.
The VRP is a function of elevation angle (i.e., in a vertical plane) and represents the distribution of energy in a vertical plane. It gives an impression of the distribution of energy depending on the distance between a transmitting antenna and an observation point. From the exposure assessment point of view the most interesting are the areas in close proximity to the transmitting antenna, i.e., the areas visible from the transmitting antenna at elevation angles around 120-180° (assuming the direction at elevation angle 90° as parallel to the ground). These directions are usually beyond the main beam of the VRP and cover the region of sidelobes and nulls of the VRP. In this area the variation of the ERP is large and can achieve the level of 20 dB and more.
A.3 Two levels approach If the radiation patterns of transmitting antennas are not known or only some similar radiation patterns are accessible (for example synthesized, based on the data concerning antenna geometry and assuming feeding arrangements), then the result of calculation should be regarded as an approximation which gives only a general view on radiation levels. In many cases, even such results may be satisfactory. It happens so if radiation levels are substantially under the limits.
If radiation patterns are well known (for example, present in antenna documentation or calculated based on geometry and feeding arrangements present in the documentation), especially when the two-dimensional radiation pattern is known, then the results of calculations are accurate in the far-field region and represent a good approximation for most of the radiating near-field region.
Many methods allowing for the reduction of radiation levels – described in this Recommendation – may be implemented without any calculations and then approved by measurement. These methods give reduction of the radiation levels in general and may be effective, especially for the cellular base stations which use typical transmitting panels. However, the approach has little application for the broadcast antennas which are always individually designed and contain sets of panels with individually designed feeding arrangements.
ITU-T Rec. K.70 (06/2007) 15
Annex B
The point source model (This annex forms an integral part of this Recommendation)
B.1 Description of the point source model The point source method is a simple but very effective model which may be used in calculating the reference levels [EN 50383], [EN 50413], [IEC/EN 62311], [ITU-R BS.1698] and [ITU-T K.52]. It is assumed that the transmitting antenna is represented only by one point source, situated in the antenna electric centre and having a radiation pattern of the considered transmitting antenna. The accuracy of this model depends on the field region and on the antenna gain. The boundaries of the field regions are defined according to slightly different criteria which can be found in [EN 50383], [EN 50400], [EN 50413], [IEC/EN 62311], [ITU-R BS.1698], [ITU-T K.52] and [ITU-T K.61]. This model is fully applicable in the far-field region, i.e., for distances from the transmitting antenna bigger than:
dr = max(3λ, 2D2/λ) (B.1)
where: dr is the distance between the transmitting antenna and the point of investigation D is the maximum size of the antenna (in radiocommunication and broadcasting,
it is usually the vertical size of the transmitting antenna or reflector diameter) λ is the wavelength
In the far-field region, relations between the electric field strength E, magnetic field strength H and power density S are as for the plane wave and may be defined by [EN 50383], [EN 50413], [IEC/EN 62311], [ITU-R BS.1698] and [ITU-T K.52]:
02
0
222
222 )()(4
),(4
),(4
ZHZEVH
R
GPF
R
GPF
R
EIRPS iieq ⋅==θφ
π
⋅=φθ
π
⋅=φθ
π= (B.2)
where: Seq is the equivalent plane-wave power density (W/m2) in a given direction EIRP is the equivalent isotropically radiated power (W) R is the distance (m) from the radiation source P is the average power (W) emitted when the transmitter operates at maximum
emission settings (all channels transmitting at their respective maximum power setting) and supplied to the radiation source (transmitting antenna)
Gi is the maximum gain of the transmitting antenna, relative to an isotropic radiator
F(θ,φ) is the antenna numeric gain (normalized gain), φ – azimuth angle, θ – elevation angle
H(φ) is the horizontal radiation pattern (HRP) V(θ) is the vertical radiation pattern (VRP) E is the rms electric field strength (V/m) H is the rms magnetic field strength (A/m) Z0 is the free space wave impedance = 120π ≈ 377 (Ω)
ITU-T Rec. K.70 (06/2007) 16
It should be noted that the transmitter power used in equation B.2 is an average power which is not nominal (or rated) transmitter power in all cases. Table B.1 contains information concerning conversion factors for the most commonly used types of radiocommunication services. More detailed information can be found in [ITU-R BS.1698].
It should also be noted that the transmitter power should be taken for maximum emission settings. It means that all channels are transmitting at their respective maximum power settings (in the case of broadcasting, limited by a licence for operation).
Table B.1 – Values of conversion factors for typical radiocommunication services
Type of service Conversion factor
nominal (rated) / mean (average) transmitter power
GSM, CDMA, UMTS, DECT, TETRA 1.0 AM DSB (modulation depth = 0.7) 1.25 AM SSB 0.6 FM 1.0 TV PAL 0.7 TV NTSC 0.6 DVB-T, T-DAB, DRM, DVB-H, DMB 1.0
In the radiating near-field region, the point source model overestimates or underestimates the level of radiation. It depends on the direction of investigation in relation to the radiation pattern. In the direction of the highest radiation this model always overestimates real values. In the direction corresponding to nulls of the transmitting antenna radiation pattern, this model usually underestimates real values.
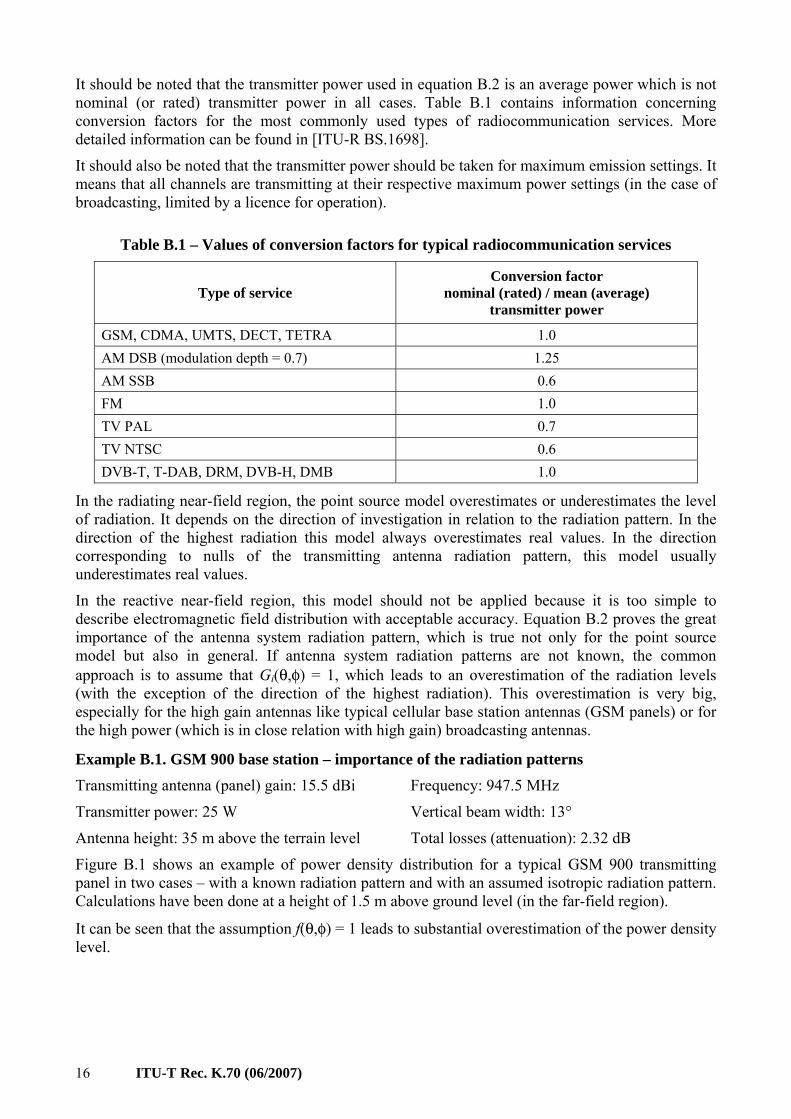
In the reactive near-field region, this model should not be applied because it is too simple to describe electromagnetic field distribution with acceptable accuracy. Equation B.2 proves the great importance of the antenna system radiation pattern, which is true not only for the point source model but also in general. If antenna system radiation patterns are not known, the common approach is to assume that Gi(θ,φ) = 1, which leads to an overestimation of the radiation levels (with the exception of the direction of the highest radiation). This overestimation is very big, especially for the high gain antennas like typical cellular base station antennas (GSM panels) or for the high power (which is in close relation with high gain) broadcasting antennas.
Example B.1. GSM 900 base station – importance of the radiation patterns Transmitting antenna (panel) gain: 15.5 dBi Frequency: 947.5 MHz
Transmitter power: 25 W Vertical beam width: 13°
Antenna height: 35 m above the terrain level Total losses (attenuation): 2.32 dB
Figure B.1 shows an example of power density distribution for a typical GSM 900 transmitting panel in two cases – with a known radiation pattern and with an assumed isotropic radiation pattern. Calculations have been done at a height of 1.5 m above ground level (in the far-field region).
It can be seen that the assumption f(θ,φ) = 1 leads to substantial overestimation of the power density level.
ITU-T Rec. K.70 (06/2007) 17
K.70(07)_F.B.1
0 5.0 10.0 15.0 20.0 25.0 30.0 35.0 40.0 45.0 50.0
0.50
1.00
1.50
2.00
2.50
3.00
3.50
4.00
4.50
5.00
Equivalent plane-wavepower density [mW/m ]2
BS ant_isotropic BSant_732_448
EMF-estimator Distance [m]
0
Isotropic radiation pattern Real radiation pattern
Figure B.1 – Example of the power density distribution as a function of distance for GSM 900 base station
B.2 Applicability of the point source model The point source model does not take into account the antenna size, which is assumed to be a point. However, for the evaluation of the boundaries of the field regions, the size of the real transmitting antenna has to be used. The real radiocommunication and broadcast antennas have dimensions from about 0.3 m (low gain cellular panel or parabolic antenna) up to 30 m (high gain FM or TV UHF antenna systems) or, in relative measure, from λ/4 up to 40λ, so the applicability of this model has to be additionally limited. If the results of calculations are to be accurate, the minimum distance between the point of investigation and the transmitting antenna has to fulfil requirements for the far-field region. This limitation may be substantially decreased by the use of the synthetic model but it requires additional information concerning this transmitting antenna which may be impossible to collect.
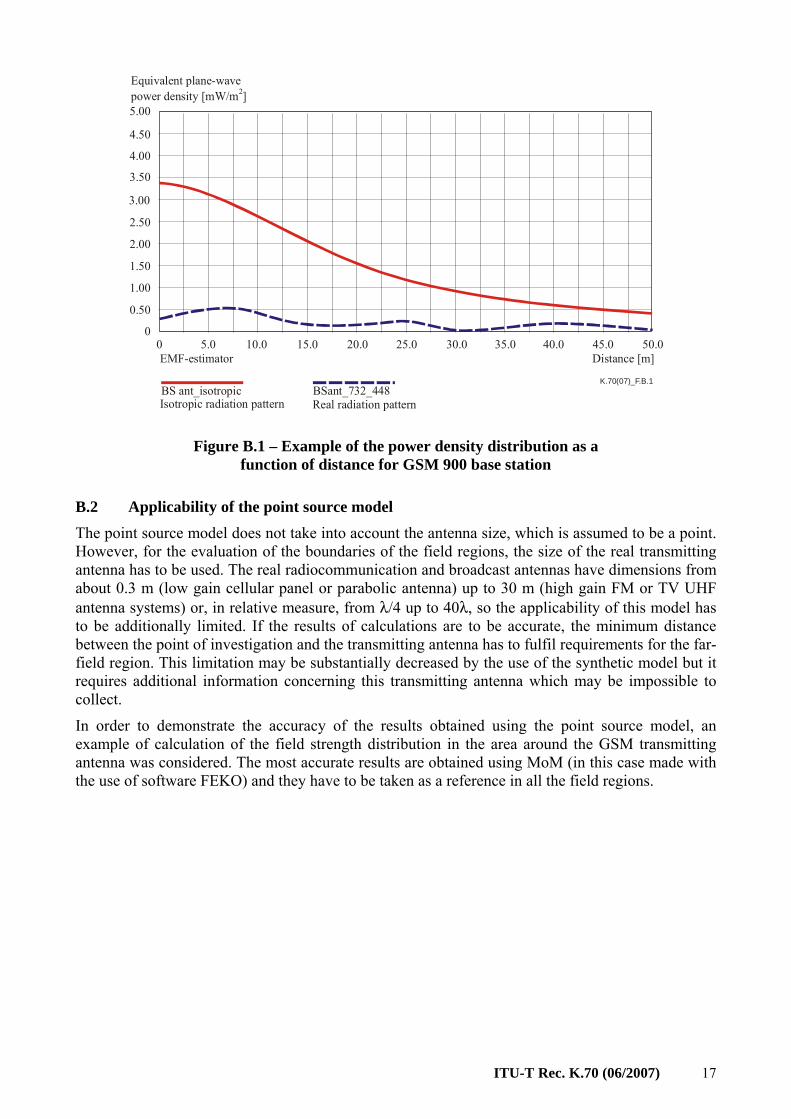
In order to demonstrate the accuracy of the results obtained using the point source model, an example of calculation of the field strength distribution in the area around the GSM transmitting antenna was considered. The most accurate results are obtained using MoM (in this case made with the use of software FEKO) and they have to be taken as a reference in all the field regions.
ITU-T Rec. K.70 (06/2007) 18
Example B.2. GSM 900 base station (high gain antenna) – comparison of the results obtained by different methods used for exposure assessment – far-field region (1.5 m a.t.l.) Transmitting antenna (panel) gain: 14.49 dBi Transmitter power: 50 W
Antenna height: 35 m above the terrain level VRP beam width: 13°
Frequency: 947.5 MHz EIRPmax: 820.4 W
Antenna height (size): 1.2 m Total losses (attenuation): 2.35 dB
Figure B.2 – Power density distribution emitted by a typical GSM 900 transmitting panel (1.2 m height) as a function of the distance to the
antenna tower at a height of 1.5 m a.t.l.
ITU-T Rec. K.70 (06/2007) 19
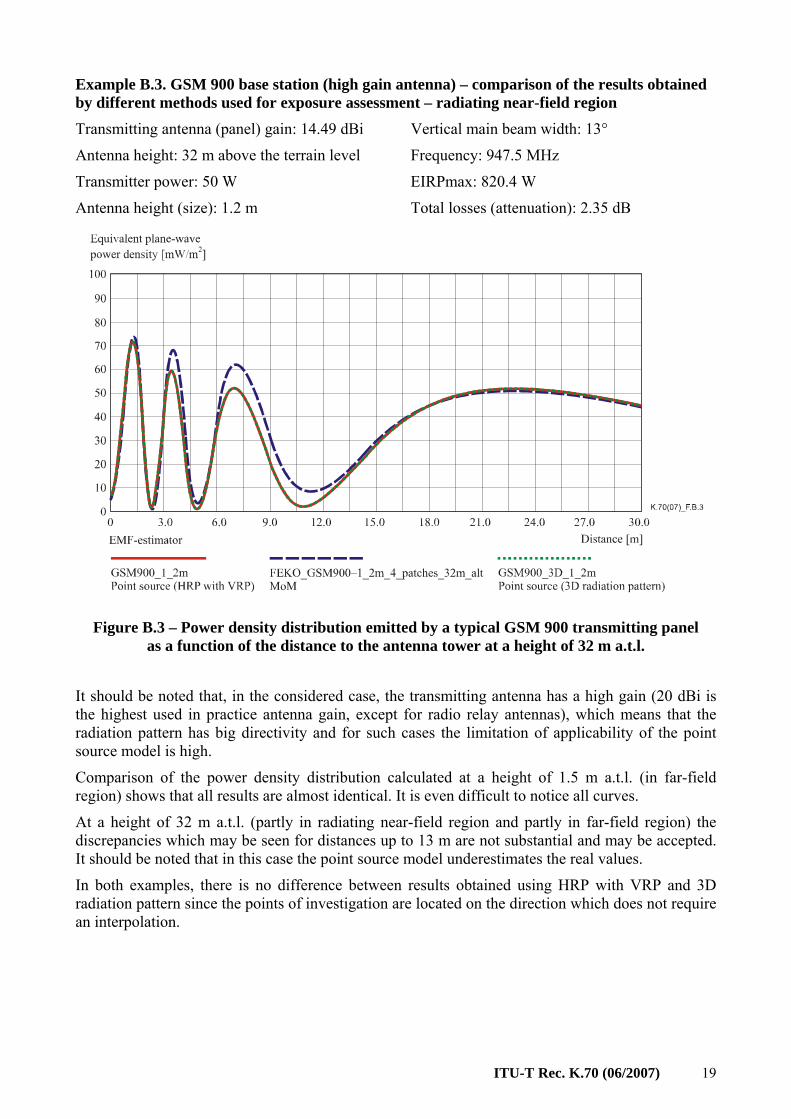
Example B.3. GSM 900 base station (high gain antenna) – comparison of the results obtained by different methods used for exposure assessment – radiating near-field region Transmitting antenna (panel) gain: 14.49 dBi Vertical main beam width: 13°
Antenna height: 32 m above the terrain level Frequency: 947.5 MHz
Transmitter power: 50 W EIRPmax: 820.4 W
Antenna height (size): 1.2 m Total losses (attenuation): 2.35 dB
Figure B.3 – Power density distribution emitted by a typical GSM 900 transmitting panel as a function of the distance to the antenna tower at a height of 32 m a.t.l.
It should be noted that, in the considered case, the transmitting antenna has a high gain (20 dBi is the highest used in practice antenna gain, except for radio relay antennas), which means that the radiation pattern has big directivity and for such cases the limitation of applicability of the point source model is high.
Comparison of the power density distribution calculated at a height of 1.5 m a.t.l. (in far-field region) shows that all results are almost identical. It is even difficult to notice all curves.
At a height of 32 m a.t.l. (partly in radiating near-field region and partly in far-field region) the discrepancies which may be seen for distances up to 13 m are not substantial and may be accepted. It should be noted that in this case the point source model underestimates the real values.
In both examples, there is no difference between results obtained using HRP with VRP and 3D radiation pattern since the points of investigation are located on the direction which does not require an interpolation.
ITU-T Rec. K.70 (06/2007) 20
These results also show that the point source model gives acceptable accuracy for some parts of the radiating near-field region. The following approach is presented in [IEC/EN 62311], concerning a similar problem. It is reasonable to define the minimum distance dm for the application of this model (beyond which an acceptable accuracy is expected) as:
dm = 0.6*D2/λ (B.3)
This is a minimum distance to the centre of the radiation source.
ITU-T Rec. K.70 (06/2007) 21
Annex C
Simplified method for the calculation of the compliance distances (This annex forms an integral part of this Recommendation)
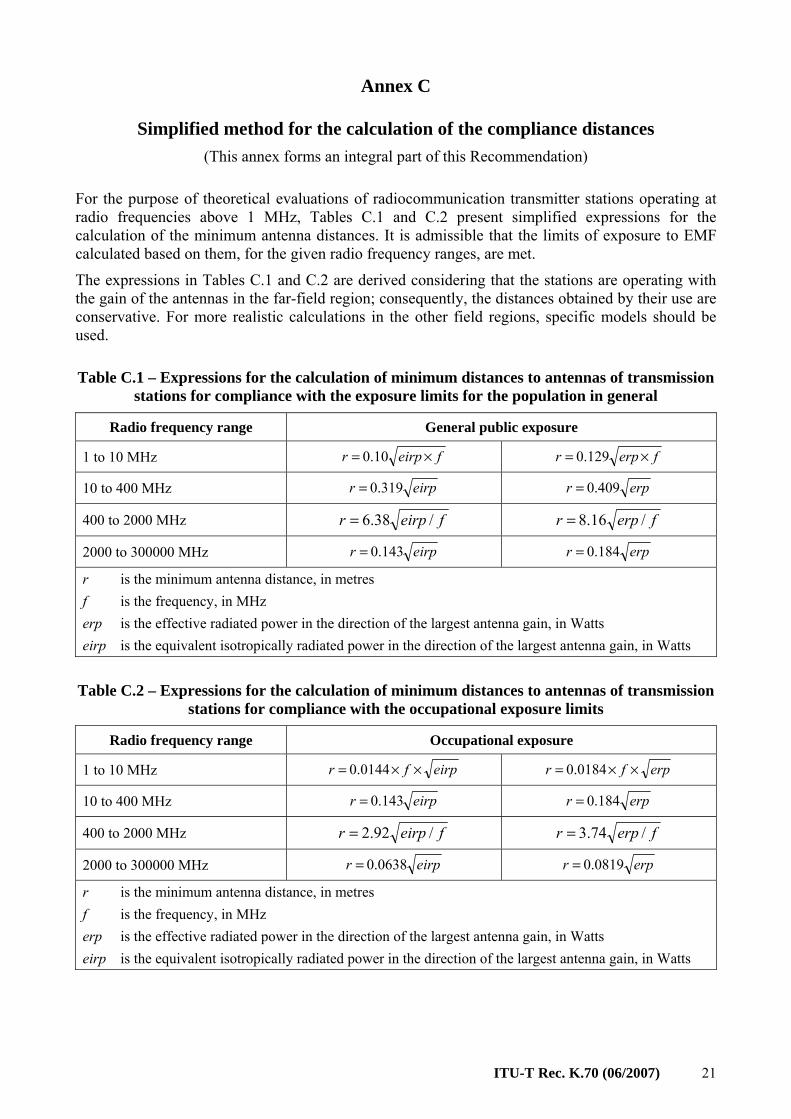
For the purpose of theoretical evaluations of radiocommunication transmitter stations operating at radio frequencies above 1 MHz, Tables C.1 and C.2 present simplified expressions for the calculation of the minimum antenna distances. It is admissible that the limits of exposure to EMF calculated based on them, for the given radio frequency ranges, are met.
The expressions in Tables C.1 and C.2 are derived considering that the stations are operating with the gain of the antennas in the far-field region; consequently, the distances obtained by their use are conservative. For more realistic calculations in the other field regions, specific models should be used.
Table C.1 – Expressions for the calculation of minimum distances to antennas of transmission stations for compliance with the exposure limits for the population in general
Radio frequency range General public exposure
1 to 10 MHz feirpr ×= 10.0 ferpr ×= 129.0
10 to 400 MHz eirpr 319.0= erpr 409.0=
400 to 2000 MHz feirpr /38.6= ferpr /16.8=
2000 to 300000 MHz eirpr 143.0= erpr 184.0=
r is the minimum antenna distance, in metres f is the frequency, in MHz erp is the effective radiated power in the direction of the largest antenna gain, in Watts eirp is the equivalent isotropically radiated power in the direction of the largest antenna gain, in Watts
Table C.2 – Expressions for the calculation of minimum distances to antennas of transmission stations for compliance with the occupational exposure limits
Radio frequency range Occupational exposure
1 to 10 MHz eirpfr ××= 0144.0 erpfr ××= 0184.0
10 to 400 MHz eirpr 143.0= erpr 184.0=
400 to 2000 MHz feirpr /92.2= ferpr /74.3=
2000 to 300000 MHz eirpr 0638.0= erpr 0819.0=
r is the minimum antenna distance, in metres f is the frequency, in MHz erp is the effective radiated power in the direction of the largest antenna gain, in Watts eirp is the equivalent isotropically radiated power in the direction of the largest antenna gain, in Watts
ITU-T Rec. K.70 (06/2007) 22
Annex D
Examples of mitigation techniques (This annex forms an integral part of this Recommendation)
The radiation level in the area accessible to people can be reduced in many ways. This annex describes possible methods, including some examples of results. Most mitigation techniques presented in this Recommendation can be applied to many different transmitting antennas used on base and transmitting stations (for example GSM, UMTS, TETRA, FM, TV, DVB-T, T-DAB, etc.).
D.1 Decrease in the transmitter power The simplest method to reduce radiation levels is to reduce transmitter power. If this method is applied, then the decrease in the transmitter power P corresponds linearly with the decrease in the power density S in all the observation points. It also corresponds with the decrease in the square of the electric field strength E2. Unfortunately, this method leads also to the reduction of the coverage area and for this reason it should be used only if other methods for some reasons cannot be applied.
D.2 Increase in the antenna height If the antenna height is increased, then the distances to all points of investigation are increased as well. It means that in this case the radiation level is reduced. This reduction is even greater because at the same time elevation angles to the considered area are moved to another part of the VRP of the transmitting antenna. This method can only be applied if a possibility to increase the antenna height exists. For example, it is difficult to apply this method for broadcasting transmitting antennas because they are typically mounted as high as possible and, for example, UHF TV antennas are typically mounted on the top of an antenna tower.
ITU-T Rec. K.70 (06/2007) 23
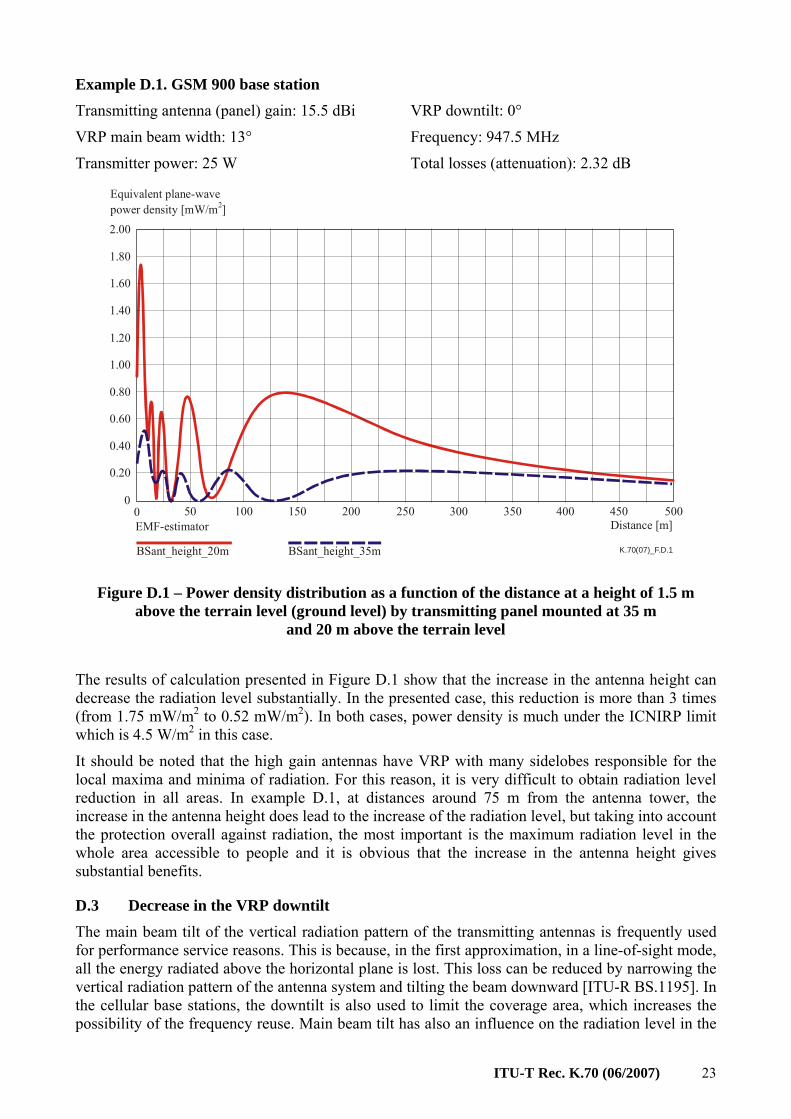
Example D.1. GSM 900 base station Transmitting antenna (panel) gain: 15.5 dBi VRP downtilt: 0°
VRP main beam width: 13° Frequency: 947.5 MHz
Transmitter power: 25 W Total losses (attenuation): 2.32 dB
K.70(07)_F.D.1
50 100 150 200 350 400 450250 3000
0.20
0.40
0.60
0.80
1.00
1.20
1.40
1.60
1.80
2.00
500EMF-estimator
BSant_height_35mBSant_height_20m
Distance [m]0
Equivalent plane-wavepower density [mW/m ]2
Figure D.1 – Power density distribution as a function of the distance at a height of 1.5 m above the terrain level (ground level) by transmitting panel mounted at 35 m
and 20 m above the terrain level
The results of calculation presented in Figure D.1 show that the increase in the antenna height can decrease the radiation level substantially. In the presented case, this reduction is more than 3 times (from 1.75 mW/m2 to 0.52 mW/m2). In both cases, power density is much under the ICNIRP limit which is 4.5 W/m2 in this case.
It should be noted that the high gain antennas have VRP with many sidelobes responsible for the local maxima and minima of radiation. For this reason, it is very difficult to obtain radiation level reduction in all areas. In example D.1, at distances around 75 m from the antenna tower, the increase in the antenna height does lead to the increase of the radiation level, but taking into account the protection overall against radiation, the most important is the maximum radiation level in the whole area accessible to people and it is obvious that the increase in the antenna height gives substantial benefits.
D.3 Decrease in the VRP downtilt
The main beam tilt of the vertical radiation pattern of the transmitting antennas is frequently used for performance service reasons. This is because, in the first approximation, in a line-of-sight mode, all the energy radiated above the horizontal plane is lost. This loss can be reduced by narrowing the vertical radiation pattern of the antenna system and tilting the beam downward [ITU-R BS.1195]. In the cellular base stations, the downtilt is also used to limit the coverage area, which increases the possibility of the frequency reuse. Main beam tilt has also an influence on the radiation level in the
ITU-T Rec. K.70 (06/2007) 24
proximity of the transmitting antenna. It can be generally stated that bigger downtilt gives bigger radiation levels in the proximity of the transmitting antenna. Although the main part of the radiation is emitted in the main beam, the changes in the radiation level appear also in all remaining directions (corresponding to sidelobes and nulls of the transmitting antenna VRP).
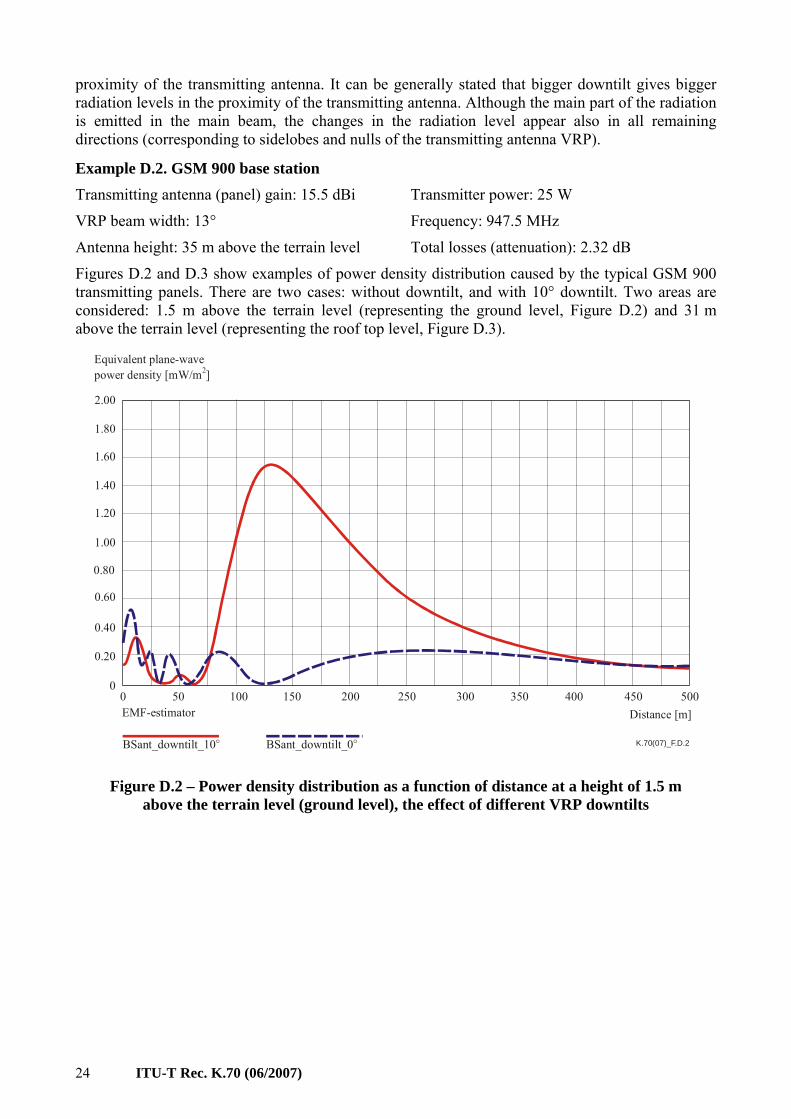
Example D.2. GSM 900 base station Transmitting antenna (panel) gain: 15.5 dBi Transmitter power: 25 W
VRP beam width: 13° Frequency: 947.5 MHz
Antenna height: 35 m above the terrain level Total losses (attenuation): 2.32 dB
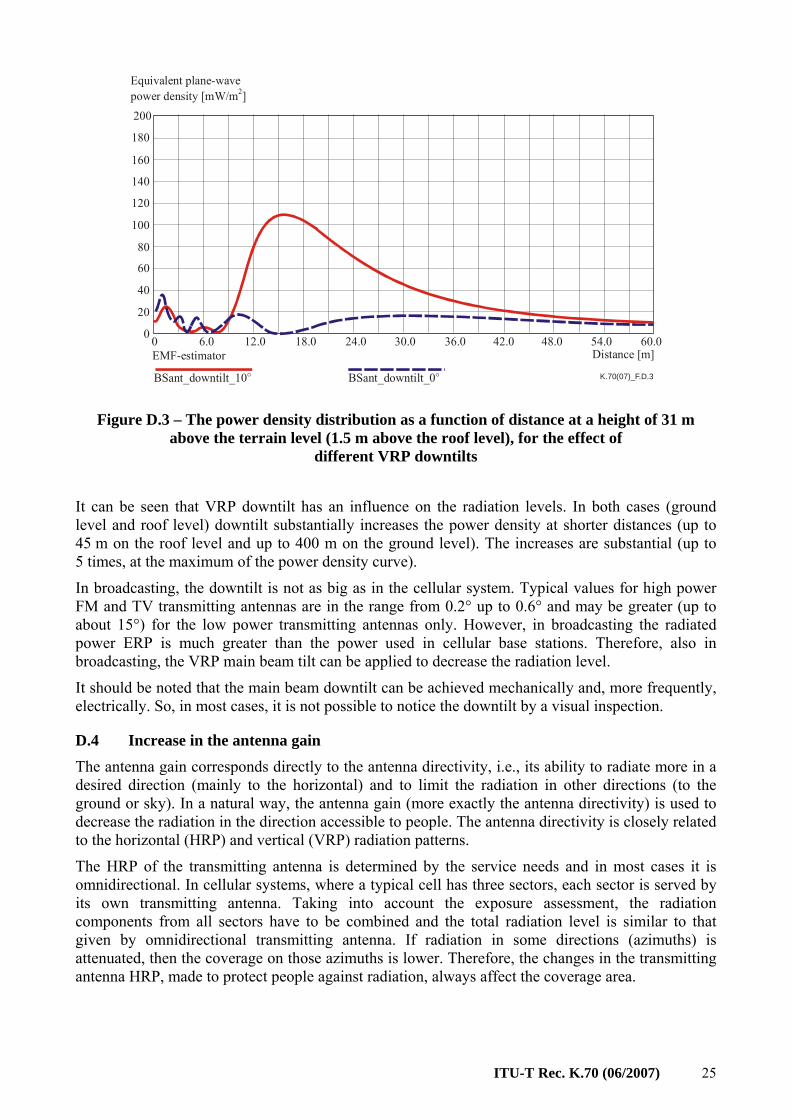
Figures D.2 and D.3 show examples of power density distribution caused by the typical GSM 900 transmitting panels. There are two cases: without downtilt, and with 10° downtilt. Two areas are considered: 1.5 m above the terrain level (representing the ground level, Figure D.2) and 31 m above the terrain level (representing the roof top level, Figure D.3).
K.70(07)_F.D.2
0
0.20
0.40
0.60
0.80
1.00
1.20
1.40
1.60
1.80
2.00
50 100 150 200 350 400 450 500250 300Distance [m]EMF-estimator
BSant_downtilt_0°BSant_downtilt_10°
0
Equivalent plane-wavepower density [mW/m ]2
Figure D.2 – Power density distribution as a function of distance at a height of 1.5 m above the terrain level (ground level), the effect of different VRP downtilts
ITU-T Rec. K.70 (06/2007) 25
Distance [m]
K.70(07)_F.D.3
0 6.0 12.0 18.0 24.0 30.0 36.0 42.0 48.0 54.0 60.0
20
40
60
80
100
120
140
160
180
200
EMF-estimator
BSant_downtilt_0°BSant_downtilt_10°
0
Equivalent plane-wavepower density [mW/m ]2
Figure D.3 – The power density distribution as a function of distance at a height of 31 m above the terrain level (1.5 m above the roof level), for the effect of
different VRP downtilts
It can be seen that VRP downtilt has an influence on the radiation levels. In both cases (ground level and roof level) downtilt substantially increases the power density at shorter distances (up to 45 m on the roof level and up to 400 m on the ground level). The increases are substantial (up to 5 times, at the maximum of the power density curve).
In broadcasting, the downtilt is not as big as in the cellular system. Typical values for high power FM and TV transmitting antennas are in the range from 0.2° up to 0.6° and may be greater (up to about 15°) for the low power transmitting antennas only. However, in broadcasting the radiated power ERP is much greater than the power used in cellular base stations. Therefore, also in broadcasting, the VRP main beam tilt can be applied to decrease the radiation level.
It should be noted that the main beam downtilt can be achieved mechanically and, more frequently, electrically. So, in most cases, it is not possible to notice the downtilt by a visual inspection.
D.4 Increase in the antenna gain The antenna gain corresponds directly to the antenna directivity, i.e., its ability to radiate more in a desired direction (mainly to the horizontal) and to limit the radiation in other directions (to the ground or sky). In a natural way, the antenna gain (more exactly the antenna directivity) is used to decrease the radiation in the direction accessible to people. The antenna directivity is closely related to the horizontal (HRP) and vertical (VRP) radiation patterns.
The HRP of the transmitting antenna is determined by the service needs and in most cases it is omnidirectional. In cellular systems, where a typical cell has three sectors, each sector is served by its own transmitting antenna. Taking into account the exposure assessment, the radiation components from all sectors have to be combined and the total radiation level is similar to that given by omnidirectional transmitting antenna. If radiation in some directions (azimuths) is attenuated, then the coverage on those azimuths is lower. Therefore, the changes in the transmitting antenna HRP, made to protect people against radiation, always affect the coverage area.
ITU-T Rec. K.70 (06/2007) 26
A different situation takes place in the case of the transmitting antenna VRP, which determines the radiation as a function of the distance to the antenna. Higher gain implies narrower main beam width and if the VRP has filled nulls [ITU-R BS.1195], then there are no losses in the coverage area. Indirectly (via the main beam width of the VRP) the antenna gain is responsible for the division of the radiated energy into two parts: the part which is radiated in the main beam direction (above the area under antenna which is in close proximity to it) and the part radiated to the area under the antenna in close proximity to it. So, it can be seen that the antenna gain (or more precisely the vertical main beam width) may be used to reduce the radiation level in close proximity to the antenna.
The coverage area strongly depends on radiated power ERP (or eirp). The same value of the ERP can be achieved by the low power transmitter feeding the high gain antenna and by the high power transmitter feeding the low gain antenna. As far as the protection against radiation is concerned, a much better choice is to use the low power transmitter feeding the high gain antenna.
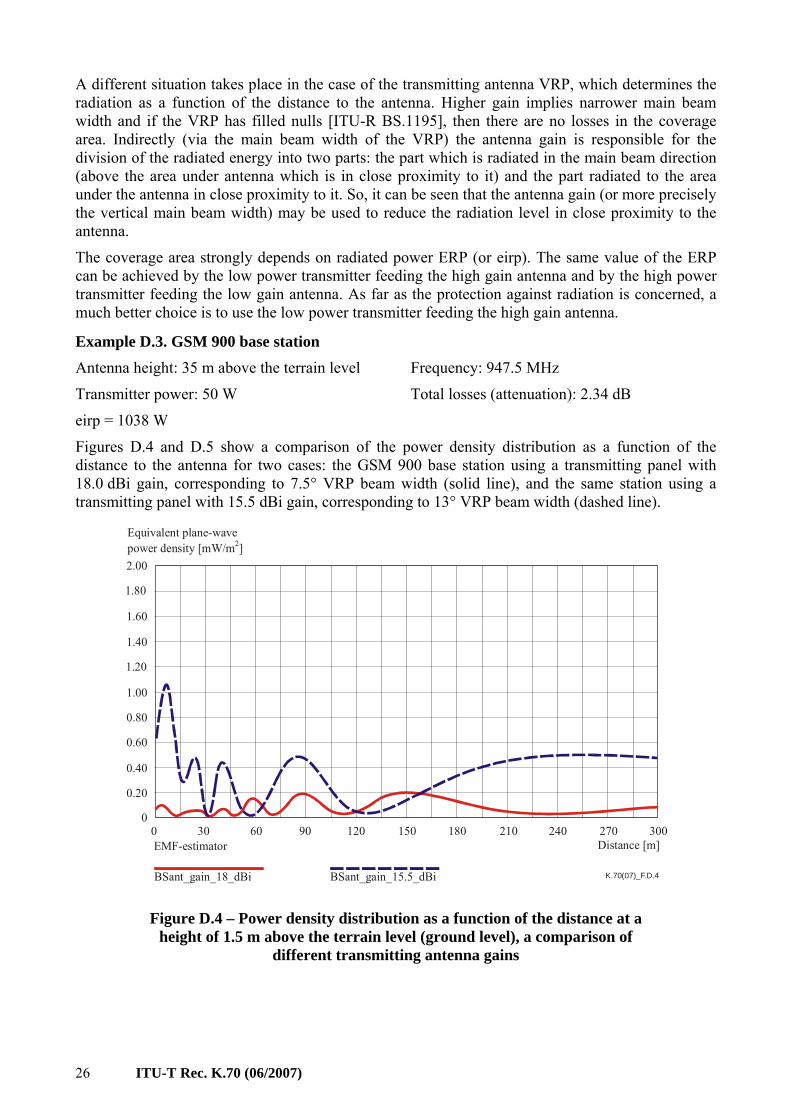
Example D.3. GSM 900 base station Antenna height: 35 m above the terrain level Frequency: 947.5 MHz
Transmitter power: 50 W Total losses (attenuation): 2.34 dB
eirp = 1038 W
Figures D.4 and D.5 show a comparison of the power density distribution as a function of the distance to the antenna for two cases: the GSM 900 base station using a transmitting panel with 18.0 dBi gain, corresponding to 7.5° VRP beam width (solid line), and the same station using a transmitting panel with 15.5 dBi gain, corresponding to 13° VRP beam width (dashed line).
Distance [m]
K.70(07)_F.D.4
0 30 60 90 120 150 180 210 240 270 300
0.20
0.40
0.60
0.80
1.00
1.20
1.40
1.60
1.80
2.00
BSant_gain_18_dBi BSant_gain_15.5_dBi
EMF-estimator
0
Equivalent plane-wavepower density [mW/m ]2
Figure D.4 – Power density distribution as a function of the distance at a height of 1.5 m above the terrain level (ground level), a comparison of
different transmitting antenna gains
ITU-T Rec. K.70 (06/2007) 27
K.70(07)_F.D.5BSant_gain_18_dBi BSant_gain_15.5_dBi
0 6.0 12.0 18.0 24.0 30.0 36.0 42.0 48.0 54.0 60.0Distance [m]EMF-estimator
10
20
30
40
50
60
70
80
90
100
0
Equivalent plane-wavepower density [mW/m ]2
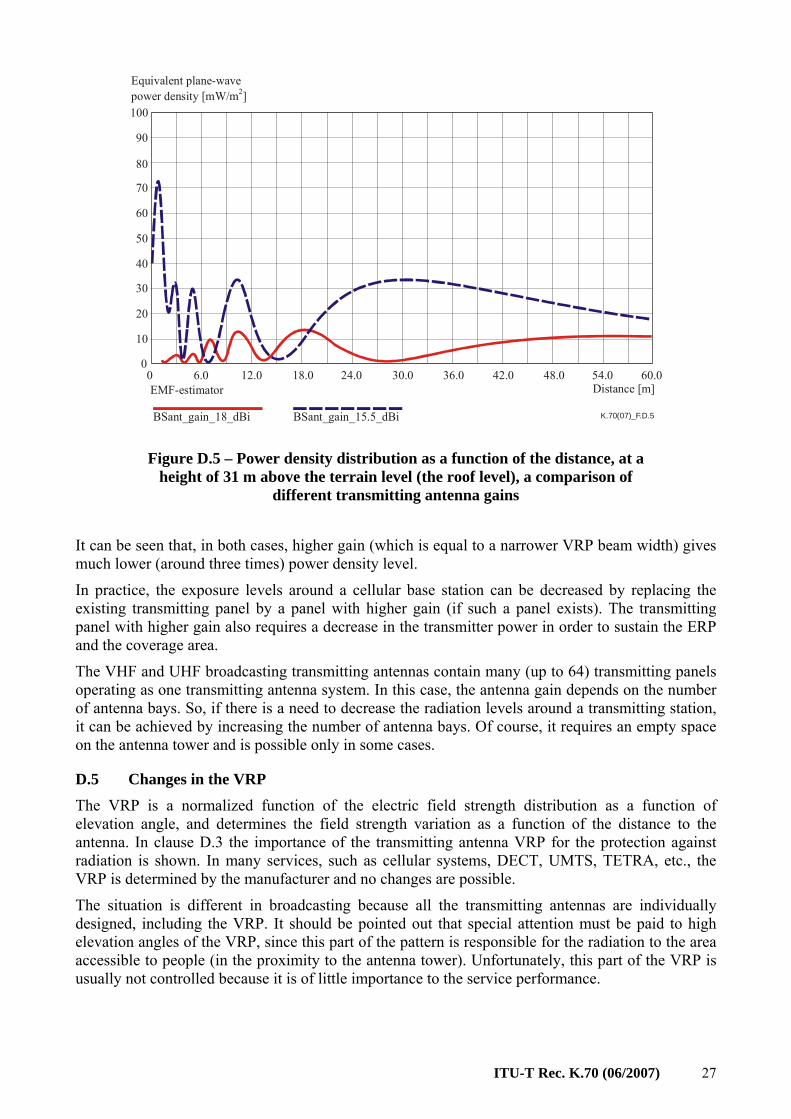
Figure D.5 – Power density distribution as a function of the distance, at a height of 31 m above the terrain level (the roof level), a comparison of
different transmitting antenna gains
It can be seen that, in both cases, higher gain (which is equal to a narrower VRP beam width) gives much lower (around three times) power density level.
In practice, the exposure levels around a cellular base station can be decreased by replacing the existing transmitting panel by a panel with higher gain (if such a panel exists). The transmitting panel with higher gain also requires a decrease in the transmitter power in order to sustain the ERP and the coverage area.
The VHF and UHF broadcasting transmitting antennas contain many (up to 64) transmitting panels operating as one transmitting antenna system. In this case, the antenna gain depends on the number of antenna bays. So, if there is a need to decrease the radiation levels around a transmitting station, it can be achieved by increasing the number of antenna bays. Of course, it requires an empty space on the antenna tower and is possible only in some cases.
D.5 Changes in the VRP The VRP is a normalized function of the electric field strength distribution as a function of elevation angle, and determines the field strength variation as a function of the distance to the antenna. In clause D.3 the importance of the transmitting antenna VRP for the protection against radiation is shown. In many services, such as cellular systems, DECT, UMTS, TETRA, etc., the VRP is determined by the manufacturer and no changes are possible.
The situation is different in broadcasting because all the transmitting antennas are individually designed, including the VRP. It should be pointed out that special attention must be paid to high elevation angles of the VRP, since this part of the pattern is responsible for the radiation to the area accessible to people (in the proximity to the antenna tower). Unfortunately, this part of the VRP is usually not controlled because it is of little importance to the service performance.
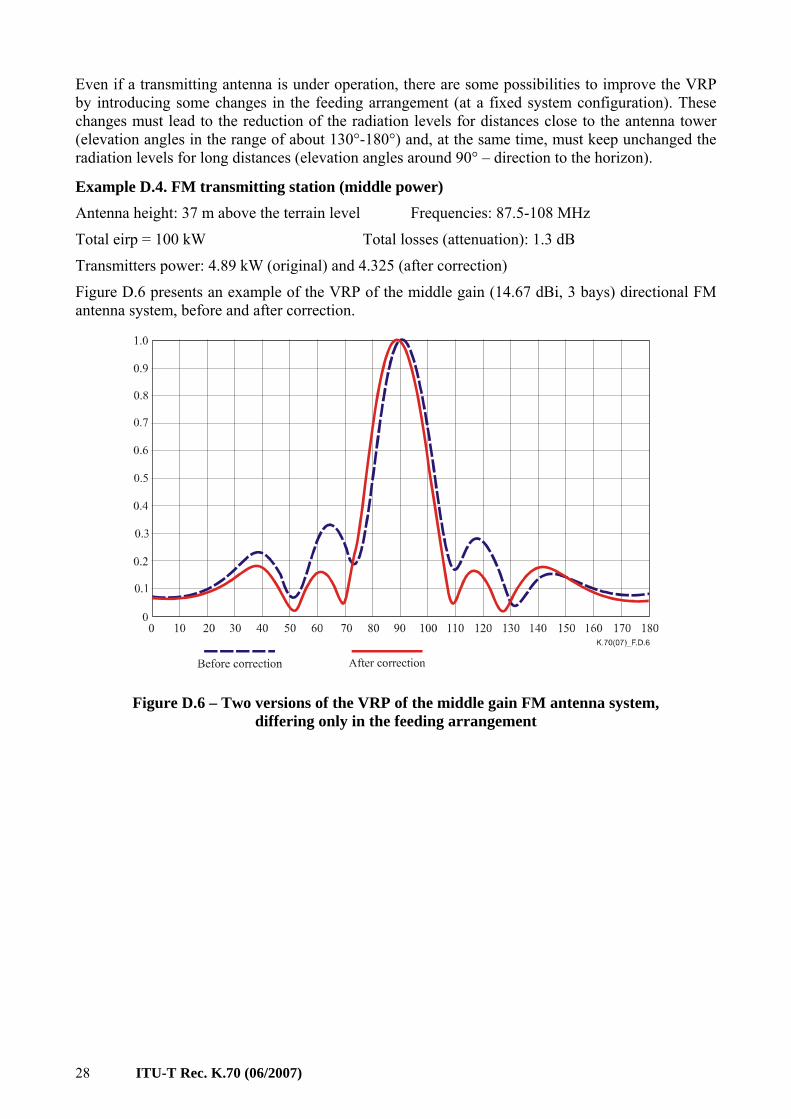
ITU-T Rec. K.70 (06/2007) 28
Even if a transmitting antenna is under operation, there are some possibilities to improve the VRP by introducing some changes in the feeding arrangement (at a fixed system configuration). These changes must lead to the reduction of the radiation levels for distances close to the antenna tower (elevation angles in the range of about 130°-180°) and, at the same time, must keep unchanged the radiation levels for long distances (elevation angles around 90° – direction to the horizon).
Example D.4. FM transmitting station (middle power) Antenna height: 37 m above the terrain level Frequencies: 87.5-108 MHz
Total eirp = 100 kW Total losses (attenuation): 1.3 dB
Transmitters power: 4.89 kW (original) and 4.325 (after correction)
Figure D.6 presents an example of the VRP of the middle gain (14.67 dBi, 3 bays) directional FM antenna system, before and after correction.
Figure D.6 – Two versions of the VRP of the middle gain FM antenna system, differing only in the feeding arrangement
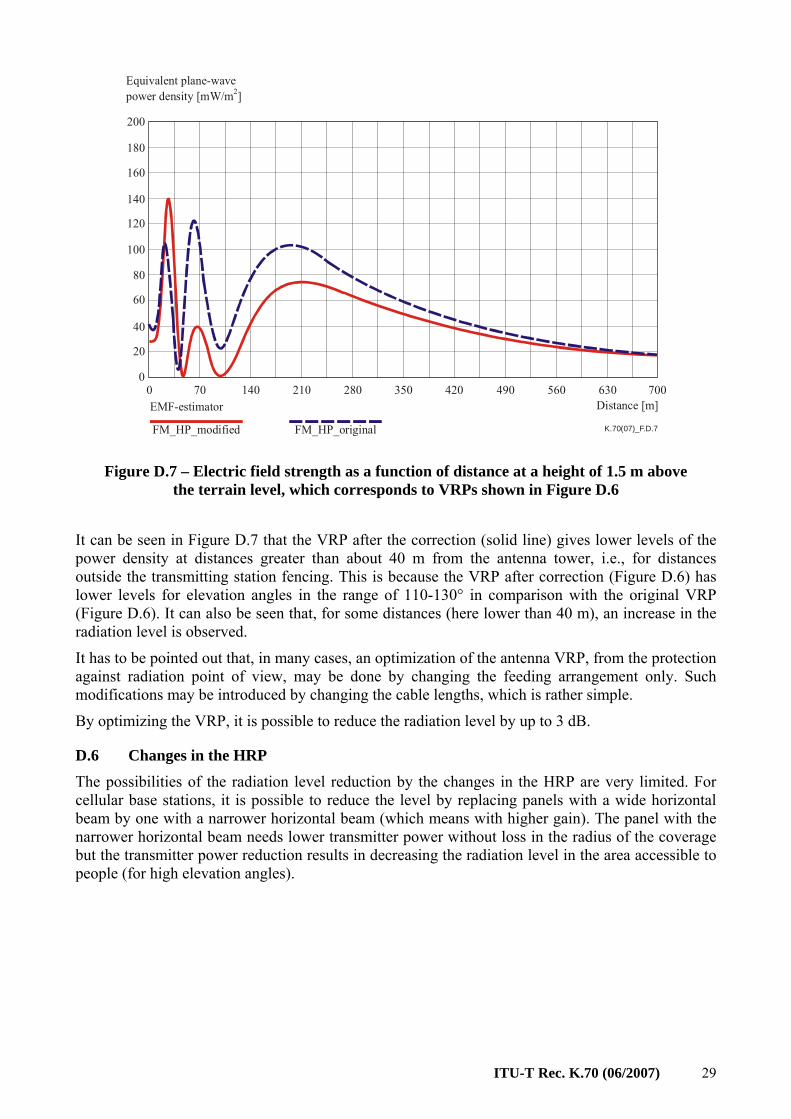
ITU-T Rec. K.70 (06/2007) 29
K.70(07)_F.D.7
070 140 210 280 350 420 490 560 630 700
20
40
60
80
100
120
140
160
180
200
FM_HP_modified FM_HP_original
EMF-estimator Distance [m]0
Equivalent plane-wavepower density [mW/m ]2
Figure D.7 – Electric field strength as a function of distance at a height of 1.5 m above the terrain level, which corresponds to VRPs shown in Figure D.6
It can be seen in Figure D.7 that the VRP after the correction (solid line) gives lower levels of the power density at distances greater than about 40 m from the antenna tower, i.e., for distances outside the transmitting station fencing. This is because the VRP after correction (Figure D.6) has lower levels for elevation angles in the range of 110-130° in comparison with the original VRP (Figure D.6). It can also be seen that, for some distances (here lower than 40 m), an increase in the radiation level is observed.
It has to be pointed out that, in many cases, an optimization of the antenna VRP, from the protection against radiation point of view, may be done by changing the feeding arrangement only. Such modifications may be introduced by changing the cable lengths, which is rather simple.
By optimizing the VRP, it is possible to reduce the radiation level by up to 3 dB.
D.6 Changes in the HRP The possibilities of the radiation level reduction by the changes in the HRP are very limited. For cellular base stations, it is possible to reduce the level by replacing panels with a wide horizontal beam by one with a narrower horizontal beam (which means with higher gain). The panel with the narrower horizontal beam needs lower transmitter power without loss in the radius of the coverage but the transmitter power reduction results in decreasing the radiation level in the area accessible to people (for high elevation angles).
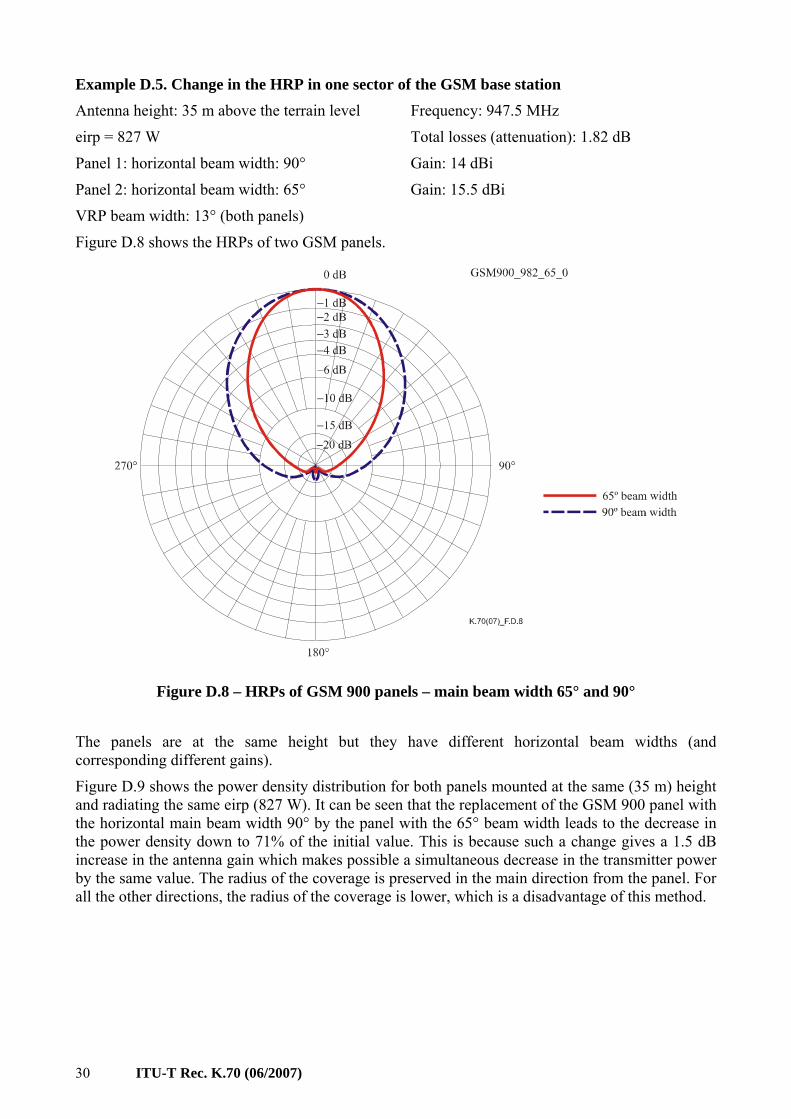
ITU-T Rec. K.70 (06/2007) 30
Example D.5. Change in the HRP in one sector of the GSM base station Antenna height: 35 m above the terrain level Frequency: 947.5 MHz
eirp = 827 W Total losses (attenuation): 1.82 dB
Panel 1: horizontal beam width: 90° Gain: 14 dBi
Panel 2: horizontal beam width: 65° Gain: 15.5 dBi
VRP beam width: 13° (both panels)
Figure D.8 shows the HRPs of two GSM panels.
Figure D.8 – HRPs of GSM 900 panels – main beam width 65° and 90°
The panels are at the same height but they have different horizontal beam widths (and corresponding different gains).
Figure D.9 shows the power density distribution for both panels mounted at the same (35 m) height and radiating the same eirp (827 W). It can be seen that the replacement of the GSM 900 panel with the horizontal main beam width 90° by the panel with the 65° beam width leads to the decrease in the power density down to 71% of the initial value. This is because such a change gives a 1.5 dB increase in the antenna gain which makes possible a simultaneous decrease in the transmitter power by the same value. The radius of the coverage is preserved in the main direction from the panel. For all the other directions, the radius of the coverage is lower, which is a disadvantage of this method.
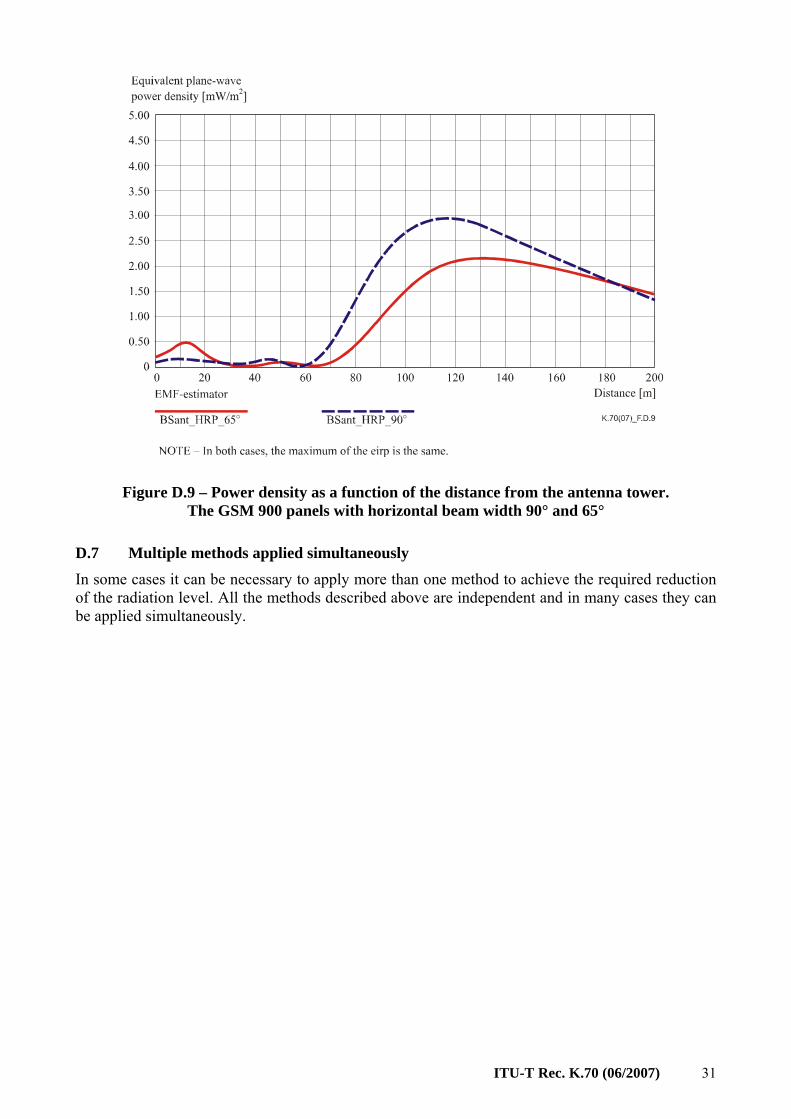
ITU-T Rec. K.70 (06/2007) 31
Figure D.9 – Power density as a function of the distance from the antenna tower. The GSM 900 panels with horizontal beam width 90° and 65°
D.7 Multiple methods applied simultaneously In some cases it can be necessary to apply more than one method to achieve the required reduction of the radiation level. All the methods described above are independent and in many cases they can be applied simultaneously.
ITU-T Rec. K.70 (06/2007) 32
Appendix I
Software EMF-estimator (This appendix does not form an integral part of this Recommendation)
The EMF-estimator software has been developed in order to support the application of the methods described in this Recommendation. It may help to make an estimation of the cumulative exposure in the vicinity of transmitting stations in the case of many different transmitting systems operating at different frequencies. The EMF-estimator is one of the available programs which may be used for that purpose. This software is not intended to be used, and in fact cannot be used, for any certification procedure of the transmitting equipment.
I.1 Applicability of the EMF-estimator The EMF-estimator software uses the point source model (described in clause 5.3) and exploits the radiation patterns contained in the attached library or introduced by the user. The radiation pattern may have a full, two-variable 3D form f(θ,φ) (a function of azimuth and elevation angles) or may be represented by the horizontal and vertical radiation patterns HRP(φ) and VRP(θ). The credibility of the calculation is strongly affected by the model used and depends on the region under investigation and available data concerning a transmitting antenna and operating channels (carriers).
Generally, the results of calculations are adequate in the far-field region and give acceptable results in most of the radiating near-field region. Depending on the direction, one may expect an overestimation or underestimation of the field in the radiating near-field region. The EMF-estimator should not be used for calculations in the reactive near-filed region because the models on which it is based are too simple to describe correctly the real conditions determining the EMFs distribution, so for this region the results are not presented by the software.
The calculations are more credible if a full radiation pattern f(θ,φ) is used. Sufficiently good estimations are also achieved if horizontal and vertical radiation patterns HRP(φ) and VRP(θ) are applied. The influence of the radiation pattern and, consequently, the importance of the exactness of its knowledge grows with increasing transmitting antenna gain.
In the EMF-estimator package, the library is included, containing examples of the radiation pattern for many typical radiocommunication and broadcast services. One should note, however, that if the radiation patterns are used for antennas which are only similar to those in operation, the results of the calculations should be regarded as an estimation only. In many practical cases in which radiation levels are far under the limits, such estimation can be sufficient.
The input data for the EMF-estimator contains the operating frequency and the size of each transmitting antenna. Based on this data, the area around an object is split into regions of the field. For the area too close to the transmitting antennas, appropriate information appears on the screen. In practice, only the area in very close proximity to the transmitting antenna (usually with no access for people) cannot be analysed with the use of the EMF-estimator.
The EMF-estimator evaluates: • electric field strength; • magnetic field strength; • the equivalent plane-wave power flux-density; • near- and far-field region distances; • compliance distances (for general public and occupational exposure); • cumulative exposure coefficients Wt and We;
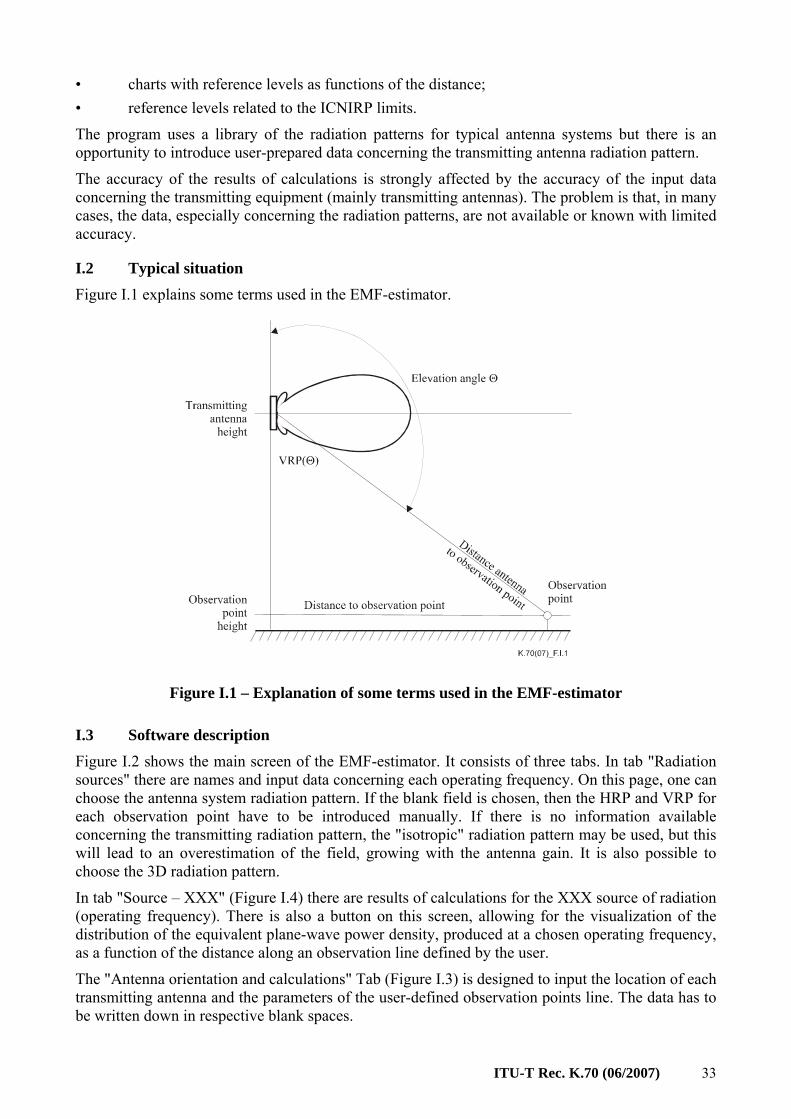
ITU-T Rec. K.70 (06/2007) 33
• charts with reference levels as functions of the distance; • reference levels related to the ICNIRP limits.
The program uses a library of the radiation patterns for typical antenna systems but there is an opportunity to introduce user-prepared data concerning the transmitting antenna radiation pattern.
The accuracy of the results of calculations is strongly affected by the accuracy of the input data concerning the transmitting equipment (mainly transmitting antennas). The problem is that, in many cases, the data, especially concerning the radiation patterns, are not available or known with limited accuracy.
I.2 Typical situation Figure I.1 explains some terms used in the EMF-estimator.
Figure I.1 – Explanation of some terms used in the EMF-estimator
I.3 Software description
Figure I.2 shows the main screen of the EMF-estimator. It consists of three tabs. In tab "Radiation sources" there are names and input data concerning each operating frequency. On this page, one can choose the antenna system radiation pattern. If the blank field is chosen, then the HRP and VRP for each observation point have to be introduced manually. If there is no information available concerning the transmitting radiation pattern, the "isotropic" radiation pattern may be used, but this will lead to an overestimation of the field, growing with the antenna gain. It is also possible to choose the 3D radiation pattern.
In tab "Source – XXX" (Figure I.4) there are results of calculations for the XXX source of radiation (operating frequency). There is also a button on this screen, allowing for the visualization of the distribution of the equivalent plane-wave power density, produced at a chosen operating frequency, as a function of the distance along an observation line defined by the user.
The "Antenna orientation and calculations" Tab (Figure I.3) is designed to input the location of each transmitting antenna and the parameters of the user-defined observation points line. The data has to be written down in respective blank spaces.
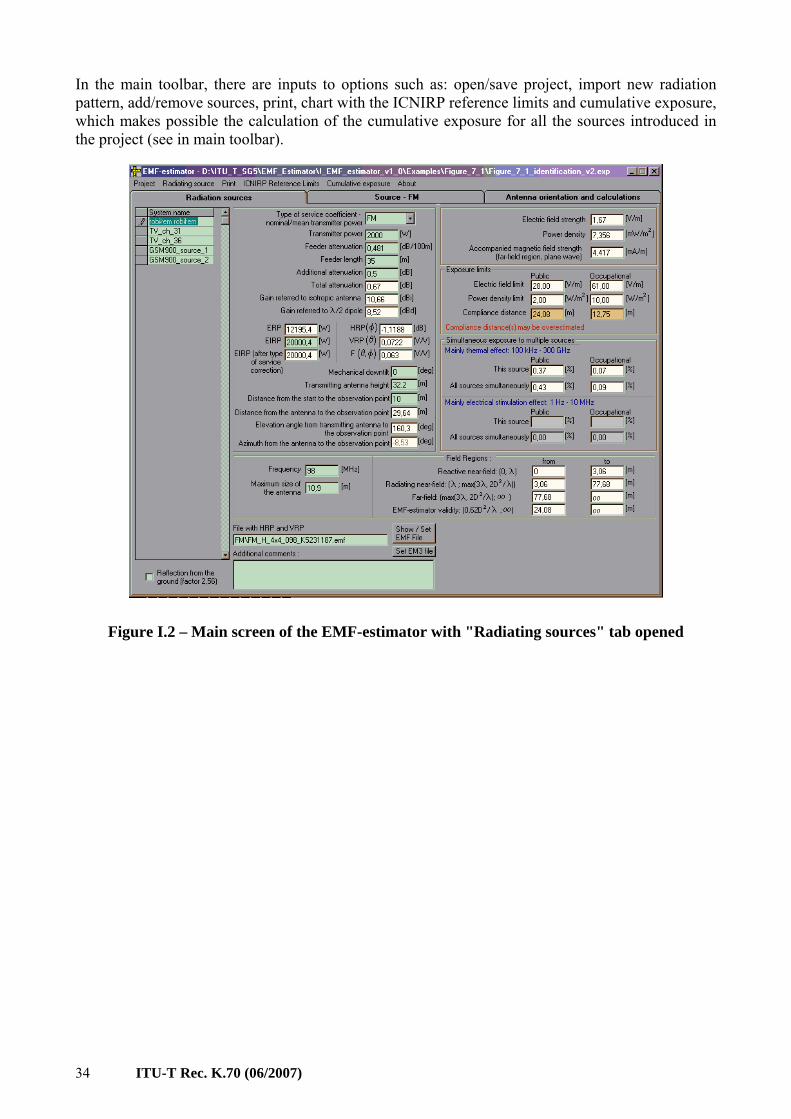
ITU-T Rec. K.70 (06/2007) 34
In the main toolbar, there are inputs to options such as: open/save project, import new radiation pattern, add/remove sources, print, chart with the ICNIRP reference limits and cumulative exposure, which makes possible the calculation of the cumulative exposure for all the sources introduced in the project (see in main toolbar).
Figure I.2 – Main screen of the EMF-estimator with "Radiating sources" tab opened
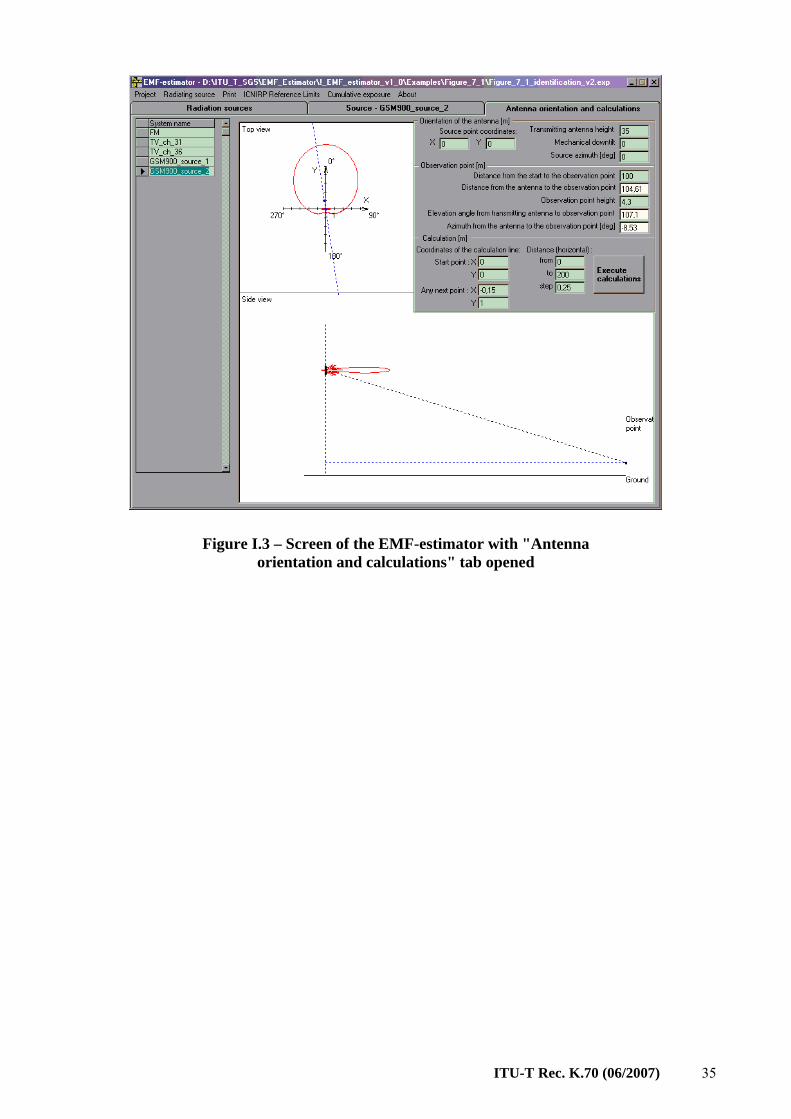
ITU-T Rec. K.70 (06/2007) 35
Figure I.3 – Screen of the EMF-estimator with "Antenna orientation and calculations" tab opened
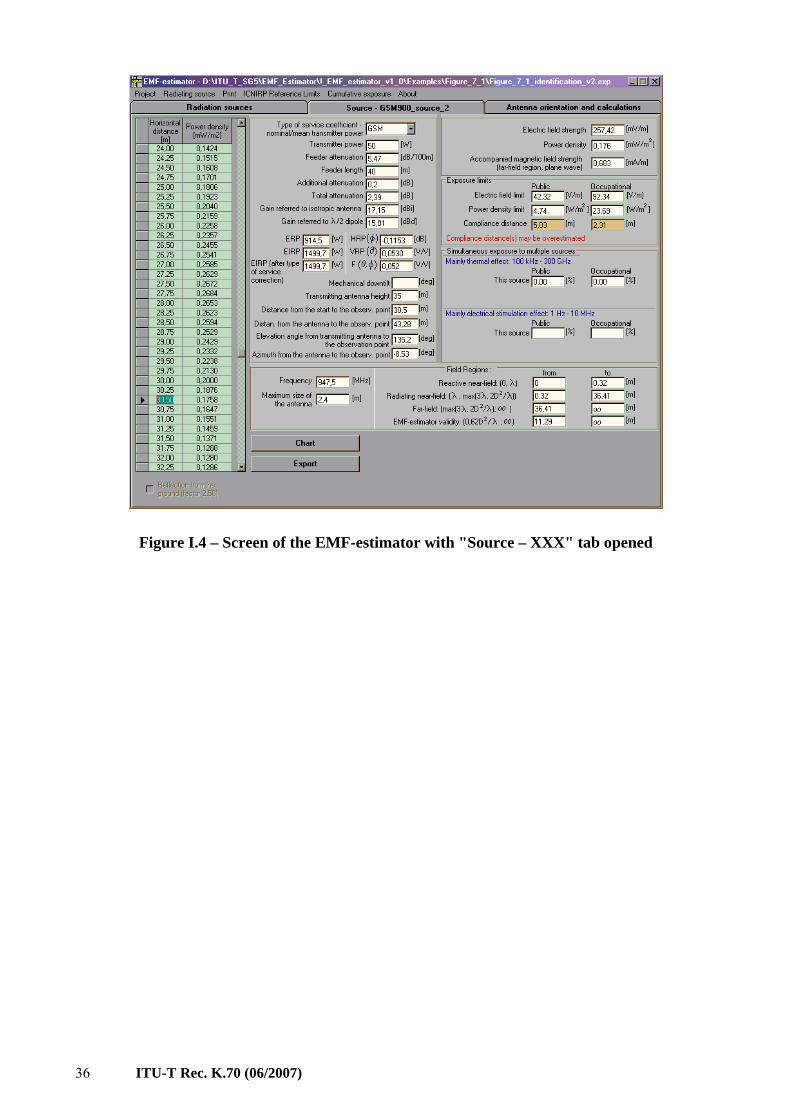
ITU-T Rec. K.70 (06/2007) 36
Figure I.4 – Screen of the EMF-estimator with "Source – XXX" tab opened
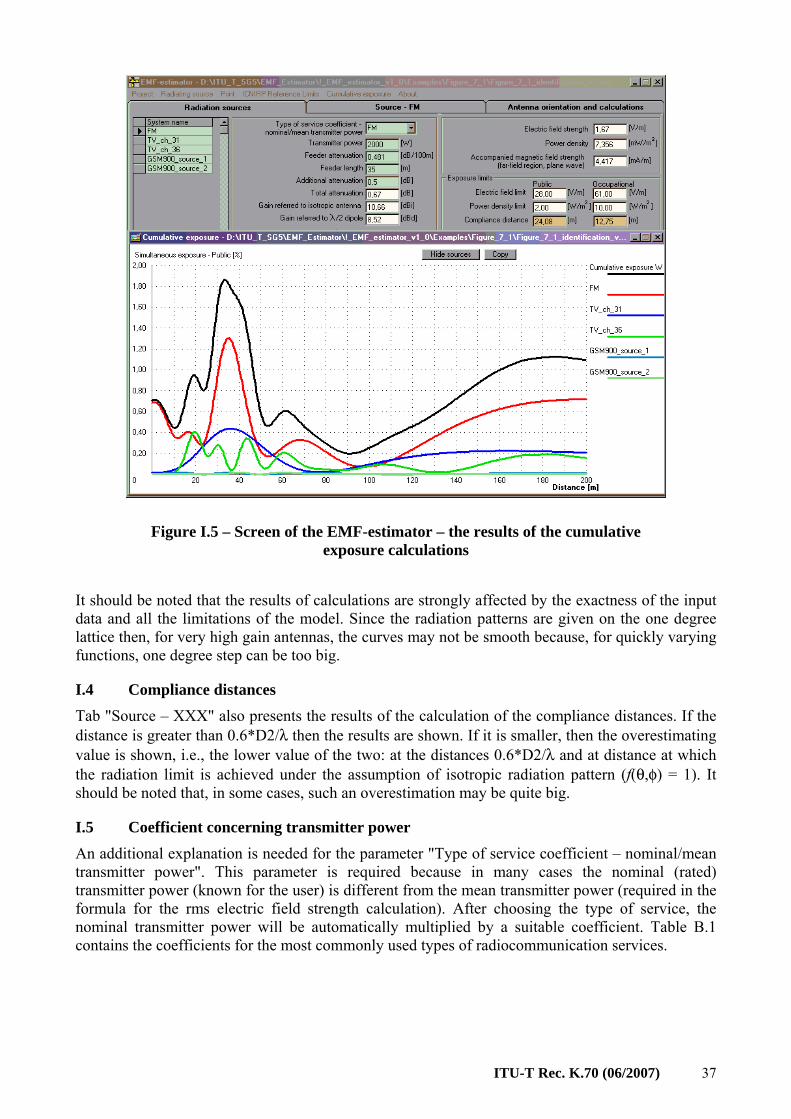
ITU-T Rec. K.70 (06/2007) 37
Figure I.5 – Screen of the EMF-estimator – the results of the cumulative exposure calculations
It should be noted that the results of calculations are strongly affected by the exactness of the input data and all the limitations of the model. Since the radiation patterns are given on the one degree lattice then, for very high gain antennas, the curves may not be smooth because, for quickly varying functions, one degree step can be too big.
I.4 Compliance distances Tab "Source – XXX" also presents the results of the calculation of the compliance distances. If the distance is greater than 0.6*D2/λ then the results are shown. If it is smaller, then the overestimating value is shown, i.e., the lower value of the two: at the distances 0.6*D2/λ and at distance at which the radiation limit is achieved under the assumption of isotropic radiation pattern (f(θ,φ) = 1). It should be noted that, in some cases, such an overestimation may be quite big.
I.5 Coefficient concerning transmitter power An additional explanation is needed for the parameter "Type of service coefficient – nominal/mean transmitter power". This parameter is required because in many cases the nominal (rated) transmitter power (known for the user) is different from the mean transmitter power (required in the formula for the rms electric field strength calculation). After choosing the type of service, the nominal transmitter power will be automatically multiplied by a suitable coefficient. Table B.1 contains the coefficients for the most commonly used types of radiocommunication services.
ITU-T Rec. K.70 (06/2007) 38
I.6 Library – radiation patterns of the antenna systems In the folder "Library", the files containing radiation patterns for some typical antenna systems used in radiocommunication and broadcasting are collected. There are patterns for FM, TV VHF, TV UHF, GSM 900, GSM 1800, AM and radio relay link antennas. Of course, this library contains only the samples of possible configurations of antennas and antenna systems that are in use worldwide. It should be noted that each broadcasting antenna is individually designed and there are no two identical systems. However, the antennas included in the library represent typical solutions realized in many telecommunication systems. There is also a subfolder "User input templates" containing "User_2D_Import_Radiation _Pattern.csv" and "User_3D_Import _Radiation _Pattern.csv" files, in a format which enables importing user data for any additional antenna, by using the import option of the EMF-estimator. Such files may then be added to the library and used in the calculations.
I.7 Examples of calculations In the folder "Examples", the projects with results of calculations presented in this Recommendation are stored. It is possible to open any project and to follow the respective calculations. It is also possible to introduce changes, in order to observe their influence on the results.
I.8 Additional comments a) The minimum input data required for the electric field strength calculations are the values
of EIRP (or ERP), operating frequency, size of the antenna and the distance from the transmitting antenna to the observation point.
b) In many situations there are no data concerning the radiation pattern of the antenna system. In this case it is reasonable to assume f(θ,φ) = 1. It should be noted, however, that the calculations under such an assumption will give the maximum value of the electric field strength, i.e., valid only in the direction of the main beam of the antenna (the direction of the highest radiation level), and some higher values in all the other directions.
c) If there is an access to the data for feeder attenuation and additional losses in the antenna feeding system, then the results of calculations of the EIRP are more accurate. Otherwise, the typical value of attenuation should be introduced (in most cases about 3 dB).
I.9 System requirements • MS Windows 95/98/Me/NT/2000/XP/Vista; • Pentium processor 400 MHz; • 64 MB RAM; • 20 MB free space on HDD; • VGA monitor (800 × 600 resolution).
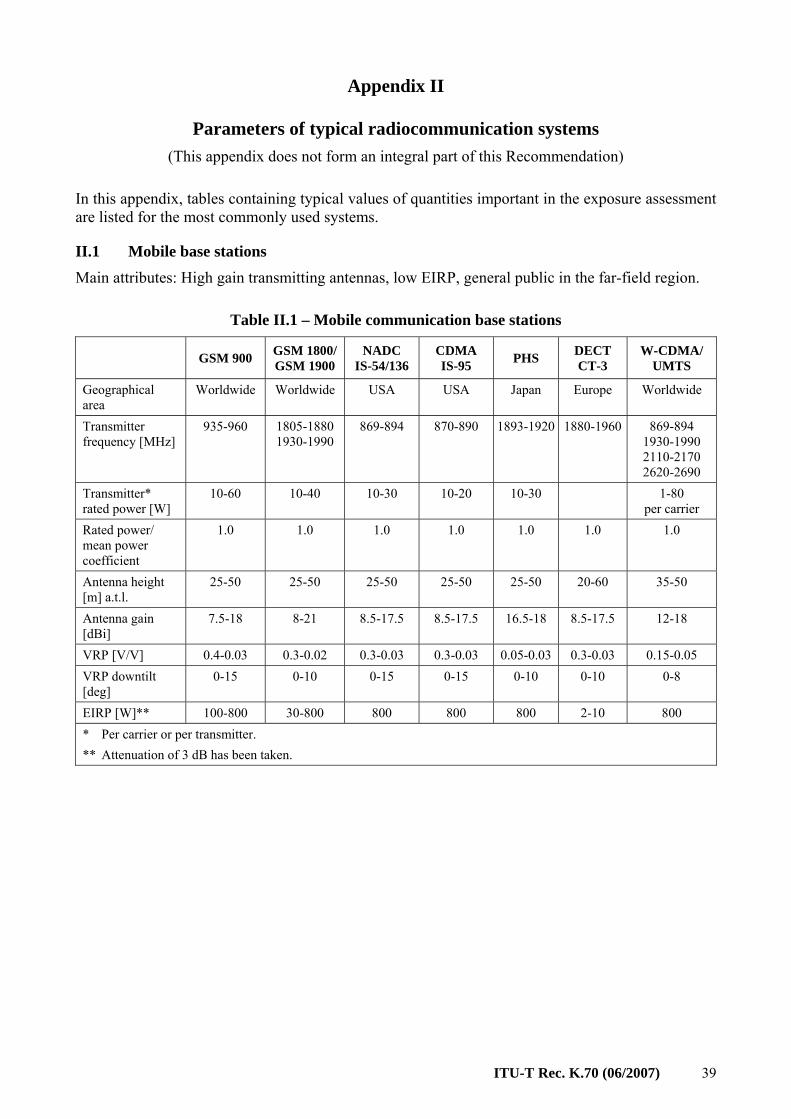
ITU-T Rec. K.70 (06/2007) 39
Appendix II
Parameters of typical radiocommunication systems (This appendix does not form an integral part of this Recommendation)
In this appendix, tables containing typical values of quantities important in the exposure assessment are listed for the most commonly used systems.
II.1 Mobile base stations Main attributes: High gain transmitting antennas, low EIRP, general public in the far-field region.
Table II.1 – Mobile communication base stations
GSM 900 GSM 1800/GSM 1900
NADC IS-54/136
CDMA IS-95 PHS DECT
CT-3 W-CDMA/
UMTS
Geographical area
Worldwide Worldwide USA USA Japan Europe Worldwide
Transmitter frequency [MHz]
935-960 1805-18801930-1990
869-894 870-890 1893-1920 1880-1960 869-894 1930-1990 2110-2170 2620-2690
Transmitter* rated power [W]
10-60 10-40 10-30 10-20 10-30 1-80 per carrier
Rated power/ mean power coefficient
1.0 1.0 1.0 1.0 1.0 1.0 1.0
Antenna height [m] a.t.l.
25-50 25-50 25-50 25-50 25-50 20-60 35-50
Antenna gain [dBi]
7.5-18 8-21 8.5-17.5 8.5-17.5 16.5-18 8.5-17.5 12-18
VRP [V/V] 0.4-0.03 0.3-0.02 0.3-0.03 0.3-0.03 0.05-0.03 0.3-0.03 0.15-0.05 VRP downtilt [deg]
0-15 0-10 0-15 0-15 0-10 0-10 0-8
EIRP [W]** 100-800 30-800 800 800 800 2-10 800 * Per carrier or per transmitter. ** Attenuation of 3 dB has been taken.
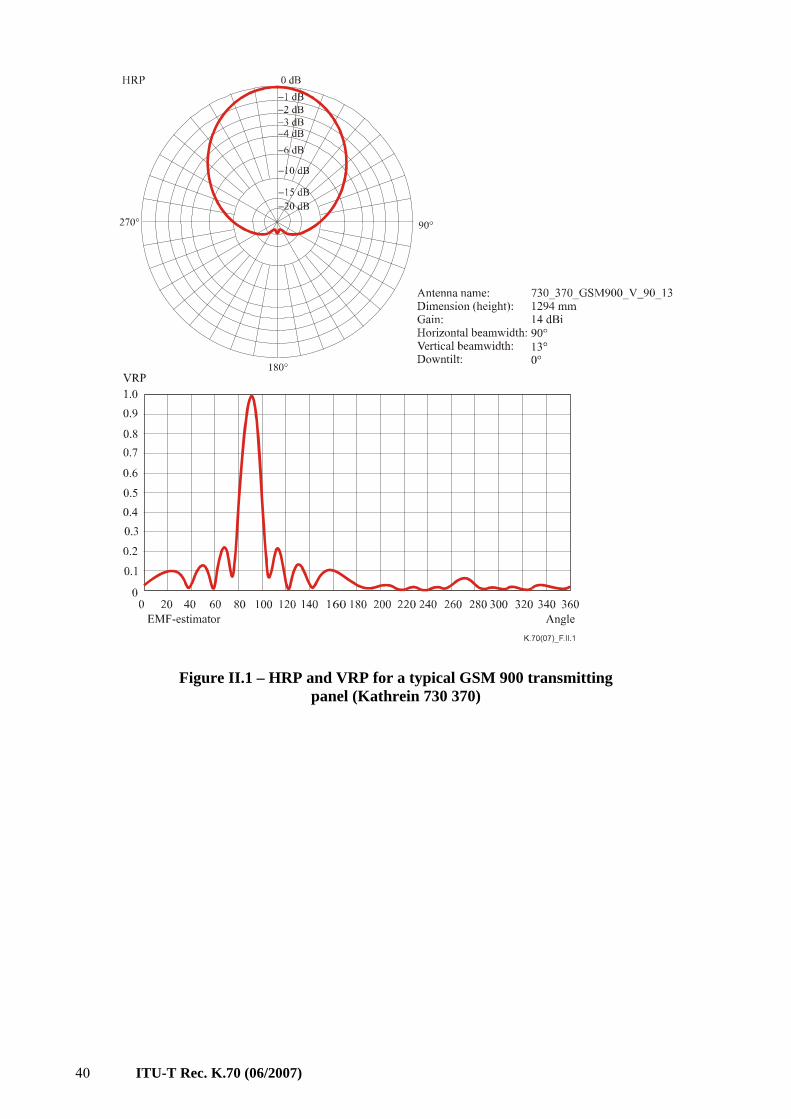
ITU-T Rec. K.70 (06/2007) 40
Figure II.1 – HRP and VRP for a typical GSM 900 transmitting panel (Kathrein 730 370)
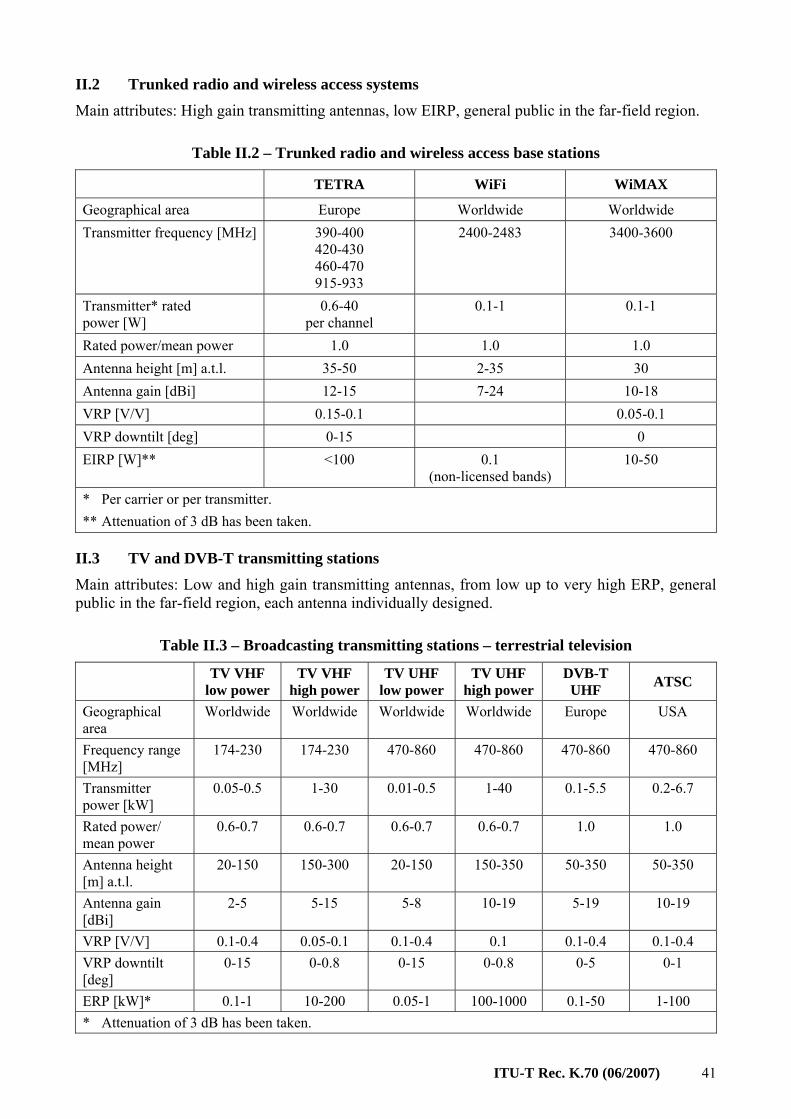
ITU-T Rec. K.70 (06/2007) 41
II.2 Trunked radio and wireless access systems Main attributes: High gain transmitting antennas, low EIRP, general public in the far-field region.
Table II.2 – Trunked radio and wireless access base stations
TETRA WiFi WiMAX
Geographical area Europe Worldwide Worldwide Transmitter frequency [MHz] 390-400
420-430 460-470 915-933
2400-2483 3400-3600
Transmitter* rated power [W]
0.6-40 per channel
0.1-1 0.1-1
Rated power/mean power 1.0 1.0 1.0 Antenna height [m] a.t.l. 35-50 2-35 30 Antenna gain [dBi] 12-15 7-24 10-18 VRP [V/V] 0.15-0.1 0.05-0.1 VRP downtilt [deg] 0-15 0 EIRP [W]** <100 0.1
(non-licensed bands) 10-50
* Per carrier or per transmitter. ** Attenuation of 3 dB has been taken.
II.3 TV and DVB-T transmitting stations Main attributes: Low and high gain transmitting antennas, from low up to very high ERP, general public in the far-field region, each antenna individually designed.
Table II.3 – Broadcasting transmitting stations – terrestrial television
TV VHF low power
TV VHF high power
TV UHF low power
TV UHF high power
DVB-T UHF ATSC
Geographical area
Worldwide Worldwide Worldwide Worldwide Europe USA
Frequency range [MHz]
174-230 174-230 470-860 470-860 470-860 470-860
Transmitter power [kW]
0.05-0.5 1-30 0.01-0.5 1-40 0.1-5.5 0.2-6.7
Rated power/ mean power
0.6-0.7 0.6-0.7 0.6-0.7 0.6-0.7 1.0 1.0
Antenna height [m] a.t.l.
20-150 150-300 20-150 150-350 50-350 50-350
Antenna gain [dBi]
2-5 5-15 5-8 10-19 5-19 10-19
VRP [V/V] 0.1-0.4 0.05-0.1 0.1-0.4 0.1 0.1-0.4 0.1-0.4 VRP downtilt [deg]
0-15 0-0.8 0-15 0-0.8 0-5 0-1
ERP [kW]* 0.1-1 10-200 0.05-1 100-1000 0.1-50 1-100 * Attenuation of 3 dB has been taken.
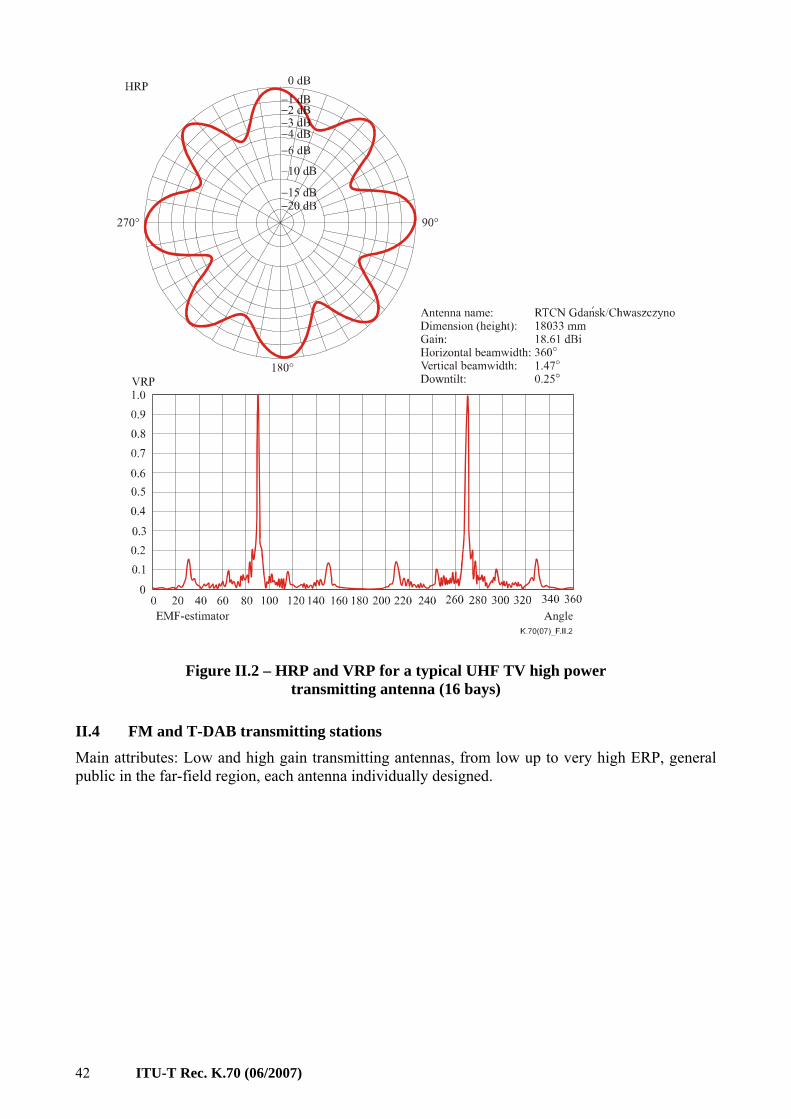
ITU-T Rec. K.70 (06/2007) 42
Figure II.2 – HRP and VRP for a typical UHF TV high power transmitting antenna (16 bays)
II.4 FM and T-DAB transmitting stations Main attributes: Low and high gain transmitting antennas, from low up to very high ERP, general public in the far-field region, each antenna individually designed.
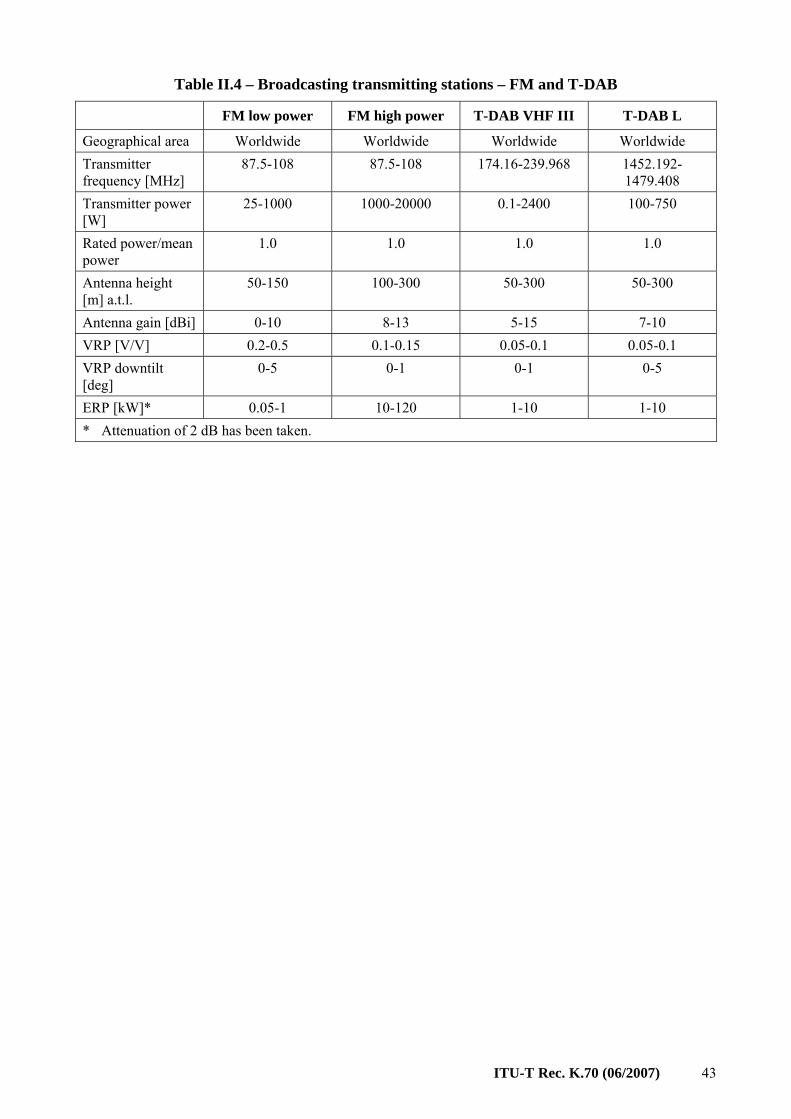
ITU-T Rec. K.70 (06/2007) 43
Table II.4 – Broadcasting transmitting stations – FM and T-DAB
FM low power FM high power T-DAB VHF III T-DAB L
Geographical area Worldwide Worldwide Worldwide Worldwide Transmitter frequency [MHz]
87.5-108 87.5-108 174.16-239.968 1452.192-1479.408
Transmitter power [W]
25-1000 1000-20000 0.1-2400 100-750
Rated power/mean power
1.0 1.0 1.0 1.0
Antenna height [m] a.t.l.
50-150 100-300 50-300 50-300
Antenna gain [dBi] 0-10 8-13 5-15 7-10 VRP [V/V] 0.2-0.5 0.1-0.15 0.05-0.1 0.05-0.1 VRP downtilt [deg]
0-5 0-1 0-1 0-5
ERP [kW]* 0.05-1 10-120 1-10 1-10 * Attenuation of 2 dB has been taken.
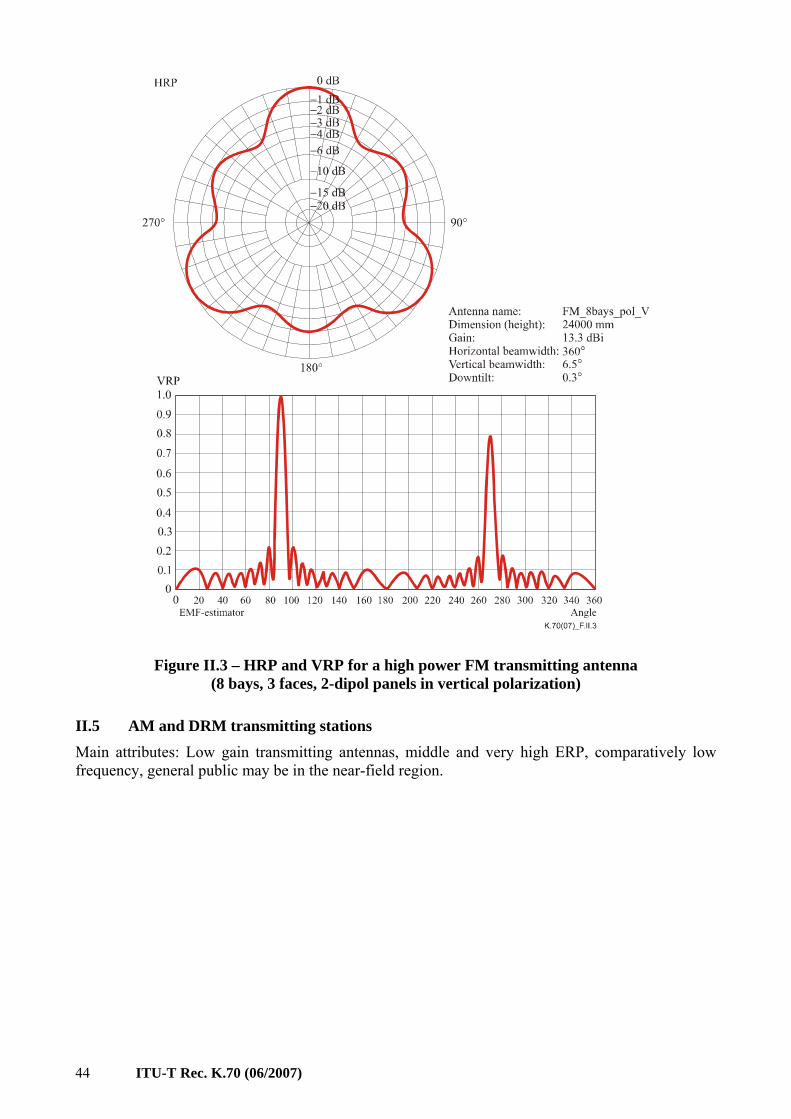
ITU-T Rec. K.70 (06/2007) 44
Figure II.3 – HRP and VRP for a high power FM transmitting antenna (8 bays, 3 faces, 2-dipol panels in vertical polarization)
II.5 AM and DRM transmitting stations Main attributes: Low gain transmitting antennas, middle and very high ERP, comparatively low frequency, general public may be in the near-field region.
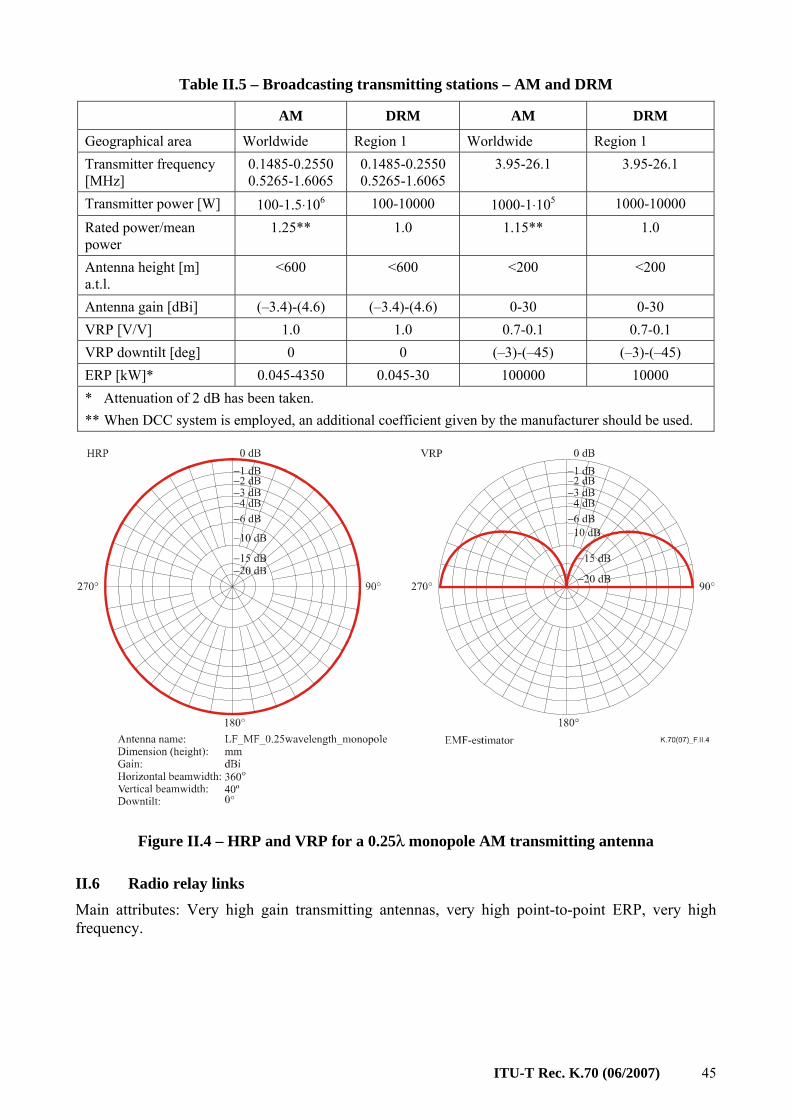
ITU-T Rec. K.70 (06/2007) 45
Table II.5 – Broadcasting transmitting stations – AM and DRM
AM DRM AM DRM
Geographical area Worldwide Region 1 Worldwide Region 1 Transmitter frequency [MHz]
0.1485-0.2550 0.5265-1.6065
0.1485-0.2550 0.5265-1.6065
3.95-26.1 3.95-26.1
Transmitter power [W] 100-1.5⋅106 100-10000 1000-1⋅105 1000-10000 Rated power/mean power
1.25** 1.0 1.15** 1.0
Antenna height [m] a.t.l.
<600 <600 <200 <200
Antenna gain [dBi] (–3.4)-(4.6) (–3.4)-(4.6) 0-30 0-30 VRP [V/V] 1.0 1.0 0.7-0.1 0.7-0.1 VRP downtilt [deg] 0 0 (–3)-(–45) (–3)-(–45) ERP [kW]* 0.045-4350 0.045-30 100000 10000 * Attenuation of 2 dB has been taken. ** When DCC system is employed, an additional coefficient given by the manufacturer should be used.
Figure II.4 – HRP and VRP for a 0.25λ monopole AM transmitting antenna
II.6 Radio relay links Main attributes: Very high gain transmitting antennas, very high point-to-point ERP, very high frequency.
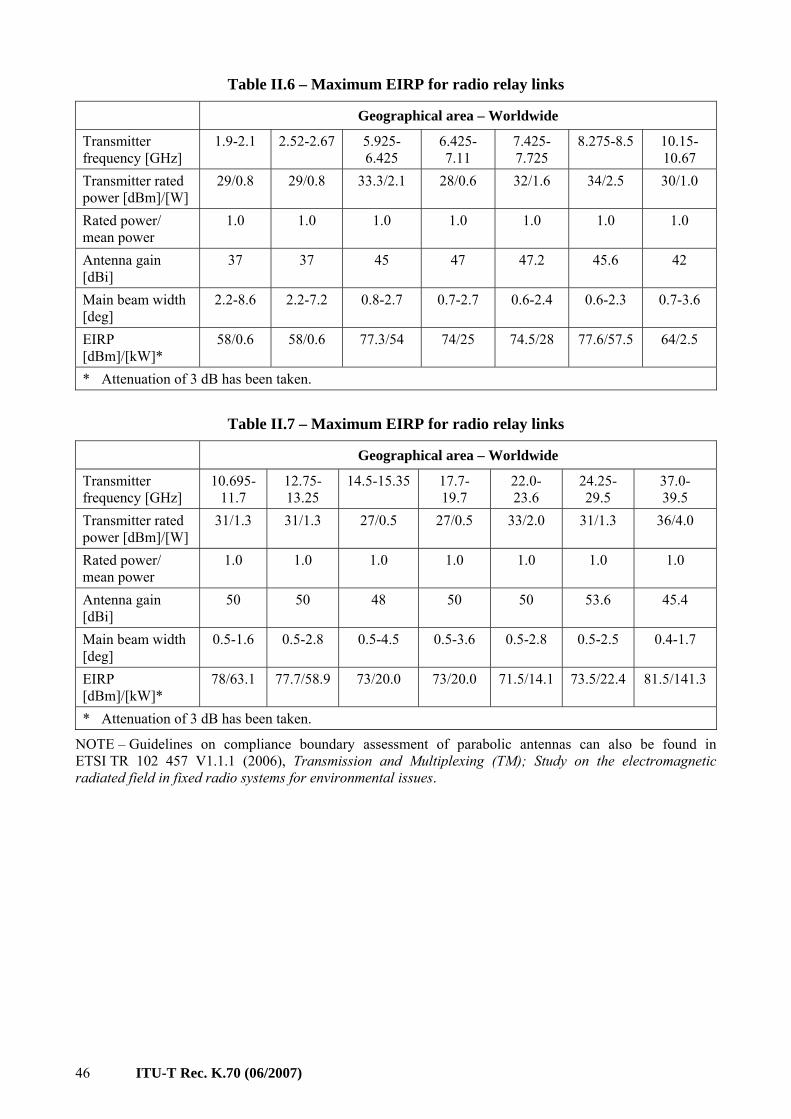
ITU-T Rec. K.70 (06/2007) 46
Table II.6 – Maximum EIRP for radio relay links
Geographical area – Worldwide
Transmitter frequency [GHz]
1.9-2.1 2.52-2.67 5.925-6.425
6.425-7.11
7.425-7.725
8.275-8.5 10.15-10.67
Transmitter rated power [dBm]/[W]
29/0.8 29/0.8 33.3/2.1 28/0.6 32/1.6 34/2.5 30/1.0
Rated power/ mean power
1.0 1.0 1.0 1.0 1.0 1.0 1.0
Antenna gain [dBi]
37 37 45 47 47.2 45.6 42
Main beam width [deg]
2.2-8.6 2.2-7.2 0.8-2.7 0.7-2.7 0.6-2.4 0.6-2.3 0.7-3.6
EIRP [dBm]/[kW]*
58/0.6 58/0.6 77.3/54 74/25 74.5/28 77.6/57.5 64/2.5
* Attenuation of 3 dB has been taken.
Table II.7 – Maximum EIRP for radio relay links
Geographical area – Worldwide
Transmitter frequency [GHz]
10.695-11.7
12.75-13.25
14.5-15.35 17.7- 19.7
22.0- 23.6
24.25- 29.5
37.0- 39.5
Transmitter rated power [dBm]/[W]
31/1.3 31/1.3 27/0.5 27/0.5 33/2.0 31/1.3 36/4.0
Rated power/ mean power
1.0 1.0 1.0 1.0 1.0 1.0 1.0
Antenna gain [dBi]
50 50 48 50 50 53.6 45.4
Main beam width [deg]
0.5-1.6 0.5-2.8 0.5-4.5 0.5-3.6 0.5-2.8 0.5-2.5 0.4-1.7
EIRP [dBm]/[kW]*
78/63.1 77.7/58.9 73/20.0 73/20.0 71.5/14.1 73.5/22.4 81.5/141.3
* Attenuation of 3 dB has been taken.
NOTE – Guidelines on compliance boundary assessment of parabolic antennas can also be found in ETSI TR 102 457 V1.1.1 (2006), Transmission and Multiplexing (TM); Study on the electromagnetic radiated field in fixed radio systems for environmental issues.

Printed in Switzerland Geneva, 2008
SERIES OF ITU-T RECOMMENDATIONS
Series A Organization of the work of ITU-T
Series D General tariff principles
Series E Overall network operation, telephone service, service operation and human factors
Series F Non-telephone telecommunication services
Series G Transmission systems and media, digital systems and networks
Series H Audiovisual and multimedia systems
Series I Integrated services digital network
Series J Cable networks and transmission of television, sound programme and other multimedia signals
Series K Protection against interference
Series L Construction, installation and protection of cables and other elements of outside plant
Series M Telecommunication management, including TMN and network maintenance
Series N Maintenance: international sound programme and television transmission circuits
Series O Specifications of measuring equipment
Series P Telephone transmission quality, telephone installations, local line networks
Series Q Switching and signalling
Series R Telegraph transmission
Series S Telegraph services terminal equipment
Series T Terminals for telematic services
Series U Telegraph switching
Series V Data communication over the telephone network
Series X Data networks, open system communications and security
Series Y Global information infrastructure, Internet protocol aspects and next-generation networks
Series Z Languages and general software aspects for telecommunication systems