Embed Size (px)
Citation preview
ITU Regional Office for Asia and the Pacific
Atsuko Okuda, Regional Director of IT U ASP RO | email: [email protected]

What we do
Coordinating radio-frequency spectrum and assigning orbital slots for satellites
Bridging the digital divide
Establishing global standards
ITU: Current Structure
‘Committed to Connecting the World’
3Sectors
ITU Radiocommunication
ITU Standardization
ITU Development
193MEMBER STATES
+700INDUSTRY &
INTERNATIONALORGANIZATIONS
+150ACADEMIAMEMBERS MEMBERSHIP
01
Asia-Pacific
02
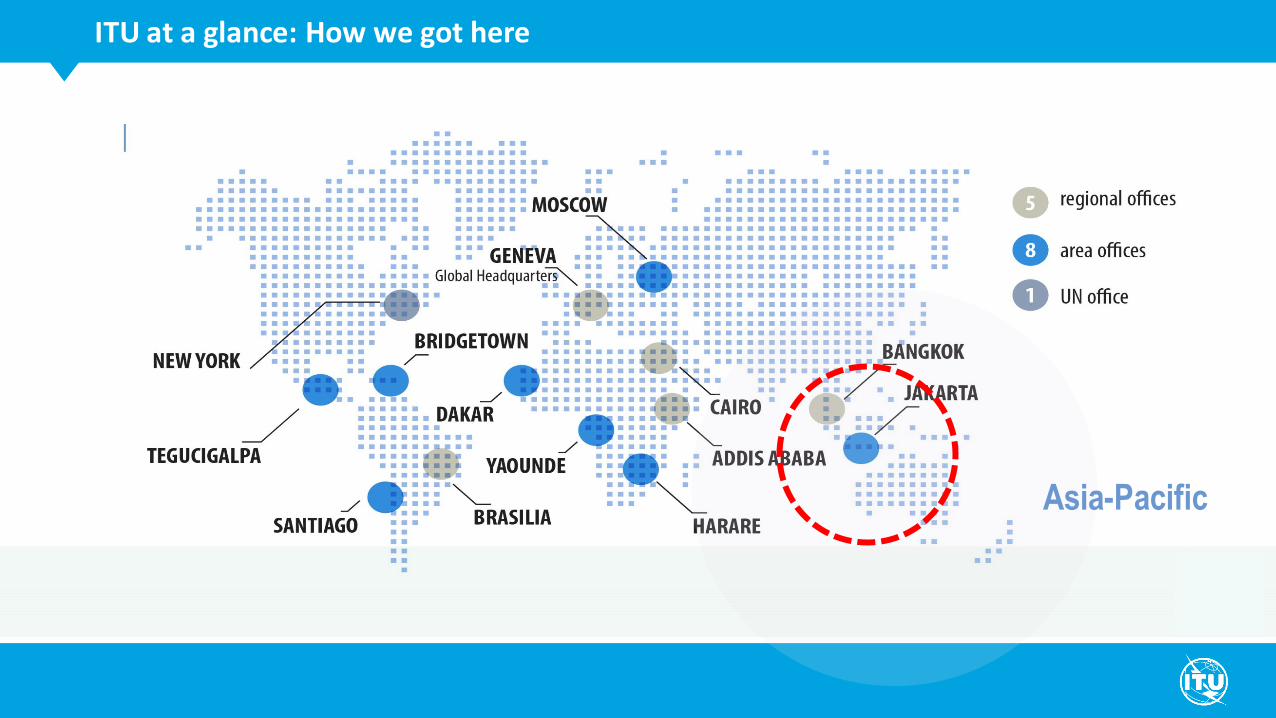
ITU at a glance: How we got here

Secretary-General’s Roadmap for Digital Cooperation
8 KEY AREAS FOR ACTION
0
5
10
15
20
25
30
35
40
ASEAN Australia & NewZealand
North East Pacific South
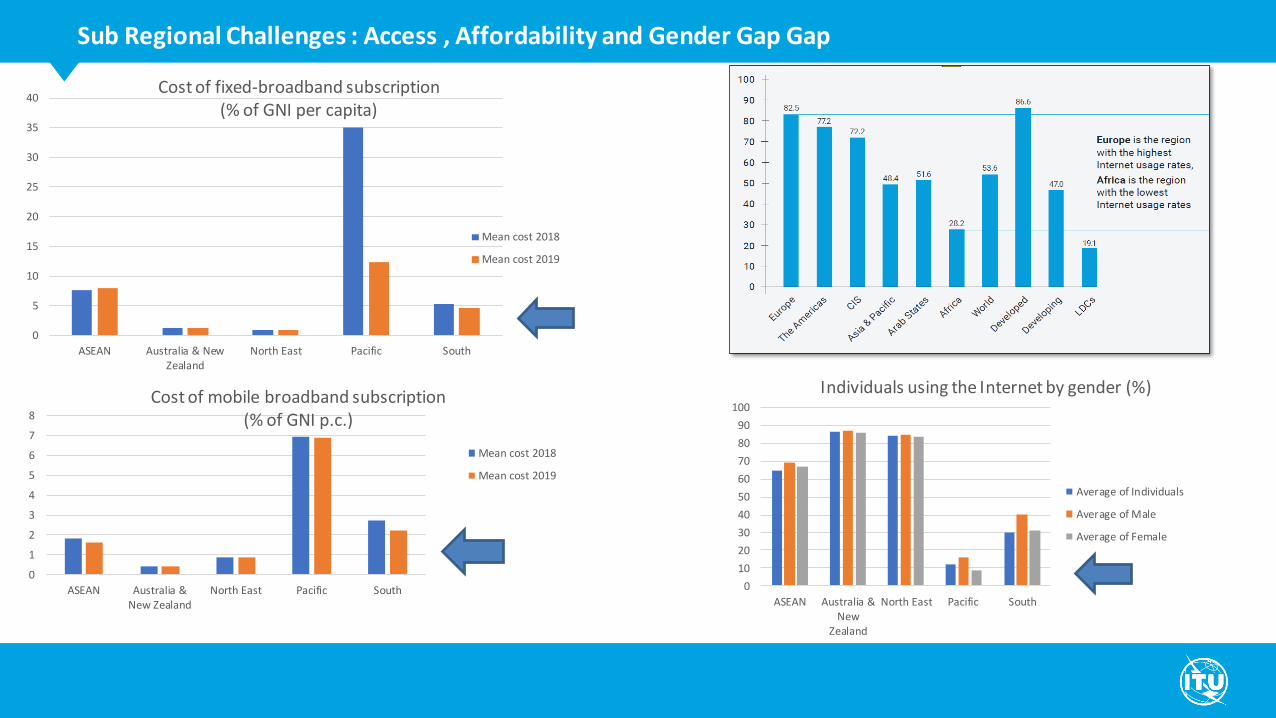
Cost of fixed-broadband subscription (% of GNI per capita)
Mean cost 2018
Mean cost 2019
0
1
2
3
4
5
6
7
8
ASEAN Australia &New Zealand
North East Pacific South
Cost of mobile broadband subscription (% of GNI p.c.)
Mean cost 2018
Mean cost 2019
0
10
20
30
40
50
60
70
80
90
100
ASEAN Australia &New
Zealand
North East Pacific South
Individuals using the Internet by gender (%)
Average of Individuals
Average of Male
Average of Female
Sub Regional Challenges : Access , Affordability and Gender Gap Gap

• Reliable and trustworthy digital services for all tocontinue to work, study, care for others, and keep intouch with loved ones
• Leverage ICTs to help address COVID-19 and make ussafer, stronger, and more connected.
• Universal, reliable, and affordable connectivity.
COVID-19: ITU initiatives
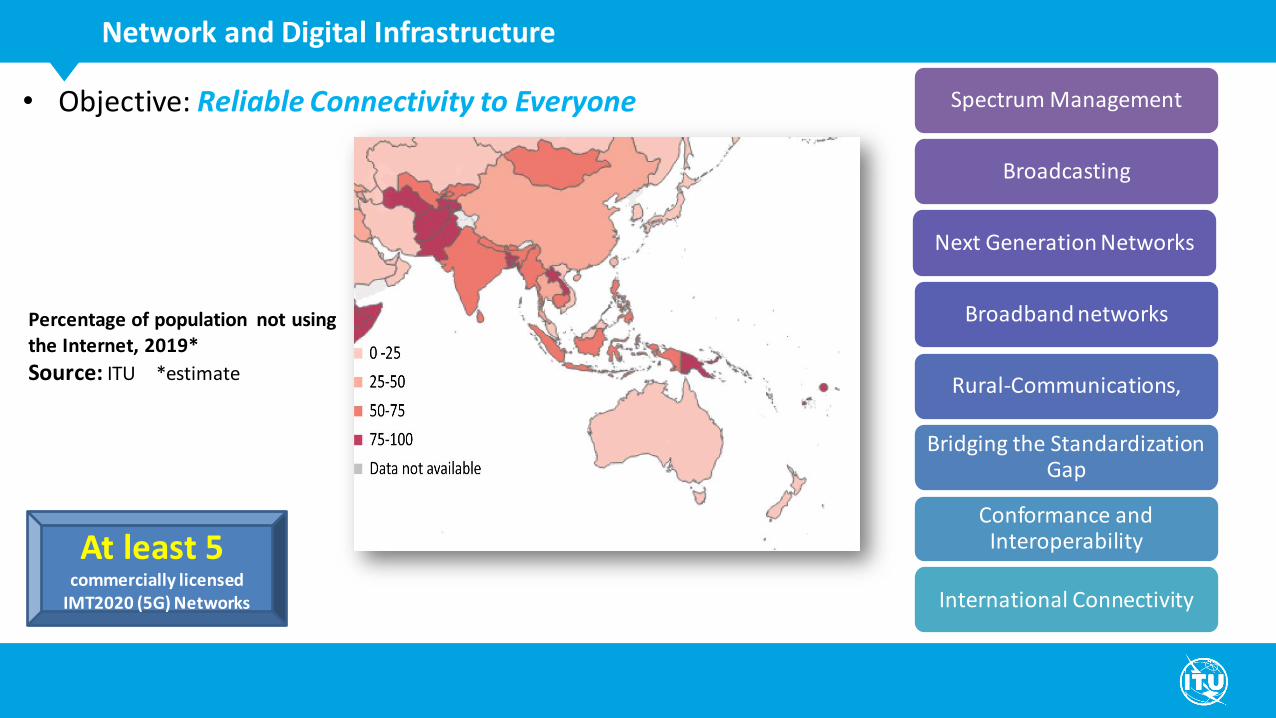
• Objective: Reliable Connectivity to Everyone
Network and Digital Infrastructure
Percentage of population not using the Internet, 2019*
Source: ITU *estimate
Spectrum Management
Broadcasting
Next Generation Networks
Broadband networks
Rural-Communications,
Bridging the Standardization Gap
Conformance and Interoperability
International Connectivity
At least 5commercially licensed
IMT2020 (5G) Networks

Mapping of digital divide for school education in Thailand
UN country team in Thailand has commissioned a comprehensive mapping of the digital divide in school educationwith a three-fold objective to:
a) Scope, map, and analyze available data across relevant ministries on access to digital devices, availability and use ofinternet, status of school connectivity, and quality of access to better understand the infrastructural challenges andopportunities for e-learning faced by some communities and disadvantaged groups in Thailand.
b) Review and assess existing ICT initiatives – both specifically purposed to support e-learning and education and thosenot specifically purposed but still essential in enabling it - to identify potential good practices as well as gaps whichrequire further assistance to bridge.
c) Develop a set of evidence-based policy recommendations on required infrastructure, including identification ofstandards where appropriate, to help bridge this digital divide and support Thailand in keeping up with improved andinclusive technologies - in line with its vision of a digital nation.
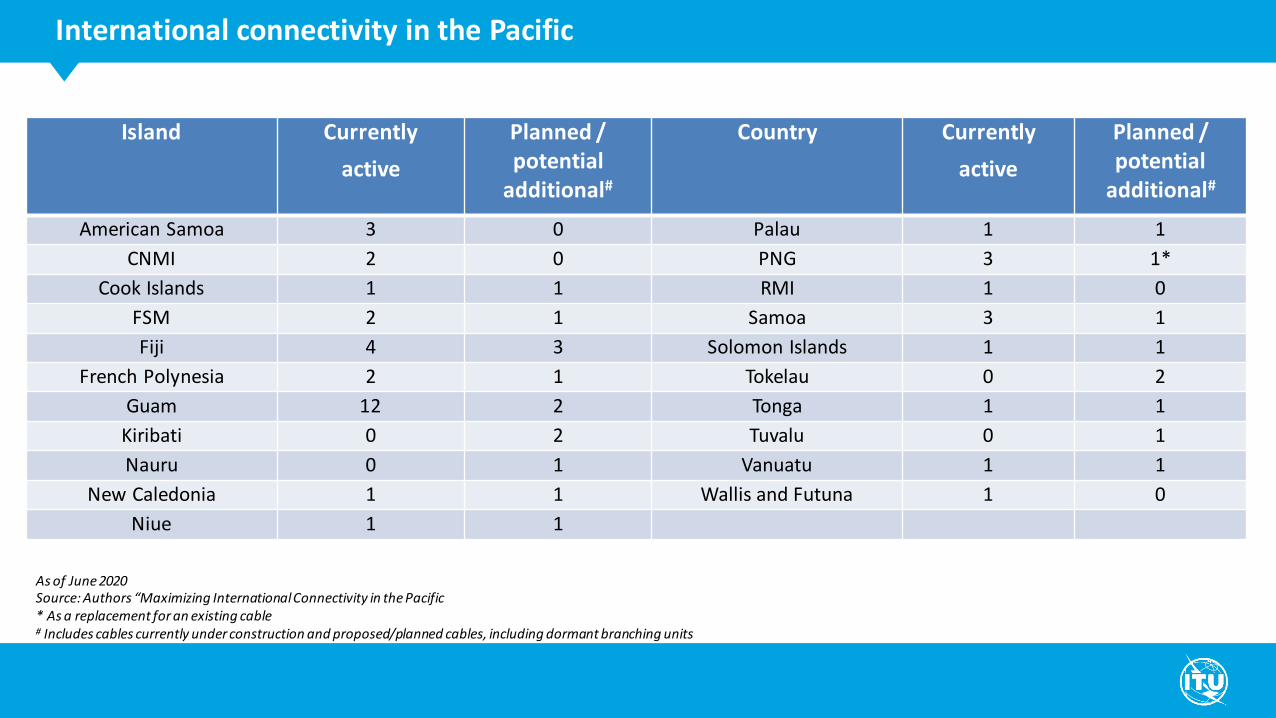
International connectivity in the Pacific
Island Currently
active
Planned / potential
additional#
Country Currently
active
Planned / potential
additional#
American Samoa 3 0 Palau 1 1
CNMI 2 0 PNG 3 1*
Cook Islands 1 1 RMI 1 0
FSM 2 1 Samoa 3 1
Fiji 4 3 Solomon Islands 1 1
French Polynesia 2 1 Tokelau 0 2
Guam 12 2 Tonga 1 1
Kiribati 0 2 Tuvalu 0 1
Nauru 0 1 Vanuatu 1 1
New Caledonia 1 1 Wallis and Futuna 1 0
Niue 1 1
As of June 2020Source: Authors “Maximizing International Connectivity in the Pacific* As a replacement for an existing cable# Includes cables currently under construction and proposed/planned cables, including dormant branching units
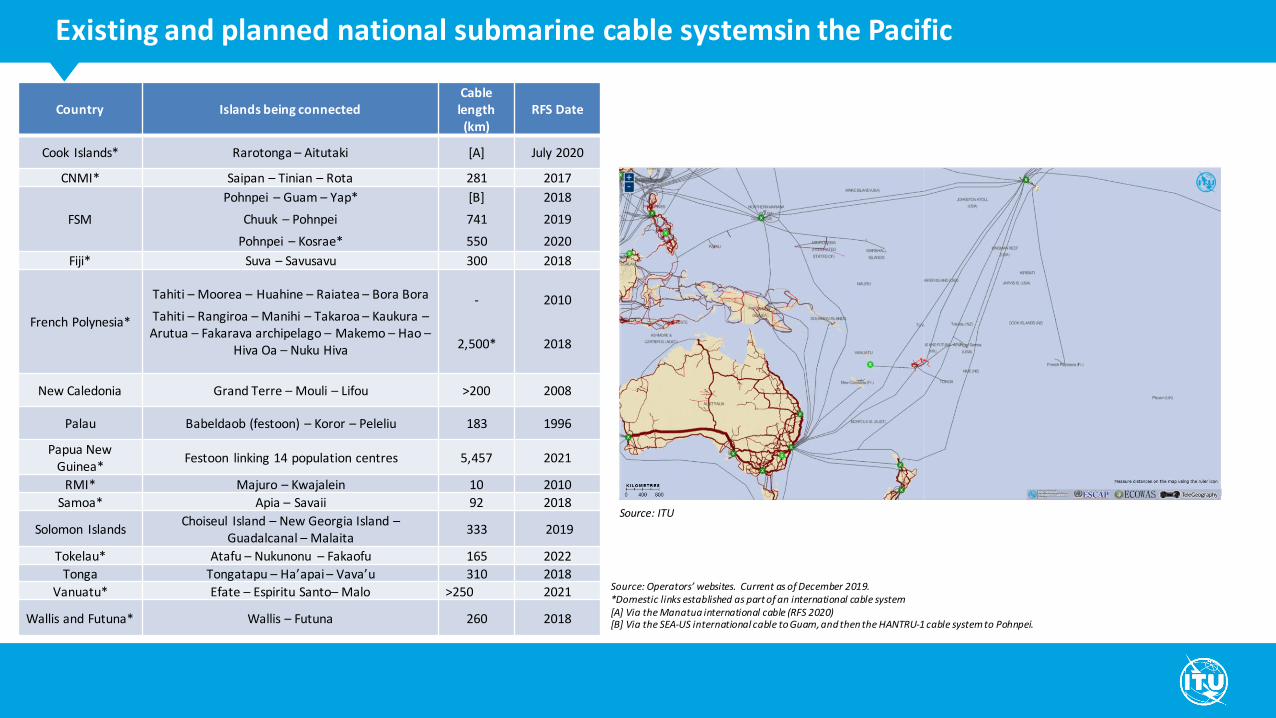
Existing and planned national submarine cable systemsin the Pacific
Country Islands being connectedCable length (km)
RFS Date
Cook Islands* Rarotonga – Aitutaki [A] July 2020
CNMI* Saipan – Tinian – Rota 281 2017
FSM
Pohnpei – Guam – Yap*
Chuuk – Pohnpei
Pohnpei – Kosrae*
[B]
741
550
2018
2019
2020
Fiji* Suva – Savusavu 300 2018
French Polynesia*
Tahiti – Moorea – Huahine – Raiatea – Bora Bora
Tahiti – Rangiroa – Manihi – Takaroa – Kaukura –Arutua – Fakarava archipelago – Makemo – Hao –
Hiva Oa – Nuku Hiva
-
2,500*
2010
2018
New Caledonia Grand Terre – Mouli – Lifou >200 2008
Palau Babeldaob (festoon) – Koror – Peleliu 183 1996
Papua New Guinea*
Festoon linking 14 population centres 5,457 2021
RMI* Majuro – Kwajalein 10 2010
Samoa* Apia – Savaii 92 2018
Solomon IslandsChoiseul Island – New Georgia Island –
Guadalcanal – Malaita333 2019
Tokelau* Atafu – Nukunonu – Fakaofu 165 2022
Tonga Tongatapu – Ha’apai – Vava’u 310 2018
Vanuatu* Efate – Espiritu Santo– Malo >250 2021
Wallis and Futuna* Wallis – Futuna 260 2018
Source: Operators’ websites. Current as of December 2019.*Domestic links established as part of an international cable system[A] Via the Manatua international cable (RFS 2020)[B] Via the SEA-US international cable to Guam, and then the HANTRU-1 cable system to Pohnpei.
Source: ITU

32
53
80
➢ 35 Ku band Equipment provided (2018-19)▪ 5 each to Fiji, Kiribati, Tonga, Papua New Guinea, Samoa, Tuvalu
and Vanuatu▪ Training provided to install the eqiupmnent by themselves.▪ Sites declared by countries
➢ 18 C band Equipment provided (2014-15)▪ 2 each to Fiji, Kiribati, Micronesia, Nauru,Papua New Guinea,
Samoa, Tonga, Tuvalu and Vanuatu
➢ 40 Ka band Equipment being sent to beneficiaries (2020)▪ 5 each to Fiji, Micronesia, Kiribati, Tonga, Papua New Guinea,
Samoa, Tuvalu and Vanuatu
➢ 7 Hybrid solar power solutions provided (Kiribati-2, Tonga-1, Tuvalu-4)➢ Additionally computing devices and periferals provided
Pacific Satellite connectivity and Development of Emergency Telecomm facility

• Impact Assessment:
outcomes of the project on
beneficiary population and
country
• Develop sustainability plan
for remote connectivity
solutions and upgrades needs
(if any)
• Further Cooperation:
potential applications and
services that can be run on the installed solutions to
further benefit the users
Overview & Impact Assessment
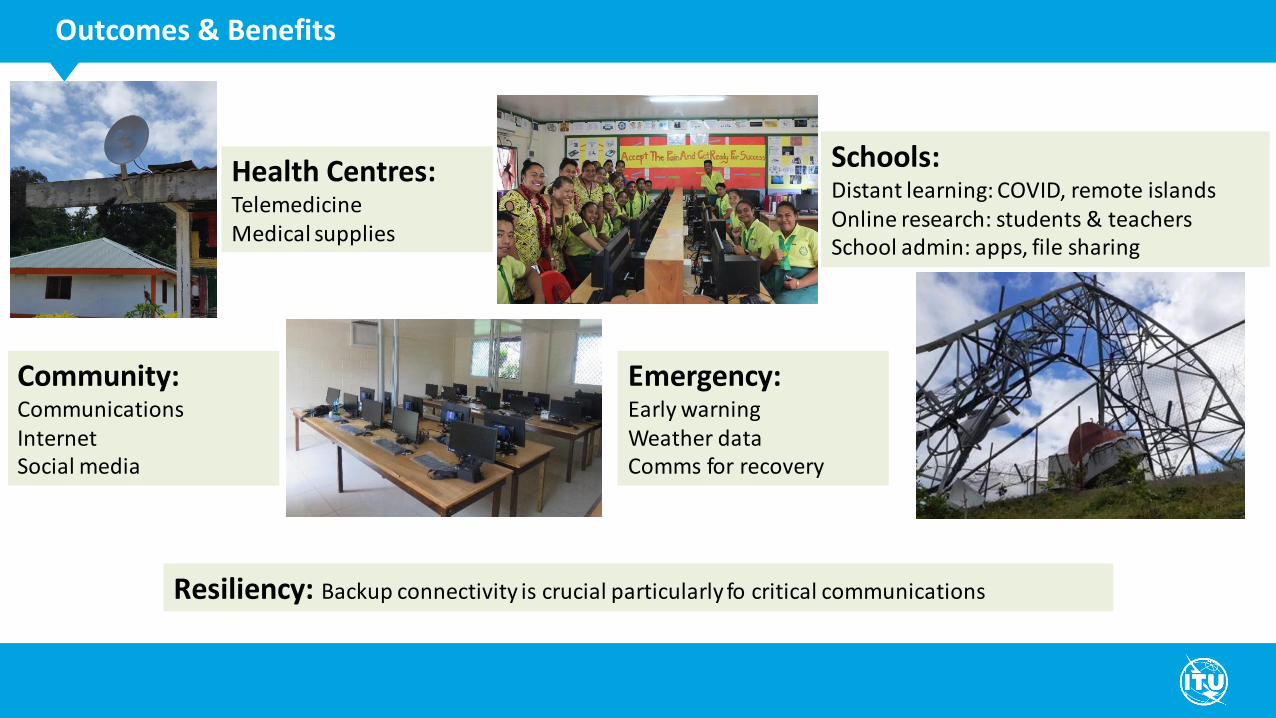
Schools: Distant learning: COVID, remote islandsOnline research: students & teachersSchool admin: apps, file sharing
Health Centres: TelemedicineMedical supplies
Emergency: Early warningWeather dataComms for recovery
Community: CommunicationsInternetSocial media
Resiliency: Backup connectivity is crucial particularly fo critical communications
Outcomes & Benefits

Outcomes & Benefits
32
• Clear demand for satellite connectivity satellite remains the most effective solution for many
remote islands
• Ka-band is most promising –performance, cost and ease of deployment
• Digital future – e-government, online
learning, smart islands, Emergency telecom
• COVID-19 –
underscores the importance of
connectivity; video-conferencing becomes a norm

Digital Application and Services
E-agriculture
Digital finance
m-health
Smart sustainable cities and digital government
ProjectsNational strategies
Case studiesSolutions support
ForumsTrainings
Projects and Partnerships
Afghanistan, Bhutan, China, Fiji, India, Mongolia, Pakistan, Papua New Guinea, Philippines, Sri
Lanka, Thailand, Vanuatu
2020
Bridging the digital divide in
the education sector in Thailand
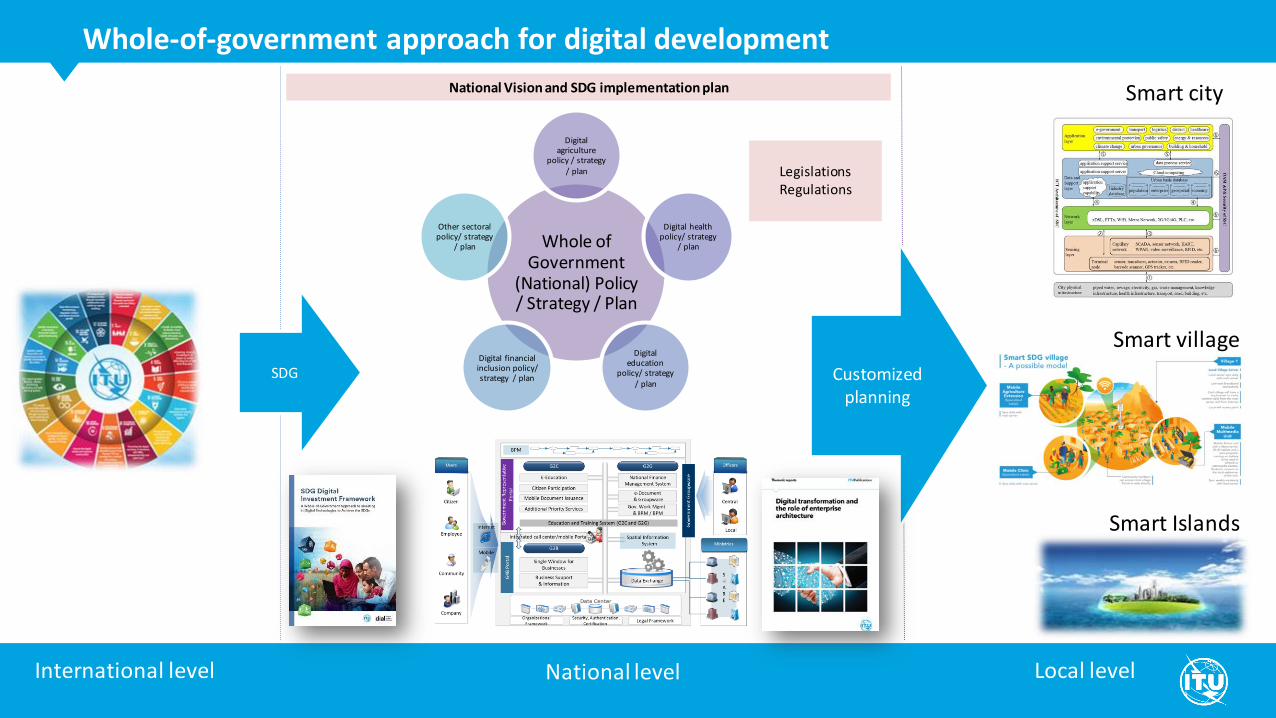
Whole of Government
(National) Policy / Strategy / Plan
Digital agriculture
policy / strategy / plan
Digital health policy/ strategy
/ plan
Digital education
policy/ strategy / plan
Digital financial inclusion policy/ strategy / plan
Other sectoral policy/ strategy
/ plan
National Vision and SDG implementation plan
Customized planning
Smart village
Smart Islands
International level National level Local level
Smart city
SDG
Legislations Regulations
Whole-of-government approach for digital development
Enterprise architecture
Gender
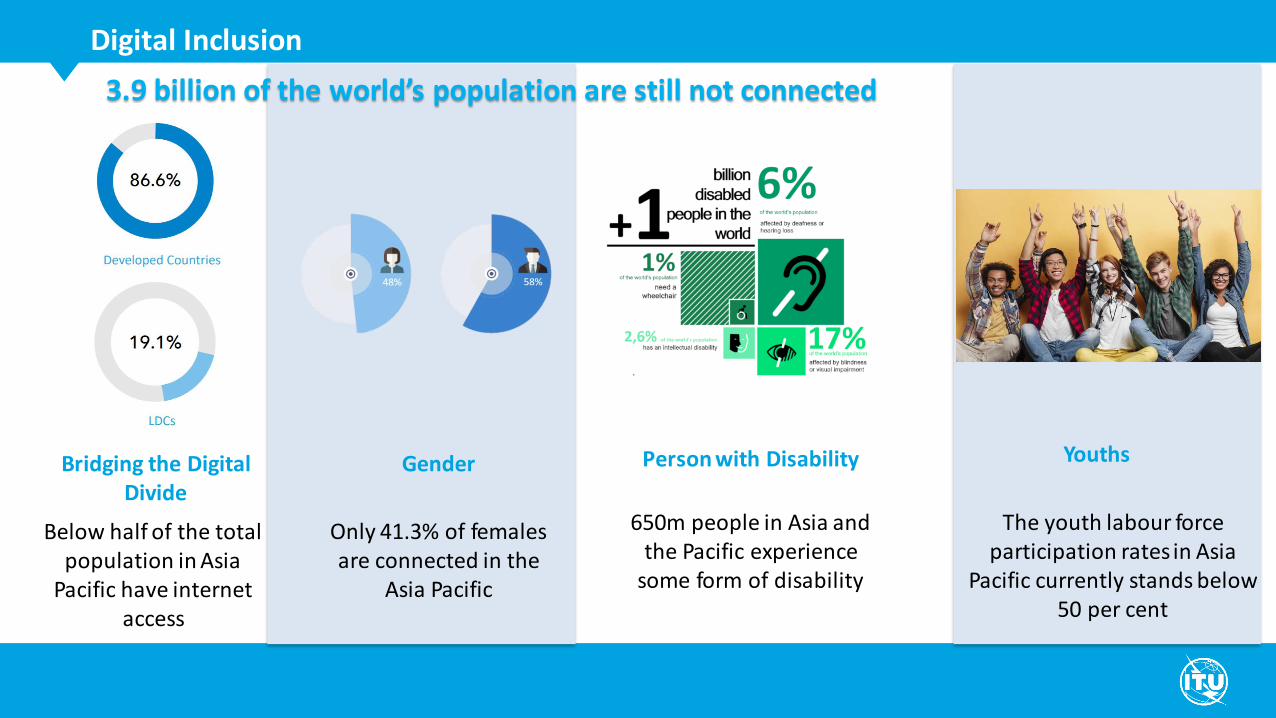
Below half of the total population in Asia
Pacific have internet access
Digital Inclusion
Person with Disability YouthsBridging the Digital Divide
Only 41.3% of females are connected in the
Asia Pacific
650m people in Asia and the Pacific experience
some form of disability
The youth labour force participation rates in Asia
Pacific currently stands below 50 per cent
3.9 billion of the world’s population are still not connected
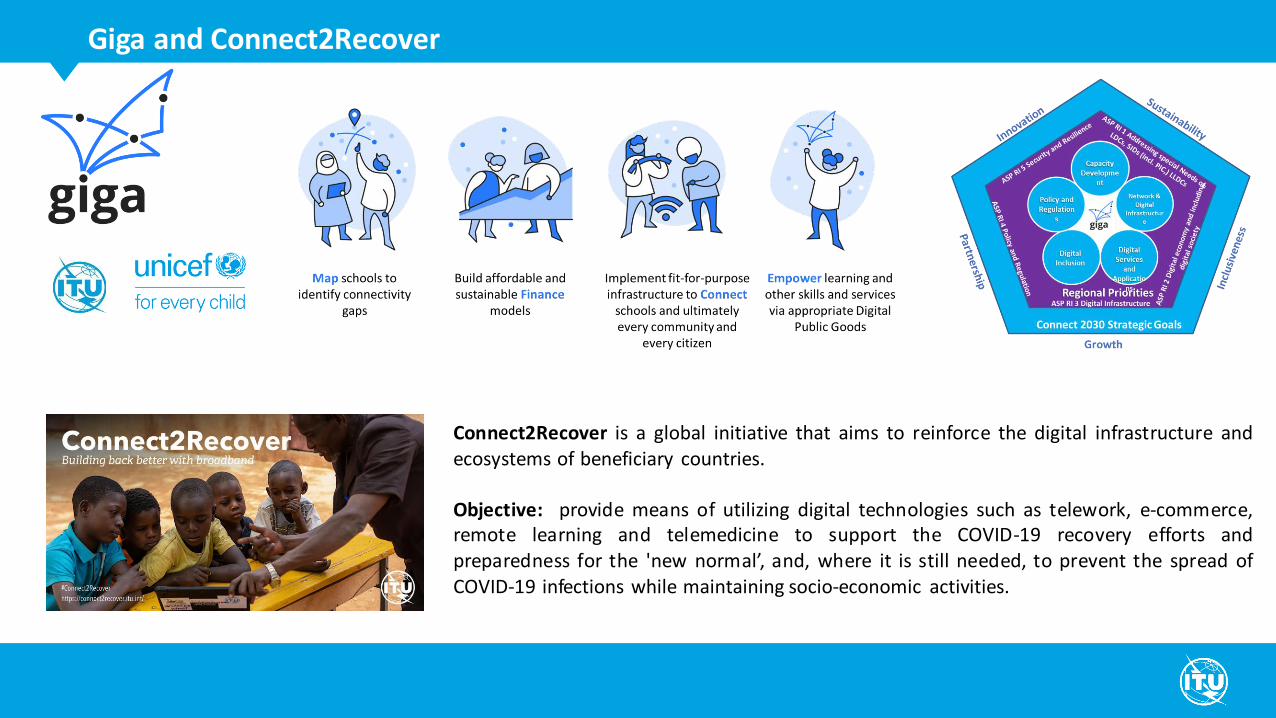
Giga and Connect2Recover
Connect2Recover is a global initiative that aims to reinforce the digital infrastructure andecosystems of beneficiary countries.
Objective: provide means of utilizing digital technologies such as telework, e-commerce,remote learning and telemedicine to support the COVID-19 recovery efforts andpreparedness for the 'new normal’, and, where it is still needed, to prevent the spread ofCOVID-19 infections while maintaining socio-economic activities.

Capacity building and digital skills development
2019: 37 trainings,1750 participants
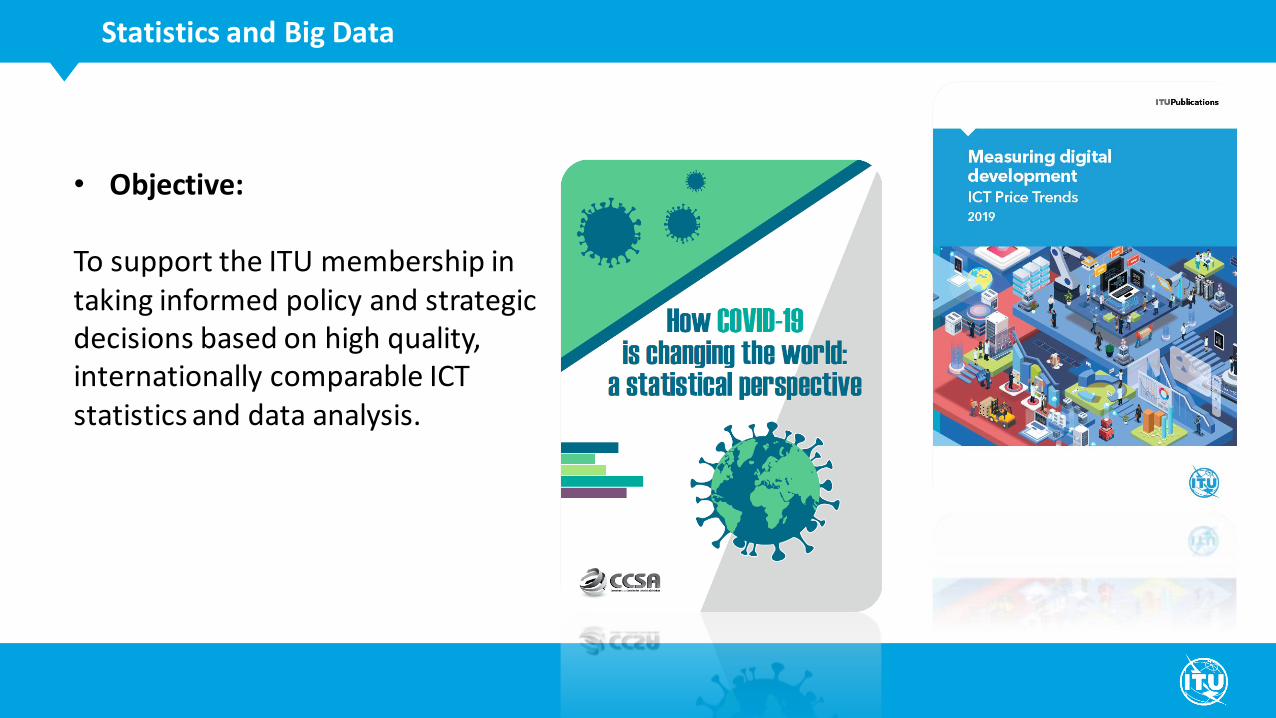
• Objective:
To support the ITU membership in taking informed policy and strategic decisions based on high quality, internationally comparable ICT statistics and data analysis.
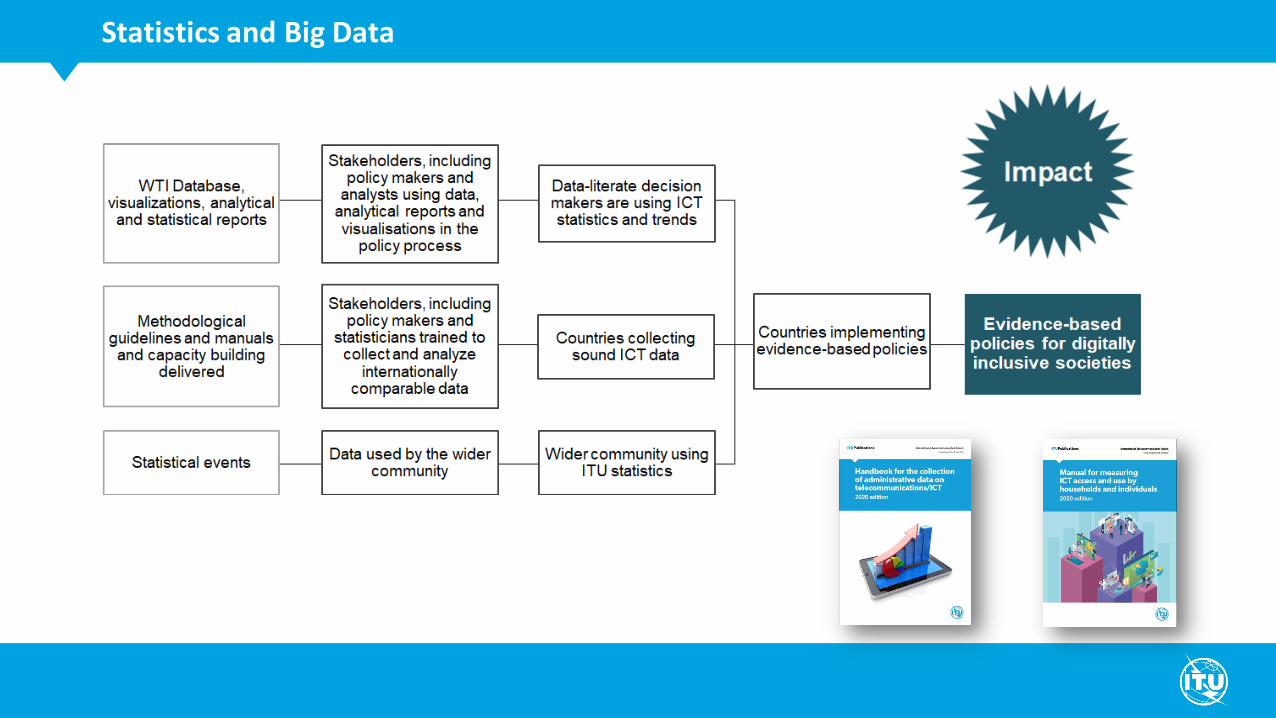
Statistics and Big Data
Statistics and Big Data
#ITUData
ICT Regulatory Tracker
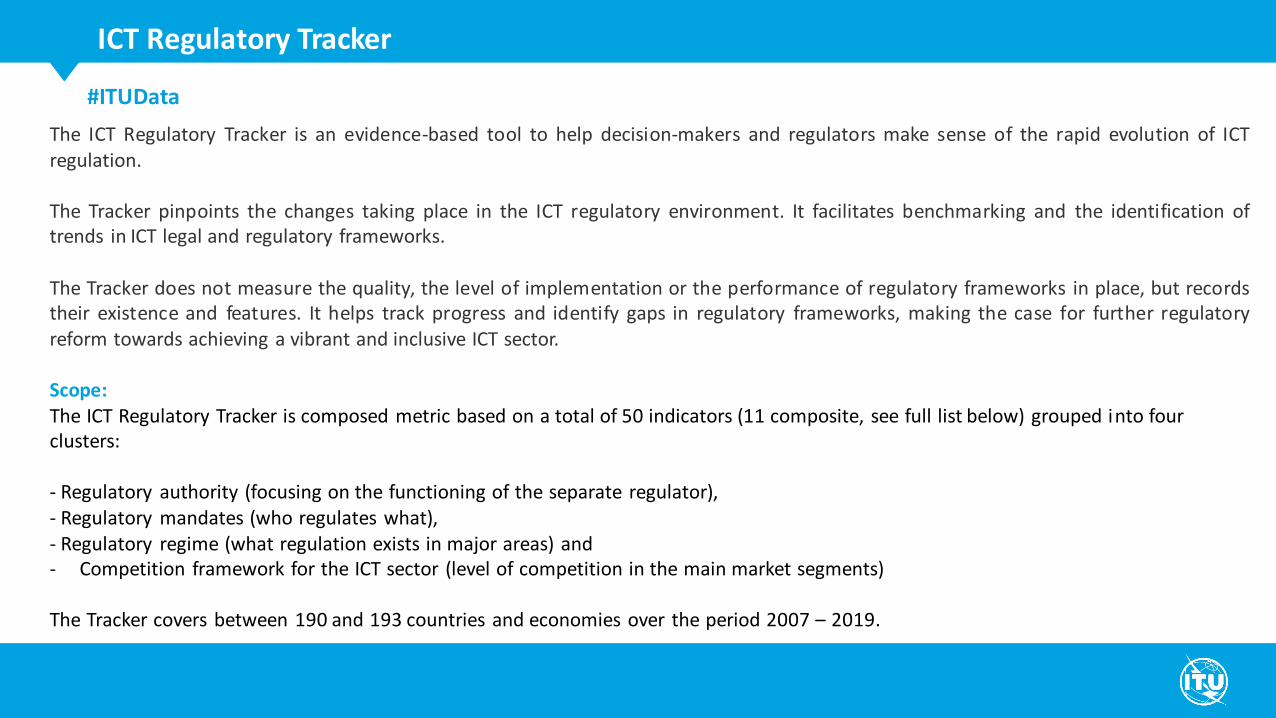
The ICT Regulatory Tracker is an evidence-based tool to help decision-makers and regulators make sense of the rapid evolution of ICTregulation.
The Tracker pinpoints the changes taking place in the ICT regulatory environment. It facilitates benchmarking and the identification oftrends in ICT legal and regulatory frameworks.
The Tracker does not measure the quality, the level of implementation or the performance of regulatory frameworks in place, but recordstheir existence and features. It helps track progress and identify gaps in regulatory frameworks, making the case for further regulatoryreform towards achieving a vibrant and inclusive ICT sector.
Scope:The ICT Regulatory Tracker is composed metric based on a total of 50 indicators (11 composite, see full list below) grouped into four clusters:
- Regulatory authority (focusing on the functioning of the separate regulator),- Regulatory mandates (who regulates what),- Regulatory regime (what regulation exists in major areas) and- Competition framework for the ICT sector (level of competition in the main market segments)
The Tracker covers between 190 and 193 countries and economies over the period 2007 – 2019.
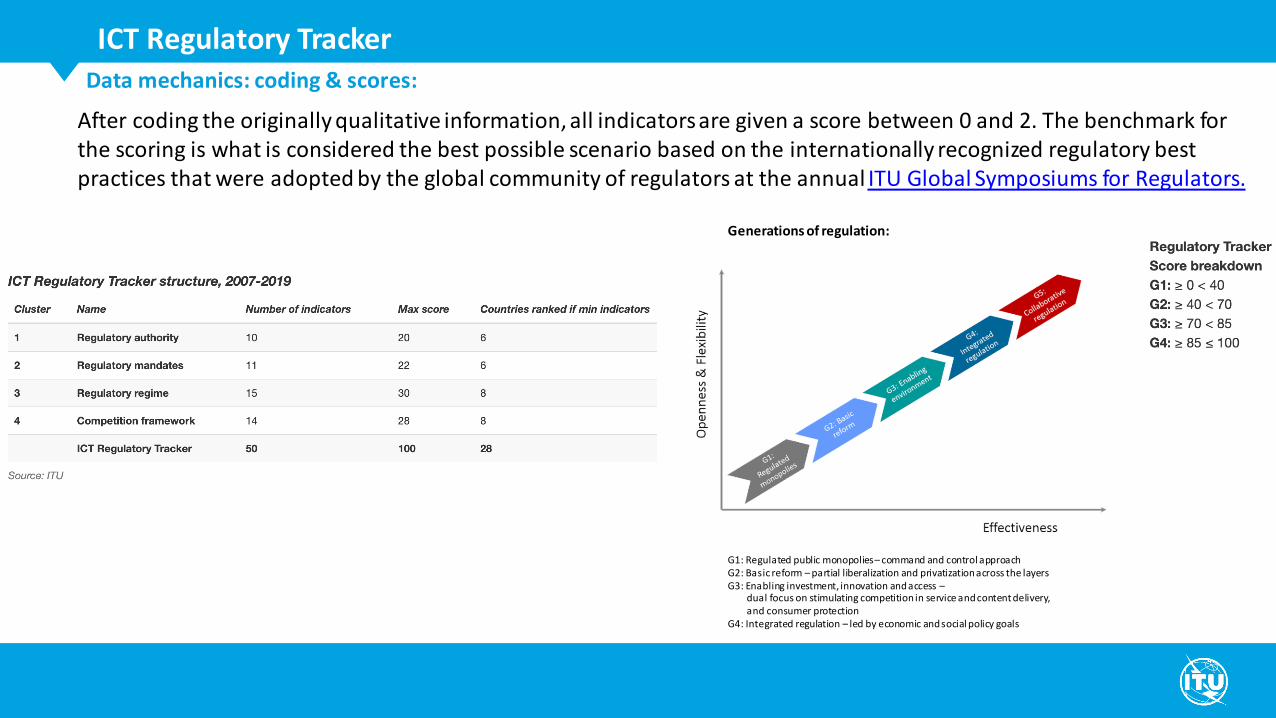
Data mechanics: coding & scores:
ICT Regulatory Tracker
After coding the originally qualitative information, all indicators are given a score between 0 and 2. The benchmark for the scoring is what is considered the best possible scenario based on the internationally recognized regulatory best practices that were adopted by the global community of regulators at the annual ITU Global Symposiums for Regulators.
Generations of regulation:
G1: Regulated public monopolies– command and control approachG2: Basic reform – partial liberalization and privatization across the layersG3: Enabling investment, innovation and access –
dual focus on stimulating competition in service and content delivery, and consumer protection
G4: Integrated regulation – led by economic and social policy goals

ICT Regulatory Tracker
Visit: https://www.itu.int/net4/itu-d/irt/#/tracker-by-country/regulatory-tracker/2019
Tracker by Country: Country Card:

ICT Regulatory Tracker
Visit: https://www.itu.int/net4/itu-d/irt/#/tracker-by-country/regulatory-tracker/2019
Tracker by Region: Comparison:
• To provide policy makers and regulators with the empiricalevidence required to further regulatory reform in the ICTsector and address the challenges and the gaps in currentregulatory frameworks for digital services and applications.
• Develop a methodology to illustrate the causalrelationship – through empirical evidence and availabledata – between government policies in the area ofcompetition, liberalization and taxation of ICT/digitalservices and the level of connectivity, penetration ofICT/digital services, prices of such services
Econometric modelling – the impact of competition, liberalization, and taxation in the ICT Sector
The study will also explore the following:
• How do government policies and regulations affectthe degree of competition in ICT/digital market?How do policy/regulatory barriers and incentivesplay out in practice?
• How do competition, liberalization and taxationaffect market outcomes, such as prices, innovationand access to digital services? What are the trans-border effects observed?
• Is there a difference between the impact of sector-specific tariffs (e.g., on Internet services) and generaltax (e.g., VAT)? What is the impact of doubletaxation on cross-boarder digital services?
Evidence based policies and regulations
• The business model of the Telecom sector which was basedon voice services have disrupted after the era of mobilebroadband in general and due to smart phone in particularhave resulted in similar services being offered by theplatform providers (like voice OTT etc.).
• This has impact on the economy of the country as outlinedin the ITU report titled ”Economic impact of OTTs onnational telecommunication/ICT markets ”.
• The traditional telecom Operators have to diversify theirbusinesses also.
• Examples of Digital Platform providers investing inconnectivity and the business model.
• Ways the government policies and regulations areimpacting different players (platform providers, telecomoperators).
• Successful examples of diversification of telecom operatorsinto other sectors like financial, health sectors, etc.
Innovative Business Models in the ICT Sector
• Optimal way forward for the traditional telecomsector and for the government and regulatorsespecially in reference to collaborative regulations.
• Explore futuristic models that both the traditionaltelecom operators could use to address the wholedigital ecosystem, and the digital platform providersto support in the basic connectivity.
• Examples: Reliance Jio, India, which is of greatinterest as described in the report “MarketPenetration through disruptive entry strategy- Acase study of Reliance Jio’s Entry into IndianTelecom Industry”.
• Impact of the high cost of spectrum and thecompetition introduced by Jio in the Indian market
• Other innovative examples from the Telecom Sectoraround the world
Evidence based policies and regulations
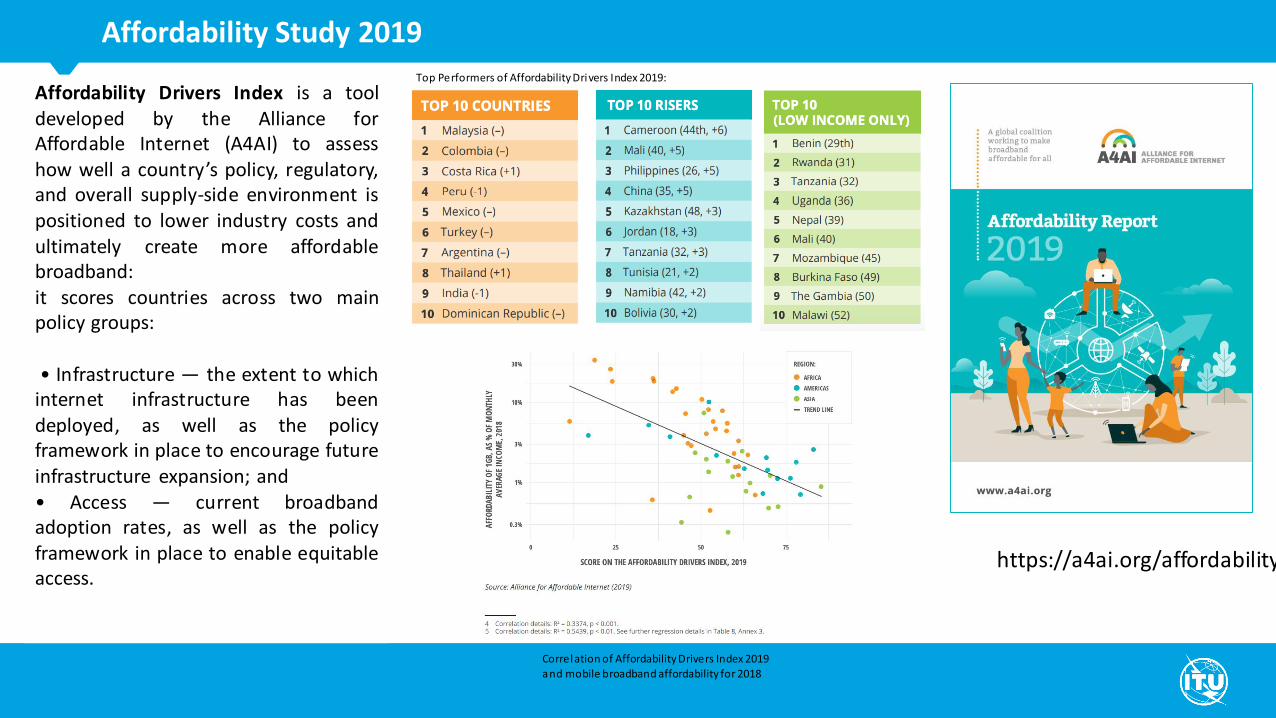
Affordability Study 2019
Affordability Drivers Index is a tooldeveloped by the Alliance forAffordable Internet (A4AI) to assesshow well a country’s policy, regulatory,and overall supply-side environment ispositioned to lower industry costs andultimately create more affordablebroadband:it scores countries across two mainpolicy groups:
• Infrastructure — the extent to whichinternet infrastructure has beendeployed, as well as the policyframework in place to encourage futureinfrastructure expansion; and• Access — current broadbandadoption rates, as well as the policyframework in place to enable equitableaccess.
Top Performers of Affordability Drivers Index 2019:
Correlation of Affordability Drivers Index 2019 and mobile broadband affordability for 2018
https://a4ai.org/affordability-report/
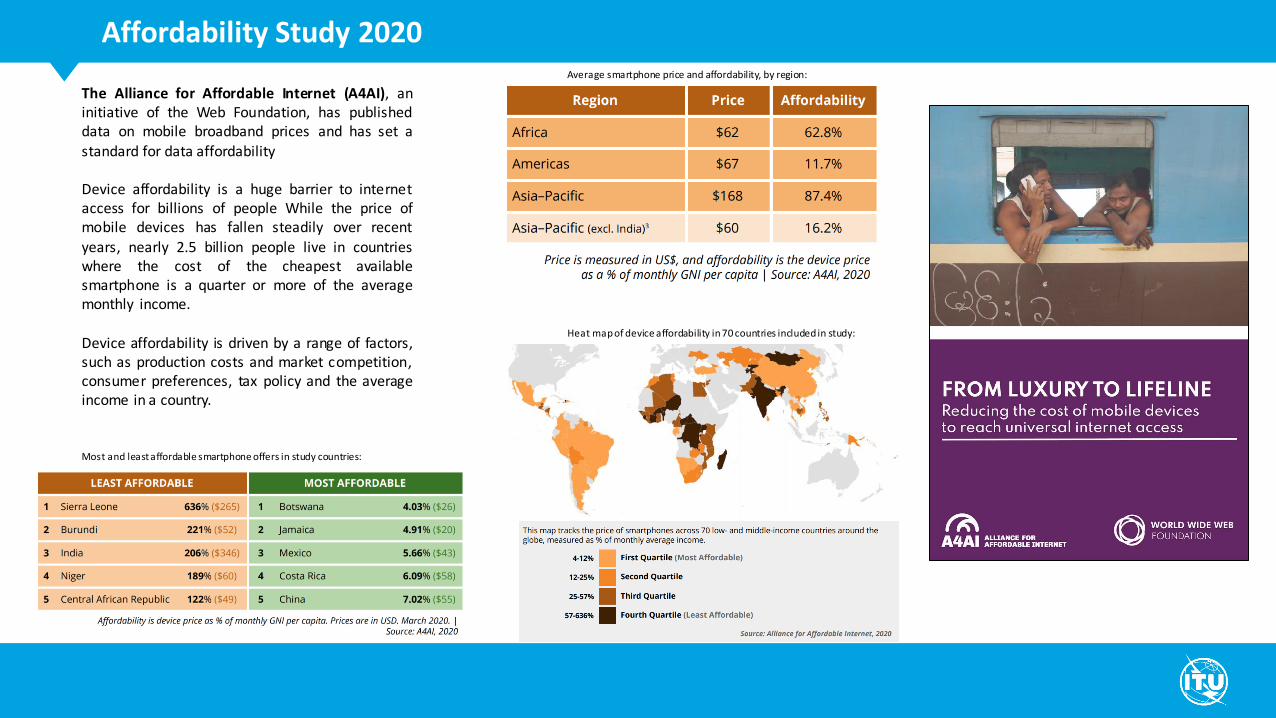
Affordability Study 2020
The Alliance for Affordable Internet (A4AI), aninitiative of the Web Foundation, has publisheddata on mobile broadband prices and has set a
standard for data affordability
Device affordability is a huge barrier to internetaccess for billions of people While the price ofmobile devices has fallen steadily over recent
years, nearly 2.5 billion people live in countrieswhere the cost of the cheapest availablesmartphone is a quarter or more of the averagemonthly income.
Device affordability is driven by a range of factors,such as production costs and market competition,consumer preferences, tax policy and the averageincome in a country.
Most and least affordable smartphone offers in study countries:
Average smartphone price and affordability, by region:
Heat map of device affordability in 70 countries included in study:
Regional Development Forum for Asia and the Pacific 2020
ITU RDF-ASP 2020

Thank You
Contact Us
ITU Regional Office for Asia and
the Pacific:
O f f i c i a l L i n k e d I n a c c o u n t :
I T U R e g i o n a l O f f i c e f o r A s i a a n d t h e P a c i f i c
T w i t t e r U R L : h t t p s : / / t w i t t e r . c o m / I T U _ A S P
O f f i c i a l T w i t t e r a c c o u n t : @ I T U _ A S P