Embed Size (px)
DESCRIPTION
ITU
Citation preview
Embargoed until
7 October 2013
13:00 CET
I n t e r n a t i o n a l T e l e c o m m u n i c a t i o n U n i o n
2013
Mea
suri
ng t
he I
nfor
mat
ion
Soc
iety
20
13
Printed in SwitzerlandGeneva, 2013
ISBN 978-92-61-14401-2Photo credits: Shutterstock
*38501*
MEASURING INFORMATION SOCIETY
THE
E_couv ICT dev index2013__v2.indd 1 22.08.2013 16:54:47
EXECUTIVESUMMARY

I n t e r n a t i o n a l T e l e c o m m u n i c a t i o n U n i o n
MEASURING
INFORMATION SOCIETY
2013
EXECUTIVESUMMARY
THE

ii
© 2013 ITU
International Telecommunication Union
Place des Nations
CH-1211 Geneva Switzerland
Original language of publication: English.
All rights reserved. No part of this publication may be reproduced, stored in a retrieval system, or transmitted in any form
or by any means, electronic, mechanical, photocopying, recording, or otherwise, without the prior permission of the
International Telecommunication Union.

iii
Foreword
I am pleased to present to you the 2013 edition of Measuring the Information Society (MIS). Now in its fifth year, this annual report identifies key ICT developments and tracks the cost and affordability of ICT services, in accordance with internationally agreed methodologies. Its core feature is the ICT Development Index (IDI), which ranks countries’ performance with regard to ICT infrastructure and uptake. The report aims to provide an objective international performance evaluation based on quantitative indicators and benchmarks, as an essential input to the ICT policy debate in ITU Member States. The 2013 edition also presents the latest results of the ICT Price Basket (IPB), and the first complete price data set for mobile-broadband services; the first-ever model to measure the world’s digital native population; and a quantitative assessment of recent digital TV broadcasting trends.
Over 250 million people came online over the last year, and almost 40 per cent of the world’s population will be using the Internet by end 2013. Mobile technology and services continue to be the key driver of the information society, and the number of mobile-broadband subscriptions is close to 2 billion. Mobile-broadband networks are allowing more people to connect to high-speed networks and benefit from a growing number of applications and services. While both fixed- and mobile-broadband speeds continue to increase, the price of services is falling and ICTs are becoming more affordable: in the space of four years, fixed-broadband prices have dropped by an impressive 82 per cent.
At the same time, the report also shows that ICT uptake remains limited in many developing countries, and particularly in the world’s least connected countries (LCCs) – a group of 39 countries (home to 2.4 billion people) with particularly low levels of ICT development. In this group of countries, ICTs can become key enablers for achieving international and national development goals and have the greatest development impact, and more policy attention needs to be directed towards them.
Young people all over the world are the most active users of ICTs. For the first time, a model has been developed to estimate the number of digital natives - the young people with solid ICT experience who are drivers of the information society. While 30 per cent of the youth population are digital natives today, the report shows that within the next five years, the digital native population in the developing world is expected to double.
The report also sheds new light on the latest digital TV broadcasting trends, another key driving force of the growing information society. The TV industry has undergone an important shift during the past few years and, in 2012, the number of households with digital TV overtook the number of households with analogue TV. This achievement reinforces the dual role of TV broadcasts: fulfilling some of the public services associated with communications and being a major market for private content creators, distributors and networks.
I trust that the data and analysis contained in this report will be of great value to the ITU membership, including policy-makers, the ICT industry and others working towards building an inclusive global information society.
Brahima Sanou Director
Telecommunication Development Bureau (BDT) International Telecommunication Union

iv
v
Acknowledgements
The 2013 edition of Measuring the Information Society was prepared by the ICT Data and Statistics Division within the
Telecommunication Development Bureau of ITU. The team included Susan Teltscher (Head of Division), Vanessa Gray,
Esperanza Magpantay, Doris Olaya and Ivan Vallejo. The following consultants to ITU provided substantive inputs: Lisa
Kreuzenbeck, Michael Best (Chapter 4), and Simon Murray (Chapter 5). Fernando Callorda, Diana Korka, Christoph Stork and
Zhazna Zuhely contributed to the compilation of data sets on prices. Helpful inputs and suggestions were received from
the following ITU colleagues: Istvan Bozoski, Pham Hai, Aurora Rubio, Sameer Sharma, Anne Rita Ssemboga and Marcelino
Tayob. The work was carried out under the overall direction of Cosmas Zavazava, Chief, Project Support and Knowledge
Management Department, Telecommunication Development Bureau.
The report includes data from Digital TV Research, Eurostat, OECD, IMF, UNCTAD, the UNESCO Institute for Statistics, the
United Nations Population Division and the World Bank, which is greatly acknowledged.
ITU also appreciates the cooperation of countries that have provided data included in this report.
The report was edited by Anthony Pitt and Bruce Granger, ITU English Translation Section. The desktop publishing was
carried out by Nathalie Delmas, and the cover was designed by Céline Désthomas. Administrative support was provided
by Herawasih Yasandikusuma.

vii
Table of contents
Foreword ................................................................................................................................................................................................................iii
Acknowledgements ............................................................................................................................................................................................v
Table of contents ............................................................................................................................................................................................... vii
Executive summary .............................................................................................................................................................................................1
Chapter 1. Introduction ................................................................................................................................................................................................................1
Chapter 2. The ICT Development Index (IDI) ..................................................................................................................................................................6
Chapter 3. Measuring the cost and affordability of broadband ..................................................................................................................... 12
Chapter 4. Measuring the world’s digital natives ...................................................................................................................................................... 18
Chapter 5. Digital TV broadcasting trends ..................................................................................................................................................................... 24

1
Measuring the Information Society 2013
EXECUTIVE SUMMARY
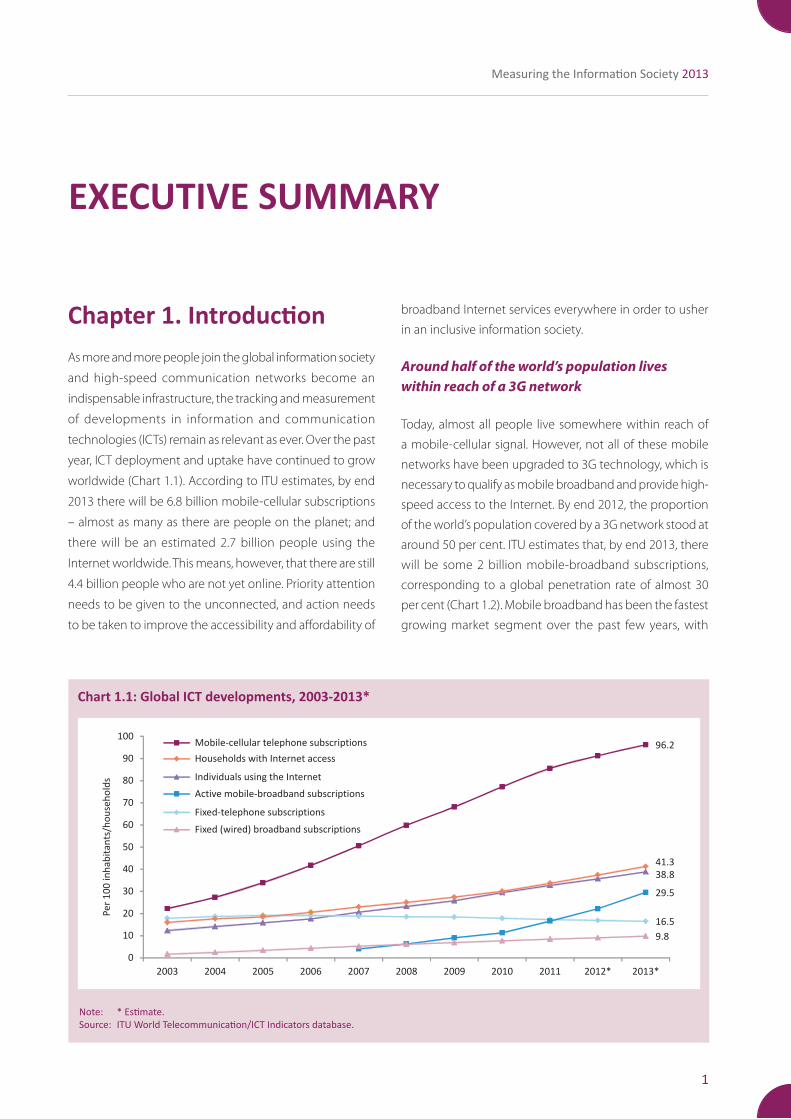
Chapter 1. IntroductionAs more and more people join the global information society
and high-speed communication networks become an
indispensable infrastructure, the tracking and measurement
of developments in information and communication
technologies (ICTs) remain as relevant as ever. Over the past
year, ICT deployment and uptake have continued to grow
worldwide (Chart 1.1). According to ITU estimates, by end
2013 there will be 6.8 billion mobile-cellular subscriptions
– almost as many as there are people on the planet; and
there will be an estimated 2.7 billion people using the
Internet worldwide. This means, however, that there are still
4.4 billion people who are not yet online. Priority attention
needs to be given to the unconnected, and action needs
to be taken to improve the accessibility and affordability of
broadband Internet services everywhere in order to usher
in an inclusive information society.
Around half of the world’s population lives within reach of a 3G network
Today, almost all people live somewhere within reach of
a mobile-cellular signal. However, not all of these mobile
networks have been upgraded to 3G technology, which is
necessary to qualify as mobile broadband and provide high-
speed access to the Internet. By end 2012, the proportion
of the world’s population covered by a 3G network stood at
around 50 per cent. ITU estimates that, by end 2013, there
will be some 2 billion mobile-broadband subscriptions,
corresponding to a global penetration rate of almost 30
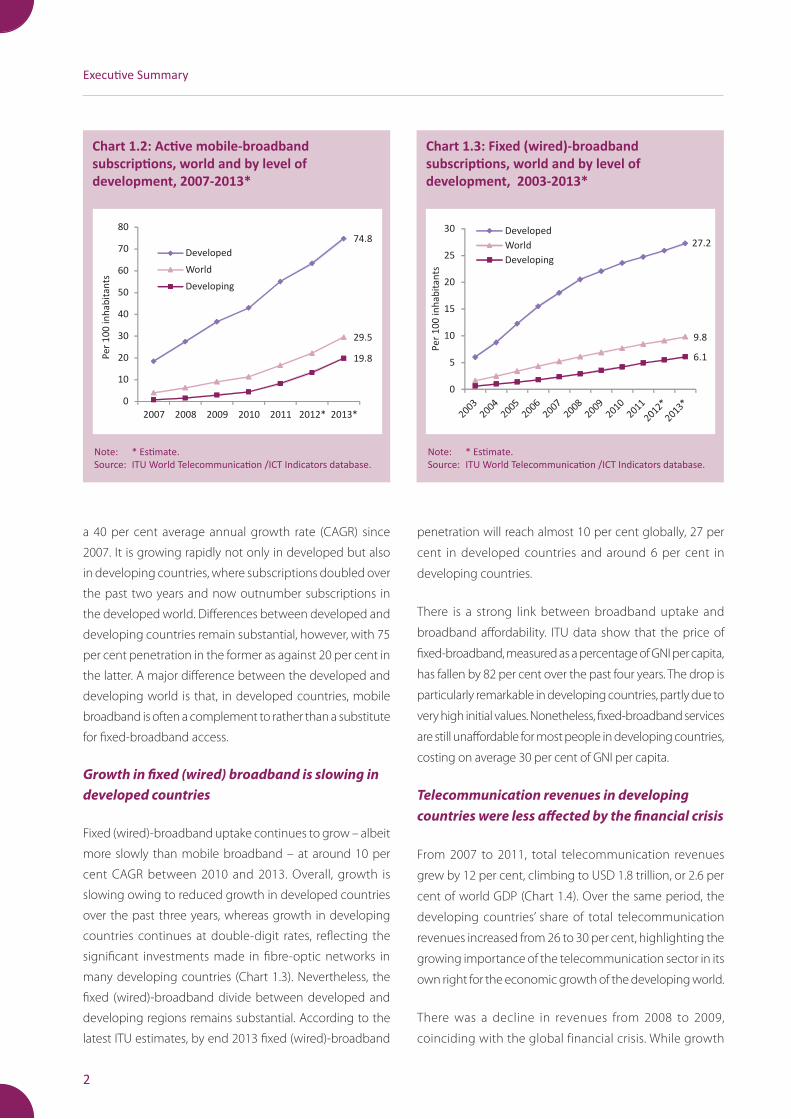
per cent (Chart 1.2). Mobile broadband has been the fastest
growing market segment over the past few years, with
Chart 1.1: Global ICT developments, 2003-2013*
Note: *Estimate.Source:ITUWorldTelecommunication/ICTIndicatorsdatabase.
96.2
38.8
16.5
29.5
9.8
41.3
0
10
20
30
40
50
60
70
80
90
100
2003 2004 2005 2006 2007 2008 2009 2010 2011 2012* 2013*
Mobile-cellular telephone subscriptions
Individuals using the Internet
Fixed-telephone subscriptions
Active mobile-broadband subscriptions
Fixed (wired) broadband subscriptions
Households with Internet access
Pe
r 1
00
in
ha
bit
an
ts/h
ou
seh
old
s
2
Executive Summary
a 40 per cent average annual growth rate (CAGR) since
2007. It is growing rapidly not only in developed but also
in developing countries, where subscriptions doubled over
the past two years and now outnumber subscriptions in
the developed world. Differences between developed and
developing countries remain substantial, however, with 75
per cent penetration in the former as against 20 per cent in
the latter. A major difference between the developed and
developing world is that, in developed countries, mobile
broadband is often a complement to rather than a substitute
for fixed-broadband access.
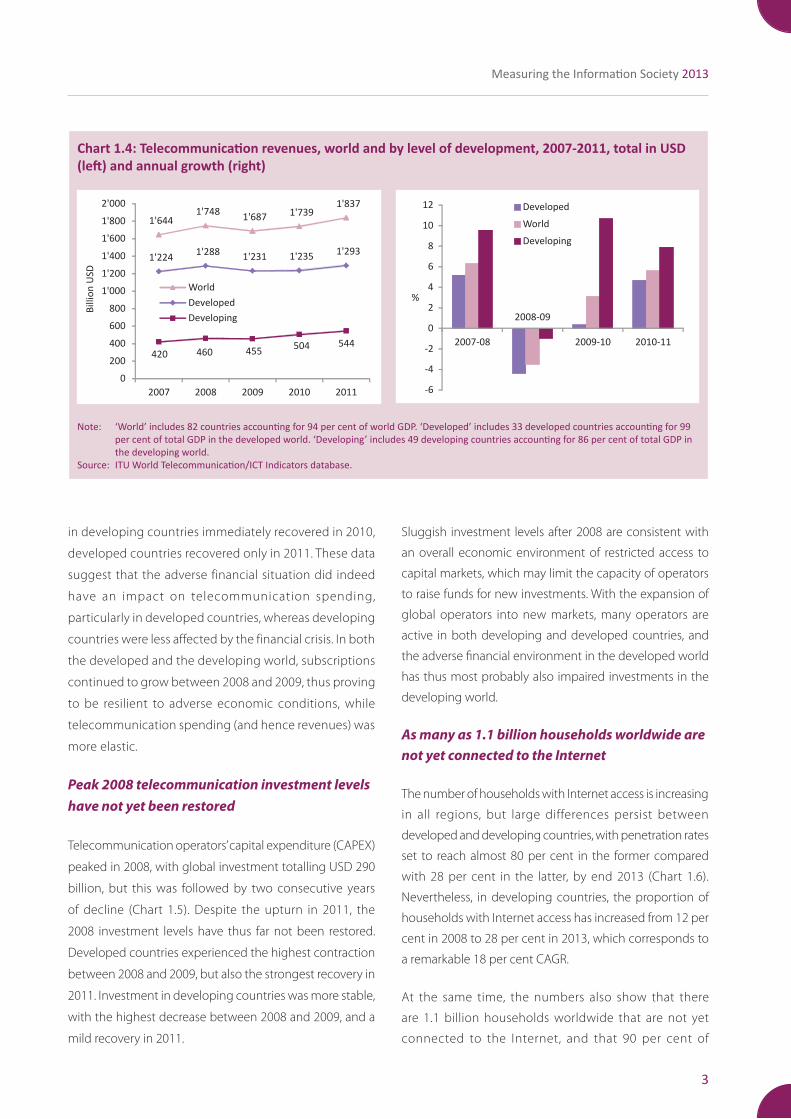
Growth in fixed (wired) broadband is slowing in developed countries
Fixed (wired)-broadband uptake continues to grow – albeit
more slowly than mobile broadband – at around 10 per
cent CAGR between 2010 and 2013. Overall, growth is
slowing owing to reduced growth in developed countries
over the past three years, whereas growth in developing
countries continues at double-digit rates, reflecting the
significant investments made in fibre-optic networks in
many developing countries (Chart 1.3). Nevertheless, the
fixed (wired)-broadband divide between developed and
developing regions remains substantial. According to the
latest ITU estimates, by end 2013 fixed (wired)-broadband
Note: *Estimate.Source: ITUWorldTelecommunication/ICTIndicatorsdatabase.
Chart 1.2: Active mobile-broadband subscriptions, world and by level of development, 2007-2013*
74.8
29.5
19.8
0
10
20
30
40
50
60
70
80
2007 2008 2009 2010 2011 2012* 2013*
Developed
World
Developing
Pe
r 1
00
in
ha
bit
an
ts
penetration will reach almost 10 per cent globally, 27 per
cent in developed countries and around 6 per cent in
developing countries.
There is a strong link between broadband uptake and
broadband affordability. ITU data show that the price of
fixed-broadband, measured as a percentage of GNI per capita,
has fallen by 82 per cent over the past four years. The drop is
particularly remarkable in developing countries, partly due to
very high initial values. Nonetheless, fixed-broadband services
are still unaffordable for most people in developing countries,
costing on average 30 per cent of GNI per capita.
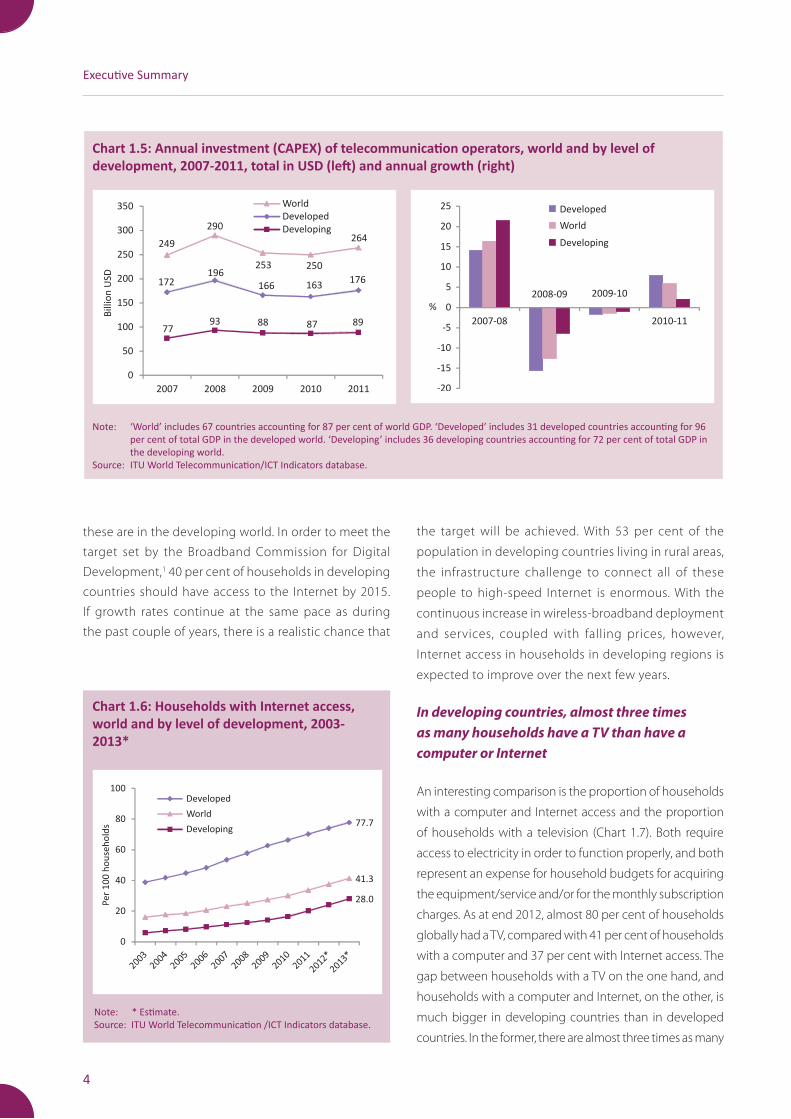
Telecommunication revenues in developing countries were less affected by the financial crisis
From 2007 to 2011, total telecommunication revenues
grew by 12 per cent, climbing to USD 1.8 trillion, or 2.6 per
cent of world GDP (Chart 1.4). Over the same period, the
developing countries’ share of total telecommunication
revenues increased from 26 to 30 per cent, highlighting the
growing importance of the telecommunication sector in its
own right for the economic growth of the developing world.
There was a decline in revenues from 2008 to 2009,
coinciding with the global financial crisis. While growth
Note: *Estimate.Source: ITUWorldTelecommunication/ICTIndicatorsdatabase.
Chart 1.3: Fixed (wired)-broadband subscriptions, world and by level of development, 2003-2013*
27.2
9.8
6.1
0
5
10
15
20
25
30 Developed
World
Developing
Pe
r 1
00
in
ha
bit
an
ts
3
Measuring the Information Society 2013
in developing countries immediately recovered in 2010,
developed countries recovered only in 2011. These data
suggest that the adverse financial situation did indeed
have an impact on telecommunication spending,
particularly in developed countries, whereas developing
countries were less affected by the financial crisis. In both
the developed and the developing world, subscriptions
continued to grow between 2008 and 2009, thus proving
to be resilient to adverse economic conditions, while
telecommunication spending (and hence revenues) was
more elastic.
Peak 2008 telecommunication investment levels have not yet been restored
Telecommunication operators’ capital expenditure (CAPEX)
peaked in 2008, with global investment totalling USD 290
billion, but this was followed by two consecutive years
of decline (Chart 1.5). Despite the upturn in 2011, the
2008 investment levels have thus far not been restored.
Developed countries experienced the highest contraction
between 2008 and 2009, but also the strongest recovery in
2011. Investment in developing countries was more stable,
with the highest decrease between 2008 and 2009, and a
mild recovery in 2011.
Chart 1.4: Telecommunication revenues, world and by level of development, 2007-2011, total in USD (left) and annual growth (right)
Note: ‘World’includes82countriesaccountingfor94percentofworldGDP.‘Developed’includes33developedcountriesaccountingfor99percentoftotalGDPinthedevelopedworld.‘Developing’includes49developingcountriesaccountingfor86percentoftotalGDPinthedevelopingworld.
Source: ITUWorldTelecommunication/ICTIndicatorsdatabase.
1'6441'748
1 687' 1 739'1 837'
1 224'1 288'
1 231' 1 235'1 293'
420 460 455504 544
0
200
400
600
800
1'000
1'200
1'400
1'600
1'800
2'000
2007 2008 2009 2010 2011
World
Developed
Developing
Bil
lio
n U
SD
-6
-4
-2
0
2
4
6
8
10
12
2007-08
2008-09
2009-10 2010-11
Developed
World
Developing
%
Sluggish investment levels after 2008 are consistent with
an overall economic environment of restricted access to
capital markets, which may limit the capacity of operators
to raise funds for new investments. With the expansion of
global operators into new markets, many operators are
active in both developing and developed countries, and
the adverse financial environment in the developed world
has thus most probably also impaired investments in the
developing world.
As many as 1.1 billion households worldwide are not yet connected to the Internet
The number of households with Internet access is increasing
in all regions, but large differences persist between
developed and developing countries, with penetration rates
set to reach almost 80 per cent in the former compared
with 28 per cent in the latter, by end 2013 (Chart 1.6).
Nevertheless, in developing countries, the proportion of
households with Internet access has increased from 12 per
cent in 2008 to 28 per cent in 2013, which corresponds to
a remarkable 18 per cent CAGR.
At the same time, the numbers also show that there
are 1.1 billion households worldwide that are not yet
connected to the Internet, and that 90 per cent of
4
Executive Summary
Chart 1.5: Annual investment (CAPEX) of telecommunication operators, world and by level of development, 2007-2011, total in USD (left) and annual growth (right)
Note: ‘World’includes67countriesaccountingfor87percentofworldGDP.‘Developed’includes31developedcountriesaccountingfor96percentoftotalGDPinthedevelopedworld.‘Developing’includes36developingcountriesaccountingfor72percentoftotalGDPinthedevelopingworld.
Source: ITUWorldTelecommunication/ICTIndicatorsdatabase.
249
290
253 250
264
172196
166 163176
7793 88 87 89
0
50
100
150
200
250
300
350
2007 2008 2009 2010 2011
World
Developed
Developing
Bil
lio
n U
SD
-20
-15
-10
-5
0
5
10
15
20
25
2007-08
2008-09 2009-10
2010-11
Developed
World
Developing
%
these are in the developing world. In order to meet the
target set by the Broadband Commission for Digital
Development,1 40 per cent of households in developing
countries should have access to the Internet by 2015.
If growth rates continue at the same pace as during
the past couple of years, there is a realistic chance that
Note: *Estimate.Source:ITUWorldTelecommunication/ICTIndicatorsdatabase.
Chart 1.6: Households with Internet access, world and by level of development, 2003-2013*
the target will be achieved. With 53 per cent of the
population in developing countries living in rural areas,
the infrastructure challenge to connect all of these
people to high-speed Internet is enormous. With the
continuous increase in wireless-broadband deployment
and services, coupled with falling prices, however,
Internet access in households in developing regions is
expected to improve over the next few years.
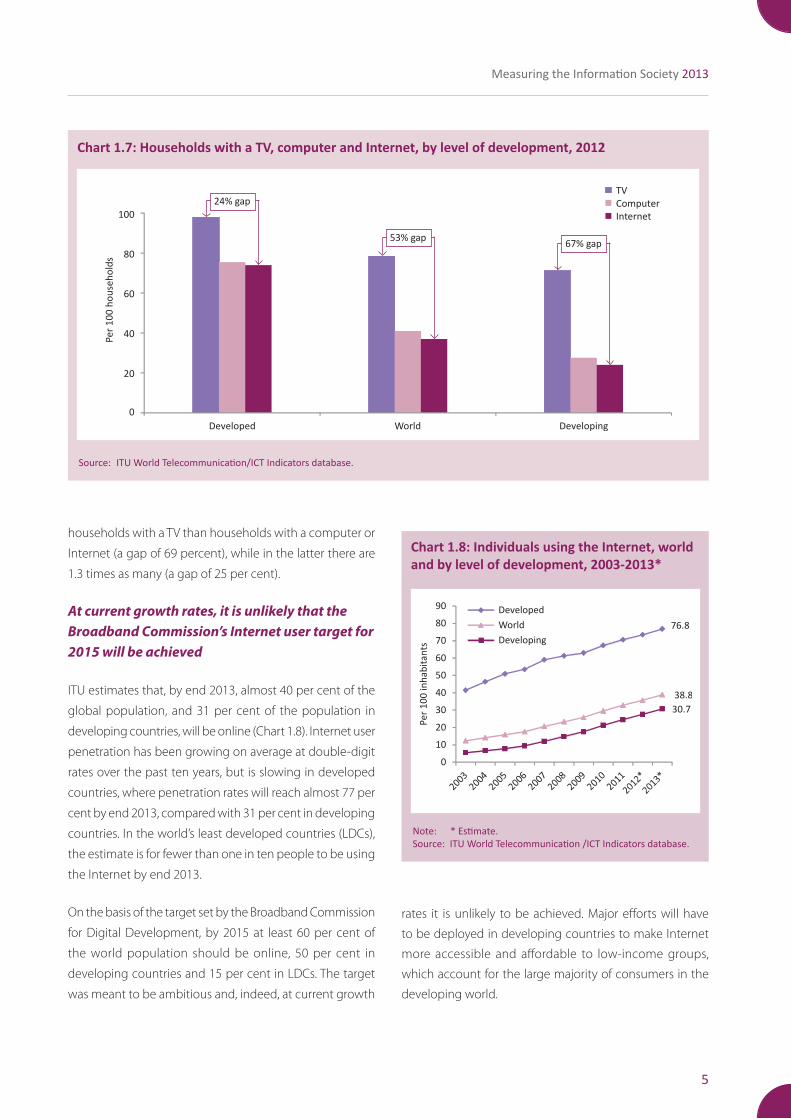
In developing countries, almost three times as many households have a TV than have a computer or Internet
An interesting comparison is the proportion of households
with a computer and Internet access and the proportion
of households with a television (Chart 1.7). Both require
access to electricity in order to function properly, and both
represent an expense for household budgets for acquiring
the equipment/service and/or for the monthly subscription
charges. As at end 2012, almost 80 per cent of households
globally had a TV, compared with 41 per cent of households
with a computer and 37 per cent with Internet access. The
gap between households with a TV on the one hand, and
households with a computer and Internet, on the other, is
much bigger in developing countries than in developed
countries. In the former, there are almost three times as many
77.7
41.3
28.0
0
20
40
60
80
100
Pe
r 1
00
ho
use
ho
lds
Developed
World
Developing
5
Measuring the Information Society 2013
households with a TV than households with a computer or
Internet (a gap of 69 percent), while in the latter there are
1.3 times as many (a gap of 25 per cent).
At current growth rates, it is unlikely that the Broadband Commission’s Internet user target for 2015 will be achieved
ITU estimates that, by end 2013, almost 40 per cent of the
global population, and 31 per cent of the population in
developing countries, will be online (Chart 1.8). Internet user
penetration has been growing on average at double-digit
rates over the past ten years, but is slowing in developed
countries, where penetration rates will reach almost 77 per
cent by end 2013, compared with 31 per cent in developing
countries. In the world’s least developed countries (LDCs),
the estimate is for fewer than one in ten people to be using
the Internet by end 2013.
On the basis of the target set by the Broadband Commission
for Digital Development, by 2015 at least 60 per cent of
the world population should be online, 50 per cent in
developing countries and 15 per cent in LDCs. The target
was meant to be ambitious and, indeed, at current growth
0
20
40
60
80
100
Developed World Developing
TV
Computer
Internet
Pe
r 1
00
ho
use
ho
lds
Chart 1.7: Households with a TV, computer and Internet, by level of development, 2012
Source:ITUWorldTelecommunication/ICTIndicatorsdatabase.
24%gap
53%gap 67%gap
Note: *Estimate.Source:ITUWorldTelecommunication/ICTIndicatorsdatabase.
Chart 1.8: Individuals using the Internet, world and by level of development, 2003-2013*
rates it is unlikely to be achieved. Major efforts will have
to be deployed in developing countries to make Internet
more accessible and affordable to low-income groups,
which account for the large majority of consumers in the
developing world.
76.8
38.8
30.7
0
10
20
30
40
50
60
70
80
90 Developed
World
Developing
Pe
r 1
00
in
ha
bit
an
ts
6
Executive Summary
As many as 146 governments have adopted a national broadband plan
National ICT/broadband policies can stimulate the market,
expand services and bring down prices. Governments can
therefore play an important role by providing an enabling
environment for the development of the ICT market and the
deployment of broadband infrastructure. Today, of the 146
governments that have adopted or are planning to adopt
a national policy, strategy or plan to promote broadband,
70 per cent are from developing countries. Furthermore,
around 35 per cent of countries have included broadband
in their universal access/service definitions – and these
numbers are expected to increase further.2 Many of these
broadband policies and plans focus on building nationwide
broadband infrastructure and connecting households, but
also on stimulating demand through the adoption of online
services and applications such as e-business, e-education,
e-health and e-government.
The main target groups of the post-2015 deve-lopment goals will be among the 4.4 billion unconnected people
There is no doubt that ICTs continue to be a key enabler
for social and economic development. Access to new
technologies is important for ensuring full participation by
all in new opportunities related to employment, education,
health, governance or peace-building. There is a real danger
that while the world is transforming into an information
society based on high-speed, always-on connections, there
is no equal access to ICTs for all. The main target groups of
the MDGs and post-2015 development goals will have to be
sought precisely among those 4.4 billion people who are not
yet connected to the Internet. People living outside major
cities in developing countries are those for whom ICTs can
have the greatest development impact. The divide between
those who are part of the global information society and
those who are not is liable to deepen, as the latter are left
behind and face little progress.
Continuous monitoring and measurement of information-
society developments will be required in order to identify
progress and gaps and to ensure equal access, use and impact
of ICTs. It is essential to have the national and international
statistical community on board early on in the process of
formulating targets and indicators in the field of ICT for
development. ITU, jointly with its partners, is working actively
to establish a bridge between these debates and promote
an active role for the statistical community in the process
of developing future ICT-related development frameworks.
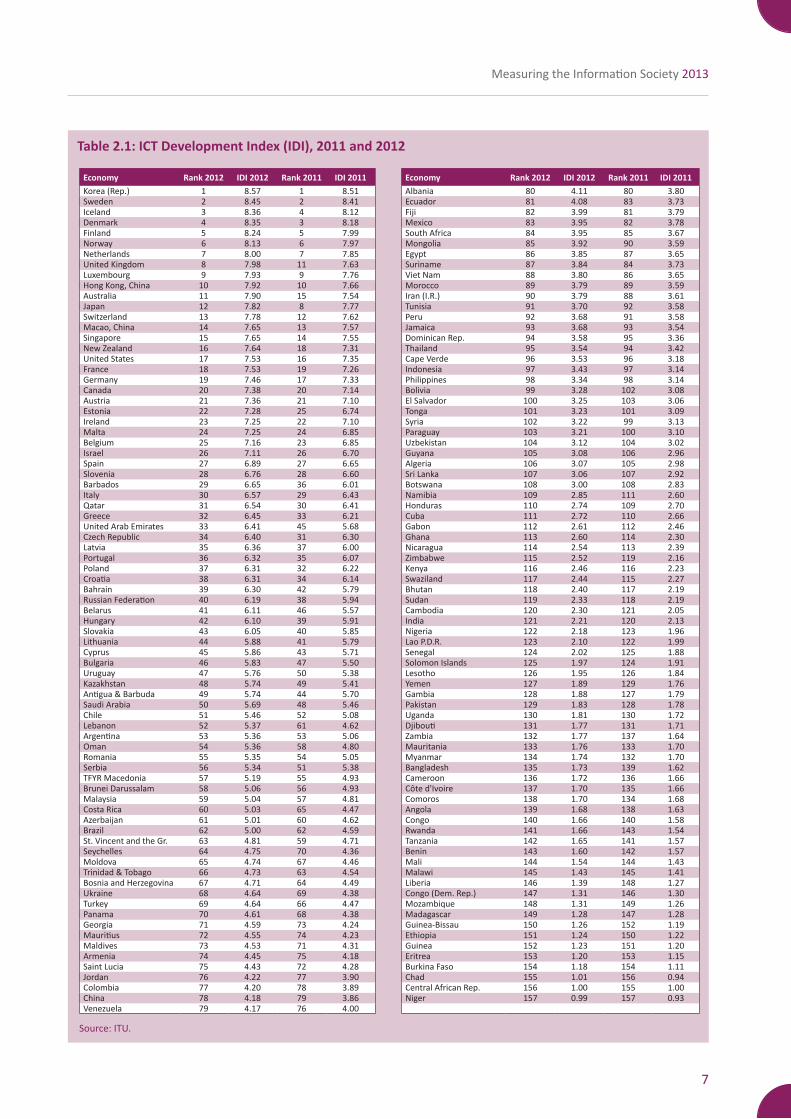
Chapter 2. The ICT Development Index (IDI)The ICT Development Index (IDI) is a composite index
combining 11 indicators into one benchmark measure
(presented on a scale from 0 to 10) that monitors and
compares developments in information and communication
technology (ICT) across countries. The main objectives of
the IDI are to measure:
• the level and evolution over time of ICT developments
in countries and relative to other countries;
• progress in ICT development in both developed and
developing countries;
• the digital divide, i.e. differences between countries
with different levels of ICT development.
The IDI is divided into three sub-indices: the access sub-
index, the use sub-index and the skills sub-index, each
capturing different aspects and components of the ICT
development process. This report presents IDI results for
2012 in comparison with 2011, for 157 economies.
The Republic of Korea and Europe’s Nordic countries maintain their positions at the top of the IDI
The Republic of Korea, followed by Sweden, continues to
lead the world in terms of ICT developments. The other
Nordic countries Iceland, Denmark, Finland and Norway
follow closely. The Netherlands, the United Kingdom,
Luxembourg and Hong Kong (China) also rank in the top ten.
A comparison with the 2011 ranking shows little change in
terms of the countries with the highest ICT levels. The United
Kingdom joined the top ten group, up from 11th position
in 2011. Almost two-thirds of the top 30 IDI economies are
7
Measuring the Information Society 2013
Note: *The GNI per capita is based on the World Bank’s Atlas Method. Source: ITU.
Table 2.1: ICT Development Index (IDI), 2011 and 2012
Economy Rank 2012 IDI 2012 Rank 2011 IDI 2011 Economy Rank 2012 IDI 2012 Rank 2011 IDI 2011Korea(Rep.) 1 8.57 1 8.51 Albania 80 4.11 80 3.80Sweden 2 8.45 2 8.41 Ecuador 81 4.08 83 3.73Iceland 3 8.36 4 8.12 Fiji 82 3.99 81 3.79Denmark 4 8.35 3 8.18 Mexico 83 3.95 82 3.78Finland 5 8.24 5 7.99 SouthAfrica 84 3.95 85 3.67Norway 6 8.13 6 7.97 Mongolia 85 3.92 90 3.59Netherlands 7 8.00 7 7.85 Egypt 86 3.85 87 3.65UnitedKingdom 8 7.98 11 7.63 Suriname 87 3.84 84 3.73Luxembourg 9 7.93 9 7.76 VietNam 88 3.80 86 3.65HongKong,China 10 7.92 10 7.66 Morocco 89 3.79 89 3.59Australia 11 7.90 15 7.54 Iran(I.R.) 90 3.79 88 3.61Japan 12 7.82 8 7.77 Tunisia 91 3.70 92 3.58Switzerland 13 7.78 12 7.62 Peru 92 3.68 91 3.58Macao,China 14 7.65 13 7.57 Jamaica 93 3.68 93 3.54Singapore 15 7.65 14 7.55 DominicanRep. 94 3.58 95 3.36NewZealand 16 7.64 18 7.31 Thailand 95 3.54 94 3.42UnitedStates 17 7.53 16 7.35 CapeVerde 96 3.53 96 3.18France 18 7.53 19 7.26 Indonesia 97 3.43 97 3.14Germany 19 7.46 17 7.33 Philippines 98 3.34 98 3.14Canada 20 7.38 20 7.14 Bolivia 99 3.28 102 3.08Austria 21 7.36 21 7.10 ElSalvador 100 3.25 103 3.06Estonia 22 7.28 25 6.74 Tonga 101 3.23 101 3.09Ireland 23 7.25 22 7.10 Syria 102 3.22 99 3.13Malta 24 7.25 24 6.85 Paraguay 103 3.21 100 3.10Belgium 25 7.16 23 6.85 Uzbekistan 104 3.12 104 3.02Israel 26 7.11 26 6.70 Guyana 105 3.08 106 2.96Spain 27 6.89 27 6.65 Algeria 106 3.07 105 2.98Slovenia 28 6.76 28 6.60 SriLanka 107 3.06 107 2.92Barbados 29 6.65 36 6.01 Botswana 108 3.00 108 2.83Italy 30 6.57 29 6.43 Namibia 109 2.85 111 2.60Qatar 31 6.54 30 6.41 Honduras 110 2.74 109 2.70Greece 32 6.45 33 6.21 Cuba 111 2.72 110 2.66UnitedArabEmirates 33 6.41 45 5.68 Gabon 112 2.61 112 2.46CzechRepublic 34 6.40 31 6.30 Ghana 113 2.60 114 2.30Latvia 35 6.36 37 6.00 Nicaragua 114 2.54 113 2.39Portugal 36 6.32 35 6.07 Zimbabwe 115 2.52 119 2.16Poland 37 6.31 32 6.22 Kenya 116 2.46 116 2.23Croatia 38 6.31 34 6.14 Swaziland 117 2.44 115 2.27Bahrain 39 6.30 42 5.79 Bhutan 118 2.40 117 2.19RussianFederation 40 6.19 38 5.94 Sudan 119 2.33 118 2.19Belarus 41 6.11 46 5.57 Cambodia 120 2.30 121 2.05Hungary 42 6.10 39 5.91 India 121 2.21 120 2.13Slovakia 43 6.05 40 5.85 Nigeria 122 2.18 123 1.96Lithuania 44 5.88 41 5.79 LaoP.D.R. 123 2.10 122 1.99Cyprus 45 5.86 43 5.71 Senegal 124 2.02 125 1.88Bulgaria 46 5.83 47 5.50 SolomonIslands 125 1.97 124 1.91Uruguay 47 5.76 50 5.38 Lesotho 126 1.95 126 1.84Kazakhstan 48 5.74 49 5.41 Yemen 127 1.89 129 1.76Antigua&Barbuda 49 5.74 44 5.70 Gambia 128 1.88 127 1.79SaudiArabia 50 5.69 48 5.46 Pakistan 129 1.83 128 1.78Chile 51 5.46 52 5.08 Uganda 130 1.81 130 1.72Lebanon 52 5.37 61 4.62 Djibouti 131 1.77 131 1.71Argentina 53 5.36 53 5.06 Zambia 132 1.77 137 1.64Oman 54 5.36 58 4.80 Mauritania 133 1.76 133 1.70Romania 55 5.35 54 5.05 Myanmar 134 1.74 132 1.70Serbia 56 5.34 51 5.38 Bangladesh 135 1.73 139 1.62TFYRMacedonia 57 5.19 55 4.93 Cameroon 136 1.72 136 1.66BruneiDarussalam 58 5.06 56 4.93 Côted'Ivoire 137 1.70 135 1.66Malaysia 59 5.04 57 4.81 Comoros 138 1.70 134 1.68CostaRica 60 5.03 65 4.47 Angola 139 1.68 138 1.63Azerbaijan 61 5.01 60 4.62 Congo 140 1.66 140 1.58Brazil 62 5.00 62 4.59 Rwanda 141 1.66 143 1.54St.VincentandtheGr. 63 4.81 59 4.71 Tanzania 142 1.65 141 1.57Seychelles 64 4.75 70 4.36 Benin 143 1.60 142 1.57Moldova 65 4.74 67 4.46 Mali 144 1.54 144 1.43Trinidad&Tobago 66 4.73 63 4.54 Malawi 145 1.43 145 1.41BosniaandHerzegovina 67 4.71 64 4.49 Liberia 146 1.39 148 1.27Ukraine 68 4.64 69 4.38 Congo(Dem.Rep.) 147 1.31 146 1.30Turkey 69 4.64 66 4.47 Mozambique 148 1.31 149 1.26Panama 70 4.61 68 4.38 Madagascar 149 1.28 147 1.28Georgia 71 4.59 73 4.24 Guinea-Bissau 150 1.26 152 1.19Mauritius 72 4.55 74 4.23 Ethiopia 151 1.24 150 1.22Maldives 73 4.53 71 4.31 Guinea 152 1.23 151 1.20Armenia 74 4.45 75 4.18 Eritrea 153 1.20 153 1.15SaintLucia 75 4.43 72 4.28 BurkinaFaso 154 1.18 154 1.11Jordan 76 4.22 77 3.90 Chad 155 1.01 156 0.94Colombia 77 4.20 78 3.89 CentralAfricanRep. 156 1.00 155 1.00China 78 4.18 79 3.86 Niger 157 0.99 157 0.93Venezuela 79 4.17 76 4.00
Source:ITU.
8
Executive Summary
from Europe, where a shared regulatory framework and a
clear set of priority areas, goals and targets have helped
countries evolve into advanced information economies. Also
among the top 30 are a number of high-income economies
from Asia and the Pacific (Australia, Macao (China), Singapore
and New Zealand) as well as the United States, Canada and
Barbados from the Americas region (Table 2.1).
ICT levels are maturing at similar speeds across countries, but little progress has been achieved in closing the digital divide
The IDI results demonstrate that ICT levels continue to
mature throughout the world, insofar as almost all countries
increased their IDI values between 2011 and 2012. At the
same time, huge differences in ICT access, use and skills
remain, and in 2012 IDI values ranged from a low of 0.99
(Niger) to a high of 8.57 (Republic of Korea) – within the
possible (theoretical) range of 0 to 10. The average 2012
IDI value in developed countries is twice as high as the
developing-country average (Table 2.2).
A comparison between 2011 and 2012 shows that, over this
time period, both the maximum and minimum IDI values
increased, meaning that ICT levels are maturing not only in
countries at the top but also in those at the very bottom.
Globally, the range between the lowest and the highest
IDI values has not changed, suggesting that, overall, the
ICT development gap between countries at the very top
and at the very bottom has not altered over the year. The
coefficient of variation (CV), which measures the dispersion
of all IDI values relative to the average IDI values, decreased
slightly between 2011 and 2012 for both the developed and
Table 2.2: IDI by level of development, 2011 and 2012
Note: *Simpleaverage.StDev:Standarddeviation,CV:Coefficientofvariation.Source: ITU.
IDI 2012 IDI 2011 Change in average value
2011-2012Average value* Min. Max. Range StDev CV Average
value* Min. Max. Range StDev CV
World 4.35 0.99 8.57 7.58 2.19 50.28 4.15 0.93 8.51 7.58 2.13 51.32 0.20
Developed 6.78 4.11 8.45 4.34 1.14 16.82 6.55 3.80 8.41 4.61 1.16 17.66 0.23
Developing 3.44 0.99 8.57 7.58 1.75 50.79 3.25 0.93 8.51 7.58 1.67 51.26 0.19
developing countries, suggesting that both groups became
slightly more homogeneous.
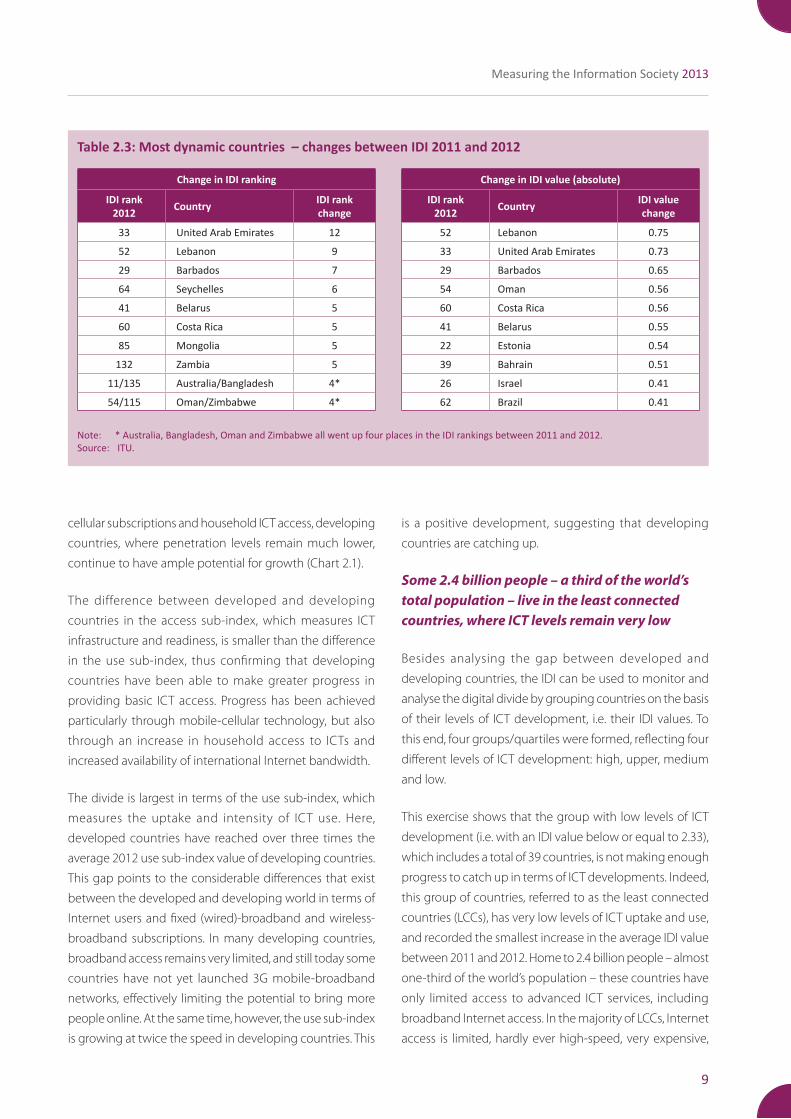
The most dynamic countries in terms of impro-ved IDI are mainly from the developing world
The report identifies a number of “dynamic” countries that
recorded above-average positive changes in their IDI rank and/
or IDI value over the 12-month period. This group of dynamic
countries predominantly includes developing countries from
all regions3. In developed countries, IDI values are generally
high and growth is more moderate (Table 2.3).
An analysis of the most dynamic countries highlights that,
although there is a strong link between ICT levels and
income levels, governments are able to foster ICT growth
and uptake, inter alia by creating an open regulatory
framework that promotes competition and brings down
prices and by encouraging private-sector investment. In
a number of cases, government-driven programmes or
initiatives have also helped to boost ICT access and use.
Finally, strong growth in the number of wireless- and
fixed-broadband subscriptions is enabling more and more
countries to increase household ICT access and use, and to
bring more people online.
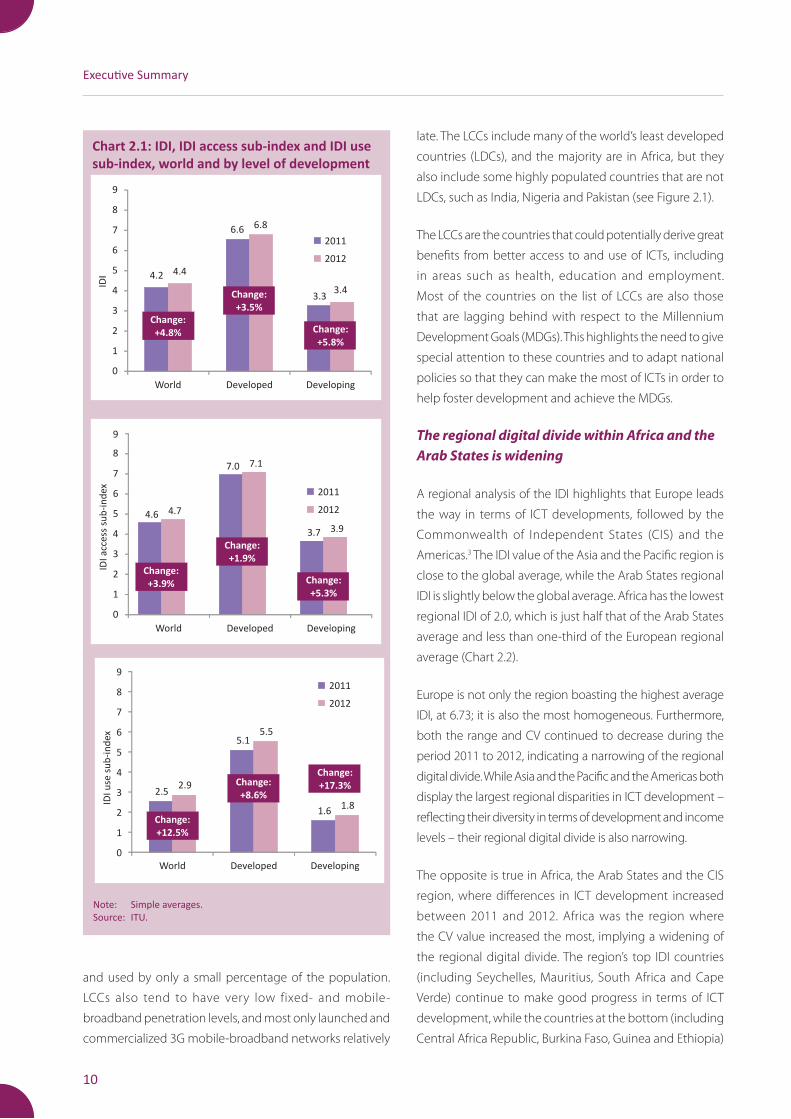
Developing countries are catching up in the IDI use sub-index
A comparison of IDI values between 2011 and 2012 shows
that the developing-country average IDI value is growing
faster, at a rate of 5.8 per cent, as against 3.5 per cent for
developed countries. While developed countries are starting
to reach saturation levels, in particular in terms of mobile-
9
Measuring the Information Society 2013
Table 2.3: Most dynamic countries – changes between IDI 2011 and 2012
Note: *Australia,Bangladesh,OmanandZimbabweallwentupfourplacesintheIDIrankingsbetween2011and2012.Source: ITU.
Change in IDI ranking Change in IDI value (absolute)
IDI rank 2012 Country IDI rank
changeIDI rank
2012 Country IDI value change
33 UnitedArabEmirates 12 52 Lebanon 0.75
52 Lebanon 9 33 UnitedArabEmirates 0.73
29 Barbados 7 29 Barbados 0.65
64 Seychelles 6 54 Oman 0.56
41 Belarus 5 60 CostaRica 0.56
60 CostaRica 5 41 Belarus 0.55
85 Mongolia 5 22 Estonia 0.54
132 Zambia 5 39 Bahrain 0.51
11/135 Australia/Bangladesh 4* 26 Israel 0.41
54/115 Oman/Zimbabwe 4* 62 Brazil 0.41
cellular subscriptions and household ICT access, developing
countries, where penetration levels remain much lower,
continue to have ample potential for growth (Chart 2.1).
The difference between developed and developing
countries in the access sub-index, which measures ICT
infrastructure and readiness, is smaller than the difference
in the use sub-index, thus confirming that developing
countries have been able to make greater progress in
providing basic ICT access. Progress has been achieved
particularly through mobile-cellular technology, but also
through an increase in household access to ICTs and
increased availability of international Internet bandwidth.
The divide is largest in terms of the use sub-index, which
measures the uptake and intensity of ICT use. Here,
developed countries have reached over three times the
average 2012 use sub-index value of developing countries.
This gap points to the considerable differences that exist
between the developed and developing world in terms of
Internet users and fixed (wired)-broadband and wireless-
broadband subscriptions. In many developing countries,
broadband access remains very limited, and still today some
countries have not yet launched 3G mobile-broadband
networks, effectively limiting the potential to bring more
people online. At the same time, however, the use sub-index
is growing at twice the speed in developing countries. This
is a positive development, suggesting that developing
countries are catching up.
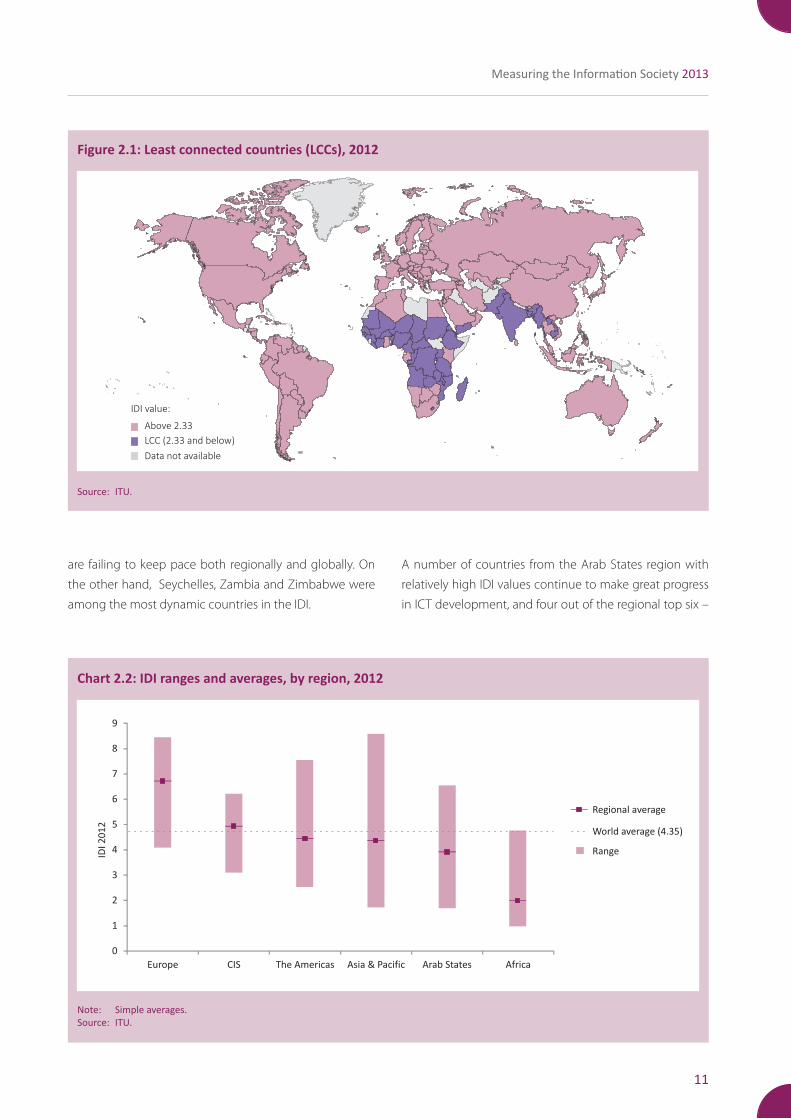
Some 2.4 billion people – a third of the world’s total population – live in the least connected countries, where ICT levels remain very low
Besides analysing the gap between developed and
developing countries, the IDI can be used to monitor and
analyse the digital divide by grouping countries on the basis
of their levels of ICT development, i.e. their IDI values. To
this end, four groups/quartiles were formed, reflecting four
different levels of ICT development: high, upper, medium
and low.
This exercise shows that the group with low levels of ICT
development (i.e. with an IDI value below or equal to 2.33),
which includes a total of 39 countries, is not making enough
progress to catch up in terms of ICT developments. Indeed,
this group of countries, referred to as the least connected
countries (LCCs), has very low levels of ICT uptake and use,
and recorded the smallest increase in the average IDI value
between 2011 and 2012. Home to 2.4 billion people – almost
one-third of the world’s population – these countries have
only limited access to advanced ICT services, including
broadband Internet access. In the majority of LCCs, Internet
access is limited, hardly ever high-speed, very expensive,
10
Executive Summary
Chart 2.1: IDI, IDI access sub-index and IDI use sub-index, world and by level of development
Note: Simpleaverages.Source:ITU.
4.2
6.6
3.3
4.4
6.8
3.4
0
1
2
3
4
5
6
7
8
9
World Developed Developing
2011
2012
IDI
Change:
+5.8%
Change:
+3.5%
Change:
+4.8%
0
1
2
3
4
5
6
7
8
9
World Developed Developing
2011
2012
IDI
acc
ess
su
b-i
nd
ex
Change:
+5.3%
Change:
+1.9%
Change:
+3.9%
4.6
7.0
3.7
4.7
7.1
3.9
:
World Developed Developing
2011
2012
IDI
use
su
b-i
nd
ex
Change:
+17.3%Change:
+8.6%
Change:
+12.5%
2.5
5.1
1.6
2.9
5.5
1.8
0
1
2
3
4
5
6
7
8
9
and used by only a small percentage of the population.
LCCs also tend to have very low fixed- and mobile-
broadband penetration levels, and most only launched and
commercialized 3G mobile-broadband networks relatively
late. The LCCs include many of the world’s least developed
countries (LDCs), and the majority are in Africa, but they
also include some highly populated countries that are not
LDCs, such as India, Nigeria and Pakistan (see Figure 2.1).
The LCCs are the countries that could potentially derive great
benefits from better access to and use of ICTs, including
in areas such as health, education and employment.
Most of the countries on the list of LCCs are also those
that are lagging behind with respect to the Millennium
Development Goals (MDGs). This highlights the need to give
special attention to these countries and to adapt national
policies so that they can make the most of ICTs in order to
help foster development and achieve the MDGs.
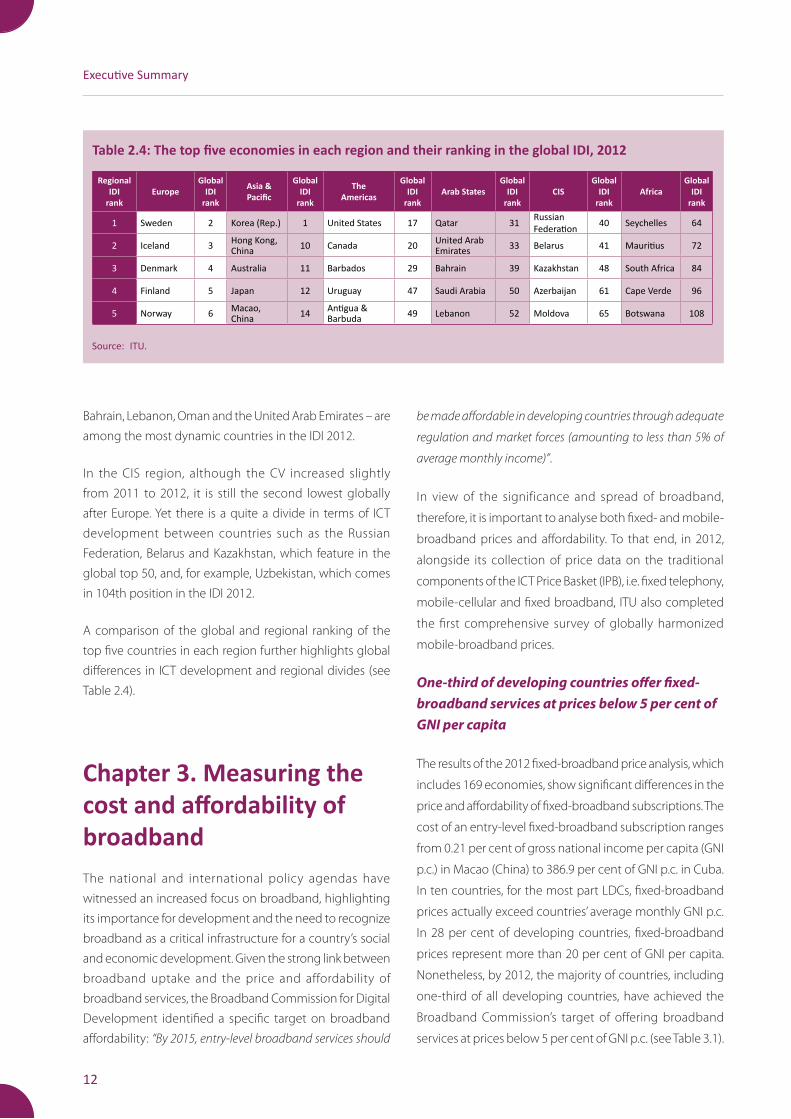
The regional digital divide within Africa and the Arab States is widening
A regional analysis of the IDI highlights that Europe leads
the way in terms of ICT developments, followed by the
Commonwealth of Independent States (CIS) and the
Americas.3 The IDI value of the Asia and the Pacific region is
close to the global average, while the Arab States regional
IDI is slightly below the global average. Africa has the lowest
regional IDI of 2.0, which is just half that of the Arab States
average and less than one-third of the European regional
average (Chart 2.2).
Europe is not only the region boasting the highest average
IDI, at 6.73; it is also the most homogeneous. Furthermore,
both the range and CV continued to decrease during the
period 2011 to 2012, indicating a narrowing of the regional
digital divide. While Asia and the Pacific and the Americas both
display the largest regional disparities in ICT development –
reflecting their diversity in terms of development and income
levels – their regional digital divide is also narrowing.
The opposite is true in Africa, the Arab States and the CIS
region, where differences in ICT development increased
between 2011 and 2012. Africa was the region where
the CV value increased the most, implying a widening of
the regional digital divide. The region’s top IDI countries
(including Seychelles, Mauritius, South Africa and Cape
Verde) continue to make good progress in terms of ICT
development, while the countries at the bottom (including
Central Africa Republic, Burkina Faso, Guinea and Ethiopia)
11
Measuring the Information Society 2013
are failing to keep pace both regionally and globally. On
the other hand, Seychelles, Zambia and Zimbabwe were
among the most dynamic countries in the IDI.
Figure 2.1: Least connected countries (LCCs), 2012
Source: ITU.
Above 2.33LCC (2.33 and below)Data not available
A number of countries from the Arab States region with
relatively high IDI values continue to make great progress
in ICT development, and four out of the regional top six –
Chart 2.2: IDI ranges and averages, by region, 2012
Note: Simple averages.Source: ITU.
Regional average
World average (4.35)
Range
0
1
2
3
4
5
6
7
8
9
Europe CIS The Americas Asia & Pacific Arab States Africa
IDI
20
12
IDI value:
12
Executive Summary
Bahrain, Lebanon, Oman and the United Arab Emirates – are
among the most dynamic countries in the IDI 2012.
In the CIS region, although the CV increased slightly
from 2011 to 2012, it is still the second lowest globally
after Europe. Yet there is a quite a divide in terms of ICT
development between countries such as the Russian
Federation, Belarus and Kazakhstan, which feature in the
global top 50, and, for example, Uzbekistan, which comes
in 104th position in the IDI 2012.
A comparison of the global and regional ranking of the
top five countries in each region further highlights global
differences in ICT development and regional divides (see
Table 2.4).
Chapter 3. Measuring the cost and affordability of broadband The national and international policy agendas have
witnessed an increased focus on broadband, highlighting
its importance for development and the need to recognize
broadband as a critical infrastructure for a country’s social
and economic development. Given the strong link between
broadband uptake and the price and affordability of
broadband services, the Broadband Commission for Digital
Development identified a specific target on broadband
affordability: “By 2015, entry-level broadband services should
be made affordable in developing countries through adequate
regulation and market forces (amounting to less than 5% of
average monthly income)”.
In view of the significance and spread of broadband,
therefore, it is important to analyse both fixed- and mobile-
broadband prices and affordability. To that end, in 2012,
alongside its collection of price data on the traditional
components of the ICT Price Basket (IPB), i.e. fixed telephony,
mobile-cellular and fixed broadband, ITU also completed
the first comprehensive survey of globally harmonized
mobile-broadband prices.
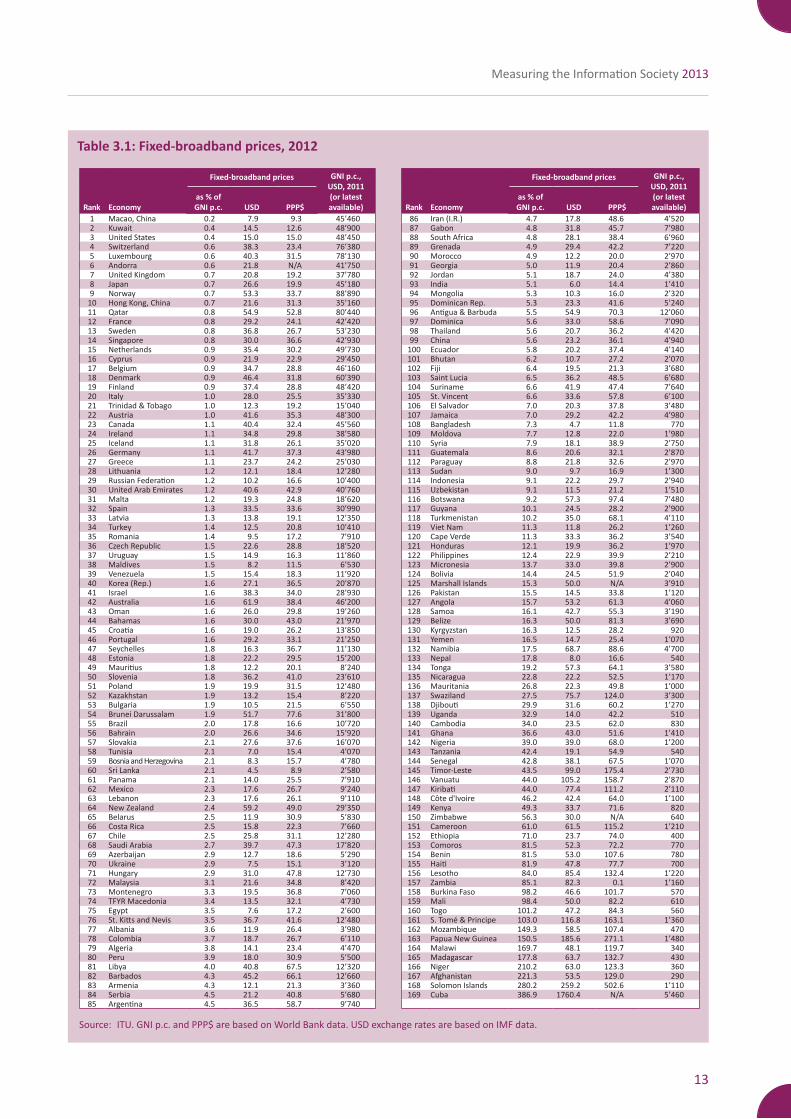
One-third of developing countries offer fixed-broadband services at prices below 5 per cent of GNI per capita
The results of the 2012 fixed-broadband price analysis, which
includes 169 economies, show significant differences in the
price and affordability of fixed-broadband subscriptions. The
cost of an entry-level fixed-broadband subscription ranges
from 0.21 per cent of gross national income per capita (GNI
p.c.) in Macao (China) to 386.9 per cent of GNI p.c. in Cuba.
In ten countries, for the most part LDCs, fixed-broadband
prices actually exceed countries’ average monthly GNI p.c.
In 28 per cent of developing countries, fixed-broadband
prices represent more than 20 per cent of GNI per capita.
Nonetheless, by 2012, the majority of countries, including
one-third of all developing countries, have achieved the
Broadband Commission’s target of offering broadband
services at prices below 5 per cent of GNI p.c. (see Table 3.1).
Table 2.4: The top five economies in each region and their ranking in the global IDI, 2012
Source:ITU.
Regional IDI
rankEurope
Global IDI
rank
Asia & Pacific
Global IDI
rank
The Americas
Global IDI
rankArab States
Global IDI
rankCIS
Global IDI
rankAfrica
Global IDI
rank
1 Sweden 2 Korea(Rep.) 1 UnitedStates 17 Qatar 31 RussianFederation 40 Seychelles 64
2 Iceland 3 HongKong,China 10 Canada 20 UnitedArab
Emirates 33 Belarus 41 Mauritius 72
3 Denmark 4 Australia 11 Barbados 29 Bahrain 39 Kazakhstan 48 SouthAfrica 84
4 Finland 5 Japan 12 Uruguay 47 SaudiArabia 50 Azerbaijan 61 CapeVerde 96
5 Norway 6 Macao, China 14 Antigua&
Barbuda 49 Lebanon 52 Moldova 65 Botswana 108
13
Measuring the Information Society 2013
Rank Economy
Fixed-broadband prices GNI p.c., USD, 2011 (or latest available) Rank Economy
Fixed-broadband prices GNI p.c., USD, 2011 (or latest available)
as % of GNI p.c. USD PPP$
as % of GNI p.c. USD PPP$
1 Macao,China 0.2 7.9 9.3 45’460 86 Iran(I.R.) 4.7 17.8 48.6 4’5202 Kuwait 0.4 14.5 12.6 48’900 87 Gabon 4.8 31.8 45.7 7’9803 UnitedStates 0.4 15.0 15.0 48’450 88 SouthAfrica 4.8 28.1 38.4 6’9604 Switzerland 0.6 38.3 23.4 76’380 89 Grenada 4.9 29.4 42.2 7’2205 Luxembourg 0.6 40.3 31.5 78’130 90 Morocco 4.9 12.2 20.0 2’9706 Andorra 0.6 21.8 N/A 41’750 91 Georgia 5.0 11.9 20.4 2’8607 UnitedKingdom 0.7 20.8 19.2 37’780 92 Jordan 5.1 18.7 24.0 4’3808 Japan 0.7 26.6 19.9 45’180 93 India 5.1 6.0 14.4 1’4109 Norway 0.7 53.3 33.7 88’890 94 Mongolia 5.3 10.3 16.0 2’32010 HongKong,China 0.7 21.6 31.3 35’160 95 DominicanRep. 5.3 23.3 41.6 5’24011 Qatar 0.8 54.9 52.8 80’440 96 Antigua&Barbuda 5.5 54.9 70.3 12’06012 France 0.8 29.2 24.1 42’420 97 Dominica 5.6 33.0 58.6 7’09013 Sweden 0.8 36.8 26.7 53’230 98 Thailand 5.6 20.7 36.2 4’42014 Singapore 0.8 30.0 36.6 42’930 99 China 5.6 23.2 36.1 4’94015 Netherlands 0.9 35.4 30.2 49’730 100 Ecuador 5.8 20.2 37.4 4’14016 Cyprus 0.9 21.9 22.9 29’450 101 Bhutan 6.2 10.7 27.2 2’07017 Belgium 0.9 34.7 28.8 46’160 102 Fiji 6.4 19.5 21.3 3’68018 Denmark 0.9 46.4 31.8 60’390 103 SaintLucia 6.5 36.2 48.5 6’68019 Finland 0.9 37.4 28.8 48’420 104 Suriname 6.6 41.9 47.4 7’64020 Italy 1.0 28.0 25.5 35’330 105 St.Vincent 6.6 33.6 57.8 6’10021 Trinidad&Tobago 1.0 12.3 19.2 15’040 106 ElSalvador 7.0 20.3 37.8 3’48022 Austria 1.0 41.6 35.3 48’300 107 Jamaica 7.0 29.2 42.2 4’98023 Canada 1.1 40.4 32.4 45’560 108 Bangladesh 7.3 4.7 11.8 77024 Ireland 1.1 34.8 29.8 38’580 109 Moldova 7.7 12.8 22.0 1’98025 Iceland 1.1 31.8 26.1 35’020 110 Syria 7.9 18.1 38.9 2’75026 Germany 1.1 41.7 37.3 43’980 111 Guatemala 8.6 20.6 32.1 2’87027 Greece 1.1 23.7 24.2 25’030 112 Paraguay 8.8 21.8 32.6 2’97028 Lithuania 1.2 12.1 18.4 12’280 113 Sudan 9.0 9.7 16.9 1’30029 RussianFederation 1.2 10.2 16.6 10’400 114 Indonesia 9.1 22.2 29.7 2’94030 UnitedArabEmirates 1.2 40.6 42.9 40’760 115 Uzbekistan 9.1 11.5 21.2 1’51031 Malta 1.2 19.3 24.8 18’620 116 Botswana 9.2 57.3 97.4 7’48032 Spain 1.3 33.5 33.6 30’990 117 Guyana 10.1 24.5 28.2 2’90033 Latvia 1.3 13.8 19.1 12’350 118 Turkmenistan 10.2 35.0 68.1 4’11034 Turkey 1.4 12.5 20.8 10’410 119 VietNam 11.3 11.8 26.2 1’26035 Romania 1.4 9.5 17.2 7’910 120 CapeVerde 11.3 33.3 36.2 3’54036 CzechRepublic 1.5 22.6 28.8 18’520 121 Honduras 12.1 19.9 36.2 1’97037 Uruguay 1.5 14.9 16.3 11’860 122 Philippines 12.4 22.9 39.9 2’21038 Maldives 1.5 8.2 11.5 6’530 123 Micronesia 13.7 33.0 39.8 2’90039 Venezuela 1.5 15.4 18.3 11’920 124 Bolivia 14.4 24.5 51.9 2’04040 Korea(Rep.) 1.6 27.1 36.5 20’870 125 MarshallIslands 15.3 50.0 N/A 3’91041 Israel 1.6 38.3 34.0 28’930 126 Pakistan 15.5 14.5 33.8 1’12042 Australia 1.6 61.9 38.4 46’200 127 Angola 15.7 53.2 61.3 4’06043 Oman 1.6 26.0 29.8 19’260 128 Samoa 16.1 42.7 55.3 3’19044 Bahamas 1.6 30.0 43.0 21’970 129 Belize 16.3 50.0 81.3 3’69045 Croatia 1.6 19.0 26.2 13’850 130 Kyrgyzstan 16.3 12.5 28.2 92046 Portugal 1.6 29.2 33.1 21’250 131 Yemen 16.5 14.7 25.4 1’07047 Seychelles 1.8 16.3 36.7 11’130 132 Namibia 17.5 68.7 88.6 4’70048 Estonia 1.8 22.2 29.5 15’200 133 Nepal 17.8 8.0 16.6 54049 Mauritius 1.8 12.2 20.1 8’240 134 Tonga 19.2 57.3 64.1 3’58050 Slovenia 1.8 36.2 41.0 23’610 135 Nicaragua 22.8 22.2 52.5 1’17051 Poland 1.9 19.9 31.5 12’480 136 Mauritania 26.8 22.3 49.8 1’00052 Kazakhstan 1.9 13.2 15.4 8’220 137 Swaziland 27.5 75.7 124.0 3’30053 Bulgaria 1.9 10.5 21.5 6’550 138 Djibouti 29.9 31.6 60.2 1’27054 BruneiDarussalam 1.9 51.7 77.6 31’800 139 Uganda 32.9 14.0 42.2 51055 Brazil 2.0 17.8 16.6 10’720 140 Cambodia 34.0 23.5 62.0 83056 Bahrain 2.0 26.6 34.6 15’920 141 Ghana 36.6 43.0 51.6 1’41057 Slovakia 2.1 27.6 37.6 16’070 142 Nigeria 39.0 39.0 68.0 1’20058 Tunisia 2.1 7.0 15.4 4’070 143 Tanzania 42.4 19.1 54.9 54059 BosniaandHerzegovina 2.1 8.3 15.7 4’780 144 Senegal 42.8 38.1 67.5 1’07060 SriLanka 2.1 4.5 8.9 2’580 145 Timor-Leste 43.5 99.0 175.4 2’73061 Panama 2.1 14.0 25.5 7’910 146 Vanuatu 44.0 105.2 158.7 2’87062 Mexico 2.3 17.6 26.7 9’240 147 Kiribati 44.0 77.4 111.2 2’11063 Lebanon 2.3 17.6 26.1 9’110 148 Côted'Ivoire 46.2 42.4 64.0 1’10064 NewZealand 2.4 59.2 49.0 29’350 149 Kenya 49.3 33.7 71.6 82065 Belarus 2.5 11.9 30.9 5’830 150 Zimbabwe 56.3 30.0 N/A 64066 CostaRica 2.5 15.8 22.3 7’660 151 Cameroon 61.0 61.5 115.2 1’21067 Chile 2.5 25.8 31.1 12’280 152 Ethiopia 71.0 23.7 74.0 40068 SaudiArabia 2.7 39.7 47.3 17’820 153 Comoros 81.5 52.3 72.2 77069 Azerbaijan 2.9 12.7 18.6 5’290 154 Benin 81.5 53.0 107.6 78070 Ukraine 2.9 7.5 15.1 3’120 155 Haiti 81.9 47.8 77.7 70071 Hungary 2.9 31.0 47.8 12’730 156 Lesotho 84.0 85.4 132.4 1’22072 Malaysia 3.1 21.6 34.8 8’420 157 Zambia 85.1 82.3 0.1 1’16073 Montenegro 3.3 19.5 36.8 7’060 158 BurkinaFaso 98.2 46.6 101.7 57074 TFYRMacedonia 3.4 13.5 32.1 4’730 159 Mali 98.4 50.0 82.2 61075 Egypt 3.5 7.6 17.2 2’600 160 Togo 101.2 47.2 84.3 56076 St.KittsandNevis 3.5 36.7 41.6 12’480 161 S.Tomé&Principe 103.0 116.8 163.1 1’36077 Albania 3.6 11.9 26.4 3’980 162 Mozambique 149.3 58.5 107.4 47078 Colombia 3.7 18.7 26.7 6’110 163 PapuaNewGuinea 150.5 185.6 271.1 1’48079 Algeria 3.8 14.1 23.4 4’470 164 Malawi 169.7 48.1 119.7 34080 Peru 3.9 18.0 30.9 5’500 165 Madagascar 177.8 63.7 132.7 43081 Libya 4.0 40.8 67.5 12’320 166 Niger 210.2 63.0 123.3 36082 Barbados 4.3 45.2 66.1 12’660 167 Afghanistan 221.3 53.5 129.0 29083 Armenia 4.3 12.1 21.3 3’360 168 SolomonIslands 280.2 259.2 502.6 1’11084 Serbia 4.5 21.2 40.8 5’680 169 Cuba 386.9 1760.4 N/A 5’46085 Argentina 4.5 36.5 58.7 9’740
Source: ITU.GNIp.c.andPPP$arebasedonWorldBankdata.USDexchangeratesarebasedonIMFdata.
Table 3.1: Fixed-broadband prices, 2012
14
Executive Summary
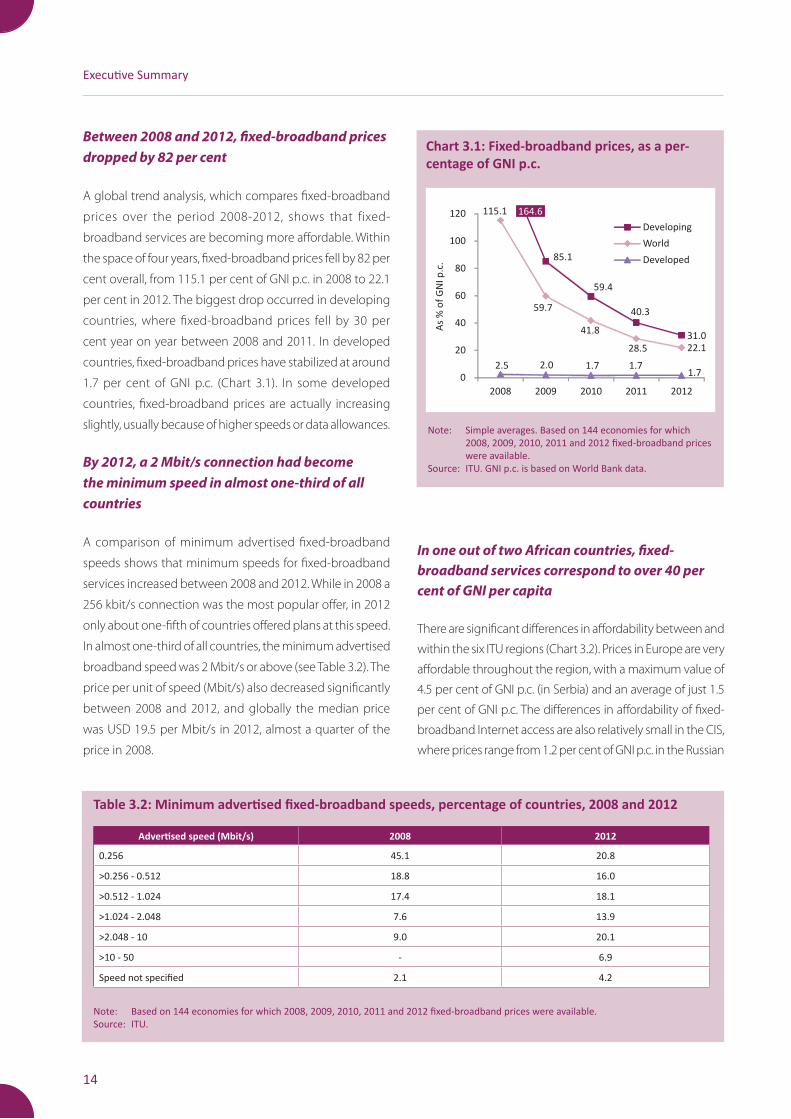
Between 2008 and 2012, fixed-broadband prices dropped by 82 per cent
A global trend analysis, which compares fixed-broadband
prices over the period 2008-2012, shows that fixed-
broadband services are becoming more affordable. Within
the space of four years, fixed-broadband prices fell by 82 per
cent overall, from 115.1 per cent of GNI p.c. in 2008 to 22.1
per cent in 2012. The biggest drop occurred in developing
countries, where fixed-broadband prices fell by 30 per
cent year on year between 2008 and 2011. In developed
countries, fixed-broadband prices have stabilized at around
1.7 per cent of GNI p.c. (Chart 3.1). In some developed
countries, fixed-broadband prices are actually increasing
slightly, usually because of higher speeds or data allowances.
By 2012, a 2 Mbit/s connection had become the minimum speed in almost one-third of all countries
A comparison of minimum advertised fixed-broadband
speeds shows that minimum speeds for fixed-broadband
services increased between 2008 and 2012. While in 2008 a
256 kbit/s connection was the most popular offer, in 2012
only about one-fifth of countries offered plans at this speed.
In almost one-third of all countries, the minimum advertised
broadband speed was 2 Mbit/s or above (see Table 3.2). The
price per unit of speed (Mbit/s) also decreased significantly
between 2008 and 2012, and globally the median price
was USD 19.5 per Mbit/s in 2012, almost a quarter of the
price in 2008.
Note: Simpleaverages.Basedon144economiesforwhich2008,2009,2010,2011and2012fixed-broadbandpriceswereavailable.
Source:ITU.GNIp.c.isbasedonWorldBankdata.
Chart 3.1: Fixed-broadband prices, as a per-centage of GNI p.c.
85.1
59.4
40.3
31.0
115.1
59.7
41.8
28.5 22.1
2.5 2.0 1.7 1.71.70
20
40
60
80
100
120
2008 2009 2010 2011 2012
Developing
World
Developed
As
% o
f G
NI
p.c
.
164.6
In one out of two African countries, fixed-broadband services correspond to over 40 per cent of GNI per capita
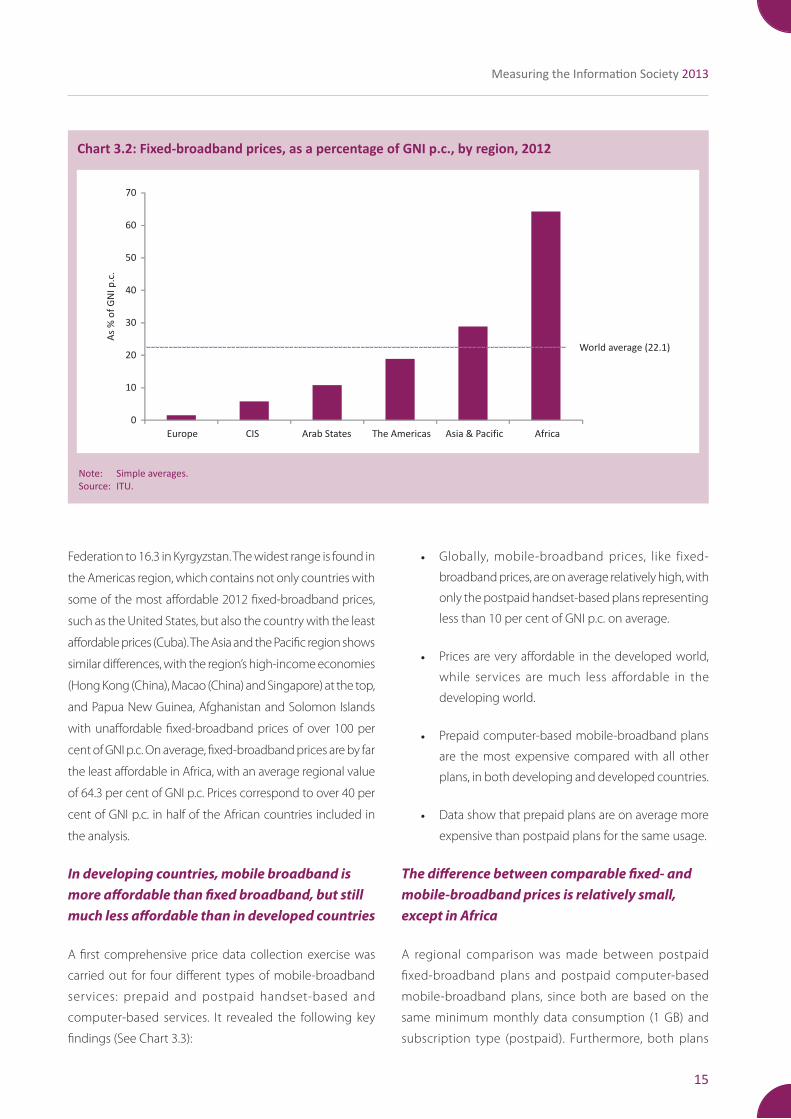
There are significant differences in affordability between and
within the six ITU regions (Chart 3.2). Prices in Europe are very
affordable throughout the region, with a maximum value of
4.5 per cent of GNI p.c. (in Serbia) and an average of just 1.5
per cent of GNI p.c. The differences in affordability of fixed-
broadband Internet access are also relatively small in the CIS,
where prices range from 1.2 per cent of GNI p.c. in the Russian
Table 3.2: Minimum advertised fixed-broadband speeds, percentage of countries, 2008 and 2012
Note: Basedon144economiesforwhich2008,2009,2010,2011and2012fixed-broadbandpriceswereavailable.Source:ITU.
Advertised speed (Mbit/s) 2008 2012
0.256 45.1 20.8
>0.256-0.512 18.8 16.0
>0.512-1.024 17.4 18.1
>1.024-2.048 7.6 13.9
>2.048-10 9.0 20.1
>10-50 - 6.9
Speednotspecified 2.1 4.2
15
Measuring the Information Society 2013
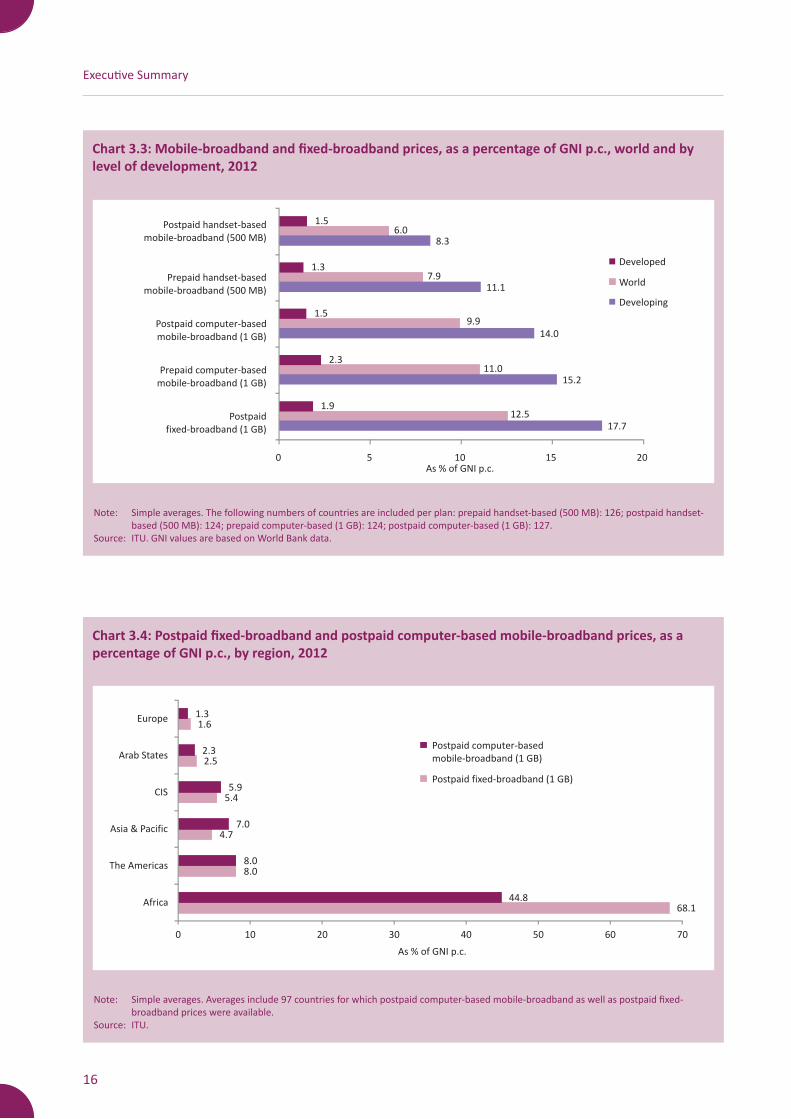
• Globally, mobile-broadband prices, like fixed-
broadband prices, are on average relatively high, with
only the postpaid handset-based plans representing
less than 10 per cent of GNI p.c. on average.
• Prices are very affordable in the developed world,
while services are much less affordable in the
developing world.
• Prepaid computer-based mobile-broadband plans
are the most expensive compared with all other
plans, in both developing and developed countries.
• Data show that prepaid plans are on average more
expensive than postpaid plans for the same usage.
The difference between comparable fixed- and mobile-broadband prices is relatively small, except in Africa
A regional comparison was made between postpaid
fixed-broadband plans and postpaid computer-based
mobile-broadband plans, since both are based on the
same minimum monthly data consumption (1 GB) and
subscription type (postpaid). Furthermore, both plans
Federation to 16.3 in Kyrgyzstan. The widest range is found in
the Americas region, which contains not only countries with
some of the most affordable 2012 fixed-broadband prices,
such as the United States, but also the country with the least
affordable prices (Cuba). The Asia and the Pacific region shows
similar differences, with the region’s high-income economies
(Hong Kong (China), Macao (China) and Singapore) at the top,
and Papua New Guinea, Afghanistan and Solomon Islands
with unaffordable fixed-broadband prices of over 100 per
cent of GNI p.c. On average, fixed-broadband prices are by far
the least affordable in Africa, with an average regional value
of 64.3 per cent of GNI p.c. Prices correspond to over 40 per
cent of GNI p.c. in half of the African countries included in
the analysis.
In developing countries, mobile broadband is more affordable than fixed broadband, but still much less affordable than in developed countries
A first comprehensive price data collection exercise was
carried out for four different types of mobile-broadband
services: prepaid and postpaid handset-based and
computer-based services. It revealed the following key
findings (See Chart 3.3):
Chart 3.2: Fixed-broadband prices, as a percentage of GNI p.c., by region, 2012
Note: Simpleaverages.Source:ITU.
0
10
20
30
40
50
60
70
Europe CIS Arab States The Americas Asia & Pacific Africa
World average (22.1)
As
% o
f G
NI
p.c
.
16
Executive Summary
Chart 3.3: Mobile-broadband and fixed-broadband prices, as a percentage of GNI p.c., world and by level of development, 2012
Note: Simpleaverages.Thefollowingnumbersofcountriesareincludedperplan:prepaidhandset-based(500MB):126;postpaidhandset-based(500MB):124;prepaidcomputer-based(1GB):124;postpaidcomputer-based(1GB):127.
Source:ITU.GNIvaluesarebasedonWorldBankdata.
12.5
11.0
9.9
7.9
6.0
17.7
15.2
14.0
11.1
8.3
1.9
2.3
1.5
1.3
1.5
0 5 10 15 20
Postpaid
fixed-broadband (1 GB)
Prepaid computer-based
mobile-broadband (1 GB)
Postpaid computer-based
mobile-broadband (1 GB)
Prepaid handset-based
mobile-broadband (500 MB)
Postpaid handset-based
mobile-broadband (500 MB)
As % of GNI p.c.
Developed
Developing
World
Chart 3.4: Postpaid fixed-broadband and postpaid computer-based mobile-broadband prices, as a percentage of GNI p.c., by region, 2012
Note: Simpleaverages.Averagesinclude97countriesforwhichpostpaidcomputer-basedmobile-broadbandaswellaspostpaidfixed-broadbandpriceswereavailable.
Source:ITU.
68.1
8.0
4.7
5.4
2.5
1.6
44.8
8.0
7.0
5.9
2.3
1.3
0 10 20 30 40 50 60 70
Africa
The Americas
Asia & Pacific
CIS
Arab States
Europe
As % of GNI p.c.
Postpaid computer-based
mobile-broadband (1 GB)
Postpaid fixed-broadband (1 GB)
17
Measuring the Information Society 2013
Table 3.3: Mobile-broadband sub-basket and its components, 2012
Economy
Mobile-broadband sub-basket
Prepaid handset-
based prices
(500 MB) as % of GNI p.c.
Postpaid computer-
based prices
(1 GB) as % of GNI
p.c.
GNI p.c., USD, 2011 (or latest available) Economy
Mobile-broadband sub-basket
Prepaid handset-
based prices
(500 MB) as % of GNI p.c.
Postpaid computer-
based prices
(1 GB) as % of GNI
p.c.
GNI p.c., USD, 2011 (or latest available)
Austria 0.1 0.1 0.1 48’300 Indonesia 2.6 2.3 2.8 2’940Qatar 0.4 0.4 0.4 80’440 Panama 2.7 2.3 3.0 7’910UnitedKingdom 0.4 0.3 0.5 37’780 Libya 2.7 4.1 1.2 12’320Germany 0.6 0.4 0.8 43’980 Argentina 2.7 2.7 2.7 9’740Kuwait 0.7 0.7 0.6 48’900 Antigua&Barbuda 2.8 2.8 2.9 12’060France 0.7 0.5 0.9 42’420 CostaRica 3.0 2.8 3.2 7’660Estonia 0.7 0.7 0.7 15’200 Egypt 3.1 3.9 2.2 2’600Norway 0.7 1.0 0.5 88’890 Jordan 3.1 2.3 3.9 4’380Belgium 0.7 0.7 0.7 46’160 Georgia 3.1 2.5 3.7 2’860Switzerland 0.7 0.8 0.7 76’380 Albania 3.3 1.5 5.1 3’980Bahrain 0.8 0.5 1.0 15’920 Ukraine 3.5 2.6 4.5 3’120Italy 0.8 0.5 1.1 35’330 Lebanon 3.7 2.8 4.6 9’110Australia 0.8 0.5 1.1 46’200 India 3.7 2.9 4.6 1’410Slovenia 0.8 0.8 0.8 23’610 Seychelles 3.9 5.2 2.6 11’130UnitedArabEmirates 1.0 0.8 1.2 40’760 Brazil 4.2 4.0 4.3 10’720Macao,China 1.0 1.0 1.0 45’460 ElSalvador 4.3 3.4 5.2 3’480Kazakhstan 1.0 1.0 1.0 8’220 CapeVerde 4.5 2.1 6.8 3’540Netherlands 1.0 1.0 1.0 49’730 Jamaica 4.6 4.9 4.2 4’980Portugal 1.0 0.8 1.2 21’250 Colombia 4.6 5.8 3.4 6’110Uruguay 1.0 1.0 1.0 11’860 SouthAfrica 4.8 3.8 5.9 6’960Denmark 1.1 1.8 0.4 60’390 Moldova 5.2 5.2 5.2 1’980HongKong,China 1.2 1.4 0.9 35’160 Mongolia 5.3 5.7 4.9 2’320Slovakia 1.3 0.8 1.7 16’070 Suriname 5.3 4.7 6.0 7’640NewZealand 1.3 1.0 1.6 29’350 Uzbekistan 5.6 4.8 6.4 1’510Ireland 1.3 1.3 1.3 38’580 Fiji 6.0 4.5 7.4 3’680UnitedStates 1.3 2.1 0.5 48’450 Ecuador 6.2 6.3 6.2 4’140Canada 1.4 1.3 1.4 45’560 Paraguay 6.7 7.7 5.8 2’970Cyprus 1.4 1.7 1.0 29’450 Guatemala 7.8 7.8 7.8 2’870Belarus 1.4 1.1 1.7 5’830 Armenia 8.0 4.8 11.2 3’360Greece 1.4 1.8 1.0 25’030 Bolivia 8.2 6.4 10.1 2’040Hungary 1.4 0.9 1.9 12’730 Namibia 8.6 8.8 8.4 4’700Spain 1.4 1.6 1.3 30’990 Philippines 9.4 6.3 12.5 2’210Serbia 1.5 1.8 1.2 5’680 Ghana 10.1 9.0 11.3 1’410Trinidad&Tobago 1.5 1.7 1.2 15’040 Botswana 11.6 9.0 14.1 7’480Romania 1.5 2.2 0.7 7’910 Honduras 11.8 16.1 7.4 1’970BruneiDarussalam 1.5 2.1 0.9 31’800 Kenya 12.4 8.2 16.5 820SaudiArabia 1.5 1.3 1.8 17’820 Morocco 12.5 20.0 4.9 2’970SriLanka 1.5 1.5 1.5 2’580 Pakistan 14.6 3.1 26.1 1’120Malta 1.6 1.8 1.3 18’620 Bangladesh 14.7 16.8 12.6 770Tunisia 1.6 1.0 2.1 4’070 Samoa 15.0 17.9 12.2 3’190Venezuela 1.6 1.4 1.9 11’920 Nicaragua 15.3 18.3 12.3 1’170Turkey 1.7 2.0 1.4 10’410 Nigeria 16.2 13.0 19.5 1’200TFYRMacedonia 1.7 1.7 1.7 4’730 Kyrgyzstan 18.5 15.8 21.2 920Barbados 1.8 1.8 1.8 12’660 VietNam 21.5 2.0 40.9 1’260Mauritius 1.8 1.8 1.8 8’240 Tajikistan 21.8 21.8 21.8 870CzechRepublic 1.8 1.8 1.8 18’520 China 23.9 3.8 44.0 4’940Azerbaijan 1.9 1.1 2.6 5’290 Mali 25.4 19.6 31.3 610Bulgaria 1.9 2.6 1.3 6’550 Lesotho 32.5 29.8 35.2 1’220RussianFederation 2.0 2.0 2.0 10’400 DominicanRep. 36.9 26.1 47.7 7’090Maldives 2.0 2.0 2.0 6’530 Haiti 42.3 16.9 67.7 700Poland 2.0 0.8 3.2 12’480 Madagascar 49.3 35.1 63.4 430Chile 2.3 2.0 2.6 12’280 Mozambique 65.9 65.9 65.9 470Peru 2.4 3.2 1.6 5’500 S.Tomé&Principe 100.0 156.5 110.3 1’360Bahamas 2.5 3.0 1.9 21,970 Zimbabwe 100.0 101.3 168.8 640Mexico 2.5 2.5 2.6 9’240 Congo(Dem.Rep.) 100.0 126.4 316.0 190
Source:ITU.
18
Executive Summary
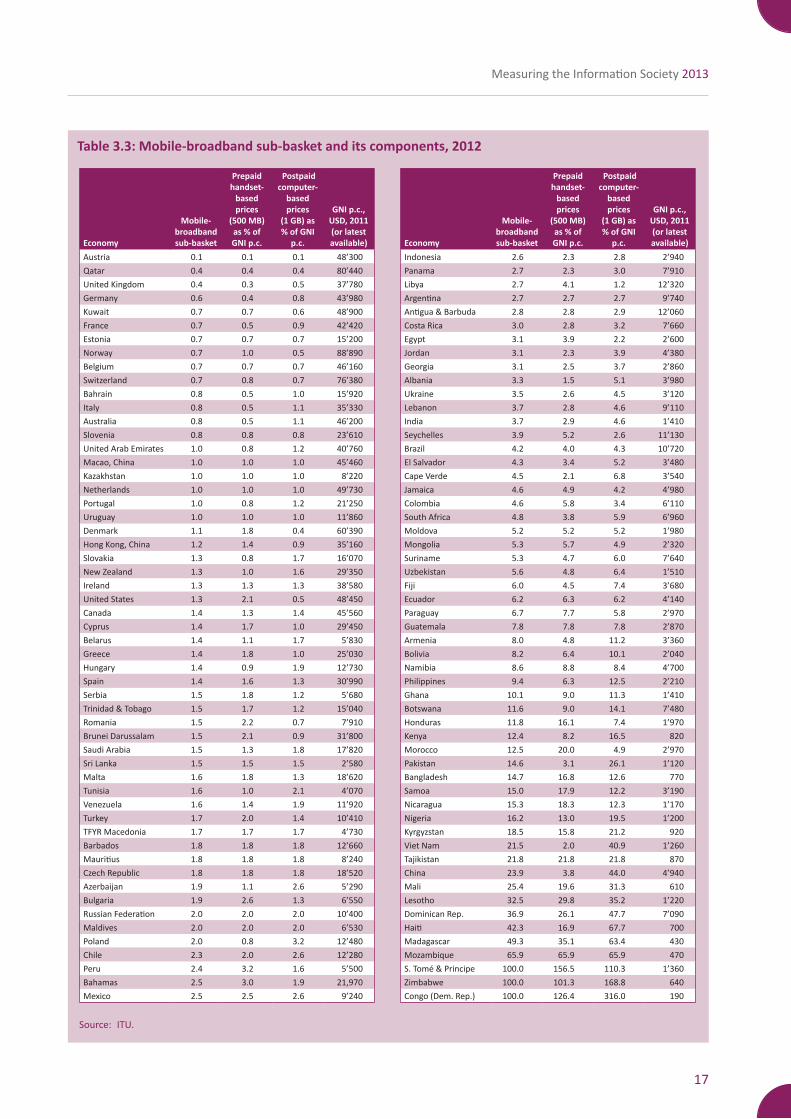
calculated for 110 economies) reveals major differences
among countries (see Table 3.3). Values range from a low
(i.e. very affordable) 0.1 in Austria, to a maximum of 100
(i.e. the cost of mobile-broadband is equal to or above the
average GNI p.c., and therefore unaffordable to a majority of
the population) in Sao Tomé and Principe, Zimbabwe and
the Democratic Republic of the Congo.
The countries at the top of the mobile-broadband sub-
basket (i.e. those with most affordable prices) are economies
with high GNI p.c. levels from the Europe and Arab States
regions – including Qatar, the United Kingdom, Germany,
Kuwait and France. However, several countries with lower
income levels, such as Estonia, Bahrain or Kazakhstan, also
feature in the top 20 of the mobile-broadband sub-basket,
with mobile-broadband prices below 1 per cent of monthly
GNI p.c. This shows that, although income matters, other
factors such as competition and regulation may play a
relevant role in making mobile broadband affordable.
Chapter 4. Measuring the world’s digital nativesFor more than two decades, people have discussed and
debated the emergence of a distinct and recognizable
global population of young people who were born into
the digital age and are growing up using information
and communication technologies (ICTs) in their daily
lives. This population of networked youth is often
referred to as digital natives, and has been the subject of
extensive research and significant academic discourse
over the past two decades. While there is no consensus
in the literature on the exact impact that ICTs have on
young people, there is general agreement that digital
media are changing the way they learn, play, socialize
and participate in civic life. Furthermore, a review of the
literature demonstrates how little research has been
done so far on digital natives and networked youth in the
developing countries. While this can be explained by a
number of factors, including the fact that the information
society, and especially Internet use, has emerged much
later in those countries compared with the United States
and Western Europe, there is an urgent need for further
are used on the same end device: a laptop or desktop
computer.
Although, globally, postpaid fixed-broadband plans are
more expensive than postpaid computer-based mobile-
broadband plans, there are regional differences. The
difference in affordability between the two plans is largest
in Africa: a postpaid computer-based mobile-broadband
subscription costs 44.8 per cent of GNI p.c., while a
postpaid fixed-broadband subscription is significantly
more expensive, at 68.1 per cent of GNI p.c. Both plans
are a lot more affordable in Europe and the Arab States,
where differences in price between the two plans are also
minimal. In the Americas, there is no difference in price in
terms of GNI p.c. between fixed broadband and mobile
broadband. In the CIS and Asia and the Pacific regions, in
contrast to the global trend, postpaid computer-based
mobile broadband is on average more expensive than
postpaid fixed broadband. While the difference is small in
the CIS, fixed broadband is somewhat more affordable in
Asia and the Pacific, at 4.7 per cent of GNI p.c. compared
with 7 per cent of GNI p.c. for mobile broadband (see
Chart 3.4).
In the developing countries, mobile data is 40 per cent more expensive than mobile voice
Following the ‘mobile miracle’ and the unprecedented spread
of mobile-cellular subscriptions, mobile broadband has been
called upon to take the baton in the ICT development race.
Since the affordability of mobile-cellular services has played
an important role in making mobile so widely available, it is
interesting to compare mobile-cellular (voice) and mobile-
broadband (data) prices. The results show that, in developing
countries, prepaid handset-based mobile broadband is 40
per cent more expensive in terms of GNI p.c. than a mobile-
cellular monthly offer. In developed countries, on the other
hand, prepaid handset-based mobile-broadband prices are
actually less expensive than mobile-cellular prices.
In more than half of the developing countries, the price of mobile broadband corresponds to less than 5 per cent of GNI p.c.
A newly developed mobile-broadband sub-basket (which
reflects the four different mobile-broadband plans and was
19
Measuring the Information Society 2013
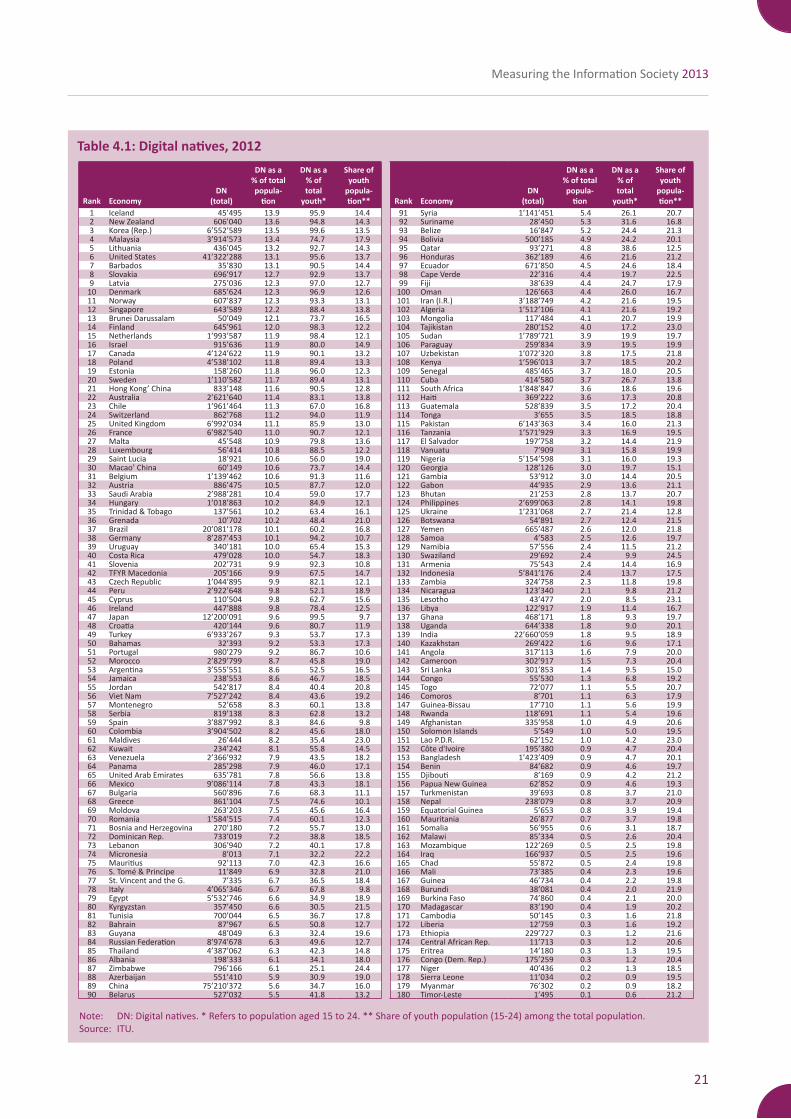
The proportion of digital natives varies from a low of 0.1 per cent in Timor-Leste to a high of 14 per cent in Iceland
The estimated proportion of the total population that are
digital natives varies between countries, from a low of 0.1
per cent in Timor-Leste to a high of 14 per cent in Iceland
(Table 4.1). The countries at the median are Belarus and Syria,
with 5.5 and 5.4 per cent digital natives, respectively. China,
the country with the largest population of digital natives, is
very close to the median, with digital natives representing
5.6 per cent of its population.
The results show that the countries with the highest
proportions of digital natives are all high-income or upper-
middle-income countries, and include countries with very
high levels of overall Internet penetration, countries at the
top of the ICT Development Index (IDI) and countries with
relatively larger shares of youth population. High-population
countries with medium or relatively high overall Internet
penetration levels tend to have high absolute numbers of
digital natives, and high-income countries (which usually
display high overall levels of Internet use) tend to have
relatively high proportions of their population categorized
as digital natives. Iceland, New Zealand, the Republic of
Korea and the United States, for example, are all countries
with relatively high levels of ICT use that also have a high
percentage of digital natives. Malaysia (ranked fourth in the
proportion of the total population that are digital natives)
is a country with a high estimated proportion of young
people who have at least five years of experience in using
the Internet.
The proportion of digital natives is more than twice as high in the developed regions
The proportion of digital natives in each region varies from a
high of 10 per cent in the Americas to a low of 1.9 per cent
in Africa. The Africa and Asia and the Pacific regions have
relatively low levels of digital natives per capita compared
with, for instance, Europe. A country’s population of
digital natives also resonates with its level of (economic)
development. Some 4.2 per cent of the people residing
in developing countries are digital natives, while in the
developed countries digital natives account for 10 per cent
of the population (Chart 4.1).
research on how ICTs are used by, and impact on, young
people in the developing world.
The first model to quantify the world’s digital native population
For the first time, ITU has developed a model to estimate the
size of the digital native population worldwide. The model
defines digital natives as the population of networked
youth – aged 15-24 years – with five or more years of online
experience. The model is applied to available data, resulting
in a country-by-country estimate of the number of digital
natives in 2012. The report thus offers the first indicator, and
the first quantified mapping, of the world’s digital natives.
These results are analysed by region, development level
and income grouping, and through the lens of educational
enrolment levels.
Just over 5 per cent of today’s world popula-tion, or 30 per cent of the young population, are digital natives
According to the model, in 2012 there were around 363
million digital natives out of a world population of around
7 billion – or 5.2 per cent. This means that 30 per cent of
the world’s youth have been active online for at least five
years. The digital natives are, globally speaking, a minority of
today’s youth. This is primarily due to relatively low Internet
usage rates in many developing countries with large (youth)
populations; but also to the fact that ICTs are a fairly new
phenomenon and that, back in 2007, by which time young
people had to be online in order to be considered digital
natives today (needing at least five years of experience to
qualify in this category), Internet penetration was relatively
low: in 2007, only 21 per cent of the global population was
online.
Figure 4.1 illustrates the distribution of digital natives
by country across the globe, with countries listed in
alphabetical order. A bigger box means more digital
natives within that country. Not surprisingly, countries
with very large populations, such as Brazil, China and
India, are prominent in the figure, but highly networked
countries with relatively smaller populations, including
Canada, the Netherlands and the Republic of Korea, also
stand out.

20
Executive Summary
Figure 4.1: Distribution of digital natives across countries (absolute numbers), 2012
Note: Absolutenumberofdigitalnativesineachcountry(listedalphabetically,toptobottomandlefttoright)indicatedbyrelativesizeofbox.Source: ITU
China
Argen-
tina
United States
Brazil
Alg-
eria
Australia
Ban-
glad-
esh
Bel-
giumChile
CanadaGermany
India
Egypt FranceColom-
bia
Czech Rep.
Russian
Fed.
South
Africa
Spain
Saudi
Arabia
Philippines
Peru
Russian
Fed.
PakistanNether-
lands
MoroccoNigeria
JapanIndonesia
Iran (I.R.)
Korea
(Rep. of)
Moldova
MexicoItaly
Thailand
Turkey United
Kingddom
Viet Nam
Venezuela
Sudan
The youth bulge in Africa and developing econo-mies will be a core driver of the level of digital nativism
Many countries are known to have a “youth bulge” or,
in other words, a large proportion of young people
relative to their population as a whole. Youth bulges
are particularly prevalent in developing nations and
regions, in particular Africa. Regionally, the percentage
of the population in the 15-24 age range varies from 20.1
per cent in Africa to 12.4 per cent in Europe. Looking at
income categories, it is apparent that the youth bulge
is most significant among the low-income and lower-
middle-income countries.
This also explains why some low-income countries, such as
Kyrgyzstan and Zimbabwe, where 15-24 year olds represent
21.5 and 24.4 per cent of the population, respectively, have
relatively high percentages of digital natives. Similarly,
lower-middle-income countries Morocco, Egypt and Syria
have relatively high proportions of digital natives, owing in
part to a large young population group. The youth bulge in
Africa and developing countries will be a core driver of the
level of digital nativism in those countries.
21
Measuring the Information Society 2013
Note: *TheGNIpercapitaisbasedontheWorldBank’sAtlasMethod.Source:ITU.
Table 4.1: Digital natives, 2012
Rank EconomyDN
(total)
DN as a % of total popula-
tion
DN as a % of total
youth*
Share of youth
popula-tion** Rank Economy
DN (total)
DN as a % of total popula-
tion
DN as a % of total
youth*
Share of youth
popula-tion**
1 Iceland 45’495 13.9 95.9 14.4 91 Syria 1’141’451 5.4 26.1 20.72 NewZealand 606’040 13.6 94.8 14.3 92 Suriname 28’450 5.3 31.6 16.83 Korea(Rep.) 6’552’589 13.5 99.6 13.5 93 Belize 16’847 5.2 24.4 21.34 Malaysia 3’914’573 13.4 74.7 17.9 94 Bolivia 500’185 4.9 24.2 20.15 Lithuania 436’045 13.2 92.7 14.3 95 Qatar 93’271 4.8 38.6 12.56 UnitedStates 41’322’288 13.1 95.6 13.7 96 Honduras 362’189 4.6 21.6 21.27 Barbados 35’830 13.1 90.5 14.4 97 Ecuador 671’850 4.5 24.6 18.48 Slovakia 696’917 12.7 92.9 13.7 98 CapeVerde 22’316 4.4 19.7 22.59 Latvia 275’036 12.3 97.0 12.7 99 Fiji 38’639 4.4 24.7 17.910 Denmark 685’624 12.3 96.9 12.6 100 Oman 126’663 4.4 26.0 16.711 Norway 607’837 12.3 93.3 13.1 101 Iran(I.R.) 3’188’749 4.2 21.6 19.512 Singapore 643’589 12.2 88.4 13.8 102 Algeria 1’512’106 4.1 21.6 19.213 BruneiDarussalam 50’049 12.1 73.7 16.5 103 Mongolia 117’484 4.1 20.7 19.914 Finland 645’961 12.0 98.3 12.2 104 Tajikistan 280’152 4.0 17.2 23.015 Netherlands 1’993’587 11.9 98.4 12.1 105 Sudan 1’789’721 3.9 19.9 19.716 Israel 915’636 11.9 80.0 14.9 106 Paraguay 259’834 3.9 19.5 19.917 Canada 4’124’622 11.9 90.1 13.2 107 Uzbekistan 1’072’320 3.8 17.5 21.818 Poland 4’538’102 11.8 89.4 13.3 108 Kenya 1’596’013 3.7 18.5 20.219 Estonia 158’260 11.8 96.0 12.3 109 Senegal 485’465 3.7 18.0 20.520 Sweden 1’110’582 11.7 89.4 13.1 110 Cuba 414’580 3.7 26.7 13.821 HongKong’China 833’148 11.6 90.5 12.8 111 SouthAfrica 1’848’847 3.6 18.6 19.622 Australia 2’621’640 11.4 83.1 13.8 112 Haiti 369’222 3.6 17.3 20.823 Chile 1’961’464 11.3 67.0 16.8 113 Guatemala 528’839 3.5 17.2 20.424 Switzerland 862’768 11.2 94.0 11.9 114 Tonga 3’655 3.5 18.5 18.825 UnitedKingdom 6’992’034 11.1 85.9 13.0 115 Pakistan 6’143’363 3.4 16.0 21.326 France 6’982’540 11.0 90.7 12.1 116 Tanzania 1’571’929 3.3 16.9 19.527 Malta 45’548 10.9 79.8 13.6 117 ElSalvador 197’758 3.2 14.4 21.928 Luxembourg 56’414 10.8 88.5 12.2 118 Vanuatu 7’909 3.1 15.8 19.929 SaintLucia 18’921 10.6 56.0 19.0 119 Nigeria 5’154’598 3.1 16.0 19.330 Macao’China 60’149 10.6 73.7 14.4 120 Georgia 128’126 3.0 19.7 15.131 Belgium 1’139’462 10.6 91.3 11.6 121 Gambia 53’912 3.0 14.4 20.532 Austria 886’475 10.5 87.7 12.0 122 Gabon 44’935 2.9 13.6 21.133 SaudiArabia 2’988’281 10.4 59.0 17.7 123 Bhutan 21’253 2.8 13.7 20.734 Hungary 1’018’863 10.2 84.9 12.1 124 Philippines 2’699’063 2.8 14.1 19.835 Trinidad&Tobago 137’561 10.2 63.4 16.1 125 Ukraine 1’231’068 2.7 21.4 12.836 Grenada 10’702 10.2 48.4 21.0 126 Botswana 54’891 2.7 12.4 21.537 Brazil 20’081’178 10.1 60.2 16.8 127 Yemen 665’487 2.6 12.0 21.838 Germany 8’287’453 10.1 94.2 10.7 128 Samoa 4’583 2.5 12.6 19.739 Uruguay 340’181 10.0 65.4 15.3 129 Namibia 57’556 2.4 11.5 21.240 CostaRica 479’028 10.0 54.7 18.3 130 Swaziland 29’692 2.4 9.9 24.541 Slovenia 202’731 9.9 92.3 10.8 131 Armenia 75’543 2.4 14.4 16.942 TFYRMacedonia 205’166 9.9 67.5 14.7 132 Indonesia 5’841’176 2.4 13.7 17.543 CzechRepublic 1’044’895 9.9 82.1 12.1 133 Zambia 324’758 2.3 11.8 19.844 Peru 2’922’648 9.8 52.1 18.9 134 Nicaragua 123’340 2.1 9.8 21.245 Cyprus 110’504 9.8 62.7 15.6 135 Lesotho 43’477 2.0 8.5 23.146 Ireland 447’888 9.8 78.4 12.5 136 Libya 122’917 1.9 11.4 16.747 Japan 12’200’091 9.6 99.5 9.7 137 Ghana 468’171 1.8 9.3 19.748 Croatia 420’144 9.6 80.7 11.9 138 Uganda 644’338 1.8 9.0 20.149 Turkey 6’933’267 9.3 53.7 17.3 139 India 22’660’059 1.8 9.5 18.950 Bahamas 32’393 9.2 53.3 17.3 140 Kazakhstan 269’422 1.6 9.6 17.151 Portugal 980’279 9.2 86.7 10.6 141 Angola 317’113 1.6 7.9 20.052 Morocco 2’829’799 8.7 45.8 19.0 142 Cameroon 302’917 1.5 7.3 20.453 Argentina 3’555’551 8.6 52.5 16.5 143 SriLanka 301’853 1.4 9.5 15.054 Jamaica 238’553 8.6 46.7 18.5 144 Congo 55’530 1.3 6.8 19.255 Jordan 542’817 8.4 40.4 20.8 145 Togo 72’077 1.1 5.5 20.756 VietNam 7’527’242 8.4 43.6 19.2 146 Comoros 8’701 1.1 6.3 17.957 Montenegro 52’658 8.3 60.1 13.8 147 Guinea-Bissau 17’710 1.1 5.6 19.958 Serbia 819’138 8.3 62.8 13.2 148 Rwanda 118’691 1.1 5.4 19.659 Spain 3’887’992 8.3 84.6 9.8 149 Afghanistan 335’958 1.0 4.9 20.660 Colombia 3’904’502 8.2 45.6 18.0 150 SolomonIslands 5’549 1.0 5.0 19.561 Maldives 26’444 8.2 35.4 23.0 151 LaoP.D.R. 62’152 1.0 4.2 23.062 Kuwait 234’242 8.1 55.8 14.5 152 Côted'Ivoire 195’380 0.9 4.7 20.463 Venezuela 2’366’932 7.9 43.5 18.2 153 Bangladesh 1’423’409 0.9 4.7 20.164 Panama 285’298 7.9 46.0 17.1 154 Benin 84’682 0.9 4.6 19.765 UnitedArabEmirates 635’781 7.8 56.6 13.8 155 Djibouti 8’169 0.9 4.2 21.266 Mexico 9’086’114 7.8 43.3 18.1 156 PapuaNewGuinea 62’852 0.9 4.6 19.367 Bulgaria 560’896 7.6 68.3 11.1 157 Turkmenistan 39’693 0.8 3.7 21.068 Greece 861’104 7.5 74.6 10.1 158 Nepal 238’079 0.8 3.7 20.969 Moldova 263’203 7.5 45.6 16.4 159 EquatorialGuinea 5’653 0.8 3.9 19.470 Romania 1’584’515 7.4 60.1 12.3 160 Mauritania 26’877 0.7 3.7 19.871 BosniaandHerzegovina 270’180 7.2 55.7 13.0 161 Somalia 56’955 0.6 3.1 18.772 DominicanRep. 733’019 7.2 38.8 18.5 162 Malawi 85’334 0.5 2.6 20.473 Lebanon 306’940 7.2 40.1 17.8 163 Mozambique 122’269 0.5 2.5 19.874 Micronesia 8’013 7.1 32.2 22.2 164 Iraq 166’937 0.5 2.5 19.675 Mauritius 92’113 7.0 42.3 16.6 165 Chad 55’872 0.5 2.4 19.876 S.Tomé&Principe 11’849 6.9 32.8 21.0 166 Mali 73’385 0.4 2.3 19.677 St.VincentandtheG. 7’335 6.7 36.5 18.4 167 Guinea 46’734 0.4 2.2 19.878 Italy 4’065’346 6.7 67.8 9.8 168 Burundi 38’081 0.4 2.0 21.979 Egypt 5’532’746 6.6 34.9 18.9 169 BurkinaFaso 74’860 0.4 2.1 20.080 Kyrgyzstan 357’450 6.6 30.5 21.5 170 Madagascar 83’190 0.4 1.9 20.281 Tunisia 700’044 6.5 36.7 17.8 171 Cambodia 50’145 0.3 1.6 21.882 Bahrain 87’967 6.5 50.8 12.7 172 Liberia 12’759 0.3 1.6 19.283 Guyana 48’049 6.3 32.4 19.6 173 Ethiopia 229’727 0.3 1.2 21.684 RussianFederation 8’974’678 6.3 49.6 12.7 174 CentralAfricanRep. 11’713 0.3 1.2 20.685 Thailand 4’387’062 6.3 42.3 14.8 175 Eritrea 14’180 0.3 1.3 19.586 Albania 198’333 6.1 34.1 18.0 176 Congo(Dem.Rep.) 175’259 0.3 1.2 20.487 Zimbabwe 796’166 6.1 25.1 24.4 177 Niger 40’436 0.2 1.3 18.588 Azerbaijan 551’410 5.9 30.9 19.0 178 SierraLeone 11’034 0.2 0.9 19.589 China 75’210’372 5.6 34.7 16.0 179 Myanmar 76’302 0.2 0.9 18.290 Belarus 527’032 5.5 41.8 13.2 180 Timor-Leste 1’495 0.1 0.6 21.2
Note: DN:Digitalnatives.*Referstopopulationaged15to24.**Shareofyouthpopulation(15-24)amongthetotalpopulation.Source: ITU.
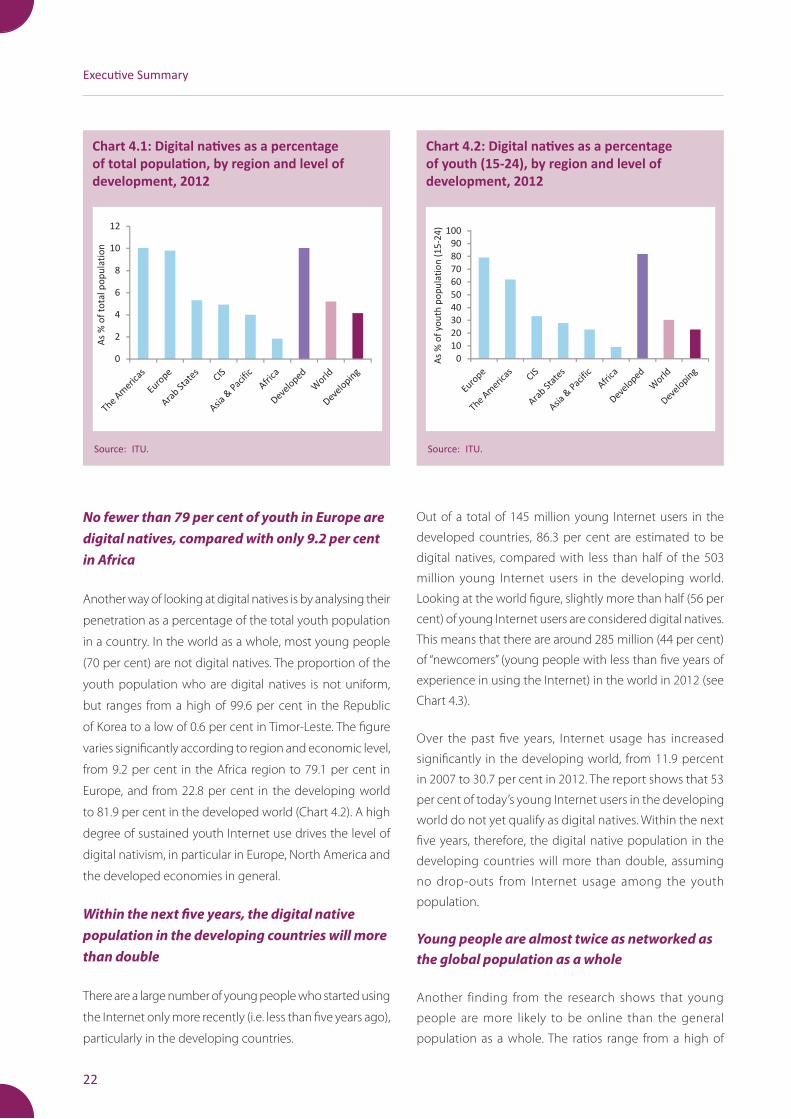
22
Executive Summary
Source: ITU.
Chart 4.1: Digital natives as a percentage of total population, by region and level of development, 2012
No fewer than 79 per cent of youth in Europe are digital natives, compared with only 9.2 per cent in Africa
Another way of looking at digital natives is by analysing their
penetration as a percentage of the total youth population
in a country. In the world as a whole, most young people
(70 per cent) are not digital natives. The proportion of the
youth population who are digital natives is not uniform,
but ranges from a high of 99.6 per cent in the Republic
of Korea to a low of 0.6 per cent in Timor-Leste. The figure
varies significantly according to region and economic level,
from 9.2 per cent in the Africa region to 79.1 per cent in
Europe, and from 22.8 per cent in the developing world
to 81.9 per cent in the developed world (Chart 4.2). A high
degree of sustained youth Internet use drives the level of
digital nativism, in particular in Europe, North America and
the developed economies in general.
Within the next five years, the digital native population in the developing countries will more than double
There are a large number of young people who started using
the Internet only more recently (i.e. less than five years ago),
particularly in the developing countries.
Source: ITU.
Chart 4.2: Digital natives as a percentage of youth (15-24), by region and level of development, 2012
Out of a total of 145 million young Internet users in the
developed countries, 86.3 per cent are estimated to be
digital natives, compared with less than half of the 503
million young Internet users in the developing world.
Looking at the world figure, slightly more than half (56 per
cent) of young Internet users are considered digital natives.
This means that there are around 285 million (44 per cent)
of “newcomers” (young people with less than five years of
experience in using the Internet) in the world in 2012 (see
Chart 4.3).
Over the past five years, Internet usage has increased
significantly in the developing world, from 11.9 percent
in 2007 to 30.7 per cent in 2012. The report shows that 53
per cent of today’s young Internet users in the developing
world do not yet qualify as digital natives. Within the next
five years, therefore, the digital native population in the
developing countries will more than double, assuming
no drop-outs from Internet usage among the youth
population.
Young people are almost twice as networked as the global population as a whole
Another finding from the research shows that young
people are more likely to be online than the general
population as a whole. The ratios range from a high of
0
10
20
30
40
50
60
70
80
90
100
As
% o
f yo
uth
po
pu
lati
on
(1
5-2
4)
0
2
4
6
8
10
12
As
% o
f to
tal
po
pu
lati
on
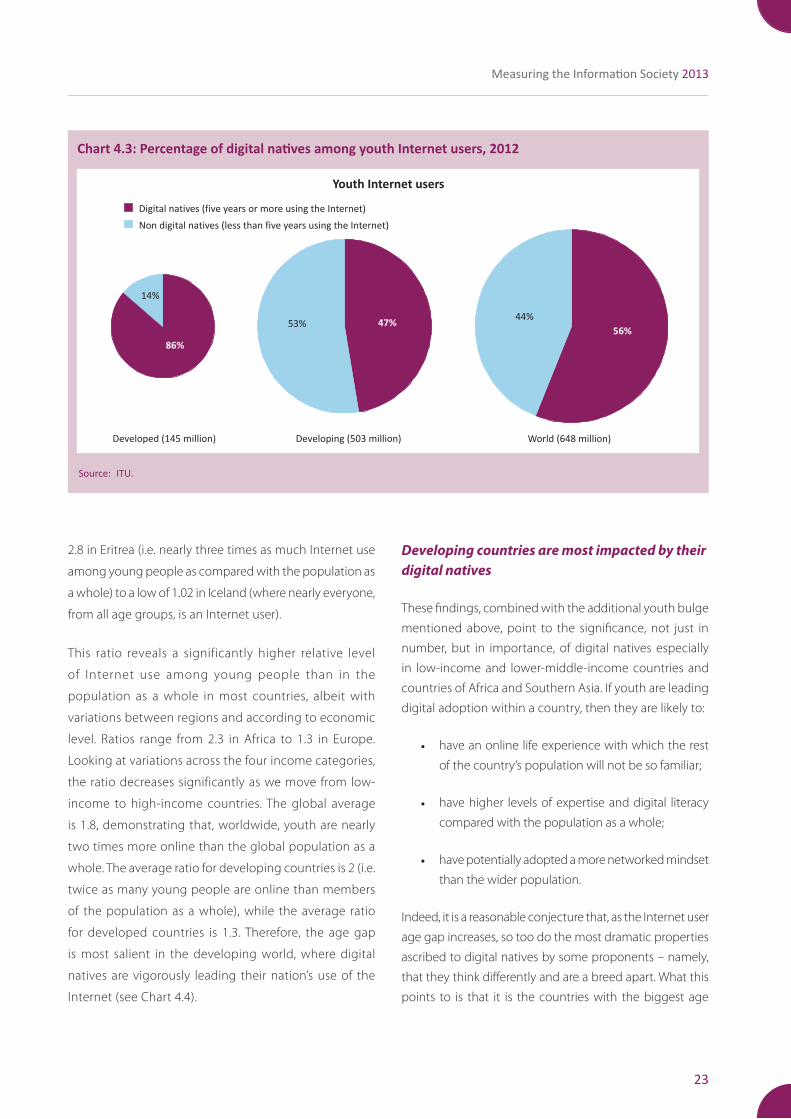
23
Measuring the Information Society 2013
Developing countries are most impacted by their digital natives
These findings, combined with the additional youth bulge
mentioned above, point to the significance, not just in
number, but in importance, of digital natives especially
in low-income and lower-middle-income countries and
countries of Africa and Southern Asia. If youth are leading
digital adoption within a country, then they are likely to:
• have an online life experience with which the rest
of the country’s population will not be so familiar;
• have higher levels of expertise and digital literacy
compared with the population as a whole;
• have potentially adopted a more networked mindset
than the wider population.
Indeed, it is a reasonable conjecture that, as the Internet user
age gap increases, so too do the most dramatic properties
ascribed to digital natives by some proponents – namely,
that they think differently and are a breed apart. What this
points to is that it is the countries with the biggest age
Chart 4.3: Percentage of digital natives among youth Internet users, 2012
Source:ITU.
86%
14%
Youth Internet users
Digital natives (five years or more using the Internet)
Non digital natives (less than five years using the Internet)
Developed (145 million)
47%53%
Developing (503 million)
56%
44%
World (648 million)
2.8 in Eritrea (i.e. nearly three times as much Internet use
among young people as compared with the population as
a whole) to a low of 1.02 in Iceland (where nearly everyone,
from all age groups, is an Internet user).
This ratio reveals a significantly higher relative level
of Internet use among young people than in the
population as a whole in most countries, albeit with
variations between regions and according to economic
level. Ratios range from 2.3 in Africa to 1.3 in Europe.
Looking at variations across the four income categories,
the ratio decreases significantly as we move from low-
income to high-income countries. The global average
is 1.8, demonstrating that, worldwide, youth are nearly
two times more online than the global population as a
whole. The average ratio for developing countries is 2 (i.e.
twice as many young people are online than members
of the population as a whole), while the average ratio
for developed countries is 1.3. Therefore, the age gap
is most salient in the developing world, where digital
natives are vigorously leading their nation’s use of the
Internet (see Chart 4.4).
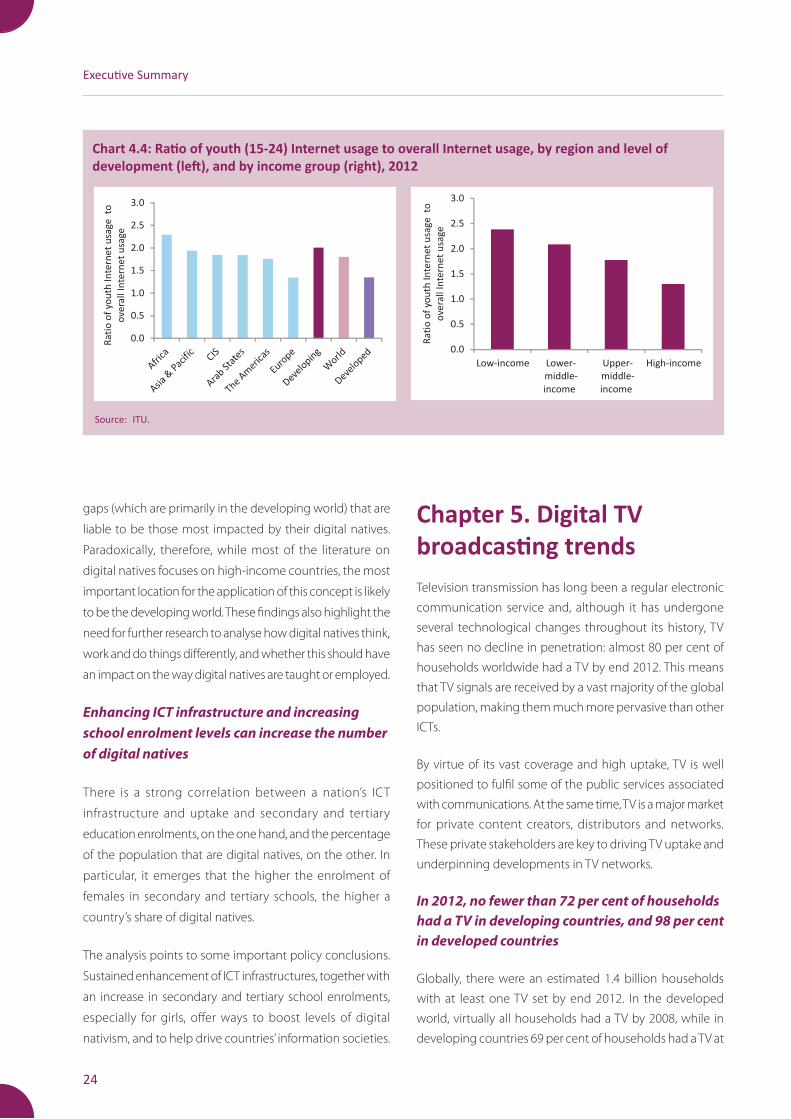
24
Executive Summary
Chart 4.4: Ratio of youth (15-24) Internet usage to overall Internet usage, by region and level of development (left), and by income group (right), 2012
Source: ITU.
0.0
0.5
1.0
1.5
2.0
2.5
3.0
Ra
tio
of
you
th I
nte
rne
t u
sag
e to
ove
rall
In
tern
et
usa
ge
0.0
0.5
1.0
1.5
2.0
2.5
3.0
Low-income Lower-
middle-
income
Upper-
middle-
income
High-income
Ra
tio
of
you
th I
nte
rne
t u
sag
e to
ove
rall
In
tern
et
usa
ge
gaps (which are primarily in the developing world) that are
liable to be those most impacted by their digital natives.
Paradoxically, therefore, while most of the literature on
digital natives focuses on high-income countries, the most
important location for the application of this concept is likely
to be the developing world. These findings also highlight the
need for further research to analyse how digital natives think,
work and do things differently, and whether this should have
an impact on the way digital natives are taught or employed.
Enhancing ICT infrastructure and increasing school enrolment levels can increase the number of digital natives
There is a strong correlation between a nation’s ICT
infrastructure and uptake and secondary and tertiary
education enrolments, on the one hand, and the percentage
of the population that are digital natives, on the other. In
particular, it emerges that the higher the enrolment of
females in secondary and tertiary schools, the higher a
country’s share of digital natives.
The analysis points to some important policy conclusions.
Sustained enhancement of ICT infrastructures, together with
an increase in secondary and tertiary school enrolments,
especially for girls, offer ways to boost levels of digital
nativism, and to help drive countries’ information societies.
Chapter 5. Digital TV broadcasting trendsTelevision transmission has long been a regular electronic
communication service and, although it has undergone
several technological changes throughout its history, TV
has seen no decline in penetration: almost 80 per cent of
households worldwide had a TV by end 2012. This means
that TV signals are received by a vast majority of the global
population, making them much more pervasive than other
ICTs.
By virtue of its vast coverage and high uptake, TV is well
positioned to fulfil some of the public services associated
with communications. At the same time, TV is a major market
for private content creators, distributors and networks.
These private stakeholders are key to driving TV uptake and
underpinning developments in TV networks.
In 2012, no fewer than 72 per cent of households had a TV in developing countries, and 98 per cent in developed countries
Globally, there were an estimated 1.4 billion households
with at least one TV set by end 2012. In the developed
world, virtually all households had a TV by 2008, while in
developing countries 69 per cent of households had a TV at
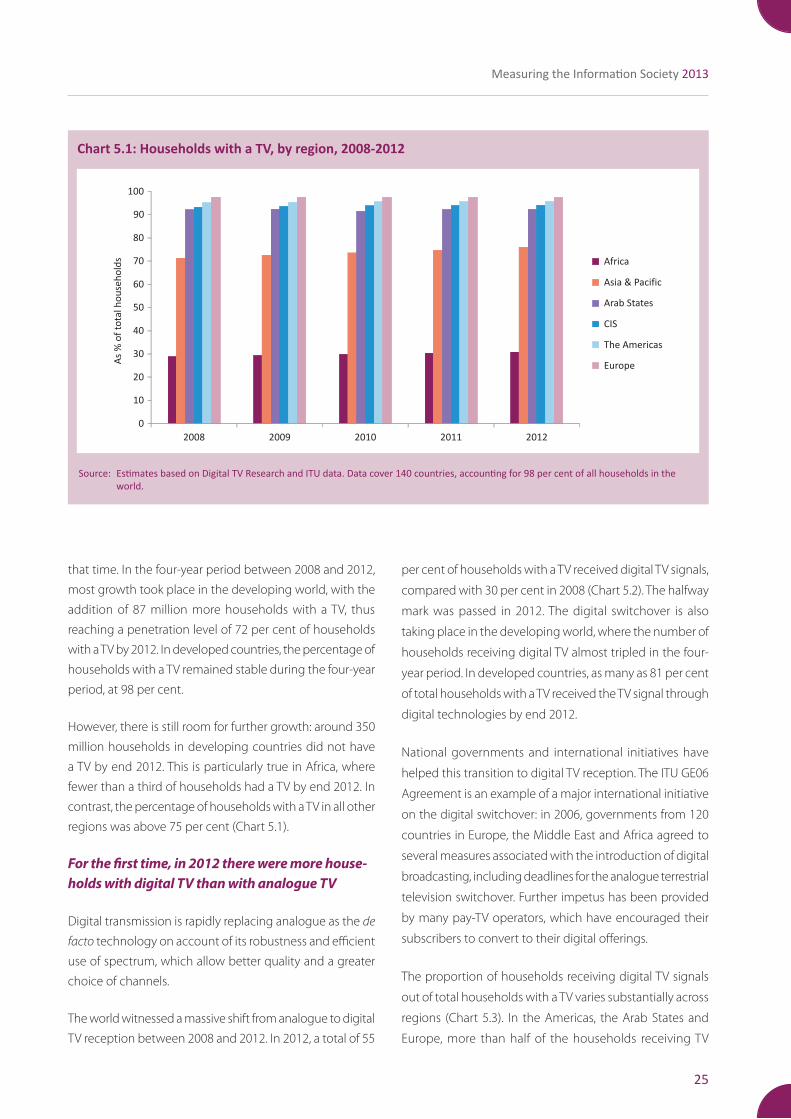
25
Measuring the Information Society 2013
that time. In the four-year period between 2008 and 2012,
most growth took place in the developing world, with the
addition of 87 million more households with a TV, thus
reaching a penetration level of 72 per cent of households
with a TV by 2012. In developed countries, the percentage of
households with a TV remained stable during the four-year
period, at 98 per cent.
However, there is still room for further growth: around 350
million households in developing countries did not have
a TV by end 2012. This is particularly true in Africa, where
fewer than a third of households had a TV by end 2012. In
contrast, the percentage of households with a TV in all other
regions was above 75 per cent (Chart 5.1).
For the first time, in 2012 there were more house-holds with digital TV than with analogue TV
Digital transmission is rapidly replacing analogue as the de
facto technology on account of its robustness and efficient
use of spectrum, which allow better quality and a greater
choice of channels.
The world witnessed a massive shift from analogue to digital
TV reception between 2008 and 2012. In 2012, a total of 55
Chart 5.1: Households with a TV, by region, 2008-2012
Source:EstimatesbasedonDigitalTVResearchandITUdata.Datacover140countries,accountingfor98percentofallhouseholdsintheworld.
0
10
20
30
40
50
60
70
80
90
100
2008 2009 2010 2011 2012
Africa
Asia & Pacific
Arab States
CIS
The Americas
EuropeAs
% o
f to
tal
ho
use
ho
lds
per cent of households with a TV received digital TV signals,
compared with 30 per cent in 2008 (Chart 5.2). The halfway
mark was passed in 2012. The digital switchover is also
taking place in the developing world, where the number of
households receiving digital TV almost tripled in the four-
year period. In developed countries, as many as 81 per cent
of total households with a TV received the TV signal through
digital technologies by end 2012.
National governments and international initiatives have
helped this transition to digital TV reception. The ITU GE06
Agreement is an example of a major international initiative
on the digital switchover: in 2006, governments from 120
countries in Europe, the Middle East and Africa agreed to
several measures associated with the introduction of digital
broadcasting, including deadlines for the analogue terrestrial
television switchover. Further impetus has been provided
by many pay-TV operators, which have encouraged their
subscribers to convert to their digital offerings.
The proportion of households receiving digital TV signals
out of total households with a TV varies substantially across
regions (Chart 5.3). In the Americas, the Arab States and
Europe, more than half of the households receiving TV
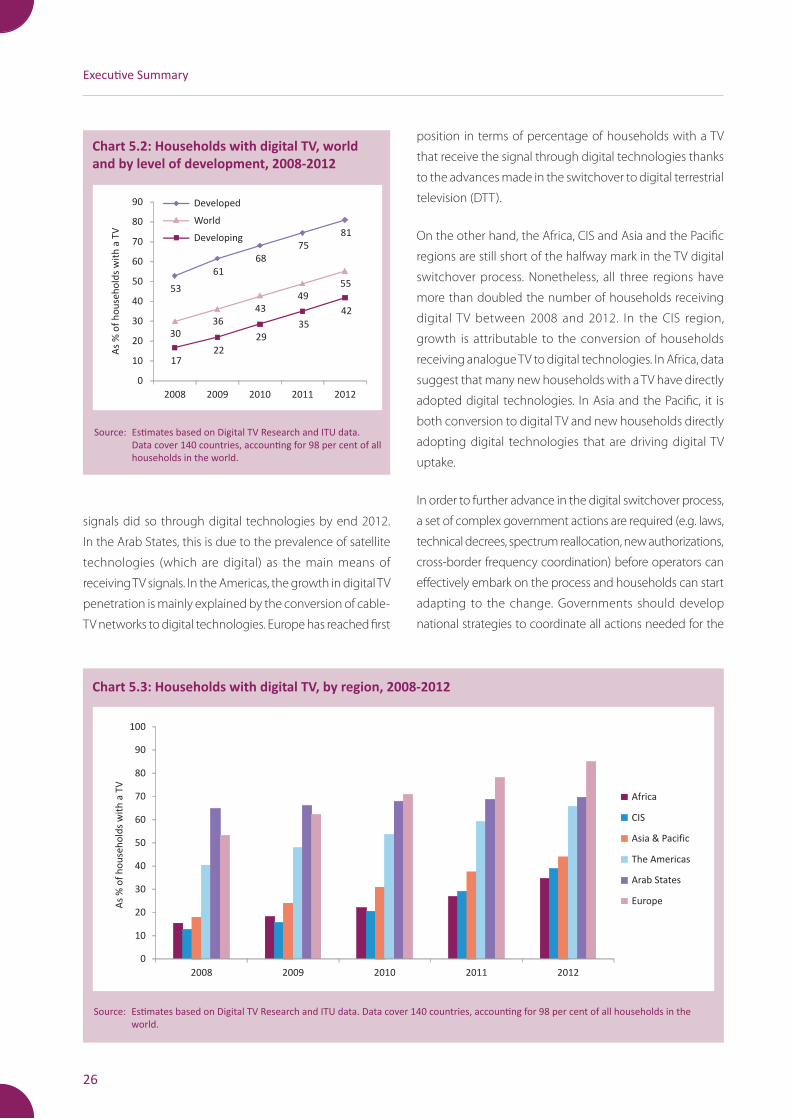
26
Executive Summary
Source:EstimatesbasedonDigitalTVResearchandITUdata.Datacover140countries,accountingfor98percentofallhouseholdsintheworld.
Chart 5.2: Households with digital TV, world and by level of development, 2008-2012
53
61
68
75
81
30
36
43
49
55
1722
29
35
42
0
10
20
30
40
50
60
70
80
90
2008 2009 2010 2011 2012
Developed
World
Developing
As
% o
f h
ou
seh
old
s w
ith
a T
V
signals did so through digital technologies by end 2012.
In the Arab States, this is due to the prevalence of satellite
technologies (which are digital) as the main means of
receiving TV signals. In the Americas, the growth in digital TV
penetration is mainly explained by the conversion of cable-
TV networks to digital technologies. Europe has reached first
position in terms of percentage of households with a TV
that receive the signal through digital technologies thanks
to the advances made in the switchover to digital terrestrial
television (DTT).
On the other hand, the Africa, CIS and Asia and the Pacific
regions are still short of the halfway mark in the TV digital
switchover process. Nonetheless, all three regions have
more than doubled the number of households receiving
digital TV between 2008 and 2012. In the CIS region,
growth is attributable to the conversion of households
receiving analogue TV to digital technologies. In Africa, data
suggest that many new households with a TV have directly
adopted digital technologies. In Asia and the Pacific, it is
both conversion to digital TV and new households directly
adopting digital technologies that are driving digital TV
uptake.
In order to further advance in the digital switchover process,
a set of complex government actions are required (e.g. laws,
technical decrees, spectrum reallocation, new authorizations,
cross-border frequency coordination) before operators can
effectively embark on the process and households can start
adapting to the change. Governments should develop
national strategies to coordinate all actions needed for the
Chart 5.3: Households with digital TV, by region, 2008-2012
Source:EstimatesbasedonDigitalTVResearchandITUdata.Datacover140countries,accountingfor98percentofallhouseholdsintheworld.
0
10
20
30
40
50
60
70
80
90
100
2008 2009 2010 2011 2012
Africa
CIS
Asia & Pacific
The Americas
Arab States
EuropeAs
% o
f h
ou
seh
old
s w
ith
a T
V
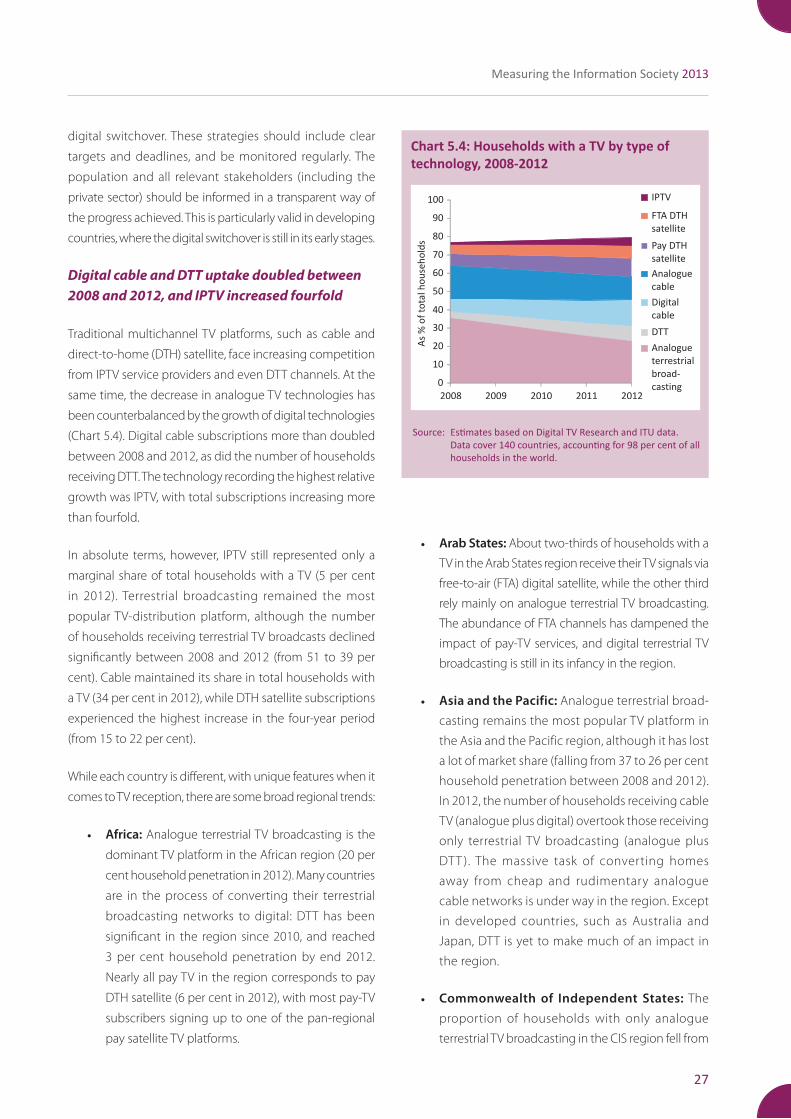
27
Measuring the Information Society 2013
• Arab States: About two-thirds of households with a
TV in the Arab States region receive their TV signals via
free-to-air (FTA) digital satellite, while the other third
rely mainly on analogue terrestrial TV broadcasting.
The abundance of FTA channels has dampened the
impact of pay-TV services, and digital terrestrial TV
broadcasting is still in its infancy in the region.
• Asia and the Pacific: Analogue terrestrial broad-
casting remains the most popular TV platform in
the Asia and the Pacific region, although it has lost
a lot of market share (falling from 37 to 26 per cent
household penetration between 2008 and 2012).
In 2012, the number of households receiving cable
TV (analogue plus digital) overtook those receiving
only terrestrial TV broadcasting (analogue plus
DTT ). The massive task of converting homes
away from cheap and rudimentary analogue
cable networks is under way in the region. Except
in developed countries, such as Australia and
Japan, DTT is yet to make much of an impact in
the region.
• Commonwealth of Independent States: The
proportion of households with only analogue
terrestrial TV broadcasting in the CIS region fell from
digital switchover. These strategies should include clear
targets and deadlines, and be monitored regularly. The
population and all relevant stakeholders (including the
private sector) should be informed in a transparent way of
the progress achieved. This is particularly valid in developing
countries, where the digital switchover is still in its early stages.
Digital cable and DTT uptake doubled between 2008 and 2012, and IPTV increased fourfold
Traditional multichannel TV platforms, such as cable and
direct-to-home (DTH) satellite, face increasing competition
from IPTV service providers and even DTT channels. At the
same time, the decrease in analogue TV technologies has
been counterbalanced by the growth of digital technologies
(Chart 5.4). Digital cable subscriptions more than doubled
between 2008 and 2012, as did the number of households
receiving DTT. The technology recording the highest relative
growth was IPTV, with total subscriptions increasing more
than fourfold.
In absolute terms, however, IPTV still represented only a
marginal share of total households with a TV (5 per cent
in 2012). Terrestrial broadcasting remained the most
popular TV-distribution platform, although the number
of households receiving terrestrial TV broadcasts declined
significantly between 2008 and 2012 (from 51 to 39 per
cent). Cable maintained its share in total households with
a TV (34 per cent in 2012), while DTH satellite subscriptions
experienced the highest increase in the four-year period
(from 15 to 22 per cent).
While each country is different, with unique features when it
comes to TV reception, there are some broad regional trends:
• Africa: Analogue terrestrial TV broadcasting is the
dominant TV platform in the African region (20 per
cent household penetration in 2012). Many countries
are in the process of converting their terrestrial
broadcasting networks to digital: DTT has been
significant in the region since 2010, and reached
3 per cent household penetration by end 2012.
Nearly all pay TV in the region corresponds to pay
DTH satellite (6 per cent in 2012), with most pay-TV
subscribers signing up to one of the pan-regional
pay satellite TV platforms.
Source:EstimatesbasedonDigitalTVResearchandITUdata.Datacover140countries,accountingfor98percentofallhouseholdsintheworld.
Chart 5.4: Households with a TV by type of technology, 2008-2012
0
10
20
30
40
50
60
70
80
90
100
2008 2009 2010 2011 2012
IPTV
FTA DTH
satellite
Pay DTH
satellite
Analogue
cable
Digital
cable
DTT
Analogue
terrestrial
broad-
casting
As
% o
f to
tal
ho
use
ho
lds
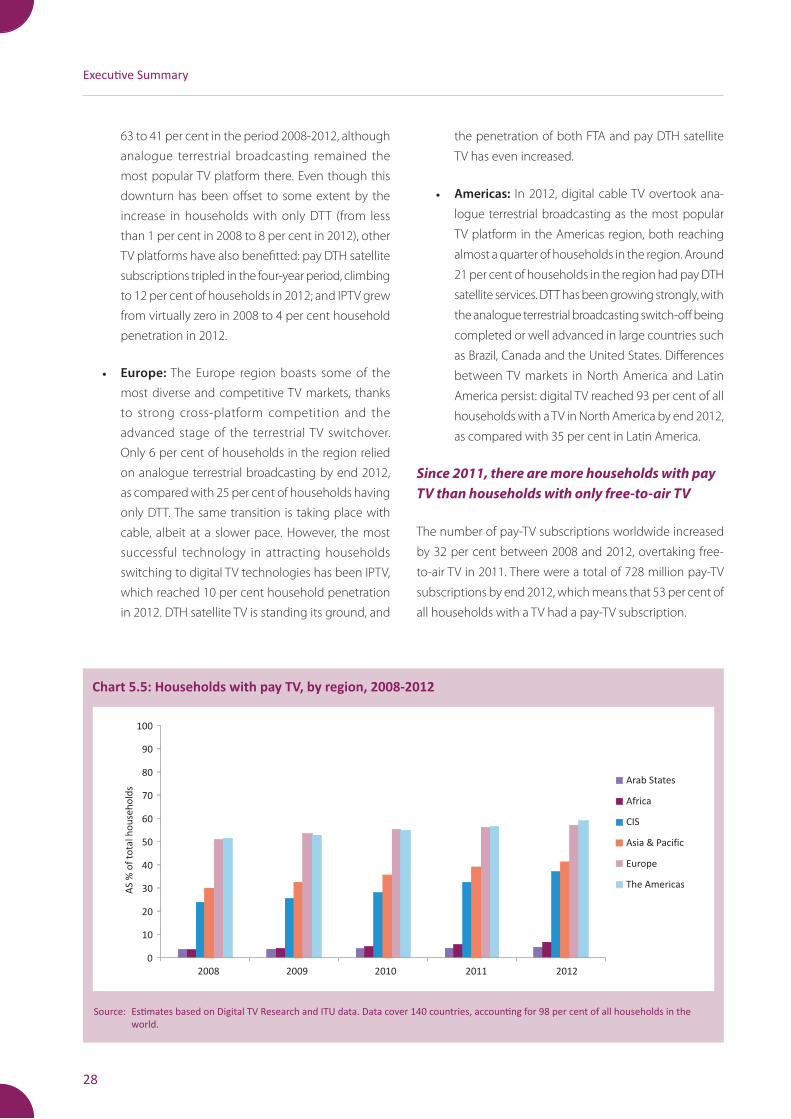
28
Executive Summary
63 to 41 per cent in the period 2008-2012, although
analogue terrestrial broadcasting remained the
most popular TV platform there. Even though this
downturn has been offset to some extent by the
increase in households with only DTT (from less
than 1 per cent in 2008 to 8 per cent in 2012), other
TV platforms have also benefitted: pay DTH satellite
subscriptions tripled in the four-year period, climbing
to 12 per cent of households in 2012; and IPTV grew
from virtually zero in 2008 to 4 per cent household
penetration in 2012.
• Europe: The Europe region boasts some of the
most diverse and competitive TV markets, thanks
to strong cross-platform competition and the
advanced stage of the terrestrial TV switchover.
Only 6 per cent of households in the region relied
on analogue terrestrial broadcasting by end 2012,
as compared with 25 per cent of households having
only DTT. The same transition is taking place with
cable, albeit at a slower pace. However, the most
successful technology in attracting households
switching to digital TV technologies has been IPTV,
which reached 10 per cent household penetration
in 2012. DTH satellite TV is standing its ground, and
the penetration of both FTA and pay DTH satellite
TV has even increased.
• Americas: In 2012, digital cable TV overtook ana-
logue terrestrial broadcasting as the most popular
TV platform in the Americas region, both reaching
almost a quarter of households in the region. Around
21 per cent of households in the region had pay DTH
satellite services. DTT has been growing strongly, with
the analogue terrestrial broadcasting switch-off being
completed or well advanced in large countries such
as Brazil, Canada and the United States. Differences
between TV markets in North America and Latin
America persist: digital TV reached 93 per cent of all
households with a TV in North America by end 2012,
as compared with 35 per cent in Latin America.
Since 2011, there are more households with pay TV than households with only free-to-air TV
The number of pay-TV subscriptions worldwide increased
by 32 per cent between 2008 and 2012, overtaking free-
to-air TV in 2011. There were a total of 728 million pay-TV
subscriptions by end 2012, which means that 53 per cent of
all households with a TV had a pay-TV subscription.
Chart 5.5: Households with pay TV, by region, 2008-2012
Source:EstimatesbasedonDigitalTVResearchandITUdata.Datacover140countries,accountingfor98percentofallhouseholdsintheworld.
0
10
20
30
40
50
60
70
80
90
100
2008 2009 2010 2011 2012
Arab States
Africa
CIS
Asia & Pacific
Europe
The Americas
AS
% o
f to
tal
ho
use
ho
lds
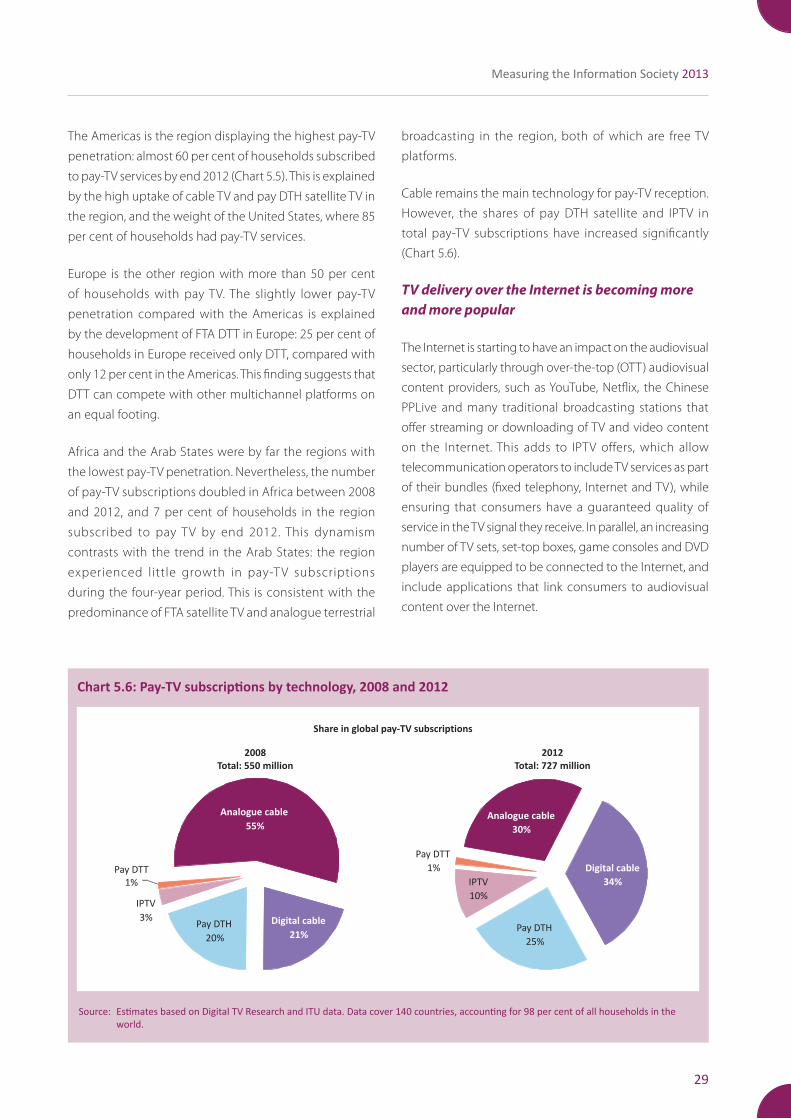
29
Measuring the Information Society 2013
Chart 5.6: Pay-TV subscriptions by technology, 2008 and 2012
Source:EstimatesbasedonDigitalTVResearchandITUdata.Datacover140countries,accountingfor98percentofallhouseholdsintheworld.
Share in global pay-TV subscriptions
2008
Total: 550 million
Analogue cable
55%
Digital cable
21%Pay DTH
20%
IPTV
3%
Pay DTT
1%
2012
Total: 727 million
Analogue cable
30%
Digital cable
34%
Pay DTH
25%
IPTV
10%
Pay DTT
1%
The Americas is the region displaying the highest pay-TV
penetration: almost 60 per cent of households subscribed
to pay-TV services by end 2012 (Chart 5.5). This is explained
by the high uptake of cable TV and pay DTH satellite TV in
the region, and the weight of the United States, where 85
per cent of households had pay-TV services.
Europe is the other region with more than 50 per cent
of households with pay TV. The slightly lower pay-TV
penetration compared with the Americas is explained
by the development of FTA DTT in Europe: 25 per cent of
households in Europe received only DTT, compared with
only 12 per cent in the Americas. This finding suggests that
DTT can compete with other multichannel platforms on
an equal footing.
Africa and the Arab States were by far the regions with
the lowest pay-TV penetration. Nevertheless, the number
of pay-TV subscriptions doubled in Africa between 2008
and 2012, and 7 per cent of households in the region
subscribed to pay TV by end 2012. This dynamism
contrasts with the trend in the Arab States: the region
experienced little growth in pay-T V subscriptions
during the four-year period. This is consistent with the
predominance of FTA satellite TV and analogue terrestrial
broadcasting in the region, both of which are free TV
platforms.
Cable remains the main technology for pay-TV reception.
However, the shares of pay DTH satellite and IPTV in
total pay-TV subscriptions have increased significantly
(Chart 5.6).
TV delivery over the Internet is becoming more and more popular
The Internet is starting to have an impact on the audiovisual
sector, particularly through over-the-top (OTT) audiovisual
content providers, such as YouTube, Netflix, the Chinese
PPLive and many traditional broadcasting stations that
offer streaming or downloading of TV and video content
on the Internet. This adds to IPTV offers, which allow
telecommunication operators to include TV services as part
of their bundles (fixed telephony, Internet and TV), while
ensuring that consumers have a guaranteed quality of
service in the TV signal they receive. In parallel, an increasing
number of TV sets, set-top boxes, game consoles and DVD
players are equipped to be connected to the Internet, and
include applications that link consumers to audiovisual
content over the Internet.
30
Executive Summary
Endnotes
1 In 2011, the Broadband Commission endorsed four targets to be achieved by 2015: (1) making broadband policy universal, (2) making broadband affordable, (3) connecting homes to broadband and (4) getting people online. See http://www.broadbandcommission.org.
2 ITU World Telecommunication Regulatory Database.
3 The regions in this publication refer to the ITU/BDT regions, see http://www.itu.int/ITU-D/ict/definitions/regions/index.html.
Streaming OTT TV and video requires extensive broadband
capacity: unlike IPTV, OTT TV and video is delivered on top
of the Internet, and thus the quality of service depends
on the capacity of each end-to-end connection. With
the exponential increase in Internet data traffic, driven by
Internet video and TV, operators and regulators will need
to face up to the challenge of catering for the increasing
number of users and devices.

The full version of the report, as well as the executive summary in all six official languages
of the ITU, are available at:
http://www.itu.int/go/mis2013