Embed Size (px)
Citation preview

"PASSIVE"ITS PROBE
Travel Time Data Collection Handbook 5-1
5 ITS PROBE VEHICLE TECHNIQUES
The probe vehicle techniques discussed in this section are unique in that they are typically intelligenttransportation system (ITS) applications designed primarily for collecting data in real-time. Theirprimary application is for a specific purpose other than travel time data collection, such as real-timetraffic operations monitoring, incident detection, and route guidance applications. However, thesesystems can be used for the collection of travel time data. Since these probe vehicles are used fortravel time data collection but are already in the traffic stream for a different purpose, they aresometimes referred to as “passive” probe vehicles. In contrast, the test vehicle techniques discussedin Chapter 3 are sometimes referred to as “active” test vehicles. Coordination is often necessarybetween the agency responsible for the system operation and the agency that would like to utilize thesystem for travel time data collection. This distinction removes these probe vehicle techniques fromother techniques, such as tje test vehicle or license plate matching techniques.
This chapter presents guidelines for designing and maintaining ITS probe vehicle data collectionsystems to cost-effectively collect quality data that may be developed from existing ITS applications.
5.0.1 General Advantages and Disadvantages
ITS probe vehicle systems for travel time data collection have the following advantages:
C Low cost per unit of data - Once the necessary infrastructure and equipment are inplace, data may be collected easily and at low cost. There is no need to routinely setup and disassemble equipment.
C Continuous data collection - Travel time data may be collected 24 hours per daywith ITS probe vehicle systems. If the infrastructure is permanently installed, dataare collected as long as probe vehicles continue to travel through the system. Notethat the hours of data collection may depend upon transit schedules for some probevehicle systems.
CC Automated data collection - Data can be collected electronically. Probe vehiclesystems are electronic, and data are automatically transmitted from the probe vehicleto the ITS control facility.
CC Data are in electronic format - Once the data have been collected, they are alreadyin an electronic format. This assists in the processing of raw travel time data into auseful format for analysis.
C No disruption of traffic - Since data are collected from probes within the trafficstream, the traffic is not influenced by the experimenter. Probe vehicles are often
CHAPTER 5 - ITS PROBE VEHICLE TECHNIQUES
5-2 Travel Time Data Collection Handbook
driven by persons not directly involved with the data collection effort, thus data arenot biased towards test vehicle driving styles.
ITS probe vehicle systems for travel time data collection have the following disadvantages:
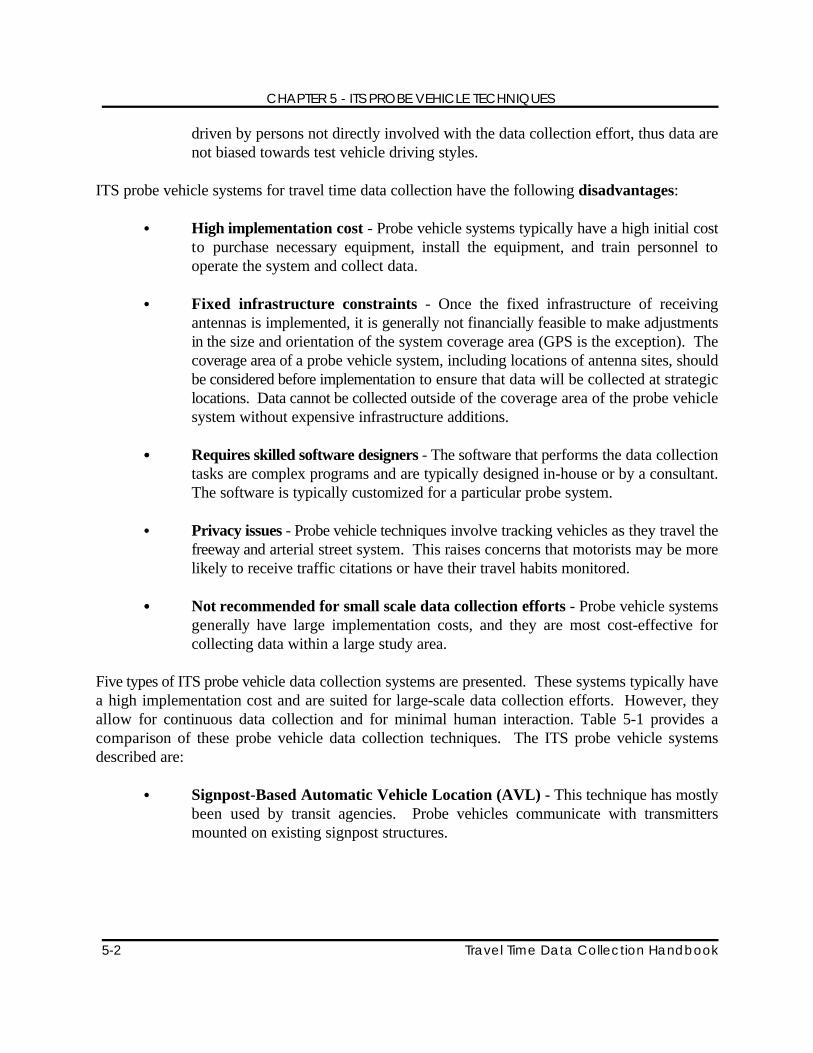
C High implementation cost - Probe vehicle systems typically have a high initial costto purchase necessary equipment, install the equipment, and train personnel tooperate the system and collect data.
C Fixed infrastructure constraints - Once the fixed infrastructure of receivingantennas is implemented, it is generally not financially feasible to make adjustmentsin the size and orientation of the system coverage area (GPS is the exception). Thecoverage area of a probe vehicle system, including locations of antenna sites, shouldbe considered before implementation to ensure that data will be collected at strategiclocations. Data cannot be collected outside of the coverage area of the probe vehiclesystem without expensive infrastructure additions.
CC Requires skilled software designers - The software that performs the data collectiontasks are complex programs and are typically designed in-house or by a consultant.The software is typically customized for a particular probe system.
C Privacy issues - Probe vehicle techniques involve tracking vehicles as they travel thefreeway and arterial street system. This raises concerns that motorists may be morelikely to receive traffic citations or have their travel habits monitored.
CC Not recommended for small scale data collection efforts - Probe vehicle systemsgenerally have large implementation costs, and they are most cost-effective forcollecting data within a large study area.
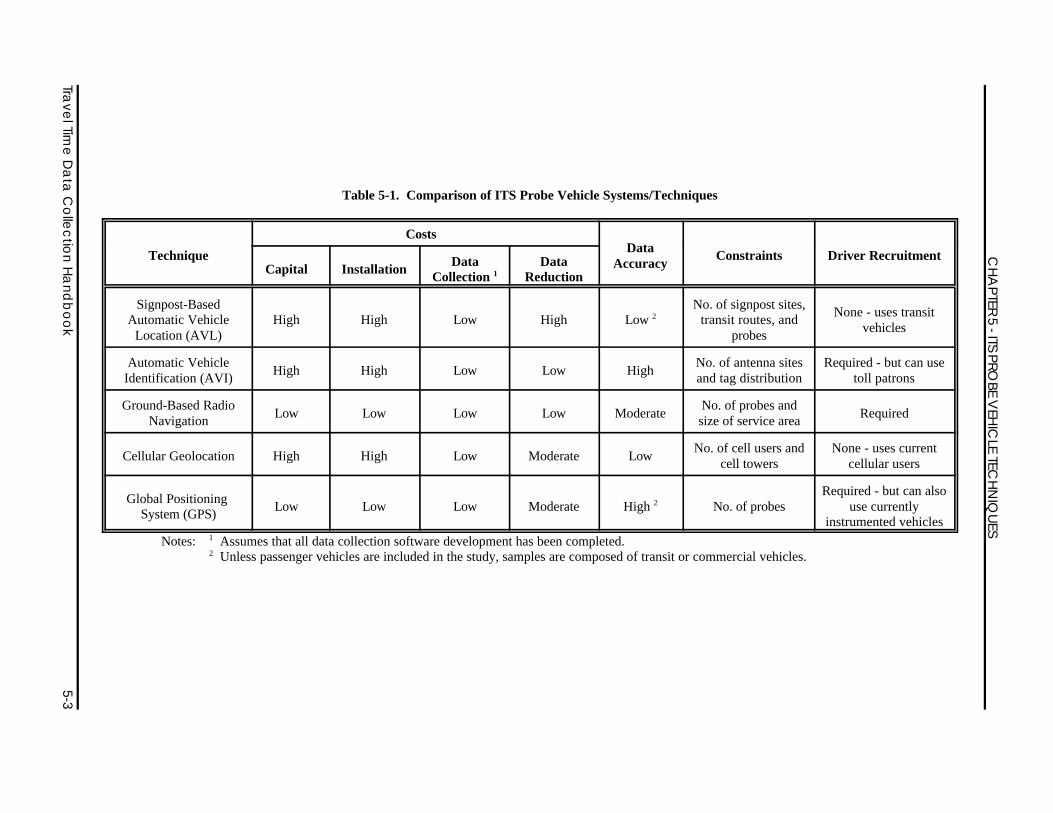
Five types of ITS probe vehicle data collection systems are presented. These systems typically havea high implementation cost and are suited for large-scale data collection efforts. However, theyallow for continuous data collection and for minimal human interaction. Table 5-1 provides acomparison of these probe vehicle data collection techniques. The ITS probe vehicle systemsdescribed are:
C Signpost-Based Automatic Vehicle Location (AVL) - This technique has mostlybeen used by transit agencies. Probe vehicles communicate with transmittersmounted on existing signpost structures.
Trave
l Time
Da
ta C
olle
ctio
n H
an
db
oo
k5-3
CH
APTER
5 - ITS
PROBE
VEH
ICLE
TECH
NIQ
UES
Table 5-1. Comparison of ITS Probe Vehicle Systems/Techniques
Technique Constraints Driver Recruitment
CostsData
AccuracyCapital InstallationData Data
Collection Reduction1
Signpost-Based No. of signpost sites,Automatic Vehicle High High Low High Low transit routes, and
Location (AVL) probes
2 None - uses transitvehicles
Automatic Vehicle No. of antenna sites Required - but can useIdentification (AVI) and tag distribution toll patrons
High High Low Low High
Ground-Based Radio No. of probes andNavigation size of service area
Low Low Low Low Moderate Required
Cellular Geolocation High High Low Moderate LowNo. of cell users and None - uses current
cell towers cellular users
Global Positioning System (GPS)
Low Low Low Moderate High No. of probes use currently2Required - but can also
instrumented vehicles
Notes: Assumes that all data collection software development has been completed.1
Unless passenger vehicles are included in the study, samples are composed of transit or commercial vehicles.2
CHAPTER 5 - ITS PROBE VEHICLE TECHNIQUES
5-4 Travel Time Data Collection Handbook
C Automatic Vehicle Identification (AVI) - Probe vehicles are equipped withelectronic tags. These tags communicate with roadside transceivers to identifyunique vehicles and collect travel times between transceivers.
C Ground-Based Radio Navigation - Often used for transit or commercial fleetmanagement, this system is similar to the global positioning system (GPS). Data arecollected by communication between probe vehicles and a radio towerinfrastructure.
C Cellular Geo-location - This experimental technology can collect travel time databy discretely tracking cellular telephone call transmissions.
C Global Positioning System (GPS) - Probe vehicles are equipped with GPSreceivers and two-way communication to receive signals from earth-orbitingsatellites. The positional information determined from the GPS signals istransmitted to a control center to display real-time position of the probe vehicles.Travel time information can be determined from the collected data.
5.0.2 Sample Size Criteria
Sample size requirements associated with probe vehicle applications are inherently different thansample size requirements for test vehicle or license plate matching techniques. In typical travel timestudies, the sample sizes are established by the test conductors prior to data collection. Typically,these sample sizes are established based on desired levels of accuracy associated with the purposeof the travel time study and on budgetary constraints. Since probe vehicle systems are designed tocollect data for real-time traffic monitoring, fleet monitoring, or electronic toll collection (ETC),the sample sizes are determined by availability of instrumented probe vehicles in the traffic stream.Probe vehicle samples sizes are considered in the following:
C Design of the probe vehicle system (e.g., distribution of AVI tags);C Evaluation of probe vehicle system; andC Analysis of data obtained from a probe vehicle system.
For example, a transit agency using signpost-based automatic vehicle location (AVL) will haveequipped a certain number of buses with the necessary hardware, a traffic management system maycollect data from an existing fleet of probe vehicles, or an ETC system may provide service to somefixed number of toll patrons. Therefore, the study supervisor has little to no control over the probevehicle sample size if the data are collected from an existing probe vehicle system.
Practitioners using data collected from probe vehicle systems should consider the achievable samplesize when designing their study and analyzing the data. While probe vehicle sample sizes may befixed at a small number, it does not necessarily mean that the data are not useful. For planningstudies that do not demand high statistical accuracy, a few probe vehicles per day can provide
CHAPTER 5 - ITS PROBE VEHICLE TECHNIQUES
Travel Time Data Collection Handbook 5-5
sufficient data for analysis (or at least as much as comparable test vehicle techniques). Small probevehicle sample sizes may not provide sufficient representation for analyses that require high levelsof accuracy.
Design of a Probe Vehicle System
In the initial stages of developing and implementing probe vehicle systems to collect travel timedata for real-time and planning applications, it is necessary to estimate an effective probe vehiclesample size. This process may involve studying the practices of existing probe vehicle systems andcomparing characteristics of respective transportation systems.
Probe vehicle systems are designed to generate a certain database on the purpose of their design.For example, signpost-based probe vehicle systems are designed to monitor the status of a transitagency’s bus fleet. Thus, the buses function as probe vehicles within the traffic stream. The sizeof the transit agency’s sample is most likely justified by the number of buses within the fleet andthe available funding to equip the buses with the necessary tracking equipment.
A representative sample does not necessarily translate to a large sample size. The nature of somestudies does not require large sample sizes to yield desirable results. For instance, a study by theWashington State Department of Transportation (WSDOT) suggested that sample sizes as low as45 AVI-equipped probe vehicles per day, which averaged 30-minute headways, could yield usefuldata (1). These data were used to determine the occurrence, duration, severity, and frequency ofcongestion. The study recommended that the sample size was sufficient for facility performancemonitoring, air quality planning and monitoring, and before-and-after studies.
A study by Boyce et al. (2) estimated necessary sample sizes for a dynamic route guidance modelbased on the results of a static, user-optimal route choice traffic assignment analysis. Their resultssuggested that about 4,000 probe vehicles were required for a 520 sq-km (200 sq-mi) suburban roadnetwork.
Srinivasan and Jovanis (3) developed an algorithm to estimate the number of probe vehicles neededto collect real-time travel time data for advanced traffic management and information systems.Their algorithm estimates the number of probe vehicles based on the time period of 5, 10, or 15minutes, reliability criterion, the proportion of links to be covered, and the duration of the peakperiod. Their algorithm was tested on a simulation of the Sacramento, California 440 sq-km (170sq-mi) network during the morning peak period. Results of the study indicated that the number ofrequired probes increased non-linearly as reliability criterion grew more stringent, that more probeswere required for shorter time periods, and that the number of required probes increased as theproportion of link coverage increased.
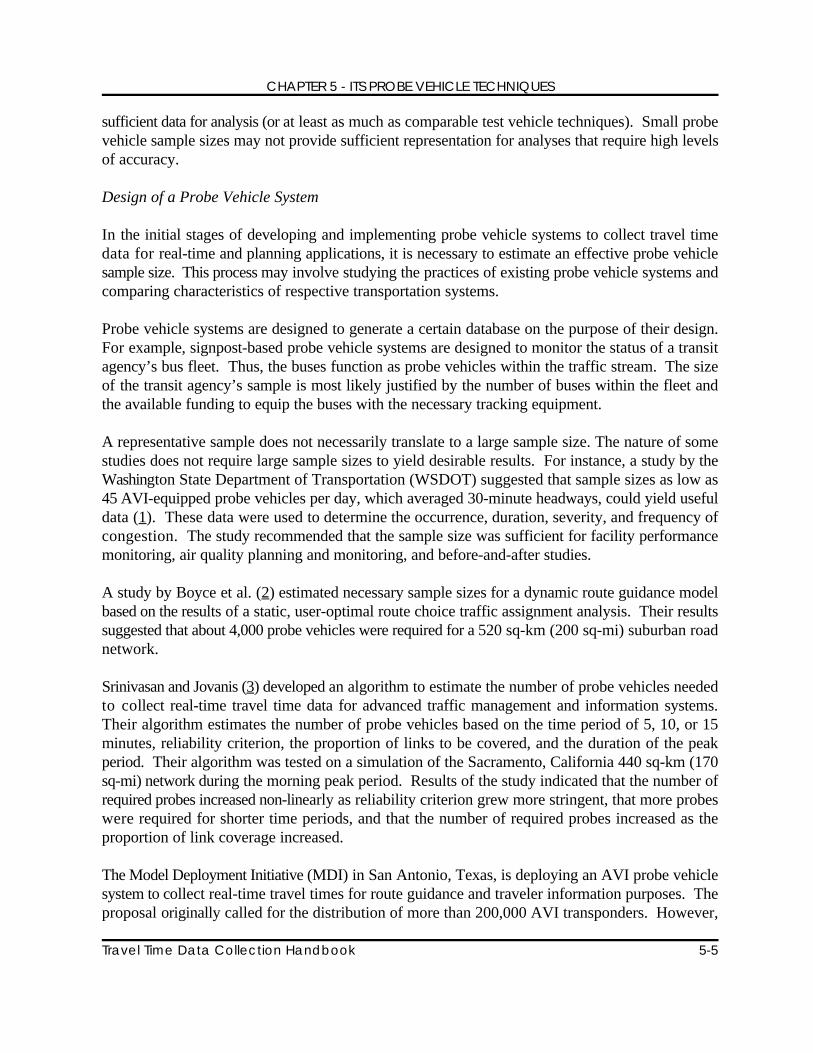
The Model Deployment Initiative (MDI) in San Antonio, Texas, is deploying an AVI probe vehiclesystem to collect real-time travel times for route guidance and traveler information purposes. Theproposal originally called for the distribution of more than 200,000 AVI transponders. However,
CHAPTER 5 - ITS PROBE VEHICLE TECHNIQUES
5-6 Travel Time Data Collection Handbook
UNKNOWN
??Probe vehicle sample sizes vary depending upon local road networks, trafficpatterns, and many other variables. The limited research does not permit validconclusions to be drawn for other urban areas without specific study.
IMPORTANT
LIt is possible to evaluate the adequacy of a probe vehicle sample size bycalculating a target sample size necessary for meeting specified accuracy criteriaand comparing this value to the system’s current sample size.
their tag distribution efforts were scaled back for several reasons, most notably budget shortagesand a reluctance to distribute the AVI tags as part of the required vehicle registration stickers.Current plans in San Antonio are to distribute between 50,000 and 70,000 AVI tags to publicvolunteers and commuters. Another difficulty with tag distribution in San Antonio was the lack ofany toll highways, especially any that could support electronic toll collection.
An automatic vehicle identification (AVI) probe vehicle system designed as a traffic monitoringsystem may advertise for volunteers to serve as probe vehicle drivers. Motorists may be targetedby changeable message board advertising on specific roadways or by popular media. Probe vehicledrivers may be recruited by offering incentives, as well. For instance, a department oftransportation may offer AVI tags to motorists free of charge. The free tags could then be used foran electronic toll collection service to conveniently pay toll charges while also participating as probevehicle drivers in the local traffic monitoring system.
Evaluation of a Probe Vehicle System
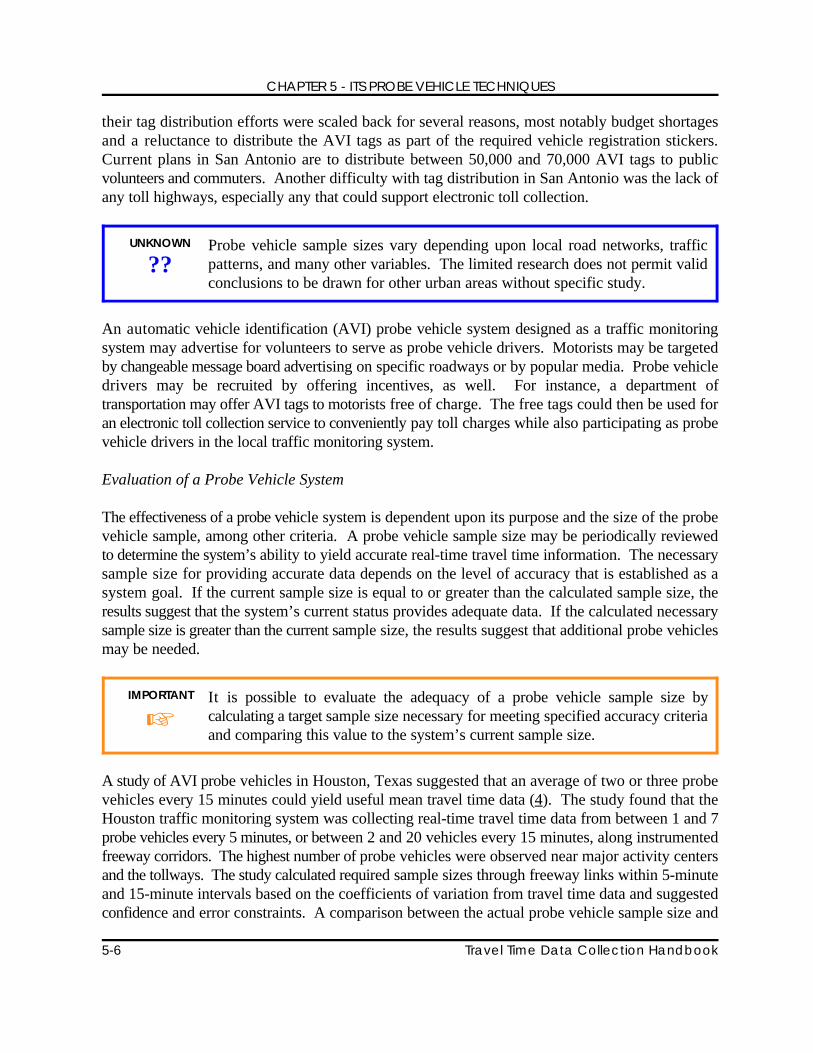
The effectiveness of a probe vehicle system is dependent upon its purpose and the size of the probevehicle sample, among other criteria. A probe vehicle sample size may be periodically reviewedto determine the system’s ability to yield accurate real-time travel time information. The necessarysample size for providing accurate data depends on the level of accuracy that is established as asystem goal. If the current sample size is equal to or greater than the calculated sample size, theresults suggest that the system’s current status provides adequate data. If the calculated necessarysample size is greater than the current sample size, the results suggest that additional probe vehiclesmay be needed.
A study of AVI probe vehicles in Houston, Texas suggested that an average of two or three probevehicles every 15 minutes could yield useful mean travel time data (4). The study found that theHouston traffic monitoring system was collecting real-time travel time data from between 1 and 7probe vehicles every 5 minutes, or between 2 and 20 vehicles every 15 minutes, along instrumentedfreeway corridors. The highest number of probe vehicles were observed near major activity centersand the tollways. The study calculated required sample sizes through freeway links within 5-minuteand 15-minute intervals based on the coefficients of variation from travel time data and suggestedconfidence and error constraints. A comparison between the actual probe vehicle sample size and
CHAPTER 5 - ITS PROBE VEHICLE TECHNIQUES
Travel Time Data Collection Handbook 5-7
IMPORTANT
LPractitioners designing or modifying probe vehicle systems should ensure thattheir local system is compatible with the National ITS Architecture standards.
the calculated necessary sample size (based on specified confidence and error constraints) suggestedwhether or not a sufficient number of probe vehicles were collecting data. Results showed that, fora 90 percent confidence level with 10 percent relative error, 2 or 3 probe vehicles every 15 minuteswere sufficient to collect useful travel time data.
Sample Composition
An aspect that should be considered when collecting and analyzing probe vehicle data is the driveror vehicle composition of the sample. Composition refers to the type of vehicles or type of driversthat may compose the sample. It is important to understand the type of vehicles and drivers that areoperating the probe vehicles. The sample may be biased if the data were collected by transitvehicles. The following traffic composition characteristics should be kept in mind when composingor evaluating probe vehicle samples:
C vehicle type - automobile, truck, transit vehicle, or other;C driver type - depends on vehicle type; andC travel lane representation - certain vehicles may primarily use certain travel lanes.
5.0.3 ITS Data Considerations
National ITS Architecture and Data Standards
Widespread implementation of intelligent transportation system (ITS) projects, including probevehicle data collection systems, has created a pressing demand for standards and protocols toprovide interoperability, compatibility, and interchangeability between various technologies.Interoperability can allow probe vehicles to travel throughout the country and still provide effectivedata collection or receive traveler information. Compatibility can allow different manufacturers’equipment to communicate without interference. Interchangeability allows one manufacturer’sdevice to be replaced with a device from a separate manufacturer.
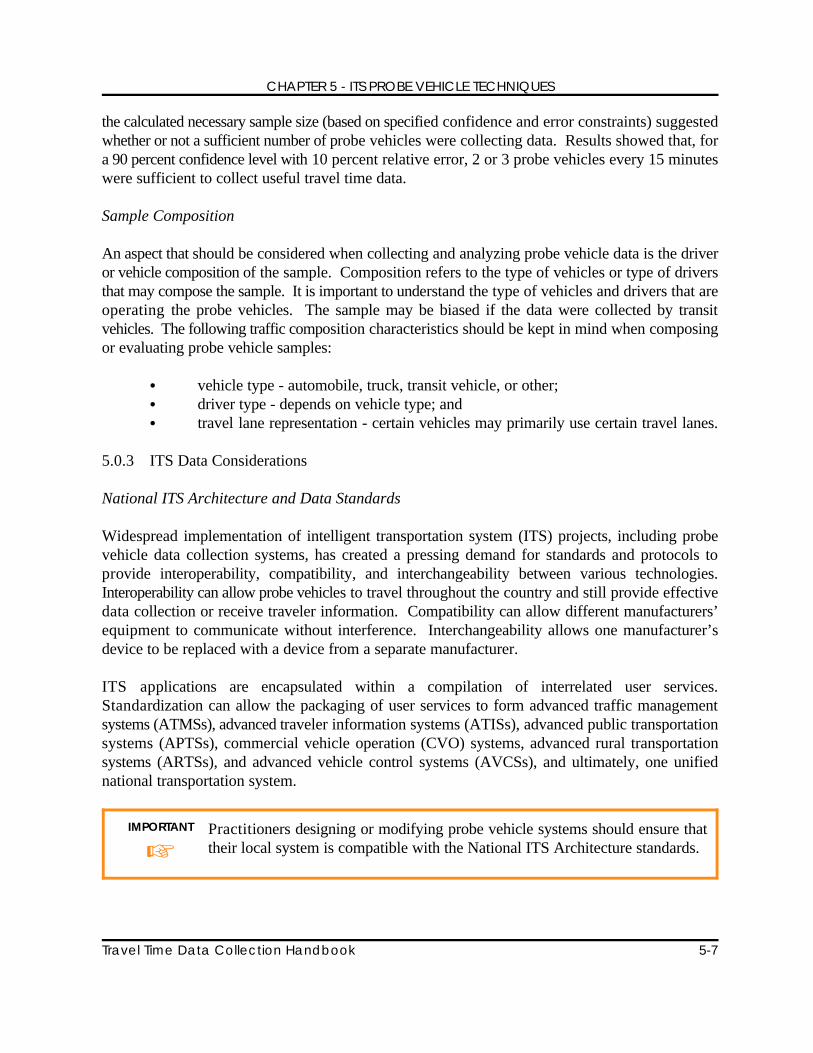
ITS applications are encapsulated within a compilation of interrelated user services.Standardization can allow the packaging of user services to form advanced traffic managementsystems (ATMSs), advanced traveler information systems (ATISs), advanced public transportationsystems (APTSs), commercial vehicle operation (CVO) systems, advanced rural transportationsystems (ARTSs), and advanced vehicle control systems (AVCSs), and ultimately, one unifiednational transportation system.
CHAPTER 5 - ITS PROBE VEHICLE TECHNIQUES
5-8 Travel Time Data Collection Handbook
Their designs and recommendations should reflect the proposed standards which are set forth bythe various organizations and committees charged with that task. The framework for developingstandards and protocols has been established by the U.S. DOT through the National ITSArchitecture project. The project has developed a series of white papers that describe the need forstandards, standards development process, example requirements, and an Architecture referencemodel (5). A standards requirement document (SRD) has been developed to provide definitionsof interfaces and necessary priorities for standardization within the Architecture reference model.The project is working towards the development of a standards implementation plan (SIP), whichwill outline standards, time schedules, and critical milestones for the implementation phase.
The National ITS Architecture provides common structure for the design of ITS. The Architecturedesigns the functions, such as gathering traffic data, that are necessary to perform certain userservices and to implement the vehicles and infrastructure of the system, the information flowbetween system components, and the communication requirements for the information flows (6).The National ITS Architecture defines how large scale ITS components, such as the ATMSs andATISs, work together. At the ATMS or ATIS level, these systems will control how freewaysystems communicate with traffic signal and control systems.
The National Transportation Communications for ITS Protocol (NTCIP) standards were developedfor communications between traffic management centers and signal systems; however, the FederalHighway Administration (FHWA) broadened the protocol to include additional technologies.Simply stated, the NTCIP will define how traffic control systems communicate to their sub-components (7). More information on the current and developing NTCIP standards are availableat ITS America’s web site at “http://www.itsa.org”.
Professional societies play a major role in the development of the National ITS Architecture. Forexample, the Institute of Transportation Engineers (ITE) is playing an active role in setting nationalstandards and guidelines to simplify operations and maintenance of ITS networks, among otherroles. The Institute is ensuring that traffic engineers are informed in the development, adoption, andreview of ITS standards.
The Intelligent Transportation Society of America (ITS America) has a Standards and ProtocolsCommittee to coordinate development of ITS standards. The Committee and the FHWA havejointly produced a standards and protocol catalog (Publication No: FHWA-JPO-95-005) whichdescribes the current state and future direction of ITS standards development.
Recent discussion about the National ITS Architecture may result in the addition of a user servicethat relates to the retention or archival of ITS traffic data. This ITS traffic data, as pointed out inthis chapter, could be useful for a wide range of planning, operations, and evaluation activities. Theproceedings from the “ITS as a Data Resource” workshop held January 1998 in Washington, DC,is available on the web at “http://www.fhwa.dot.gov/ohim/”.
CHAPTER 5 - ITS PROBE VEHICLE TECHNIQUES
Travel Time Data Collection Handbook 5-9
5.1 Signpost-Based Automatic Vehicle Location
Transit agencies have utilized automatic vehicle location (AVL) or automatic vehicle monitoringsystems to monitor the position and status of transit fleet vehicles. A variety of AVL systems existbased on such technologies as LORAN-C, ground-based radio navigation, and signpost-basedtechnologies. These technologies are being replaced by the global positioning system (GPS), whichis discussed later in this chapter. However, some transit agencies continue to use signpost-basedsystems successfully, whereas other agencies have reported limited success.
Signpost-based AVL systems are still operated, such as with the London Transport Bus (LTB)system, San Antonio VIA transit system, New Jersey Transit system, and the Seattle Metro system(8,9). This type of system is typically used by relatively large transit agencies in metropolitan areas.Only a few rural transit agencies have used this technology since it requires substantial capitalinvestment and staff resources to develop, implement, and operate.
Signpost-based AVL systems are designed to track the location of fleet vehicles along their routesfor real-time fleet monitoring, schedule adherence monitoring, computer-aided dispatching, andschedule evaluating. The system consists of seven main components to collect and store travel timedata:
1. infrastructure of electronic transmitters;2. in-vehicle receiver;3. in-vehicle odometer sensor;4. in-vehicle locating unit, or data microprocessor;5. in-vehicle radio transmitter;6. central control radio receiver; and7. central control facility.
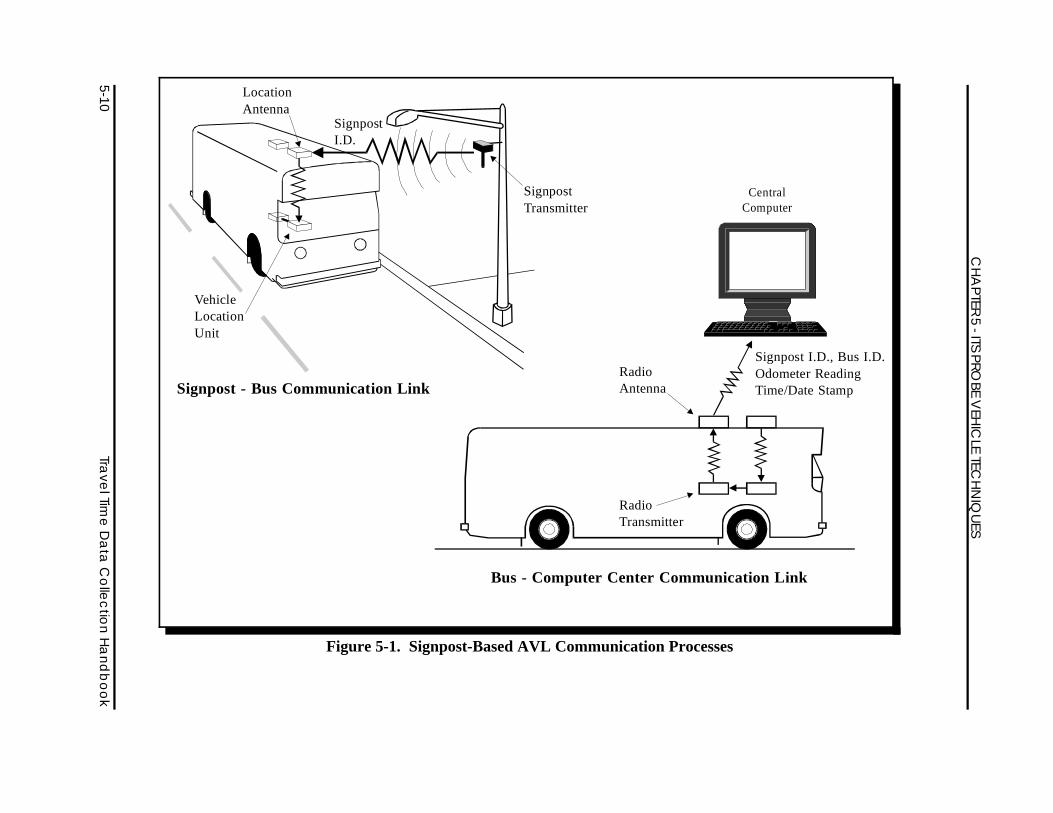
Figure 5-1 illustrates the communication processes between the electronic transmitter and transitvehicle and between the transit vehicle and the central computer. Electronic signposts emit uniqueidentification codes. These unique codes are received by approaching fleet vehicles. The signpostidentification is stored in the vehicle locating unit where it is assigned a time and date stamp, thecorresponding differential odometer reading between sequential signposts, and the vehicle’sidentification. This data bundle is sent to a central control facility at periodic intervals or upon acontroller’s prompt. The data transmission to the central computer is mutually exclusive from theoccurrence of the signpost transmission.
SignpostTransmitter
SignpostI.D.
LocationAntenna
RadioAntenna
Signpost I.D., Bus I.D.Odometer ReadingTime/Date Stamp
RadioTransmitter
VehicleLocationUnit
CentralComputer
Signpost - Bus Communication Link
Bus - Computer Center Communication Link
CH
APTER
5 - ITS
PROBE
VEH
ICLE
TECH
NIQ
UES
Figure 5-1. Signpost-Based AVL Communication Processes
5-10Tra
vel Tim
e D
ata
Co
llec
tion
Ha
nd
bo
ok
CHAPTER 5 - ITS PROBE VEHICLE TECHNIQUES
Travel Time Data Collection Handbook 5-11
5.1.1 Advantages and Disadvantages
The advantages of signpost-based AVL for travel time collection (relative to other ITS probevehicle techniques) are:
C Simple infrastructure - Signpost-based technology is relatively simple,straightforward and can be implemented quickly (9).
C Vehicle performance data - Some signpost-based AVL systems are designed tocollect transit vehicle operational performance data, such as fuel consumption, oilpressure, or cooling temperature. These data may be useful for emissions orenvironmental modeling.
C Passenger count data - Some signpost-based AVL systems may be able to collectpassenger counts as transit patrons enter and exit the vehicle. These data may beuseful for production and attraction counts in trip generation or origin-destinationstudies.
The disadvantages of signpost-based AVL for travel time collection (relative to other ITS probevehicle techniques) are:
C Non-representative data - Since signpost-based AVL systems are typicallydesigned to monitor transit fleet operations, their travel time data reflect the travelhabits of transit vehicles and transit drivers. This representation may not beacceptable for travel time studies that wish to target automobile traffic.
C Limited coverage area - Since the signpost-based system collects data from transitprobe vehicles, the data are limited to roadways that are traveled by transit vehicles.
C Equipment maintenance - Transit agencies have reported that odometers andsignpost transmitters require routine calibration to prevent erroneous data collection.
C Outdated technology - Many transit agencies are upgrading to GPS technology (seeSection 5.5). The signpost-based AVL technology has been out-performed by themore accurate and robust global positioning satellites. Signpost-based AVLequipment is also difficult to obtain in the event that equipment needs upgrading orreplacement. Vendors of signpost-based equipment are focusing on the morelucrative GPS technology.
CHAPTER 5 - ITS PROBE VEHICLE TECHNIQUES
5-12 Travel Time Data Collection Handbook
C Complex data reduction - Although data are in electronic format and can be imported intoa spreadsheet or statistical analysis package, the data require extensive editing and qualitycontrol. For example, data must be edited to adjust for bus layovers or else link travel timeswill appear larger than they actually were. Gross data collection errors, from poorly placedor malfunctioning signpost transmitters, will need spot editing.
5.1.2 Costs and Equipment Requirements
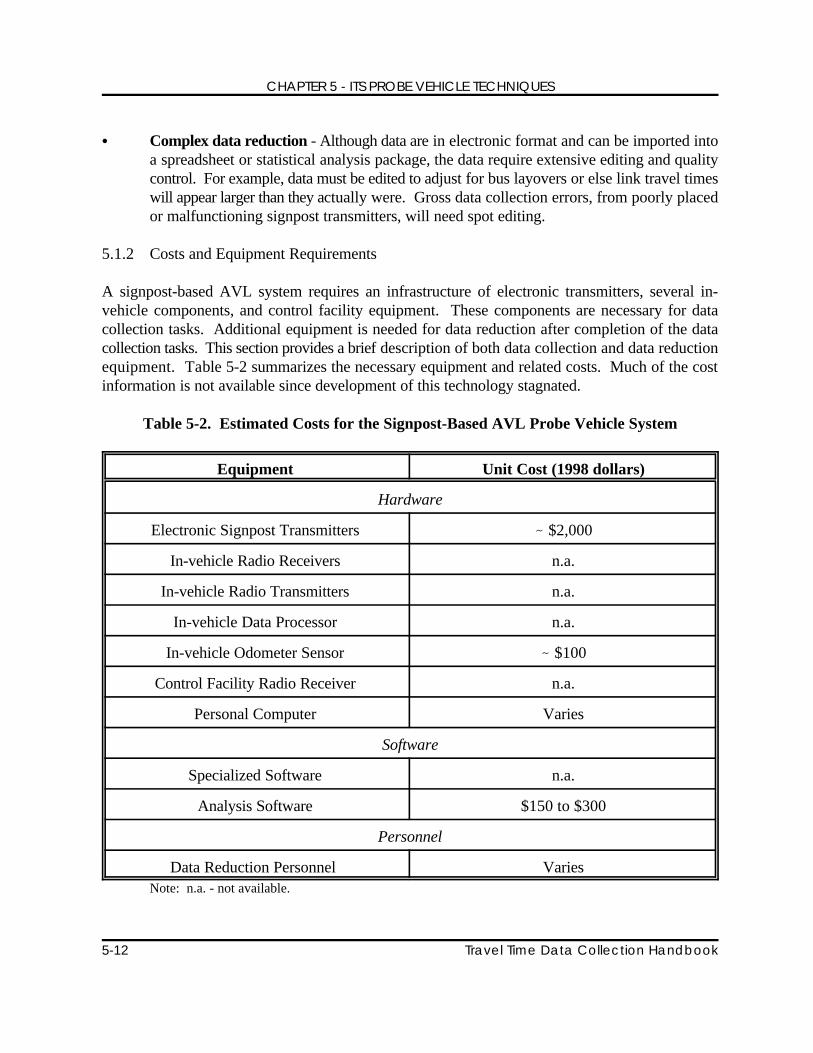
A signpost-based AVL system requires an infrastructure of electronic transmitters, several in-vehicle components, and control facility equipment. These components are necessary for datacollection tasks. Additional equipment is needed for data reduction after completion of the datacollection tasks. This section provides a brief description of both data collection and data reductionequipment. Table 5-2 summarizes the necessary equipment and related costs. Much of the costinformation is not available since development of this technology stagnated.
Table 5-2. Estimated Costs for the Signpost-Based AVL Probe Vehicle System
Equipment Unit Cost (1998 dollars)
Hardware
Electronic Signpost Transmitters - $2,000
In-vehicle Radio Receivers n.a.
In-vehicle Radio Transmitters n.a.
In-vehicle Data Processor n.a.
In-vehicle Odometer Sensor - $100
Control Facility Radio Receiver n.a.
Personal Computer Varies
Software
Specialized Software n.a.
Analysis Software $150 to $300
Personnel
Data Reduction Personnel VariesNote: n.a. - not available.
CHAPTER 5 - ITS PROBE VEHICLE TECHNIQUES
Travel Time Data Collection Handbook 5-13
Data Collection Requirements
Electronic Transmitters - Electronic transmitters are installed at the side of the roadway.They are typically installed on existing signpost structures. Installation time is typicallyabout two hours.
In-Vehicle Radio Receivers - This device receives the electronic transmitters’ signals. Itis typically installed on the top or front of the vehicle.
In-Vehicle Data Processor - This collects and stores data (odometer mileage) until thesignpost transmission is received and then transmits data to the control facility.
In-Vehicle Odometer Sensor - This device records the distance between signposttransmission receptions. Installation time typically requires about two hours.
Control Facility Radio Receiver - This device receives data transmissions from the probevehicle fleet.
Personal Computer - Traditionally, agencies have collected and processed data withmainframe computers. Desktop computers can be used to perform the necessary tasks.
Specialized Software - Special software is needed to poll vehicles and collect and processdata. Software is typically created in-house or by a consultant. The software also generatesreports and data archives which can be analyzed by other software.
Data Reduction Personnel - Individuals who will reduce the data that is being received bythe AVL system for use in travel time determination.
Data Reduction Requirements
Personal Computer - Electronic data from the signpost-based system can be analyzed usingtypical desktop computers. Disk storage requirements depend upon the size of the transitagency’s signpost-based AVL system (e.g. link coverage, sample size, number of routes).
Analysis Software - Raw data can be imported into typical spreadsheet or statisticalanalysis software packages for personal computers. With the necessary understanding ofthe data to code the software, the data can be analyzed.
CHAPTER 5 - ITS PROBE VEHICLE TECHNIQUES
5-14 Travel Time Data Collection Handbook
5.1.3 System Design Considerations
This section describes several considerations that can facilitate the data collection and reductionprocess. These recommendations can help ensure that the most useful data are collected to meetthe demands of the study.
Select strategic routes - It may not be feasible to include all transit routes in the systemcoverage area. Selecting strategic links along the transit route to include in the system canensure that travel time data are collected along critical links (e.g., most congested, greatestdemand) in the system.
Identify signpost locations - It is important to consider which locations within the systemare the most appropriate for detecting the probe vehicles. This can be done by installingsignposts at the beginning, end, and major points throughout the route. Signpost transmitterlocations are typically spaced several miles apart.
Obtain signpost use agreement - Once a signpost location has been selected, a post or poleto attach the electronic signpost transmitter must be identified. A pole attachmentagreement must be obtained from the owner of the post or pole (e.g., telephone company,electric company, municipality, or private owner).
Attach transmitters to signposts - Transmitter installations on signposts should complywith utilities specifications for attachment method, height, and other criteria. Thetransmitter power should be appropriately adjusted.
Maintain map-matching database - The map-matching database is necessary to track theprobe vehicles throughout the system. Each signpost must have an identification numberand its location must be entered into the map-matching database. This database should becontinuously updated as changes in the system, such as relocated signposts and routeadjustments, are implemented. Verify the mileage of each route by driving it in the field.
Certify working condition of in-vehicle equipment - Odometer sensors should beproperly calibrated. All in-vehicle equipment and cables and probe vehicle electrical systemshould be in proper operating condition.
Provide on-call equipment maintenance staff - On-board equipment and signposttransmitters require constant calibration and routine maintenance. Transit agencies havefull-time personnel to maintain the functionality of their equipment.
CHAPTER 5 - ITS PROBE VEHICLE TECHNIQUES
Travel Time Data Collection Handbook 5-15
IMPORTANT
LIt is important to consider that the raw data are difficult to interpret without someunderstanding of the transit agency’s bus operations and location of electronicsignposts within the roadway network.
5.1.4 Data Reduction and Quality Control
Once the raw data have been collected, it is necessary to process the data into a useful format. Thissection describes several measures that are necessary to develop a useful data set and severalmeasures that assist in performing an efficient analysis.
Data files are typically in an ASCII text format. These data may be imported into a spreadsheetsoftware package or into statistical analysis software for analysis.
This section presents several issues to consider when reducing and inspecting the quality ofsignpost-based AVL travel time data.
Identify scheduled layover points - The raw data file includes the bus identificationnumber, time that the bus passed an electronic signpost, the location of the signpost, and thephysical length of roadway traveled among other data. These data are essential to determinetravel times through roadway segments. It is also important to keep in mind that busschedules include layovers. Layovers detain a bus at a stop along its route. These layoverdurations should be figured into the travel times by obtaining information on pre-scheduledlayovers from the transit agency.
Maintain signpost transmitter locations with map - Additionally, it is necessary tomaintain the locations of the electronic signpost transmitters so that a physical roadwayreference may be used to interpret the location of time points. Ensure that transmitterlocations are updated on the system map when changes are implemented in the field.Signpost transmitters are often relocated in the field, however, the map remains unchangedthereafter.
Interpret physical location of time points - Data are sent from the vehicle to the controlcenter not upon passage of the signpost transmitter, but upon passage of a scheduled pointin time (time point). The data describe the distance traveled between sequential time points.Thus, a travel time for a section of roadway is known. However, the physical location ofthat roadway section can only be inferred. It is possible to approximate the location of atime point since it is known when the vehicle passes a signpost transmitter. The exactlocation of the transmitter is known, and the location of the vehicle passing within range ofthe transmitter can be estimated to within about 30 m (100 ft). Based on the difference intime between transmitter passage and time point passage, the approximate roadway locationof a time point can be interpreted.
CHAPTER 5 - ITS PROBE VEHICLE TECHNIQUES
5-16 Travel Time Data Collection Handbook
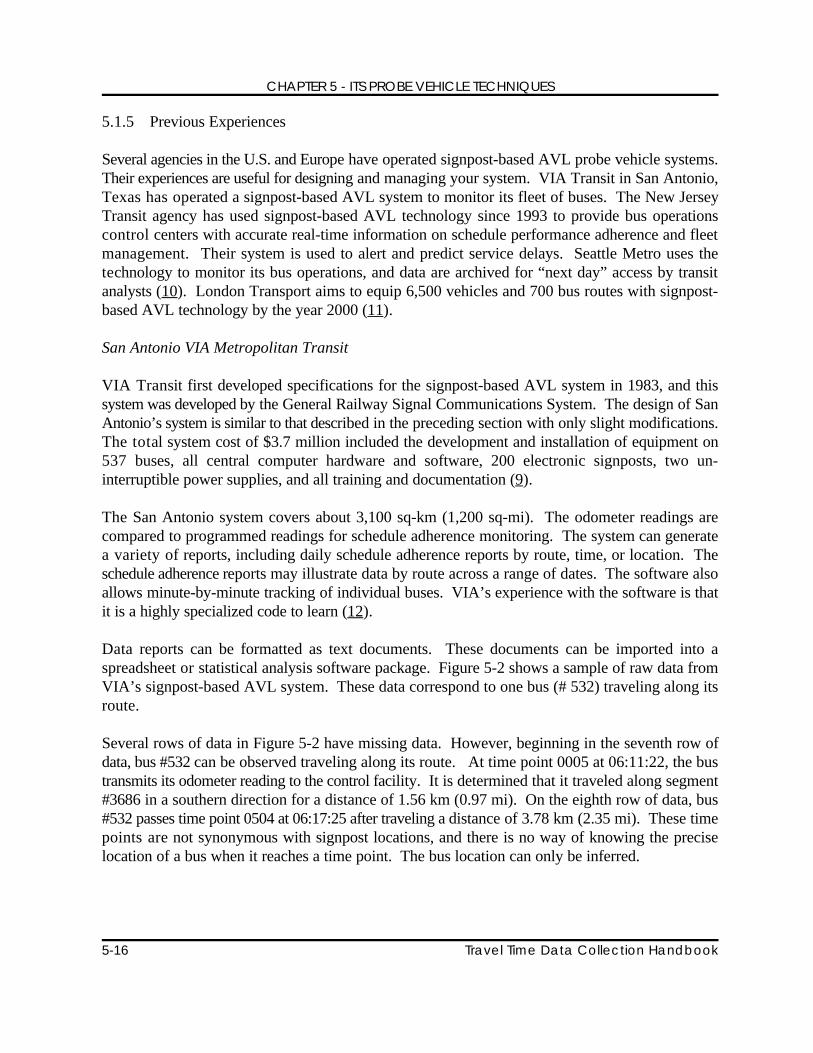
5.1.5 Previous Experiences
Several agencies in the U.S. and Europe have operated signpost-based AVL probe vehicle systems.Their experiences are useful for designing and managing your system. VIA Transit in San Antonio,Texas has operated a signpost-based AVL system to monitor its fleet of buses. The New JerseyTransit agency has used signpost-based AVL technology since 1993 to provide bus operationscontrol centers with accurate real-time information on schedule performance adherence and fleetmanagement. Their system is used to alert and predict service delays. Seattle Metro uses thetechnology to monitor its bus operations, and data are archived for “next day” access by transitanalysts (10). London Transport aims to equip 6,500 vehicles and 700 bus routes with signpost-based AVL technology by the year 2000 (11).
San Antonio VIA Metropolitan Transit
VIA Transit first developed specifications for the signpost-based AVL system in 1983, and thissystem was developed by the General Railway Signal Communications System. The design of SanAntonio’s system is similar to that described in the preceding section with only slight modifications.The total system cost of $3.7 million included the development and installation of equipment on537 buses, all central computer hardware and software, 200 electronic signposts, two un-interruptible power supplies, and all training and documentation (9).
The San Antonio system covers about 3,100 sq-km (1,200 sq-mi). The odometer readings arecompared to programmed readings for schedule adherence monitoring. The system can generatea variety of reports, including daily schedule adherence reports by route, time, or location. Theschedule adherence reports may illustrate data by route across a range of dates. The software alsoallows minute-by-minute tracking of individual buses. VIA’s experience with the software is thatit is a highly specialized code to learn (12).
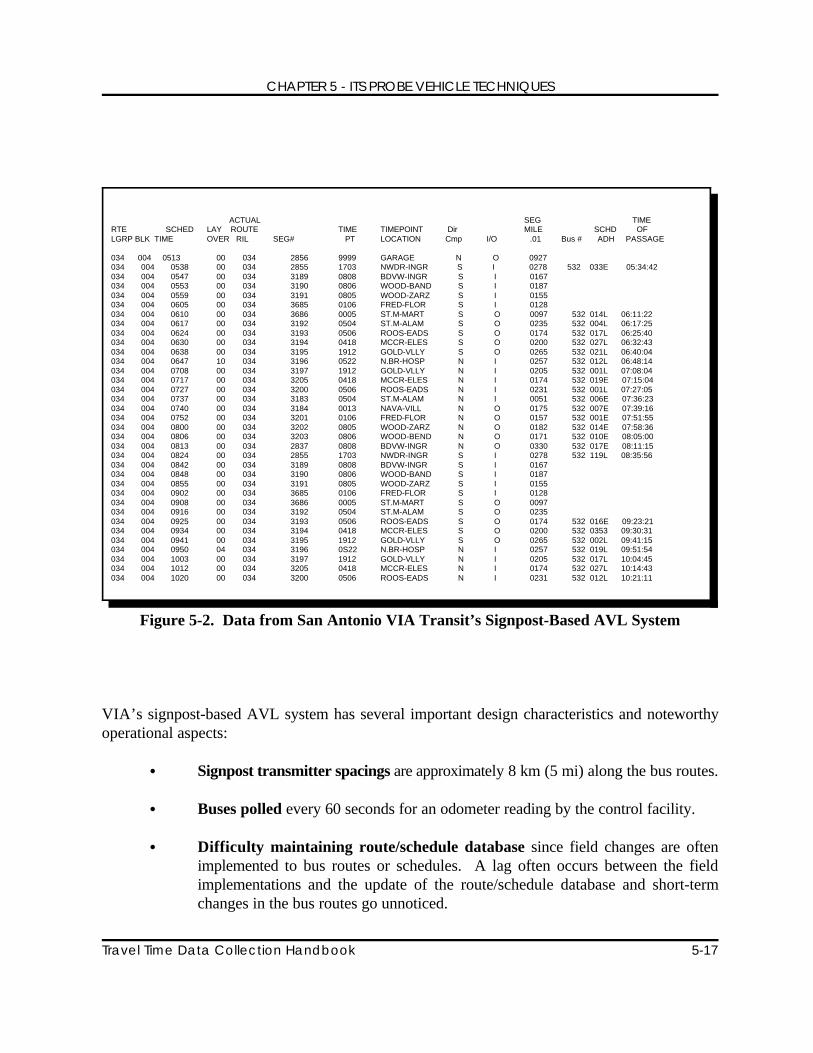
Data reports can be formatted as text documents. These documents can be imported into aspreadsheet or statistical analysis software package. Figure 5-2 shows a sample of raw data fromVIA’s signpost-based AVL system. These data correspond to one bus (# 532) traveling along itsroute.
Several rows of data in Figure 5-2 have missing data. However, beginning in the seventh row ofdata, bus #532 can be observed traveling along its route. At time point 0005 at 06:11:22, the bustransmits its odometer reading to the control facility. It is determined that it traveled along segment#3686 in a southern direction for a distance of 1.56 km (0.97 mi). On the eighth row of data, bus#532 passes time point 0504 at 06:17:25 after traveling a distance of 3.78 km (2.35 mi). These timepoints are not synonymous with signpost locations, and there is no way of knowing the preciselocation of a bus when it reaches a time point. The bus location can only be inferred.
CHAPTER 5 - ITS PROBE VEHICLE TECHNIQUES
Travel Time Data Collection Handbook 5-17
ACTUAL SEG TIMERTE SCHED LAY ROUTE TIME TIMEPOINT Dir MILE SCHD OFLGRP BLK TIME OVER RIL SEG# PT LOCATION Cmp I/O .01 Bus # ADH PASSAGE
034 004 0513 00 034 2856 9999 GARAGE N O 0927 034 004 0538 00 034 2855 1703 NWDR-INGR S I 0278 532 033E 05:34:42034 004 0547 00 034 3189 0808 BDVW-INGR S I 0167034 004 0553 00 034 3190 0806 WOOD-BAND S I 0187034 004 0559 00 034 3191 0805 WOOD-ZARZ S I 0155034 004 0605 00 034 3685 0106 FRED-FLOR S I 0128034 004 0610 00 034 3686 0005 ST.M-MART S O 0097 532 014L 06:11:22034 004 0617 00 034 3192 0504 ST.M-ALAM S O 0235 532 004L 06:17:25034 004 0624 00 034 3193 0506 ROOS-EADS S O 0174 532 017L 06:25:40034 004 0630 00 034 3194 0418 MCCR-ELES S O 0200 532 027L 06:32:43034 004 0638 00 034 3195 1912 GOLD-VLLY S O 0265 532 021L 06:40:04034 004 0647 10 034 3196 0522 N.BR-HOSP N I 0257 532 012L 06:48:14034 004 0708 00 034 3197 1912 GOLD-VLLY N I 0205 532 001L 07:08:04 034 004 0717 00 034 3205 0418 MCCR-ELES N I 0174 532 019E 07:15:04034 004 0727 00 034 3200 0506 ROOS-EADS N I 0231 532 001L 07:27:05034 004 0737 00 034 3183 0504 ST.M-ALAM N I 0051 532 006E 07:36:23034 004 0740 00 034 3184 0013 NAVA-VILL N O 0175 532 007E 07:39:16034 004 0752 00 034 3201 0106 FRED-FLOR N O 0157 532 001E 07:51:55034 004 0800 00 034 3202 0805 WOOD-ZARZ N O 0182 532 014E 07:58:36034 004 0806 00 034 3203 0806 WOOD-BEND N O 0171 532 010E 08:05:00034 004 0813 00 034 2837 0808 BDVW-INGR N O 0330 532 017E 08:11:15034 004 0824 00 034 2855 1703 NWDR-INGR S I 0278 532 119L 08:35:56034 004 0842 00 034 3189 0808 BDVW-INGR S I 0167034 004 0848 00 034 3190 0806 WOOD-BAND S I 0187034 004 0855 00 034 3191 0805 WOOD-ZARZ S I 0155034 004 0902 00 034 3685 0106 FRED-FLOR S I 0128034 004 0908 00 034 3686 0005 ST.M-MART S O 0097034 004 0916 00 034 3192 0504 ST.M-ALAM S O 0235034 004 0925 00 034 3193 0506 ROOS-EADS S O 0174 532 016E 09:23:21034 004 0934 00 034 3194 0418 MCCR-ELES S O 0200 532 0353 09:30:31034 004 0941 00 034 3195 1912 GOLD-VLLY S O 0265 532 002L 09:41:15034 004 0950 04 034 3196 0S22 N.BR-HOSP N I 0257 532 019L 09:51:54034 004 1003 00 034 3197 1912 GOLD-VLLY N I 0205 532 017L 10:04:45034 004 1012 00 034 3205 0418 MCCR-ELES N I 0174 532 027L 10:14:43034 004 1020 00 034 3200 0506 ROOS-EADS N I 0231 532 012L 10:21:11
Figure 5-2. Data from San Antonio VIA Transit’s Signpost-Based AVL System
VIA’s signpost-based AVL system has several important design characteristics and noteworthyoperational aspects:
C Signpost transmitter spacings are approximately 8 km (5 mi) along the bus routes.
C Buses polled every 60 seconds for an odometer reading by the control facility.
C Difficulty maintaining route/schedule database since field changes are oftenimplemented to bus routes or schedules. A lag often occurs between the fieldimplementations and the update of the route/schedule database and short-termchanges in the bus routes go unnoticed.
CHAPTER 5 - ITS PROBE VEHICLE TECHNIQUES
5-18 Travel Time Data Collection Handbook
C 1 to 2 persons required to maintain route/schedule database.
C Aging hardware and signpost-based technology is difficult to replace.
C Quality of data is suspect since data are often erroneous or missing for reportgeneration because vehicles often have malfunctioning equipment, odometers arenot calibrated for vehicle’s tire size or inflation level, or route/schedule referencedatabase are not updated. Erroneous data are also obtained when a bus passesthrough a layover point (e.g., transit center or bus stop) since there is no distinctionbetween arrival or departure; however, data between layover points is reliable.
C Signpost maintenance requires checking signposts periodically for proper signaltransmission. Signpost maintenance is a large expense. Sensitivity of signposts onlow-speed facilities should be set at a shorter range than for signposts on freeways.Sensitivity refers to the transmission range of the signpost transmitter.
C Odometer maintenance requires odometers that are properly calibrated for eachbus.
VIA uses its signpost-based AVL system for real-time location tracking, schedule adherencemonitoring, and computer-aided dispatching. They reported that the data have never been requestedfor use in any other applications other than for their personal fleet management.
New Jersey Transit Agency
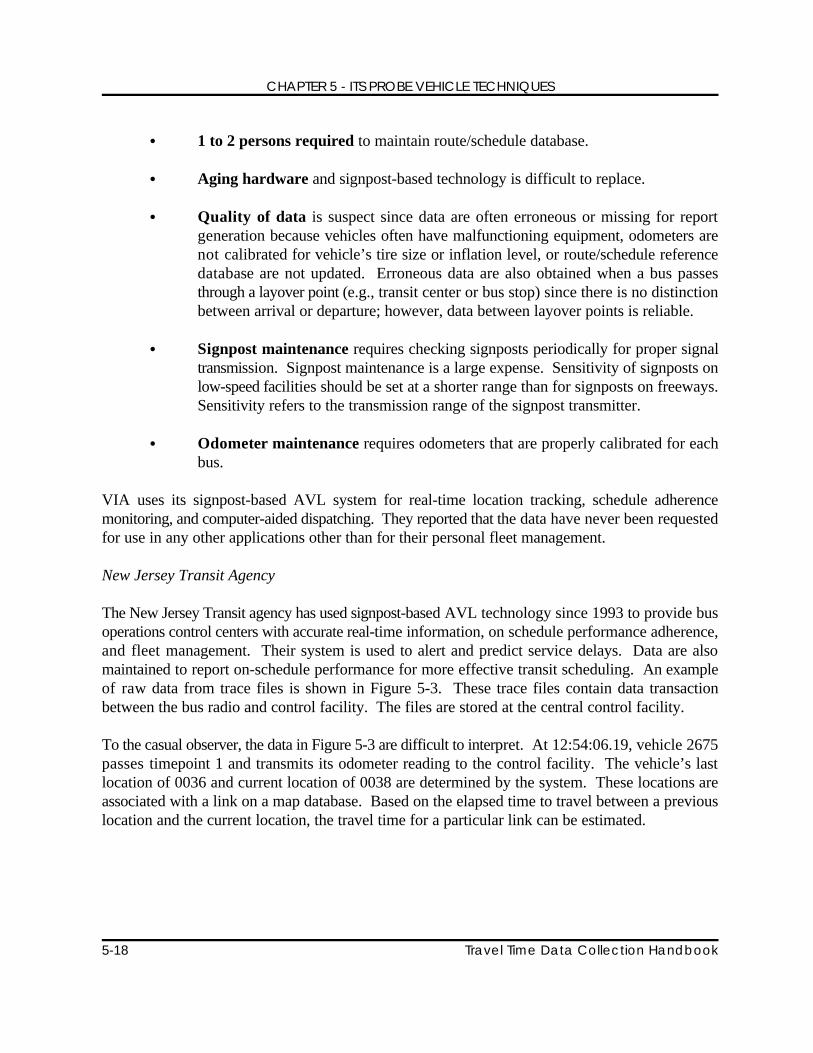
The New Jersey Transit agency has used signpost-based AVL technology since 1993 to provide busoperations control centers with accurate real-time information, on schedule performance adherence,and fleet management. Their system is used to alert and predict service delays. Data are alsomaintained to report on-schedule performance for more effective transit scheduling. An exampleof raw data from trace files is shown in Figure 5-3. These trace files contain data transactionbetween the bus radio and control facility. The files are stored at the central control facility.
To the casual observer, the data in Figure 5-3 are difficult to interpret. At 12:54:06.19, vehicle 2675passes timepoint 1 and transmits its odometer reading to the control facility. The vehicle’s lastlocation of 0036 and current location of 0038 are determined by the system. These locations areassociated with a link on a map database. Based on the elapsed time to travel between a previouslocation and the current location, the travel time for a particular link can be estimated.
CHAPTER 5 - ITS PROBE VEHICLE TECHNIQUES
Travel Time Data Collection Handbook 5-19
12:31:42.82 LOC_MSG Veh: 2675 Last Loc 005A Curr Loc 005A Odm 0 TID 00004813 Trip Id0000266112:33:50.98 LOC~MSG Veh: 2675 Last Loc 005A Curr Loc 0036 Odm 0 TID 00004813 Trip Id00002661 12:33:51.01 TIMEPT Veh: 2675 EOT Trip Msg TID 00004813 Trip Id 0000266112:33:51.01 TIMEPT Veh: 2675 Timepoint 6 completed by Signpost TID 0000481312:43:52.06 LOC_MSG Veh: 2675 Last Loc 005A Curr Loc 0036 Odm 0 TID 00004813 Trip Id006E117F12:53:51.91 LOC_MSG Veh: 2675 Last Loc 005A Curr Loc 005A Odm 0 TID 00004813 Trip Id006E117F12:54:06.17 LOC_MSG Veh: 2675 Last Loc 0036 Curr Loc 0036 Odm 0 TID 00004813 Trip Id006E117F12:54:06.19 TIMEPT Veh: 2675 Immediate Trip Msg TID 00004813 Trip Id 006E117F12:54:06.19 TIMEPT Veh: 2675 Timepoint 1 completed by Signpost TID 0000481312:54:52.25 LOC_MSG Veh: 2615 SOT Msg TID 00004813 Trip Id 006E117F12:54:52.29 TIMEPT Veh: 2675 Immediate Trip Msg TID 00004813 Trip Id 006E117F13:00:34.06 LOC_MSG Veh: 2675 Last Loc 0036 Curr Loc 0038 Odm 0 TID 00004813 Trip Id006E117F 13:00:34.09 TIMEPT Veh: 2675 Immediate Trip Msg TID 00004813 Trip Id 006E117F13:00:34.09 TIMEPT Veh: 2675 Timepoint 2 completed by Signpost TID 0000481313:02:54.62 SPM$EMPNO_MSG - EmpNo 26758 Msg TID 0000113413:10:34.56 LOC_MSG Veh: 2675 Last Loc 0038 Curr Loc 0038 Odm 0 TID 00004813 Trip Id006E117F13:11:53.29 LOC_MSG Veh: 2675 Last Loc 0038 Curr Loc 005A Odm 0 TID 00004813 Trip Id006E117F13:11:53.32 TIMEPT Veh: 2675 Immediate Trip MsgTID 00004813 Trip Id 006E117F
Figure 5-3. Data from New Jersey Transit’s Signpost-Based AVL System
Seattle Metro Transit System
The Seattle Metro system was designed to provide a method of collecting, storing, and analyzingperformance data to improve service analysis and scheduling modifications for its bus fleet (10).Some specific characteristics about Metro’s system are:
C Probe vehicle polling rate of 30 to 90 seconds;C Fast polling rate of 5 to 15 seconds for individual vehicles;C Location accuracy to within ± 76 m (± 250 ft).
Location accuracy discrepancies were attributed to bus odometer malfunction, in-vehicle receiverfailure, in-vehicle processor failure, and the bus being off-route.
London Transport Bus System
The London Transport Bus (LTB) system uses signpost-AVL technology in which in-vehicletransponders communicate with roadside microwave beacons (13). Nine hundred and fifty buses,out of a 6,500 bus fleet, are equipped with AVL tags. The system is used to estimate arrival timesfor buses and display the information at bus stop variable message signs.
Current operations generate 40 megabytes of data every day. The data are archived for seven daysto include the time at which buses pass certain points and the length of time to complete routes.These data can be used to compute journey times. The data set does not include raw location data,thus the layover time at bus stops are included.
CHAPTER 5 - ITS PROBE VEHICLE TECHNIQUES
5-20 Travel Time Data Collection Handbook
5.2 Automatic Vehicle Identification
Automatic vehicle identification (AVI) technologies are in widespread use throughout the UnitedStates for a variety of purposes: electronic toll collection (ETC), real-time traffic monitoring,incident management, traveler information, and performance measure data collection. A few largemetropolitan areas monitor traffic operations in real-time with AVI technology; however, itsprimary application is for electronic toll collection. Currently, about 18 U.S. toll collection agenciesuse AVI to electronically collect tolls (14). An additional 10 toll agencies are planning to use AVIfor electronic toll collection by the end of 1998. In Houston, Texas, AVI technology is used forboth electronic toll collection and traffic monitoring.
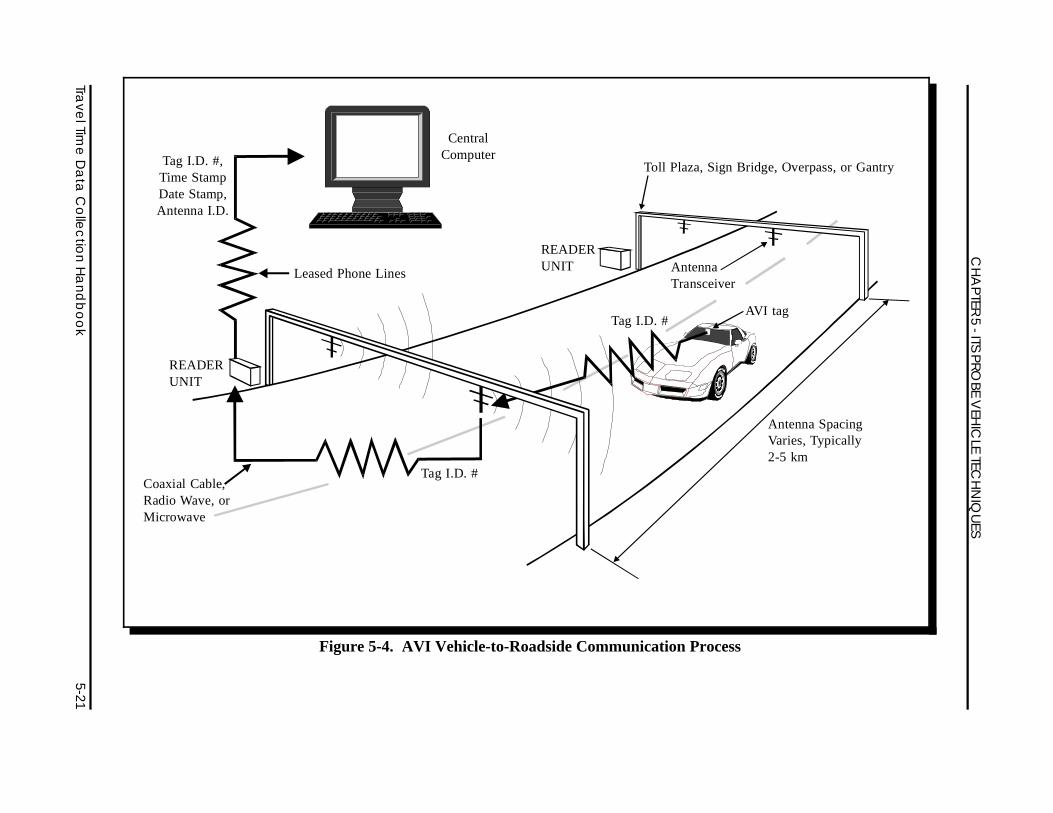
Figure 5-4 illustrates the AVI components and the data collection process. An AVI system collectstravel time data by using four primary components:
C ITS probe vehicles equipped with electronic transponders;C roadside antenna that detects the presence of electronic transponders;C roadside readers which bundle data; andC a central computer facility to collect all data.
Tags, also known as transponders, are electronically encoded with unique identification (ID)numbers. Since these tags are often used for electronic toll collection, the tag ID number can besynonymous with the electronic registration number used to determine vehicle ownership inelectronic toll collection (15,16). Roadside antennas are located on roadside or overhead structures(e.g., bridge, guide sign), or as a part of an electronic toll collection booth.
The antennas emit radio frequency signals within a capture range across one or more freeway lanes.The radio frequency (RF) capture range may be constantly emitted, or it may be triggered by anupstream loop detector (i.e., as in toll plazas). When the probe vehicle enters the antenna’s capturerange, the radio signal is reflected off of the electronic transponder. This reflected signal is slightlymodified by the tag’s unique ID number. The captured ID number is sent to a roadside reader unitvia coaxial cable and is assigned a time and date stamp and antenna ID stamp. These bundled dataare then transmitted to a central computer facility via telephone line where they are processed andstored. Unique probe vehicle ID numbers are tracked along the freeway system, and the probevehicles’ travel times are calculated as the difference between time stamps at sequential antennalocations.
AVI tag
Tag I.D. #,Time StampDate Stamp,Antenna I.D.
CentralComputer
READERUNIT
Toll Plaza, Sign Bridge, Overpass, or Gantry
READERUNIT
Antenna SpacingVaries, Typically2-5 km
AntennaTransceiver
Tag I.D. #
Tag I.D. #
Coaxial Cable,Radio Wave, orMicrowave
Leased Phone Lines
Figure 5-4. AVI Vehicle-to-Roadside Communication Process
Trave
l Time
Da
ta C
olle
ctio
n H
an
db
oo
k5-21
CH
APTER
5 - ITS
PROBE
VEH
ICLE
TECH
NIQ
UES
CHAPTER 5 - ITS PROBE VEHICLE TECHNIQUES
5-22 Travel Time Data Collection Handbook
The roadside readers have the capability of initiating the dial-up process to the central facility orthey may answer dial-in requests for data. The data collection process may slightly differ for someelectronic toll collection systems. An ETC plaza may store data for lengthy periods before the dataare sent to a central facility.
AVI systems have the ability to continuously collect large amounts of data with minimal humanresource requirements. The data collection process is constrained primarily by sample sizecharacteristics and the coverage area of the AVI infrastructure (i.e., antenna readers or ETC booths).AVI technology has demonstrated itself as highly accurate. Since AVI tags are commonly used fortoll collection, it is important to have a high detection rate. The Electronic Toll and TrafficManagement (ETTM) User Requirements for Future National Interoperability, published by theStandards and Protocols Committee of the Intelligent Transportation Society of America (ITSAmerica), suggests detection rates of greater than 99.5 percent. Agencies using AVI technologyhave experienced detection rates of between 85 to 99 percent.
Electronic Toll Collection
Many toll agencies in the U.S. are using AVI technology for electronic toll collection. Thecombination of an electronic toll collection system and a traffic information and managementsystem can be referred to as an electronic toll and traffic management (ETTM) system. Thiscombination offers an expanded utility for vehicles equipped with electronic tags to not onlyprocess tolls, but also service ITS applications (17). Electronic toll collection systems can provideuseful travel time data, particularly on systems with a large percentage of motorists using ETC.Some system adjustments will most likely be necessary to provide an effective data collectioneffort. For example, toll plazas are typically spaced further apart than recommended for AVI datacollection, and computer systems may not be prepared to archive travel time data.
While most ETC systems are not set up to simultaneously collect and manage travel time data, someexisting ETC agencies, such as the Illinois State Toll Highway Authority have begun to utilize AVItechnology for travel time data collection in addition to toll processing. Some ETC systemsexperience between 25 percent to 100 percent of all tollway vehicles having electronic tags. Thisprovides a large sample to collect representative travel time data.
Some modifications may be necessary for ETC systems to collect accurate travel time data. Forexample, antenna spacings may be too far apart. Also, some ETC systems have open-ended designsin which tolls are transacted at only one antenna per direction. Recall that two sequential antennasare needed to collect travel time data. These and other modifications are feasible, and ETC systemscan provide an abundant source of travel time data.
CHAPTER 5 - ITS PROBE VEHICLE TECHNIQUES
Travel Time Data Collection Handbook 5-23
5.2.1 Advantages and Disadvantages
Inherent within the AVI data collection methodology are certain advantages and disadvantageswhich can affect the quality of travel time data. The AVI technology presents characteristics whichcan affect the integrity of travel time data. These technological characteristics are presented andbriefly discussed in this section.
The advantages of AVI probe vehicles for travel time collection (relative to other ITS probe vehicletechniques) are:
C Continuous data collection - Travel time data may be collected for entire 24-hourperiods for each day of the year since personnel are not required for field datacollection. Data may be collected during weekends and holidays, as well. AVIallows data collection during all types of weather and environmental conditions aslong as probe vehicles are detected.
C Minimal personnel requirements - The AVI data collection process is completelyautomated. Personnel are not necessary to collect data from the field. Very fewpersonnel are needed to maintain the system and process data (18).
C Safe data collection - Since personnel are not required in the field, the risk of injuryis eliminated.
C Minimal human error - The elimination of manual data collection virtuallyremoves potential of human error from the actual data collection process.
C Accuracy of data collection - For small sample sizes, 100 percent of AVI tags canbe captured by the antenna (15). The Washington State Transportation Center(TRAC) experienced an 83 percent detection rate. Travel time observations havebeen validated by simultaneous floating car travel times. AVI tags have beendetected at speeds of 180 km/h (110 mph) and when multiple probe vehiclessimultaneously pass the same reader site. AVI technology has demonstrated itselfas immune from interference from cellular telephones, citizen band radios, andelectric generators (1).
C Lane specific - Can collect travel time data corresponding to particular lanes.
C Vast amounts of data - Since data can be collected continuously and since thesystem has the potential to collect data from many probe vehicle drivers, thepotential exists for vast amounts of travel time data. Data can be collected over anentire year and through all types of environmental conditions.
CHAPTER 5 - ITS PROBE VEHICLE TECHNIQUES
5-24 Travel Time Data Collection Handbook
The disadvantages of AVI probe vehicles for travel time collection (relative to other ITS probevehicle techniques) are:
C Infrastructure dependent - The system can collect travel time data only alongfreeway or arterial street segments that are within the coverage area of AVIinfrastructure (i.e., segments equipped with antennas or ETC booths).
C Electronic tag dependent - Data collection is limited to the number of tags in usewithin the study area.
C Clock drift problems - Several agencies have reported that maintaining theantennas or ETC booths is expensive and may affect data quality. A commonmaintenance problem is keeping the clocks, which place the time stamp on eachtransponder read, in synchronization (1,15).
C Privacy issues - The technology requires that unique tag IDs are tracked betweensequential antennas to determine travel times. The IDs correspond to individualdrivers of probe vehicles, as the drivers are often registered to use an ETC system.The technology may allow individual vehicles to be tracked along the system.
C Large data storage requirement - In AVI systems, especially systems with manyantenna locations and probe vehicles, a large amount of data storage space isneeded.
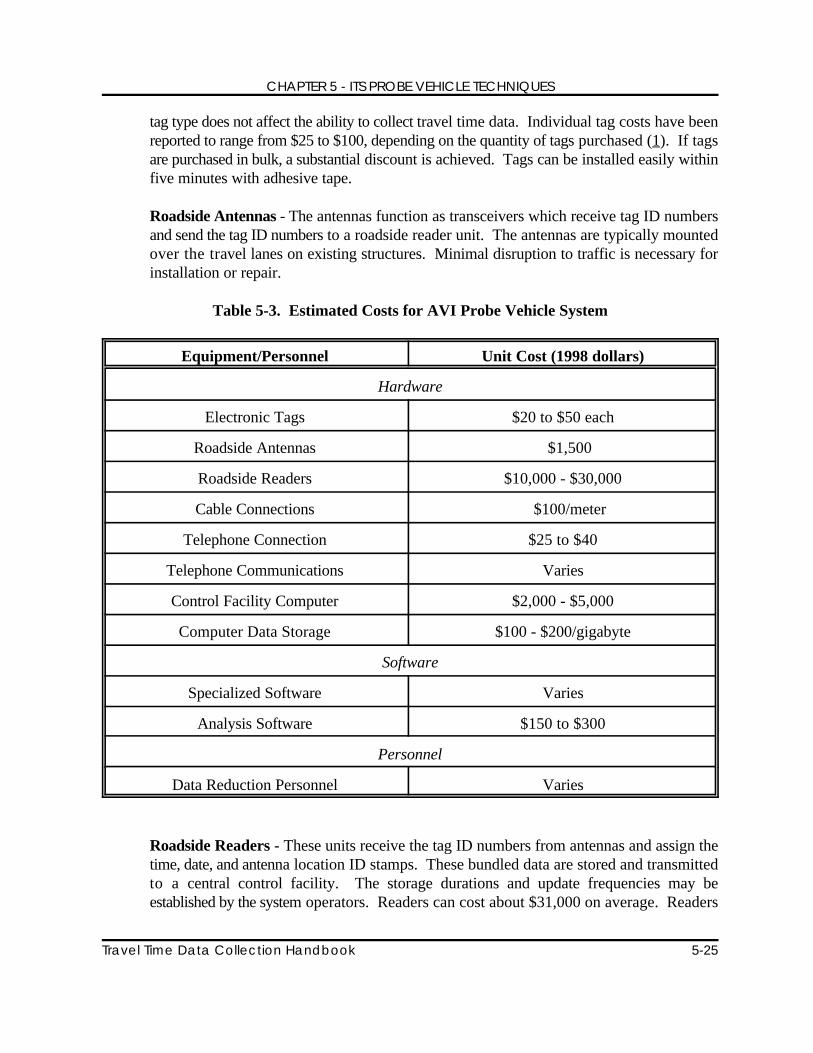
5.2.2 Costs and Equipment Resources
This section will describe the essential components for collecting travel time data using the AVIprobe vehicle technique. The quantity of certain components depends on the application of thetechnology. Equipment are presented by field hardware requirements and by central facilityhardware requirements. Table 5-3 summarizes the needed AVI equipment and costs. As with mostprobe vehicle systems, they may be installed initially for reasons other than travel time datacollection. Therefore, some of the costs presented in Table 5-3 may be subsidized by differentagencies benefitting from the system.
Data Collection Requirements
Electronic Tags - These devices are attached to the probe vehicles. They are usually placedon the inside windshield and are about the size of a credit card. Three different tag types(types I, II, and III) are commercially available. The primary difference betweentransponder types is the ability to write onto the transponder, and these distinctions arerelevant primarily for electronic toll collection purposes. Different transponder types allowtoll account data to be stored on the transponder instead of in a centralized database. The
CHAPTER 5 - ITS PROBE VEHICLE TECHNIQUES
Travel Time Data Collection Handbook 5-25
tag type does not affect the ability to collect travel time data. Individual tag costs have beenreported to range from $25 to $100, depending on the quantity of tags purchased (1). If tagsare purchased in bulk, a substantial discount is achieved. Tags can be installed easily withinfive minutes with adhesive tape.
Roadside Antennas - The antennas function as transceivers which receive tag ID numbersand send the tag ID numbers to a roadside reader unit. The antennas are typically mountedover the travel lanes on existing structures. Minimal disruption to traffic is necessary forinstallation or repair.
Table 5-3. Estimated Costs for AVI Probe Vehicle System
Equipment/Personnel Unit Cost (1998 dollars)
Hardware
Electronic Tags $20 to $50 each
Roadside Antennas - $1,500
Roadside Readers $10,000 - $30,000
Cable Connections - $100/meter
Telephone Connection $25 to $40
Telephone Communications Varies
Control Facility Computer $2,000 - $5,000
Computer Data Storage $100 - $200/gigabyte
Software
Specialized Software Varies
Analysis Software $150 to $300
Personnel
Data Reduction Personnel Varies
Roadside Readers - These units receive the tag ID numbers from antennas and assign thetime, date, and antenna location ID stamps. These bundled data are stored and transmittedto a central control facility. The storage durations and update frequencies may beestablished by the system operators. Readers can cost about $31,000 on average. Readers
CHAPTER 5 - ITS PROBE VEHICLE TECHNIQUES
5-26 Travel Time Data Collection Handbook
require frequent maintenance, which has been reported as costly as $256 per lane per siteper month.
Cables - Antennas and readers are typically connected by coaxial cables.
Telephone Line - Reader units are often tied into the central computer facility by leasedtelephone lines. The cost of leasing telephone lines may be a major operational cost. Onetelephone line is necessary for each reader unit in the field. Fiber optic cable or microwavetransmission offers a much quicker by costlier alternative to telephone lines.
Data Management and Reduction Requirements
Specialized Software - Specialized software is required to collect and process incoming tagreads and match them to calculate travel times. Software is often designed in-house, by aconsultant, or is a proprietary-based application.
Archive Capacity - Sufficient archival capacity is needed to store historic travel time data.The size of archival depends on the size of the AVI system (i.e., sample size, antennas, tagreads).
Analysis Software - Archived data can typically be analyzed using a common spreadsheetor statistical analysis package.
Data Reduction Personnel - Individuals who will reduce the data that is being received bythe AVL system for use in travel time determination.
5.2.3 System Design Considerations
This section will discuss how to design the AVI system to generate data which are most useful forthe readers’ travel time data needs. Certain hardware configurations, such as antenna spacing,mounting, or capture zone area, may be more appropriate for certain analysis methods or may bemore inclusive for a variety of analysis methods. Certain hardware specifications/types may requireadditional attention than others, and this should be considered.
Electronic Tag Types
Several vendors develop AVI technologies, and a variety of transponders and antennas arecommercially available. Currently, three different transponder technologies have been used. Thesetransponder technologies are referred to as types I, II, and III (19). The primary difference betweentransponder types is the ability to write onto the transponder, and these distinctions are relevantprimarily for electronic toll collection purposes. Different transponder types allow toll account datato be stored on the transponder instead of in a centralized database. The technological differences
CHAPTER 5 - ITS PROBE VEHICLE TECHNIQUES
Travel Time Data Collection Handbook 5-27
between tag types do not affect their abilities to collect travel time data since the necessary data (i.e.,unique ID numbers) are transmitted from the transponders to the roadside units regardless oftransponder type.
Maximizing Tag Distribution
It is desirable to distribute as many electronic tags as possible to collect travel time data. A greaternumber of probe vehicles can provide a more representative sample of the traffic population’s traveltime characteristics. In order to achieve a desirable level of probe vehicles, it is necessary to attractprobe vehicle drivers and distribute the electronic tags. Participation in an AVI system can beachieved by offering probe drivers various incentives. Potential incentives may include thefollowing:
C priority passage through toll facilities;C priority passage through weigh/inspection stations (for trucks);C ability to receive in-vehicle travel information;C free electronic tag;C voucher for merchandise or fuel;C registration for roadside maintenance service; orC some type of payment.
It is also important to ensure participants that their privacy will not be violated. Public concernshave been raised about various privacy issues. A privacy policy should be drafted, perhaps inaccordance with the Intelligent Transportation Society of America Privacy Principles, to ensure thatindividually identifiable data are not improperly managed and personal privacy is not compromised(20). Some common privacy concerns include:
C vehicle/driver tracking;C automated traffic law enforcement;C distribution of personal travel history; andC distribution of personal information.
Vehicle-to-Roadside Communication Media
Other technological differences exist between vehicle-to-roadside communication signals andbetween roadside antenna types. These differences may affect the accuracy and performance of theAVI system and should be considered when installing or upgrading AVI technologies or whencollecting travel time data. The most common vehicle-to-roadside communication signal is radiofrequency (RF). However, laser signals have been used. RF signal AVI technologies have beendemonstrated to be more reliable than laser technologies, and RF technology is the choice of newETC systems (21).
CHAPTER 5 - ITS PROBE VEHICLE TECHNIQUES
5-28 Travel Time Data Collection Handbook
Antenna Spacing and Installation Specifications
Antennas are usually mounted on existing overpass or sign structures and antenna spacing oftenvaries as mounting structure spacing varies. More expensive options include constructing a gantryover the roadway for exclusive use of AVI antennas. The level of congestion is often consideredin the placement of antennas; antennas are spaced more frequently in areas with greater congestionlevels. In addition, antenna spacing is set according to anticipated benefits from incident detection.Incident detection requires more frequent spacings than does simple travel time monitoring. OneAVI system designer recommends that antennas are spaced no greater than two minutes apart insections where speeds are less than 48 km/h (30 mph) during recurring congestion for the purposesof future incident detection (22).
Typical antenna spacings range between about 2 km (1.2 mi) to 5 km (3.1 mi). It is important toconsider that adequate antenna spacing varies with variations in mean travel time data. Largerantenna spacings result in decreased sensitivity to variations in mean travel time within the segment.It is important to consider that antennas must be connected to roadside readers. Roadside readersmust be connected to the control facility via telephone cable or other transmission medium, andpower must be supplied to the readers and antennas. Antenna and reader placement mustaccommodate these connections.
Roadside Reader Clock Synchronization
AVI roadside reader clocks place a time stamp on the tag read prior to transmitting the data to thecontrol facility. The clocks on readers must be synchronized to ensure that accurate travel timesare collected throughout the entire system. It is imperative that sequential reader clocks aresynchronized. It is necessary to periodically synchronize clocks. It is also possible to control readerclocks from the control facility by synchronizing all system clocks simultaneously.
Antenna Capture Range Adjustment
Reports suggest that one antenna can cover 18 lanes of traffic; however, practical application limitsone antenna to 8 or 9 bi-directional lanes of traffic. Typical installations allow for separate antennasfor directional lanes of traffic. The capture range for the RF signal can be adjusted to detect onelane or multiple lanes, thus allowing for detection of specific lanes. Different antenna types allowfor different capture range dimensions and are more conducive to monitoring multiple traffic lanes.
Telephone Connection to Reader Units
Analog telephone lines are often used. However, the recurring costs of analog lines presents ISDNlines as an alternative. ISDN lines can be multiplexed into a single channel into the control facilityand have smaller long-term costs. However, in the event that power is lost to the ISDN modem,manual re-connection may be required by the telephone company.
CHAPTER 5 - ITS PROBE VEHICLE TECHNIQUES
Travel Time Data Collection Handbook 5-29
5.2.4 Data Reduction and Quality Control
An AVI system requires special software applications to perform the necessary data processing.Software is typically developed by the vendor of AVI equipment, a consultant, or agency operatingthe AVI system.
Roadside reader units are equipped with computers running software to recognize each tag ID read,bundle the reads with corresponding time and date stamps and antenna ID stamp, and transmit thebundled data to a central computer. The central computer operates software which solicits datafrom the multiple roadside reader units, typically at some preset time interval.
Once data have been received by the central computer facility, several steps are taken to reduce datainto a useful format. This section describes the basic steps in the AVI data reduction process afterthe data have been transmitted from the field to the central computer.
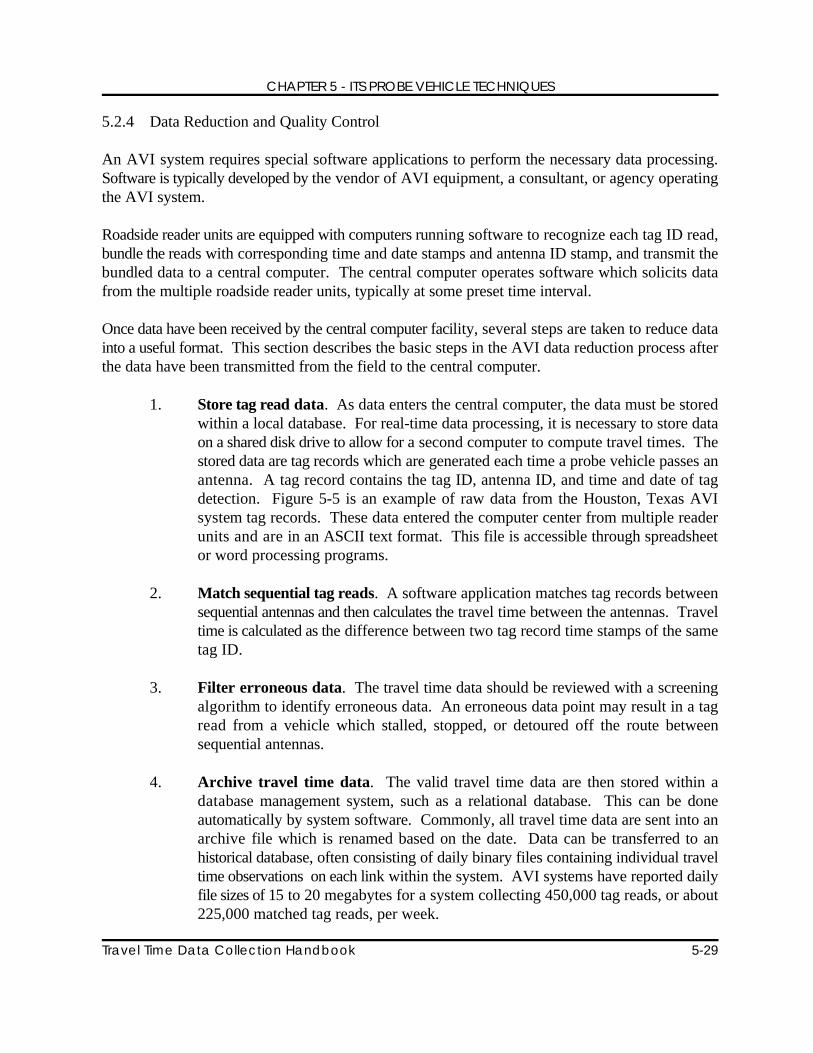
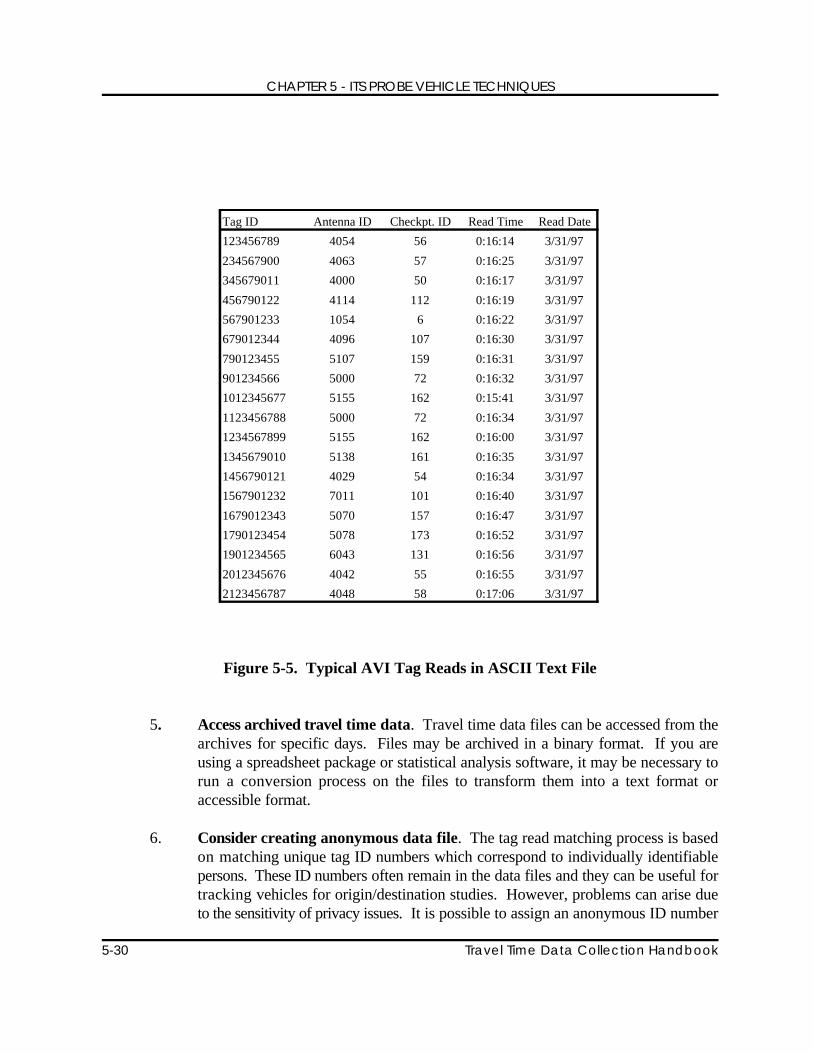
1. Store tag read data. As data enters the central computer, the data must be storedwithin a local database. For real-time data processing, it is necessary to store dataon a shared disk drive to allow for a second computer to compute travel times. Thestored data are tag records which are generated each time a probe vehicle passes anantenna. A tag record contains the tag ID, antenna ID, and time and date of tagdetection. Figure 5-5 is an example of raw data from the Houston, Texas AVIsystem tag records. These data entered the computer center from multiple readerunits and are in an ASCII text format. This file is accessible through spreadsheetor word processing programs.
2. Match sequential tag reads. A software application matches tag records betweensequential antennas and then calculates the travel time between the antennas. Traveltime is calculated as the difference between two tag record time stamps of the sametag ID.
3. Filter erroneous data. The travel time data should be reviewed with a screeningalgorithm to identify erroneous data. An erroneous data point may result in a tagread from a vehicle which stalled, stopped, or detoured off the route betweensequential antennas.
4. Archive travel time data. The valid travel time data are then stored within adatabase management system, such as a relational database. This can be doneautomatically by system software. Commonly, all travel time data are sent into anarchive file which is renamed based on the date. Data can be transferred to anhistorical database, often consisting of daily binary files containing individual traveltime observations on each link within the system. AVI systems have reported dailyfile sizes of 15 to 20 megabytes for a system collecting 450,000 tag reads, or about225,000 matched tag reads, per week.
Tag ID Antenna ID Checkpt. ID Read Time Read Date
123456789 4054 56 0:16:14 3/31/97
234567900 4063 57 0:16:25 3/31/97
345679011 4000 50 0:16:17 3/31/97
456790122 4114 112 0:16:19 3/31/97
567901233 1054 6 0:16:22 3/31/97
679012344 4096 107 0:16:30 3/31/97
790123455 5107 159 0:16:31 3/31/97
901234566 5000 72 0:16:32 3/31/97
1012345677 5155 162 0:15:41 3/31/97
1123456788 5000 72 0:16:34 3/31/97
1234567899 5155 162 0:16:00 3/31/97
1345679010 5138 161 0:16:35 3/31/97
1456790121 4029 54 0:16:34 3/31/97
1567901232 7011 101 0:16:40 3/31/97
1679012343 5070 157 0:16:47 3/31/97
1790123454 5078 173 0:16:52 3/31/97
1901234565 6043 131 0:16:56 3/31/97
2012345676 4042 55 0:16:55 3/31/97
2123456787 4048 58 0:17:06 3/31/97
CHAPTER 5 - ITS PROBE VEHICLE TECHNIQUES
5-30 Travel Time Data Collection Handbook
Figure 5-5. Typical AVI Tag Reads in ASCII Text File
5. Access archived travel time data. Travel time data files can be accessed from thearchives for specific days. Files may be archived in a binary format. If you areusing a spreadsheet package or statistical analysis software, it may be necessary torun a conversion process on the files to transform them into a text format oraccessible format.
6. Consider creating anonymous data file. The tag read matching process is basedon matching unique tag ID numbers which correspond to individually identifiablepersons. These ID numbers often remain in the data files and they can be useful fortracking vehicles for origin/destination studies. However, problems can arise dueto the sensitivity of privacy issues. It is possible to assign an anonymous ID number
CHAPTER 5 - ITS PROBE VEHICLE TECHNIQUES
Travel Time Data Collection Handbook 5-31
to each original tag ID number. This reassigned anonymous ID does not correspondto an individually identifiable account, yet it retains the ability to track vehicles fororigin/destination studies. Once the anonymous file is created, the original tag IDnumbers can be discarded.
5.2.5 Previous Experience
This section describes several AVI systems in the U.S. and describes actual experiences andpractices of the operating agencies. The Texas Department of Transportation (TxDOT) has helpedto develop the TranStar system in Houston which operates an AVI system in order to monitor trafficconditions, detect incidents, distribute travel information, and archive travel time data. TxDOT iscurrently developing an AVI system in San Antonio to monitor traffic conditions and detectincidents. The Washington State Transportation Center (TRAC) studied AVI use in Seattle’s PugetSound region in 1994. The TRANSCOM agency operates the TRANSMIT system in New Yorkand New Jersey to monitor traffic conditions with AVI technology. In addition, several AVIsystems are operated abroad, and system design criteria from these systems are useful for U.S.applications. The experiences of these agencies can provide useful support for designing andmanaging AVI systems and effectively collecting quality travel time data.
TranStar Traffic Monitoring System, Houston, Texas
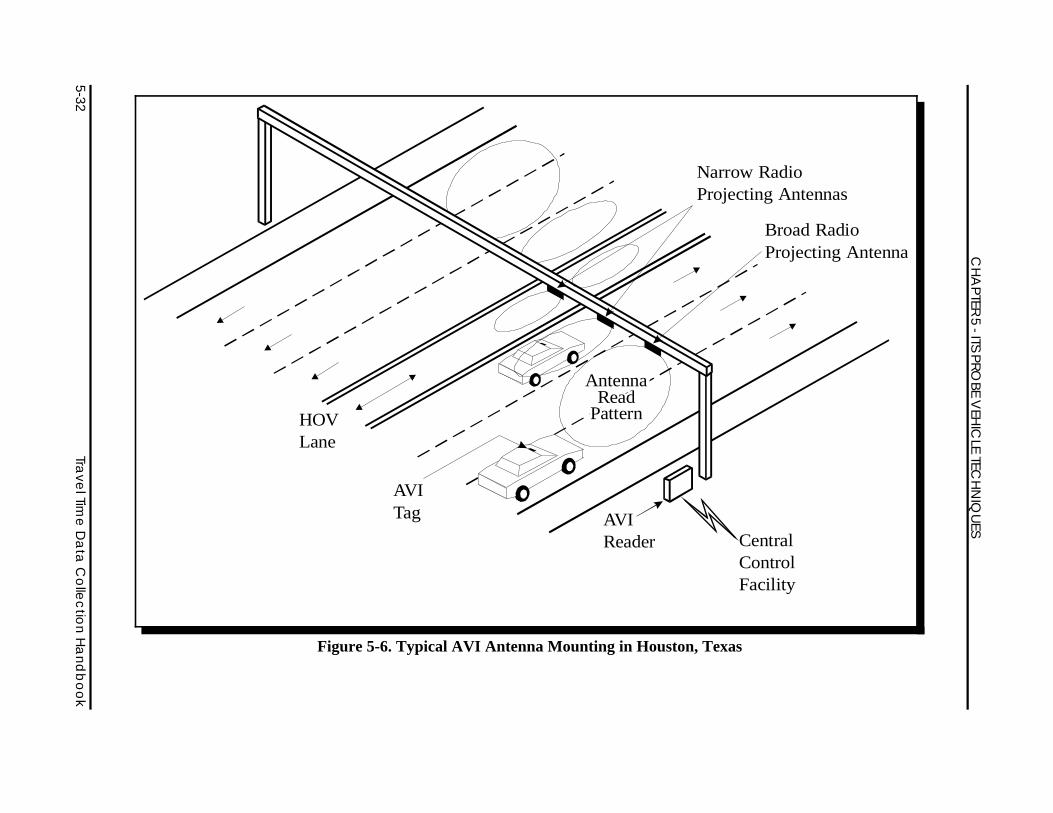
Antenna installation specifications - Antennas are mounted above traffic on existingroadway overpasses, overhead sign structures, or side-mount sign structures. Antennaspacing depends on the availability of existing structures, and spacings are typically 2 km(1.2 mi). The actual range of spacings is between 1.4 km (0.9 mi) and 10.8 km (6.7 mi)with an average of about 4.6 km (2.85 mi).
Antenna capture range setting - The Houston system uses two general antenna types. Oneantenna type emits a directional, narrow, and long RF capture range. These narrow bandprojecting antennas are mounted over high-occupancy vehicle (HOV) lanes and insidefreeway main lanes to prevent false reads from adjacent lanes. The second antenna typeemits a broader and shorter RF capture range, and these types are mounted over outsidefreeway main lanes. A typical installation configuration of these two antenna types isshown in Figure 5-6.
AntennaRead
Pattern
AVIReader
AVITag
HOVLane
CentralControlFacility
Broad RadioProjecting Antenna
Narrow RadioProjecting Antennas
CH
APTER
5 - ITS
PROBE
VEH
ICLE
TECH
NIQ
UES
5-32Tra
vel Tim
e D
ata
Co
llec
tion
Ha
nd
bo
ok
Figure 5-6. Typical AVI Antenna Mounting in Houston, Texas
CHAPTER 5 - ITS PROBE VEHICLE TECHNIQUES
Travel Time Data Collection Handbook 5-33
AVI tag distribution - Motorists traveling during the peak period were targeted to receiveelectronic tags from the Texas Department of Transportation (TxDOT) through arecruitment process. The system also relied upon vehicles equipped with ETC tags fromthe local toll authority to supplement peak period coverage and provide for off-peak periodcoverage. Over 200,000 tags have been distributed through the local automated tollcollection system (23) to date.
Probe vehicle driver recruitment - Citizens were reluctant to place an electronic trackingdevice in their vehicles. Volunteer drivers were sought through correspondence with largeemployers, advertising over news media, advertising on changeable message signs andtrailer message signs, and advertising on the Internet. The most effective method of driverrecruitment was through changeable message signs and trailer message signs along thefreeways. Signs identified an appropriate telephone number to seek an explanation of theAVI system.
Probe vehicle density/tag read frequency - When planning for the system, the target ratewas one probe vehicle or one tag read per antenna location per one minute. This target ratewas set because it required one minute to process field data to the central facility.Approximately five percent of the total volume passing antenna locations yield tag reads.This corresponds to approximately four tag reads per minute during peak periods and aboutthree tag reads per minute during off-peak periods. About 60 percent of the tag reads werecorrectly matched with tag reads at sequential antenna locations to yield a travel time datapoint.
Data archival - In the Houston AVI system, the travel time data are stored in an Oraclerelational database. Travel time data are stored in binary files, and one binary file is createdfor each 24-hour period (24). Daily files can be extracted from the archive in order toanalyze one day of data at a time.
Automatic Vehicle Identification System, San Antonio, Texas
The Texas Department of Transportation and the City of San Antonio are planning the developmentof a real-time traffic monitoring system using AVI technology.
Antenna spacing - Site selection for antennas was based partly on an analysis of volumeto capacity (v/c) ratios to determine the most congested areas of the freeway system. Thesecongested areas were ranked by congestion priority, and care was taken to ensure thatantenna distribution was balanced throughout the system.
Antennas were spaced at 1.6 km (1 mi) to 3.2 km (2 mi) intervals. Travel patterns wereconsidered to determine where the greatest number of tag reads would occur. Fieldevaluations were necessary to determine if antennas could be mounted on existingstructures. Mounting on existing structures can significantly reduce the installation costs.
CHAPTER 5 - ITS PROBE VEHICLE TECHNIQUES
5-34 Travel Time Data Collection Handbook
AVI tag distribution - Initially, it was decided to distribute AVI tags through the vehicleregistration process. However, the process of distributing tags through the registrationsystem and to motorists required one year which was beyond the system’s schedule.Approximately 80,000 tags will be distributed. This quantity was established based uponbudgetary constraints.
Tags were to be randomly distributed to large employers in the area. The system designerswere attempting to target motorists who traveled the corridors within the AVI coverage areaduring the peak hours. No record was to exist of any particular tag placed in any particularvehicle. Tag ID numbers were to be scrambled to prevent the ability to track individuals.
Data management and reduction equipment specifications included provisions for a 167MHZ computer, two 2.1 gigabyte hard drives, and 128 megabytes of random access memory(RAM) desktop memory.
New York/New Jersey TRANSMIT System
The TRANSCOM System for Managing Incidents and Traffic (TRANSMIT) system operates on29 km (18 mi) of the New York State Thruway and Garden State Parkway in New York and NewJersey. About 23 antenna locations are a part of the $1.4 million system.
The TRANSMIT system follows these guidelines:
C Antenna spacing of 2.4 km (1.5 mi) for maximum incident detection time of fiveminutes;
C Probe vehicle density specifications of 0.9 percent of total volume for two-lanehighways and 2.1 percent for three- and four-lane highways;
C One antenna used to cover all lanes in one direction; and
C Antenna mounting utilized existing overhead structures.
Puget Sound Region Study
The Washington State Transportation Center (TRAC) studied AVI use in Seattle’s Puget Soundregion in 1994. A combination of 50 electronic transmitters and 10 antenna units made up theinfrastructure. This system used an AVI loop detection type system with the 50 in-vehicletransmitters installed underneath the vehicle.
Sequential antenna spacing was between 1 and 4 km (0.62 to 2.5 mi) with an averagedistance of 2.6 km (1.61 mi) (23).
CHAPTER 5 - ITS PROBE VEHICLE TECHNIQUES
Travel Time Data Collection Handbook 5-35
European AVI Systems
Several AVI systems are operated abroad, and system design criteria from these systems are usefulfor U.S. applications. The Automatic Debiting Electronic Payment in Transport (ADEPT) projectis an electronic toll collection (ETC) system using two-way communications between in-vehicletags and roadside beacons (13). Type III tags, or “smart” tags contain vehicle identification, driver,financial, and other data. Toll transactions are processed within the in-vehicle tag. Since thesystem was designed to collect tolls, the accuracy and quality of data are very good with only onetag in 1,000,000 tags missed or incorrectly detected. Speeds as high as 140 km/h (87 mph) havebeen detected by the system. The main technical problem was ensuring that the system coulddistinguish between vehicles across multiple traffic lanes.
One estimation of AVI technology costs offered cost data based on two unique installations (13).The first installation technique requires that a single AVI antenna is required for each lane of trafficwith a cost of $8,200 for site installation. It was estimated that the cost of one antenna per lane was$1,600. The second installation technique assumes that one antenna covers an entire direction oftravel. For a two-directional roadway, two antennas are required per site at a cost of $3,200 inaddition to the $8,200 site installation charge. Communications costs were estimated based on atheoretical AVI system (13). The theoretical system’s infrastructure covered 450 directional linksof multi-lane roadways carrying 75,000 vehicle per day, 750 directional links of four-lane roadwayscarrying 50,000 vehicles per day, and 750 directional lanes of two-lane roadways carrying 25,000vehicles per day.
The most cost-effective method to provide communication links to antenna sites was ISDN lines.It was estimated that the annual costs of ISDN communications for the theoretical AVI systemwould be $1,100,000 in addition to installation fees. Annual leased-line costs for the same systemwere estimated at $5,400,000 plus $2,800,000 for installation. Annual radio data communicationscosts for the same system were estimated at $9,500,000.
An AVI system on the Oslo toll ring in Norway collects data from 400,000 probe vehicles (25). Thesystem has been especially sensitive to Norwegian privacy legislation, such as the Personal DataRegister Act of 1978. Under this law, a record of AVI tag identity is defined as a personal dataregister, and the unique seven digit tag ID was truncated to the last three digits. This truncationallowed the vehicles to remain anonymous and records were no longer defined as personal datafiles.
The Oslo toll ring AVI system tracks vehicles, calculates travel times between antennas, andaverages travel times every five minutes for each section within the field reader units. The averagedtravel time data are transmitted every five minutes to a traffic control center. Maximum volumesat test sites are about 1,200 to 1,400 vehicles per lane per hour, or about 100 to 120 vehicles perfive-minute interval. Since one-third of the total traffic population is equipped with AVI tags, about30 to 35 probe vehicles are recorded every five minutes during maximum volume at test sites.However, about 20 vehicles pass test sites every five minutes on average (25).
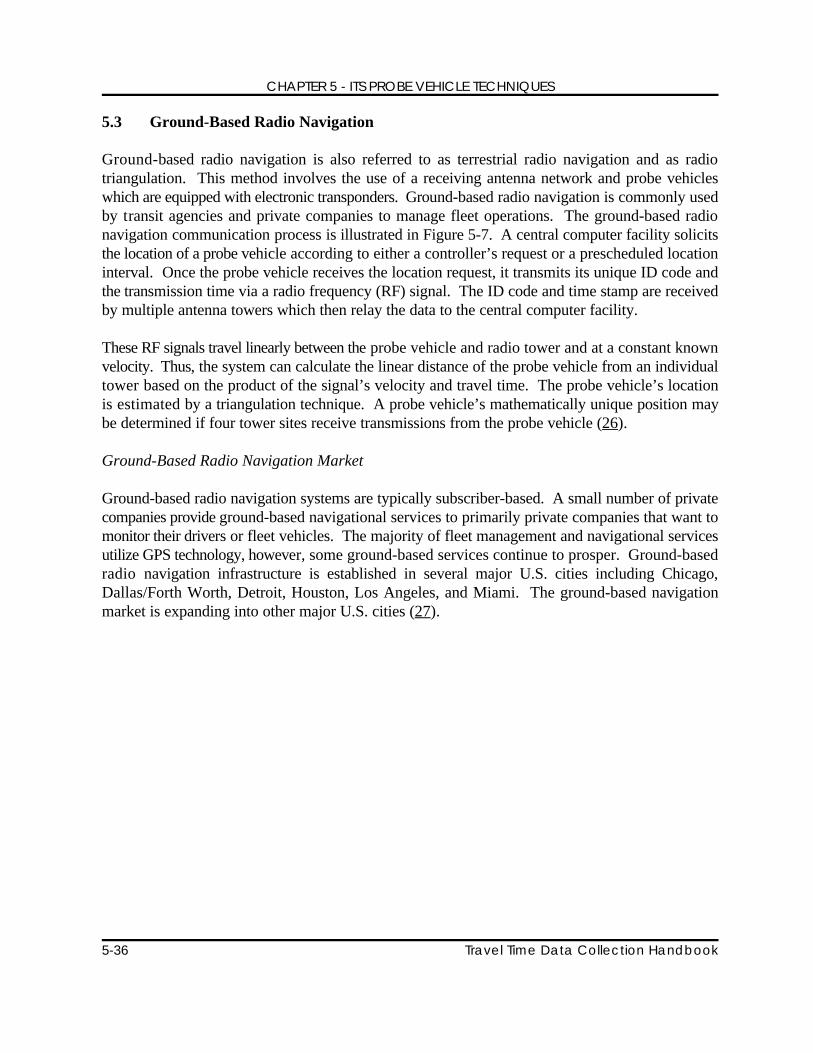
CHAPTER 5 - ITS PROBE VEHICLE TECHNIQUES
5-36 Travel Time Data Collection Handbook
5.3 Ground-Based Radio Navigation
Ground-based radio navigation is also referred to as terrestrial radio navigation and as radiotriangulation. This method involves the use of a receiving antenna network and probe vehicleswhich are equipped with electronic transponders. Ground-based radio navigation is commonly usedby transit agencies and private companies to manage fleet operations. The ground-based radionavigation communication process is illustrated in Figure 5-7. A central computer facility solicitsthe location of a probe vehicle according to either a controller’s request or a prescheduled locationinterval. Once the probe vehicle receives the location request, it transmits its unique ID code andthe transmission time via a radio frequency (RF) signal. The ID code and time stamp are receivedby multiple antenna towers which then relay the data to the central computer facility.
These RF signals travel linearly between the probe vehicle and radio tower and at a constant knownvelocity. Thus, the system can calculate the linear distance of the probe vehicle from an individualtower based on the product of the signal’s velocity and travel time. The probe vehicle’s locationis estimated by a triangulation technique. A probe vehicle’s mathematically unique position maybe determined if four tower sites receive transmissions from the probe vehicle (26).
Ground-Based Radio Navigation Market
Ground-based radio navigation systems are typically subscriber-based. A small number of privatecompanies provide ground-based navigational services to primarily private companies that want tomonitor their drivers or fleet vehicles. The majority of fleet management and navigational servicesutilize GPS technology, however, some ground-based services continue to prosper. Ground-basedradio navigation infrastructure is established in several major U.S. cities including Chicago,Dallas/Forth Worth, Detroit, Houston, Los Angeles, and Miami. The ground-based navigationmarket is expanding into other major U.S. cities (27).
Ground-BasedRadio Tower
Vehicle I.D.Time Stamp
VehicleLocationRequest
Vehicle I.D.Time Stamp
Vehicle I.D.Time Stamp
CentralComputer
VehicleLocation Unit
Vehicle I.D.Time Stamp
Trave
l Time
Da
ta C
olle
ctio
n H
an
db
oo
k5-37
CH
APTER
5 - ITS
PROBE
VEH
ICLE
TECH
NIQ
UES
Figure 5-7. Ground-Based Radio Navigation Communication Process
CHAPTER 5 - ITS PROBE VEHICLE TECHNIQUES
5-38 Travel Time Data Collection Handbook
5.3.1 Advantages and Disadvantages
The advantages of ground-based radio navigation for travel time collection (relative to other ITSprobe vehicle techniques) are:
C Low start-up cost data collection approach compared to other probe vehiclemethods if ground-based radio navigation service is available in your area.
C Expanding market means more widespread use of technology.
C Relatively simple data collection if a ground-based location service provider isavailable in your area.
The disadvantages of ground-based radio navigation for travel time collection (relative to other ITSprobe vehicle techniques) are:
C Low precision - The accuracy of the locating system is between 15 to 46 m (50 to150 ft), and errors as high as several hundred meters have been reported. Accuracyis affected by the topography of the land and mounting and power setting of the in-vehicle equipment.
C Antiquated technology - Ground-based radio navigation technology is lesssophisticated and less precise than GPS technologies.
C Dense urban areas - RF signals can have difficulty penetrating in urban areas.Radio tower infrastructure can be difficult to mount in dense urban areas.
C Non-representative data - Technology is typically used by commercial vehicles ortransit agencies. Thus, travel time data collected from these agencies may be biasedtowards transit or commercial drivers or vehicles and may not represent the drivingpopulation.
C Privately-owned data - Ground-based navigation systems are mainly operated byprivate companies. If you wish to utilize data collected from an outside party, thecompany must agree to provide data access.
C Small market - Ground-based radio navigation is currently available in only selectcities, and is feasible in only dense urban areas with large market potential.
C Driver recruitment - May need to recruit volunteers to drive probe vehiclesdepending on the size and scope of the study.
CHAPTER 5 - ITS PROBE VEHICLE TECHNIQUES
Travel Time Data Collection Handbook 5-39
5.3.2 Cost and Equipment Requirements
The ground-based radio navigation data collection process requires the equipment listed below. Asdescribed previously, since probe vehicle systems are often installed initially for uses unrelated totravel time data collection, other agencies interested in the system may aid in subsidizing the costsof the system.
C In-Vehicle Transponders - Transponders may be installed within approximately30 minutes, depending upon the installer. The entire in-vehicle AVL unit consistsof a control unit (about the size of a video cassette) and a pancake-shaped antenna.The control unit must be connected to the vehicle’s ignition and is typically mountedunderneath the steering column. The unit detects when a trip has begun or endedbased on when the ignition has been triggered or terminated.
C Personal Computer Workstation - A 386 microprocessor has proven sufficient torun the proprietary software package. The personal computer must have a high-speed (14,400 bps) modem connection to the service provider.
C Proprietary Software - Since the service is provided by a private company,software is typically proprietary and is provided upon subscription to the service.Software requires a DOS operating system and the map database files for thecoverage area. The software is typically configured to request the locations ofvehicles every 30 seconds when ignition is on and every 5 minutes when ignition isoff. The software can write data to an ASCII text file, and location data can be ina longitude/latitude format or in a street/nearest cross street format (26).
C Software Training - Relatively simple and can be done within one day.
C Service Start-Up Costs - A fee must be paid to the service provider to initiateservice. This fee can cost as much as several thousand dollars depending upon thesize of the study. However, public institutions have been given discounts.
C Monthly Service Costs - A monthly fee is charged in addition to the start-up costs.This fee typically runs about several hundred dollars for in-vehicle equipment rentaland services.
C Supervision and Management - Required to obtain and reduce the data.
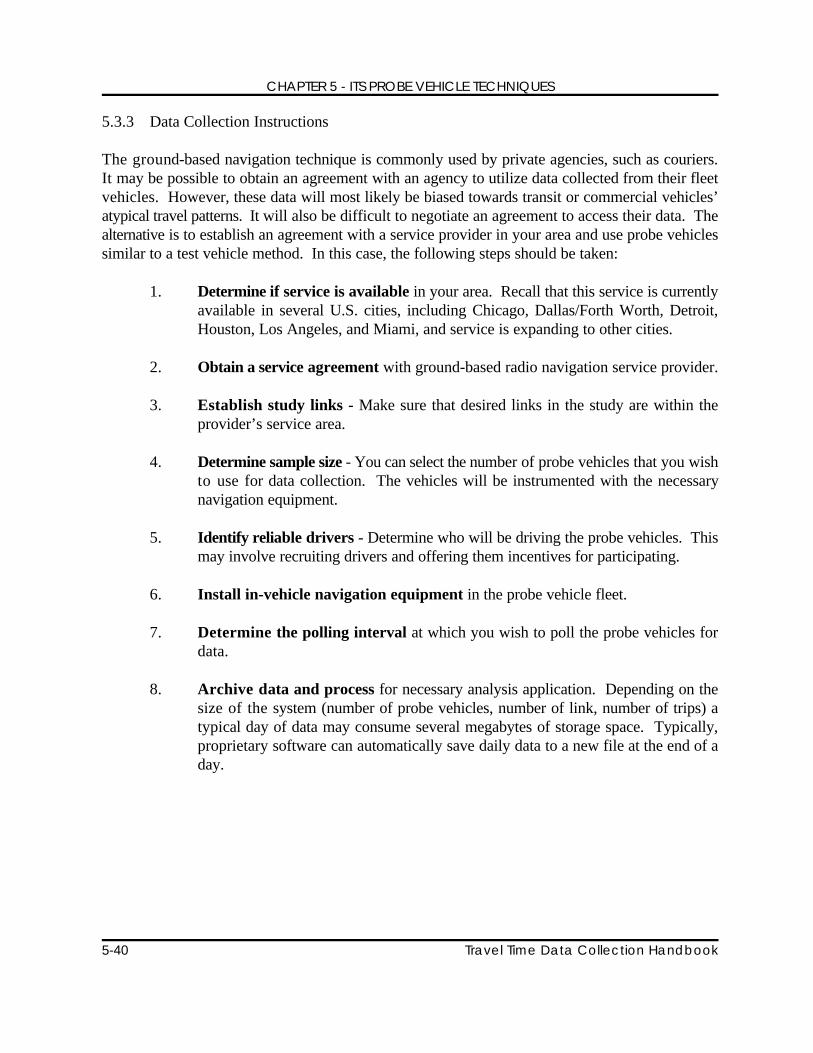
CHAPTER 5 - ITS PROBE VEHICLE TECHNIQUES
5-40 Travel Time Data Collection Handbook
5.3.3 Data Collection Instructions
The ground-based navigation technique is commonly used by private agencies, such as couriers.It may be possible to obtain an agreement with an agency to utilize data collected from their fleetvehicles. However, these data will most likely be biased towards transit or commercial vehicles’atypical travel patterns. It will also be difficult to negotiate an agreement to access their data. Thealternative is to establish an agreement with a service provider in your area and use probe vehiclessimilar to a test vehicle method. In this case, the following steps should be taken:
1. Determine if service is available in your area. Recall that this service is currentlyavailable in several U.S. cities, including Chicago, Dallas/Forth Worth, Detroit,Houston, Los Angeles, and Miami, and service is expanding to other cities.
2. Obtain a service agreement with ground-based radio navigation service provider.
3. Establish study links - Make sure that desired links in the study are within theprovider’s service area.
4. Determine sample size - You can select the number of probe vehicles that you wishto use for data collection. The vehicles will be instrumented with the necessarynavigation equipment.
5. Identify reliable drivers - Determine who will be driving the probe vehicles. Thismay involve recruiting drivers and offering them incentives for participating.
6. Install in-vehicle navigation equipment in the probe vehicle fleet.
7. Determine the polling interval at which you wish to poll the probe vehicles fordata.
8. Archive data and process for necessary analysis application. Depending on thesize of the system (number of probe vehicles, number of link, number of trips) atypical day of data may consume several megabytes of storage space. Typically,proprietary software can automatically save daily data to a new file at the end of aday.
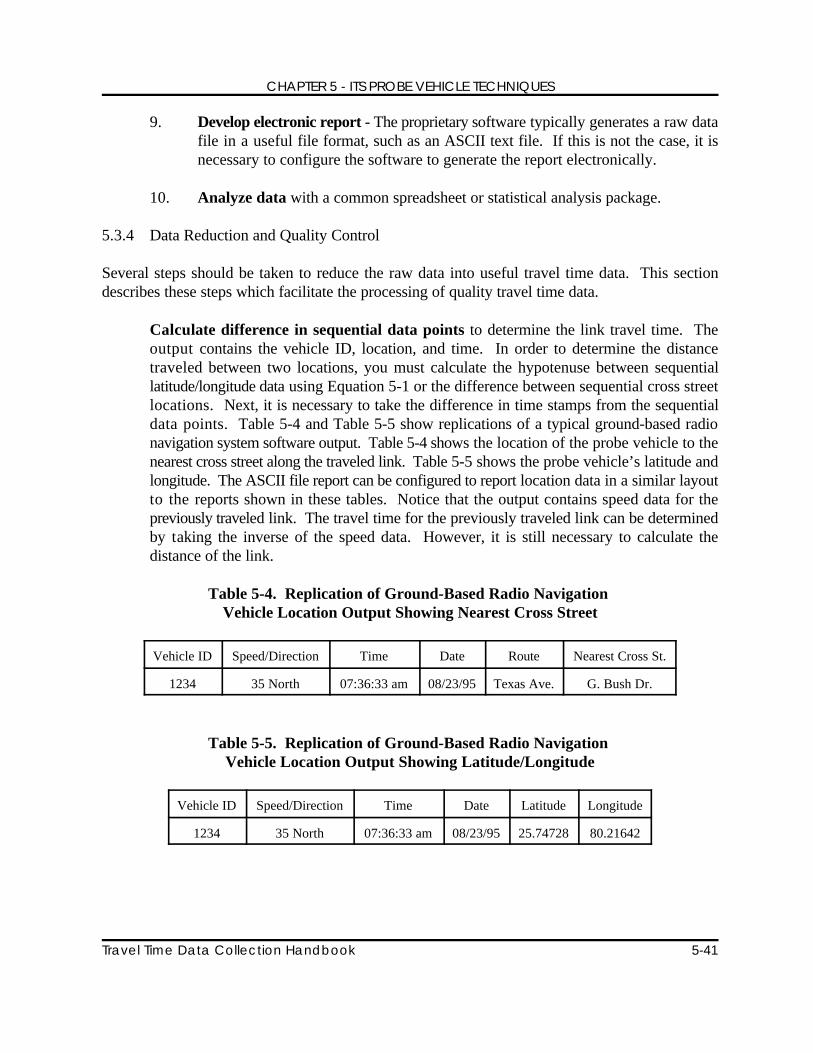
CHAPTER 5 - ITS PROBE VEHICLE TECHNIQUES
Travel Time Data Collection Handbook 5-41
9. Develop electronic report - The proprietary software typically generates a raw datafile in a useful file format, such as an ASCII text file. If this is not the case, it isnecessary to configure the software to generate the report electronically.
10. Analyze data with a common spreadsheet or statistical analysis package.
5.3.4 Data Reduction and Quality Control
Several steps should be taken to reduce the raw data into useful travel time data. This sectiondescribes these steps which facilitate the processing of quality travel time data.
Calculate difference in sequential data points to determine the link travel time. Theoutput contains the vehicle ID, location, and time. In order to determine the distancetraveled between two locations, you must calculate the hypotenuse between sequentiallatitude/longitude data using Equation 5-1 or the difference between sequential cross streetlocations. Next, it is necessary to take the difference in time stamps from the sequentialdata points. Table 5-4 and Table 5-5 show replications of a typical ground-based radionavigation system software output. Table 5-4 shows the location of the probe vehicle to thenearest cross street along the traveled link. Table 5-5 shows the probe vehicle’s latitude andlongitude. The ASCII file report can be configured to report location data in a similar layoutto the reports shown in these tables. Notice that the output contains speed data for thepreviously traveled link. The travel time for the previously traveled link can be determinedby taking the inverse of the speed data. However, it is still necessary to calculate thedistance of the link.
Table 5-4. Replication of Ground-Based Radio Navigation Vehicle Location Output Showing Nearest Cross Street
Vehicle ID Speed/Direction Time Date Route Nearest Cross St.
1234 35 North 07:36:33 am 08/23/95 Texas Ave. G. Bush Dr.
Table 5-5. Replication of Ground-Based Radio Navigation Vehicle Location Output Showing Latitude/Longitude
Vehicle ID Speed/Direction Time Date Latitude Longitude
1234 35 North 07:36:33 am 08/23/95 25.74728 80.21642
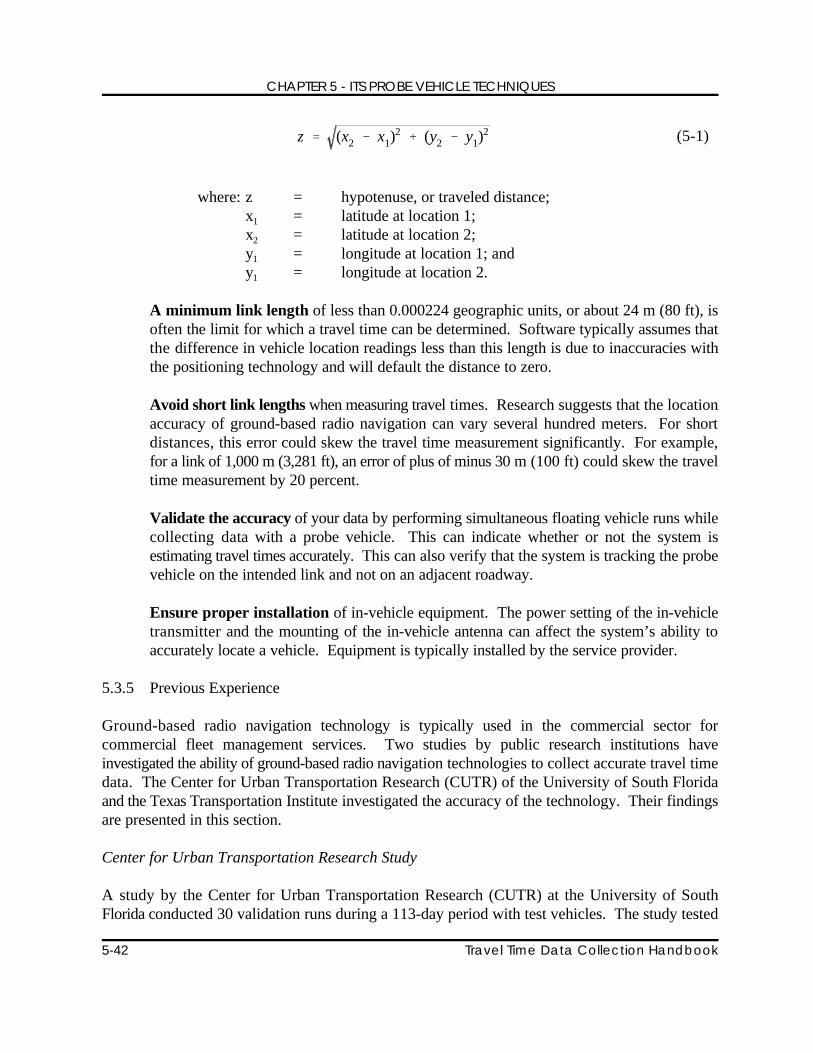
z ' (x2 & x1)2 % (y2 & y1)
2
CHAPTER 5 - ITS PROBE VEHICLE TECHNIQUES
5-42 Travel Time Data Collection Handbook
(5-1)
where: z = hypotenuse, or traveled distance;x = latitude at location 1;1
x = latitude at location 2;2
y = longitude at location 1; and1
y = longitude at location 2.1
A minimum link length of less than 0.000224 geographic units, or about 24 m (80 ft), isoften the limit for which a travel time can be determined. Software typically assumes thatthe difference in vehicle location readings less than this length is due to inaccuracies withthe positioning technology and will default the distance to zero.
Avoid short link lengths when measuring travel times. Research suggests that the locationaccuracy of ground-based radio navigation can vary several hundred meters. For shortdistances, this error could skew the travel time measurement significantly. For example,for a link of 1,000 m (3,281 ft), an error of plus of minus 30 m (100 ft) could skew the traveltime measurement by 20 percent.
Validate the accuracy of your data by performing simultaneous floating vehicle runs whilecollecting data with a probe vehicle. This can indicate whether or not the system isestimating travel times accurately. This can also verify that the system is tracking the probevehicle on the intended link and not on an adjacent roadway.
Ensure proper installation of in-vehicle equipment. The power setting of the in-vehicletransmitter and the mounting of the in-vehicle antenna can affect the system’s ability toaccurately locate a vehicle. Equipment is typically installed by the service provider.
5.3.5 Previous Experience
Ground-based radio navigation technology is typically used in the commercial sector forcommercial fleet management services. Two studies by public research institutions haveinvestigated the ability of ground-based radio navigation technologies to collect accurate travel timedata. The Center for Urban Transportation Research (CUTR) of the University of South Floridaand the Texas Transportation Institute investigated the accuracy of the technology. Their findingsare presented in this section.
Center for Urban Transportation Research Study
A study by the Center for Urban Transportation Research (CUTR) at the University of SouthFlorida conducted 30 validation runs during a 113-day period with test vehicles. The study tested
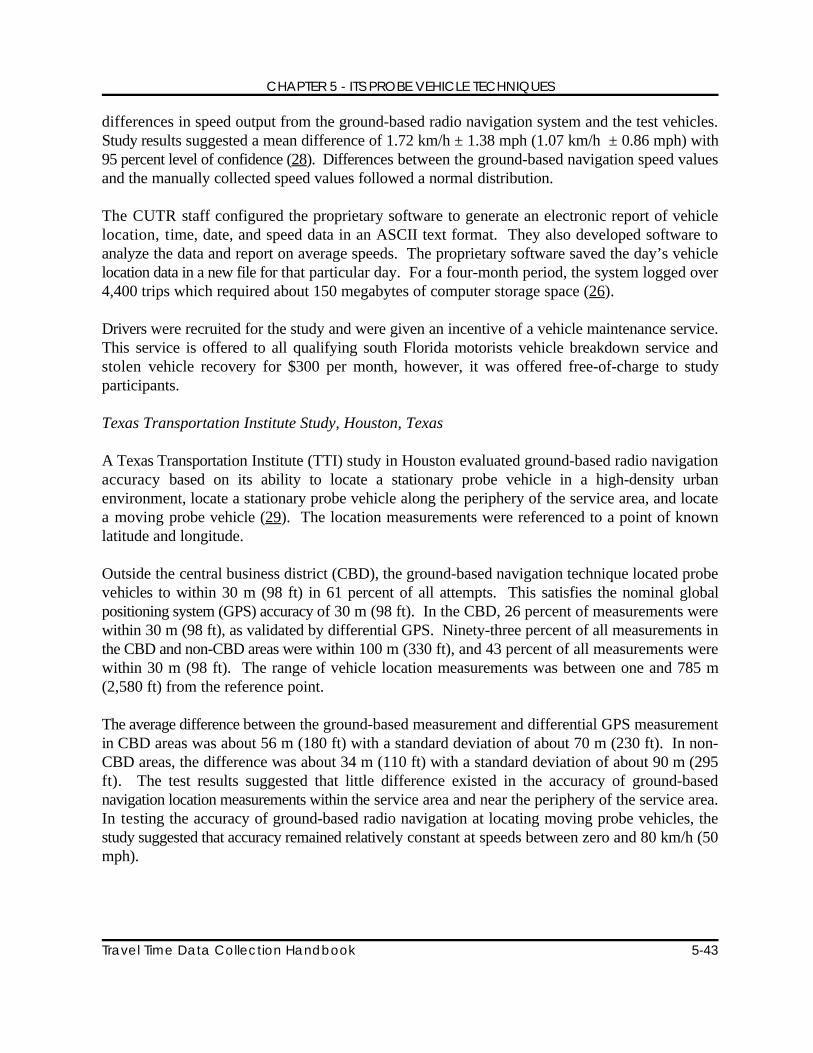
CHAPTER 5 - ITS PROBE VEHICLE TECHNIQUES
Travel Time Data Collection Handbook 5-43
differences in speed output from the ground-based radio navigation system and the test vehicles.Study results suggested a mean difference of 1.72 km/h ± 1.38 mph (1.07 km/h ± 0.86 mph) with95 percent level of confidence (28). Differences between the ground-based navigation speed valuesand the manually collected speed values followed a normal distribution.
The CUTR staff configured the proprietary software to generate an electronic report of vehiclelocation, time, date, and speed data in an ASCII text format. They also developed software toanalyze the data and report on average speeds. The proprietary software saved the day’s vehiclelocation data in a new file for that particular day. For a four-month period, the system logged over4,400 trips which required about 150 megabytes of computer storage space (26).
Drivers were recruited for the study and were given an incentive of a vehicle maintenance service.This service is offered to all qualifying south Florida motorists vehicle breakdown service andstolen vehicle recovery for $300 per month, however, it was offered free-of-charge to studyparticipants.
Texas Transportation Institute Study, Houston, Texas
A Texas Transportation Institute (TTI) study in Houston evaluated ground-based radio navigationaccuracy based on its ability to locate a stationary probe vehicle in a high-density urbanenvironment, locate a stationary probe vehicle along the periphery of the service area, and locatea moving probe vehicle (29). The location measurements were referenced to a point of knownlatitude and longitude.
Outside the central business district (CBD), the ground-based navigation technique located probevehicles to within 30 m (98 ft) in 61 percent of all attempts. This satisfies the nominal globalpositioning system (GPS) accuracy of 30 m (98 ft). In the CBD, 26 percent of measurements werewithin 30 m (98 ft), as validated by differential GPS. Ninety-three percent of all measurements inthe CBD and non-CBD areas were within 100 m (330 ft), and 43 percent of all measurements werewithin 30 m (98 ft). The range of vehicle location measurements was between one and 785 m(2,580 ft) from the reference point.
The average difference between the ground-based measurement and differential GPS measurementin CBD areas was about 56 m (180 ft) with a standard deviation of about 70 m (230 ft). In non-CBD areas, the difference was about 34 m (110 ft) with a standard deviation of about 90 m (295ft). The test results suggested that little difference existed in the accuracy of ground-basednavigation location measurements within the service area and near the periphery of the service area.In testing the accuracy of ground-based radio navigation at locating moving probe vehicles, thestudy suggested that accuracy remained relatively constant at speeds between zero and 80 km/h (50mph).
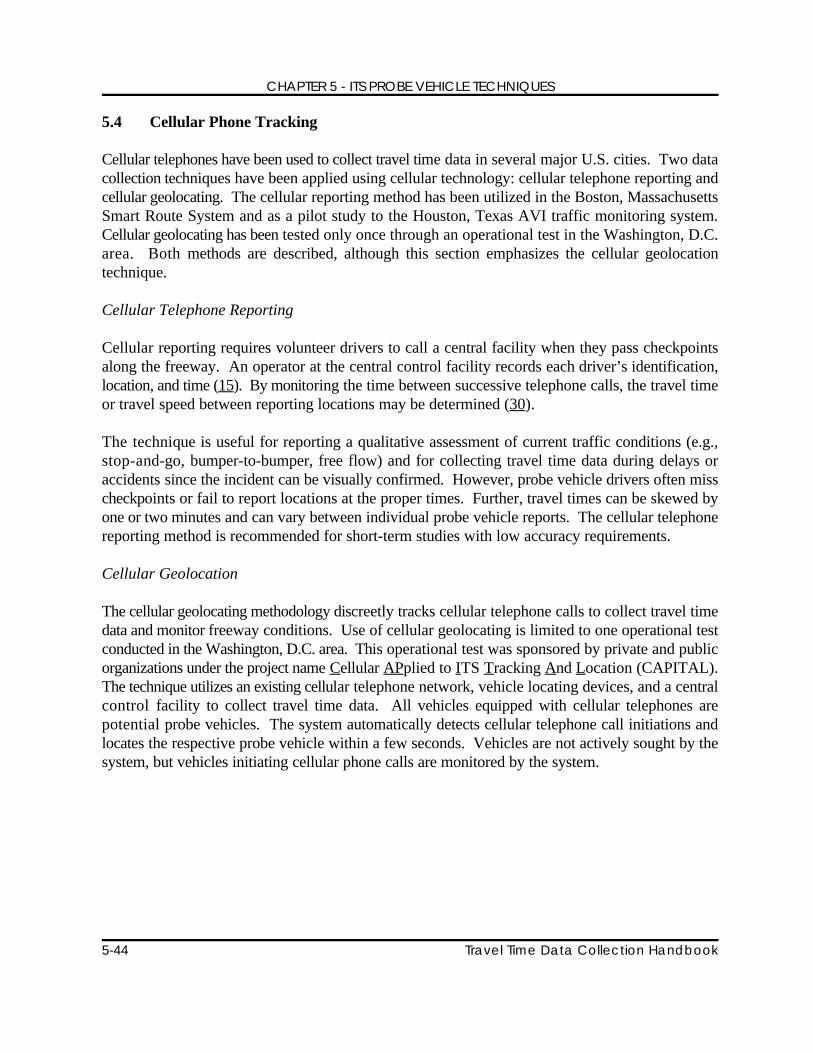
CHAPTER 5 - ITS PROBE VEHICLE TECHNIQUES
5-44 Travel Time Data Collection Handbook
5.4 Cellular Phone Tracking
Cellular telephones have been used to collect travel time data in several major U.S. cities. Two datacollection techniques have been applied using cellular technology: cellular telephone reporting andcellular geolocating. The cellular reporting method has been utilized in the Boston, MassachusettsSmart Route System and as a pilot study to the Houston, Texas AVI traffic monitoring system.Cellular geolocating has been tested only once through an operational test in the Washington, D.C.area. Both methods are described, although this section emphasizes the cellular geolocationtechnique.
Cellular Telephone Reporting
Cellular reporting requires volunteer drivers to call a central facility when they pass checkpointsalong the freeway. An operator at the central control facility records each driver’s identification,location, and time (15). By monitoring the time between successive telephone calls, the travel timeor travel speed between reporting locations may be determined (30).
The technique is useful for reporting a qualitative assessment of current traffic conditions (e.g.,stop-and-go, bumper-to-bumper, free flow) and for collecting travel time data during delays oraccidents since the incident can be visually confirmed. However, probe vehicle drivers often misscheckpoints or fail to report locations at the proper times. Further, travel times can be skewed byone or two minutes and can vary between individual probe vehicle reports. The cellular telephonereporting method is recommended for short-term studies with low accuracy requirements.
Cellular Geolocation
The cellular geolocating methodology discreetly tracks cellular telephone calls to collect travel timedata and monitor freeway conditions. Use of cellular geolocating is limited to one operational testconducted in the Washington, D.C. area. This operational test was sponsored by private and publicorganizations under the project name Cellular APplied to ITS Tracking And Location (CAPITAL).The technique utilizes an existing cellular telephone network, vehicle locating devices, and a centralcontrol facility to collect travel time data. All vehicles equipped with cellular telephones arepotential probe vehicles. The system automatically detects cellular telephone call initiations andlocates the respective probe vehicle within a few seconds. Vehicles are not actively sought by thesystem, but vehicles initiating cellular phone calls are monitored by the system.
CHAPTER 5 - ITS PROBE VEHICLE TECHNIQUES
Travel Time Data Collection Handbook 5-45
An illustration of cellular geolocation communications are shown in Figure 5-8. The systemsearches for vehicles initiating cellular telephone calls by processing the cellular reverse controlchannels (phone-to-tower) and identifying when a mobile telephone transmits a message.Simultaneously, the forward control channel (tower-to-phone) is examined for the assignment ofcommunication channels to mobile telephones. The geolocating component of the system identifieswhen a cellular telephone transmits a call initiation message. Direction finding equipment locatedat multiple sites in the area determine the origin of the telephone call.
The probe vehicles’ locations are determined by a combination of lines of bearing and timedifference of arrival calculations by the direction finding system to geolocate a vehicle (31).Intersecting lines of bearing are used to triangulate probe vehicles’ locations. Time-difference-of-arrival method calculates the location based on signal propagation times between the vehicle andnearby cellular towers. The system has the capability of tracking the cellular activity of probevehicles even as the vehicle passes through multiple cell sites and when the telephone call switchescellular channels.
The probe vehicle’s location is passed to a traffic information module. By repeating the processevery five to seven seconds, sufficient data are generated in 30 to 50 seconds to provide an accurateestimate of the probe vehicle’s velocity (32).
Future Direction of Cellular Technology
The Federal Communications Commission (FCC) has adopted a Report and Order which developsrules to govern the implementation of Enhanced 911 (E911) calls for wireless, or cellular, services(33). The ruling requires cellular providers to be capable of relaying the location of the base stationor cell site receiving a 911 call to an appropriate Public Safety Answering Point (PSAP). They willalso be required to provide the location of the mobile station, or cellular telephone, to the PSAP intwo dimensions with an accuracy within a 125 m (410 ft) radius in 67 percent of all instances.These changes are to be implemented over the next several years.
The locations of the cellular telephones will be determined by time difference of arrival techniques(34). These are the techniques used in cellular geolocating methods to collect travel time data.These changes in the cellular industry can affect the feasibility of collecting travel time data cost-effectively since similar service can be used for other codes, such as 555.
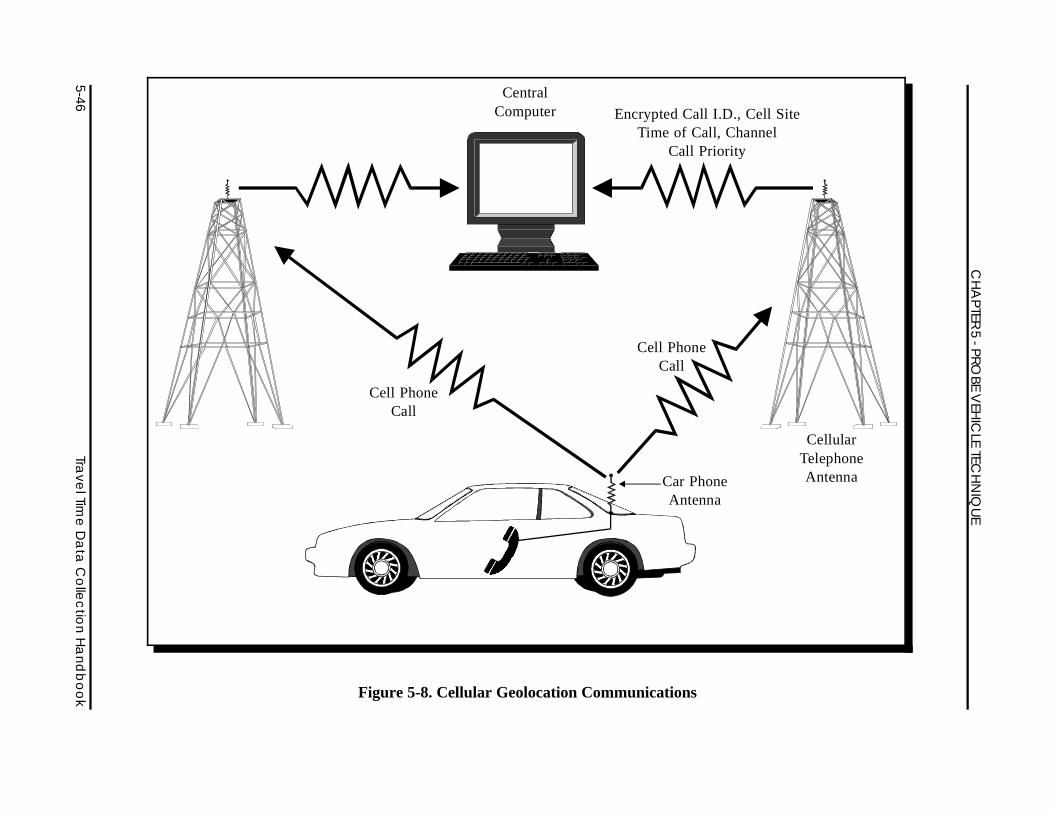
CellularTelephoneAntenna
Encrypted Call I.D., Cell SiteTime of Call, Channel
Call Priority
Cell PhoneCall
Cell PhoneCall
CentralComputer
Car PhoneAntenna
5-46Tra
vel Tim
e D
ata
Co
llec
tion
Ha
nd
bo
ok
CH
APTER
5 - PRO
BE V
EHIC
LE TEC
HN
IQU
E
Figure 5-8. Cellular Geolocation Communications
CHAPTER 5 - ITS PROBE VEHICLE TECHNIQUES
Travel Time Data Collection Handbook 5-47
5.4.1 Advantages and Disadvantages
The advantages of cellular geolocating for travel time collection (relative to other ITS probevehicle techniques) are:
C Driver recruitment not necessary - The system utilizes samples from the existingpopulation of vehicles equipped with cellular telephones. It is not necessary torecruit volunteers or designate personnel to collect data.
C No in-vehicle equipment to install.
C Large potential sample - Studies have suggested that cellular telephone useincreases as congestion increases (35). As cellular telephone ownership increases,the number of potential probe vehicles increases.
The disadvantages of cellular geolocating for travel time collection (relative to other ITS probevehicle techniques) are:
C Experimental technology - To date, cellular geolocating has been tested only oncethrough the CAPITAL Operational Test in the Washington, D.C. area.
C Privacy issues - The nature of cellular geolocating may offend persons concernedthat cellular telephone calls may be monitored and that their vehicles may betracked.
C Infrastructure dependent - Since the system is constrained by existing cellularinfrastructure, it is impractical to readily modify the study area for data collection.Extending or adjusting the study area requires moving cellular towers and/or thegeolocating equipment. Study is limited to links within the coverage area of thecellular network.
C Cellular phone use dependent - Travel time data collection can break down duringperiods of low cellular telephone use.
C Low accuracy - Testing of this technology has suggested it is adequate fordetermining if a probe vehicle is on a particular road, however, it was shown to beaccurate at estimating travel times in 20 percent of all instances. Often geolocatinga vehicle’s position is impaired by topography and line of sight barriers. Testing ofthe geolocating system reported average geolocating errors between 107 to 650meters (351 to 2,133 feet) (31).
CHAPTER 5 - ITS PROBE VEHICLE TECHNIQUES
5-48 Travel Time Data Collection Handbook
C Potentially biased sample - Sample is biased towards motorists which have and usecellular telephones. There may exist personality aspects of cellular phone userswhich may or may not affect driving behavior.
5.4.2 Cost and Equipment Requirements
All information on the cost of equipment for cellular geolocation is based on the findings of theCAPITAL Operational Test. Much of the total system cost was attributed to research anddevelopment of the technology. The CAPITAL study assessed the capital and installationinvestments; however, operational and maintenance costs are not known.
A cellular geolocating system requires the presence of a cellular infrastructure of cellular towers andvehicles equipped with cellular telephones. It is also necessary to establish permission to utilizethe cellular network from the cellular system operator. The CAPITAL system consisted of twoprimary components that were necessary to collect probe vehicle data: a geolocation componentand a traffic information component.
Geolocation Component
This component is responsible for recognizing cellular calls, monitoring call switching betweencellular channels, prioritizing calls, and calculating geolocations, lines of bearing, and time-differences-of-arrivals for signals. The geolocation component contains specially designed arraysof antennas and electronic equipment which monitor call initiation signals from cellular phones toprovide directions from the cell towers to the telephone locations. Signals from multiple towers areused to derive latitude and longitude of phone locations. Within the geolocation component areseveral subcomponents, which utilize various equipment to perform the necessary geolocationcomponent tasks. The three sub-components and the respective equipment requirements are (31):
C Transmission Alert System - This element was responsible for identifying newcalls and alerting the geolocation control system with call data. This subcomponentcosts approximately $200,000 per unit, including equipment and installation costs(31). The Transmission Alert System requires:
C Wideband cellular call receivers; andC Digital narrowband cellular call receivers.
C Geolocation Control System - This subcomponent is needed for calculating thegeolocation of probe vehicles. The installation and equipment costs for thissubcomponent are approximately $150,000 (31). It requires personal computers.
C Direction Finding System - This subcomponent is necessary for calculating thelines of bearing and time differences in arrival of signals. One such system cost$310,000 (31). The directional finding equipment are installed at existing cellular
CHAPTER 5 - ITS PROBE VEHICLE TECHNIQUES
Travel Time Data Collection Handbook 5-49
tower sites. Some electronic equipment must be housed in an environmentallycontrolled structure. It requires:
C eight-element antennas;C math processor;C Octal digital receiver;C synchronized system clocks (accurate within 100 nanosecond); andC GPS receiver.
Traffic Information Component
A central facility receives all data and processes them into useful travel information. Thiscomponent is responsible for determining the locations, travel times, and speeds of probe vehicles.
5.4.3 System Design Considerations
This section describes several issues which can affect the quality of travel time data. These arepotentially problematic issues which should be addressed in the design of a cellular geolocationsystem.
Insufficient signal strengths - Cellular service providers are required to use certainamounts of the radio spectrum. A provider’s usable radio spectrum is divided into channels.Each call requires two channels: receive and transmit. In areas with large cellular servicedemands, the cellular network is designed to reuse channels by managing the power anddirection of signals from the tower to the telephone and managing the power of the signalfrom the telephone to the tower. An ideal power level is strong enough for calls to beinterpreted yet weak enough to prevent cross-talking between phones in different cells usingthe same channel. Reusing channels is more critical as cellular telephone use increases.Additional antennas are installed and signal strength is further weakened to avoid cross-talk.
Insufficient tower infrastructure - If signal strength is too weak, the existing towerinfrastructure may be insufficient to interpret signals for accurate geolocation. Theinstallation of additional tower sites may be necessary. The use of directional antennas, asopposed to omni-directional, restricts the ability to interpret signals, as well.
Observe legal issues - Use of this type system should comply with the TelephoneDisclosure and Disputes Resolution Act and Federal Communications Commission (FCC)Docket 93-1 which implements that act given that the phone call receiving equipment isused under contract with the federal government and in concert with licensed cellularproviders.
Observe privacy issues - The identity of telephone numbers or electronic serial numbersshould not be accessible to anyone operating the system. Voice conversations should not
CHAPTER 5 - ITS PROBE VEHICLE TECHNIQUES
5-50 Travel Time Data Collection Handbook
be monitored. The system can function even if transmissions are assigned random orencrypted identification numbers which do not allow specific caller information to beobtained.
5.4.4 Data Reduction and Quality Control
This section describes several problems which can occur when geolocating vehicles. Theseproblems have been encountered in previous cellular geolocation studies (35). Data collection ofquality travel time data can be impaired by:
C Bridge structures - it can be difficult to interpret the altitude of a probe vehicle todetermine if it is atop or underneath a bridge structure.
C Adjacent roadways - the location system does not have pin-point accuracy, and itcan be difficult to determine if vehicles are on adjacent roadways to the freeway.
C Roadside emergency phones - it is necessary to identify if a call is coming froma roadside emergency phone or roadside cellular phone.
5.4.5 Previous Experience
The CAPITAL operational test in the Washington, D.C. area is the only identifiable case of cellulargeolocation. This section presents the data flow involved in the data collection process and alsomore detailed descriptions of design considerations.
In the CAPITAL project, the travel time data collection process involved four basic steps:
1. Call initiation received by geolocation control system and a message sent to thetraffic information center containing the following data:
C time stamp;C encrypted ID number;C latitude and longitude;C information on whether or not a 911 call was initiated;C flag to indicate if call was initiated within boundary of study;C sector number indicating specific area of cell tower; andC confidence factor of the latitude/longitude accuracy.
2. Traffic information center receives data. If data is within bounds, it is not discardedand the system determines if the phone is on a mapped traffic link. If the phone isnot on a map link, monitoring is stopped. If the vehicle is on a map link, additionalgeolocating is performed to more accurately determine its location. At this point,
CHAPTER 5 - ITS PROBE VEHICLE TECHNIQUES
Travel Time Data Collection Handbook 5-51
direction is unknown, however, it is determined that the vehicle is on eitherdirectional link.
3. The geolocation system performs additional geolocation functions and the receiveddata are sent to the traffic information system.
4. When the traffic information system receives the second geolocation data packageon an identified phone ID, the direction of the vehicle is determined and the travelspeed is calculated based on the vehicle’s travel time between two locations on thelink.
Static geolocation accuracy tests were conducted at several locations of known latitude andlongitude (U.S. Geological Survey markers and state benchmarks). With a sample of 24 static testlocations tested during four days, the errors in geolocation accuracy fell between 107 m (350 ft) and649 m (2,130 ft) (31). Differential GPS units served as a comparison to the cellular geolocationresults. The error was defined as the difference between the cellular geolocation data and thedifferential GPS data. The poor location accuracy was attributed to topographic interference andline-of-sight problems.
The system’s ability to estimate average speeds was tested in a comparison of system output to testvehicle output. Study results suggested that reasonable speeds were estimated only 20 percent ofthe time (31). Reasonable speeds were those determined similar to results from test vehicle runs.
University of Technology, Sydney, Australia
A recent study at the University of Technology in Sydney, Australia evaluated the use of MobileTelephone Positioning Systems (MTPS) for vehicle positioning applications (36). The studypresents the potential for success of MTPS in the future. More specifically, the study comparesMTPS with the more common application of using the global positioning system (GPS) forpositional information. The study describes how positional information can be supplied througha MTPS system for use in applications such as fleet operations, occasional location determination,congestion detection, navigation and route guidance, and geographic referencing.
The study makes the following points when comparing GPS and MTPS (36).
• Cellular networks in major cities operate hundreds of base stations, often with manydifferent frequencies. This gives a far greater diversity than GPS, which may onlyhave at best four to eight satellites visible at a particular location. This diversity isparticularly important in urban areas where occlusion and multipath can seriouslydegrade GPS positioning.
• Many ITS applications require a communication facility as well as positioning. AnMTPS can provide both facilities in a single system.
CHAPTER 5 - ITS PROBE VEHICLE TECHNIQUES
5-52 Travel Time Data Collection Handbook
• Although the cost of GPS receivers is dropping, it will always be a finite cost. Apositioning facility can be added to some cellular communication systems with nochanges to the mobile handsets and relatively minor changes to the network.
Although the study presents these benefits of using MTPS, the study also discusses issues that areassociated with the successful development of an MTPS. These complications include interferencefrom co-channels or adjacent channels, equipment delay time, signal occlusion, and geometricalerrors to name a few. Ingenuity and careful design are suggested to help alleviate these concerns.Privacy and security, two non-technical but equally important issues, are also discussed by theauthors as critical considerations in the development and implementation of such a system.
With increasing bandwidth availability of new cellular systems, the authors expect an increase inthe use of MTPS. The authors also note the anticipated increases in accuracy and coverage ofMTPS in the future.
CHAPTER 5 - ITS PROBE VEHICLE TECHNIQUES
Travel Time Data Collection Handbook 5-53
IMPORTANT
LGPS used for ITS probe vehicles has several distinct differences from GPSapplications for test vehicles. These include the on-board logging capability,driving behaviors of instrumented vehicles, and accuracy levels.
5.5 Global Positioning System
The Global Positioning System (GPS) was originally developed by the Department of Defense forthe tracking of military ships, aircraft, and ground vehicles. Signals are sent from the 24 satellitesorbiting the earth at 20,120 km (12,500 mi) (see Figure 3-1). These signals can be utilized tomonitor location, direction, and speed anywhere in the world. A consumer market has quicklydeveloped for many civil, commercial, and research applications of GPS technology includingrecreational (e.g., backpacking, boating), maritime shipping, international air traffic management,and vehicle navigation. The location and navigation advantages of GPS have found many uses inthe transportation profession (37).
The reader is encouraged to review Section 3.3.1 for additional discussion of GPS including itsoperation and increasing usage. Chapter Three discussed the use of GPS as a test vehicle datacollection technique. The test vehicle technique involves collecting data with the aid of aninstrumented vehicle capable of receiving GPS signals for position information. The data arecollected in the field and then downloaded to a central data storage computer after data collectionis complete. The global positioning system may also be used to collect real-time positionalinformation from vehicles. Real-time probe vehicle location information is then sent to a centralcontrol center for vehicle monitoring. The equipment requirements and set-up are similar to thetest-vehicle needs, however, there is the additional need for a two-way communication link (i.e.,the probe vehicle must be able to return a signal to a control center).
Currently, there are many applications of automatic vehicle location (AVL) that employ GPS forvehicle tracking in real-time. These include emergency service vehicles (e.g., police, fire,ambulance), rental cars, commercial fleets, taxis, and transit vehicles (38). GPS has proven to bea valuable tracking mechanism for these vehicles to a central location. For emergency servicevehicles, dispatching the nearest vehicles is facilitated with this technology. Further, for taxi andtransit applications, the technology allows users to know the location of buses and the estimatedtime of arrival at bus-stops and transit centers. Many transit agencies throughout the country utilizeGPS of bus fleets. One of the largest instrumented systems is the Dallas Area Rapid Transit(DART) that has approximately 1,200 buses instrumented with GPS receivers for AVL (39). Theseprobe vehicles that are already instrumented and operating on the transportation system provide aunique opportunity for the collection of travel time data.
This section of the handbook describes the use of GPS for ITS probe vehicle applications to takeadvantage of vehicles that are already instrumented and operating on the transportation system forthe collection of travel time information.
CHAPTER 5 - ITS PROBE VEHICLE TECHNIQUES
5-54 Travel Time Data Collection Handbook
5.5.1 Advantages and Disadvantages
The GPS probe vehicle technique has the following advantages (as compared to other ITS probevehicle methods):
• Relatively low operating cost after initial installation.
• Provides detailed data that are collected continuously along the entire travel timecorridor.
• GPS is becoming increasingly available as a consumer product.
• Data collection is automated.
The GPS probe vehicle technique has the following disadvantages:
• Privacy issues become a concern when installing GPS receivers on the vehicles ofvolunteer motorists.
• Signals can be lost in urban areas due to large buildings, trees, tunnels, or parkinggarages.
• It is difficult to have consistency between drivers due to differences in drivingbehavior.
• It is necessary to install two-way communication systems to send and receivesignals.
• Relatively high installation cost. Since the hardware investment may be initiallypurchased for a purpose other than travel time data collection, coordination isnecessary with the agency that installed the system.
CHAPTER 5 - ITS PROBE VEHICLE TECHNIQUES
Travel Time Data Collection Handbook 5-55
5.5.2 Cost and Equipment Requirements
This section will detail the personnel, hardware, and software needs necessary when consideringthe use of GPS as a probe vehicle travel time data collection method. Figure 5-9 shows a typicalconfiguration for a GPS-based probe vehicle system. The following sequence of events describesthe process of providing positional communications for a probe vehicle as shown in Figure 5-9 (40).This is how existing AVL systems utilizing GPS operate.
• The GPS receiver on the vehicle uses signals from a minimum of four satellites todetermine the vehicle’s position;
• This information is stored and “waits” to be processed with differential correctiondata;
• The differential information is then calculated at the differential correction station;
• The differential information is sent by a DGPS beacon transmitter a digital repeateron a transmission tower;
• The digital repeater then transmits this data forward to a second tower or to all probevehicles within its range;
• The probe vehicles receive the data through a digital radio transceiver that receivesand transmits data to and from the transmission tower through the digital repeater.The data are translated by the modem and passed along to the GPS receiver;
• The stored GPS information is then corrected with the differential data;
• The corrected location data is passed to the modem, translated to digital datapackage, and transmitted back to a digital repeater located on a transmission tower;and
• The digital repeater then verifies the data transmission, and either transmits the datato the control center or relays the data to the next transmission tower until it reachesthe control center.
Dispatch and vehicle monitoring personnel would be located in the control center. It is thisindividual’s responsibility to monitor the vehicle location information for bus operations. Foremergency vehicles, the dispatcher would be responsible for ensuring that the most appropriatevehicle (generally closest) responds to the emergency.
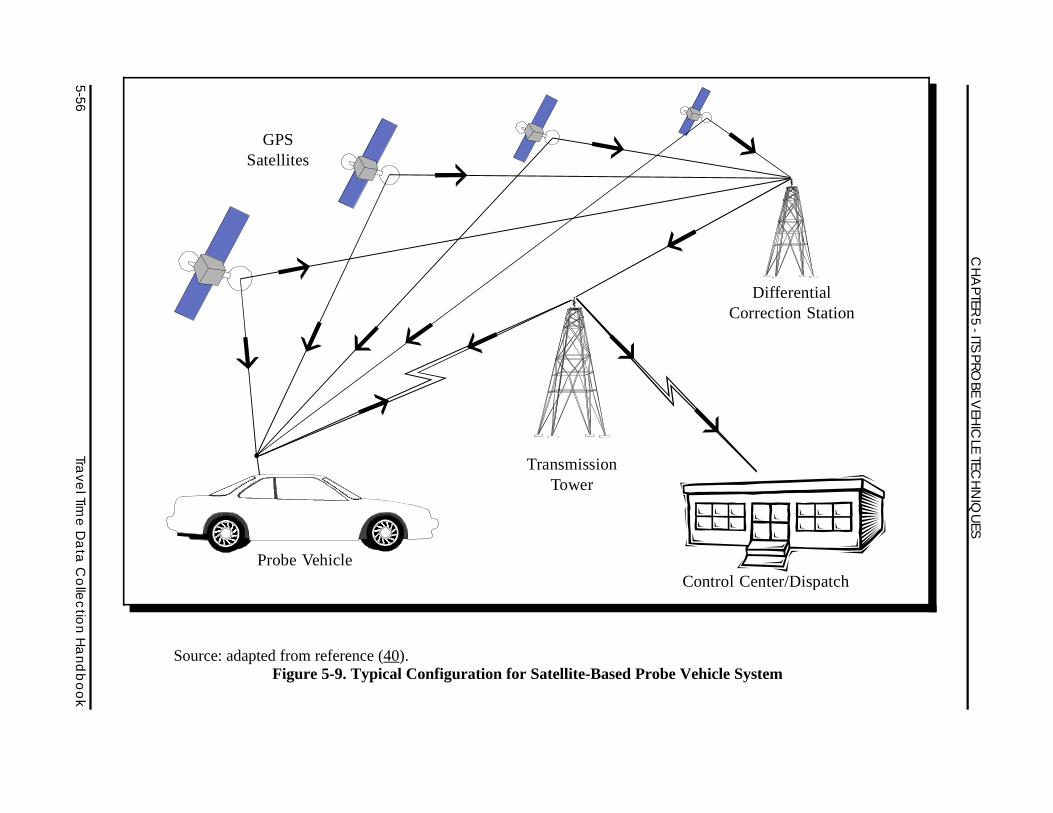
Control Center/Dispatch
TransmissionTower
Probe Vehicle
DifferentialCorrection Station
GPSSatellites
CH
APTER
5 - ITS
PROBE
VEH
ICLE
TECH
NIQ
UES
5-56Tra
vel Tim
e D
ata
Co
llec
tion
Ha
nd
bo
ok
Source: adapted from reference (40).Figure 5-9. Typical Configuration for Satellite-Based Probe Vehicle System
CHAPTER 5 - ITS PROBE VEHICLE TECHNIQUES
Travel Time Data Collection Handbook 5-57
IMPORTANT
LThe amount of bandwidth for these systems is limited, therefore, it can often bedifficult and expensive to obtain a frequency for communications, especially inlarge cities.
IMPORTANT
LThe speed at which data must travel through the communication system is alsoan important consideration when determining the required system hardware.
For the system shown in Figure 5-9 to operate, there are several equipment needs andconsiderations. This figure only shows the system required to get the information to the controlcenter. Once the data are received by the control center, reduction of the data into travel timeinformation may also be necessary depending upon the system design.
Considerations When Using GPS Probe Vehicles
There are several additional considerations when using GPS probe vehicles for travel time datacollection. As shown in Figure 5-9, the largest difference is the communication that must take placebetween the probe vehicle back to the control center. Many technologies exist for the transmissionof position information. These include conventional radio, cellular systems, satellites, beacons andsignposts, and paging systems. Conventional radio is the most commonly used communicationssystem for AVL systems throughout the world (41).
The coverage area is another consideration when developing a system, and the larger the area thatmust be covered with the system, the more towers that may be necessary to cover the area. It is alsonecessary to consider what tower will be used for setting up the antenna for the system (i.e., willa private transmission tower be used or will a locally-owned tower be rented). Further, when aconventional radio channel is desired for communication, an application for a license from theFederal Communications Commission (FCC) is required (38).
For GPS probe vehicle systems, a modem combined with a conventional radio bandwidth convertsdata to an analog signal for transmission. Generally, modems for mobile radio operations use 2400,4800, or 9600 baud. Some applications of GPS that are currently in use for buses or emergencyvehicles, utilize several radio channels to provide more capacity. Some configurations called TimeDivision Multiple Access (TDMA) schemes allow for the transmission of data in a given time slot.Time slots can actually be assigned for smaller fleets. Conversely, large fleets may operate witha communication system in which the time slots are dynamically assigned to optimize the effectiveuse of the transmissions. Generally, GPS probe vehicle systems will provide location informationabout a vehicle every 10 seconds (38).
Table 5-6 presents estimates of hardware, software, and personnel costs for using GPS for probevehicle data collection. Ranges of costs are provided. Equipment costs and user fees are included
CHAPTER 5 - ITS PROBE VEHICLE TECHNIQUES
5-58 Travel Time Data Collection Handbook
except for some components that have a large variation in cost. The hardware, software, andpersonnel costs are further described below.
GPS Receiver - Required to process GPS signal information from the earth-orbitingsatellites.
Radio Frequency (RF) Modem - Allows for two-way communication of positionalinformation to the control center.
GPS Antenna - Required to receive GPS signals from the earth-orbiting satellites.
Differential Correction Receiver (if desired) - Receives signals from GPS satellites todetermine corrected positional information. This information may be transmitted from aU.S. Coast Guard beacon or a private service (see differential signal service fee).
Differential Signal Service Fee - Fee charged for the use of the FM signal or otherfrequency band for obtaining differential correction information. Fees vary based upon thedesired positional accuracy.
DGPS Antenna - Receives signals from the differential correction station.
Transmission Tower Costs - Towers are necessary for radio transmissions. Transmissiontower costs vary depending upon several factors. If cable must be installed to thetransmission tower, related costs will be incurred. The height of the transmission tower alsobecomes a factor. Rental fees may vary depending upon the ownership of the transmissiontower. Service fees for radio frequency use can also vary. One factor that affects this costis the availability of bandwidth.
Digital Repeater - Aids in sending radio signals from tower to tower (if necessary) and toprobe vehicles or the control center.
Portable Computer - Necessary for positional data collection in the field.
Power Supply - Necessary for both the GPS receiver and the portable computer. Generallysupplied through the cigarette lighter or a battery pack.
Data Storage Computer - Generally located back at the office or in the control center.This computer is used to store the positional data obtained in the field.
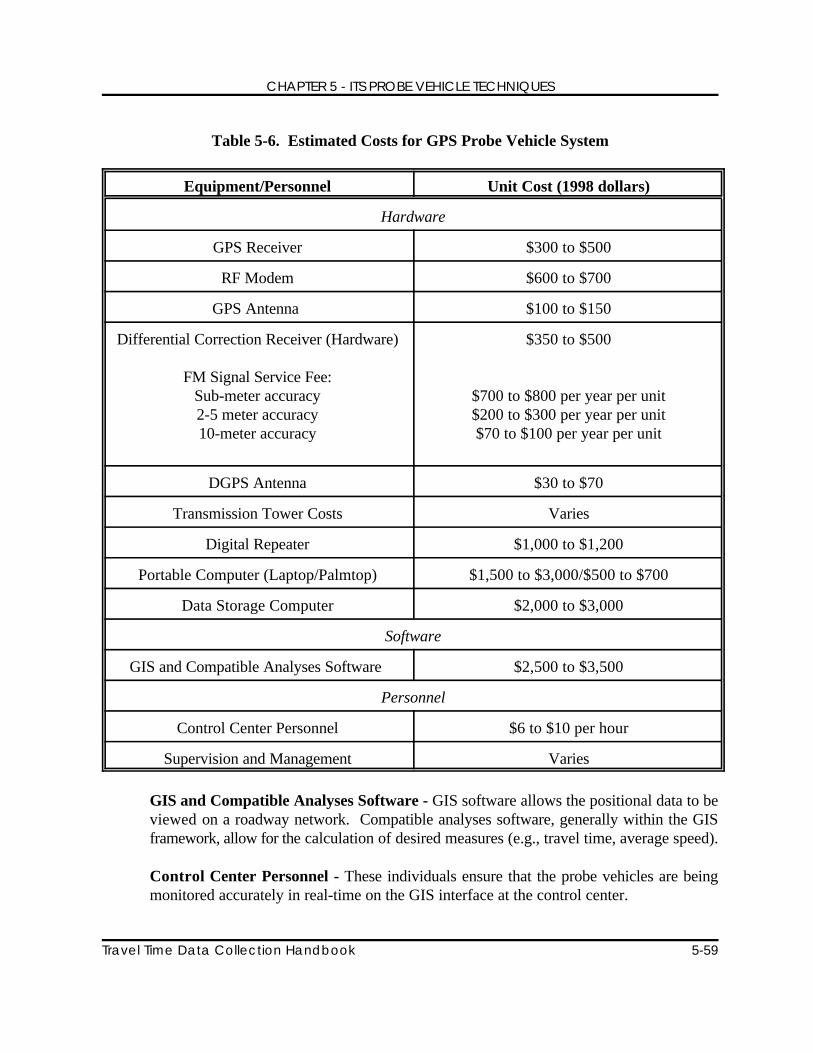
CHAPTER 5 - ITS PROBE VEHICLE TECHNIQUES
Travel Time Data Collection Handbook 5-59
Table 5-6. Estimated Costs for GPS Probe Vehicle System
Equipment/Personnel Unit Cost (1998 dollars)
Hardware
GPS Receiver $300 to $500
RF Modem $600 to $700
GPS Antenna $100 to $150
Differential Correction Receiver (Hardware) $350 to $500
FM Signal Service Fee:Sub-meter accuracy $700 to $800 per year per unit2-5 meter accuracy $200 to $300 per year per unit10-meter accuracy $70 to $100 per year per unit
DGPS Antenna $30 to $70
Transmission Tower Costs Varies
Digital Repeater $1,000 to $1,200
Portable Computer (Laptop/Palmtop) $1,500 to $3,000/$500 to $700
Data Storage Computer $2,000 to $3,000
Software
GIS and Compatible Analyses Software $2,500 to $3,500
Personnel
Control Center Personnel $6 to $10 per hour
Supervision and Management Varies
GIS and Compatible Analyses Software - GIS software allows the positional data to beviewed on a roadway network. Compatible analyses software, generally within the GISframework, allow for the calculation of desired measures (e.g., travel time, average speed).
Control Center Personnel - These individuals ensure that the probe vehicles are beingmonitored accurately in real-time on the GIS interface at the control center.
CHAPTER 5 - ITS PROBE VEHICLE TECHNIQUES
5-60 Travel Time Data Collection Handbook
Supervision and Management - This includes management personnel who monitor theoverall data collection, data reduction, and analysis of the system operation. This costvaries depending upon the size of the system, computer automation, and study needs.
There are several additional system designs to consider when developing a system for probe vehicletravel time data collection. Software packages are an integral part of the success of such a system.The GIS interface must be able to receive the GPS information in real-time for processing.Additional “packaged” software is available that is capable of placing a vehicle identifier on thevehicle that is being shown traveling in real-time on the computer screen at the control center.Analysis software is available that is able to compute real-time travel time information forpredetermined routes.
In addition, dead reckoning systems may also be considered in the system design. Dead reckoningprovides a means for vehicle locations to be determined when GPS satellite signals are not beingreceived (i.e., they are being blocked by trees or buildings).
5.5.3 Data Reduction and Quality Control
Several steps are necessary in the reduction of GPS probe vehicle data:
1. Insert necessary information into the base map at the control center. There areseveral input requirements to the base map that are necessary to perform reductionof the data. These inputs include street names, cross-street information, andreference (checkpoint) locations for travel time segment definition.
2. Convert raw GPS data from the field to a trackable vehicle on the controlcenter screen. With the aid of GIS software applications and related analysessoftware, the raw data obtained from the GPS receiver in the field is converted toa moving and labeled vehicle on the control center monitor.
3. Adjust collected data to match base map (if desired). Apply map matching orappropriate software algorithms that “snap” the real-time data to the base mapinformation.
4. Compute travel time for a given segment. The GIS software is capable of beingprogrammed to calculate the travel time of vehicles traveling through predeterminedlinks. In addition, the data being brought into the control center can be backed upfor quality control and further analyses purposes. It should be noted that segmentdefinition has caused some dispute in the profession as some professionals say thatsegments should be defined as a given length, while others argue that segmentlength should be defined in units of time since GPS data is obtained in real-time.
CHAPTER 5 - ITS PROBE VEHICLE TECHNIQUES
Travel Time Data Collection Handbook 5-61
UNKNOWN
??There are differing opinions about whether to aggregate GPS data intopredefined roadway segments. If data storage is available, all GPS data pointsshould be stored to permit “dynamic segmentation.”
Quality Control Considerations
Several checks can be performed to ensure that adequate results are being achieved. The followingquality control considerations can be applied in the data reduction stages.
• Monitoring the course of vehicles being tracked. The individual responsible formonitoring the vehicles being tracked in real-time can monitor the vehicles on thecomputer monitor. If the general routes of the labeled vehicles on the computermonitor are known, the individual watching the screen can recognize inconsistenciesin vehicle trajectories if the vehicles appear to be off course.
• Selected “spot checks” of real-time data being collected. Although the data arebeing collected and transferred in real-time, data log files can be stored. These filescan be randomly selected to evaluate the travel time information they are producing.Based upon the historical operation of the predetermined segments, the analyst canuse this technique to determine if the results are accurate.
• Evaluation of locations where GPS signals are temporarily lost. In the absenceof a dead-reckoning system, the path of a traveling vehicle may be lost when GPSsignals are blocked. During periods when the GPS signal is lost, with or without theuse dead-reckoning, it may be beneficial to check the travel time results providedfor these routes.
5.5.4 Previous Experience
ADVANCE, Illinois Department of Transportation (IDOT)
The Advanced Driver and Vehicle Advisory Navigation Concept (ADVANCE) was undertaken in1991 as a test of dynamic in-vehicle route guidance. The partners in the project include the IllinoisDepartment of Transportation (IDOT), the Federal Highway Administration (FHWA), the AmericanAutomobile Association (AAA), Motorola, and the Illinois Universities Transportation ResearchConsortium (Northwestern University and the University of Illinois at Chicago) with thecooperation of the Argonne National Laboratory. ADVANCE has established a very useful Internetsite where complete reports on every aspect of the project are available for the use of thoseinterested (43).
CHAPTER 5 - ITS PROBE VEHICLE TECHNIQUES
5-62 Travel Time Data Collection Handbook
Real-time route guidance information was provided to individuals to evaluate if they would altertheir trip to avoid congestion and reduce the travel time of their trip. Many technologies wereutilized in the study to provide the real-time information to travelers. These included the globalpositioning system (GPS), wireless communications, CD-ROM map storage, and data fusion. TheTransportation Information Center (TIC) was the core of the system receiving information fromseveral sources, processing the data, and transmitting it to users (43).
As a major effort to establish an in-vehicle real-time route guidance system to travelers, manylessons were learned from the ADVANCE project that are applicable to the establishment of traveltime data collection utilizing GPS technology. The study used radio frequency communicationsbetween the vehicles and the control center through modems in the vehicles for transmission ofinformation. Differential correction information was also supplied to the vehicles for correctionof the GPS information. Although two channels were established for communication purposes,there were times when the system could become slowed down because the modems in the vehiclescould not handle real time info as fast as it could be sent.
Privacy issues, such as the concern that “big brother” will be watching, is always a concern whenthe instrumentation of private vehicles is being considered. Although ADVANCE used project carsdonated by car manufacturers, the original intent was the instrumentation of private vehicles.Therefore, experience was gained in soliciting and preparing motorists for driving the test vehicles.Very limited advertisement of the project was performed to solicit individuals to apply for theinstrumentation of their vehicle for the study. However, there was a large response by individualsto test the new route guidance system. Selection criteria were established to aid in determiningwhich individuals would be allowed to participate in the study. The participants were told of allaspects of the project including a briefing that included presentations from the partners in theproject to provide information about the project including a user’s manual, quick reference guide,brochure on the ADVANCE project, and other related materials (44).
The ADVANCE project team did have a modem identification number in the database used foranalysis. It would be possible to match this identification number with the individual driver withsome work. Therefore, the team disclosed this information to interested drivers to ensure they werenot concerned about the fact that they could be monitored. The full disclosure of exactly how thesystem was being used and the data being collected aided in the understanding, comfort, and interestof the volunteers in the study.
Predetermined segment links in the 780 sq-km (300 sq-mi ) ranged from 0.016 to 3.2 km (0.01 to2.0 mi) in length. Predetermined routes were also used in the study, and data collection wasperformed over different times of the day. Computer processing was provided in each vehicle withthe aid of on-board computers. Therefore, the computation of travel time information on thepredetermined links was performed in the vehicle and transmitted to the TIC. This reduced thecomputation that was necessary at the TIC. The TIC would then gather the information from probevehicles and loop data from the transportation system and process it every five minutes. Thisinformation was then reported back to the probe vehicles.
CHAPTER 5 - ITS PROBE VEHICLE TECHNIQUES
Travel Time Data Collection Handbook 5-63
The project team was satisfied with the ADVANCE in-vehicle route guidance effort. The use ofthe GPS technology was advantageous because it provided minimal overhead costs. This is becauseof the simple fact that it relied on another trustable system since GPS is maintained closely by theDepartment of Defense. For these reasons, ADVANCE has provided many beneficial lessons forapplication of future probe vehicle applications for travel time data collection.
Texas Transportation Institute (TTI), College Station, Texas
The objective of one current research effort within the Texas A&M Intelligent TransportationSystem (ITS) Research Center of Excellence (RCE) is to develop, demonstrate, and evaluate anAVL/GPS system for rural transit. Brazos Transit District (BTD) was selected as the transit agencyto be instrumented with the AVL system. BTD presently covers 23 counties in the State of Texas.It is the largest provider of rural transit services in the state (40,42). This example is provided todescribe to the reader an AVL system that is being studied in an effort to aid the practitioner inrealizing the potential use of existing probe vehicle systems such as AVL for travel time datacollection. The reader is encouraged to review Figure 5-9 for an illustration of such a system.
GPS technology was selected for use in determining vehicle positioning. The system was set-upsimilarly to Figure 5-9 except the probe vehicle was a transit vehicle. The communications systemincluded the use of two-way UHF radio bandwidth operating in the 460 MHZ range. Differentialcorrection improved vehicle position data from a range of 10 to 15 meters (33 to 49 feet) to 2 to 5meters (7 to 16 feet). Real-time information is sent from the transit vehicle to a transmission towerand back to the Texas Transportation Institute (TTI) and the BTD dispatch office (42).
This study has provided several lessons learned. The first noteworthy lesson is the concern that “bigbrother” is watching over the transit driver. Many of the bus drivers were concerned that they werebeing monitored when they were traveling with the GPS receivers in the vehicle. The drivers wouldoften shut off the GPS receivers prior to driving their scheduled route. Although the drivers wereeducated thoroughly that they were not being monitored while on their scheduled routes, this wasa common problem. The problem could be resolved to some degree by ensuring that the GPSreceiver was hidden from the view of the driver (42). Keeping the equipment out-of-sight of thedriver is a valuable lesson for consideration when GPS equipment may be installed on privatevehicles as well. Even when the drivers are informed that they are not being monitored, if the driveris unable to see the unit, they may not be reminded or become tempted to disconnect it. Of course,the driver must be informed that the equipment is on-board the vehicle.
The study has found that the GPS technology is applicable and effective for rural transit applicationsas well. Since the location was rural, there was no difficulty in obtaining RF bandwidth for the two-way communications. The critical factor is the rental fee and equipment cost for the transmissiontower(s). For this study, it was necessary to install the antenna and cable into the tower forcommunications. As discussed previously, the coverage area will determine the number andspacing of transmission towers. One tower was able to adequately cover the Brazos County areain this study. Continued tasks in the study are evaluating the range of the transmission of the tower.
CHAPTER 5 - ITS PROBE VEHICLE TECHNIQUES
5-64 Travel Time Data Collection Handbook
The study also describes the software packages that were used to integrate digital maps, mappingsoftware, relational database capabilities, and GPS real-time information into one system. Further,the software that was used can track individual buses with unique identification tags (42). Inaddition, analysis packages compatible to the GIS software can be created that can compute real-time travel time and speed information based on the incoming real-time GPS information forpredetermined links.
CHAPTER 5 - ITS PROBE VEHICLE TECHNIQUES
Travel Time Data Collection Handbook 5-65
5.6 References for Chapter 5
1. Use of Automatic Vehicle Identification Techniques for Measuring Traffic Performance andPerforming Incident Detection. Final Report WA-RD 273.1. Washington State Departmentof Transportation. Olympia, Washington. October 1992.
2. Boyce, D.B., J. Hicks, and A. Sen. “In-Vehicle Navigation Requirements for MonitoringLink Travel Times in a Dynamic Route Guidance System.” ADVANCE Working PaperSeries, Number 2. Urban Transportation Center, University of Illinois at Chicago. Chicago,Illinois, March 1991.
3. Srinivasan, K., and P.P. Jovanis. “Determination of Number of Probe Vehicles Requiredfor Reliable Travel Time Measurement in Urban Network.” In Transportation ResearchRecord 1537. Transportation Research Board, National Research Council. Washington,DC, 1996.
4. Holdener, D.J. and S.M. Turner. “Probe Vehicle Sample Sizes For Real-Time Information:The Houston Experience.” Proceedings of the 1996 Annual Meeting of ITS America.Intelligent Transportation Society of America. Washington, DC, 1996.
5. Patel, R.K. and E. Rowe. “An Overview of ITS Standards and Protocols.” ITE Journal.Institute of Transportation Engineers. Washington, DC, December 1995.
6. ITS Architecture Theory of Operations. Federal Highway Administration, U.S. Departmentof Transportation. Washington, DC, June 1996.
7. NTCIP Steering Group. “The National Transportation Communications/ITS Protocol: AnIntroduction.” ITE Journal. Institute of Transportation Engineers. Washington, DC,December 1995.
8. “Full Tracking for all London Buses by 2000.” ITS: Intelligent Transport Systems.January/February 1997.
9. Evaluation of Automatic Vehicle Location Systems in Public Transit. Research ReportSWUTC/93/30060-l Southwest Region University Transportation Center, TexasTransportation Institute. College Station, Texas, 1993.
10. Overgaard, D.A. “Automatic Vehicle Location at Seattle Metro.” Proceedings of thePacific Rim TransTech Conference, Volume I American Society of Civil Engineers, NewYork, New York, 1993.
11. “Full Tracking for All London Buses by 2000.” ITS Intelligent Transport Systems.January/February 1997.
CHAPTER 5 - ITS PROBE VEHICLE TECHNIQUES
5-66 Travel Time Data Collection Handbook
12. VIA's Experience with “First Generation” Radio/AVL/CAD. VIA Project #96-128. VIAMetropolitan Transit. San Antonio, Texas, November 1, 1996.
13. Existing and Emerging Technologies for the Automatic Collection of Data for TransportModeling [http://www.smithsys.com.uk/smith/public/p&p/p&pndex_road.htm#Road-transport].
14. “U.S. ETC Systems in Production/Development.” ETTM on the Web.[http://www.ettm.com/syssumm.html]. April 1997.
15. Travel Time Data Collection Field Tests - Lessons Learned. Final Report DOT FHWAPL-96-010. Federal Highway Administration, U.S. Department of Transportation.Washington, DC January, 1996.
16. “Automatic Vehicle Identification.” [http://www.ettm.com/avi.html]. ETTM on the Web.1996.
17. Yermack, L., M. Gallagher, and K.R. Marshall. “ETTM - An Early ITS Winner.” ITEJournal. Institute of Transportation Engineers. Washington, DC, December 1995.
18. Smalley, D.O., D.R. Hickman, and W.R. McCasland. Design and Implementation ofAutomatic Vehicle Identification Technologies for Traffic Monitoring in Houston, Texas.Draft Report TX-97-1958-2F. Texas Transportation Institute. College Station, Texas,August 1996.
19. Schuckel, C. “Examination of a Uniform Smart Card for Electronic Toll Collection andTransit Fees.” Compendium: Graduate Student Papers on Advanced SurfaceTransportation Systems. Report Number SWUTC/96/72840-0003-1. Southwest RegionUniversity Transportation Center, Texas Transportation Institute. College Station, Texas,August 1996.
20. ITS Fair Information and Privacy Principles. [http://www.itsa.org/] IntelligentTransportation Society of America Washington, DC, March 1995.
21. “Automatic Vehicle Identification.” [http://www.ettm.com/avi.html]. ETTM on the Web.1966.
22. Marshall, K.R. and T. Batz. “The TRANSCOM TRANSMIT Project: An AlternativeApproach for Traffic Surveillance and Incident Detection.” Moving Toward Deployment:The Proceedings of the 1994 Annual Meeting of IVHS America, Volume 2. IVHS America.Washington, DC, April 1994.
CHAPTER 5 - ITS PROBE VEHICLE TECHNIQUES
Travel Time Data Collection Handbook 5-67
23. Van Arendonk, J. “A Comparison of Real-Time Freeway Speed Estimation Using LoopDetectors and AVI Technologies.” Compendium: Graduate Student Papers on AdvancedSurface Transportation Systems. Report Number SWUTC/96/72840-0003-1. SouthwestRegion University Transportation Center, Texas Transportation Institute. College Station,Texas. August, 1996.
24. Hickman, D. “AVI System Software: Operation, Configuration, and Maintenance Guide,Version 1.2.” Texas Transportation Institute. November, 1996.
25. Christiansen, I. and L.E. Hauer. “Probing for Travel Time.” Traffic TechnologyInternational. August/September 1996.
26. Polk, A.E. and M.C. Pietrzyk. “The Miami Method: Using Automatic Vehicle Location(AVL) for Measurement of Roadway Level-of-Service.” The Proceedings of the 1995Annual Meeting of ITS America, Volume 1. Intelligent Transportation Society of America.Washington, DC, 1995.
27. “Teletrac Reveals Plans to Establish Presence in Nine New Markets.” Teletrac, Inc.[http:\\www.teletrac-online.com/business/press/3_17_97.html]. March 1997.
28. Automatic Vehicle Location for Measurement of Corridor Level-of Service: StatewideAnalysis. Center for Urban Transportation Research, College of Engineering, Universityof South Florida, December 1994.
29. Vaidya, N., L.L. Higgins, and K.F. TurnbulI. “An Evaluation of the Accuracy of a Radio-Trilateration Automatic Vehicle Location System.” Proceedings of the 1996 AnnualMeeting of ITS America. Intelligent Transportation Society of America. Washington, DC,1996.
30. Levine, S.Z., W.R. McCasland, and D.O. Smalley. “Development of a Freeway trafficManagement Project Through a Public-Private Partnership.” Transportation ResearchRecord 1394. Transportation Research Board, National Research Council. Washington,DC 1993.
31. Final Evaluation Report For The CAPITAL-IVHS Operational Test and DemonstrationProgram. Draft Report. Transportation Studies Center, University of Maryland. CollegePark, Maryland, November 1996.
32. Larsen, R. “Using Cellular Phones as Traffic Probes.” Traffic Technology International.Aug/Sept. 1996.
33. “Federal Communications Commission Adopts Rules to Implement Enhanced 911 forWireless Services (cc Docket No.94-102).” NEWS Report No. DC 96-52, Action in Docket
CHAPTER 5 - ITS PROBE VEHICLE TECHNIQUES
5-68 Travel Time Data Collection Handbook
Case. [http:/www.fcc.gov/Bureaus/wireless/News_Releases/1996/nrwil16026.txt]. June12, 1996.
34. Hanson, E. “City foresees better coordination of 911 calls from cellular phones.” HoustonChronicle Newspaper. March 8, 1997.
35. Sumner, R., R. Smith, J. Kennedy, and J. Robinson. “Cellular Based Traffic Surveillance -The Washington, D.C. Area Operational Test.” Moving Toward Deployment, Proceedingsof the IVHS America 1994 Annual Meeting, Volume 2. IVHS America. Washington, DC,1994.
36. Drane, C.R., M. MacNaughtan, and C.A. Scott. “The Accurate Location of MobileTelephones.” Presented at the Third Annual World Congress on Intelligent TransportSystems. Orlando, Florida, October 1996.
37. Cubbedge, S.. “The Global Positioning System.” QST. September 1996.
38. Broncano, S. K. “The GPS-RF Connection for AVL.” Communications. November 1995.
39. “Growing Number of Transit Agencies Install AVL Systems.” The Urban TransportationMonitor. September 13, 1996.
40. Perry, C.F. and K.F. Turnbull. “Implementation and Assessment of An Automated VehicleLocation System for Rural Transit Using GPS and UHF Radio Technologies.” Presentedat ITS America. Washington, DC, June 1997.
41. Krakiwsky, E.J. “Navigation and Tracking Systems.” ITS World. January/February, 1996.
42. Perry, C.F. and K.F. Turnbull. “Implementation of An Automated Vehicle Location Systemfor Rural Transit.” Presented at the Rural Intelligent Transportation System Conference.1996.
43. Advanced Driver and Vehicle Advisory Navigation Concept (ADVANCE) World WideWeb Page. “About ADVANCE.” http://ais.its-program.anl.gov/reports/about.advance.html.
44. Advanced Driver and Vehicle Advisory Navigation Concept (ADVANCE) News. February,1995.
CHAPTER 5 - ITS PROBE VEHICLE TECHNIQUES
Travel Time Data Collection Handbook 5-69
5.7 Additional Resources for ITS Probe Vehicle Techniques
Automatic Vehicle Identification
Carlin, G.A. “Travel Time Variations of Probe Vehicles Using Houston’s Automatic VehicleIdentification Traffic Monitoring System.”
Levine, S.Z. and W.R. McCasland. “Monitoring Freeway Traffic Conditions with AutomaticVehicle Identification Systems.” ITE Journal. March 1994.
Ullman, G.L., K.N. Balke, W.R. McCasland, and C.L. Dudek. “Benefits of Real-Time Travel TimeInformation in Houston.” College Station, Texas, 1995.
Balke, K.N., C.L. Dudek, and C.E. Mountain. “Using Probe-Measured Travel Times to DetectMajor Freeway Incidents in Houston, Texas.” Presented at the 75th Annual Meeting of theTransportation Research Board. Washington, DC, January 1996.
Tran, D.M. “Variability of Travel Speed on Houston Freeways.” Compendium: TransportationEngineering Research Reports. Texas A&M University Undergraduate Transportation EngineeringFellows Program. Texas Transportation Institute. College Station, Texas. August 1995.
Electronic Toll Collection Field Performance Evaluations for the Florida Department ofTransportation. Center for Urban Transportation Research. College of Engineering. Universityof South Florida, June 1993.
Spasovic, L.N., W. Zhang, A.K. Bladikas, L.J. Pignataro, E. Niver, and S. Ciszewski. “Primer onElectronic Toll Collection Technologies.” Transportation Research Record 1516. TransportationResearch Board. National Research Council. Washington, DC, 1995.
Travel Time Data Collection Field Tests - Lessons Learned. Final Report. Federal HighwayAdministration. U.S. Department of Transportation. Report Number DOT-FHWA-PL-96-010.DOT-VNTSC-FHWA-96-1. Washington, DC, January 1996.
Tarnoff, P.J. and T. Batz. “The TRANSCOM TRANSMIT Project: A Unique InstitutionalApproach to a Unique Project.” Moving Toward Deployment, The Proceedings of the 1994 AnnualMeeting of IVHS America, Volume 1. IVHS America. Washington, DC, April 1994.
CHAPTER 5 - ITS PROBE VEHICLE TECHNIQUES
5-70 Travel Time Data Collection Handbook
Global Positional System
Turnbull, K.F. “Evaluation of Automatic Vehicle Location Systems in Public Transit.” Sponsoredby the Southwest Region University Transportation Center (SWUTC). Research Report No. 30060-1. Performed by the Texas Transportation Institute. College Station, Texas, August 1993.
Littwin, A. “The Great Personal Communications Services (PCS) Buildout: A Status Report.”Telecommunications. April 1997.
Casey, R. F., L.N. Labell, R. Holmstorm, J.A. LoVecchio, C.L. Schweiger, and T. Sheehan.“Advanced Public Transportation Systems: The State of the Art Update ‘96.” U.S. Department ofTransportation. Federal Transit Administration, January 1996.
Jones, J. “AVL/GPS: Find It Now.” Intelligent Highway Systems.
See Chapter 3 for further GPS references related to test vehicle techniques.