Embed Size (px)
Citation preview
“Its not that I’m a rascist, its that they are Roma”*: Stories of Roma discrimination &
returns to education in South Eastern Europe
Niall O’Higgins
CELPE
DiSES
Università di Salerno [email protected]
Paper prepared for presentation at the AIEL Conference 2007. Preliminary draft, June 2007. 1° Sessione Tematica: Verso una Nuova Geografia regional dell’Europe, sottosessione E.
* With apologies to Giobbe Covatta
1
“Its not that I’m a rascist, its that they are Roma”: Stories of discrimination & returns to education in South Eastern Europe
Niall O’Higgins CELPE DiSES
Università di Salerno
Abstract
Roma were the clear losers from the transition to the market economy in the countries of Central & Eastern Europe. Nowadays they face unemployment rates well above, and incomes well below, the average of their ‘majority’ counterparts. Explanations of why Roma seem to fare so badly tend to fall into one of two, usually not disinterested, camps: the low education ‘school’ and the discrimination hypothesis. That is, the poor employment prospects of Roma are due either to their reluctance to participate in education or because they are discriminated against in the labour market. This paper uses an unique survey of Roma and non-Roma undertaken in Seven South Eastern European countries in 2005 in order to examine the question. The first part of this paper looks at the employment, unemployument and income situation of Roma compared to ‘majority’ populations in South East Europe. In the second part, an examination of (employment and income) returns to education shows that, whilst it is undoubtedly true that Roma have lower average education levels than non-Roma living in similar circumstances, such an outcome is rational in as much as the returns to education are much lower for Roma than for non-Roma. The reason for this may be sought both in the lower quality of education offered to Roma in the largely segregated education systems of South Eastern Europe as well as in the effective discrimination faced by Roma on the labour market once they leave school. The main direct implication is that policies to raise education levels of the Roma themselves are unikely to have much impact on the employment and income of this group.

2
This paper is largely base on the UNDP ‘vulnerability’ survey carried out in October 2004 in seven South Eastern European Countries as well as in Kosovo province. The survey covered both Roma and non-roma populations living in proximity to each other. Thuis the survey itself can not claim to be nationally representative for each country covered however, much effort was employed to ensure that the Roma and non-roma samples were directly comparable one to another. It represents a systematic attempt to provide hard information on the situation of Roma in transition countries. This paper builds my previous work in the area1, however, in contrast to these previous efforts, inclusion of a comparison, non-Roma group allows the analysis to go much further in evaluating the relative effects of, in this case, education ion the employment and income of the roma population.
Unemployment rates across the region
The survey included both subjective and objective measures of unemployment. First, the socio-economic status of each household member (unemployed, employed, student, retired and so on) was asked for. This subjective self-assessment was then complemented by more objective criteria associated with labour force survey methodologies. Each household member was asked whether s/he had earned any income in the previous month, and if so, how. This helped make possible the exclusion of those amongst the ‘unemployed’ who had in fact worked in the previous month.
According to the internationally accepted ILO definition, in order to be considered unemployed a person must be:
a) without work;
b) willing and able to work; and
c) actively seeking work.
Including amongst the unemployed those who were not actively seeking work means classifying discouraged workers as unemployed. The appropriateness of using the active job search criterion in defining the unemployed has often been questioned.2
The data shows that unemployment rates are far higher among Roma than the respective unemployment rates for the majority (see Figure 1)3. In some cases, such as in Bulgaria 1 See, in particular, UNDP (2001) and O’Higgins (2002).
2 For example, for Hungary, Micklewright and Nagy (2002) have found that, amongst those without employment, those who did not seek work but wished to work (invariably excluded from the unemployed using the standard strict ILO criteria), took less time to find jobs than those who actively sought work through registration at employment offices (invariably included in the unemployed according to strict ILO criteria). This brings into doubt the appropriateness of the active search criteria as a basis fior the identification of labour market attachment in practice.
3 Unemployment rates were based on both the willingness and ability to work. The unemployed includes all those whose principal working status were defined as ‘not working’ as opposed to, for example, ‘studying’, ‘doing housework’ or ‘working’ AND who did not have any earned income in the last month. Clearly here the question arises as to the extent to which the ‘not working’ category capture willingness and ability, however, it was felt preferable to use this in preference to the alternative (self-definition) of unemployment.
3
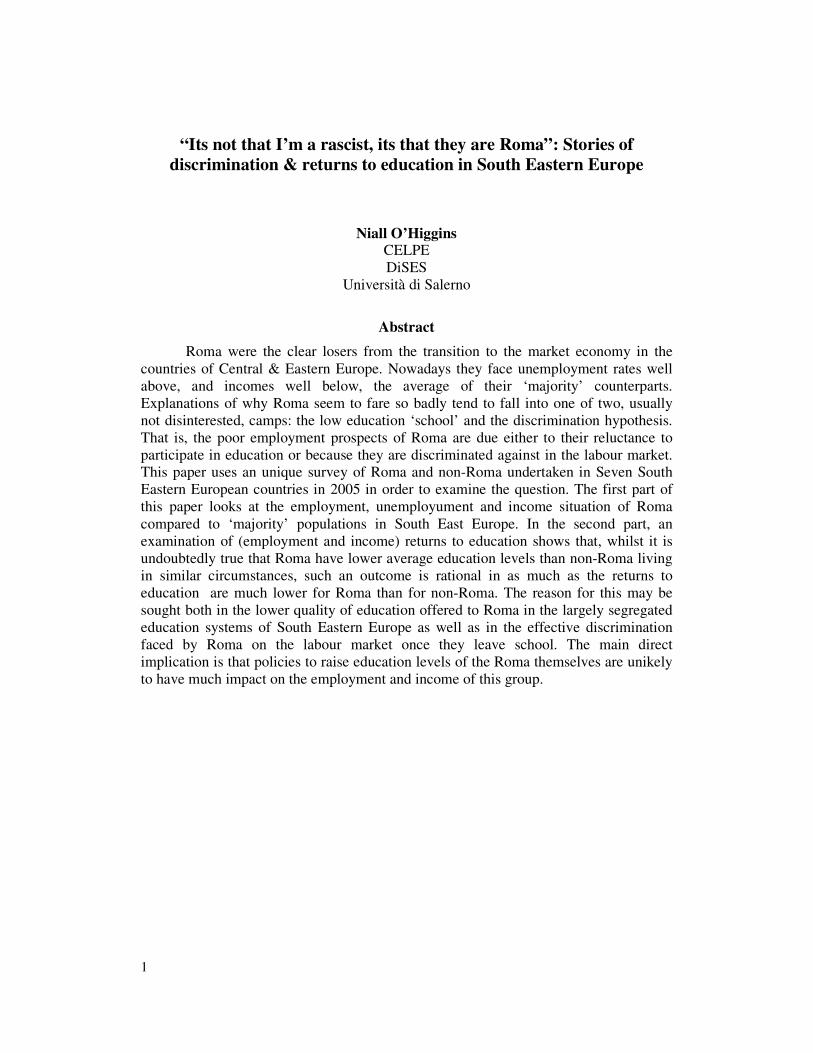
and Croatia, the Roma face unemployment rates which are more than twice as high as their similarly placed colleagues from the majority.4
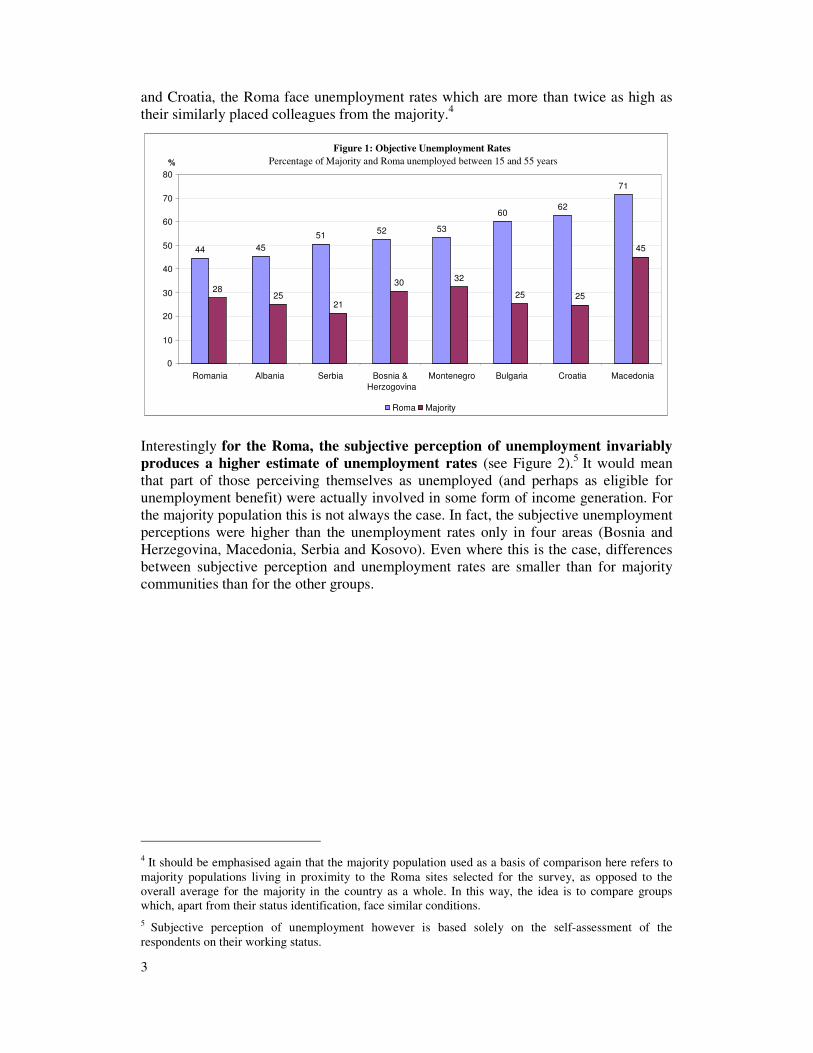
Interestingly for the Roma, the subjective perception of unemployment invariably
produces a higher estimate of unemployment rates (see Figure 2).5 It would mean that part of those perceiving themselves as unemployed (and perhaps as eligible for unemployment benefit) were actually involved in some form of income generation. For the majority population this is not always the case. In fact, the subjective unemployment perceptions were higher than the unemployment rates only in four areas (Bosnia and Herzegovina, Macedonia, Serbia and Kosovo). Even where this is the case, differences between subjective perception and unemployment rates are smaller than for majority communities than for the other groups.
4 It should be emphasised again that the majority population used as a basis of comparison here refers to majority populations living in proximity to the Roma sites selected for the survey, as opposed to the overall average for the majority in the country as a whole. In this way, the idea is to compare groups which, apart from their status identification, face similar conditions.
5 Subjective perception of unemployment however is based solely on the self-assessment of the respondents on their working status.
Figure 1: Objective Unemployment Rates Percentage of Majority and Roma unemployed between 15 and 55 years
44 45 51 52 53
60 62
71
28 25
21
30 32
25 25
45
0
10
20
30
40
50
60
70
80
Romania Albania Serbia Bosnia & Herzogovina
Montenegro Bulgaria Croatia Macedonia
%
Roma Majority
4
Differences between ‘subjective perception’ of unemployment and unemployment rates reflect two distinct phenomena: some people define themselves as unemployed even though they have recently worked; others do not define themselves as unemployed but would be so classified according to the criteria used here. Since, for many, unemployment is associated with the absence of a regular job, those involved in informal sector and irregular employment are quite likely to define themselves as unemployed, even though they may be doing some sort of work. The data support the idea that Roma tend to be involved to a greater extent in informal sector employment while at the same time declare themselves as unemployed. On the other hand, for many, the state of unemployment may be associated with the receipt of unemployment benefits. Even though such individuals would work if work were available, they may not collect unemployment benefits and so not see themselves as unemployed per se. Moreover, a stigma may be associated with the self-declaration of unemployment hence the subjective rate may not be as high. The benefits and stigmatisation effect is more common for the majority population. Since the first of these differences will produce a lower estimate of unemployment using the ‘objective’ criteria, whilst the latter will raise it, the relationship between subjective perception and unemployment rates is not determined a priori.
In any event, Figure 2 suggests that using the subjective rates as a base tends to overestimate the difference between Roma unemployment rates and those of the majority populations. But even without the overestimation, the difference is substantial especially when one recalls that they are living in a similar socio-economic environment, thus facing the same conditions.
Differences in type of employment and sources of income
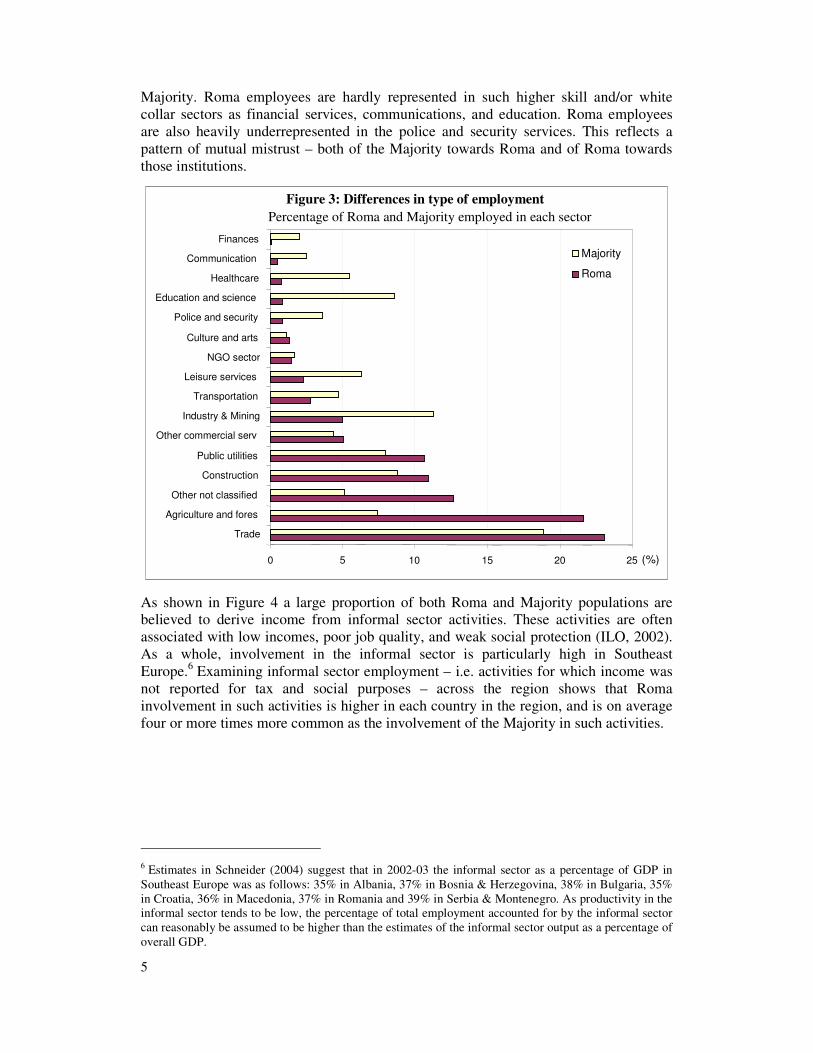
The data in Figure 3 show that Roma employment tends to be heavily concentrated in trade, agriculture, construction, and public utilities, with the latter most probably including the bulk of public works job-creation projects. These are sectors dominated by manual labour and a large role for low skilled employment. Indeed, Roma are mainly concentrated in low skilled employment. Almost 67 percent of Roma surveyed were employed in unskilled or semi-skilled labour compared with just 16 percent of the
Figure 2: Subjective perception of Unemployment Percentage of Majority and Roma that stated unemployment status
48
70 71 76 78 78 80
89 92
18 23
26 25 25 28
56 51
41
0
10
20
30
40
50
60
70
80
90
100
Albania Bulgaria Montenegro Croatia Romania Serbia Kosovo Macedonia Bosnia & Herzogovina
%
Roma Majority
5
Majority. Roma employees are hardly represented in such higher skill and/or white collar sectors as financial services, communications, and education. Roma employees are also heavily underrepresented in the police and security services. This reflects a pattern of mutual mistrust – both of the Majority towards Roma and of Roma towards those institutions.
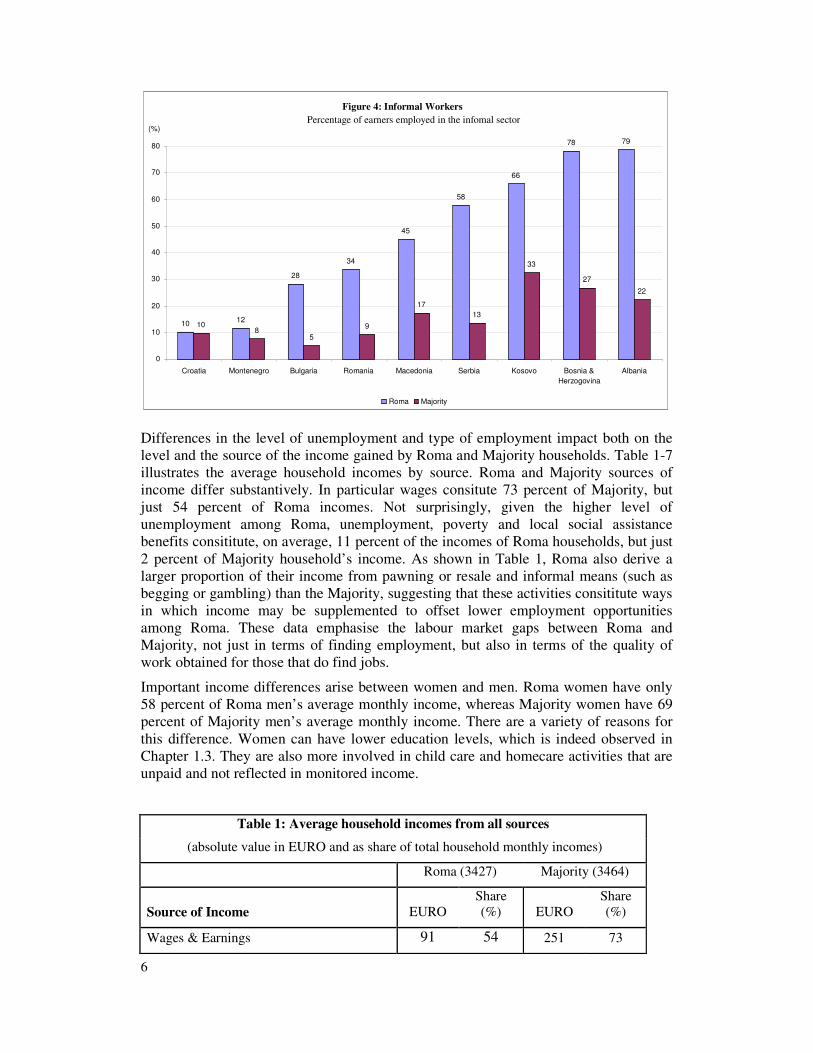
As shown in Figure 4 a large proportion of both Roma and Majority populations are believed to derive income from informal sector activities. These activities are often associated with low incomes, poor job quality, and weak social protection (ILO, 2002). As a whole, involvement in the informal sector is particularly high in Southeast Europe.6 Examining informal sector employment – i.e. activities for which income was not reported for tax and social purposes – across the region shows that Roma involvement in such activities is higher in each country in the region, and is on average four or more times more common as the involvement of the Majority in such activities.
6 Estimates in Schneider (2004) suggest that in 2002-03 the informal sector as a percentage of GDP in Southeast Europe was as follows: 35% in Albania, 37% in Bosnia & Herzegovina, 38% in Bulgaria, 35% in Croatia, 36% in Macedonia, 37% in Romania and 39% in Serbia & Montenegro. As productivity in the informal sector tends to be low, the percentage of total employment accounted for by the informal sector can reasonably be assumed to be higher than the estimates of the informal sector output as a percentage of overall GDP.
Figure 3: Differences in type of employment
Percentage of Roma and Majority employed in each sector
0 5 10 15 20 25
Trade
Agriculture and fores
Other not classified
Construction
Public utilities
Other commercial serv
Industry & Mining
Transportation
Leisure services
NGO sector
Culture and arts
Police and security
Education and science
Healthcare
Communication
Finances Majority
Roma
(%)
6
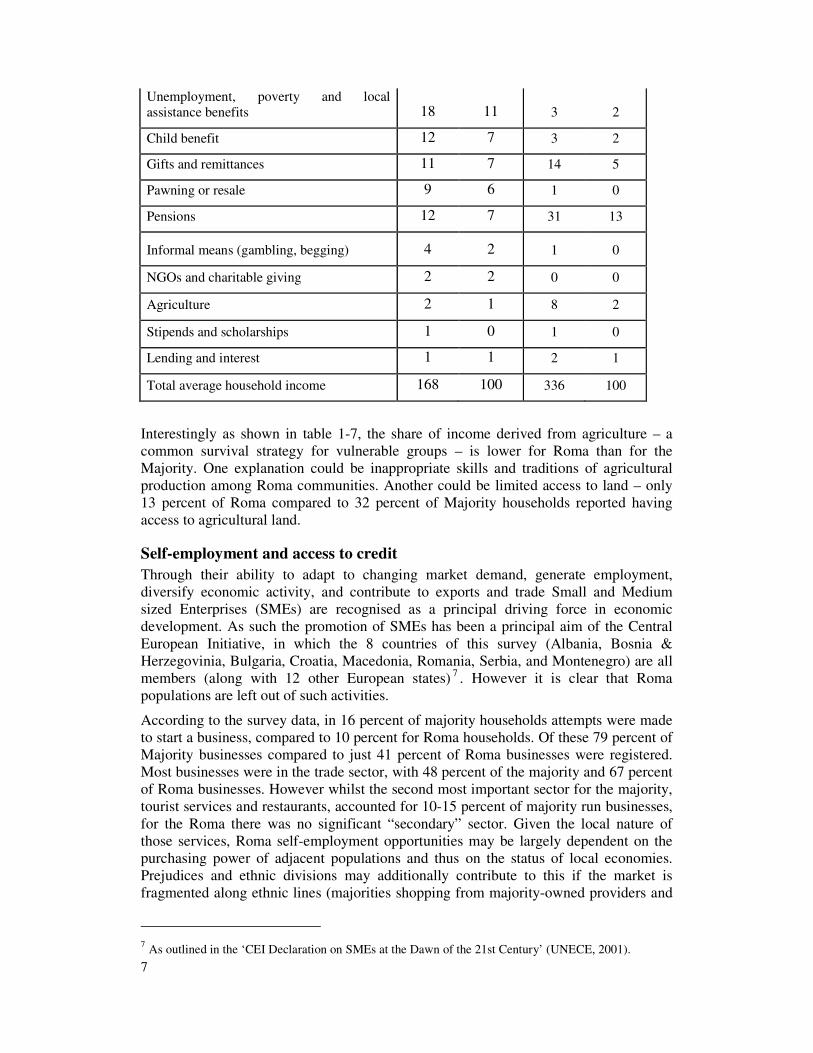
Differences in the level of unemployment and type of employment impact both on the level and the source of the income gained by Roma and Majority households. Table 1-7 illustrates the average household incomes by source. Roma and Majority sources of income differ substantively. In particular wages consitute 73 percent of Majority, but just 54 percent of Roma incomes. Not surprisingly, given the higher level of unemployment among Roma, unemployment, poverty and local social assistance benefits consititute, on average, 11 percent of the incomes of Roma households, but just 2 percent of Majority household’s income. As shown in Table 1, Roma also derive a larger proportion of their income from pawning or resale and informal means (such as begging or gambling) than the Majority, suggesting that these activities consititute ways in which income may be supplemented to offset lower employment opportunities among Roma. These data emphasise the labour market gaps between Roma and Majority, not just in terms of finding employment, but also in terms of the quality of work obtained for those that do find jobs.
Important income differences arise between women and men. Roma women have only 58 percent of Roma men’s average monthly income, whereas Majority women have 69 percent of Majority men’s average monthly income. There are a variety of reasons for this difference. Women can have lower education levels, which is indeed observed in Chapter 1.3. They are also more involved in child care and homecare activities that are unpaid and not reflected in monitored income.
Table 1: Average household incomes from all sources
(absolute value in EURO and as share of total household monthly incomes)
Roma (3427) Majority (3464)
Source of Income EURO Share (%) EURO
Share (%)
Wages & Earnings 91 54 251 73
Figure 4: Informal Workers Percentage of earners employed in the infomal sector
10 12
28 34
45
58
66
78 79
10 8
5 9
17 13
33 27
22
0
10
20
30
40
50
60
70
80
Croatia Montenegro Bulgaria Romania Macedonia Serbia Kosovo Bosnia & Herzogovina
Albania
Roma Majority
(%)
7
Unemployment, poverty and local assistance benefits 18 11 3 2
Child benefit 12 7 3 2
Gifts and remittances 11 7 14 5
Pawning or resale 9 6 1 0
Pensions 12 7 31 13
Informal means (gambling, begging) 4 2 1 0
NGOs and charitable giving 2 2 0 0
Agriculture 2 1 8 2
Stipends and scholarships 1 0 1 0
Lending and interest 1 1 2 1
Total average household income 168 100 336 100
Interestingly as shown in table 1-7, the share of income derived from agriculture – a common survival strategy for vulnerable groups – is lower for Roma than for the Majority. One explanation could be inappropriate skills and traditions of agricultural production among Roma communities. Another could be limited access to land – only 13 percent of Roma compared to 32 percent of Majority households reported having access to agricultural land.
Self-employment and access to credit
Through their ability to adapt to changing market demand, generate employment, diversify economic activity, and contribute to exports and trade Small and Medium sized Enterprises (SMEs) are recognised as a principal driving force in economic development. As such the promotion of SMEs has been a principal aim of the Central European Initiative, in which the 8 countries of this survey (Albania, Bosnia & Herzegovinia, Bulgaria, Croatia, Macedonia, Romania, Serbia, and Montenegro) are all members (along with 12 other European states) 7 . However it is clear that Roma populations are left out of such activities.
According to the survey data, in 16 percent of majority households attempts were made to start a business, compared to 10 percent for Roma households. Of these 79 percent of Majority businesses compared to just 41 percent of Roma businesses were registered. Most businesses were in the trade sector, with 48 percent of the majority and 67 percent of Roma businesses. However whilst the second most important sector for the majority, tourist services and restaurants, accounted for 10-15 percent of majority run businesses, for the Roma there was no significant “secondary” sector. Given the local nature of those services, Roma self-employment opportunities may be largely dependent on the purchasing power of adjacent populations and thus on the status of local economies. Prejudices and ethnic divisions may additionally contribute to this if the market is fragmented along ethnic lines (majorities shopping from majority-owned providers and
7 As outlined in the ‘CEI Declaration on SMEs at the Dawn of the 21st Century’ (UNECE, 2001).
8
minorities – from minority-own8). The low household income levels in and adjacent to Roma communities suggest that prospects for significant income generation via self-employment seem bleak.
Inadequate access to capital in general, and bank credit in particular, is typically a serious barrier to self-employment and entrepreneurial activities for vulnerable groups. The poor (over-represented among Roma) often have no access to formal financial institutions because of the high costs of time, money, and bureaucracy, the collateral requirements, and the unwillingness of these institutions to administer microcredits for the poor. Roma do have access to informal money lenders, but they charge ruinously high interest rates and are often linked to organized crime.
The absence of legal protection of vulnerable groups’ informal property rights is a major development issue – and unused opportunity. This limits the poor’s ability to collateralize their assets and thereby gain access to formal financial institutions.9 Legal reforms to redress these problems can have a huge impact in terms of poverty reduction, often opening the door for more intensive involvement of the private sector.10
On the one hand, microfinance has expanded in Central and Eastern Europe helping absorb the structural adjustment shocks and increase self-employment (Forster S. et al. 2003). The microfinance sector has developed somewhat “in parallel” to the formal banking, however, working largely at community level and involving NGOs rather than banks per se.
For many commercial banks, microlending is unattractive for several reasons. First, small loans are more expensive to administer (on a per unit basis) and bring lower returns: administering a small loan is not much cheaper than administering a larger one, while the return on the latter is considerably greater. Second, vulnerable groups, especially the poor, have difficulties in providing collateral. Third, small entrepreneurs usually do not follow strict accounting rules, making it difficult for bankers to assess their creditworthiness. Fourth, many micro- and small-scale entrepreneurs (including the poor) lack the experience (and sometimes the ability) needed to write the business plans that are required for bank loans. As a result, both banks and micro-entrepreneurs have rational reasons to avoid each other. Microlending remains largely outside the scope of banks, which prefer upstream clients. Vulnerable groups such as Roma rarely qualify as “upstream clients”.
Data from the survey suggest that Roma and majority do use credit, however. They also show that the three major barriers to bank credit - lack of collateral, lack of credit history, and lack of skills - are more pronounced for the Roma than for the majorities living in close proximity to Roma. Data show that Roma in Southeast Europe have less access to credit from commercial banks than do majority populations living nearby. 26 percent of the majority households surveyed said they had used some type of credit, compared with 15% of Roma households.
8 This is more obvious in the case of post-conflict regions where boycotting of the former adversaries’ businesses is often the follow-up to open conflict.
9 Hernan De Soto, 2003: The Mystery of Capital,: Why Capitalism Triumphs in the West and Fails Everywhere Else, Basic Books, 2003.
10 See UNDP, 2004: Unleashing Enrtrereneurship; UNDP, 2005: Employing The Roma. Insights from the
business. UNDP: Bratislava.
9
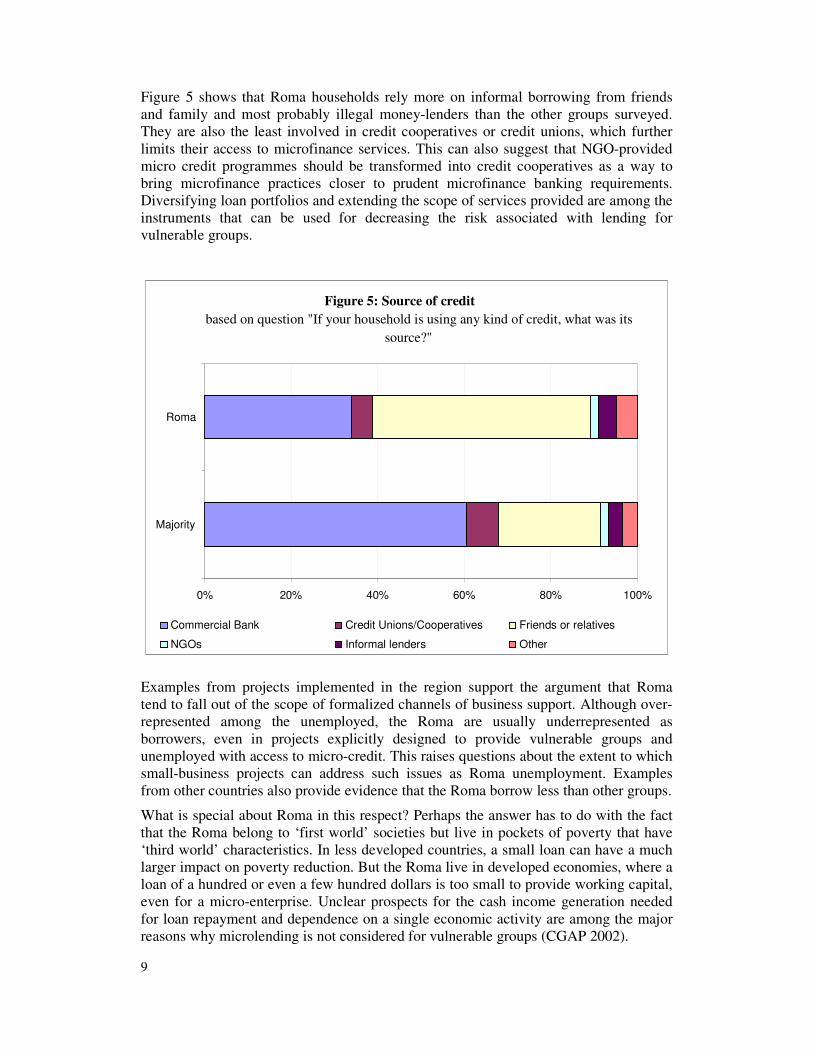
Figure 5 shows that Roma households rely more on informal borrowing from friends and family and most probably illegal money-lenders than the other groups surveyed. They are also the least involved in credit cooperatives or credit unions, which further limits their access to microfinance services. This can also suggest that NGO-provided micro credit programmes should be transformed into credit cooperatives as a way to bring microfinance practices closer to prudent microfinance banking requirements. Diversifying loan portfolios and extending the scope of services provided are among the instruments that can be used for decreasing the risk associated with lending for vulnerable groups.
Examples from projects implemented in the region support the argument that Roma tend to fall out of the scope of formalized channels of business support. Although over-represented among the unemployed, the Roma are usually underrepresented as borrowers, even in projects explicitly designed to provide vulnerable groups and unemployed with access to micro-credit. This raises questions about the extent to which small-business projects can address such issues as Roma unemployment. Examples from other countries also provide evidence that the Roma borrow less than other groups.
What is special about Roma in this respect? Perhaps the answer has to do with the fact that the Roma belong to ‘first world’ societies but live in pockets of poverty that have ‘third world’ characteristics. In less developed countries, a small loan can have a much larger impact on poverty reduction. But the Roma live in developed economies, where a loan of a hundred or even a few hundred dollars is too small to provide working capital, even for a micro-enterprise. Unclear prospects for the cash income generation needed for loan repayment and dependence on a single economic activity are among the major reasons why microlending is not considered for vulnerable groups (CGAP 2002).
Figure 5: Source of credit
based on question "If your household is using any kind of credit, what was its
source?"
0% 20% 40% 60% 80% 100%
Majority
Roma
Commercial Bank Credit Unions/Cooperatives Friends or relatives
NGOs Informal lenders Other
10
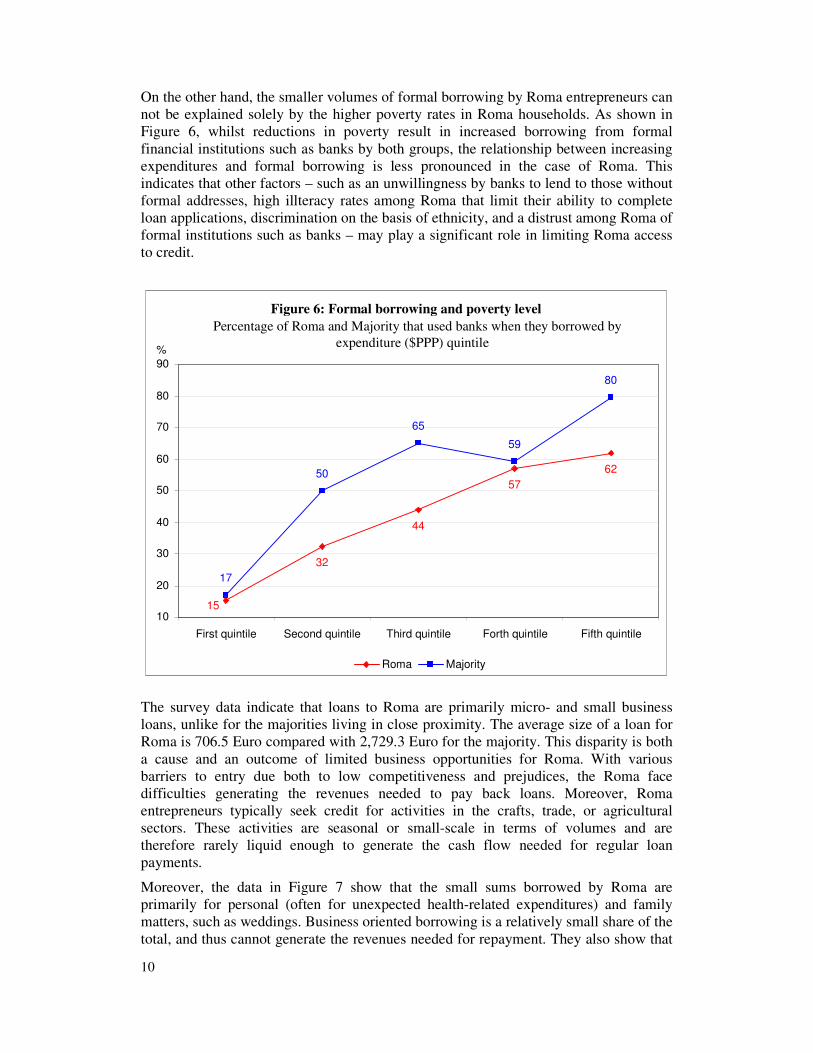
On the other hand, the smaller volumes of formal borrowing by Roma entrepreneurs can not be explained solely by the higher poverty rates in Roma households. As shown in Figure 6, whilst reductions in poverty result in increased borrowing from formal financial institutions such as banks by both groups, the relationship between increasing expenditures and formal borrowing is less pronounced in the case of Roma. This indicates that other factors – such as an unwillingness by banks to lend to those without formal addresses, high illteracy rates among Roma that limit their ability to complete loan applications, discrimination on the basis of ethnicity, and a distrust among Roma of formal institutions such as banks – may play a significant role in limiting Roma access to credit.
The survey data indicate that loans to Roma are primarily micro- and small business loans, unlike for the majorities living in close proximity. The average size of a loan for Roma is 706.5 Euro compared with 2,729.3 Euro for the majority. This disparity is both a cause and an outcome of limited business opportunities for Roma. With various barriers to entry due both to low competitiveness and prejudices, the Roma face difficulties generating the revenues needed to pay back loans. Moreover, Roma entrepreneurs typically seek credit for activities in the crafts, trade, or agricultural sectors. These activities are seasonal or small-scale in terms of volumes and are therefore rarely liquid enough to generate the cash flow needed for regular loan payments.
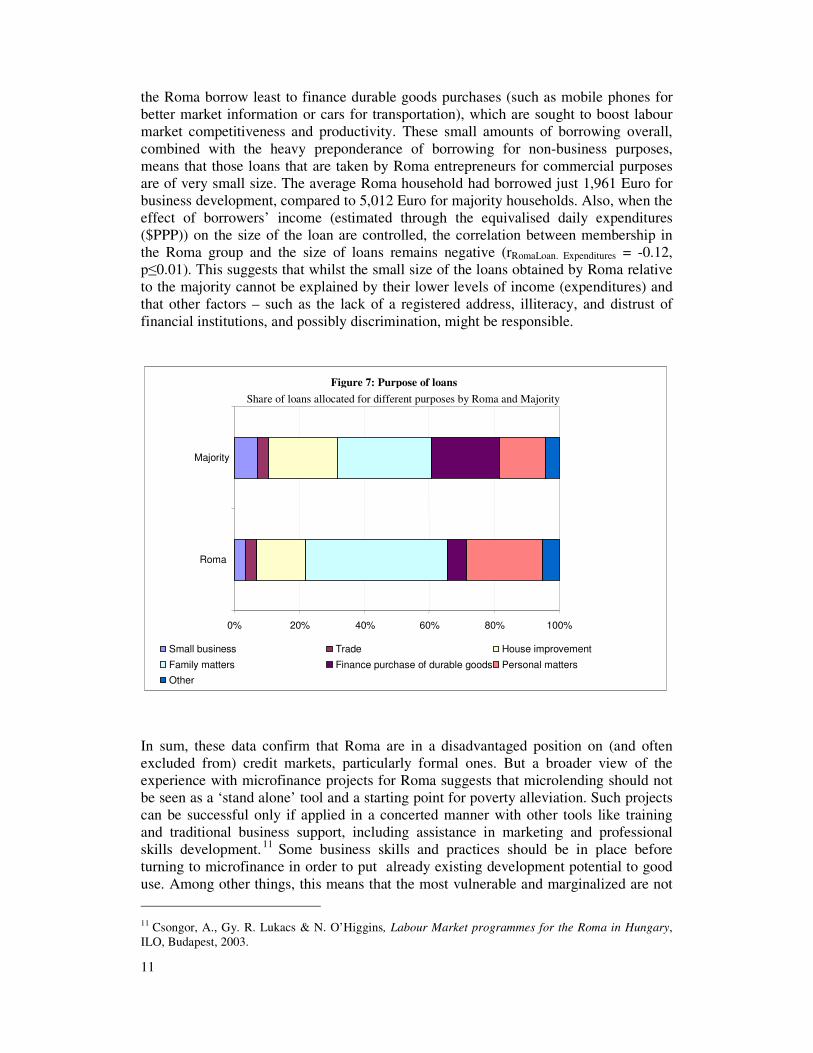
Moreover, the data in Figure 7 show that the small sums borrowed by Roma are primarily for personal (often for unexpected health-related expenditures) and family matters, such as weddings. Business oriented borrowing is a relatively small share of the total, and thus cannot generate the revenues needed for repayment. They also show that
Figure 6: Formal borrowing and poverty level
Percentage of Roma and Majority that used banks when they borrowed by
expenditure ($PPP) quintile
44
57 62
17
59
32
15
80
65
50
10
20
30
40
50
60
70
80
90
First quintile Second quintile Third quintile Forth quintile Fifth quintile
Roma Majority
%
11
the Roma borrow least to finance durable goods purchases (such as mobile phones for better market information or cars for transportation), which are sought to boost labour market competitiveness and productivity. These small amounts of borrowing overall, combined with the heavy preponderance of borrowing for non-business purposes, means that those loans that are taken by Roma entrepreneurs for commercial purposes are of very small size. The average Roma household had borrowed just 1,961 Euro for business development, compared to 5,012 Euro for majority households. Also, when the effect of borrowers’ income (estimated through the equivalised daily expenditures ($PPP)) on the size of the loan are controlled, the correlation between membership in the Roma group and the size of loans remains negative (rRomaLoan. Expenditures = -0.12, p≤0.01). This suggests that whilst the small size of the loans obtained by Roma relative to the majority cannot be explained by their lower levels of income (expenditures) and that other factors – such as the lack of a registered address, illiteracy, and distrust of financial institutions, and possibly discrimination, might be responsible.
In sum, these data confirm that Roma are in a disadvantaged position on (and often excluded from) credit markets, particularly formal ones. But a broader view of the experience with microfinance projects for Roma suggests that microlending should not be seen as a ‘stand alone’ tool and a starting point for poverty alleviation. Such projects can be successful only if applied in a concerted manner with other tools like training and traditional business support, including assistance in marketing and professional skills development. 11 Some business skills and practices should be in place before turning to microfinance in order to put already existing development potential to good use. Among other things, this means that the most vulnerable and marginalized are not
11 Csongor, A., Gy. R. Lukacs & N. O’Higgins, Labour Market programmes for the Roma in Hungary, ILO, Budapest, 2003.
Figure 7: Purpose of loans
Share of loans allocated for different purposes by Roma and Majority
0% 20% 40% 60% 80% 100%
Roma
Majority
Small business Trade House improvement Family matters Finance purchase of durable goods Personal matters Other
12
the best target groups for such projects, but should instead be aided through other activities with a strong community development focus.
The Decade Action Plans focus particularly on self-employment and entrepreneurship. Measures range from providing business and qualification trainings, establishing cooperatives in the agricultural sector, to promoting Roma handcrafts. It remains to be seen whether these measures will be planned with a concrete focus on market demands and sustainability. Promoting entrepreneurship among Roma has to go beyond traditional Roma products and focus on current market demands.
Correlates of Employment
Age
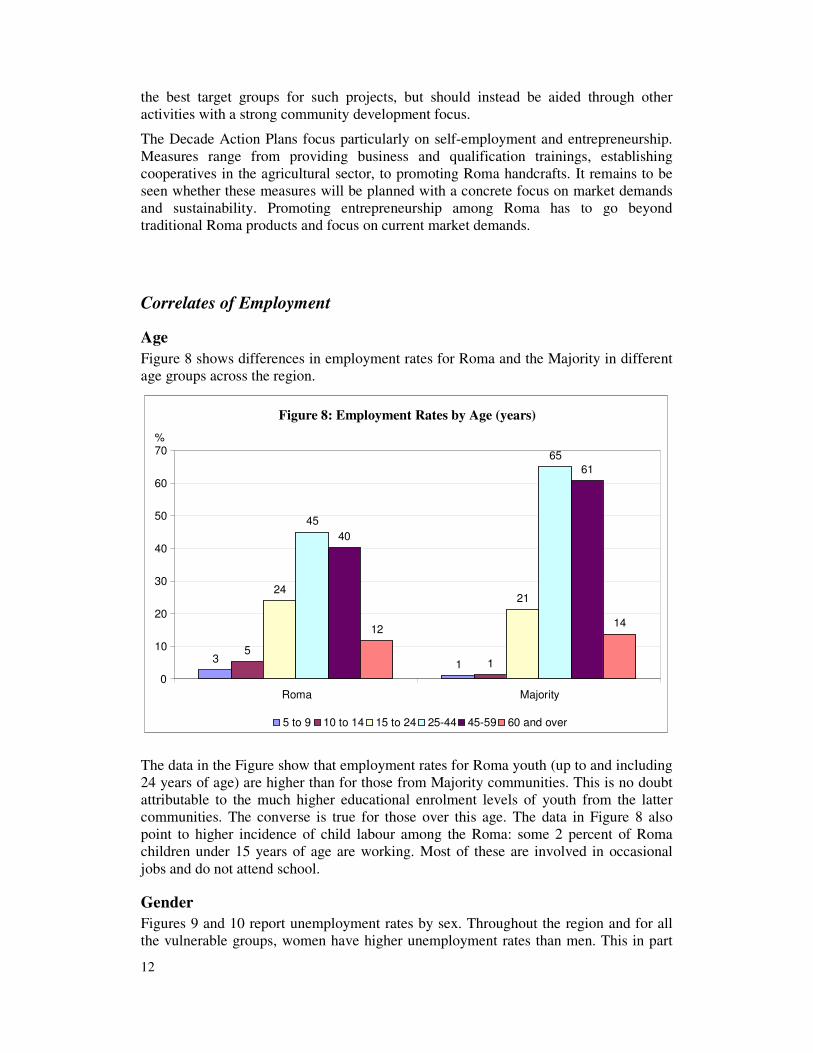
Figure 8 shows differences in employment rates for Roma and the Majority in different age groups across the region.
The data in the Figure show that employment rates for Roma youth (up to and including 24 years of age) are higher than for those from Majority communities. This is no doubt attributable to the much higher educational enrolment levels of youth from the latter communities. The converse is true for those over this age. The data in Figure 8 also point to higher incidence of child labour among the Roma: some 2 percent of Roma children under 15 years of age are working. Most of these are involved in occasional jobs and do not attend school.
Gender
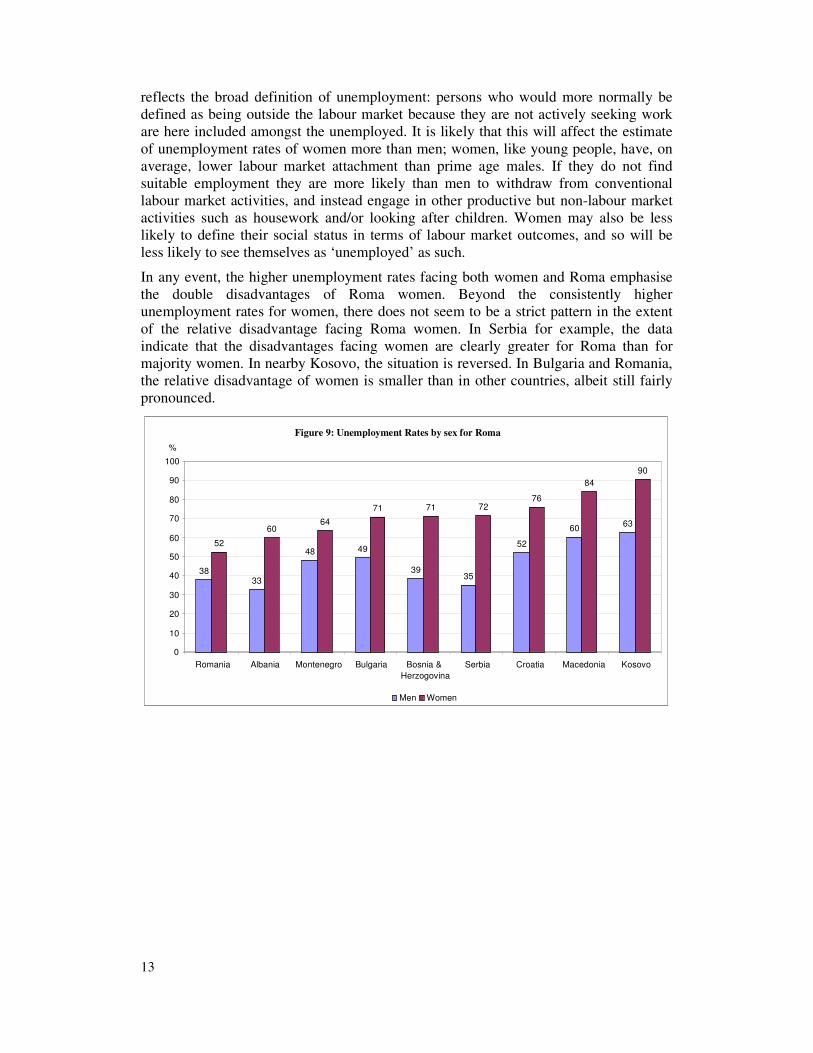
Figures 9 and 10 report unemployment rates by sex. Throughout the region and for all the vulnerable groups, women have higher unemployment rates than men. This in part
Figure 8: Employment Rates by Age (years)
3 1
5 1
24 21
45
65
40
61
12 14
0
10
20
30
40
50
60
70
Roma Majority
5 to 9 10 to 14 15 to 24 25-44 45-59 60 and over
%
13
reflects the broad definition of unemployment: persons who would more normally be defined as being outside the labour market because they are not actively seeking work are here included amongst the unemployed. It is likely that this will affect the estimate of unemployment rates of women more than men; women, like young people, have, on average, lower labour market attachment than prime age males. If they do not find suitable employment they are more likely than men to withdraw from conventional labour market activities, and instead engage in other productive but non-labour market activities such as housework and/or looking after children. Women may also be less likely to define their social status in terms of labour market outcomes, and so will be less likely to see themselves as ‘unemployed’ as such.
In any event, the higher unemployment rates facing both women and Roma emphasise the double disadvantages of Roma women. Beyond the consistently higher unemployment rates for women, there does not seem to be a strict pattern in the extent of the relative disadvantage facing Roma women. In Serbia for example, the data indicate that the disadvantages facing women are clearly greater for Roma than for majority women. In nearby Kosovo, the situation is reversed. In Bulgaria and Romania, the relative disadvantage of women is smaller than in other countries, albeit still fairly pronounced.
Figure 9: Unemployment Rates by sex for Roma
38 33
48 49
39 35
52 60 63
52 60
64 71 71 72
76 84
90
0
10
20
30
40
50
60
70
80
90
100
Romania Albania Montenegro Bulgaria Bosnia & Herzogovina
Serbia Croatia Macedonia Kosovo
%
Men Women
14
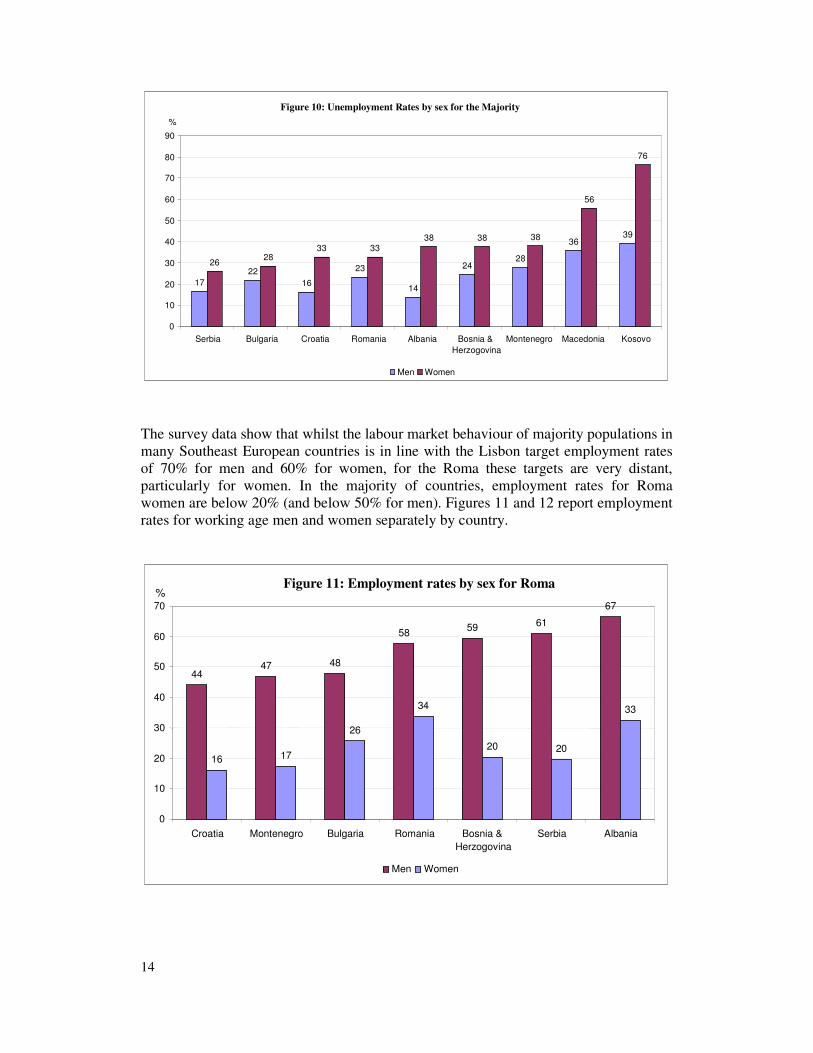
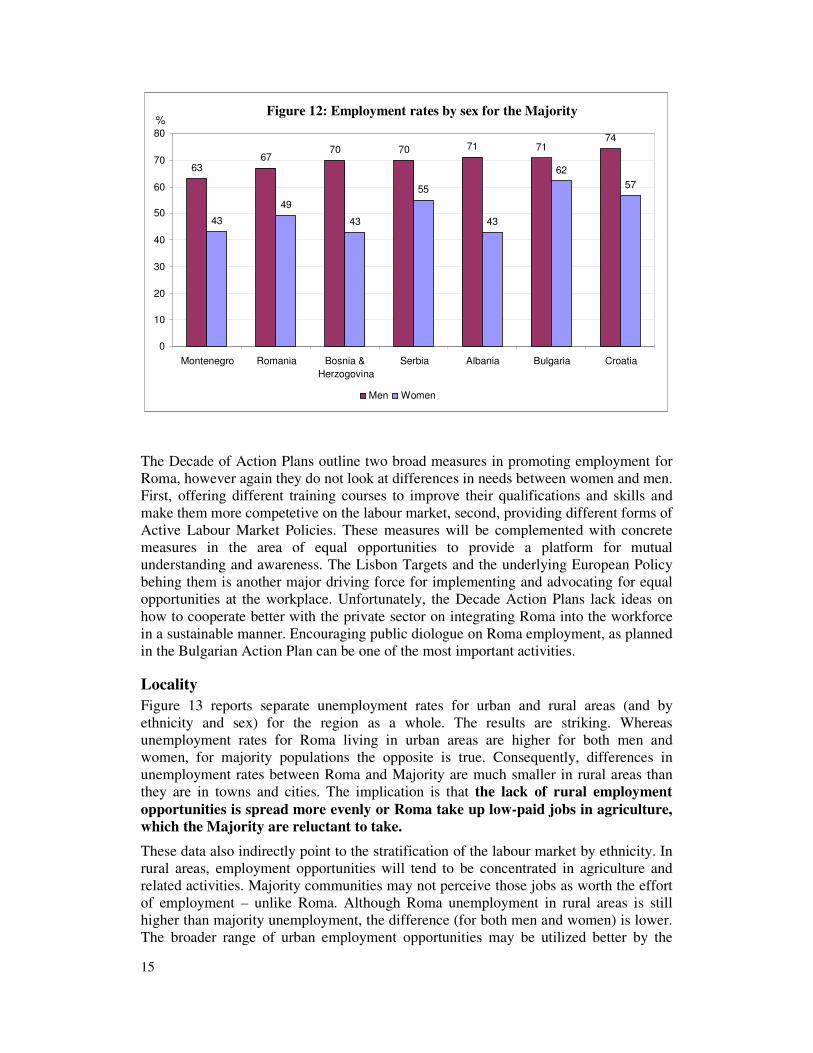
The survey data show that whilst the labour market behaviour of majority populations in many Southeast European countries is in line with the Lisbon target employment rates of 70% for men and 60% for women, for the Roma these targets are very distant, particularly for women. In the majority of countries, employment rates for Roma women are below 20% (and below 50% for men). Figures 11 and 12 report employment rates for working age men and women separately by country.
Figure 10: Unemployment Rates by sex for the Majority
17 22
16 23
14
24 28
36 39
26 28 33 33
38 38 38
56
76
0
10
20
30
40
50
60
70
80
90
Serbia Bulgaria Croatia Romania Albania Bosnia & Herzogovina
Montenegro Macedonia Kosovo
%
Men Women
Figure 11: Employment rates by sex for Roma
44 47 48
58 59 61
67
16 17
26
34
20 20
33
0
10
20
30
40
50
60
70
Croatia Montenegro Bulgaria Romania Bosnia & Herzogovina
Serbia Albania
Men Women
%
15
The Decade of Action Plans outline two broad measures in promoting employment for Roma, however again they do not look at differences in needs between women and men. First, offering different training courses to improve their qualifications and skills and make them more competetive on the labour market, second, providing different forms of Active Labour Market Policies. These measures will be complemented with concrete measures in the area of equal opportunities to provide a platform for mutual understanding and awareness. The Lisbon Targets and the underlying European Policy behing them is another major driving force for implementing and advocating for equal opportunities at the workplace. Unfortunately, the Decade Action Plans lack ideas on how to cooperate better with the private sector on integrating Roma into the workforce in a sustainable manner. Encouraging public diologue on Roma employment, as planned in the Bulgarian Action Plan can be one of the most important activities.
Locality
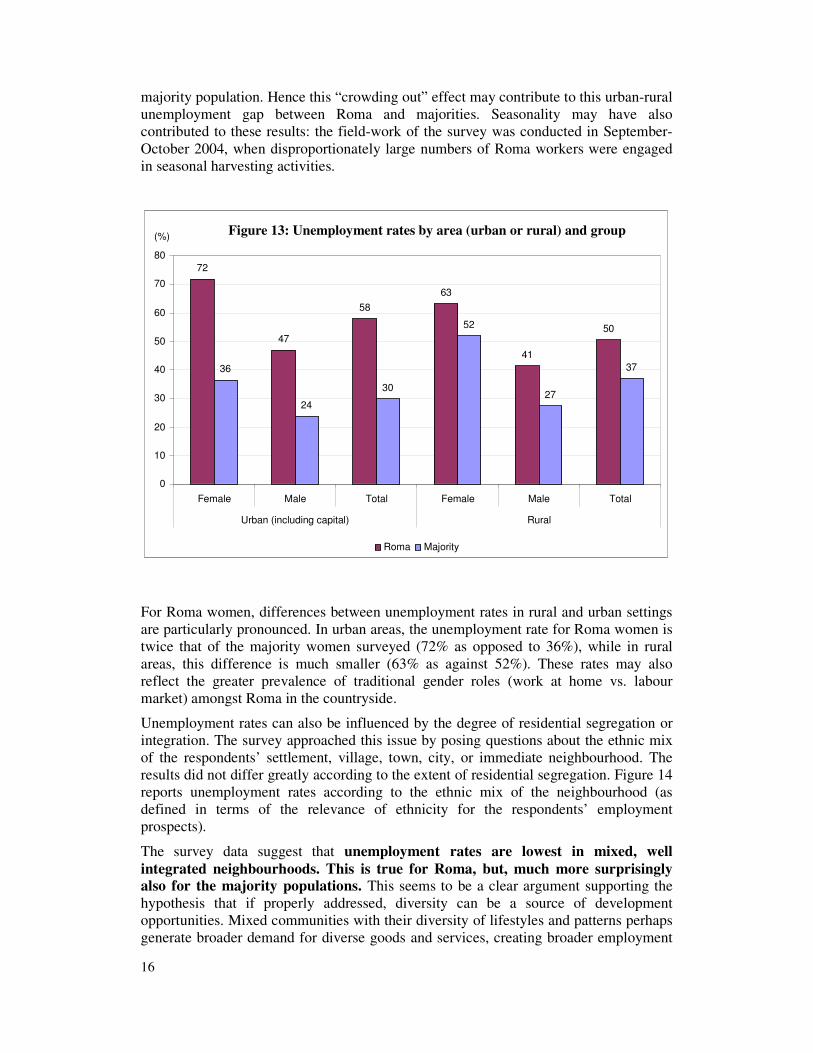
Figure 13 reports separate unemployment rates for urban and rural areas (and by ethnicity and sex) for the region as a whole. The results are striking. Whereas unemployment rates for Roma living in urban areas are higher for both men and women, for majority populations the opposite is true. Consequently, differences in unemployment rates between Roma and Majority are much smaller in rural areas than they are in towns and cities. The implication is that the lack of rural employment
opportunities is spread more evenly or Roma take up low-paid jobs in agriculture,
which the Majority are reluctant to take.
These data also indirectly point to the stratification of the labour market by ethnicity. In rural areas, employment opportunities will tend to be concentrated in agriculture and related activities. Majority communities may not perceive those jobs as worth the effort of employment – unlike Roma. Although Roma unemployment in rural areas is still higher than majority unemployment, the difference (for both men and women) is lower. The broader range of urban employment opportunities may be utilized better by the
Figure 12: Employment rates by sex for the Majority
63 67
70 70 71 71 74
43 49
43
55
43
62 57
0
10
20
30
40
50
60
70
80
Montenegro Romania Bosnia & Herzogovina
Serbia Albania Bulgaria Croatia
Men Women
%
16
majority population. Hence this “crowding out” effect may contribute to this urban-rural unemployment gap between Roma and majorities. Seasonality may have also contributed to these results: the field-work of the survey was conducted in September-October 2004, when disproportionately large numbers of Roma workers were engaged in seasonal harvesting activities.
For Roma women, differences between unemployment rates in rural and urban settings are particularly pronounced. In urban areas, the unemployment rate for Roma women is twice that of the majority women surveyed (72% as opposed to 36%), while in rural areas, this difference is much smaller (63% as against 52%). These rates may also reflect the greater prevalence of traditional gender roles (work at home vs. labour market) amongst Roma in the countryside.
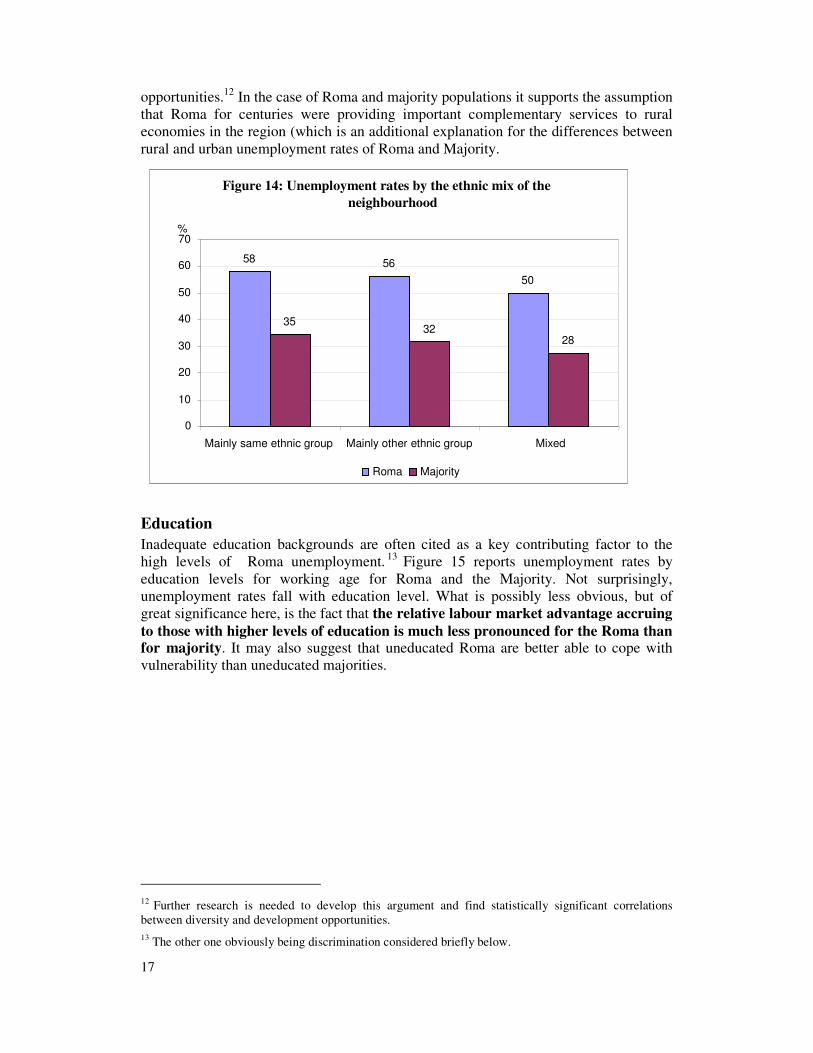
Unemployment rates can also be influenced by the degree of residential segregation or integration. The survey approached this issue by posing questions about the ethnic mix of the respondents’ settlement, village, town, city, or immediate neighbourhood. The results did not differ greatly according to the extent of residential segregation. Figure 14 reports unemployment rates according to the ethnic mix of the neighbourhood (as defined in terms of the relevance of ethnicity for the respondents’ employment prospects).
The survey data suggest that unemployment rates are lowest in mixed, well
integrated neighbourhoods. This is true for Roma, but, much more surprisingly also for the majority populations. This seems to be a clear argument supporting the hypothesis that if properly addressed, diversity can be a source of development opportunities. Mixed communities with their diversity of lifestyles and patterns perhaps generate broader demand for diverse goods and services, creating broader employment
Figure 13: Unemployment rates by area (urban or rural) and group
72
47
58 63
41
50
36
24
30
52
27
37
0
10
20
30
40
50
60
70
80
Female Male Total Female Male Total
Urban (including capital) Rural
Roma Majority
(%)
17
opportunities.12 In the case of Roma and majority populations it supports the assumption that Roma for centuries were providing important complementary services to rural economies in the region (which is an additional explanation for the differences between rural and urban unemployment rates of Roma and Majority.
Education
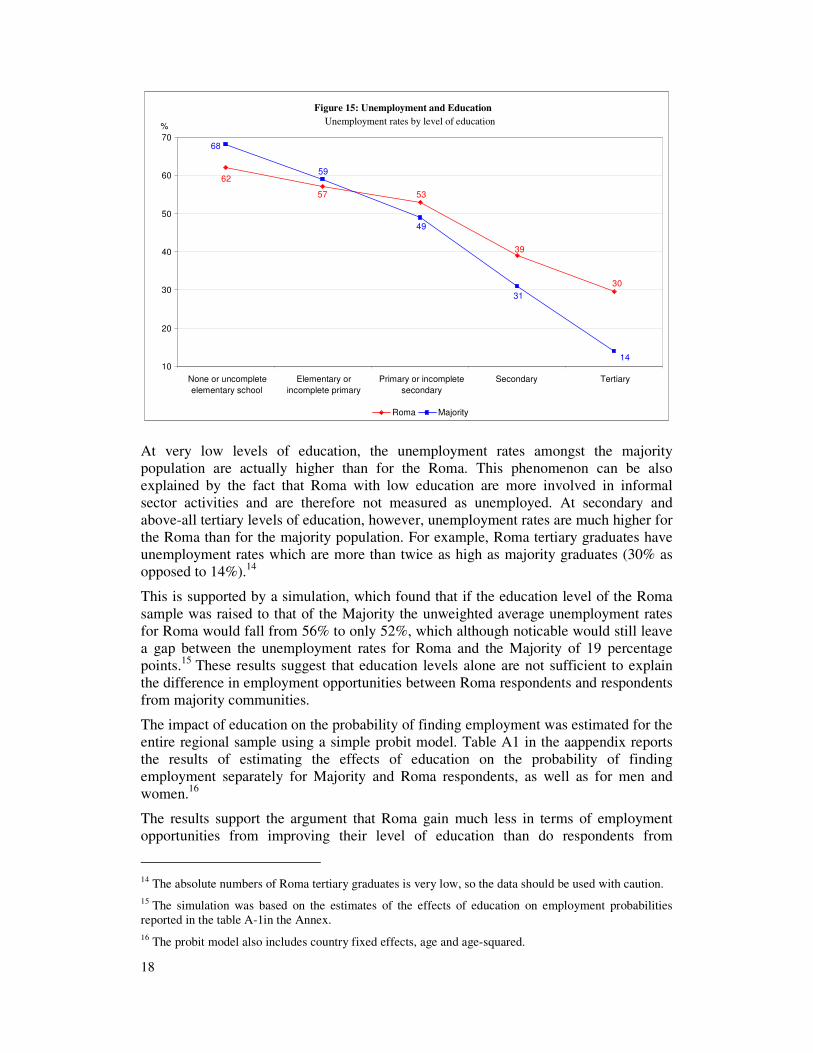
Inadequate education backgrounds are often cited as a key contributing factor to the high levels of Roma unemployment. 13 Figure 15 reports unemployment rates by education levels for working age for Roma and the Majority. Not surprisingly, unemployment rates fall with education level. What is possibly less obvious, but of great significance here, is the fact that the relative labour market advantage accruing
to those with higher levels of education is much less pronounced for the Roma than for majority. It may also suggest that uneducated Roma are better able to cope with vulnerability than uneducated majorities.
12 Further research is needed to develop this argument and find statistically significant correlations between diversity and development opportunities.
13 The other one obviously being discrimination considered briefly below.
Figure 14: Unemployment rates by the ethnic mix of the
neighbourhood
58 56
50
35 32
28
0
10
20
30
40
50
60
70
Mainly same ethnic group Mainly other ethnic group Mixed
%
Roma Majority
18
At very low levels of education, the unemployment rates amongst the majority population are actually higher than for the Roma. This phenomenon can be also explained by the fact that Roma with low education are more involved in informal sector activities and are therefore not measured as unemployed. At secondary and above-all tertiary levels of education, however, unemployment rates are much higher for the Roma than for the majority population. For example, Roma tertiary graduates have unemployment rates which are more than twice as high as majority graduates (30% as opposed to 14%).14
This is supported by a simulation, which found that if the education level of the Roma sample was raised to that of the Majority the unweighted average unemployment rates for Roma would fall from 56% to only 52%, which although noticable would still leave a gap between the unemployment rates for Roma and the Majority of 19 percentage points.15 These results suggest that education levels alone are not sufficient to explain the difference in employment opportunities between Roma respondents and respondents from majority communities.
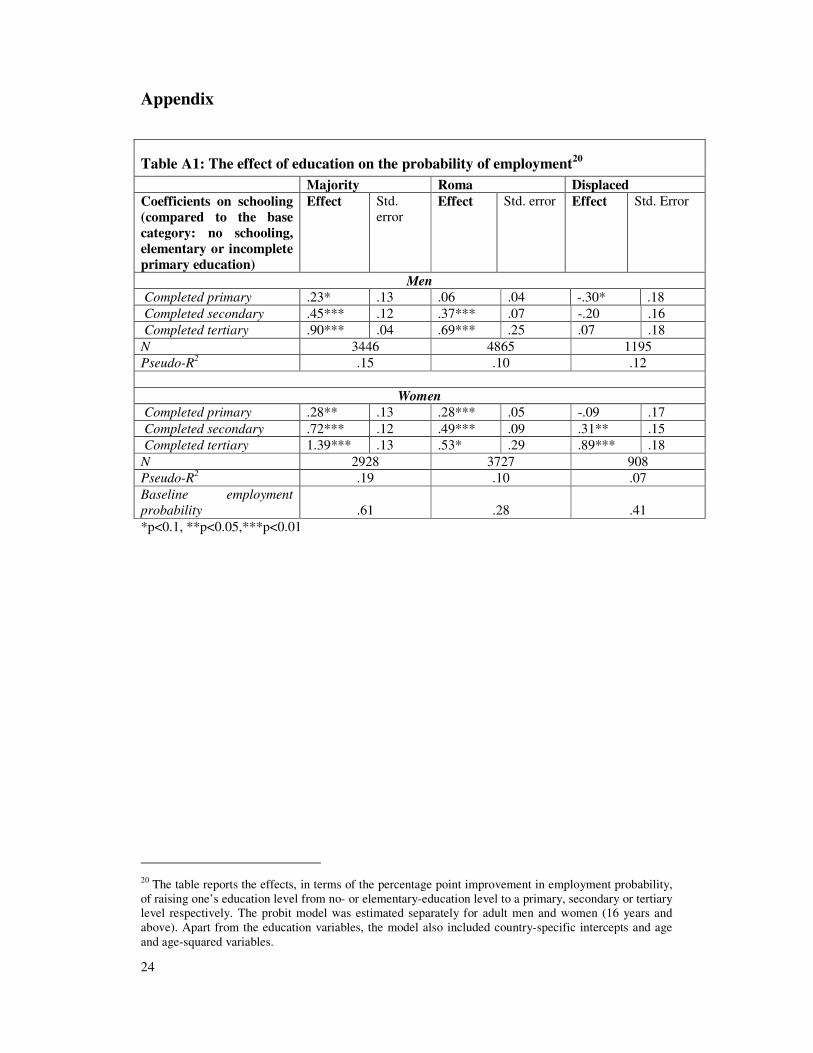
The impact of education on the probability of finding employment was estimated for the entire regional sample using a simple probit model. Table A1 in the aappendix reports the results of estimating the effects of education on the probability of finding employment separately for Majority and Roma respondents, as well as for men and women.16
The results support the argument that Roma gain much less in terms of employment opportunities from improving their level of education than do respondents from
14 The absolute numbers of Roma tertiary graduates is very low, so the data should be used with caution.
15 The simulation was based on the estimates of the effects of education on employment probabilities reported in the table A-1in the Annex.
16 The probit model also includes country fixed effects, age and age-squared.
Figure 15: Unemployment and Education Unemployment rates by level of education
30
39
53 57 62
68
59
49
14
31
10
20
30
40
50
60
70
None or uncomplete elementary school
Elementary or incomplete primary
Primary or incomplete secondary
Secondary Tertiary
%
Roma Majority
19
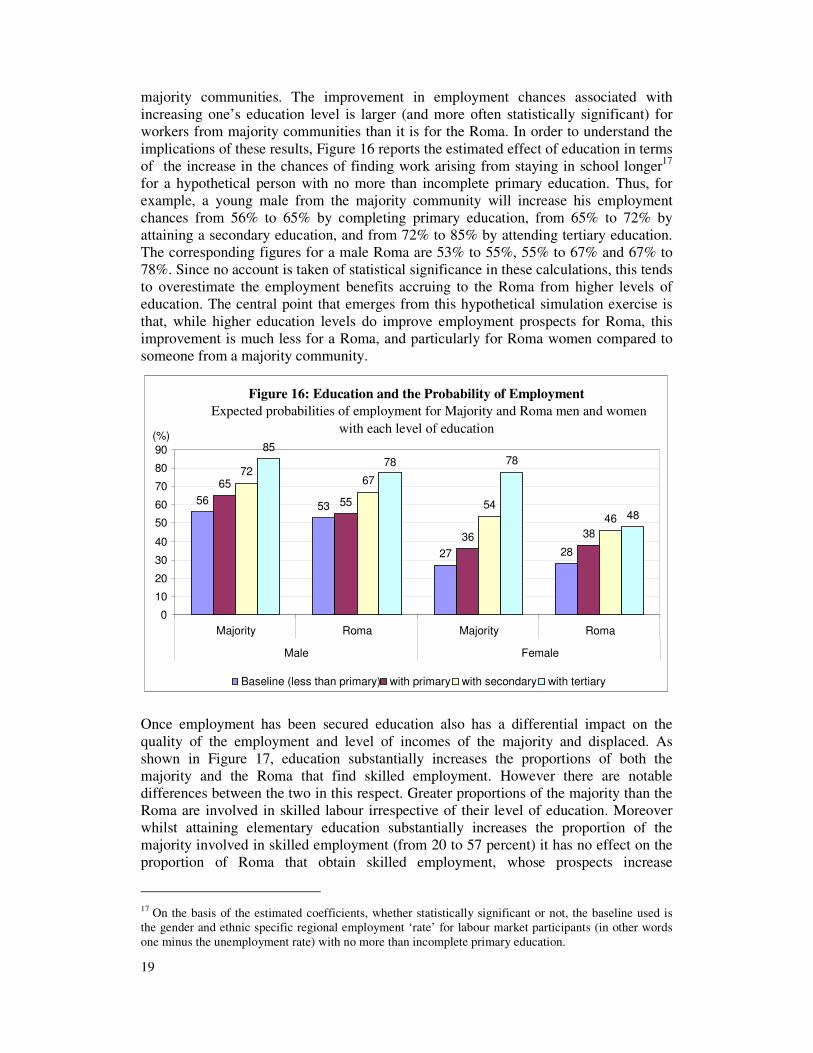
majority communities. The improvement in employment chances associated with increasing one’s education level is larger (and more often statistically significant) for workers from majority communities than it is for the Roma. In order to understand the implications of these results, Figure 16 reports the estimated effect of education in terms of the increase in the chances of finding work arising from staying in school longer17 for a hypothetical person with no more than incomplete primary education. Thus, for example, a young male from the majority community will increase his employment chances from 56% to 65% by completing primary education, from 65% to 72% by attaining a secondary education, and from 72% to 85% by attending tertiary education. The corresponding figures for a male Roma are 53% to 55%, 55% to 67% and 67% to 78%. Since no account is taken of statistical significance in these calculations, this tends to overestimate the employment benefits accruing to the Roma from higher levels of education. The central point that emerges from this hypothetical simulation exercise is that, while higher education levels do improve employment prospects for Roma, this improvement is much less for a Roma, and particularly for Roma women compared to someone from a majority community.
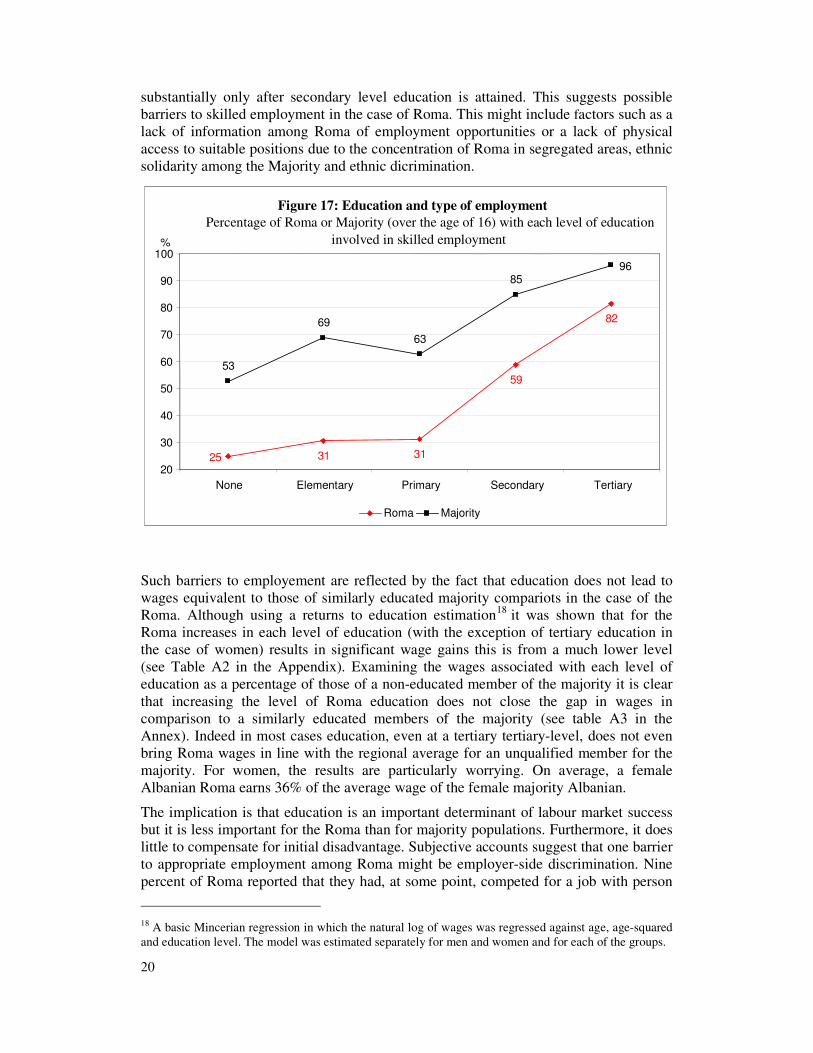
Once employment has been secured education also has a differential impact on the quality of the employment and level of incomes of the majority and displaced. As shown in Figure 17, education substantially increases the proportions of both the majority and the Roma that find skilled employment. However there are notable differences between the two in this respect. Greater proportions of the majority than the Roma are involved in skilled labour irrespective of their level of education. Moreover whilst attaining elementary education substantially increases the proportion of the majority involved in skilled employment (from 20 to 57 percent) it has no effect on the proportion of Roma that obtain skilled employment, whose prospects increase
17 On the basis of the estimated coefficients, whether statistically significant or not, the baseline used is the gender and ethnic specific regional employment ‘rate’ for labour market participants (in other words one minus the unemployment rate) with no more than incomplete primary education.
Figure 16: Education and the Probability of Employment
Expected probabilities of employment for Majority and Roma men and women
with each level of education
56 53
27 28
65
55
36 38
72 67
54 46
85 78
48
78
0
10
20
30
40
50
60
70
80
90
Majority Roma Majority Roma
Male Female
Baseline (less than primary) with primary with secondary with tertiary
(%)
20
substantially only after secondary level education is attained. This suggests possible barriers to skilled employment in the case of Roma. This might include factors such as a lack of information among Roma of employment opportunities or a lack of physical access to suitable positions due to the concentration of Roma in segregated areas, ethnic solidarity among the Majority and ethnic dicrimination.
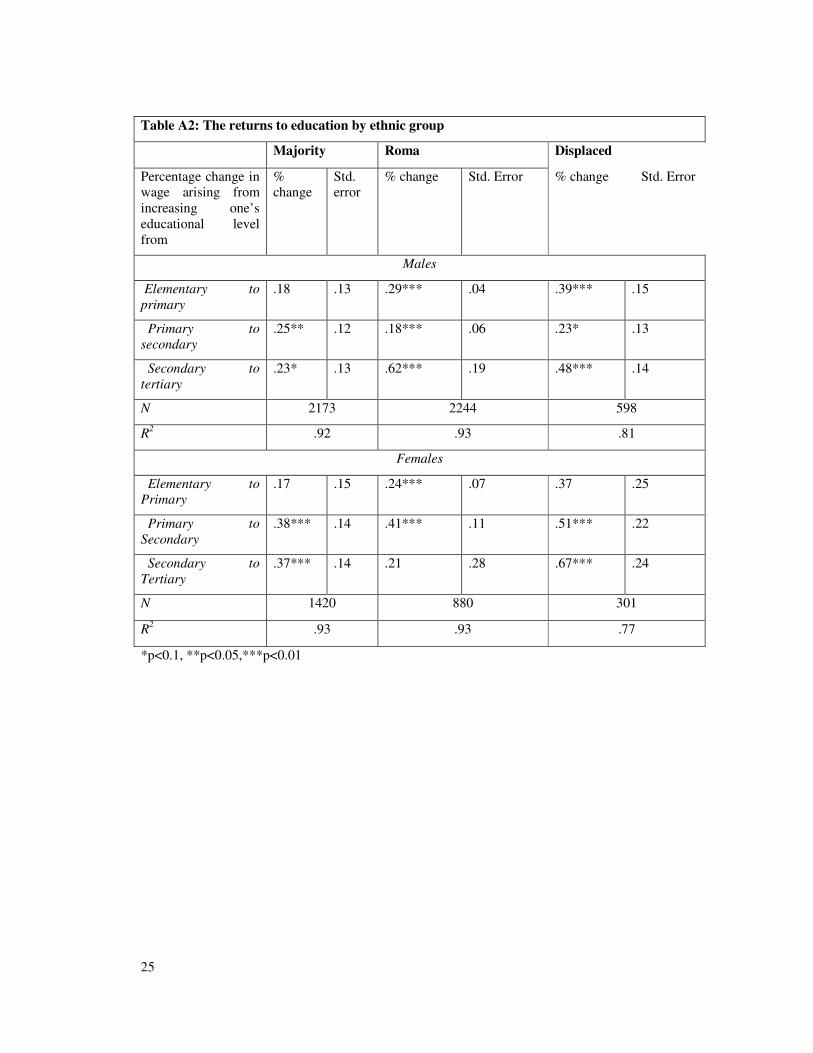
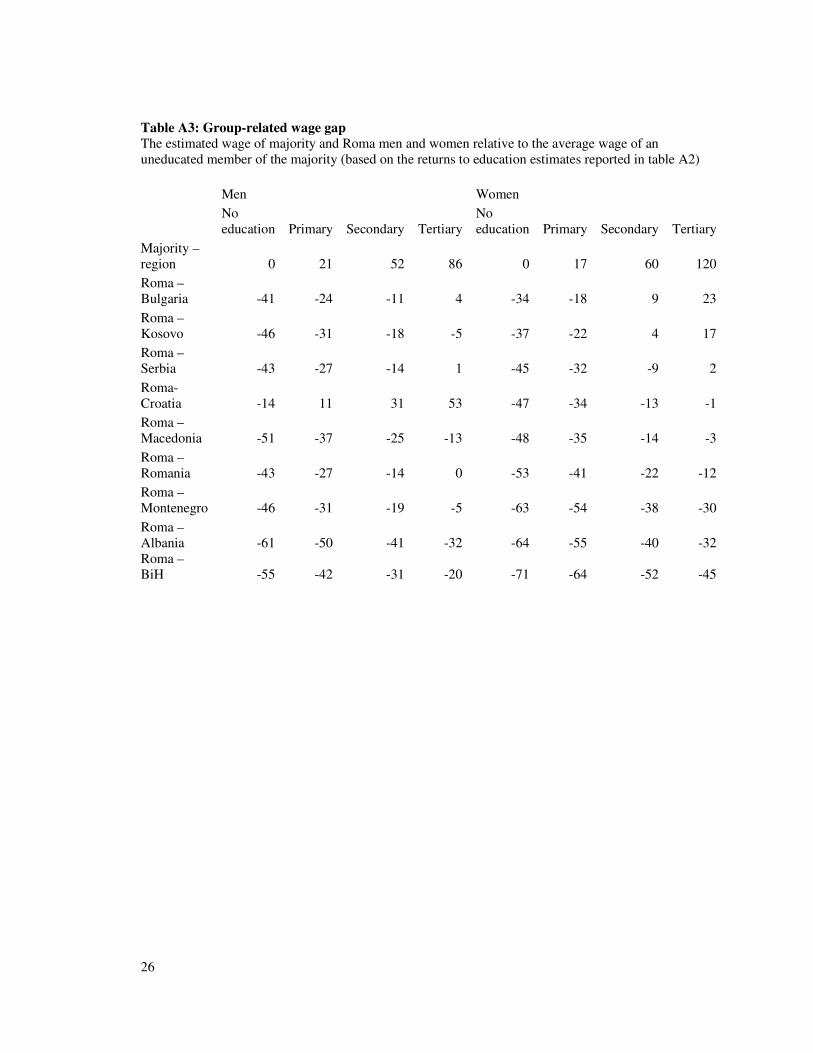
Such barriers to employement are reflected by the fact that education does not lead to wages equivalent to those of similarly educated majority compariots in the case of the Roma. Although using a returns to education estimation18 it was shown that for the Roma increases in each level of education (with the exception of tertiary education in the case of women) results in significant wage gains this is from a much lower level (see Table A2 in the Appendix). Examining the wages associated with each level of education as a percentage of those of a non-educated member of the majority it is clear that increasing the level of Roma education does not close the gap in wages in comparison to a similarly educated members of the majority (see table A3 in the Annex). Indeed in most cases education, even at a tertiary tertiary-level, does not even bring Roma wages in line with the regional average for an unqualified member for the majority. For women, the results are particularly worrying. On average, a female Albanian Roma earns 36% of the average wage of the female majority Albanian.
The implication is that education is an important determinant of labour market success but it is less important for the Roma than for majority populations. Furthermore, it does little to compensate for initial disadvantage. Subjective accounts suggest that one barrier to appropriate employment among Roma might be employer-side discrimination. Nine percent of Roma reported that they had, at some point, competed for a job with person
18 A basic Mincerian regression in which the natural log of wages was regressed against age, age-squared and education level. The model was estimated separately for men and women and for each of the groups.
Figure 17: Education and type of employment
Percentage of Roma or Majority (over the age of 16) with each level of education
involved in skilled employment
31 31
59
82
53
69
63
85
25
96
20
30
40
50
60
70
80
90
100
None Elementary Primary Secondary Tertiary
Roma Majority
%
21
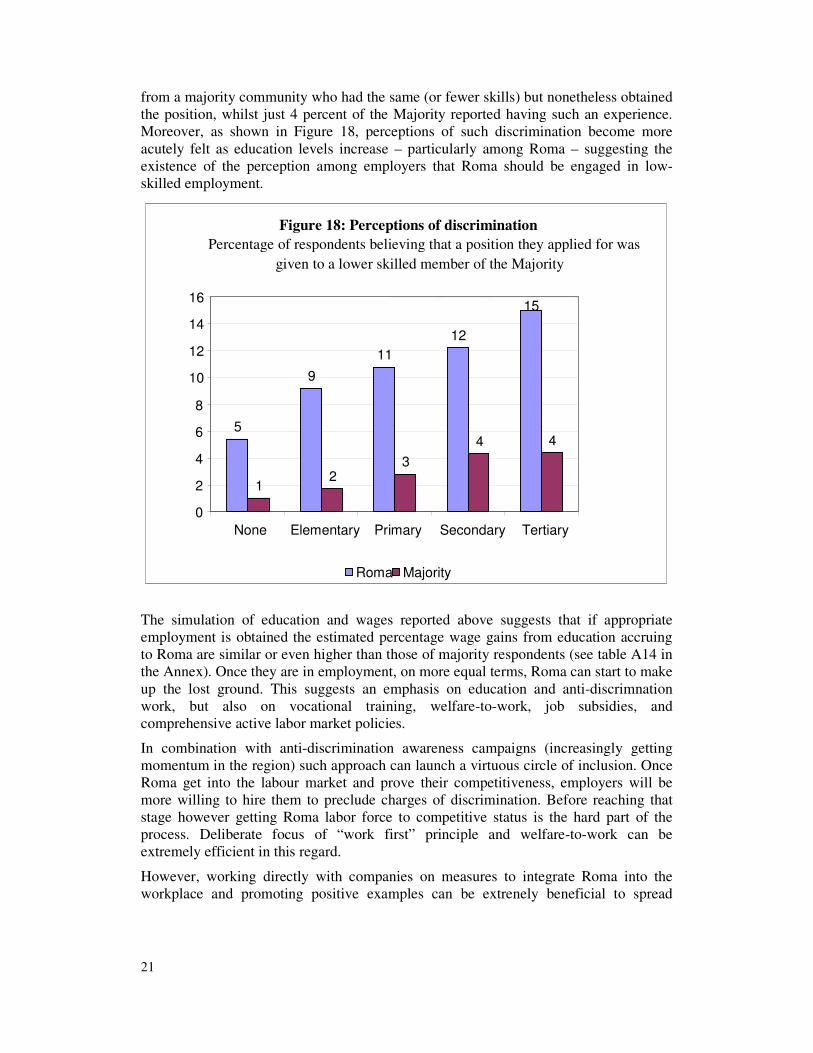
from a majority community who had the same (or fewer skills) but nonetheless obtained the position, whilst just 4 percent of the Majority reported having such an experience. Moreover, as shown in Figure 18, perceptions of such discrimination become more acutely felt as education levels increase – particularly among Roma – suggesting the existence of the perception among employers that Roma should be engaged in low-skilled employment.
The simulation of education and wages reported above suggests that if appropriate employment is obtained the estimated percentage wage gains from education accruing to Roma are similar or even higher than those of majority respondents (see table A14 in the Annex). Once they are in employment, on more equal terms, Roma can start to make up the lost ground. This suggests an emphasis on education and anti-discrimnation work, but also on vocational training, welfare-to-work, job subsidies, and comprehensive active labor market policies.
In combination with anti-discrimination awareness campaigns (increasingly getting momentum in the region) such approach can launch a virtuous circle of inclusion. Once Roma get into the labour market and prove their competitiveness, employers will be more willing to hire them to preclude charges of discrimination. Before reaching that stage however getting Roma labor force to competitive status is the hard part of the process. Deliberate focus of “work first” principle and welfare-to-work can be extremely efficient in this regard.
However, working directly with companies on measures to integrate Roma into the workplace and promoting positive examples can be extrenely beneficial to spread
Figure 18: Perceptions of discrimination
Percentage of respondents believing that a position they applied for was
given to a lower skilled member of the Majority
5
9
11
12
1 2
3
4 4
15
0
2
4
6
8
10
12
14
16
None Elementary Primary Secondary Tertiary
Roma Majority
22
around positive experiences and thereby reduce stereotypes.19 This business side has never been addressed before, and is also not addressed in the Decade Action Plans. If companies are not willing to provide employment opportunities and on-the-job training, no active labour market policy will be sustainable. Creating a platform for companies to discuss Roma employment should become a priority if the governments are serious about their commitments to the Decade.
This does not mean of course that the gains from education will completely eliminate the effects of factors leading to lower earnings for Roma with low levels of education compared to similarly qualified members of the majority. Education improves earnings in roughly equal percentage measure for Roma and non-Roma but this is not sufficient to fully compensate the Roma/Majority differential at low levels of education.
Conclusions
In this paper a number of issues related to employment and unemployment have been considered suggesting that for Roma the subjective definition invariably produces a higher estimate of unemployment rates. It would mean that part of those perceiving themselves as unemployed (and perhaps as legitimate for unemployment benefit) were actually involved in some form of income generation. For the majority population this is not always the case.
Data suggest that there are high intra-group differences in unemployment levels. For Roma respondents, differences between youth and adult unemployment rates are much smaller than for respondents from majority communities. As regards gender, women face higher unemployment rates among all three groups. However women’s disadvantage is not “equally spread” – Roma women face relatively higher unemployment rates, which serves to emphasise the double disadvantage associated with being born Roma and female. Specific active labour market policies need to take the special situation of Roma women into account.
The survey data suggest some interesting patterns in terms of the spatial distribution of unemployment. Whereas for Roma unemployment rates are higher in urban areas, majority respondents living in rural areas face higher unemployment rates. Differences in unemployment rates between Roma and Majority are therefore much lower in rural areas than they are in cities and towns. The implicaton is that in rural areas the lack of employment opportunities is spread more evenly between majorities and Roma and the greater prevalence of traditional gender roles (work at home vs. labour market) amongst Roma in the countryside also contributes to the existence of lower unemployment rates of women in rural areas. Unemployment rates are also lowest in mixed neighbourhoods, which is true for Roma, but, much more surprisingly also for the Majority populations.
Low education is clearly asiociated with higher unemployment. However the relative labour market advantage accruing to those with higher levels of education is much less pronounced for Roma respondents than for respondents from majority. Although weak education backgrounds contribute to poor Roma labour market outcomes, they are not sufficient to explain the difference in employment opportunities between Roma and majority populations. Thus, other factors such as discrimination and/or the
19 For a more through discussion of these issues see UNDP (2005) ‘Employing the Roma: Insights from Business’ UNDP Regional Bureau for Europe and the CIS.
23
concentration of Roma in depressed areas with few employment possibilities appear to be playing a major role in the Roma labour market disadvantage. It would mean that in order to improve employment opportunities of Roma, simply increasing their educational status is not enough and should be matched by anti-discrimination awareness campaigns targeting majority and other groups to overcome existing prejudices but also companies need to get involved in dialogue and provide positive case studies to reduce stereotypes and discrimination at the workplace.
Emerging is the tendency for Roma to be concentrated in low skill and low quality forms of employment. Here too, it would appear that education is not going to be sufficient by itself to level the playing field. Although the income gains from education are similar in percentage terms for Roma and non-Roma, this is not sufficient to compensate for the basic disadvantage related to the different absolute starting point. Even where the gains form education appear to be relatively high, such as for university educated Roma men, this is still insufficient to fully compensate the initial disadvantage, which may be related both to discrimination and quality of education (not necessarily associated with the level attained). On the other hand, the data do indicate that significant income gains do accrue to education for Roma, as well as other vulnerable groups, in the form of better employment prospects and higher labour incomes.
24
Appendix
Table A1: The effect of education on the probability of employment20
Majority Roma Displaced
Coefficients on schooling (compared to the base category: no schooling, elementary or incomplete primary education)
Effect Std. error
Effect Std. error Effect Std. Error
Men Completed primary .23* .13 .06 .04 -.30* .18
Completed secondary .45*** .12 .37*** .07 -.20 .16
Completed tertiary .90*** .04 .69*** .25 .07 .18
N 3446 4865 1195 Pseudo-R
2 .15 .10 .12
Women
Completed primary .28** .13 .28*** .05 -.09 .17
Completed secondary .72*** .12 .49*** .09 .31** .15 Completed tertiary 1.39*** .13 .53* .29 .89*** .18
N 2928 3727 908 Pseudo-R
2 .19 .10 .07
Baseline employment
probability
.61
.28
.41
*p<0.1, **p<0.05,***p<0.01
20 The table reports the effects, in terms of the percentage point improvement in employment probability, of raising one’s education level from no- or elementary-education level to a primary, secondary or tertiary level respectively. The probit model was estimated separately for adult men and women (16 years and above). Apart from the education variables, the model also included country-specific intercepts and age and age-squared variables.
25
*p<0.1, **p<0.05,***p<0.01
Table A2: The returns to education by ethnic group
Majority Roma Displaced
Percentage change in wage arising from increasing one’s educational level from
% change
Std. error
% change Std. Error % change Std. Error
Males
Elementary to
primary
.18 .13 .29*** .04 .39*** .15
Primary to
secondary
.25** .12 .18*** .06 .23* .13
Secondary to
tertiary
.23* .13 .62*** .19 .48*** .14
N 2173 2244 598
R2 .92 .93 .81
Females
Elementary to
Primary
.17 .15 .24*** .07 .37 .25
Primary to
Secondary
.38*** .14 .41*** .11 .51*** .22
Secondary to
Tertiary
.37*** .14 .21 .28 .67*** .24
N 1420 880 301
R2 .93 .93 .77
26
Table A3: Group-related wage gap The estimated wage of majority and Roma men and women relative to the average wage of an uneducated member of the majority (based on the returns to education estimates reported in table A2)
Men Women
No education Primary Secondary Tertiary
No education Primary Secondary Tertiary
Majority – region 0 21 52 86 0 17 60 120
Roma – Bulgaria -41 -24 -11 4 -34 -18 9 23
Roma – Kosovo -46 -31 -18 -5 -37 -22 4 17
Roma – Serbia -43 -27 -14 1 -45 -32 -9 2
Roma- Croatia -14 11 31 53 -47 -34 -13 -1
Roma – Macedonia -51 -37 -25 -13 -48 -35 -14 -3
Roma – Romania -43 -27 -14 0 -53 -41 -22 -12
Roma – Montenegro -46 -31 -19 -5 -63 -54 -38 -30
Roma – Albania -61 -50 -41 -32 -64 -55 -40 -32 Roma – BiH -55 -42 -31 -20 -71 -64 -52 -45