Embed Size (px)
Citation preview
Philanthropy & Church: Survey Says Presented by William Enright, Ph.D.
A Presbyterian Outlook webinar www.pres-‐outlook.org 1
2013 CONGREGATIONAL ECONOMIC IMPACT STUDY
THE RECESSION &
ITS IMPLICATIONS FOR CONGREGATIONAL LIFE
PRESENTED BY WILLIAM G. ENRIGHT
1
Lake Institute on Faith & Giving IU Lilly Family School of Philanthropy
2

Philanthropy & Church: Survey Says Presented by William Enright, Ph.D.
A Presbyterian Outlook webinar www.pres-‐outlook.org 2
2013 CONGREGATIONAL ECONOMIC IMPACT STUDY
(CEIS)
In partnership with Alban Institute NACBA Indianapolis Center for Congregations Maximum Generosity
3 www.philanthropy.iupui.edu/congregational-economic-impact-study
Respondents by denomination type
4
2013 CEIS Demographics
Denomination Percent Mainline Protestant 60.8%
Evangelical Protestant 24.9%
Other 9.2%
Jewish 2.4%
Catholic 1.1%
Prefer Not to Say/Not Selected 1.1%
Historically Black Protestant 0.6%
Page 46 – Table 8

Philanthropy & Church: Survey Says Presented by William Enright, Ph.D.
A Presbyterian Outlook webinar www.pres-‐outlook.org 3
By highest percentages reported:
37% of congregations established between 1801-1900
48% suburban
37% have average age of congregants between 55-64
33% have average AGI of congregants of $40K-$60K
37% have average number of people attending weekend services at 101-250 people, followed by 35% at 0-100. 2% are considered mega-churches at 2000+
5
2013 CEIS Demographics
Congregations are recovering from the worst of the recession.
Congregations are not keeping pace with inflation.
Gift size and number of donors are the drivers for fundraising success.
Congregations where the pastor aware if giving patterns do better.
Congregations with younger attendees do better.
Most congregations offer some type of electronic giving.
6
2013 CEIS Key Findings

Philanthropy & Church: Survey Says Presented by William Enright, Ph.D.
A Presbyterian Outlook webinar www.pres-‐outlook.org 4
Percentage of Congregations Reporting on How They Felt They Weathered the Great Recession
2013 CEIS Weathering the Great Recession
10.3%
63.6%
9.9%
1.1%
13.1%
1.6%
0.5%
Very well
Well
Poorly
Very poorly
Too soon to tell
Don't know
Prefer not to answer
7
Page 14 – Figure 1
28.1%
37.4%
32.7%
1.6% 0.3%
Improved Stayed about the same
Worsened Don't know Prefer not to answer
Percentage of Congregations Reporting Changes in Congregational Finances Since the Worst of the Recession
2013 CEIS Changes in Congregational Finances
8
Page 15 – Figure 2

Philanthropy & Church: Survey Says Presented by William Enright, Ph.D.
A Presbyterian Outlook webinar www.pres-‐outlook.org 5
2013 CEIS Changes in Revenues
Percentage of Congregations Reporting Changes in Revenues Between 2007 and 2011, Compared with Inflation
16.8%
22.6%
52.0%
8.4%
0.3%
Revenues were ahead of
inflation
Revenues kept pace with inflation
Revenues did not keep pace with inflation
Don't know Prefer not to answer
9
Page 16 – Figure 3
Percentage of Congregations Reporting Changes in Weekly Attendance Following the Recession
2013 CEIS Changes in Weekly Attendance
4.5%
20.2%
38.1%
28.8%
7.1%
1.0%
0.3%
Increased significantly
Increased slightly
Stayed about the same
Declined slightly
Declined significantly
Don't know
Prefer not to answer
10
Page 18 – Figure 5
Philanthropy & Church: Survey Says Presented by William Enright, Ph.D.
A Presbyterian Outlook webinar www.pres-‐outlook.org 6
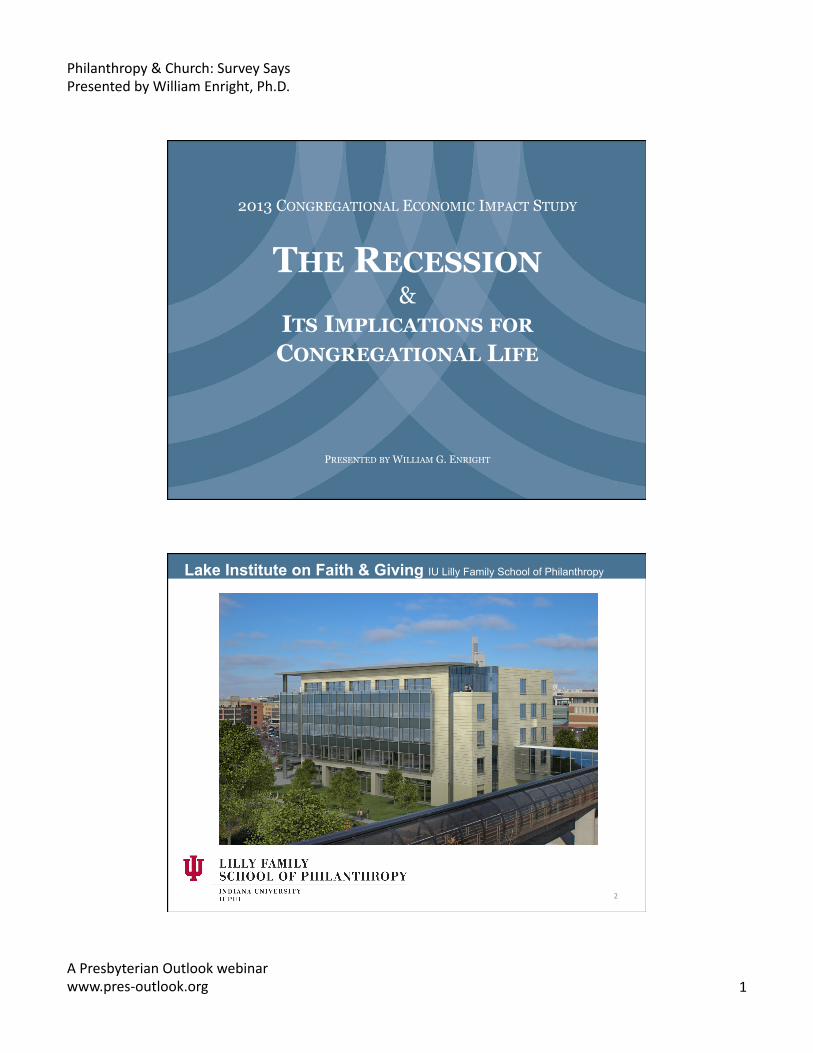
Congregation's Total Revenue for 2011 Percent of Congregations
Less than $150,000 22.0%
$150,000 to $299,999 25.9%
$300,000 to $599,999 23.6%
$600,000 to $999,999 11.2%
$1,000,000 to $4,999,999 14.8%
$5,000,000 to $9,999,999 1.30%
$10,000,000 and up 1.20%
Congregational Total Revenue for 2011, by Percentage of Congregations Reporting
2013 CEIS Total Revenue
11
Page 22 – Table 1
Breakdown of Congregational Revenue for 2011
2013 CEIS Breakdown of Congregational Revenue
12
Revenue Source
Receive Revenue From This Source
(%)
Average % of Revenue Raised From this Source
Median % of Revenue Raised
From This Source
Tithes/dues/pledge fulfillments 99.5% 75.6% 80.0%
Special offerings 80.8% 9.1% 7.0%
Capital campaigns 37.2% 12.1% 10.0%
Bequests 29.0% 7.6% 5.0%
Consolidated earned income 59.2% 11.3% 5.0% Corporate & foundation gifts & grants 10.5% 7.6% 5.0%
Other 24.5% 12.4% 8.0%
Page 23 – Table 2

Philanthropy & Church: Survey Says Presented by William Enright, Ph.D.
A Presbyterian Outlook webinar www.pres-‐outlook.org 7
Percentage of Congregations Reporting a Change in Overall Pledges or Dues Payments Received Between 2010 and 2011
2013 CEIS Change in Pledges/Payments Received
39.8%
31.1%
22.1%
5.0% 2.0%
Increased Stayed about the same
Decreased Don't know Prefer not to answer
13
Page 24 – Figure 6
Percentage of Congregations Reporting on Clergy’s Awareness of Contributions Received
2013 CEIS Clergy Awareness
44.7 49.3
5.0 1.0
0
10
20
30
40
50
60
Yes No Don't know Prefer not to answer
14
Page 26 – Figure 8

Philanthropy & Church: Survey Says Presented by William Enright, Ph.D.
A Presbyterian Outlook webinar www.pres-‐outlook.org 8
Percentage of Congregations Reporting a Change in Overall Fundraising Receipts Between 2010 and 2011
2013 CEIS Change in Fundraising Receipts
49.8%
24.1% 21.6%
4.3% 0.3%
Increased Stayed the same
Decreased Don't know Prefer not to answer
15
Page 28 – Figure 9
Factors Respondents Attributed to Increases & Decreases in 2011 Fundraising Results, by Percentage of Congregations Reporting
2013 CEIS Factors Attributed to Increases and Decreases
16
Among those reporting an increase in fundraising: Percent Higher average gifts 53.7% More donors 41.9% Other 23.6% Unexpected bequest or estate gifts 16.2% Unexpected cash gifts 15.4% Expected bequest or estate gifts 2.6%
Among those reporting a decrease in fundraising: Percent Fewer donors 69.0% Lower average gifts 47.8% Other 25.8% Unfulfilled pledges 24.6% Unexpected loss of large gift 14.8%
Page 31 – Table 3

Philanthropy & Church: Survey Says Presented by William Enright, Ph.D.
A Presbyterian Outlook webinar www.pres-‐outlook.org 9
Percentage of Congregations Reporting Changes in the Budget for 2012, Compared with 2011
2013 CEIS Changes in the Budget
48.9%
24.3% 25.6%
1.0% 0.2%
Increased Stayed the Same
Decreased Don't know Prefer not to answer
17
Page 35 – Figure 12
Percentage of Congregations Reporting Budget Allocation Adjustments for 2012, Compared with 2011
2013 CEIS Budget Allocations
18
Budget Allocation Adjustments Percent of Congregations
Making Increases Percent of Congregations
Making Reductions Salaries 34.2% 13.2% Outreach programs 23.0% 11.7% Revenue-generating activities 18.7% 3.8% Missions activities 18.6% 11.6% Internal programs 16.7% 33.4% Charitable organization support 16.2% 20.3% Staffing 15.5% 25.6% Building maintenance 14.5% 34.7% Employee benefits 9.3% 9.5% Brick-and-mortar projects 9.1% 16.3% Congregational assets 3.5% 4.1%
Page 36 – Table 5

Philanthropy & Church: Survey Says Presented by William Enright, Ph.D.
A Presbyterian Outlook webinar www.pres-‐outlook.org 10
Number of Employees Part-time Full-time
0 5.2% 5.8%
1 10.6% 37.8%
2 13.9% 15.9%
3 18.2% 10.6%
4 or more 52.1% 29.8%
Paid Congregational Staff Employed in 2011, by Percentage of Congregations Reporting
2013 CEIS Congregational Staff
19
Page 37 – Table 6
Changes in Congregations’ Approaches to Philanthropic Education in Recent Years, by Percentage of Congregations Reporting
2013 CEIS Philanthropic Education
1.9%
3.4% 47.0%
28.3%
13.4%
5.7%
0.3%
Significantly less than prior to the recession
Slightly less than prior to the recession
About the same as prior to the recession
Slightly more than prior to the recession
Significantly more than prior to the recession
Don't know
Prefer not to answer
20
Page 38 – Figure 13
Philanthropy & Church: Survey Says Presented by William Enright, Ph.D.
A Presbyterian Outlook webinar www.pres-‐outlook.org 11
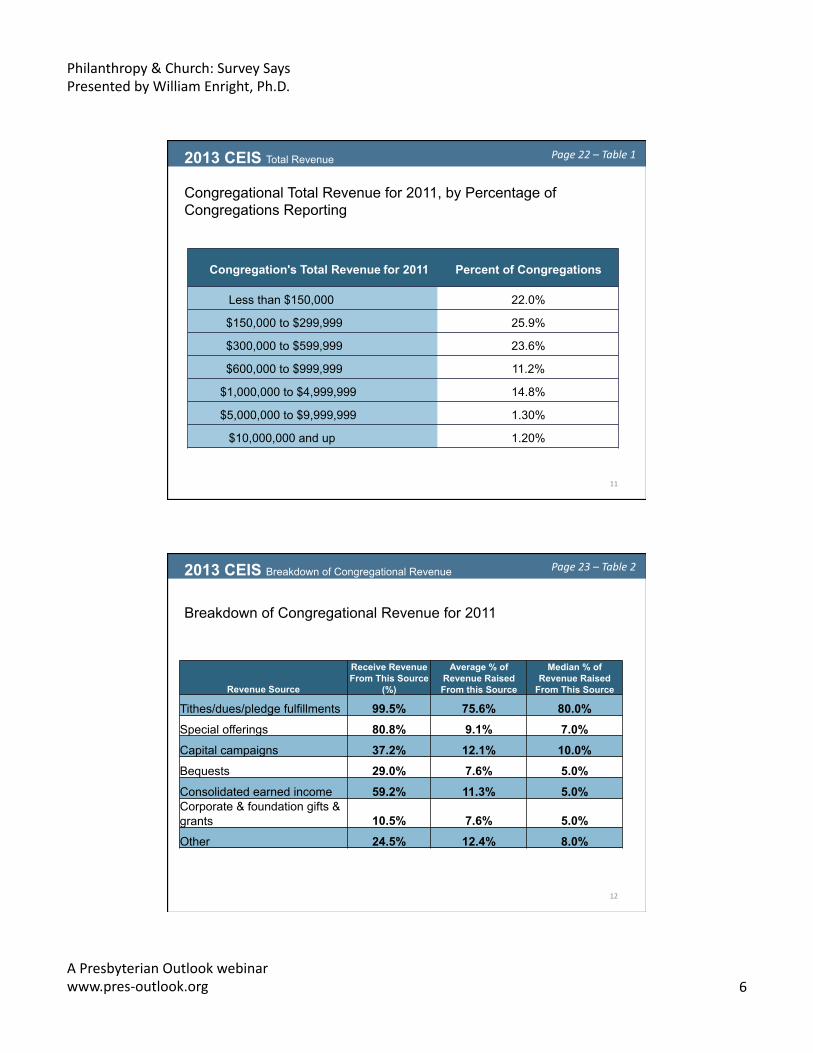
Congregational Offerings of Courses, Workshops, Classes, or Seminars on Personal Finance or Charitable Giving, by Percentage of Congregations Reporting
2013 CEIS Personal Finance Courses
36.0%
62.9%
0.8% 0.3%
Yes No Don't know Prefer not to answer
21
Page 39 – Figure 14
Percentage of Congregations Using Social Media & Online Tools
2013 CEIS Social Media
16.4%
95.3%
78.8%
18.8% 6.5% 1.7% 4.0%
14.7% 8.1%
0%
20%
40%
60%
80%
100%
22
Page 40 – Figure 15
Philanthropy & Church: Survey Says Presented by William Enright, Ph.D.
A Presbyterian Outlook webinar www.pres-‐outlook.org 12
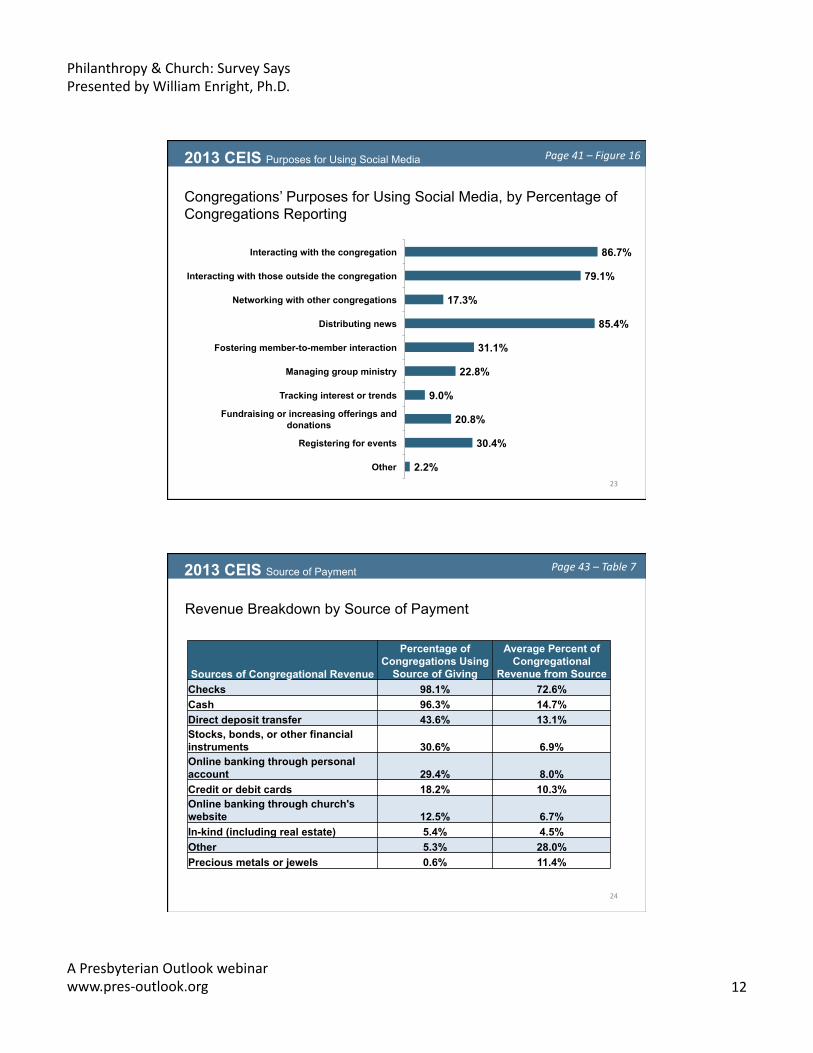
Congregations’ Purposes for Using Social Media, by Percentage of Congregations Reporting
2013 CEIS Purposes for Using Social Media
86.7%
79.1%
17.3%
85.4%
31.1%
22.8%
9.0%
20.8%
30.4%
2.2%
Interacting with the congregation
Interacting with those outside the congregation
Networking with other congregations
Distributing news
Fostering member-to-member interaction
Managing group ministry
Tracking interest or trends
Fundraising or increasing offerings and donations
Registering for events
Other 23
Page 41 – Figure 16
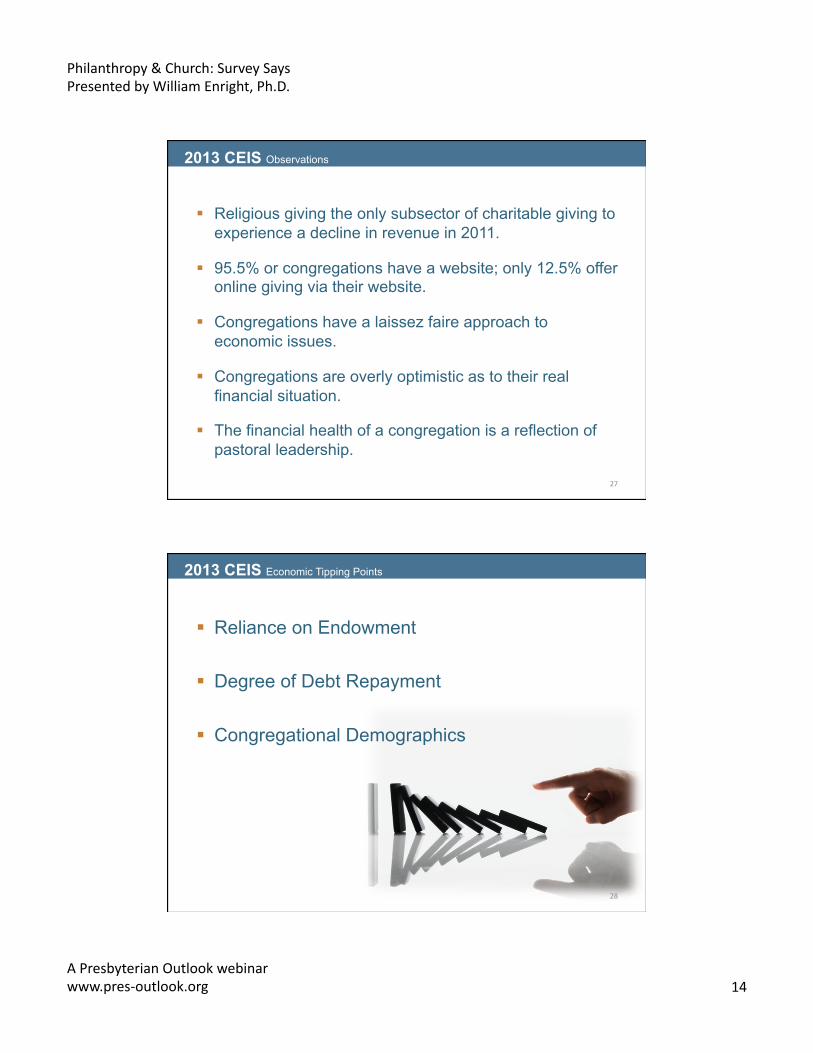
Revenue Breakdown by Source of Payment
2013 CEIS Source of Payment
24
Sources of Congregational Revenue
Percentage of Congregations Using
Source of Giving
Average Percent of Congregational
Revenue from Source Checks 98.1% 72.6% Cash 96.3% 14.7% Direct deposit transfer 43.6% 13.1% Stocks, bonds, or other financial instruments 30.6% 6.9% Online banking through personal account 29.4% 8.0% Credit or debit cards 18.2% 10.3% Online banking through church's website 12.5% 6.7% In-kind (including real estate) 5.4% 4.5% Other 5.3% 28.0% Precious metals or jewels 0.6% 11.4%
Page 43 – Table 7

Philanthropy & Church: Survey Says Presented by William Enright, Ph.D.
A Presbyterian Outlook webinar www.pres-‐outlook.org 13
Average Income of Congregants, by Percentage of Congregations Reporting
Average Adjusted Gross Income of Families Within
Congregation Percentage
$40,000 or less 10.5%
$40,001 to $60,000 32.7%
$60,001 to $80,000 29.3%
$80,001 or more 15.8%
Don't know 11.2%
Prefer not to answer 0.5%
2013 CEIS Average Income of Congregants
25
Page 50 – Table 12
Average Number of People Attending Typical Weekend Services
2013 CEIS Attendance
26
Average Number of People Attending Weekend Services Percentage
0 to 100 people 34.8%
101 to 250 people 36.9%
251 to 500 people 16.0%
501 to 1000 people 6.9%
1001 to 2000 people 3.1%
2000 people or more 1.8%
Don't know 0.4%
Page 51 – Table 13
Philanthropy & Church: Survey Says Presented by William Enright, Ph.D.
A Presbyterian Outlook webinar www.pres-‐outlook.org 14
Religious giving the only subsector of charitable giving to experience a decline in revenue in 2011.
95.5% or congregations have a website; only 12.5% offer online giving via their website.
Congregations have a laissez faire approach to economic issues.
Congregations are overly optimistic as to their real financial situation.
The financial health of a congregation is a reflection of pastoral leadership.
27
2013 CEIS Observations
Reliance on Endowment
Degree of Debt Repayment
Congregational Demographics
28
2013 CEIS Economic Tipping Points

Philanthropy & Church: Survey Says Presented by William Enright, Ph.D.
A Presbyterian Outlook webinar www.pres-‐outlook.org 15
1. Mainline Protestant & Jewish congregations are more likely to have an annual pledge campaign and an endowment.
2. Evangelical congregations are more likely to offer courses in personal financial management.
“Differences in institutionalized practices are theological differences.” Mark Chaves
29
2013 CEIS Theology & Giving Practices
A theological footprint shapes giving practices
30
2013 CEIS The Religious Language Conundrum
The Language of Obligation
The Language of Reciprocity
The Language of Gratitude
How Does Theology Shape the Practice of Giving?

Philanthropy & Church: Survey Says Presented by William Enright, Ph.D.
A Presbyterian Outlook webinar www.pres-‐outlook.org 16
“The Christian life cannot have obligation as its deepest root. The life of faith is entirely responsive, springing from gratitude rather than duty.” Sondra Wheeler
“When we understand the grace we’ve received, we are able to turn outward in gratitude and generosity.” Christine D. Pohl
31
2013 CEIS Faith, Money & Giving
DONOR SENSITIVITY FUTURE CHALLENGES OF RELIGIOUS GIVING
32

Philanthropy & Church: Survey Says Presented by William Enright, Ph.D.
A Presbyterian Outlook webinar www.pres-‐outlook.org 17
Increased competition for the Almighty’s Dollar
Religious market share declining
The challenges of an uncertain economy
Donor’s increasing philanthropic savvy
Religion must learn to make its case/tell its story
Church must change its dialogue on money
33
Donor Sensitivity The New World of Religious Giving
DONOR SENSITIVITY Congregations and Social Media
95.3% of congregations have a website
79.8% of congregations use Facebook
80% of church attendees use email and the web.
Only 25% of attendees use it relative to their church.
“Religion is for the most part an insignificant participant in social media.”
Scott Thumma
2013 CEIS Report, Indiana University Lilly Family School of Philanthropy Third Annual Biennial Conference on Religion and American Culture, June 2013
34

Philanthropy & Church: Survey Says Presented by William Enright, Ph.D.
A Presbyterian Outlook webinar www.pres-‐outlook.org 18
1. What is your mission; what do you do?
2. Who are the people you serve; what needs do you address?
3. Are you in debt? If so, how are you addressing your debt?
4. What is your impact on your immediate community?
5. What programs and missions do you fund?
6. Do you have a strategic plan and goals for the future?
7. What does success look like in your congregation?
35
Donor Sensitivity: What Donors Want to Know
1. Why do you exist?
2. How do you behave?
3. What do you do?
4. What is important to you right now?
5. What does tomorrow look like?
6. What must you do now?
36
Donor Sensitivity Questions to Clarify your Organization’s Vision

Philanthropy & Church: Survey Says Presented by William Enright, Ph.D.
A Presbyterian Outlook webinar www.pres-‐outlook.org 19
NURTURING A CULTURE OF
GENEROSITY
37
CULTURE OF GENEROSITY Organizational Structure of Generosity
Keys to Building an Organizational Structure of Generosity
ATTITUDE: How does leadership feel about fundraising as a core
value?
ADVOCACY: How do your members & donors understand and
articulate your mission?
ACTION: How do you engage your staff in nurturing generosity? What steps do you need to take in building an
organizational culture of generosity?
38

Philanthropy & Church: Survey Says Presented by William Enright, Ph.D.
A Presbyterian Outlook webinar www.pres-‐outlook.org 20
CULTURE OF GENEROSITY Three Dimensions
Organizational Culture is Three-Dimensional
ARTIFACTS: The visible organizational structures and processes
ESPOUSED BELIEFS & VALUES: Organizational strategies, goal, philosophies, tenets
of faith
UNDERLYING ASSUMPTIONS: The unconscious, presumed beliefs, feelings,
perceptions
Edgar Schein: Organizational Culture and Leadership. 39
CULTURE OF GENEROSITY Four Frames
Four Frames of an Organization
1. STRUCTURAL FRAME: Organizational goals, roles, relationships.
2. HUMAN RESOURCE FRAME: People, their needs, feelings, prejudices, skills, limitations
3. POLITICAL FRAME: Areas where subjective interest groups vie for power & the use of resources.
4. SYMBOLIC FRAME: Organizational cultures: rituals, ceremonies, stories, myths, policies, heroes.
L. G. Boleman and T.E. Deal, Reframing Organization 40
Philanthropy & Church: Survey Says Presented by William Enright, Ph.D.
A Presbyterian Outlook webinar www.pres-‐outlook.org 21
THE WHY AND HOW
OF CHANGE
41
WHY & HOW Why Change?
Reasons for Strategic Change Initiatives
To improve and/or stabilize performance
To adapt to changes in the external environment & position an organization for the future
42
Philanthropy & Church: Survey Says Presented by William Enright, Ph.D.
A Presbyterian Outlook webinar www.pres-‐outlook.org 22
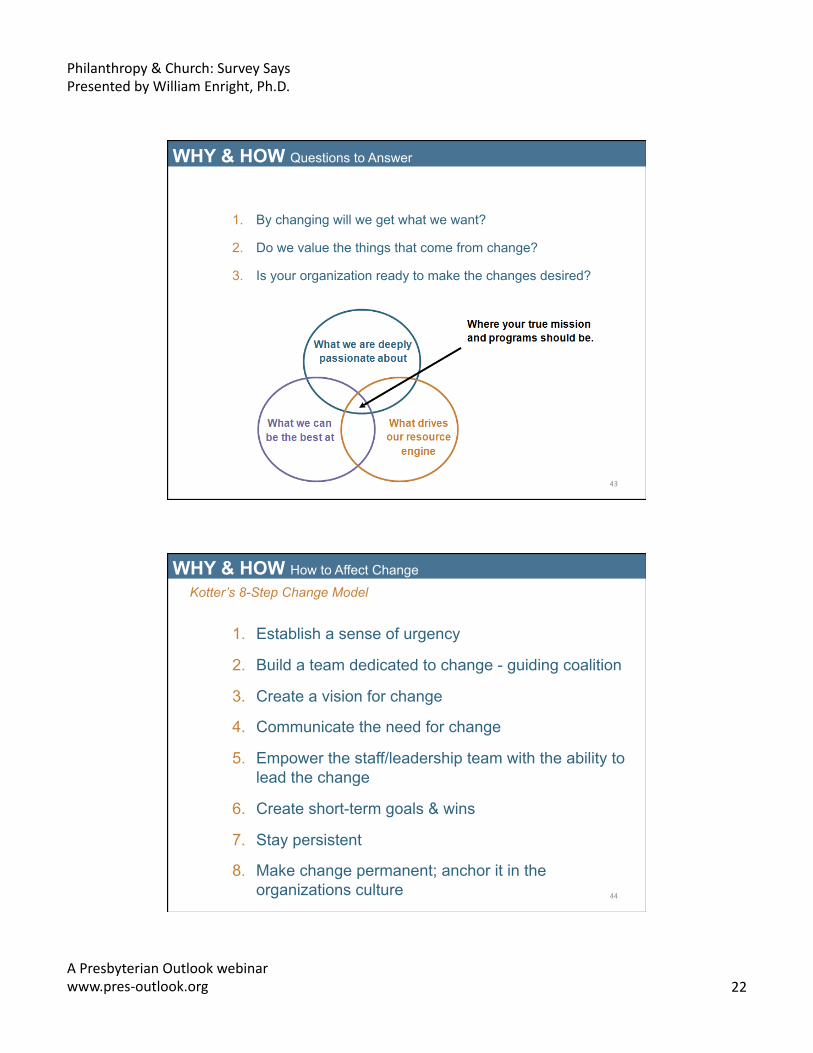
WHY & HOW Questions to Answer
1. By changing will we get what we want?
2. Do we value the things that come from change?
3. Is your organization ready to make the changes desired?
43
WHY & HOW How to Affect Change
Kotter’s 8-Step Change Model
1. Establish a sense of urgency
2. Build a team dedicated to change - guiding coalition
3. Create a vision for change
4. Communicate the need for change
5. Empower the staff/leadership team with the ability to lead the change
6. Create short-term goals & wins
7. Stay persistent
8. Make change permanent; anchor it in the organizations culture 44
Philanthropy & Church: Survey Says Presented by William Enright, Ph.D.
A Presbyterian Outlook webinar www.pres-‐outlook.org 23
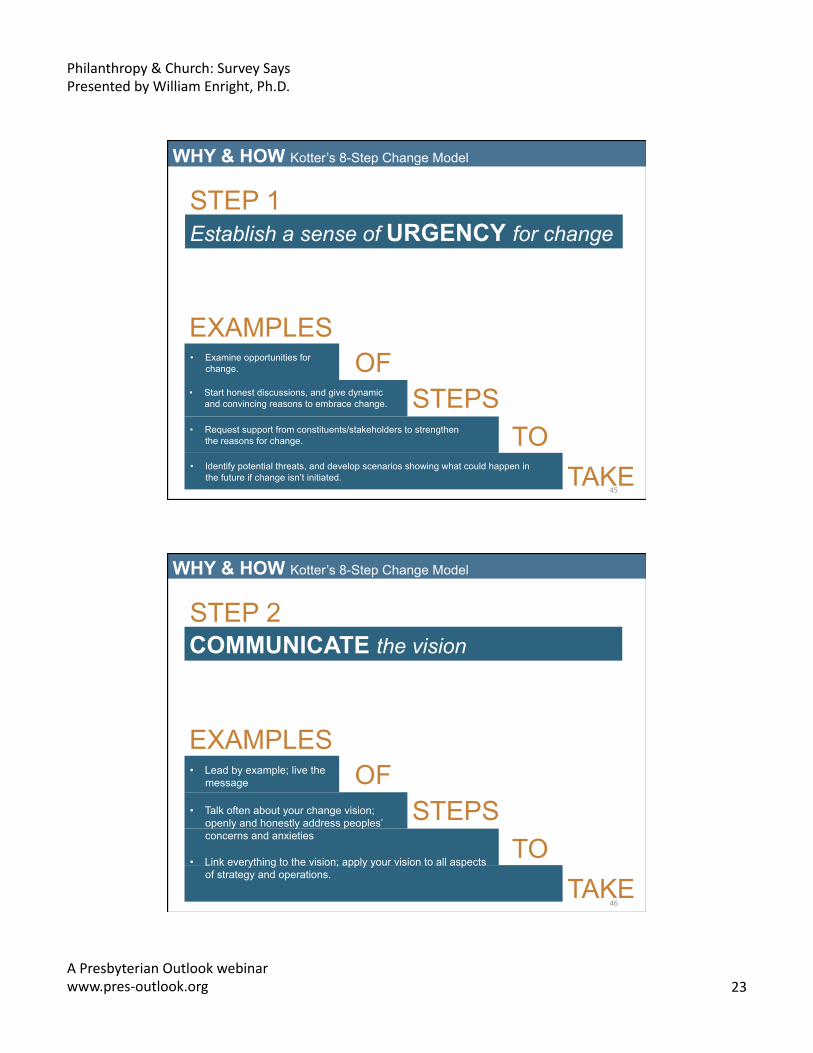
WHY & HOW Kotter’s 8-Step Change Model
STEP 1
Establish a sense of URGENCY for change
TAKE
• Start honest discussions, and give dynamic and convincing reasons to embrace change.
• Request support from constituents/stakeholders to strengthen the reasons for change.
• Identify potential threats, and develop scenarios showing what could happen in the future if change isn’t initiated.
EXAMPLES
STEPS
• Examine opportunities for change.
TO
OF
45
WHY & HOW Kotter’s 8-Step Change Model
STEP 2
COMMUNICATE the vision
TAKE
• Talk often about your change vision; openly and honestly address peoples’ concerns and anxieties
• Link everything to the vision; apply your vision to all aspects of strategy and operations.
EXAMPLES
STEPS
• Lead by example; live the message
TO
OF
46
Philanthropy & Church: Survey Says Presented by William Enright, Ph.D.
A Presbyterian Outlook webinar www.pres-‐outlook.org 24
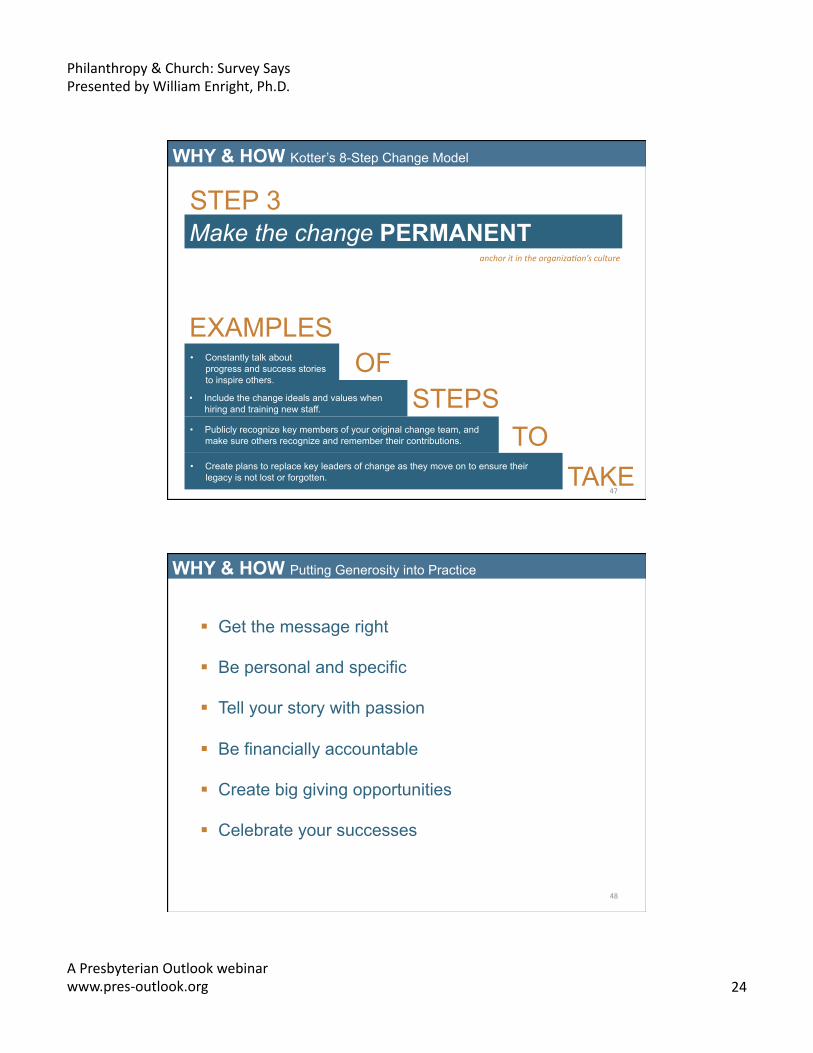
WHY & HOW Kotter’s 8-Step Change Model
STEP 3
TAKE
• Include the change ideals and values when hiring and training new staff.
• Publicly recognize key members of your original change team, and make sure others recognize and remember their contributions.
• Create plans to replace key leaders of change as they move on to ensure their legacy is not lost or forgotten.
EXAMPLES
STEPS
• Constantly talk about progress and success stories to inspire others.
TO
OF
Make the change PERMANENT anchor it in the organiza>on’s culture
47
Get the message right
Be personal and specific
Tell your story with passion
Be financially accountable
Create big giving opportunities
Celebrate your successes
WHY & HOW Putting Generosity into Practice
48
Philanthropy & Church: Survey Says Presented by William Enright, Ph.D.
A Presbyterian Outlook webinar www.pres-‐outlook.org 25
REFLECT • DISCUSS • CONNECT
Connect with Lake Institute on Faith & Giving
EMAIL: [email protected]
PHONE: 317-278-8998
WEBSITE: www.philanthropy.iupui.edu/lake-institute
TWITTER: @LakeInstitute
49