Embed Size (px)
Citation preview

Western University Western University
Scholarship@Western Scholarship@Western
Electronic Thesis and Dissertation Repository
6-22-2017 12:00 AM
It’s All About Context: Investigating the Effects of Consonant and It’s All About Context: Investigating the Effects of Consonant and
Vowel Environment on Vowel-Evoked Envelope Following Vowel Environment on Vowel-Evoked Envelope Following
Responses Responses
Emma Bridgwater The University of Western Ontario
Supervisor
Dr. David W. Purcell
The University of Western Ontario
Graduate Program in Health and Rehabilitation Sciences
A thesis submitted in partial fulfillment of the requirements for the degree in Master of Science
© Emma Bridgwater 2017
Follow this and additional works at: https://ir.lib.uwo.ca/etd
Part of the Speech and Hearing Science Commons
Recommended Citation Recommended Citation Bridgwater, Emma, "It’s All About Context: Investigating the Effects of Consonant and Vowel Environment on Vowel-Evoked Envelope Following Responses" (2017). Electronic Thesis and Dissertation Repository. 4601. https://ir.lib.uwo.ca/etd/4601
This Dissertation/Thesis is brought to you for free and open access by Scholarship@Western. It has been accepted for inclusion in Electronic Thesis and Dissertation Repository by an authorized administrator of Scholarship@Western. For more information, please contact [email protected].

i
Abstract
The envelope following response (EFR) has proven useful for studying brainstem speech
processing. Previous work, however, demonstrates that its amplitude varies across stimuli.
This thesis investigates whether this variation is attributable to the consonant or vowel
context of the stimulus, or some interaction of the two. Experiment 1 evoked EFRs in 30
participants using seven English vowels embedded in four CVC environments. A strong
effect of vowel and a minor effect of consonant on EFR amplitude were found. In
Experiment 2, 64 listeners heard four different tokens of one of four possible English vowels
(16 participants/vowel), embedded in the same CVC environments as before. A significant
three-way interaction between vowel, vowel trial, and consonant was found, indicating that
the EFR is highly sensitive to subtle acoustic differences in stimuli. To effectively utilize the
EFR in research, future studies should carefully explore the mechanisms driving these
complex context effects.
Keywords
envelope following response (EFR), auditory processing, auditory evoked potentials (AEPs),
electrophysiology, consonant environment, vowel context, vowel evoked envelope following
response

ii
Acknowledgments
First and foremost, I would like to express my sincere thanks to my supervisor, Dr. David
Purcell. Thank you for the encouragement, support, and guidance you have provided me
throughout this project. Your contributions have made the last two years an unforgettable
learning experience.
A special acknowledgement goes to Dr. Andrew Johnson, whose insights into analysis have
been invaluable, and without whom this project would have been condemned to analysis in
SPSS. Your perpetual enthusiasm and willingness to discuss R early in the morning have
meant a lot. Thank you also to my advisory committee members, Dr. Janice Cardy and Dr.
Susan Scollie, for the expertise you have brought to this project.
I am also grateful to my SAFER Lab colleagues, past and present, for all of the laughter,
baked goods, and gossip we have shared. Vijayalakshmi, thank you for all of the time you
have spent discussing analysis with me.
Thank you also to the infamous SAFER Lab Skyflakes container, for enduring countless
artifact checks without complaint and with perfect impedances.
I would also like to thank my family, who despite not fully understanding what exactly I was
researching or why, have always been there for me.
Finally to Charles Morton, with love, for everything. Without your steadfast support and
delicious cooking, I would not have gotten through this degree. Thank you for believing in
me.
Funding for this project was provided by Western University and the Natural Sciences and
Engineering Research Council of Canada.

iii
Table of Contents
Abstract ................................................................................................................................ i
Acknowledgments ............................................................................................................... ii
Table of Contents ............................................................................................................... iii
List of Tables ..................................................................................................................... vi
List of Figures ................................................................................................................... vii
List of Appendices ........................................................................................................... viii
List of Abbreviations ......................................................................................................... ix
Chapter 1 ............................................................................................................................. 1
1 Introduction .................................................................................................................... 1
1.1 The Acoustics of Speech ......................................................................................... 2
1.1.1 Speech vs. Language ................................................................................... 2
1.1.2 Speech Production ...................................................................................... 2
1.1.3 Vowel Acoustics ......................................................................................... 4
1.1.4 Context Effects ............................................................................................ 7
1.2 Neurophysiology of Speech Processing .................................................................. 8
1.2.1 The Envelope Following Response ............................................................ 9
1.2.2 Why Measure the EFR? ............................................................................ 10
1.2.3 Sources of the EFR ................................................................................... 11
1.2.4 The EFR and Variability ........................................................................... 14
1.3 Purpose of this thesis ............................................................................................ 14
Chapter 2 ........................................................................................................................... 16
2 Experiment 1 Methods ................................................................................................. 16
2.1 Participants ............................................................................................................ 16
2.2 Stimuli ................................................................................................................... 16

iv
2.2.1 Construction .............................................................................................. 16
2.2.2 Presentation ............................................................................................... 19
2.3 EFR Recording ...................................................................................................... 20
2.4 Experiment 1 Analysis .......................................................................................... 21
2.4.1 EFR Analysis and Detection ..................................................................... 21
2.4.2 Data Exclusion .......................................................................................... 24
2.4.3 Stimulus Artifact Evaluation ..................................................................... 25
Chapter 3 ........................................................................................................................... 26
3 Experiment 1 Results and Discussion .......................................................................... 26
3.1 Effect of Consonant and Vowel on EFR Amplitude ............................................ 26
3.2 Effect of Consonant and Vowel on Noise ............................................................. 31
3.3 Experiment 1 Discussion ...................................................................................... 38
3.3.1 Consonant Environment ............................................................................ 38
3.3.2 Vowel Identity .......................................................................................... 39
3.3.2.1 Cochlear Stimulus Delays .......................................................... 41
Chapter 4 ........................................................................................................................... 45
4 Experiment 2 Methods ................................................................................................. 45
4.1 Participants ............................................................................................................ 45
4.2 Stimuli ................................................................................................................... 45
4.2.1 Construction .............................................................................................. 45
4.2.2 Presentation and Recording ...................................................................... 49
4.3 Experiment 2 Analysis .......................................................................................... 49
4.3.1 EFR Analysis and Detection ..................................................................... 49
4.3.2 Data Exclusion .......................................................................................... 50
4.3.3 Stimulus Artifact Evaluation ..................................................................... 50

v
Chapter 5 ........................................................................................................................... 52
5 Experiment 2 Results and Discussion .......................................................................... 52
5.1 Effect of Vowel Trial on Amplitude within Consonant Environment .................. 54
5.2 Effect of Consonant Environment on Amplitude within Vowel Trial .................. 57
5.3 Noise ..................................................................................................................... 59
5.3.1 Effect of Vowel Category and Consonant on Noise ................................. 59
5.3.2 Effect of Vowel Category and Vowel Trial on Noise ............................... 60
5.4 Experiment 2 Discussion ...................................................................................... 63
5.4.1 Effect of Vowel Trial on Amplitude within Consonant Environment ...... 63
5.4.2 Effect of Consonant Environment on Amplitude within Vowel Trial ...... 64
5.4.2.1 Cochlear Stimulus Delays .......................................................... 65
5.4.3 Sensitivity of the EFR to Context ............................................................. 66
Chapter 6 ........................................................................................................................... 68
6 Conclusions and Future Directions .............................................................................. 68
6.1 Summary ............................................................................................................... 68
6.2 General Conclusions ............................................................................................. 69
6.3 Future Directions .................................................................................................. 70
6.3.1 Source Localization .................................................................................. 70
References ......................................................................................................................... 72
Appendices ........................................................................................................................ 78
Curriculum Vitae .............................................................................................................. 84

vi
List of Tables
Table 1: Concatenated words and pseudowords used in Experiment 1 .................................. 18
Table 2: Vowel durations for Experiment 1 ........................................................................... 18
Table 3: Mean differences in EFR amplitude (nV) for all significant vowel comparisons. ... 30
Table 4: Differences in mean noise (nV) for all significant vowel comparisons. .................. 32
Table 5: Relative level differences between vowels estimated with Praat ............................. 40
Table 6: Concatenated words and pseudowords used in Experiment 2. ................................. 47
Table 7: Experiment 2 descriptive stimulus characteristics. ................................................... 48
Table 8: Mean differences in EFR amplitude (nV) between trials of /ij/ within consonant
environment. ........................................................................................................................... 56
Table 9: Mean differences in EFR amplitude (nV) between trials of /u/ within consonant
environment. ........................................................................................................................... 56
Table 10: Mean differences in EFR amplitude (nV) between trials of /ɛ/ within consonant
environment. ........................................................................................................................... 56
Table 11: Mean differences in EFR amplitude (nV) between consonant contexts within trials
of /ij/. ....................................................................................................................................... 58
Table 12: Mean differences in EFR amplitude (nV) between consonant contexts within trials
of /u/. ....................................................................................................................................... 58
Table 13: Mean differences in EFR amplitude (nV) between consonant contexts within trials
of /ɛ/. ....................................................................................................................................... 58

vii
List of Figures
Figure 1: Canadian English vowel space. ................................................................................. 6
Figure 2: Diagram showing the arrangement of the main nuclei and fibre tracks of the
ascending auditory pathway in the brainstem. ........................................................................ 13
Figure 3: Illustration of the Fourier analyzer noise track estimates. ....................................... 23
Figure 4: Group EFR amplitude and noise estimates across all experimental contexts. ........ 27
Figure 5: Notched boxplot comparing EFR amplitude across vowel, and collapsed across
consonant context. ................................................................................................................... 28
Figure 6: Histogram of the by-participant noise range in Experiment 1. ............................... 35
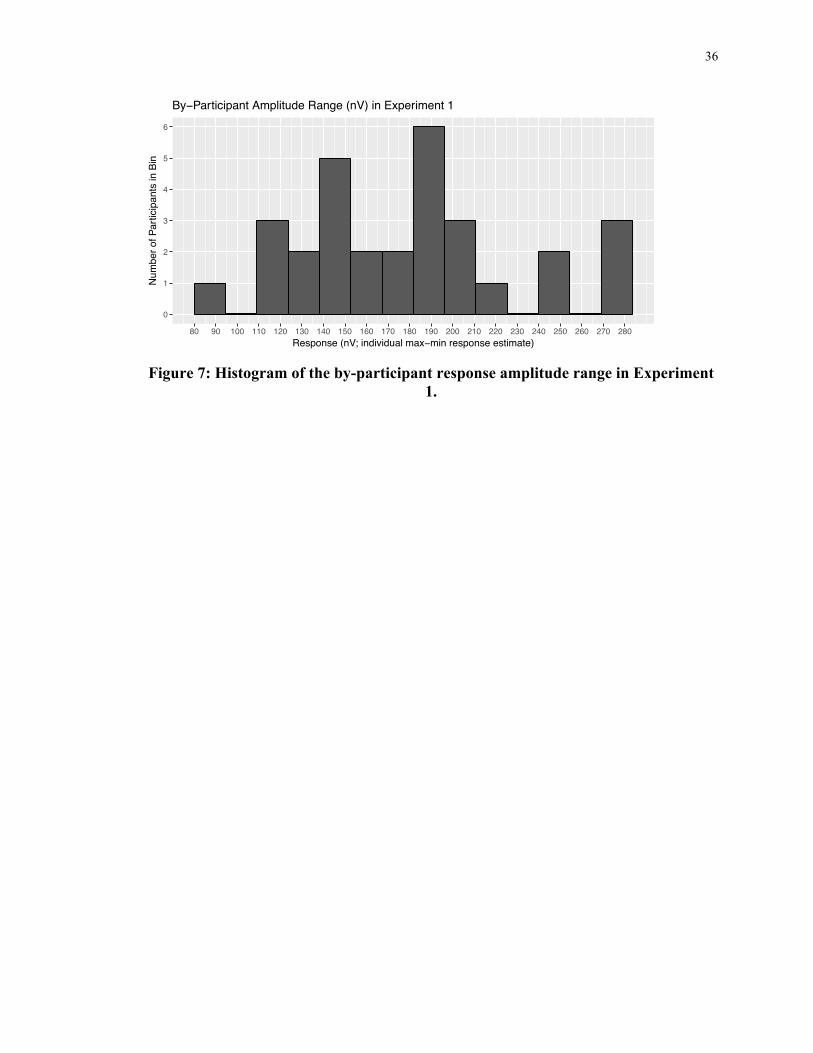
Figure 7: Histogram of the by-participant response amplitude range in Experiment 1. ......... 36
Figure 8: Notched boxplot comparing noise across consonant environments. ....................... 37
Figure 9: Group EFR amplitude and noise across all experimental contexts. ........................ 53
Figure 10: Histogram of the by-participant noise range within vowel category in Experiment
2............................................................................................................................................... 61
Figure 11: Histogram of the by-participant response amplitude range within vowel category
in Experiment 2. ...................................................................................................................... 62

viii
List of Appendices
Appendix A: Ethics Approval Notice .................................................................................... 78
Appendix B: Sample Letter of Information and Consent ...................................................... 80

ix
List of Abbreviations
ABR Auditory brainstem response
AEP Auditory evoked potential
AN Auditory nerve
C Consonant (any); linguistic placeholder
cABR Complex auditory brainstem response
CN Cochlear nucleus
CVC Single syllable string with a [consonant – vowel – consonant] structure
Cz Electrode location on the vertex
dB Decibels
dBA A-weighted decibels
EEG Electroencephalography
EFR Envelope following response
f0 Fundamental frequency
F1 First formant
F2 Second formant
FA Fourier analyzer
FDR False discovery rate
FFR Frequency following response
GG Greenhouse-Geisser
HL Hearing level
Hz Hertz
IC Inferior colliculus
kΩ Kilo-ohm
MEG Magnetoencephalography
ms Millisecond
nV Nanovolt
RM-ANOVA Repeated measures analysis of variance

x
sABR Speech auditory brainstem response
SD Standard deviation
SPL Sound pressure level
TMS Transcranial magnetic stimulation
V Vowel (any); linguistic placeholder
1
Chapter 1
1 Introduction
Speech is fundamental to the human experience; we use it frequently - and, for normal
individuals, effortlessly - in our daily lives to interact with and comprehend the world
around us. Despite this ease, speech perception is an incredibly complex process, and
there are many steps in the pathway to transduce sound stimuli from physical sound
waves in the air to electrical signals that the brain can process.
When an individual experiences sound – like the turning of pages when reading a thesis,
for example – vibrations travel through the air and the outer ear to the tympanic
membrane. The tympanic membrane, which separates the outer ear canal from the middle
ear, is where the transduction of airborne stimulus to mechanical vibration begins.
Vibrations travel through the bones of the middle ear to the inner ear, where sensory hair
cells transduce them from hydromechanical vibrations in the cochlea to electrical
impulses on the auditory nerve (Plack, 2014). The electrical signal, which preserves the
frequency, temporal, and spatial information of the original stimulus in remarkable detail,
then travels up the auditory pathways through the brain for further processing.
The brain’s electrical activity can be recorded in real time using electroencephalography
(EEG); responses to acoustic stimuli specifically can be isolated from the background
noise of muscle and brain activity using averaging techniques (Luck, 2005; Picton, 2011).
However, despite our considerable physiological knowledge of the auditory pathway, and
the advances that have been made in technology for studying speech processing, our
understanding of exactly how the auditory system encodes and processes speech signals
is lacking.

2
1.1 The Acoustics of Speech
1.1.1 Speech vs. Language
Before delving into a discussion about the acoustic and linguistic components of the
speech signal, it is important to highlight that the focus of this thesis is on neural
responses to speech, and not to language.
Language is composed of a group of meaningful symbols, and socially determined rules
dictate how those symbols can be combined (Aiken, 2008). Speech acts as an acoustic
carrier for linguistic information, and does not necessarily have meaning per se.
Language processing, furthermore, is a complex cognitive process that requires higher-
order brain areas and specific knowledge on behalf of the listener for proper
comprehension. Speech processing is a much more physical phenomenon, and utilizes
brain structures that are evolutionarily primitive; a listener does not require specific
knowledge about the signal merely to process it (Møller, 2006).
1.1.2 Speech Production
Though speech seems to come to humans instinctually, the act of speech production itself
is quite complex when broken down. The speech production system is typically described
in terms of a source-filter model, where the larynx and vocal folds act as the source for
sound energy by periodically filtering or blocking the steady stream of air produced
during exhalation (Fant, 1980). Features of the supralaryngeal vocal tract, which
encompasses the oral and nasal cavities and their associated articulators, act as a filter by
shaping the airflow to alter the acoustic properties of the sound produced (Fant, 1980).
Roughly, the filter is responsible for producing the linguistic units of speech, like
consonant and vowel sounds. Non-linguistic vocal information, including features like
pitch and vocal tone, are largely products of the source (Kraus & Nicol, 2005).
There are several ways for speakers to produce speech sounds. The first and least
complex is to simply relax the vocal folds and allow air to pass through the larynx
unimpeded. Supralaryngeal features, such as the tongue and teeth, can then be used to
alter the airflow, which results in various hiss- and burst-like productions (Borden &

3
Harris, 1984). These sounds form the basis for characteristic English consonants like /ʃ/
and /t/. As these sounds are produced when the vocal folds are open, rather than tense and
vibrating, these productions lack periodicity, and are commonly described as voiceless
(Ladefoged & Johnson, 2011).
Another method of speech production involves vibration of the vocal folds, which is
achieved through the periodic adduction and abduction of the folds during the buildup
and release of subglottal pressure in the lungs (Borden & Harris, 1984; Ladefoged &
Johnson, 2011). All Canadian English vowels and many consonants are produced in this
manner. Due to the periodicity introduced by this vibration, these sounds are considered
voiced.
The rate at which one’s vocal folds open and close per second also defines an important
characteristic of speech production. This rate of vibration is referred to as the
fundamental frequency (f0). Voiced speech sounds produced by a given speaker are
composed of multiple harmonics of their f0. These harmonics are related to the
fundamental frequency by integer multiples, so the second harmonic is twice the
frequency of f0, the third harmonic is 3f0, and so on. Perceptually, listeners interpret a
speaker’s fundamental frequency as their vocal pitch.
Vibration rate is relatively unique to a given speaker, and is largely determined by
physical aspects of the vocal folds, such as length and thickness (Titze, 1989). Adult
males, who have longer and thicker vocal folds in general, tend to have lower
fundamentals, averaging 120 Hz, as compared to the adult female average of 220 Hz.
Consequently, male voices are perceived as having a lower pitch (Plack, 2014; Titze,
1989). The cricothyroid muscle in the larynx can also induce temporary changes to a
speaker’s f0 by altering the tension across the vocal folds during speech production. When
the cricothyroid muscle contracts, it increases the tension across the vocal folds. This
increased tension suppresses their ability to vibrate, allowing for voiceless phonation, and
also elevates the speaker’s f0 (Löfqvist, Baer, McGarr & Seider Story, 1998).

4
1.1.3 Vowel Acoustics
Vowel sounds are the most salient pieces of acoustic information in speech; this is largely
because they have more energy and greater duration than consonant units. Like all voiced
speech sounds, vowels are a complex of harmonics, the quality of which is dictated by
the f0 of the speaker. Different vowels can be distinguished from one another in terms of
the physical articulatory gestures made by the tongue and lips during production, as well
as their distinct formant patterns (Ladefoged & Johnson, 2011). Formants are acoustic
features composed of one or more harmonics that, due to the resonant features of the
vocal tract during production, have the highest amplitude compared to neighbouring
frequencies, and therefore have the most acoustic energy (Plack, 2014; Borden & Harris,
1984).
On wideband spectrograms, formants appear as distinct, dark bands of energy against the
lighter grey of frequencies that compose the rest of the signal. They are numbered as F1,
F2, F3, and so on, with the first formant (F1) having the lowest frequency and greatest
energy (Plack, 2014). Previous work has shown that the F1 and F2 formants provide
enough information about vowel identity for discrimination (Delattre, Liberman, Cooper
& Gerstman, 1952). Each vowel has distinct formant frequencies that can be used to help
identify them in the speech signal. For example, the vowel /ij/ has a first formant around
280 Hz, and a second formant around 2250 Hz, which distinguishes it from /ɪ/, whose F1
and F2 are approximately 400 Hz and 1920 Hz, respectively (Ladefoged & Johnson,
2011). Vowels can also be distinguished based on the relationship between their first and
second formants: typically high, front vowels like /ej/ have widely separated F1 and F2s,
whereas the F1 and F2 of low back vowels like /ɔ/ are much closer in frequency (Ciocca
& Whitehill, 2012).
While formants are generally described in terms of their average frequency across a
population, natural variance exists. Men typically demonstrate lower formant values
compared to women, who in turn have lower formants than children (Peterson & Barney,
1952). Variation exists at the level of the individual as well. Vowel space graphs
collected from large populations (see Hillenbrand, Getty, Clarke & Wheeler, 1995)
typically show significant overlap in formant frequencies across vowel categories

5
between speakers. This is not, however, reflective of individual behaviour; when
considered alone, a single speaker will demonstrate very discrete vowels and have little,
if any, formant frequency overlap between categories (Mitsuya, MacDonald, Munhall &
Purcell, 2015).
Both vowel and consonant sounds can differ across languages and dialects. Canadian
English is comprised of ten vowels: /ij, ɪ, ej, ɛ, æ, ʌ, u, ʊ, ɔ, ɑ/ (Haigawara, 2006). The
Canadian English vowel space can be seen in Figure 1. Some English dialects make an
audible distinction between the vowels /ɔ/ and /ɑ/, but the Canadian Shift has resulted in
significant pronunciation overlap for these two sounds across most of Canada (Clarke,
Elms, & Youssef, 1995). The merge has been documented in both Manitoba and Ontario
(Clarke et al., 1995; Haigawara, 2006), but it does not exist in the Maritimes (Boberg,
2000).

6
Figure 1: Canadian English vowel space.
The vertical axis is the first formant frequency (F1), and the horizontal is the second formant frequency (F2). Adapted from the Language Samples Project (Mendoz –Denton, Hendricks & Kennedy, 2001), http://www.ic.arizona.edu/~lsp/Canadian/canphon2.html. Note that this thesis uses different IPA notation for the following: /i/ = /ij/, /e/ = /ej/, /o/ =
/ɔ/.

7
1.1.4 Context Effects
Though linguistic and auditory researchers often study the elements of speech as isolated
units, the average human rarely encounters the sounds of their language in such an
artificial way. In reality, the speech signal is a constant stream of acoustic energy, where
each individual sound is influenced, overlapped, and altered by its neighbours (Borden &
Harris, 1984). While this coarticulation is ultimately what makes speech fluid and
efficient, it does alter the quality of individual units. Vowels, which make up the nucleus
of most utterances, are particularly susceptible to context effects.
Previous work has found that, when embedded in symmetrical CVC syllables (ex. /fejf/,
/tɔt/), F1 is insensitive to the consonant environment regardless of vowel identity
(Stevens & House, 1963). The consonant environment, however, has been shown to
affect F2 by shifting it to be more central (Stevens & House, 1963). The F2 of front
vowels, which are typically high in frequency, decreased, whereas the low F2 frequencies
characteristic of back vowels increased. The place of articulation of the surrounding
consonants had the most significant impact on the magnitude of F2 change observed,
with postdental environments (θ, ð, s, z, t, d, c̆, ȷ̆) producing shifts of up to +350 Hz in the
high back vowel /u/ (Stevens & House, 1963). Vowel identity also influenced the
magnitude of F2 shift, with high-to-mid back vowels like /u/ and /ʊ/ exhibiting the
greatest changes in postdental environments, and mid-front vowels like /ɪ/ and /ɛ/
showing increased F2 reduction in labial consonant contexts.
Hillenbrand, Clarke and Neary (2001) replicated these early effects of consonant context,
and additionally studied the effects of non-symmetrical CVC consonant environments on
vowel formants. The minimal changes in observed F1 frequency shifts were also seen in
these asymmetric environments, and the same F2 centralization trend was observed
across all vowels. Interestingly, the large upward shift in the F2 for back vowel /u/ was
replicated as well, with an increase in +500 Hz for males and +600 Hz for females on
average (Hillenbrand et al., 2001). Results also suggested that the changes in formant
frequency were largely driven by properties associated with the first consonant in the
syllable (Hillenbrand et al., 2001).

8
Overall, it is necessary to consider the influence of the consonant environment when
studying speech, even in relatively short stimuli. The use of isolated vowel sounds, and
the generalizability of study results using such stimuli, is potentially limited in scope,
since vowels produced in isolation have been shown to have stark differences to those
produced in natural speech-like contexts.
1.2 Neurophysiology of Speech Processing
Despite the depth of knowledge about speech from a linguistic perspective, there is an
appreciable gap in knowledge regarding how the human auditory system processes and
encodes that speech signal at a neural level. Auditory evoked potentials (AEPs; electrical
signals from the brainstem and certain brain areas that respond to sound stimuli) have
proven to be an effective way to study neural speech processing. AEPs are an ideal tool
for this purpose, given that they accurately reflect the rapid temporal rate of auditory
signal transduction, and can also be recorded non-invasively at the scalp (Picton,
Hillyard, Krausz and Galambos, 1974).
There are a variety of measurable AEPs in humans, loosely categorizable in terms of their
recording latency (Picton, 2013). Late responses, which have a long delay between
stimulus presentation and response measurement, are thought to derive from the auditory
cortex and its associated areas. Early responses are believed to be dominated by
generators originating in more primitive areas of the auditory pathway, including the
cochlea and brainstem (Picton, 2013).
AEPs can be further classified by their response pattern at a temporal level: transient
responses are elicited by short, rapid changes in acoustic stimuli, whereas sustained
responses are elicited by some continuous aspect of the stimulus (Picton, 2013; Rance,
2008). Following responses, which include the frequency following response (FFR) and
the envelope following response (EFR), are thought to fit somewhere between these two
categories. The FFR and EFR can be elicited to rapid changes in a stimulus, but can also,
as the nomenclature would suggest, track continuous features as well (Picton, 2013).

9
1.2.1 The Envelope Following Response
The envelope following response (EFR) is a near-steady state following response that is
phase locked to the amplitude envelope of a given stimulus. The EFR is typically elicited
in response to amplitude-modulated tones, but it can also be elicited by natural vowel
sounds. When generated in response to speech-like stimuli, the EFR tracks the
fundamental frequency of the speaker’s voice (Aiken & Picton, 2006).
Recent evidence suggests that the initiation of the EFR response is dominated by
harmonics near F1, and that the F1 amplitude is a strong predictor of the amplitude of the
following response (Laroche, Dajani, Prévost & Marcoux, 2013; Choi, Purcell, Coyne &
Aiken, 2013). It is not surprising that F1 amplitude is an important predictor for EFR
response detection; it is the formant with the highest energy, and tends to dominate the
acoustic signal when present.
F1 frequency may also affect EFR amplitude, such that higher F1 frequencies elicit larger
EFR responses; this is largely for physiological reasons (Choi et al., 2013). The middle
ear transfers mid frequency energy to the cochlea more effectively than low frequency
energy, and the cochlea in turn has wider filter bandwidths at higher frequencies. These
wider filters increase the likelihood that multiple harmonics will stimulate similar
neuronal populations, which is important for generating EFRs (Choi et al., 2013).
Furthermore, EFR responses have been shown to decrease with increases in F2 amplitude
(Choi et al., 2013). As F1 frequency has an inverse relationship with F2 amplitude,
typically decreasing when the latter increases, it is likely that F1 frequency plays a role in
EFR generation.
Though the F1 appears to be the major contributor to EFR response generation, it is
difficult to sort out the contributions that may result from higher formants in the stimulus,
as the higher formants tend to have less acoustic energy. Attempts to address this in the
literature have used a technique that shifts the harmonics near one formant by some small
amount (eg. 8 Hz) to separate out EFR responses initiated by F1 from those initiated by
higher harmonics (Easwar, Purcell, Aiken, Parsa & Scollie, 2015). These manipulated
vowels retain a high degree of naturalness, while simultaneously allowing the study of
10
contributions to the EFR made by higher, weaker formants that are typically
overshadowed by the energy at F1.
1.2.2 Why Measure the EFR?
Currently one of the most common evoked potentials used to study neural correlates of
speech processing is the auditory brainstem response (ABR; Malayeri, Lotfi, Moossavi,
Rostami & Faghihzadeh, 2014). The ABR has been critical for studying early
components of the auditory pathway, as well as for diagnosing hearing impairments
(Malyeri et al., 2014). However, the ABR (like many other AEPs that originate early in
auditory pathway) is less useful when it comes to studying speech processing, since it
cannot be evoked in response to natural speech stimuli.
Work has been done using the speech ABR (sABR, sometimes called the complex, or
cABR); the stimuli utilized in these experiments are generally rapid /da/-like synthetic
syllables approximately 40 ms in duration, which do not accurately reflect the features or
pace of natural running speech (Banai, Abrams & Kraus, 2007; Skoe & Kraus, 2010).
The auditory system is a nonlinear processor, and is unlikely to respond to these
vanishingly short synthetic sounds as it would to more representative speech-like stimuli
(Choi et al., 2013; Rance, 2008). As such, while results from these studies are valuable, it
is not necessarily valid to generalize their results when discussing speech processing
(Gailbraith et al., 2004).
What makes the EFR more attractive than better-characterized AEPs like the sABR is
that it is easily elicited in response to both running speech and individual words (Choi et
al., 2013; Easwar et al., 2015). EFR detection rates and amplitudes recorded from
naturally spoken speech contexts were comparable to those obtained with simpler, steady
state vowels alone (Choi et al., 2013). EFR responses also tend to be much larger at a
given stimulus level compared to other following responses, benefiting from multiple
contributions from different regions of the cochlea ascending the auditory pathway
(Aiken & Picton, 2008; Laroche et al., 2013). This tendency for higher amplitudes
contributes to the EFR’s short detection time; responses to most vowels can be obtained
in less than ten minutes of recording (Choi et al., 2013; Easwar et al., 2015). Together,

11
these features make the envelope following response a promising tool for developing a
deeper understanding of how the human auditory system encodes and processes speech.
Clinically speaking, the EFR may also prove to be a valuable objective measure of
hearing aid outcome evaluation in infants (Easwar, 2014). Presently, there is a lack of
objective measures for this purpose; the current clinical procedure relies on behavioural
responses that can be difficult to elicit in infants with early hearing loss diagnoses (Joint
Committee on Infant Hearing, 2007; Bagatto, Scollie, Hyde & Sewald, 2010). Available
electrophysiological measures in the clinic suffer from the same problem seen in speech
processing research − they are obtained using artificial stimuli, and may not accurately
reflect how the brainstem is processing the speech signal that hearing aids are designed to
enhance.
1.2.3 Sources of the EFR
Though neuron populations throughout the auditory pathway (see Figure 2) are capable
of following the stimulus envelope, neurophysiological studies on humans and animals
have linked EFR generation to three major areas: the auditory nerve (AN), cochlear
nucleus (CN), and the inferior colliculus (IC).
Single unit recordings in the auditory nerve of anesthetised cats have shown that
individual neurons in this area produce interspike intervals that correlate well with the f0
of sinusoidal tones and single formant vowels (Cariani & Delgutte, 1996). These
responses remain robust even when the first harmonic at the fundamental frequency is
absent from the stimulus (Cariani & Delgutte, 1996), and suggest that neuronal
populations in the auditory nerve are the earliest generators of the EFR response.
Similar results were found using single-unit recording techniques higher in the auditory
pathway at the cochlear nucleus (Frisina, Smith & Chamerlan, 1990; Kim, Sirianni, &
Chang, 1990). In gerbils and rabbits, neuron populations in this area were found to
encode modulations related to amplitude in complex sounds (Frisina et al., 1990; Kuwada
et al., 2002). Some neurons in the CN also appear to act as amplifiers for the EFR

12
response, as some units measured responses that were nearly twice that obtained from
neurons in the auditory nerve.
The inferior colliculus (IC) has also been linked to EFR generation in humans and
animals (Smith, Marsh & Brown, 1975). As electrical impulses in this region are readily
measurable at the scalp with surface electrodes – and responses from deeper areas are not
– the majority of human-based EFR research is likely recording responses from the IC. A
comparison of deep and surface electrodes demonstrated that the mean onset latency
recorded at the scalp most closely approximated the latency recorded within the inferior
colliculus compared to other areas in the pathway (Smith et al., 1975). Furthermore,
when neurons in the IC were selectively cooled in cats, following responses were
eliminated both at the IC and at the scalp (Smith et al., 1975). Responses were unaffected
following cooling of other areas, including the medial superior olive, suggesting that the
IC is one of the primary generators of the EFR and FFR responses. Human
magnetoencephalography (MEG) results correlate well with these animal-based studies,
identifying both the cochlear nucleus and inferior colliculus as generators of the EFR
(Coffey, Herholz, Chepesiuk, Baillet & Zatorre, 2016).
These subcortical areas respond best at the higher modulation rates associated with
speech stimuli; higher cortical areas tend to respond optimally to very low modulation
rates (< 50 Hz) (Herdman et al., 2002; Kuwada et al., 2002; Purcell et al., 2004). Recent
results from MEG challenge this assumption, demonstrating that an asymmetrical source
in the auditory cortex, similar in magnitude to known subcortical sources, is present in
FFRs elicited by a 120 ms /da/ signal with a 98 Hz f0 (Coffey et al., 2016). Little research
has been done into the precise nature of this cortical source, however, and it is presently
unclear whether or not it would contribute substantially in responses to longer, more
speech-like stimuli.

13
Figure 2: Diagram showing the arrangement of the main nuclei and fibre tracks of
the ascending auditory pathway in the brainstem. Auditory nerve (AN), cochlear nucleus (CN), superior olivary complex (SOC), lateral
lemniscus (LL), inferior colliculus (IC), medial geniculate (MG). Reproduced with permission from Møller et al., 1988.

14
1.2.4 The EFR and Variability
Despite its promise, the EFR is not a perfect measure. Section 2.4 discussed the impact of
consonant environment on vowel acoustics, including its effects on overall frequency and
F2 centralization. The EFR in turn, as a following response that can track natural speech,
is also influenced by changes in subtle speech acoustics.
Aiken and Purcell (2013) demonstrated that EFR amplitude was highly variable within
participant as a function of the stimuli, by recording responses to different vowels
embedded in a stable consonant environment. In a similar vein, within-listener EFR
amplitude was also shown to vary when the stimuli consisted of the same vowel in
different consonant environments (Choi et al., 2013). The vowel /u/, for example, elicited
an average EFR of approximately 160 nV when presented in the context /bud/, but only
125 nV when elicited by the word /fud/ (Choi et al., 2013). Similar, although smaller,
variation was observed for vowels /ij/, /ɛ/ and /ɔ/. Other vowels, such as the low-front
vowel /æ/, exhibited more uniform EFRs on average.
There are parallels between studies investigating context effects on the EFR, and studies
done on formant production patterns. The vowels in Choi et al. (2013) that produced the
greatest EFR variation were the same vowels whose F2 frequencies were more affected
by consonant environment (Stevens & House, 1963; Hillenbrand et al., 2001).
Additionally, vowels like /æ/ which produced stable EFRs regardless of context were also
largely insensitive to F1 and F2 alteration stemming from consonant context.
Ultimately, while some literature has emerged suggesting that there is a measurable effect
of consonant context on steady state responses to vowels in the brain (Aravamudhan,
Carbonell & Lotto, 2010), the precise nature of this interaction has not been well studied,
and our understanding of the cause for EFR variation remains largely speculative.
1.3 Purpose of this thesis
It is clear from the previous discussion that the EFR has the potential to greatly increase
our understanding of human speech processing and neural encoding processes. Given that
it can be elicited in response to natural speech stimuli, while keeping data collection
15
times to a minimum, the EFR also has the potential to provide more ecologically valid
information about speech processing than current methods.
A review of the literature has also shown, however, that there are still problems with
measuring the EFR. Importantly, there is considerable within-listener variation in EFR
amplitude. While amplitude variation appears to be dependent on the stimulus itself, it is
still unknown what aspect of the stimulus is driving it. The purpose of this thesis is to
investigate whether amplitude variation can be attributed to features of the stimulus’
consonant environment, vowel category, subtle variations in vowel acoustics, or an
interaction of the three. Results from this study are an important step towards developing
more effective stimuli for EFR research and clinical application, as well as furthering the
development of a powerful tool for studying neural correlates of speech processing.

16
Chapter 2
2 Experiment 1 Methods
2.1 Participants
Thirty-four (18 female, 17 male) participants between the ages of 18 and 37 (x̅ = 24.06
years, σ = ±4.48 years) were recruited from the local Western University community in
London, Ontario. Thirty-three participants reported that English was their first language,
with two participants indicating that they learned English simultaneously with another
language (Kazakh and Punjabi). No speech, language, or neurological impairments were
reported. Routine otoscopy prior to the start of the experiment revealed no occluding
wax, discharge, or other obstructions that may have impacted the experiment results. A
hearing assessment was also performed. Audiometric thresholds, measured using a
Madesen Itera audiometer and TDH-39 headphones, were measured at 250, 500, 750,
1000, 1500, 2000, 3000, and 4000 Hz. Thirty-three participants had normal thresholds
across the entire octave and inter-octave range (≤ 20 dB HL across all test frequencies).
Two participants presented with audiometric thresholds ≤ 30 dB HL; one exhibited these
elevated thresholds for 2000 Hz and above in the left ear, and 3000 Hz and above in the
right. The other participant had elevated thresholds only at 4000 Hz in the right ear. All
participants provided informed consent, and were compensated for their time. The study
was approved through the Health Sciences Research Ethics Board of Western University.
2.2 Stimuli
2.2.1 Construction
EFRs were evoked by the vowels /ij/ (as in “heed”), /ɪ/ (as in “hid”), /ej/ (as in “hayed”),
/ɛ/ (as in “head”), /æ/ (as in “had”), /u/ (as in “who’d”/, and /ɔ/ (as in “hawed”), which
were embedded into four different consonant contexts, /hVd/, /sVt/, /zVf/, and /ʒVv/,
respectively. While the /hVd/ and /sVt/ contexts produced recognizable English words
when combined with the seven vowels, the stimuli from the /zVf/ and /ʒVv/ contexts still
resulted in viable English pseudowords.

17
All vowels, representing the major sounds of the Canadian English vowel space and a
range of F1 and F2 frequencies, were produced by a 34-year-old male, native English
talker in a /hVd/ context. This context was chosen due to its status as a neutral consonant
environment; there is little to no difference in vowel formant acoustics when comparing
vowels spoken in this context versus in isolation (Stevens & House, 1963). The same
talker also produced the full range of Canadian English consonant sounds in a neutral,
word-initial /Cɑ/ context. The speaker was instructed to speak in a neutral tone of voice
throughout. Recordings were made in a sound-attenuated booth using a studio-grade
microphone (AKG Type C 4000B) and SpectraPLUS software (version 5.0.26.0; Pioneer
Hill Software, LLC, Poulsbo, WA, USA). Recordings were sampled at a rate of 44100
Hz, and were later downsampled to 32000 Hz using Praat (Boersma, 2001) software.
Three recordings of all vowel and consonant sounds were made.
All post-recording audio inspection and editing was done using a pair of Sennheiser HD
280 Pro headphones. Praat was used to splice the steady state portion of each vowel from
their neutral production contexts, as determined through spectrograms and listening. As
much of the vowel sound was preserved as possible while still removing coarticulation
cues from the sound file. A similar process was used to isolate the consonant sounds from
their word-initial recordings. The best instances of both consonants and vowels were
selected based on listening quality, and in the case of vowels, based on the flatness of the
f0 contour. The isolated consonant and vowel files were then concatenated into the 28
different contexts used in the experiment, as seen below in Table 1.

18
/ij/ /ɪ/ /ej/ /ɛ/ /æ/ /u/ /ɔ/
/hVd/ hijd hɪd hejd hɛd hæd hud hɔd /sVt/ sijt sɪt sejt sɛt sæt sut sɔt /zVf/ zijf zɪf zejf zɛf zæf zuf zɔf
/ʒVv/ ʒijv ʒɪv ʒejv ʒɛv ʒæv ʒuv ʒɔv Table 1: Concatenated words and pseudowords used in Experiment 1
/ij/ /ɪ/ /ej/ /ɛ/ /æ/ /u/ /ɔ/ Duration (ms) 243.58 142.73 243.26 139.76 224.01 196.12 205.03
Table 2: Vowel durations for Experiment 1

19
A perceptual quality test using three naïve listeners was performed on the concatenated
words. Listeners were instructed to listen to each audio file and write down what word
they thought they heard. Overall listeners correctly identified the entire word (both
consonants and the vowel) 65% of the time. The greatest proportion of errors occurred in
identifying the word-final stop in the /sVt/ consonant context; listeners consistently
incorrectly identified the voiceless /t/ as its voiced counterpart, /d/. As all consonants
were recorded in word-initial positions, this perceived voicing might be an artifact of the
aspiration that voiceless English consonants undergo when they precede vowels. Overall,
listeners were able to correctly identify both the initial consonant and vowel sounds 83%
of the time.
Due to natural differences in vowel length (x̅ = 199.21 ms, σ = ±43.38 ms; see Table 2
above), the resulting words varied in duration. Onset and offset ramps of 5 ms were
added to each word before they were concatenated together with 10 ms of silence
between each word. The waveform of the stimulus file was manually adjusted over short
periods to remove two transient spikes that appeared in the offset of the words /hijd/ and
/hɪd/ respectively. The single polarity recording was then multiplied by a factor of -1 to
produce a waveform of the opposite polarity. These two files were concatenated together
into the final stimulus file.
2.2.2 Presentation
LabVIEW software (version 8.5; National Instruments, Austin, TX) was used to control
the presentation of the stimulus and the data collection. A PCI-6289 M-series acquisition
card was used to convert the EFR stimulus from digital into analog, and to convert the
EEG recordings from analog to digital. The stimulus was presented at a sample rate of
32000 Hz with 16-bit resolution; EFRs were recorded at a rate of 8000 samples per
second. A Tucker-Davis Technologies PA5 attenuator and an SA1 power amplifier
controlled the stimulus level. The 24.242 s stimulus was presented for 148 sweeps (i.e.
148 repetitions) at approximately 70 dB SPL (65 dBA SPL), for a total experimental
length of 60 minutes. The stimulus level was calibrated using a Brüel and Kjær Type
2250 sound level meter in Leq mode, with the stimulus playing for two minutes into a
Brüel and Kjær Type 4157 ear simulator.

20
2.3 EFR Recording
The EEG was recorded using three disposable Medi-Trace Ag/AgCl electrodes placed on
the skin using Grass Technologies EC2 electrode cream. The inverting electrode was
placed on the posterior midline of the neck below the hairline, the non-inverting electrode
was placed on the vertex (Cz), and the ground electrode was placed on the middle of the
left collarbone. Each electrode site was prepared with an alcohol wipe and NuPrep skin
gel prior to electrode application. Electrode impedances, obtained using an F-EXM5
Grass impedance meter at 30 Hz, were measured as less than 5 kΩ, with interelectrode
differences at ≤ 2 kΩ. Impedances were measured again at the end of the experiment.
Once proper impedances were obtained, electrodes were secured using small strips of
medical tape.
After electrode application, participants were seated in a reclining chair inside an
electromagnetically shielded, sound-attenuated booth (Eckel Industries of Canada, Model
C26). A rolled-up towel was placed behind their neck to provide head support and to
reduce artifacts from neck muscles. Participants were also offered a blanket.
Electrode leads were plugged into a Grass LP511 EEG amplifier with a bandpass filter
between 3 and 3000 Hz. The amplifier also provided a gain of 50000 to the measured
EEG, which was doubled to 100000 by the PCI-6289 acquisition card. Participants heard
the stimulus through an Etymotic ER-2 mu-metal shielded insert earphone (shielded by
Intelligent Hearing Systems) that was fitted with an appropriately sized foam tip
(Etymotic ER-14a or ER-14b) inserted in the left ear canal. Appropriate ear-tip size was
determined through otoscopy at the beginning of the experiment. To reduce the chance of
introducing electromagnetic artifacts into the recording, the electrode leads and EEG
amplifier cord were physically separated from the ER-2 transducer as much as possible.
Participants were encouraged to close their eyes, relax, and try to sleep in order to reduce
muscle artifacts. The sound-booth lights were switched off for the duration of the
experiment.

21
2.4 Experiment 1 Analysis
2.4.1 EFR Analysis and Detection
Response analysis was performed offline using MATLAB software (version
8.3.0.532[R2014a]; Mathworks, Natick, MA, USA) in a similar manner to Easwar et al.,
2015. Each 24.282 s sweep was divided into 24 epochs of 1.01175 s each. A noise metric
was calculated for each epoch, using the average EEG amplitude between approximately
80 and 240 Hz. Epochs exceeding two standard deviations above the mean noise metric
were rejected prior to averaging. Opposite stimulus polarities were then averaged
together (Easwar & Purcell, 2015; Aiken & Picton, 2008); EFR responses were then
analyzed using predetermined boundaries corresponding to the start and end of each
vowel segment.
EFRs recorded over the course of the 148-sweep EEG were estimated using a Fourier
analyzer (FA; Choi et al., 2013; Easwar et al., 2015). Sine and cosine reference sinusoids
were generated using the instantaneous f0 frequency of the stimulus. A 10 ms delay
correction was also applied to the EEG, in order to account for estimated brainstem
processing delay (Aiken and Picton, 2006; Choi et al., 2013, Easwar et al., 2015, Purcell
et al., 2004). The delay-corrected EEG was then multiplied by the sinusoids to produce
real and imaginary components of the EFR at f0. Each of the two components was low-
pass filtered by averaging over vowel duration to provide a single complex value that
provided an estimate of EFR amplitude and phase. This process was repeated across all
vowel contexts, for a total of 28 separate EFR estimates per recording.
Using two frequency tracks below and five frequency tracks above the f0 response, the
FA also produced an estimate of the background EEG noise. The separation in Hertz of
the frequency tracks varied with analyzer bandwidth, which is the reciprocal of vowel
duration, resulting in different track spacing based on vowel identity. Certain tracks, such
as the one containing 60 Hz, and the tracks +1/-1 bandwidth of f0, were excluded to avoid
contamination of the noise estimate. As the talker had a very low f0 overall
(approximately 90 Hz), the number of tracks below f0 that could be included were

22
limited. Figure 3 below provides an illustration of the FA noise track estimates for /u/ in
an /hVd/ context.
The EEG noise across all seven tracks was averaged in order to produce a single noise
estimate, which was then compared with the previously calculated EFR amplitude
estimate using an F-test. If the ratio of the EFR amplitude exceeded the critical F-ratio (2,
14 degrees of freedom) of 3.7389 at an α of 0.05, the EFR was considered detected.

23
Figure 3: Illustration of the Fourier analyzer noise track estimates.
The line in blue represents the fundamental frequency track, f0.

24
2.4.2 Data Exclusion
Overall, 70% of all measured EFRs were significantly detected. Unfortunately, all
subjects but one presented with at least one non-significant EFR measurement. As the use
of repeated measures analysis of variance (RM-ANOVA) as discussed later requires
complete data from all participants, this presented an analysis complexity. Typically
when performing an RM-ANOVA analysis, missing data is dealt with by either excluding
participants with missing data, or selecting one of the available data imputation methods.
Given the nature of the present EFR data, excluding participants with non-significant
responses would be impossible. While missing data imputation is also a valid approach, it
carries the risk of introducing significant estimation bias into the analysis (Gueorguieva
& Krystal, 2004) and is not necessarily an accurate representation of a participant’s true
EFR responses. Additionally, simply excluding any participants without significant
responses, or inferring those responses from a sometimes-limited pool, is not an accurate
representation of how EFR measurement might occur in a clinic. As well, even non-
significant responses provide a small quantifiable estimate of the true EFR amplitude that
is otherwise obscured by incidental background noise. For these reasons, the decision was
made to include all EFR data in the analysis regardless of significant detection.
Recordings from myogenically noisy participants are likely to be dominated by artifacts,
and could negatively impact the group EFR sample. In order to retain an optimal sample
size, while still excluding those participants with contaminated recordings, participants
were excluded from further analysis based on two criteria.
Firstly, a noise metric threshold was calculated for each participant; as mentioned above,
noise metrics were calculated as the average EEG amplitude between 80 – 240 Hz in
each 1-second epoch of the stimulus (Easwar, 2014). These calculations were than
averaged by participant to produce a single noise metric threshold for each participant,
and averaged across participants to produce a group estimate (x̅ = 621.29 nV, σ =
±360.52 nV). Subjects with a noise metric threshold exceeding 2 SDs above the mean (≥
1324.34 nV) were excluded (n = 1). After this round of rejection, the noise estimates
neighbouring the EFR response frequency for each vowel/consonant context were
averaged across a given participant, and then across all participants to produce an average

25
noise value near the response frequency (x̅ = 52.74 nV, σ = ±37.56 nV). Participants
whose average noise level exceeded two SDs above the mean (≥ 113.54 nV) were
excluded from further analysis (n = 2). Finally, one subject was removed from the
experiment for high audiometric thresholds (≥ 25dB HL across 2+ test frequencies in
both ears), and self-reported tinnitus. In total, 30 participants remained for the final
analysis.
2.4.3 Stimulus Artifact Evaluation
A stimulus artifact check was performed on two individuals to confirm that presumed
responses were not generally contaminated by cross-talk of the stimulus to the recording
channel. Setup was performed as detailed above, but utilizing a no-stimulus-to-the-ear
recording. The foam tip of the transducer was inserted into a Zwislocki coupler (a real-
ear simulator) that was placed next to the participant. The stimulus was presented for its
full duration, and response analysis was performed as detailed above. The false-positive
rate, or the rate of significant EFR detections in the absence of the stimulus, was 3.57%
(two significant detections out of 56), which was close to the expected α of 5% during
response analysis.
A similar check was performed using a head simulator created with a tub of tap water.
Electrode impedance was approximately 1.5 kΩ. The EFR electrode montage was set up
with electrodes positioned to approximate their locations on a real human. The bucket
was placed in the booth and was otherwise set up identically to the real human artifact
check. The false-positive rate was also 3.57% (one significant detection out of 28) and
that false “response” was numerically small (13.9 nV). It is unlikely, therefore, that false
positives or stimulus artifact had a significant impact on observed EFR responses.

26
Chapter 3
3 Experiment 1 Results and Discussion
EFR responses from 30 participants (17 female, 13 male) were analyzed for Experiment
1. All statistical analysis was performed using R (version 3.3.1; R Core Team, 2016) and
RStudio (1.0.136; RStudio Team, 2016).
3.1 Effect of Consonant and Vowel on EFR Amplitude
Figure 4 illustrates the average EFR response and average noise amplitude across the
group for each context present in the study. A large degree of variability in EFR
amplitude was observed (x̅ = 131.27 nV, σ = ±63.77 nV) across participants.
A two-way repeated measures analysis of variance (RM ANOVA), as implemented
through the car package (version 2.1-4; Fox & Weisberd, 2011), was used to examine the
effects of consonant and vowel on observed EFR amplitude. As sphericity is a critical
assumption of all RM ANOVA, the results from Mauchly’s test were interpreted and
applied prior to examination of any significant effects.
Mauchly’s test showed a violation of the sphericity assumption for vowel (0.16[20],
p<0.001) and for the interaction between consonant and vowel (<0.001[170], p<0.001)
but not for consonant (0.86[5], p = 0.52).
The RM ANOVA, after Greenhouse-Geisser corrections were applied (ε = 0.67) revealed
a significant main effect of vowel identity on EFR amplitude (F[4.013, 116.364] = 8.949,
p < 0.001, η2p = 0.236). Post-hoc comparisons were performed using paired t-tests
corrected for multiple comparisons using the False Discovery Rate (FDR) method
(Benjamini & Hochberg, 1995). Multiple significant differences in EFR amplitude based
on vowel were found after post-hoc correction, as illustrated by Figure 5 below.

27
Figure 4: Group EFR amplitude and noise estimates across all experimental contexts.
Error bars indicate one standard deviation above the mean in each category.
28
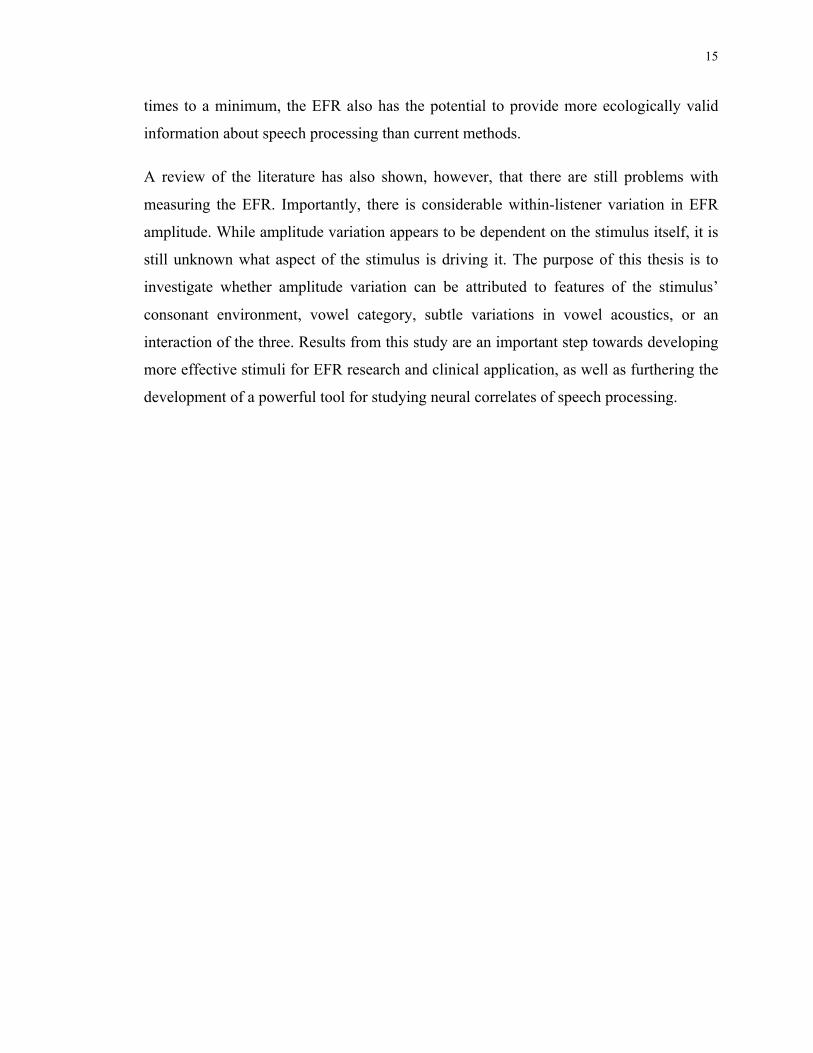
Figure 5: Notched boxplot comparing EFR amplitude across vowel, and collapsed across consonant context.
Box area indicates all data within the 25th – 75th percentiles, and the black line indicates the median response for the vowel group. Vertical whiskers indicate the maximum and
minimum values; points lying beyond these limits are considered outliers. Notches indicate the 95% confidence interval around the median. Significance codes: * = 0.05, **
= 0.01, *** = 0.001, **** < 0.001.
29
Vowel /æ/ was found to elicit higher EFR amplitudes than all other vowel categories (/ɔ/
t[119] = -4.19, p < 0.001; /ɛ/ t[119] = -3.19, p < 0.003; /ej/ t[119] = -12.22, p < 0.001; /ɪ/
t[119] = -6.87, p < 0.001; /ij/ t[119] = -4.87, p < 0.001; /u/ t[119] = -5.34, p < 0.001).
Vowel /ɔ/ produced higher EFRs when compared with /ɪ/ (t[119] = -2.33, p = 0.035) and
/ej/ (t[119] = -6.22, p < 0.001).
The mid-front vowel /ɛ/ was also found to elicit EFRs of greater amplitude than several
other vowels (/ej/ t[119] = -7.00, p < 0.001; /ɪ/ t[119] = -3.24, p = 0.003). Finally, the
vowel /ej/ was observed to produce EFRs of lower amplitude when compared to vowels
/ɪ/ (t[119] = 4.05, p < 0.001), /ij/ (t[119] = 4.66, p < 0.001) and /u/ (t[119] = 4.89, p <
0.001). Table 3 below lists the differences in mean EFR amplitude for all significant
vowel comparisons.
A significant main effect of consonant environment on EFR amplitude (F[3,87]=3.05,
p=0.037, η2p = 0.095) was also observed. As consonant did not violate the assumption of
sphericity, no corrections were applied. Post-hoc comparisons revealed a single
significant difference in EFR amplitude based on consonant environment: /ʒVv/ elicited
higher amplitude EFRs when compared to /sVt/ (t[209] = 3.02, p = 0.017), with a mean
difference of 11.6 nV (/ʒVv/ - /sVt/). No other consonant environment contrasts
approached significance.
Though the interaction between consonant environment and vowel identity reached
significance at p < 0.05 in the original RM ANOVA, it only approached significance
(F[8.884, 257.654] = 1.809, p = 0.068, η2p = 0.059) after GG corrections (ε = 0.49) were
applied to account for sphericity violations, and was therefore not analyzed further.

30
Differences in Mean EFR Amplitudes by Vowel
/æ/ /ɔ/ /ɛ/ /ej/ /ɪ/ /ij/
/ɔ/ -23.5400 /ɛ/ -18.7725 /ej/ -57.1550 -33.6150 -38.3825 /ɪ/ -38.8291 -15.2891 -20.0566 18.3259 /ij/ -33.4558 23.6992 /u/ -32.4883 24.6667
Table 3: Mean differences in EFR amplitude (nV) for all significant vowel comparisons.
Differences have been calculated by subtracting column values from row values (e.g. /ej/ - /æ/).
31
3.2 Effect of Consonant and Vowel on Noise
Variations in noise across experimental conditions were also observed (x̅ = 45.8 nV, σ =
±17.83 nV). Using a two way RM ANOVA, the effect of consonant environment and
vowel identity on participant noise estimates neighbouring the response was investigated.
After GG correction (ε = 0.52) for sphericity, (0.082[20], p < 0.001), a strong main effect
of vowel identity on the noise estimate emerged (F[3.129, 90.751]=20.447, p < 0.001, η2p
= 0.779). Post-hoc tests corrected using the FDR method revealed multiple significant
differences between vowels; the differences in mean noise between significantly different
vowels can be seen in Table 4.

32
Differences in Mean Noise (nV) by Vowel /æ/ /ɔ/ /ɛ/ /ej/ /ɪ/ /ij/
/ɔ/ /ɛ/ 11.187 9.759 /ej/ -2.861 -4.288 -14.048 /ɪ/ 12.038 10.611 14.899 /ij/ -12.848 -13.700 /u/ 3.983 -7.204 6.843 -8.056 5.644
Table 4: Differences in mean noise (nV) for all significant vowel comparisons. Mean differences have been calculated by subtracting column values from row values
(e.g. /ɔ/ - /æ/).

33
Vowel /æ/ had lower noise on average than vowels /ɛ/ (t[119] = 6.19, p= < 0.001), /ɪ/
(t[119] = 6.97, p < 0.001), and /u/ (t[119] = 2.81, p = 0.009), but higher noise than /ej/
(t[119] = -2.13, p = 0.049). Mid-back vowel /ɔ/ was less noisy than both /ɛ/ (t[119] =
5.15, p < 0.001) and /ɪ/ (t[119] = 6.38, p < 0.001), but significantly noisier than /ej/
(t[119] = -3.01, p = 0.005). Vowel /ɛ/ had higher noise than vowel tokens /ej/ t[119] =
-7.79, p < 0.001), /ij/ t[119] = -7.36, p < 0.001), and /u/ t[119] = -3.59, p = 0.001). Vowel
/ɪ/ resulted in higher noise estimates than either /ij/ (t[119] = -8.35, p < 0.001) or /u/
(t[119] = -4.25, p < 0.001). Finally, /ij/ resulted in less noise on average compared to /u/
(t[119] = 3.41, p = 0.002).
That the short duration front vowels /ɛ/ (139.76 ms) and /ɪ/ (142.73 ms) produced the
highest noise estimates (x̅ = 53.54 nV and 54.39 nV, respectively) is not surprising given
that the noise estimate is inversely related to vowel duration (Choi et al., 2013).
Contrastively, vowels /ej/ and /ij/, which had the longest durations (243.26 ms and 243.58
ms) also tended to have lower noise estimates when compared to the other vowel tokens,
as well as having the lowest noise estimates on average (/ej/ x̅ = 39.49 nV, /ij/ x̅ = 40.69
nV). Overall, the variation in noise levels across stimuli is not concerningly large, and
has a relatively constrained range across all participants, especially when compared to the
variation observed in EFR amplitude, as can be seen by comparing the histograms in
Figure 6 and Figure 7 below. As a result, noise is unlikely to have affected measured
responses in a significant way.
A main effect of consonant on noise was also significant (F[3,87]=9.524, p < 0.001,
partial η2p = 0.12). No corrections were made, as consonant did not violate the
assumption of sphericity. Post-hoc examination only found significant differences
between the /sVt/ context and all other consonant environments, as can be seen below in
Figure 8. /sVt/ contexts produced higher noise than /ʒVv/ (t[209] = 4.69, p < 0.001),
/hVd/ (t[209] = 3.91, p < 0.001), and /zVf/ (t[209] = -3.05, p = 0.005).
Though significant, the amount of overlap in the 95% confidence intervals around the
medians of each consonant category in Figure 8 suggest that overall the differences are
fairly small; while /sVt/ had the highest mean noise at 49.22 nV, it was quite numerically

34
similar to /zVf/ (x̅ = 45.53 nV), and elevated only marginally compared to /hVd/ (x̅ =
44.67 nV) and /ʒVv/ (x̅ = 43.73 nV). The nature of the mechanism responsible for this
variation in noise levels across consonant environment is unknown, as is the source of
differences in noise (3 significant differences) compared to response amplitude (1
significant difference) variations across conditions. Ultimately, as with the differences in
noise across vowel identity, these variations are small and are unlikely to substantially
impact response estimates.

35
Figure 6: Histogram of the by-participant noise range in Experiment 1.
0
1
2
3
4
5
25 30 35 40 45 50 55 60 65 70 75 80 85 90 95Noise (nV; individual max−min noise estimate)
Num
ber o
f Par
ticip
ants
in B
in
By−Participant Noise Range (nV) in Experiment 1
36
Figure 7: Histogram of the by-participant response amplitude range in Experiment
1.
0
1
2
3
4
5
6
80 90 100 110 120 130 140 150 160 170 180 190 200 210 220 230 240 250 260 270 280Response (nV; individual max−min response estimate)
Num
ber o
f Par
ticip
ants
in B
in
By−Participant Amplitude Range (nV) in Experiment 1

37
Figure 8: Notched boxplot comparing noise across consonant environments.
Box area indicates all data within the 25th – 75th percentiles, and the black line indicates the median noise for the consonant group. Vertical whiskers indicate the maximum and
minimum values; points lying beyond these limits are considered outliers. Notches indicate the 95% confidence interval around the median. Significance codes: * = 0.05, **
= 0.01, *** = 0.001, **** < 0.001.

38
3.3 Experiment 1 Discussion
3.3.1 Consonant Environment
Overall, the main effect of consonant environment on EFR amplitude was, though
significant, relatively minor, with /ʒVv/ contexts eliciting slightly higher EFR amplitudes
(+11.6 nV) compared to /sVt/ contexts. The onset consonants of these two contexts, /ʒ/
and /s/, are linguistically very similar. Both are fricatives, though /s/ is produced with the
tip of the tongue slightly more anterior in the mouth relative to /ʒ/, but the articulatory
differences are quite minor (O’Grady & Archibald, 2011).
The major difference between the two lies in their voicing; /ʒ/ is a voiced fricative,
whereas /s/ is unvoiced. Previous work has shown an effect of voicing in AEPs in CV
syllables, with larger N1 amplitudes observed in response to voiced consonants in non-
musician listeners (Ott, Langer, Oechslin, Meyer & Jäncke, 2011; Zaehle, Jäncke &
Meyer, 2007). Though the N1 is an AEP generated in the auditory cortex, versus the
largely-brainstem based generators of the EFR, it is possible that voicing had an impact
on EFR amplitude.
Additionally, though the other contrasts did not reach significance after correction, /ʒVv/
contexts did elicit numerically higher mean EFR amplitudes (137.5 nV) than the other
voiceless-onset consonant context, /hVd/ (131.1 nV). The /zVf/ environment did not
produce EFRs substantially different from /hVd/, but, like /ʒVv/, elicited numerically
higher EFR responses on average (130.7 nV, +4.9 nV) when compared to the voiceless-
onset /sVt/ context (125.8 nV).
It is difficult to conclusively say what aspect of the consonant environment may be
impacting EFR amplitudes, given the small pool of consonant contexts used in this
experiment. Based on these initial results, and those of previous AEP studies, the effect
of voicing holds some promise. More exhaustive results, based on a broader range of
consonant contexts, is needed to demonstrate a substantial effect of voiced versus
voiceless consonants on EFR amplitude.

39
Ultimately, given the relatively limited effects of consonant context on EFR amplitude
after corrections, despite a large sample size, it is unlikely that consonant environment is
contributing substantially to the EFR responses in this experiment.
3.3.2 Vowel Identity
Finding an overall main effect of vowel on EFR amplitude is in line with results from
previous studies of both naturally produced and steady state vowel tokens (Aiken &
Picton, 2006; 2008; Choi et al., 2013). Some differences in average EFR amplitude were
observed, however. It is important to note that while the overall presentation level of the
stimulus was approximately 65 dBA SPL, relative level differences did exist between the
individual vowel phonemes, as listed below in Table 5.
For naturally produced vowels /ij/ and /u/, Choi et al. (2013) reported average amplitudes
of 106 and 173 nV, respectively. The average amplitude for /ij/ in the present experiment
was slightly higher numerically speaking, at 127 nV, and somewhat lower for /u/, at 128
nV. Additionally, while Choi et al. (2013) observed very low EFR amplitudes for the
back vowel /ɔ/, at 78 nV, the average response in this experiment was considerably
higher, at 137 nV.
Interestingly, while previous work observed vowels at the most extreme points of
articulation causing higher-amplitude EFRs (Aiken & Picton, 2006), most of the vowels
in the present study producing large EFR responses, with the exception of the low front
vowel /æ/, are typically considered middle vowels. Additionally, these vowels also
require relatively neutral articular placement during production and are unrounded.
The precise source of the variation in EFR amplitudes for the same vowel observed
across different experiments is unknown. As discussed in the Introduction (see section
1.2.2), there are many characteristics related to speech production that are unique across
speakers, including variations in f0 and formant frequencies. As a result, it is likely that
the differences in overall EFR amplitude observed between experiments are related to
differences in the acoustics between different talkers.

40
/ij/ /ɪ/ /ej/ /ɛ/ /æ/ /u/ /ɔ/ Relative Level (dB) 0 3 3 2 1 2 6
Table 5: Relative level differences between vowels estimated with Praat. Reference (0 dB) is the lowest stimulus level across the vowels (/ij/).

41
3.3.2.1 Cochlear Stimulus Delays
Differences in the relative cochlear delay of voice harmonics in a vowel’s F1 and F2
bands might provide a more parsimonious explanation than articulation features for
observed EFR variation across vowel identity (Aiken & Picton, 2006). The early
formants, particularly F1 and F2, carry most of the acoustic energy in a given vowel, and
the EFR is known to follow envelope modulation at both formants (Easwar & Purcell,
2015). Due to the physical structure and mechanics of the cochlea, however, neural
responses initiated at F1 and F2 cochlear regions necessarily begin at different times.
Since higher frequencies are arranged at the basal end of the basilar membrane, closest to
the oval window, responses to F2 will always begin earlier in time than responses to F1.
The EFR measured in this experiment is likely the sum of multiple responses initiated by
voice harmonics associated with each formant; this results in stimulation across multiple
regions in the cochlea that correspond to a given vowel’s formant frequencies. As a
result, if the responses stimulated by voice harmonics around F1 are out of phase with
those stimulated by frequencies around F2 due to cochlear delays (and therefore stimulus
envelope phase delays), their summation could result in destructive addition, which
would reduce the overall amplitude measured at the scalp.
Aiken and Picton (2006) found that these phase delays, calculated with Eggermont’s
(1979) estimates of cochlear delay, best accounted for the variation in EFR amplitudes
across their stimuli. Utilizing a similar approach, stimulus envelope phase differences for
the F1 and F2 cochlear regions were calculated and the effect on a hypothetical
composite EFR (the sum of F1 and F2 region contributions) was estimated for each of the
seven vowels in Experiment 1.
To determine these effects, an estimate of the average f0 over the entire duration of each
vowel was first obtained using MATLAB, and estimates of F1 and F2 frequencies were
obtained using Praat. Using Eggermont’s (1979) model for estimating cochlear traveling
wave delay, the delays in seconds to the F1 and F2 cochlear regions of each vowel were
calculated. By subtracting the delay to F1 from the delay to F2, the relative delay (Δτ)
between the two formant regions was calculated. Assuming equal contribution from both

42
formants, a net EFR was modeled as the sum of two sinusoids with a relative phase angle
of 2π*f0*Δτ.
Due to the relative delay between F1 and F2 regions, the net EFR calculated from the
sum of their contributions was generally less than 100% of the maximum possible
amplitude had F1 and F2 contributions occurred perfectly in phase. The relative reduction
from this theoretical possible maximum was calculated as: 100 * (1 – model net EFR /
maximum possible net amplitude).
The F1 of vowel /æ/ was approximately 670 Hz, and the F2 was 1585 Hz. With
Eggermont’s (1979) delay estimates, the neural response at F2 would have begun 2.2 ms
prior to the response at F1, resulting in a phase difference of approximately 240° for an
average /æ/ f0 of 84 Hz). This phase shift would have reduced the net EFR response
measured at the vertex by approximately 16% from the possible maximum, a relatively
minor reduction. This suggests that phase differences between stimulus formants had
only a limited impact on the response amplitude to /ae/, and might account for the
consistently high EFR amplitudes measured in response to this vowel in this experiment.
A similar effect can be seen for the back vowel /ɔ/, which also elicited high response
amplitudes across participants. The relative delay between F2 and F1 cochlear regions
was 1.4 ms, which for a mean f0 of 83 Hz resulted in a 45° phase shift, and only a 7%
reduction in overall response amplitude. Interestingly, despite having a lower amplitude
reduction, /ɔ/ still elicited significantly smaller EFRs (-23.5 nV, see Table 3) compared to
/ae/. This suggests that while relative stimulus phase does appear important, it is unlikely
to be the only factor contributing to the observed differences across vowel.
Contrastively, for vowel /ej/, with an approximate f0 of 86 Hz, an F1 of 335 Hz and an F2
of 2300 Hz, the relative delay between F2 and F1 cochlear regions was 6.1 ms,
corresponding to a phase delay of 190°. This means that responses initiated from F1 and
F2 cochlear regions might be almost completely out of phase with one another, resulting
in a 92% decrease in the overall measured response. This corresponds well with the
results obtained from Experiment 1, as /ej/ consistently elicited the lowest EFR
amplitudes when compared to all other vowels.

43
Overall, the main effect of vowel on EFR amplitude may be attributable to stimulus
phase effects. This could account for the differences across vowel tokens in the present
paper and previous work (Choi et al., 2013, Aiken & Picton 2006), as different speakers
will have different fundamental and formant frequencies, which could affect the resultant
net EFR. Responses to /ej/ in this study were smaller, potentially due in part to
destructive addition of EFRs initiated from F1 and F2 cochlear regions with an f0 of 86
Hz. Assuming similar F1 and F2 frequencies and levels, an /ej/ token produced by a
different speaker with an f0 of 106 Hz, only 20 Hz higher, would result in only a 50%
decrease in EFR amplitude at Cz.
The impact of relative stimulus phase is also affected by the gender of the speaker. Using
formant and fundamental estimates from Hillenbrand et al.’s (1995) study on American
vowel characteristics, phase interactions for the average female speaker’s production of
/ej/ would result in only a 14% reduction in EFRs measured at Cz, due to a higher
fundamental (219 Hz), and less relative delay (5.5 ms) between F1 and F2 cochlear
regions of 536 and 2530 Hz, respectively.
Though relative stimulus phase does appear to be important, as seen in previous work
(Aiken & Picton 2006) and the present study, there are caveats. The calculations above
are dependent on the assumption that F1 and F2 have relatively equal contributions to the
EFR. Research on the FFR, an AEP with similar characteristics to the EFR, has
demonstrated that as stimulus level is increased, the amplitude of responses elicited by F1
tend to increase, overshadowing contributions from F2 and likely reducing the impact of
stimulus phase differences introduced by cochlear traveling wave delays (Krishnan,
2002). Though there has been comparatively less work done to study this effect on the
EFR, evidence for this unequal contribution does exist. Aiken and Picton (2006) found
that despite a predicted 30% reduction in /u/ based on phase shift calculations, responses
to /u/ were higher than to other vowels exhibiting a similar phase shift. Given that the F2
of their /u/ token had a level 25 dB lower than its F2, responses to harmonics near F2

44
may have been contributing less to the response, thus diminishing the overall importance
of relative phase differences between stimulus bands (Aiken & Picton, 2006).
Similar evidence for unequal F1 and F2 contributions can be seen in the present study as
well; based on relative phase differences, /ej/ had a predicted reduction of 92% from the
theoretical maximum. If this reduction were actually occurring, assuming equal
contributions, it would be unlikely that such a small net EFR would even be detectable at
the scalp. That it was measurable at all, though low in amplitude relative to other stimuli,
suggests that as in Aiken and Picton’s (2006) results, something more than phase delays
is contributing to differences in EFR amplitudes. The present stimulus design does not,
however, allow for separate evaluation of F1 and F2 contributions.
Overall, a strong effect of vowel identity on EFR amplitude was revealed through
Experiment 1. As discussed previously, however, the vowels that stimulated the highest
EFRs in this experiment were not entirely consistent with the results found in previous
work on natural and steady-state vowels (Aiken & Picton, 2006; Choi et al., 2013). Along
with previous work, the present experiment suffers from a limited pool of tokens:
participants were only exposed to a single token spoken by a single speaker for each of
the seven vowels.
Naturally produced vowels are somewhat variable even within a speaker. Though a given
speaker’s vowel categories are quite distinct, generally exhibiting little overlap in F1 and
F2 space even across multiple productions (Mitsuya, MacDonald, Munhall & Purcell,
2015), variation in production does occur. This makes generalizing response amplitude
effects difficult; not only across the same vowel produced by different speakers, but
potentially even different instances of the same vowel produced by the same speaker. In
order to fully characterize the EFR, an important next step is to determine how sensitive,
if at all, the response is to subtle changes that are so characteristic of natural speech.

45
Chapter 4
4 Experiment 2 Methods
4.1 Participants
Sixty-eight participants (52 female, 16 male) between the ages of 18 and 28 (x̅ = 19.46
years, σ = ±2.43 years) were recruited from the local Western University community in
London, Ontario and through the Psychology Research Participation Pool (SONA).
English was the first language of 62 participants, with 6 participants indicating they had
learned English concurrently with another language. There were no self-reported speech,
language or neurological impairments. Routine otoscopy revealed no occluding wax,
discharge, or other obstructions in the left ear canal. Audiometric thresholds were tested
as per Experiment 1 (see Section 2.1 for details), and all participants had normal
thresholds across all test frequencies. All participants provided informed consent prior to
the start of the experiment, and were compensated for their time either monetarily or with
course credit.
4.2 Stimuli
4.2.1 Construction
The focus of this second experiment was to determine whether the natural variations in
vowel acoustics that occur during speech across a given vowel category had an effect on
the EFR amplitude. The same list of vowels and consonants used in Experiment 1 were
used to build the stimuli for Experiment 2 (see Section 2.2.1).
All vowels and consonants were recorded in neutral /hVd/ and word-initial /Cɑ/ contexts,
respectively. The talker for this experiment was a 25 year-old male native English
speaker. The recording setup and script were identical to Experiment 1 (see Section 2.2.1
for details). A total of seven recordings of the full list of consonants and vowels were
made.

46
As before, Praat was used to splice the consonants and vowels out of their respective
contexts. The consonant files were selected based on their sound quality, as determined
using Sennheiser HD 280 Pro headphones, and were the same across all conditions. Four
instances of each vowel were chosen in a similar manner, additionally using Praat to
inspect the f0 track for relative flatness.
As in Experiment 1, all seven vowels were concatenated with all four consonant contexts
(See Table 6 below for a complete list of stimuli). Due to logistical constraints, only four
vowel categories were chosen as the final stimuli for Experiment 2: /ij/, /ɛ/, /u/ and /ɔ/.
These vowels were chosen in order to broadly cover the range of the Canadian English
vowel spectrum. Four different instances of each vowel were selected as tokens within
each category. Vowel duration was controlled for within category by adjusting the length
of each sound file to be equivalent to the shortest of the four tokens. Intensity was
controlled for by equalizing the intensity of each individual vowel file to the mean
within-category intensity across all four tokens. See Table 7 below for a comprehensive
overview of all vowel stimuli used in this experiment.
After adjustment, each token was then concatenated with each of the four consonant
contexts, resulting in 16 total words/pseudowords per vowel category. Onset and offset
ramps of 5 ms were added to each word, before they were concatenated with 10 ms of
silence between each word. In total, four stimulus files were created, one for each vowel
category. Sweep duration for each of the stimulus files were as follows: 16.324 s for /ij/,
14.502 s for /ɛ/, 25.972 s /u/ and 16.546 s for /ɔ/. As in Experiment 1, both polarities
were presented in the final stimulus files.

47
/ij/ /ɛ/ /u/ /ɔ/ /h V d/ hijd hɛd hud hɔd /s V t/ sijt sɛt sut sɔt /z V f/ zijf zɛf zuf zɔf /ʒ V v/ ʒijv ʒɛv ʒuv ʒɔv
Table 6: Concatenated words and pseudowords used in Experiment 2.

48
Vowel Trial
f0 range (min, max; Hz)
Mean f0 (Hz) F1 (Hz) F2 (Hz) Duration
(ms) Relative
Intensity (dB)
/ij/
Trial 1
96.6, 132.7
128 302 2233
212.8 1 Trial 2 126 303 2215 Trial 3 125 293 2178 Trial 4 127 324 2213
/ɛ/
Trial 1
96.5, 131.4
123 614 1758
155.8 4 Trial 2 117 598 1691 Trial 3 117 619 1655 Trial 4 125 603 1788
/u/
Trial 1
93.1, 132.8
121 304 1023
201.7 0 Trial 2 125 254 619 Trial 3 128 348 1032 Trial 4 124 325 1039
/ɔ/
Trial 1
91.6, 127.4
119 684 1085
219.9 6 Trial 2 117 695 1078 Trial 3 123 687 1108 Trial 4 122 690 1117
Table 7: Experiment 2 descriptive stimulus characteristics. f0 ranges are the minimum and maximum frequency values calculated from across all
vowel tracks present in the given stimulus file (16/vowel type). Relative intensity reference level (0) is to the lowest intensity vowel.

49
4.2.2 Presentation and Recording
Unlike the pure within-subject design of Experiment 1, where each participant heard all
vowel and consonant combinations, vowel category served as a between-subjects variable
in Experiment 2. Each participant only heard the four vowel tokens within a given
category for the duration of the experiment. This was done in order to maximize the
amount of data that could be recorded for a given vowel token, while also keeping the
experiment to a single session with a reasonable recording time of ≤ 60 minutes. Total
number of sweeps collected for each of the stimulus files were as follows: 200 for /ij/,
230 for /ɛ/, 200 for /u/ and 200 for /ɔ/. More sweeps were collected for /ɛ/ in order to
compensate for the increased noise typically associated with short vowels; additionally,
because it had the shortest sweep duration, more instances could be presented in under 60
minutes compared to the long vowels. Presentation level was relatively similar across all
vowels, with minor differences between vowels: 70.5 dBZ SPL for /ij/, 70.1 for /ɛ/, 70.7
for /u/, and 70.5 for /ɔ/. Stimulus presentation and response recording were otherwise
performed using the same paradigm as in Experiment 1 (see section 2.2.2 and 2.3
respectively).
4.3 Experiment 2 Analysis
4.3.1 EFR Analysis and Detection
Response analysis and EFR detection was performed using the same procedure as
Experiment 1 (See section 2.4.1 for details), adjusted slightly to accommodate the
reduced number of EFR estimates (16 rather than 28) required for each of the four
stimulus files.
Though the FA process was largely similar, the frequency tracks above and below the f0
response used to estimate background EEG noise were also adjusted. Five tracks above
and three tracks below f0 were used, in order to ensure 60 Hz was excluded from the noise
estimates. Within a stimulus token, the EEG noise was averaged across all frequency
tracks to produce a single noise estimate, which was then compared with the EFR
amplitude estimate using an F-test. As with Experiment 1, if the ratio of the EFR

50
exceeded the critical F-ratio (2,16 degrees of freedom) of 3.6337 at an α of 0.05, the EFR
was considered detected.
4.3.2 Data Exclusion
The overall EFR detection rate was lower than in Experiment 1, with 42.19% of all
measured EFRs significantly detected. By vowel category, 44.44% of all EFRs elicited
by /ij/, 37.87% elicited by /u/, 33.86% elicited by /ɔ/, and 55.88% elicited by /ɛ/ were
significantly detected. All EFR data was included in the analysis regardless of significant
detection, for reasons detailed in Section 2.4.2.
Data exclusion was performed using the same requirements as Experiment 1 (see Section
2.4.2). All participants whose average noise metric threshold (x̅ = 614.84 nV, σ = ±363.25
nV) exceeded two standard deviations above the mean (≥ 1341.33 nV) were removed
from further consideration (n = 2). Average noise values near the response frequency
were then calculated (x̅ = 32.62 nV, σ = ±9.27 nV) across all participants, and any whose
average noise level exceeded two SDs above the mean (≥ 51.16 nV) were removed from
the analysis (n = 2). A total of 64 participants remained for analysis, distributed evenly
across the four vowel conditions (n = 16 per group).
4.3.3 Stimulus Artifact Evaluation
A stimulus artifact check was performed with each of the four stimulus soundtracks in a
similar manner as Experiment 1 (see Section 2.4.3). The rate of significant EFR
detections in the absence of any stimulus was 6.25% for the vowel /ij/ (one significant
detection out of 16), 6.25% for the vowel /ɛ/, 0% for /u/ and 6.25% for /ɔ/. The false-
positive rate across each of the stimulus files was close to the expected α of 5% during
response analysis. All significantly detected false-positive responses (n = 3 across all
stimulus files) were relatively small in amplitude compared to the noise floor.
The artifact check was repeated using the same head simulator procedure as Experiment
1 for each of the four stimulus files. The false positive rate was 0% for the vowel /ij/,
6.25% (with a “response” amplitude of 8 nV) for the vowel /ɛ/, 0% for /u/ and 0% for /ɔ/.

51
Based on the results of both of these checks, it is highly unlikely that either false-
positives or stimulus artifacts had a significant bearing on observed EFR responses.

52
Chapter 5
5 Experiment 2 Results and Discussion
EFR responses from 64 participants (48 female, 16 male) were analyzed for Experiment
2. R (version 3.3.1; R Core Team, 2016) and RStudio (1.0.136; RStudio Team, 2016)
were used for all analyses, as in Experiment 1.
Variations in EFR amplitude was observed based on overall vowel category, as in
Experiment 1; /ɛ/ (x̅ = 80.08 nV, σ = ±42.20 nV) had the highest mean amplitude, as well
as the widest standard deviation. Vowels /ij/ (x̅ = 53.13 nV, σ = ±33.40 nV) and /u/ (x̅ =
53.19 nV, σ = ±28.53 nV) produced relatively similar mean amplitudes, with /ɔ/ (x̅ =
45.81 nV, σ = ±23.51 nV) eliciting the lowest EFRs on average. Figure 9 below
illustrates the average EFR amplitude and noise estimates for each vowel category and
each vowel trial within that category.

53
Figure 9: Group EFR amplitude and noise across all experimental contexts. Error bars indicate one standard deviation above the mean in each category.

54
In order to examine the effects of consonant, vowel category, and vowel trial on EFR
amplitude, a three-way RM ANOVA, using code from the car package (version 2.1-4;
Fox & Weisberd, 2011), was implemented. Mauchly’s tests for sphericity were included
for each main effect and interaction in the RM ANOVA output, and their results were
considered prior to further examination of any significant effects.
The RM ANOVA revealed a significant three way interaction between consonant, vowel
category, and vowel trial on EFR amplitude (F[27, 540]= 2.041, p = 0.002, η2p = 0.093)
No violation of sphericity was detected (0.52[351], p = 0.77), therefore no correction to
the degrees of freedom was necessary. Post-hoc tests, using FDR correction for multiple
comparisons (Benjamini & Hochberg, 1995), were used to further investigate this
complex interaction. As vowel category was a between-subjects factor for Experiment 2,
and in order to retain power, all comparisons were done within each group of 16
participants
5.1 Effect of Vowel Trial on Amplitude within Consonant Environment
To investigate the effect of consonant context across individual vowel trials, the first set
of post-hoc tests held consonant context constant, and investigated the effects that each of
the four vowel trials had on EFR amplitude within that context.
For vowel /ij/ (see Table 8 below), multiple significant differences emerged across trial
within the /ʒVv/ context; Trial 1 elicited lower average EFR amplitudes compared to
Trials 3 (t[15] = 2.48, p = 0.04) and 4 (t[15] = 3.35, p = 0.03), and Trial 4 elicited higher
amplitudes compared to Trial 2 (t[15] = 2.87, p = 0.03) and Trial 3 (t[15] = 2.76, p =
0.03). Within the /zVf/ consonant context, Trial 4 also elicited higher average EFR
amplitudes than Trial 1 (t[15] = 3.65, p = 0.01). No significant differences were found
within the /hVd/ or /sVt/ contexts.
For vowel /u/ (see Table 9 below), only one significant difference was found, in the /sVt/
context; Trial 3 elicited higher amplitudes on average compared to Trial 1 (t[15] = 3.2, p

55
= 0.04). No significant differences were found within any consonant context for vowel
/ɔ/.
The majority of significant differences were found across trials for /ɛ/ (see Table 10
below). Within the /hVd/ context, Trial 3 elicited lower EFR amplitudes than Trial 2
(t[15] = -2.96, p = 0.02), and Trial 4 elicited lower amplitudes than both Trial 1 (t[15] = -
3.8, p = 0.005) and Trial 2 (t[15] = -5.03, p < 0.001). Within the /zVf/ consonant context,
Trial 2 elicited lower amplitudes than Trial 1 (t[15] = -3.07, p = 0.02). Trial 3 elicited
lower amplitudes than both Trials 1 (t[15] = -4.21, p = 0.005) and 2 (t[15] = -3.55, p =
0.009), and Trial 4 elicited lower EFR amplitudes compared to Trial 3 (t[15] = 2.9, p =
0.02).
Finally, within the /sVt/ context, Trial 2 elicited lower EFR amplitudes than Trial 1 (t[15]
= -3.37, p = 0.01), Trial 3 elicited lower EFRs than Trial 1 (t[15] = -2.51, p = 0.05), and
Trial 4 also elicited lower amplitudes than Trial 1 (t[15] = -4.17, p = 0.005). No
significant differences were found across trial within the /ʒVv/ consonant environment.

56
Vowel: /ij/
Trial 1 Trial 2 Trial 3
/ʒ V
v/ Trial 2 Trial 3 15.1938 Trial 4 38.8313 32.6375 23.6375
/z V
f/ Trial 2
Trial 3 Trial 4 27.1688 Table 8: Mean differences in EFR amplitude (nV) between trials of /ij/ within
consonant environment. Differences are calculated by subtracting column values from row values (e.g. Trial 3 –
Trial 1).
Vowel: /u/
Trial 1 Trial 2 Trial 3
/s V
t/ Trial 2 Trial 3 17.5063 Trial 4 Table 9: Mean differences in EFR amplitude (nV) between trials of /u/ within
consonant environment. Differences are calculated by subtracting column values from row values (e.g. Trial 3 –
Trial 1).
Vowel: /ɛ/
Trial 1 Trial 2 Trial 3
/h V
d/ Trial 2
Trial 3 -20.2205 Trial 4 -32.5644 -34.0493
/z V
f/ Trial 2 -30.1402
Trial 3 -33.1918 -4.0659 Trial 4 -4.0530
/s V
t/ Trial 2 -29.1258
Trial 3 -33.1918 Trial 4 -37.2448 Table 10: Mean differences in EFR amplitude (nV) between trials of /ɛ/ within
consonant environment. Differences are calculated by subtracting column values from row values (e.g. Trial 3 –
Trial 1).

57
5.2 Effect of Consonant Environment on Amplitude within Vowel Trial
The second group of t-tests were implemented to investigate the effects of different
consonant contexts within a given vowel trial. For these comparisons, the vowel trial was
held consonant, and its effects on EFR amplitude were contrasted across the four
different consonant environments.
Fewer significant differences emerged for vowel /ij/ under these conditions (see Table 11
below). For Trial 2, the /ʒVv/ context elicited a lower EFR amplitude than the same trial
in an /hVd/ context (t[15] = -2.69, p = 0.05). The /zVf/ context also elicited a lower EFR
amplitude than the /hVd/ context (t[15] = -2.85, p = 0.05). A significant difference
between contexts also emerged for Trial 4 of vowel /ij/: when embedded in the /sVt/
environment, Trial 4 elicited a lower EFR amplitude than when embedded in a /ʒVv/
context (t[15] = -3.53, p = 0.02).
When occurring in an /sVt/ environment, Trial 1 of vowel /u/ (see Table 12 below)
elicited lower amplitudes than when it was in either an /hVd/ (t[15] = -3.75, p = 0.01) or
/ʒVv/ (t[15] = 3.24, p = 0.02) environment. Additionally, when Trial 1 occurred in a /zVf/
environment, it elicited higher amplitudes than when it occurred in an /sVt/ environment
(t[15] = 2.44, p = 0.05). As in the previous set of post-hoc tests, no significant amplitude
differences emerged across consonant environment within trials of vowel /ɔ/.
The majority of significant contrasts emerged with vowel /ɛ/ again (see Table 13 below);
for Trial 2, the /ʒVv/ (t[15] = -4.88, p < 0.001), /sVt/ (t[15] = -6.21, p < 0.001) and /zVf/
(t[15] = -4.45, p < 0.001) contexts all produced lower amplitudes when compared to Trial
2 in an /hVd/ context. Within Trial 3, the /zVf/ (t[15] = -3.51, p = 0.02) context also
elicited lower amplitudes than Trial 3 in an /hVd/ context.

58
Vowel: /ij/ /h V d/ /ʒ V v/ /s V t/
Tri
al 2
/ʒ V v/ -18.1063 /s V t/ /z V f/ -19.0188
Tri
al 4
/ʒ V v/ /s V t/ -35.1875 /z V f/
Table 11: Mean differences in EFR amplitude (nV) between consonant contexts within trials of /ij/.
Differences are calculated by subtracting column values from row values (e.g. /ʒ V v/ – /h V d/)
Vowel: /u/
/h V d/ /ʒ V v/ /s V t/
Tri
al 1
/ʒ V v/ /s V t/ -26.9625 -17.2438 /z V f/ 21.6563
Table 12: Mean differences in EFR amplitude (nV) between consonant contexts within trials of /u/.
Differences are calculated by subtracting column values from row values (e.g. /s V t/ – /h V d/)
Vowel: /ɛ/
/h V d/ /ʒ V v/ /s V t/
Tri
al 2
/ʒ V v/ -38.6167 /s V t/ -39.9306 /z V f/ -39.2971
Tri
al 3
/ʒ V v/ /s V t/ /z V f/ -23.7761
Table 13: Mean differences in EFR amplitude (nV) between consonant contexts within trials of /ɛ/.
Differences are calculated by subtracting column values from row values (e.g. /ʒ V v/ – /h V d/)

59
5.3 Noise
Numerically speaking, the overall observed noise in Experiment 2 (x̅ = 31.56 nV, σ =
±10.11 nV) was numerically lower and was more closely clustered around the mean than
that of Experiment 1 (x̅ = 45.8 nV, σ = ±17.83 nV). Unsurprisingly, given its short
duration, /ɛ/ (x̅ = 36.44 nV, σ = ±10.21 nV) had the highest mean noise. Noise levels for
vowels /ɔ/ (x̅ = 30.28 nV, σ = ±9.25 nV) and /u/ (x̅ = 30.92 nV, σ = ±9.1 nV) were
relatively similar, with /ij/ (x̅ = 28.58 nV, σ = ±10.09 nV) having the smallest average
noise.
A three-way RM ANOVA was run in order to investigate the effects of consonant
environment, vowel category, and vowel trial on observed noise, following the same
procedure as outlined above (see the introduction to Section 5). The RM ANOVA
revealed two significant, two way interaction effects for noise: vowel category and
consonant (F[9,180]= 2.152, p = 0.03, η2p = 0.08), and vowel category and vowel trial
(F[9,180]= 3.642, p < 0.001, η2p = 0.1). As neither interaction violated sphericity
assumptions, no GG corrections were applied. All post-hoc tests were performed using
FDR corrections for multiple comparisons (Benjamini & Hochberg, 1995).
5.3.1 Effect of Vowel Category and Consonant on Noise
A few significant contrasts emerged across consonant environment for vowel /ɔ/, with
/sVt/ causing higher noise (+4.5 nV, mean /sVt/ - mean /hVd) as compared to /hVd/
contexts (t[63] = 4.07, p < 0.001), and /zVf/ contexts resulting in lower noise (-4.4 nV)
than /sVt/ (t[63] = -4.87, p < 0.001).
Vowel /ɛ/ was the only other vowel category to exhibit significant contrasts after FDR
corrections were applied. For vowel /ɛ/, /ʒVv/ contexts resulted in higher noise (+3.4 nV)
than /hVd/ contexts (t[63] = 2.38, p = 0.04). /sVt/ contexts (t[63] = 4.24, p < 0.001) and
/zVf/ contexts (t[63] = 4.46, p < 0.001) also resulted in higher noise as compared to /hVd/
(+6.9 nV and +5 nV, respectively).
60
5.3.2 Effect of Vowel Category and Vowel Trial on Noise
A small number of significant contrasts also survived correction for the interaction of
vowel category and vowel trial. For vowel /ij/, Trials 2 (t[63] = -2.92, p = 0.009) and 4
(t[63] = -4.37, p < 0.001) both exhibited less noise on average than Trial 1 (-2.9 nV and -
4.8 nV respectively), and Trial 4 additionally resulted in less noise (t[63] = -3.34, p =
0.004; -3.4 nV) as compared to Trial 3.
Vowel /u/ exhibited multiple significant contrasts in noise across vowel trial. Trials 3
(t[63] = -2.95, p = 0.006; -4.1 nV) and 4 (t[63] = -3.8, p < 0.001; - 5.2 nV) resulted in
lower noise on average as compared to Trial 1. Additionally, Trial 3 (t[63] = -3.58, p <
0.001; -4.0 nV) and Trial 4 (t[63] = -5.15, p < 0.001; - 5.1 nV) both exhibited less
observed noise on average as compared to Trial 2.
Overall, while several contrasts did emerge for both of the significant interactions in the
RM ANOVA, the observed noise amplitude range was relatively small within vowel
category, and smaller than variation observed in response amplitude (see Figure 10 and
Figure 11). Once again, while the exact nature of the mechanism responsible for this
variation in noise remains unclear, given the incredibly small differences in noise
demonstrated above, it is unlikely that noise is having a different impact on EFR response
estimates across conditions.

61
Figure 10: Histogram of the by-participant noise range within vowel category in
Experiment 2.

62
Figure 11: Histogram of the by-participant response amplitude range within vowel
category in Experiment 2.

63
5.4 Experiment 2 Discussion
5.4.1 Effect of Vowel Trial on Amplitude within Consonant Environment
In Experiment 1 it was suggested that the voiced/voiceless distinction between
consonants might be the cause of differences in EFR amplitude (see section 4.1 for a
discussion). Though Experiment 2 was limited to the same four consonant environments,
due to the design it is possible to compare the effects of different consonant across the
same instance of a given vowel, allowing for a more comprehensive look at the role
consonant might play.
The influence of voicing does not appear, based on the results of Experiment 2, to play a
consistent role in eliciting high amplitude EFRs. The pattern observed across those
vowels and trials that did result in significant contrasts (see section 5.1) showed that the
voiceless-onset /hVd/ context actually tended to elicit higher EFR amplitudes on average
as compared to its voiced-onset counterparts /ʒVv/ and /zVf/.
Though the onsets for all four environments used in this thesis are technically categorized
as fricatives, /h/ is somewhat unique. Spectral analysis shows that, of all the voiceless
fricatives, it has the lowest lower frequency limit (between 400 – 700 Hz), with an upper
limit around 6500 Hz, and major peaks in intensity around 1000 Hz (Strevens, 1960).
Importantly, these intensity peaks, as observed in /hVd/ spectra, are so distinct that they
actually mimic vowel formants; it is the only voiceless fricative occurring in Canadian
English to exhibit this property (Strevens, 1960).
As discussed in the Introduction (see section 1.3.1), stimulation across multiple
harmonics in the cochlea is important for initiating EFRs (Choi et al., 2013). The middle
ear is also most effective at transferring mid-frequency energy, peaking at around 1000
Hz, which includes the energy typically associated with /h/. The presence of /h/ in the
onset of the CVC words could therefore be interacting productively with the following
vowel to stimulate across a wider population of neurons in the cochlea, resulting in EFRs
of much higher amplitude as compared to other consonant contexts.

64
Overall, some of the observed consonant effects are consistent with previous work
suggesting that voiced consonants produced larger amplitude AEPs (Ott, Langer,
Oechslin, Meyer & Jäncke, 2011; Zaehle, Jäncke & Meyer, 2007). These previous studies
have focused on AEPs primarily produced in the auditory cortex (the N1). In the present
study, consonant environment /sVt/ elicited considerably lower amplitudes compared to
/ʒVv/ in both Trial 4 of /ij/ (-35.19 nV) and Trial 1 of /u/ (-17.24 nV); additionally,
voiced onset /zVf/ elicited higher amplitudes compared to /sVt/ in Trial 1 of /u/ (+21.66
nV). The results from the present experiment suggest that the auditory cortex source
recently implicated in FFR generation (Coffey et al., 2016) may be playing a more active
role than previously thought, as early brainstem neuronal populations are not generally
considered sensitive to fine linguistic cues. The present data are, however, too limited to
comprehensively explore this possibility. Though voiceless /sVt/ elicited lower response
amplitudes compared to voiced /ʒVv/ in two separate trials of two different vowels, other
present results are inconsistent: voiced /zVf/ elicited lower amplitudes than voiceless
/hVd/ in two separate trials of /ɛ/. Ultimately, more work needs to be done to fully
untangle the effect of voicing on EFR response amplitudes.
5.4.2 Effect of Consonant Environment on Amplitude within Vowel Trial
As in Experiment 1, and previous work studying vowel-evoked EFRs, vowel identity was
important in determining EFR amplitude. Notably, the high-amplitude EFR responses
measured to /ɛ/ in Experiment 1 (x̅ = 141.68 nV, σ = ±72.32 nV, median = 134.65 nV),
relative to the other vowels, were replicated in Experiment 2 (x̅ = 80.1 nV, σ = ±42.2 nV,
median = 69.6 nV). Though responses were numerically smaller in Experiment 2, this
difference is likely attributable to differences in speaker; in Experiment 1, the /ɛ/ token
had an f0 of 89 Hz, and an F1 of 465 Hz. Contrastively, the average f0 across all four /ɛ/
tokens from Experiment 2 was 121 Hz, and the average F1 was 608 Hz.
Data from auditory steady-state response literature suggests that response amplitude
decreases with increasing modulation frequency, with a fairly steep drop in amplitude
after 100 Hz (see Picton, John, Dimitrijevic, & Purcell, 2003 for a review). As the
average fundamental frequency (123 Hz) of the speaker in Experiment 2 was 36 Hz
65
higher than the speaker from Experiment 1 (36 Hz), this relatively higher modulation rate
might account not only for the discrepancy in amplitude between instances of /ɛ/, but the
lower average EFR amplitudes observed in Experiment 2 (x̅ = 58.05 nV, σ = ±35.12 nV)
compared to Experiment 1 (x̅ = 131.27 nV, σ = ±63.77 nV).
5.4.2.1 Cochlear Stimulus Delays
Results from Experiment 2 demonstrate that the envelope following response is sensitive
to subtle differences in acoustics across tokens of the same vowel (see section 5.1), even
when those tokens originated from the same speaker in identical contexts. In Experiment
1, the effect of F1 and F2 phase delays was found to be a fairly robust predictor of
differences in amplitude; vowel stimuli that had F1 and F2 responses that were
significantly out of phase due to cochlear delays displayed significant decreases in EFR
amplitude. As similar results have been observed prior in the literature as well (Aiken &
Picton, 2006), it is possible that F1 and F2 phase delays may account for the inter-trial
differences observed across vowel categories.
Using the same calculation method as Experiment 1 (see Section 4.3), the F1 and F2
phase delays were calculated for each vowel trial. Despite the consistency with the
literature demonstrated in Experiment 1, the predicted net EFR amplitude reduction in
Experiment 2 consistently failed to predict which trials would produce the greatest
response amplitudes. Despite producing the lowest amplitudes overall (x̅ = 45.81 nV, σ =
±23.51 nV), EFR responses to tokens of /ɔ/ were only predicted to be reduced 13% on
average from the theoretical possible maximum. Contrastively, despite producing the
highest amplitudes overall (x̅ = 80.08 nV, σ = ±42.20 nV), tokens /ɛ/ were predicted to be
reduced by an average of 50%. Finally, despite /ij/ and /u/ producing relatively similar
amplitudes (x̅ = 53.13 nV, σ = ±33.40 nV and x̅ = 53.19 nV, σ = ±28.53 nV,
respectively), /ij/ trials were predicted to be reduced only by an average of 12%, versus
the 69% reduction expected from trials of /u/.
The source of these discrepancies is not immediately clear, but the acoustic signal is a
complex one; it is highly unlikely that only one aspect of the stimulus – like F1 and F2
phase delays – is responsible for differences in response amplitude. Given the sensitivity

66
of the EFR to subtle differences in vowel tokens produced by the same speaker, it may
also be sensitive to other features of the stimulus that have not been properly accounted
for in the present experiment.
Additionally, as touched on in Experiment 1 (see Section 4.3), the method used here to
calculate phase delays is not perfect; first of all, it assumes equal contribution to the net
EFR from both F1 and F2 cochlear regions, which may not be the case. The present
experiment suffers from the same limitation as Experiment 1, in that it is not possible to
precisely separate and determine the relative contributions of responses initiated at F1
compared to those initiated by F2. Drawing on theory from the literature, however,
different contributions from F1 and F2 emerge as a likely source of the discrepancies
between estimated net EFR amplitude and observed responses.
5.4.3 Sensitivity of the EFR to Context
The major finding of the present study is that the envelope following response is highly
sensitive to different aspects of the stimulus: not only does its amplitude change based on
vowel identity, as seen in Experiment 1, but it can also be simultaneously influenced by
different tokens of the same vowel and their surrounding consonant environment. It is
important to note that this occurs in the absence of any coarticulation effects from the
onset consonant, as the experimental stimuli were constructed to remove these cues.
The major source of the interactions between vowel type, vowel trial, and consonant
environment are consistently observed for vowel /ɛ/. With respect to the effect of
consonant environment on amplitude when vowel trial is held constant, it is interesting to
note that the majority of differences between consonant environments for /ɛ/ tokens occur
with Trial 2, which consistently elicits higher amplitudes (Δx̅ = +39.3 nV) when
concatenated in an /hVd/ environment as compared to any other consonant environment.
Trial 2 had the lowest F1 (598 Hz) and the second lowest F2 (1655 Hz) of all the
different tokens of /ɛ/. As discussed in Section 6.1, acoustic analysis of /h/ reveals a
lower frequency limit of 400 – 700 Hz (Strevens, 1960). In combination with the
characteristic intensity bands seen in /h/ spectra, it could be the case that the lower
frequency limit of the /h/ token used in this experiment is interacting productively with

67
the low frequency F1 of /ɛ/’s Trial 2 to stimulate the cochlea, leading to a larger EFR
amplitude when compared to other consonants. That Trial 2 also elicited higher EFR
amplitudes in an /hVd/ context compared to Trials 3 (+20.2 nV) and 4 (+34 nV) of /ɛ/
further suggests that there may be some productive interaction between Trial 2’s low F1
and the acoustic features of /hVd/.
Unfortunately this does not explain why other trials of /ɛ/ do not benefit in a similar way;
for example, the F1 Trial 4 of /ɛ/ is only slightly elevated compared to Trial 2 (603 Hz
and 598 Hz, respectively). Though the cochlea is tonotopically organized, if the onset of
/hVd/ was productively stimulating the same region as Trial 2’s F1 enough to boost the
EFR, a similar effect should be observed for Trial 4, as there is only a 5 Hz difference in
their first formants. Furthermore, it also does not explain why a similar observation isn’t
seen for any trials of /ɔ/, which have comparable F1 frequencies to /ɛ/ trials. Differences
in relative intensity between stimuli files could account for this, since the intensity of
each vowel token was adjusted to its category group mean, but the differences are
relatively minor between categories (see Table 7) so this is unlikely to have a major
effect.
The results from this experiment suggest that there is a more complex relationship
between envelope following response amplitude and stimulus context than previously
thought. The EFR has also been shown to be considerably more sensitive to subtle
acoustic aspects of the stimulus, such that different vowel tokens, produced by the same
speaker, can elicit responses of significantly different amplitudes in the same listener.
Going forward, it is important to ascertain what aspects of the stimulus context are
driving these differences, in order to develop maximally effective stimuli for research and
clinical purposes.
68
Chapter 6
6 Conclusions and Future Directions
6.1 Summary
The overall purpose of this thesis was to investigate whether EFR amplitude variation
could be attributed to features of the stimulus’ consonant environment, its vowel context,
or an interaction of the two.
Using seven different English vowels embedded in four different CVC consonant
environments, Experiment 1 took a broad approach to answering what aspects of the
stimulus might contribute to EFR amplitude changes. Results indicated a strong effect of
vowel identity, primarily driven by high amplitudes elicited by /æ/ and low amplitudes to
/ej/, and a minor effect of consonant environment. Cochlear stimulus delays between
voice harmonics in the F1 and F2 bands were explored as a potential explanation for the
observed differences; the modeled impact of calculated relative delays corresponded well
to observations in the data. This simple model suffered from several limitations, however;
particularly its assumption about equal F1 and F2 response contributions. Additionally,
Experiment 1 measured EFRs in response to only a limited pool of stimuli; each
participant was exposed to a single token for each of the seven vowels.
Experiment 2 aimed to address this limitation by presenting participants with four tokens
of a given vowel, each embedded in the same four CVC contexts seen in Experiment 1.
Due to the volume of data collection required, only four of the vowels used in
Experiment 1 were presented in Experiment 2. Results from this second study provided a
more nuanced view of the sensitivity of the EFR to stimulus context. A significant three-
way interaction between vowel category, vowel trial, and consonant environment
emerged. That broad differences were again found across vowel category was not
surprising, given the results of Experiment 1 and previous work with the EFR (Choi et
al., 2013). More interesting, however, was the finding that in addition to the overall
vowel category, EFR amplitudes were influenced by not only a given token of the same
vowel, but by the consonant environment that token was presented in.

69
6.2 General Conclusions
The exact mechanism driving this level of sensitivity in the envelope following response
is not presently clear. This thesis explored several possible contributors, including
relative stimulation delays in vowel F1 and F2 bands and possible interactions between
the acoustics of vowels and the pseudo-vowel acoustic qualities of the /h/ onset in the
/hVd/ context. Ultimately, the results of Experiment 1 and Experiment 2 demonstrate that
the EFR response is much more sensitive to stimulus context than previously thought, as
even minor differences occurring across different vowel tokens produced by the same
speaker in the same context can elicit a significantly different response amplitude. It is
difficult to conclusively say, however, based on the stimuli used in this thesis, precisely
what aspects of the consonant environment, vowel category, and vowel trial are
contributing to this variability.
It is important to use representative stimuli in order to study speech processing in
humans, and to generalize those findings from the controlled laboratory environment to
the real world (Gailbraith et al., 2004; Choi et al., 2013; Rance, 2008). It is also
important, however, to have a stimulus that is capable of reliably eliciting responses
significantly different from background noise in a wide population. Based on the results
of these experiments, it is clear that in order to effectively implement the EFR as a tool
for studying neural speech processing, any proposed stimuli must be carefully
constructed and tested in a group of individuals without hearing or neurological problems
in order to account for interactions across consonant, vowel, and token in order to
maximize responses.
It may even be the case that true natural speech is not the optimal EFR stimulus. Stimuli
that closely approximate natural speech while still allowing precise control (for example,
the concatenated stimuli in these experiments, which lack natural coarticulation cues; the
pseudo-natural words used in Easwar et al., 2015, etc.) may be sufficient. Such artificial
stimuli may also have the benefit of somewhat mitigating the myriad of potentially
unpredictable stimulus context effects.

70
6.3 Future Directions
Though the experiments in this paper, when combined, represent one of the largest
collections of speech-evoked EFR data to date, they do have several limitations. In
particular, due to time constraints inherent in a Master’s thesis, the four vowel categories
chosen for Experiment 2 were selected prior to the completion of data collection for
Experiment 1. While they were chosen to ensure broad representation of the Canadian
English vowel space, interesting contrasts emerged during Experiment 1 analysis that
could not be further investigated, such as the high amplitude EFRs evoked to /æ/. It was
interesting to see the unusually prominent EFRs elicited by vowel /ɛ/ replicate across
experiments and talkers, in contrast with previous work (Choi et al. 2013). It is difficult
to fully discuss the low amplitudes elicited by the long vowel /ej/ from Experiment 1
without replication.
The next step for this project will be to collect data from multiple tokens of the remaining
three vowels tested in Experiment 1 to see whether or not the significant differences that
emerged are replicable. Additionally, it would be ideal to increase the sample size of
Experiment 2 across all conditions, as with only 16 subjects per vowel category, low
power may be obscuring other interesting contrasts.
6.3.1 Source Localization
During the prior discussion of the neuronal populations responsible for generating the
EFR (see Section 1.2.3), one of the major themes was the reliance on animal studies for
informing our knowledge of its generator sites. This is largely due to the dangerous and
invasive nature of performing deep electrode recordings or selective neuronal cooling in
humans, particularly in the sensitive brainstem. Transcranial magnetic stimulation
(TMS), a technique in neuroscience that makes use of targeted magnetic fields to cause a
temporary disruption in normal brain activity (Walsh & Cowey, 2000), is the closest
analogue to neuronal cooling that is safe to use in humans. Unfortunately, TMS is most
effective for disruption of superficial cortical regions, and cannot be used for
investigation of subcortical or brainstem structures (Walsh & Cowey, 2000).

71
Auditory evoked potential recordings at the scalp are also capable of providing a rough
indication of where a signal might be coming from, but such measurements are inaccurate
due to the inverse problem (Luck, 2005). Essentially scalp potentials are only indirect
measures of brain activity; this signal must pass through the highly non-conductive skull,
and several layers of the dermis, resulting in significant interference (Pascual-Marqui,
1999). As a result, it is impossible to calculate a unique intracranial source from an AEP
recording; mathematically speaking, there are infinite possible solutions, or combination
of sources, for any given recording (Pascual-Marqui, 1999; Schomer & Da Silva, 2012).
Going forward, it is important to increase EFR source localization research in human
subjects, despite these potential issues. Higher density, 128+ electrode setups are capable
of providing sufficient spatial and temporal information for localization (Ryynanen,
Hyttinen, Laarne & Malmivuo, 2004). Additionally, recent research with AEPs using
magnetoencephalography has proved promising for localization (Coffey et al., 2016), and
MEG is not limited by interference in the same way that EEG measurements are. Despite
this, MEG protocols suffer from challenges related to detecting deep sources, which play
a role in EFR generation; a combination of EEG and MEG approaches, therefore, may
provide the most parsimonious picture of EFR sources. Ultimately, to maximize the
utility of the EFR both as a tool for studying human speech processing and as a clinical
outcome measure, it is important to understand not only how the signal behaves, but also
where the signal is produced.

72
References Aiken, S. J., & Picton, T. W. (2006). Envelope following responses to natural vowels.
Audiology and Neurotology, 11(4), 213–232.
Aiken, S. J., & Picton, T. W. (2008). Envelope and spectral frequency-following responses to vowel sounds. Hearing Research, 245(1-2), 35–47.
Aiken, S., & Purcell, D.W. (2013). Sensitivity to polarity in speech-evoked frequency-
following responses. 21st International Congress on Acoustics (ICA), Montréal, 5 pages in electronic proceedings.
Aiken, S. J. (2008). Human brain responses to speech sounds (Doctoral dissertation)
University of Toronto. Toronto, ON. Aravamudhan, R., Carbonell, K. M., & Lotto, A. J. (2010). Presence of preceding sound
affects the neural representation of speech sounds: Frequency following response data. The Journal of the Acoustical Society of America, 128(4), 2322-2322.
Bagatto, M., Scollie, S. D., Hyde, M., & Seewald, R. (2010). Protocol for the provision of
amplification within the Ontario Infant Hearing Program. International Journal of Audiology, 49(sup1), S70-S79.
Banai, K., Abrams, D., & Kraus, N. (2007). Sensory-based learning disability: Insights
from brainstem processing of speech sounds. International Journal of Audiology, 46(9), 524-532.
Benjamini, Y., & Hochberg, Y. (1995). Controlling the false discovery rate: a practical
and powerful approach to multiple testing. Journal of the Royal Statistical Society. Series B (Methodological), 57(1), 289-300.
Boberg, C. (2000). Geolinguistic diffusion and the US-Canada border. Language
Variation and Change, 12(1), 1–24. Boersma, P. (2001). Praat, a system for doing phonetics by computer. Glot International,
5(9), 341-345. Borden, G., & Harris, K. (1980). Speech science primer: Physiology, acoustics, and
perception of speech (2nd ed.). Baltimore, Maryland: Williams & Wilkins. Fox, J., & Weisberg, S. (2011). An {R} Companion to Applied Regression, Second
Edition. Thousand Oaks CA: Sage. URL: http://socserv.socsci.mcmaster.ca/jfox/Books/Companion
Cariani, P. A., & Delgutte, B. (1996). Neural correlates of the pitch of complex tones. I.
Pitch and pitch salience. Journal of Neurophysiology, 76(3), 1698–1716.

73
Choi, J. M., Purcell, D. W., Coyne, J.-A. M., & Aiken, S. J. (2013). Envelope following
responses elicited by English sentences. Ear and Hearing, 34(5), 637–50. Ciocca, V., & Whitehill, T. (2012). The acoustic measurement of vowels. In Handbook of
Vowels and Vowel Disorders (pp. 113-137). New York, NY: Taylor & Francis. Clarke, S., Elms, F., & Youssef, A. (1995). The third dialect of English: Some Canadian
evidence. Language Variation and Change, 7(02), 209-228. Coffey, E. B., Herholz, S. C., Chepesiuk, A. M., Baillet, S., & Zatorre, R. J. (2016).
Cortical contributions to the auditory frequency-following response revealed by MEG. Nature Communications, 7.
Delattre, P., Liberman, A. M., Cooper, F. S., & Gerstman, L. J. (1952). An experimental
study of the acoustic determinants of vowel color; observations on one-and two-formant vowels synthesized from spectrographic patterns. Word, Vol. 8, 195-210.
Easwar, V. (2014). Evaluation of Auditory Evoked Potentials as a Hearing aid Outcome
Measure (Doctoral dissertation). Western University. London, ON. Easwar, V., Purcell, D. W., Aiken, S. J., Parsa, V., & Scollie, S. D. (2015). Effect of
stimulus level and bandwidth on speech-evoked envelope following responses in adults with normal Hearing. Ear and Hearing, 36(6), 619-634.
Eggermont, J. J. (1979). Narrowband AP latencies in normal and recruiting human ears.
The Journal of the Acoustical Society of America, 65(2), 463-470. Fant, G. (1980). The relations between area functions and the acoustic signal.
Phonetica, 37(1-2), 55-86. Frisina, R. D., Smith, R. L., & Chamberlain, S. C. (1990). Encoding of amplitude
modulation in the gerbil cochlear nucleus: I. A hierarchy of enhancement. Hearing Research, 44(2), 99-122.
Galbraith, G. C., Amaya, E. M., de Rivera, J. M. D., Donan, N. M., Duong, M. T., Hsu, J.
N., Tran, K., & Tsang, L. P. (2004). Brain stem evoked response to forward and reversed speech in humans. Neuroreport, 15(13), 2057–2060.
Gueorguieva, R., & Krystal, J. H. (2004). Move over ANOVA: Progress in analyzing
repeated-measures data and its reflection in papers published in the archives of general psychiatry. Archives of General Psychiatry, 61(3), 310-317.
Hagiwara, R. E. (2006). Vowel Production in Winnipeg. The Canadian Journal of
Linguistics / La Revue Canadienne de Linguistique, 51(2), 127–141.

74
Herdman, A. T., Lins, O., Van Roon, P., Stapells, D. R., Scherg, M., & Picton, T. W. (2002). Intracerebral sources of human auditory steady-state responses. Brain Topography, 15(2), 69-86.
Hillenbrand, J. M., Clark, M. J., & Nearey, T. M. (2001). Effects of consonant
environment on vowel formant patterns. The Journal of the Acoustical Society of America, 109(2), 748–763.
Hillenbrand, J., Getty, L. A., Clark, M. J., & Wheeler, K. (1995). Acoustic characteristics
of American English vowels. The Journal of the Acoustical Society of America, 97(5), 3099-3111.
Joint Committee on Infant Hearing. (2007). Year 2007 position statement: principles and
guidelines for early hearing detection and intervention programs. Pediatrics, 120(4), 898-921.
Kim, D. O., Sirianni, J. G., & Chang, S. O. (1990). Responses of DCN-PVCN neurons
and auditory nerve fibers in unanesthetized decerebrate cats to AM and pure tones: analysis with autocorrelation/power-spectrum. Hearing Research, 45, 95–113.
Kraus, N., & Nicol, T. (2005). Brainstem origins for cortical ‘what’ and ‘where’
pathways in the auditory system. Trends in Neurosciences, 28(4), 176-181. Krishnan, A. (2002). Human frequency-following responses: representation of steady-
state synthetic vowels. Hearing Research, 166(1), 192-201. Kuwada, S., Anderson, J. S., Batra, R., Fitzpatrick, D. C., Teissier, N., & D'Angelo, W.
R. (2002). Sources of the scalp-recorded amplitude-modulation following response. Journal of the American Academy of Audiology, 13(4), 188-204.
Ladefoged, P., & Johnson, K. (2011). A course in phonetics (6th ed.). Boston, MA:
Wadsforth Publishing. Laroche, M., Dajani, H. R., Prévost, F., & Marcoux, A. M. (2013). Brainstem auditory
responses to resolved and unresolved harmonics of a synthetic vowel in quiet and noise. Ear and Hearing, 34(1), 63–74.
Löfqvist, A., Baer, T., McGarr, N. S., & Story, R. S. (1989). The cricothyroid muscle in
voicing control. The Journal of the Acoustical Society of America, 85(3), 1314-1321.
Luck S, J. (2005) An introduction to the event-related potential technique. Cambridge,
MA: MIT Press.

75
Mendoz-Denton, N., Hendricks, S., & Kennedy, R. (2001). Language Samples Project: Canadian English. Retrieved from http://www.ic.arizona.edu/~lsp/Canadian/ canphon2.html.
Møller, A. R., Jannetta, P. J., & Sekhar, L. N. (1988). Contributions from the auditory
nerve to the brainstem auditory evoked potentials (BAEPs): Results of intracranial recording in man. Electroencephalography and Clinical Neurophysiology/ Evoked Potentials Section, 71(3), 198-211.
Møller, A. (2006). Hearing anatomy, physiology, and disorders of the auditory
system (2nd ed.). San Diego, CA: Academic Press. Malayeri, S., Lotfi, Y., Moossavi, S. A., Rostami, R., & Faghihzadeh, S. (2014).
Brainstem response to speech and non-speech stimuli in children with learning problems. Hearing Research, 313, 75-82.
Mitsuya, T., MacDonald, E. N., Munhall, K. G., & Purcell, D. W. (2015). Formant
compensation for auditory feedback with English vowels. The Journal of the Acoustical Society of America, 138(1), 413–424.
O'Grady, W., & Archibald, J. (2011). Contemporary linguistic analysis: an
introduction (7th ed.). Toronto: Pearson Canada. Ott, C. G. M., Langer, N., Oechslin, M. S., Meyer, M., & Jäncke, L. (2011). Processing
of voiced and unvoiced acoustic stimuli in musicians. Frontiers in Psychology, 2, 195.
Pascual-Marqui, R. D. (1999). Review of methods for solving the EEG inverse
problem. International Journal of Bioelectromagnetism, 1(1), 75-86. Peterson, G. E., & Barney, H. L. (1952). Control methods used in a study of the vowels.
The Journal of the Acoustical Society of America of the Acoustical Society of America, 24(2), 175 – 184.
Picton, T. (2011). Human auditory evoked potentials. San Diego, California: Plural
Publishing. Picton, T. (2013). Hearing in time: evoked potential studies of temporal processing. Ear
Hear, 34(4), 385–401. Picton, T. W., Hillyard, S. a., Krausz, H. I., & Galambos, R. (1974). Human auditory
evoked potentials. I: Evaluation of components. Electroencephalography and Clinical Neurophysiology, 36, 179–190.

76
Picton, T. W., John, M. S., Dimitrijevic, A., & Purcell, D. (2003). Human auditory steady-state responses: Respuestas auditivas de estado estable en humanos. International Journal of Audiology, 42(4), 177-219.
Plack, C. J. (2013). The Sense of Hearing. New York, NY: Psychology Press. Purcell, D. W., John, S. M., Schneider, B. A., & Picton, T. W. (2004). Human temporal
auditory acuity as assessed by envelope following responses. Journal of the Acoustical Society of America, 116(6), 3581–3593.
R Core Team (2016). R: A language and environment for statistical computing. R
Foundation for Statistical Computing, Vienna, Austria. URL http://www.R-project.org/.
Rance, G. (2008). Auditory Steady-State Response. San Diego: Plural Publishing. RStudio Team (2016). RStudio: Integrated Development for R. RStudio, Inc., Boston,
MA. URL http://www.rstudio.com/. Ryynanen, O. R. M., Hyttinen, J. A., Laarne, P. H., & Malmivuo, J. A. (2004). Effect of
electrode density and measurement noise on the spatial resolution of cortical potential distribution. IEEE Transactions on Biomedical Engineering, 51(9), 1547-1554.
Schomer, D. L., & Da Silva, F. L. (2012). Niedermeyer's electroencephalography: basic
principles, clinical applications, and related fields. Philadelphia: Lippincott Williams & Wilkins.
Skoe, E., & Kraus, N. (2010). Auditory brainstem response to complex sounds: a
tutorial. Ear and Hearing, 31(3), 302-324. Smith, J. C., Marsh, J. T., & Brown, W. S. (1975). Far field recorded frequency following
responses: evidence for the locus of brainstem sources. Electroencephalography and Clinical Neurophysiology, 39(5), 465–472.
Stevens, K. N., & House, A. S. (1963). Perturbation of vowel articulations by
consonantal context: an acoustical study. Journal of Speech and Hearing Research, 6(2), 111–28.
Strevens, P. (1960). Spectra of fricative noise in human speech. Language and
Speech, 3(1), 32-49. Titze, I. R. (1989). On the relation between subglottal pressure and fundamental
frequency in phonation. The Journal of the Acoustical Society of America, 85(2), 901-906.

77
Walsh, V., & Cowey, A. (2000). Transcranial magnetic stimulation and cognitive neuroscience. Nature Reviews Neuroscience, 1(1), 73-80.
Zaehle, T., Jancke, L., & Meyer, M. (2007). Electrical brain imaging evidences left
auditory cortex involvement in speech and non-speech discrimination based on temporal features. Behavioral and Brain Functions, 3(1), 63.

78
Appendices Appendix A: Ethics Approval Notice

79

80
Appendix B: Sample Letter of Information and Consent
It’s all about context: Investigating the effects of consonant environment on the envelope following response
LETTER OF INFORMATION
Study Background You are invited to participate in a study investigating how English vowels are processed in the brain, and the influences that surrounding consonant context have on brain activity in response to vowels. You are being recruited for this study because you have normal hearing and our measurements will help us understand sound processing in the normal hearing brain. All measurements will take place in the Electrophysiology Laboratory of the National Centre for Audiology in Elborn College at the University of Western Ontario. Speech is a fundamental aspect of the human experience, but in spite of this, our understanding of how the auditory system processes and encodes it is lacking. Auditory evoked potentials (AEPs), which measure brain activity in response to sound, have proven to be an effective, non-invasive tool for studying responses to auditory stimuli. The envelope following response (EFR) is a particular AEP evoked in response to speech stimuli. It has proven to be highly variable, however, with the same vowel eliciting different EFRs in the same listener. This study will investigate the source of this variation and characterize it, which will contribute to our understanding of how speech is processed in the brain. The total time required for the study is approximately 120 minutes.
Questionnaire and Hearing Assessment This study will include a total of 50 individuals. If you agree to participate in the study, you will take part in a brief questionnaire and a brief assessment of your hearing. This will be followed by the main experiment, which will be conducted over one testing session. The questionnaire will ask you to report your age, handedness, language experience and any known neurological, speech and language, vision and hearing problems. You may choose to omit a response to a specific question on the questionnaire without any penalty. The hearing assessment will be a visual examination of your ear canals and a measurement called a pure-tone audiogram which takes about 12 minutes to complete. You will hear tones one at a time through headphones, and you will signal when you detect each tone. The tones will progressively become quieter until you are no longer able to hear them. This procedure is repeated for several different pitches and for each ear. Envelope Following Response (EFR)
81
In the testing session, an electrical measurement of your brain’s response to sound will be taken. This requires the placement of earphone inserts into the ear canal, and the placement of either an electrode net onto your scalp, or surface electrodes onto the skull and collarbone. For application of the cap, it will be soaked in a saline solution to increase conductivity prior to application. This solution is harmless and will not damage your skin or hair. A towel will be placed around your shoulders throughout the experiment to prevent any liquid dripping on your clothing. After the experiment is concluded, the cap will be removed and you will be able to wash your hair. For the surface electrode placement, the sites for three electrodes will be cleaned with an alcohol pad and a gentle scrub pad to improve electrical contact. One electrode will be placed on your collarbone and the other two will be placed on your head. A conductive gel and light adhesive will hold them in place. After the experiment, the electrodes will be gently removed and the gel cleaned away with a damp cloth. During the measurement, you will lie comfortably in a reclined easy chair and are encouraged to sleep. English vowels, words, and pseudo-words will be presented at a comfortable loudness and measurement time will be approximately 120 minutes. At either the beginning or end of the experiment, you may also be asked to listen to English words and pseudo-words and write down what you heard as accurately as possible. Risks These methods are widely used in laboratories studying hearing. There are no known risks associated with this technology. Sometimes people may temporarily experience redness where the surface electrodes were placed during the skin cleaning procedure. Benefits to Study Participation Participation in the study is voluntary. You may refuse to participate, or withdraw from the study at any time, without loss of compensation. Your data would also be withdrawn. If you are a student, neither participation in the study or a decision to withdraw will affect your academic status. The procedures to be used in this study are designed for research purposes and are not intended to provide you with any direct benefit. It may contribute to our understanding of how vowels are processed in the brain, which is of benefit to society in the long term. There may be the possibility that the brief hearing assessment could identify a previously unknown hearing impairment. If this were to occur, we will encourage you to seek professional assessment from your family practitioner or audiologist. We may also provide information about obtaining an assessment at the Western audiology clinic in Elborn College. All information obtained in this study will be held in strict confidence and participant anonymity will be maintained. Data is retained indefinitely. Your name will not appear

82
in any publications or presentations of the findings of this study. Your personal and background information will be kept separately from all data. In addition, the data obtained in this study will only be connected via a master list and the Unique ID of each participant. You will receive written feedback about the specific aims of the study at the end of the experiment. If you would like to receive copies of these publications, please contact Dr. Purcell at the telephone number below. If you have any questions or would like additional information about this study, please contact Dr. David Purcell, National Centre for Audiology, School of Communication Sciences and Disorders, University of Western Ontario, London, Ontario, N6G 1H1 (telephone: 519-661-2111 ext. 80435). If you have questions regarding the conduct of this study or your rights as a research participant, you may contact the Office of Research Ethics at (519) 661-3036, or via electronic mail at [email protected]. Compensation Participants in this study are reimbursed for the time committed to the study and the inconveniences associated with participation in the study at the rate of $5/half-hour or part-thereof. Signing of Consent Form If you agree to participate in this study, please sign the consent form. You do not waive any legal rights by signing the consent form. You will be given a copy of this Letter of Information for your records. Representatives of Western University’s Health Sciences Research Ethics Board may contact you or require access to your study-related records to monitor the conduct of the research.

83
It’s all about context: Investigating the effects of consonant environment on the envelope following response
CONSENT FORM
I have read the Letter of Information, have had the nature of the study explained to me, and I agree to participate. All questions have been answered to my satisfaction. Research Participant (please print):__________________________________________ Signature: _______________________ Date: ______________________________ Signature of Person Responsible for Obtaining Signed Consent Printed Name: _______________________ Signature: _______________________ Date: ______________________________

84
Curriculum Vitae
Name: Emma Bridgwater Post-secondary Western University Education and London, Ontario, Canada Degrees: 2015-2017 M.Sc.
McMaster University Hamilton, Ontario, Canada 2011-2015 Hons. B.A.
Honours and Western University Awards Alexander Graham Bell Doctoral Scholarship [Declined]
Natural Science and Engineering Research Council (NSERC) 2017
Ontario Graduate Scholarship [Declined] 2017
Canada Graduate Scholarship – Master’s Natural Science and Engineering Research Council (NSERC) 2016
Ontario Graduate Scholarship [Declined] 2016
McMaster University
Canada Graduate Scholarship – Master’s [Declined] Social Science and Humanities Research Council (SSHRC) 2015 Ontario Graduate Scholarship [Declined] 2015 Undergraduate Student Research Award, Natural Science and Engineering Research Council (NSERC) 2014
Related Work Graduate Teaching Assistant Experience Western University
2015 Conference Posters [1] Bridgwater, E.*, & Purcell, D. (2017, May). It’s all about context: Investigating the
effects of consonant and vowel environment on vowel-evoked envelope following

85
responses. XXV International Evoked Response Audiometry Study Group Biennial Symposium (IERASG), Warsaw, Poland.
[2] Bridgwater, E.*, & Kuperman, V. (2015, March). You speak for yourself, but listen
to others. 28th Annual CUNY Conference on Human Sentence Processing, Los Angeles, CA.
Conference Talks [1] Bridgwater, E.*, & Kuperman, V. (2015, March). You speak for yourself, but listen
to others. 8th Annual Toronto Undergraduate Linguistics Conference (TULCON), Toronto, ON.