Embed Size (px)
Citation preview

Gray Iron
Aluminum
Copper
Ductile Iron
Steel
Zinc
Other
Municipal Castings
Farm Equipment
Construction, Mining &
Oil Field Machinery
Pipe & Fittings
Railroad
Automotive & Light Truck
Internal Combustion Engines
Valves
Other
Robert E. Eppich Eppich Technologies May 2004
Industrial Technologies Program Boosting the productivity and competitiveness of U.S. industry through improvements in energy and environmental performance
Executive Summary
The United States metalcasting industry is an energy intensive industry that is dominated by small businesses. It is critical to the U.S. economy, as 90% of all manufactured goods contain one or more cast metal components. Metalcastings are integral in U.S. sectors such as the transportation, energy, aerospace, manufacturing, and national security. Metalcasting enables the production of both simple and complex parts that meet wide-ranging needs. The process consists of introducing molten metal into a mold containing a cavity of the desired shape.
This report represents an energy benchmark for various metalcasting processes. It describes process flows and energy use by fuel type and processes for selected casting operations. It also provides recommendations for improving energy efficiency in casting. There are many processes used to cast metal, including: green sand, lost foam, die casting, squeeze casting, investment casting, chemically-bonded sand, and centrifugal casting. There are also wide ranges of metals that can be cast. These metals are either ferrous or non-ferrous. Examples of some of the ferrous alloys cast include: ductile iron, gray iron, malleable iron, steel, and stainless steel. Examples of nonferrous metals that can be cast include: aluminum, magnesium, copper, zinc, titanium, and many more.
Due to the diverse nature of the metalcasting industry, there is no single benchmark that can be used to describe the entire energy use throughout the industry. To establish an energy consumption benchmark for the U.S. metalcasting industry, fifteen metalcasters, which represent different processes and different metals, that are considered typical for the industry, underwent an energy assessment. These assessments evaluated the energy associated with these facilities’ operations, including: heating, ventilation, melting, emission control equipment, and the associated manufacturing and support equipment. In evaluating the energy associated with these processes and profiling each facility, data was collected in the following areas:
• Casting yield, as measured by dividing the average casting weight per mold by average metal poured per mold.
• Average weight of casting. • Plant-wide scrap rate, including customer returns. • Melt and dross losses. • Annual tons of waste removed from the facility. • Type of gating system and use of computerized approach to gating. • Use of solidification modeling. • Typical charge materials.
Approximately two years of data was obtained from each metalcasting facility evaluated. In some cases up to four years of data was obtained. When possible, energy data loggers were attached to pieces of machinery to develop accurate energy information for a given process. Exhibit i and Exhibit ii summarizes the data collected.
Though the primary purpose of the project was the generation of the metalcasting energy profile through the assessment of 15 typical metalcasting facilities, a number of observations are relevant:
i

• In all metalcasting facilities there were opportunities for improvement in the areas of energy, productivity, and waste. These opportunities ranged from modest to very substantial, and in view of the reported metalcasting pretax profitability of 1.8 percent of sales revenue, these improvements, if implemented and sustained, would result in substantial improvement in profitability.
• Scrap rates (defective castings) ranged between 0.5 percent and 25 percent, including all defective castings returned from the customer. Interestingly, the metalcasters at 0.5 percent scrap rate were not satisfied, whereas the 25 percent scrap rate metalcasters were complacent. Reduction in scrap rates, especially those resulting from casting defects being exposed during machining at the customer’s facility, often represent the easiest path to increased profitability.
• All the metalcasters experienced wide swings in scrap rate due to as-yet unidentified variables.
• Careful attention to process control procedures, such as temperature of molten metal while pouring the molds, showed that scrap reductions could be achieved without capital investment.
• In general, the cleaner the facility, the lower the scrap rate and the higher the casting quality.
• Natural gas savings opportunities were available at a number of non-ferrous facilities, if conversions were made from very old gas-fired crucible and reverberatory furnaces to updated crucible furnaces and stack melters. However, one facility that was using a stack melter had exiting exhaust temperatures over 1,400º F due to a “loose” charge. Thus a stack melter by itself doesn’t guarantee energy savings.
• In general, energy savings were available in all metalcasting facilities through the rigorous use of ladle, trough, and furnace covers.
• Energy savings were also available through the use of engineered ladle preheating systems, rather than torches in the top of ladles.
• One facility exhibited a major opportunity for yield improvement, based on a re-engineering of the manual pouring system.
• Compressed air, in total, offers many opportunities for energy savings, productivity improvements, and improved casting quality. Most compressed air systems were the result of progressive growth in the need for compressed air. Thus the systems were often misengineered, saturated with water, they exhibited numerous leaks, and they misapplied air for various situations. Air driers were selected based on low capital cost, not operating efficiency.
• Most metalcasters, including the smaller facilities, were using computerized solidification modeling and gating software.
ii

• Brief studies of equipment during operation showed that there was opportunity for increased productivity without “speeding” up ram speeds and hydraulics; seconds were being wasted “waiting” for things to happen.
• Man-hours/ton of castings sold ranged from 3-200. Obviously the facility at a three man-hours/ton was a very focused high-production facility. The facility at 200 man-hours/ton was producing a large variety of one to four castings/order in high alloy metals.
iii

Exhibit i Summary of Data From Ferrous Facilities Visited
Facilit y Type
Molding Process
Annual Production
in Tons
Total Compressed
Air (hp)
Electric Btu per
ton (x 106)
Natural Gas Btu per ton (x 106)
Btu per ton
Coke (x 106)
Other Btu
Compressed Air hp/ton
Total Energy Btu per
ton (x 106)
Total Tacit Energy Btu
(x 106)
Gray Iron-Cupola
Green Sand 87,500 3,150 2.07 2.37 5.100 0.04 0.036 9.59 13.44
Gray Iron-Induction Green Sand 13,250 1,300 11.8 6.59 N/A N/A 0.098 18.39 40.34
Ductile Iron-Cupola
Green Sand 103,000 2,750 2.23 1.97 5.97 0.04 0.027 10.51 14.66
Ductile Iron-Induction
Green Sand 5,500 250 8.54 6.12 N/A N/A 0.045 14.66 30.54
Ductile Iron (Pipe)-Cupola
Centrifugal 206,000 1,050 0.46 2.65 2.79 0.08 0.005 5.98 6.84
Steel-Induction (Primarily Stainless)
Airset 900 450 22.4 32.91 N/A N/A 0.500 55.31 96.97
Steel- Arc 70% Green Sand, 30%
Airset 3,230 650 9.22 11.48 N/A N/A 0.201 20.7 37.8
Steel-Induction
Airset 2,700 225 6.89 10.36 N/A N/A 0.083 17.3 30.1
Note: Tacit energy is a term used to describe an energy value that equals the combination of onsite energy consumption, the process energy required to produce and transmit/transport the energy source, and feedstock energy. Tacit energy for electrical generation is 2.86 times the measured usage. It’s been assumed that the tacit energy for coke and natural gas is “1” or unity because a marginal amount is lost in the transportation and transmission of these fuels. This report does not include the energy used to make equipment or buildings that house the process steps.
iv

Exhibit ii Summary of Data From Non-Ferrous Facilities Visited
Facility Type Molding Process
Annual Production
in lbs.
Total Compressed
Air (hp)
Electric Btu per
lb.
Natural Gas Btu per lb.
Btu per lbs.
Coke
Compressed Air hp/lb.
Total Energy Btu per
lb.
Total Tacit Energy Btu
per lb.
Die Casting Aluminum – 1
High – Pressure
3,424,000 175 6,121 16,801 N/A 0.00005 22,922 34,307
Die Casting Aluminum – 2
High – Pressure
2,203,130 100 3,301 12,640 N/A 0.00005 15,941 22,081
Permanent Mold/Sand Aluminum
Permanent Mold/ Green Sand
2,783,638 390 6,061 29,892 N/A 0.00014 35,953 47,226
Lost Foam-Aluminum Lost Foam 33,792,000 4,200 9,420 27,610 N/A 0.00012 37,030 54,551
Die Casting- Magnesium1
High – Pressure
4,122,088 300 9,815 3,015 N/A 0.00007 12,830 31,086
Copper-Base-Induction
Green Sand 4,322,840 100 4,113 1,227 N/A 0.00002 5,340 12,990
Copper-Base-Induction
Green Sand 3,268,944 250 6,434 2,894 N/A 0.00008 9,328 21,296
Die Casting- Zinc
Hot Chamber 13,869,000 250 2,102 4,954 N/A 0.00002 7,056 10,966
1 Data is a two-year average of the magnesium die casting facility.
v

Table of Contents
Executive Summary I
I. Introduction 1A. Investigative Methodology 1B. General Observations 2C. Organization of this Report 3
II. Industry Overview 5A. Industry Overview 5B. Metalcasting Production 6C. Energy Use 10
III. Ferrous Castings 12A. General Flow of Operations in a Ferrous Facility 12B. General Energy Use by Type 15C. Facility Profiles: Ferrous Castings 19D. Results and Observations: Ferrous 38
IV. Non-Ferrous Castings 43A. Types of Facilities Visited 43B. Nonferrous Facility Profiles 44C. Melt Loss-Dross 63D. Results and Observations: Non-Ferrous 64
Appendix A-1
vi

Errata Sheet
This is a listing of the corrections that were made since the original posting of the Energy Use in Selected Metalcasting Facilities – 2003 in March 2004.
Text Errors
• Page iv, Exhibit i: the Btu per ton of Coke for the Ductile Iron cupola facility was originally 5.87 was changed to 5.97.
• Page iv, Exhibit i: the Total Energy Btu per ton and Total Tacit energy Btu where recalculated to correct rounding errors.
• Page v, Exhibit ii: the Total Tacit Energy Btu per lb. for Die Casting Aluminum – 2 and Die Casting – Magnesium was corrected for rounding errors.
• Page 19, Exhibit 3.8: The total for Energy column was corrected for rounding errors. • Page 21, Exhibit 3.12: The total for Motor Power, Hours, and Energy columns were
corrected for rounding and addition errors. • Page 26, Exhibit 3.23: the hp/ft2 was changed from 0.027 to 0.0071. • Page 33, Exhibit 3.36: the % of this table was corrected for rounding errors and a
new row was inserted called maintenance. • Page 34, Exhibit 3.38: New exhibit inserted that illustrates the Natural Gas
Allocation for Stainless Steel Foundry. • Page 36, Exhibit 3.42: the % of Total column was corrected for rounding errors. • Page 38, Exhibit 3.49: The Natural Gas Btu/Ton; the Total Btu/Ton and Total Tacit
Btu/Ton column was re-calculated. • Page 39, Exhibit 3.50: The Total Btu/ton and Total Tacit Btu/Ton columns were
corrected for rounding errors. • Page 41, Exhibit 3.52: the Tonnage for the Induction – Ductile Iron facility was
changed from 5,500 to 5,100. Also the Btu/Ton for Induction – Stainless Steel facility was changed from 26.7 to 32.91.
• Page 48, Exhibit 4.8: the Average of kWh/gross lbs. was changed from 9.8 to 10.3. • Page 53 Exhibit 4.19: the percentages where revised due to rounding errors. • Page 55 Exhibit 4.26: the % of Electricity Use column was revised to account for
rounding errors. • Page 60, Exhibit 4.40: the hp/ft2 was changed from 0.031 to 0.0025. • Page A-2, Exhibit A.3: the Average of kWh/gross lbs. was changed from 9.8 to 10.3. • Page A-4, Exhibit A.5: the Total Distribution column was recalculated due to
rounding.
vii

I. Introduction
To establish an energy consumption benchmark for the U.S. metalcasting industry, the results of a study of fifteen metalcasters who represent different processes and facility sizes considered “typical” for the industry were assessed. This study reviews energy associated with the operation of the entire metalcasting facility, including: heating, ventilation, melting, emission control equipment, and the associated manufacturing and support equipment.
The U.S. metalcasting industry is an energy intensive industry dominated by small businesses, and is imperative to the nation’s economy. This industry manufactures components such as auto parts, mining equipment, and power generation equipment, utilizing a variety of casting processes, metals, and alloys.
Due to the diverse nature of the industry, there is no single benchmark that can be used to describe the entire industry. Thus, this report is really a series of benchmarks, each representing a segment of the industry.
A. Investigative Methodology
To perform the benchmark analysis, Eppich Technologies, in conjunction with the U.S. Department of Energy’s Industrial Assessment Centers, evaluated and profiled operation-wide energy use at fifteen metalcasting facilities. These Exhibit 1.1 facilities were selected by the three Types of Metalcasting Facilities major metalcasting societies – Selected American Foundry Society (AFS), North American Die Casting Association (NADCA) and Steel Founders’ Society of America (SFSA) – representing the diverse cross-section of processes used in the industry. The three societies also functioned as the Steering Committee for the project. The facilities were not specifically identified as best practice, even though some of them might represent best practice. Facility types chosen are shown in Exhibit 1.1.
In each case, one of the 26 U.S. Department of Energy (DOE), Industrial Technologies Program (ITP) sponsored Industrial Assessment Centers (IAC) from a nearby university performed an energy assessment, which included not onlyenergy, but also productivity and waste.2 The Project Manager, Robert Eppich,
Facility type Selector Gray Iron – Cupola AFS Gray Iron – Induction AFS Ductile Iron – Cupola AFS Ductile Iron – Induction AFS Ductile Iron (Pipe) – Cupola AFS Steel – Induction SFSA Steel – Arc SFSA Aluminum – Die Casting NADCA Aluminum – Die Casting NADCA Aluminum – Green Sand & Permanent Mold AFS
Aluminum – Lost Foam AFS Magnesium – Die Casting NADCA Copper-Base – Induction AFS Copper-Base – Induction AFS Zinc – Die Casting NADCA
2 The Industrial Assessment Centers (IACs) program enables eligible small- and medium-sized manufacturers to have comprehensive industrial assessments performed at no cost to the manufacturer. The
1

accompanied the IAC at each site visit. Each metalcaster received an IAC report for their internal use. Information on the IACs and the assessment database can be found at: http://www.oit.doe.gov/iac, and http://oipea-www.rutgers.edu.oipea_df.html. Even though the individual facilities’ confidentiality is protected, there is significant macro and micro information, including recommendations, available on the web.
In evaluating energy use and profiling each facility, data were collected in the following eight areas:
1. Casting yield, as measured by dividing the average casting weight per mold by average metal poured per mold.
2. Average weight of casting. 3. Plant-wide scrap rate, including customer returns. 4. Melt and dross losses. 5. Annual tons of waste removed from the facility. 6. Type of gating system and use of computerized approach to gating. 7. Use of solidification modeling. 8. Typical charge materials.
Approximately two years of data were obtained from each metalcaster. In some cases up to four years of data were obtained. Oxygen use was also solicited as part of the assessment. When possible, energy data loggers were attached to specific pieces of equipment to develop “micro” energy information. To further the analysis, energy data was also solicited from:
1. State metalcasting organizations, 2. Additional metalcasters that were not visited, and 3. The IAC database.
Additional information from non-visited metalcasters reflects the energy use for approximately 2.5 million tons of iron and 14,000 tons (28 million pounds) of aluminum.
B. General Observations:
In developing the metalcasting energy profile, a number of general observations were made:
• In all of the metalcasting facilities visited, there are opportunities for improvement in the areas of energy, productivity, and waste. These opportunities range from modest to very substantial, and in view of the reported metalcasting pretax profitability of 1.8 percent of sales revenue, these improvements, if implemented and sustained, can result in substantial improvement in profitability at a given facility.
• Energy savings can be achieved in all metalcasting facilities through the rigorous use of ladle, trough, and furnace covers.
(IACs) are located at 26 universities throughout the U.S. and are part of the DOE’s Office of Energy Efficiency and Renewable Energy (EERE), Industrial Technologies Program (ITP).
2

• Energy savings can be achieved through the use of engineered ladle preheating systems, rather than torches in the top of ladles.
• Careful attention to process control procedures, such as temperature of molten metal while pouring the molds, showed that scrap reductions can be achieved without capital investment.
• Opportunities for saving natural gas existed at a number of non-ferrous facilities. Significant energy savings could be realized if conversions were made from old gas-fired crucible and reverberatory furnaces to updated crucible furnaces and stack melters. However, one facility that was using a stack melter had exiting exhaust temperatures over 1,400ºF due to a “loose” charge. Thus, a stack melter by itself does not guarantee energy savings.
• Scrap rates (defective castings) ranged between 0.5 percent and 25 percent, including all defective castings returned from the customer. Interestingly, the metalcasters at 0.5 percent were not satisfied with their performance, whereas the 25 percent metalcasters considered that level of scrap to be acceptable. Reduction in scrap rates, especially those resulting from casting defects being exposed during machining at the customer, often represent the easiest path to increased profitability.
• In general, the cleaner the facility, the lower the scrap rate and the higher the casting quality.
• Several of the metalcasters experienced wide swings in scrap rates, due to unidentified variables.
• One facility exhibited a major opportunity for yield improvement, based on a re-engineering of the manual pouring system.
• Compressed air, in total, offers many opportunities for energy savings, productivity improvements, and improved casting quality. Most compressed air systems were the result of progressive growth needs for compressed air. Thus the systems were often misengineered, saturated with water, exhibited numerous leaks, and they misapplied air for various situations. Air driers were selected based on low capital cost and did not operating efficiently.
• Most metalcasters, even the smaller facilities, were using computerized solidification modeling and gating software.
• Brief studies of equipment during operation showed that there is opportunity for increased productivity without “speeding” up ram speeds and hydraulics; seconds were being wasted “waiting” for things to happen.
C. Organization of This Report
This report includes an overview of the metalcasting industry, followed by profiles of the facilities visited as part of the benchmarking study. The facility profile portion of the report is divided into two sections: (1) Ferrous Casting and (2) Non-ferrous Casting. The ferrous casting section includes all gray & ductile iron, steel, and high alloy casting
3

foundries. The non-ferrous casting section includes aluminum die castings, lost foam, sand/permanent mold casting processes, copper-base casting (primarily produced in sand), zinc die casting, and magnesium die casting.
Facility profiles include a general overview of each facility, a review of electrical energy and natural gas use, and a discussion on compressed air usage, where applicable.
4

II. Industry Background
A. Industry Overview
Metalcasting is critical to the U.S. economy, with 90 percent of all manufactured goods containing one or more cast metal components. Cast metal products are found in virtually every sector of our economy. The metalcasting industry has been integral to U.S. growth and has helped the U.S. become the world benchmark in fields such as manufacturing, science, medicine, and aerospace.
Gray and ductile irons continue to comprise the greatest weight of casting shipments, followed by aluminum, steel, copper, and zinc. New markets are opening for magnesium, titanium, and other non-ferrous alloys, as metalcasters increase their ability to successfully develop new markets. As illustrated in Exhibit 2.1, major end-use markets include transportation (autos, trucks, railroad, and engines), construction equipment, mining, pumps, valves, other oilfield and petrochemical equipment, agricultural equipment, military weapon systems, and myriad other smaller niche markets.
Exhibit 2.1 Casting Supply and End-Use Markets
Supply Markets End-Use Markets
Copper 2%
Ductile Iron 31%
Aluminum 10%
Steel 10%
Zinc 1.5%
Other 3.5%
Automotive & Light Truck 35%
Farm Equip. 3%
Construction, Mining & Oilfield Mach. 6%
Pipe & Fittings 15%
Railroad 5%
Valves 5%
Int. Comb. Engines 5%Other
23%
Municipal Castings 3%Gray Iron
42%
Source: U.S. Department of Commerce, Bureau of Census, Current Industrial Reports MA331E (00) and MA331A (00)-1
5
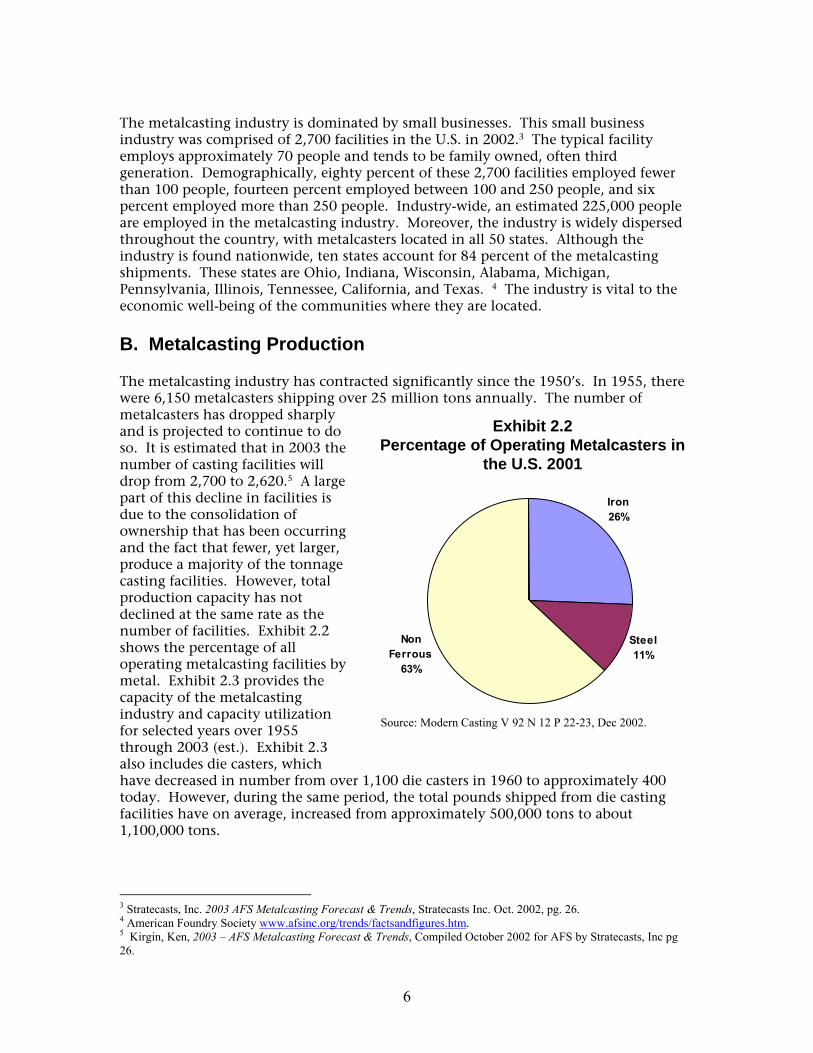
The metalcasting industry is dominated by small businesses. This small business industry was comprised of 2,700 facilities in the U.S. in 2002.3 The typical facility employs approximately 70 people and tends to be family owned, often third generation. Demographically, eighty percent of these 2,700 facilities employed fewer than 100 people, fourteen percent employed between 100 and 250 people, and six percent employed more than 250 people. Industry-wide, an estimated 225,000 people are employed in the metalcasting industry. Moreover, the industry is widely dispersed throughout the country, with metalcasters located in all 50 states. Although the industry is found nationwide, ten states account for 84 percent of the metalcasting shipments. These states are Ohio, Indiana, Wisconsin, Alabama, Michigan, Pennsylvania, Illinois, Tennessee, California, and Texas. 4 The industry is vital to the economic well-being of the communities where they are located.
B. Metalcasting Production
The metalcasting industry has contracted significantly since the 1950’s. In 1955, there were 6,150 metalcasters shipping over 25 million tons annually. The number of metalcasters has dropped sharply and is projected to continue to do Exhibit 2.2 so. It is estimated that in 2003 the Percentage of Operating Metalcasters in number of casting facilities will the U.S. 2001 drop from 2,700 to 2,620.5 A large part of this decline in facilities is due to the consolidation of ownership that has been occurring and the fact that fewer, yet larger, produce a majority of the tonnage casting facilities. However, total production capacity has not declined at the same rate as the number of facilities. Exhibit 2.2 Non shows the percentage of all Ferrous operating metalcasting facilities by 63% metal. Exhibit 2.3 provides the capacity of the metalcasting industry and capacity utilization for selected years over 1955
Source: Modern Casting V 92 N 12 P 22-23, Dec 2002.
through 2003 (est.). Exhibit 2.3 also includes die casters, which have decreased in number from over 1,100 die casters in 1960 to approximately 400 today. However, during the same period, the total pounds shipped from die casting facilities have on average, increased from approximately 500,000 tons to about 1,100,000 tons.
3 Stratecasts, Inc. 2003 AFS Metalcasting Forecast & Trends, Stratecasts Inc. Oct. 2002, pg. 26. 4 American Foundry Society www.afsinc.org/trends/factsandfigures.htm.
Kirgin, Ken, 2003 – AFS Metalcasting Forecast & Trends, Compiled October 2002 for AFS by Stratecasts, Inc pg 26.
Iron 26%
Steel 11%
6
5

Casting shipments are an estimated Exhibit 2.313,974,000 tons for 2003. Casting consumption in the United States is Estimated Number of U.S. Metalcasting
predicted to reach a peak of 16.4 Year Sites Capacity (tons) Capacity
Utilization % 1955 6,150 25,500,000 741982 4,100 22,607,000 551986 3,870 19,820,000 651990 3,300 18,000,000 761995 2,950 17,096,000 771996 2,910 17,682,000 79 1997 2,870 17,467,000 851998 2,850 17,748,000 82 1999 2,830 17,468,000 80 2000 2,800 17,854,000 77 2001 2,770 17,830,000 72 2002* 2,700 17,770,000 76 2003* 2,620 17,600,000 79
Sites, Industry Capacity, & Utilization million tons in 2008 and 2009, which is a level of 1 million tons above 1999 shipments. Sales, which dropped to a low of $27.7 billion in 2001, were forecasted to rise to $31.3 billion in 2003 and subsequently rise to $41.2 billion by 2007.6
1. Metalcasting Processes
There are several general types of metalcasting processes. The type of molding relating to the media into
*Estimated which the molten metal is poured is Source: Stratecasts, Inc AFS 2003 Metalcasting Forecast & Trends briefly summarized below. Additional details on these molding processes can be obtained from the American Foundry Society (AFS), North American Die Casting Association (NADCA), and the Steel Founders’ Society of America (SFSA).
• Green Sand Molding: This casting process utilizes either silica sand or lake sand bonded with clay, water, and several other minor additions such as sea coal, which is a high-volatile bituminous coal. Typical clay levels range from 6-10 wt percent of the sand system. This sand is compacted on the pattern either mechanically, as is the case for the typical high-production foundry, or in the case of some of the smaller metalcasters, it is manually compacted on the pattern. Green sand molding is used to produce products such as iron engine blocks, disk-brake rotors, valves, pump bodies and other construction/transportation-related castings. The green sand molding process is also used to produce aluminum and copper-base castings.
• Air-Set Molding: This casting process utilizes either silica sand or lake sand bonded with a “resin-type” binder. The 1-2 percent binder and sand is compacted against the pattern. This process is typically used in low production operations or to produce larger molds. It is used to produce both ferrous and non-ferrous castings.
• Cores and Core Processes: Cores are used to produce internal geometry in a casting. They typically consist of 1-2 percent binder and sand. They are “cured” with either heat or a catalytic gas before being removed from the corebox that creates their shape. A core, is only used once, as is the green-sand mold; i.e. one core assembly-mold per casting. The core-making processes are significant users of compressed air, which is used to blow the sand into the coreboxes. There are a number of choices of binder systems. Some of these are “heat-cured” (warm or hot
6 Kirgin, Ken, 2003 – AFS Metalcasting Forecast & Trends, Compiled October 2002 for AFS by Stratecasts, Inc, pg 4
7

box). Others utilize a gas to catalyze the process (coldbox) or simply allow an extended period of time to pass for curing of the chemical binder.
• Lost Foam Casting Process: The lost foam casting process is a relatively new process (invented in the late 1950s), whereby a pattern is created from expandable polystyrene (EPS) beads in a process similar to that used to make the well-known Styrofoam coffee cup, but with much higher technology. The pattern is coated with a very thin refractory and surrounded by unbonded sand or similar fine refractory-type material after the coating has dried. The molten metal liquefies/vaporizes the foam and fills the resultant cavity. This approach can be used to form internal passages that cannot be made with the conventional core/mold approach. This process is producing aluminum engine blocks and heads, along with air conditioning components and ferrous truck and electrical sector components.
• Permanent Mold Casting Process: The permanent mold process uses a metal mold, rather than a sand mold. The molten metal, typically an aluminum alloy, is poured into the open mold, usually at essentially atmospheric pressure. The mold is used thousands of times before it is worn out, typically by thermal fatigue of the mold. The process is often used to produce aluminum wheels for the transportation industry and other automotive structural components. The process is also used to produce copper-base castings, such as pump rotors and plumbing fixtures.
• High-Pressure Die Casting Process: The high-pressure die casting process injects molten metal into a metal mold at high velocity and pressure. The metal mold lasts for thousands of cycles. This process is used for producing castings made of aluminum, magnesium, zinc, and also copper-base alloys. This molding technique provides good dimensional control and enables thin-walls to be cast. This molding process is used to produce items ranging from zippers in zinc to transmission cases in aluminum or valve covers in magnesium.
• Centrifugal Casting Process: The centrifugal casting process is ideal for the production of iron pipe and other specialty alloy pipe configurations. A metal mold, the length of the desired pipe is rotated at fairly high speed and the molten metal is introduced. Centrifugal force keeps the molten metal against the surface of the mold until solidification occurs. The wall thickness is determined by the amount of metal that is introduced into the rotating mold.
• Investment Casting: Investment casting, or the lost-wax process as it is sometimes called, is a very specialized process for casting just about all alloys. The process is used to produce gas-turbine blades, aircraft components and commercial items such as golf clubs and pistols. Many statues and pieces of jewelry are also produced by the investment casting process. The total tonnage by this process is small and this process was not included in the project.
8

2. Cast Metals/Alloys
The types of castings being shipped by the industry are increasingly diverse and reflect the industry’s ability to cast new, in-demand, ferrous and non-ferrous alloys. Cast metals include:
• Gray and Ductile Iron: Approximately 50 percent of the ductile iron is cast into pressure pipe, which is heat treated to achieve the desired mechanical properties. Other than the ductile pressure pipe, which is centrifugally cast in steel molds, the balance of the ductile and gray iron is cast in sand – primarily “green sand” – with minor tonnage being cast in chemically bonded sand.7
• Malleable Iron: Malleable iron tonnage, which had been primarily used for connecting rods and pipe fittings, is falling rapidly, and today it is virtually insignificant. This tonnage is also cast in green sand.8
• Steel: Steel is cast by the green sand, chemically-bonded sand, and air-set molding process. Steel railroad wheels, which amount to 360,000 tons/year, are cast by a unique permanent mold process, which utilizes graphite molds.9
• Aluminum: Aluminum is cast by a variety of casting processes, including: green sand molding, permanent mold castings, high-pressure die casting, and lost foam.10
• Copper: The copper-based alloys are cast in both permanent molds and green sand. A very small percentage is die cast.11
• Zinc: The zinc-based alloys are virtually all die cast.12
• Magnesium: Magnesium alloys are primarily die cast or permanent mold cast. 13
7 Kirgin, Ken, 2003 – AFS Metalcasting Forecast & Trends, Compiled October 2002 for AFS by Stratecasts, Inc, pg 20. 8 Ibid. pg 12. 9 Private communication from Steel Founders Society of America. 10 Based on author’s (R. Eppich) knowledge of industry. 11 Ibid. 12 Ibid. 13 Ibid.
9

C. Energy Use
Metalcasting is an energy-intensive process; in fact it is one of the nine most energy-intensive industries in the U.S. In 1998, the industry (NAICS 3315) spent $1.2 billion purchasing an estimated 235 trillion Btu.14 If captive Exhibit 2.4 foundries are included, the Metalcasting Industry Energy estimated energy Consumption- 1998 consumption for metalcasting processes increases to 328 trillion Btu.15 As illustrated in Exhibit 2.4, about 58 percent of the industry’s energy consumption is supplied by natural gas, 27 percent from Natural Gas electricity, and 13 percent 58% from coke. The remainder includes other fuel.16 The coke is only used in the cupola melting process for the production of molten cast iron (gray or ductile). Exhibit 2.5
Process Energy As illustrated in Exhibit 2.5, (% of total costs) approximately 55 percent of energy costs are in melting, while moldmaking and coremaking account for about 20 percent combined. Heat treatment and post-cast operations, such as
Moldmaking machining, also use 12% significant amounts of energy.17 This breakdown of energy cost may be typical of a green sand iron facility, 8%
which is also using a significant number of cores. It is not, however representative of a die casting facility. Improvements that increase the efficiency of the melting or other processes in Exhibit
14 U.S. Department of Energy, Energy Information Administration, Manufacturing Energy Consumption Report 1998 Table N.11.1 NAICS 3315. 15 Using AFS 2002 Metalcasting Forecast & Trends, the ratio of metalcasting shipments (NAICS 3315) tocaptive foundry casting production was calculated. To estimate energy consumption in captive foundries, this ratio was applied to industry energy consumption for NAICS 3315, 1998 Manufacturing EnergyConsumption Report, U.S. Department of Energy, Energy Information Administration, Tables N.11.1.16 U.S. Department of Energy, Energy Information Administration, 1998 Manufacturing EnergyConsumption, Table N1.2 “First Use of Energy for All Purposes”, NAICS code 3315; 331511; 331521;331524.
U.S. Department of Energy, Office of Industrial Technologies, Energy and Environmental Profile of the U.S. Metalcasting Industry, pg. 10.
Coke 13%
Other 2%
Electricity 27%
Coremaking Other 12%
Post Cast 7%
Heat Treatment
6%
Melting 55%
10
17

2.5, or reduce the amount of metal, which must be melted, will significantly improve the energy efficiency in casting.
11

III. Ferrous Castings
Seven ferrous metalcasters were chosen to undergo on-site energy profiling by one of the DOE/ITP sponsored Industrial Assessment Centers (IAC), accompanied by the Project Manager, Robert E. Eppich. Exhibit 3.1 summarizes the types of the facilities visited. These facilities represent virtually all combinations of melting and casting processes utilized to produce ferrous castings. The remainder of this section includes:
• A discussion of the general flow of operations in ferrous casting facilities. • A general description of energy use in ferrous casting usage of energy. • Profiles of the ferrous casting facilities analyzed. • Observations and recommendations on energy efficiency in ferrous casting
facilities.
Exhibit 3.1 Ferrous Metalcasting Facilities That Underwent Energy ProfilingFacilities Melting Cast Product Gray Iron Cupola Highly Cored Refrigeration & Transportation Gray Iron Induction Misc./Ag & Transportation
Ductile Iron Cupola Transportation- Brake System Ductile Iron Induction Misc./Ag & Transportation Ductile Iron Cupola Pressure Pipe
Stainless Steel Induction Pumps, Turbine & Valves Steel Arc Pumps & Valves
A. General Flow of Operations in a Ferrous Facility
Ferrous casting processes are diverse, representing many types of facilities, flow of operations, and energy profiles. In general, there are at least three broad categories of ferrous castings, and each of these categories requires different melting techniques and alloying. The general categories are:
1. Cast iron: typically contains +2.5 percent carbon (C), +1.5 percent silicon (Si) and other alloying elements to develop the desired metallurgical and mechanical properties. These alloys are cast in the temperature range of 2,3502,650º F. They are generally melted at temperatures not exceeding 2,850º F. Gray and ductile iron are representative of this class of ferrous castings with an analysis of 3.5 percent C and 2.1 percent Si.
2. Steel: typically contains less than 1 percent C and other alloying elements for hardenability during heat treatment. These alloys are cast in the temperature range of 2,850-2,950º F. They are generally melted at temperatures of 2,950 – 3,050º F. Most steel castings have a carbon analysis around 0.3-0.4 percent.
3. Stainless Steel: alloyed with chromium and nickel for corrosion and heat resistance and is about 100º F lower than the low alloy steel castings that are melted and poured at 2,850-2,950º F.
12

The general process flow for the various ferrous metalcasting facilities is similar, except for the melting portion of the process. Exhibit 3.2 (pg. 14) illustrates the general process flow for a typical ferrous metalcasting facility. The process starts with a specific “recipe” of raw materials that will result in the desired chemistry for molten metal.
The raw materials enter the process stream, metallics are melted, cores (if needed) are made, and the molten metal is poured into the molds. After the castings solidify, they are removed from the molds, cleaned via shot blasting, and processed to remove all gates and risers.
Ferrous metalcasting facilities tend to use ferrous scrap as the primary raw material; but this scrap is often supplemented with pig iron in the cast iron facilities to achieve the desired control of residual elements. The ferrous scrap is selected based on price, availability, and suitability for the melting process that has been selected. For example, steel bundles are used in the cupola operation, whereas steel punchings and slitter scrap will find its way into induction furnaces.
There are three primary melting techniques used in ferrous metals: 1. Cupola 2. Induction melting 3. Arc melting
Because of the different melting points and carbon requirements, the cupola is an acceptable melting source for cast irons, but not for steel castings. Induction furnaces can be used for melting either cast irons or steel, but because of the difference in melting temperatures, steel requires an entirely different, higher-grade refractory than does cast iron. Today, the arc furnace is virtually only used for melting steel. In the past, it was also used for melting cast iron.
In most foundries, the metal goes into an induction heated furnace for temperature control and further “mixing” to smooth out peaks and valleys of chemistry associated with the cupola operation. In a gray iron operation, metal is tapped from this holding furnace and taken to the molding lines. In a facility making ductile iron, the metal from the cupola is treated to remove virtually all sulfur and then moved to the induction-powered holding furnace. Molten iron is tapped from this holding furnace for further treatment. Reacting this iron with a controlled amount of magnesium creates ductile iron during solidification of the casting. Once this treatment is complete, there is a specific amount of time allowed for the ladle to be poured.
The general process flow for an induction melting or arc melting facility is the same as for the cupola operation. However no coke is required for melting in induction or arc melting operations, and therefore no limestone is required for fluxing the coke ash. Instead, all melting energy is electrical. One advantage of induction melting is that there are no chemistry changes associated with the coke-combustion process or coke-related sulfur emissions. By the same token, the induction melting charge needs to be much cleaner than the cupola charge because of the difficulty in removing molten slag from the induction furnace and the detrimental effect of this slag on induction furnace refractory life. The arc furnace allows for metal refining via control of slag chemistry. Steel may also undergo either argon degassing or vacuum degassing to remove nitrogen and other impurities.
13

Once molten metal is delivered to the molding lines, it makes no difference where it was melted. Molten metal is poured into the mold cavities, allowed to cool to a specific temperature, and then the molds are “shaken out,” which is a foundry term for removing the casting from the mold. The castings and associated gating system are separated from the sand. In most cases the casting remains extremely hot at this stage. The gating system, which includes the solidified runners and risers that are generally still attached to the casting, are removed and become part of the “recipe” of scrap for another charge. Any castings that are scrapped for defects are also remelted, if they are small enough to be recharged. The sand is recycled to make new molds after water and clay additions are made.
Exhibit 3.2 Process Flow for Typical Ferrous Metalcasting Operation
Raw Materials & Components Cardboard
Electricity Packaging Materials
Electricity Core Sand Mold Sand Natural Gas Metal Slag
Natural Gas Electricity Electricity
Electricity Metal Scrap
Electricity Metal Scrap
Defective Pieces Electricity
Metal Scrap
Electricity Packaging
and Shipping
Inspection
Mold Making Melting Core Making
Receiving
Finishing
Casting
14

B. General Energy Use by Type
This section describes general energy use in ferrous casting by type of foundry. Energy requirements include melting and associated peripherals such as emission controls, heat treating and other post casting operations, and facility utilities.
1. Coke Use at a Ferrous Foundry
Iron foundries that utilize the cupola as the melting source (device) utilize coke as the primary energy source for melting. This same coke also provides the carbon for converting the steel scrap into the high, 3.5 percent carbon cast iron. Calculations later in the report, which summarize energy usage, assume that all of the coke was consumed by combustion.
2. Electrical Energy Use at a Ferrous Foundry
The melting operations in a ferrous foundry consist of far more than just the melting device (melter), whether it’s a cupola, induction furnace or arc furnace. The metallics must be charged into the melter, the emissions must be captured, and the molten metal must be transferred from the melter to other holders or to the pouring lines. These processes consume electricity. Exhibit 3.3 provides a simplified overview of the electrical use in the melting department. The emission control system is a considerable consumer of electrical energy. The electrical energy needed to operate the emission control system for the same cupola facility is shown in Exhibit 3.4.
Exhibit 3.3Electricity Use for Various
Operations in a Cupola Melting Department
Ancillary
Melting Dust Motors Furnace #1Emission Collector 2% 19%System
15%
Hot Blast 14%
Furnace #2 19%Cooling
Systems 4%
Furnace #3 Charging 20%3%
4%
Exhibit 3.4 Electricity Use Associated with the Operation of the Emission Control
System of the Cupola
Emission Control Fan
74%
Wetcap Sunflow Pump-South
14% 3%Mist Elim. Pump-South
1%
Booster Pump
2%
Pump-North
Scrubber Cooling Fan Pump-East
2% 4%
These energy requirements would be similar for other cupola operations. These electrical energy requirements are summarized in later sections, which provide details on the various facilities. Oxygen is used to raise the O2 level of incoming blast air to
15

the cupola. This oxygen is also considered an electrical energy consumer. Energy is being consumed at a number of points in the ferrous foundry process. Exhibit 3.5 summarizes the electrical consumption flow for the entire melting area.
Exhibit 3.5 Electrical Consumption for Ferrous Melting Area
64.7 kW
15.1 kW
42.7 kW
Hot Water Exhaust
631.3 kW
6.2 kW Exhaust
16.7 kW Hot air Air
57.0 kW To Wetcap
Combustion Blower (19.4
kW)
Air
Turbine (376.4 kW)
Cooling Tower (26.1 kW)
27.5 kW
50.7 kW
Cold Water
Hotwell Tank Coldwell Tank
Chargers
Metallic Feeders
Additonal Chargers
Cupola Emission Control Fan
(631.3 kW)
Clean Water
Wetcap Tank
Slurry Tank
To Mist Eliminator
To Scrubber Hotblast Furnace
Exhaust System
P
P
P
P
P
P
P
P
Induction Furnace - 1 Induction Furnace - 2 Induction Furnace - 3 (489.7 kW) (493.6 kW) (485.1 kW)
The actual electrical energy use for the melting system is shown in Exhibit 3.10, page 20. This would be somewhat typical for either a gray iron cupola facility or a ductile iron cupola facility. Other operations may have fewer large holding furnaces. But they might have additional smaller holding/automatic pouring furnaces associated with each molding line. Exhibit A.5 in the Appendix provides significant additional details of the energy requirements for this typical cupola operation.
Exhibit 3.11 page 21 illustrates the electrical consumption of a “typical” ferrous foundry over a 12-month period. Electricity consumption remains rather constant over a 12month period, which is a characterization of a ferrous casting facility. However, in the month of July there is a decline in the electricity consumption due to the annual maintenance and shutdown period.
An example of electricity consumption by equipment type is shown in Exhibit 3.6. The data in Exhibit 3.6 represents an induction melting, ductile iron facility producing cored casting in greensand, however it is also typical of non-ferrous, green-sand metalcasting operations.
16

Exhibit 3.6 Electric Use of Typical Equipment for a Ferrous Induction Metalcasting
Facility
No. Equipment Quantity Size (hp)
Energy Source
Capacity (kW)
Load Factor during normal operation (%)
Remarks
1 Setco single end snag grinder 1 30.0 Elec. 22.38 50 From
observation
2 Fox single end snag grinders 4 25.0 Elec. 18.65 50 From
observation
3 Wheelabrator with skip loader
1 50.0 Elec. 37.30 70
4 Furnace Brown
Boveri IT5 2 Elec. 2,200.00 95 One furnace
melt at a time
5 Redford coreblower for ISO-cure
2 7.5 Elec. 5.60 70
6 Beardsley & Pipe CB
1 7.5 Elec. 5.60 70
7 Semi automatic core blower for
ISO-cure 15 7.5 Elec. 5.60 70
8 Dependable shell
core machines (manual)
2 20.0 Elec. 14.92 70
9
SF6CA Beardsley & Piper shell core
machine (automatic)
1 30.0 Elec. 22.38 75
10 Shalco U-180 Shell
core machine automatic
1 100.0 Elec. 74.60 75
11 Gaylord charge dryer
1 Nat. Gas 351.70 50 1.2 MMBtu burner
12 3 ton overhead crane bridge crane 1 7.5 Elec. 5.60 30
13
Robert sinto FBN2S, 20x24 flask
automatic molding machine
2 30.0 Elec. 22.38 38 Measured
14
75B Beardsley & Piper Speedmullor
with Hartley Controls
1 75.0 Elec. 55.95 50 Measured
15 General Kinematics Vibra Drum 1 7.5 Elec. 5.60 75
16 General Kinematics Screener Seperator 1 100.0 Elec. 74.60 75
17 Conveyor motor 1 30.0 Elec. 22.38 80 18 Dust collector 150.0 Elec. 111.90 40 Measured 19 Dust collector 1 50.0 Elec. 37.30 40 Measured 20 Air compressor 1 100.0 Elec. 74.60 50 Measured 21 Air compressor 2 75.0 Elec. 55.95 60 Measured
22 Cooling tower 1 15.0 Elec. 11.19 50 From observation
Furnace Mold prep Finishing Cooling Misc
17

3. Natural Gas Usage at a Ferrous Foundry
Natural gas is being used in a number of ways in the metalcasting industry. In ferrous operations, the primary uses are:
1. Heating of the workplace, 2. Heat treating furnaces, 3. Preheating cupola-blast air, 4. Cupola afterburners (environmental), 5. Ladle preheating, 6. Preheating of metallic charges, and 7. Core machines.
Metalcasting operations have substantial “wasted” heat created by the melting and subsequent cooling of the molten metal and other energy using processes. This heat is virtually never captured and used beneficially. Traditional green sand metalcasting facilities are exhausting tremendous quantities of air through baghouses in an effort to maintain a satisfactory environment for the employees and surrounding community. Very few facilities return the “cleaned” air from the baghouses back into the plant. This air must be replaced, and in the winter this air needs to be heated.
4. Compressed Air Usage at a Ferrous Foundry
The typical foundry operation uses substantial quantities of compressed air. The compressed air pressure is usually around 95-110 pounds per square inch (psi). Typical uses for compressed air are:
1. Air powered, grinding-type hand tools in the finishing department. 2. Blowing resin-coated sand into core boxes to form cores for the molding
process. 3. Blowing green sand into the copes (top) and drags (bottom) to form molds. 4. Pneumatically transporting sand within the facility. 5. Operating pneumatic cylinders and molding machines.
In most cases it is only necessary that the dew point of the compressed air be kept low enough so that water doesn’t collect in the line. However, some coremaking processes require air at a – 40º F dew point to prevent chemical reactions from occurring between the resin and the moisture in the sand/air.
18

C. Facility Profiles: Ferrous Casting
The remainder of this section profiles individual ferrous metalcasting facilities. Profiles include an overview of operations, followed by a discussion of electricity, natural gas, and compressed air usage in each facility.
C.1 Gray Iron Cupola Facility
Overview of Operation: The gray iron cupola operation visited uses a single unlined water-wall cupola with a gas-fired, non-recuperative hot blast as the primary melting source. Three channel-induction holding furnaces are utilized after the cupola for temperature control and distribution of the molten iron prior to the molding lines. This facility is located in the Midwest, and the impact of summer/winter conditions on energy usage was also evaluated. The higher tonnage metalcasting facilities, which always means more tons/hour, use the cupola as the melting source.
Most cupola melting facilities are Exhibit 3.7 utilizing oxygen enrichment or Electricity Profile for a Gray Iron injection as a means of increasing melt-rate, reducing coke usage, or Induction
Cupola Operation improving chemistry control. The Holding Cupola electrical energy used to produce 17% Melting
12%100 ft3 of oxygen is 1.6 kWh, a Lighting generally accepted number that 1% Other- Core
Processing
report. Compressed Departments Air
will be used throughout the
29% 27% Molding
This facility produces highly cored 14%
castings. Green sand high-pressure molding is used for the molding process. A variety of Exhibit 3.8 coremaking processes are used, such as coldbox, hotbox, and shell process.
Electricity Consumption: Exhibit 3.7 illustrates the electricity distribution for major areas of the cupola-gray iron facility. Note that compressed air is 27 percent of the energy. Compressed air consumption is high due to the large amounts required for coremaking, the molding lines, and air-powered tools in the finishing/processing department. This is not unusual for a foundry operation.
Electricity Distribution from Charging to Holding Molten Metal- Ready to Pour
System Power (kW)
Energy (kWh)
Energy Distributed
(%) Charging 122.5 466,463 3.3 Cooling Systems 104.3 515,242 3.6 Hot Blast 403.8 1,994,628 14.0 Emission Systems 736.4 2,078,538 14.5 Melting Dust Collector
128.0 632,320 4.4
Ancillary Motors 47.4 233,944 1.6 Furnace 1 489.7 2,693,788 18.8 Furnace 2 493.6 2,656,125 18.6 Furnace 3 485.1 3,027,213 21.2 Total (s) 3,010.7 14,298,261 100.0
19

6,000,000
Aug-00
Sep-00
Oct-0 0
Nov-00
Dec-00
Jan-01
Feb-01
Mar-01
Apr-01
May-01
Jun-01
Jul-01
Aug-0 0
Sep-0 0
Oct-00
Nov-00
Dec-0 0
Jan-01
Feb-01
Mar-01
Apr-01
May-01
Jun-01
Jul-01
The electrical use profile from the gray iron-cupola facility is summarized in Exhibit 3.8. The auxiliary equipment includes HVAC systems, finishing operations, and general motor loads not otherwise specified in Exhibit 3.8. Obviously, the power associated with induction holding is dependent on the number and size of the induction holding furnaces. Again, these are only being used for holding, not melting. They do, however, run 24 hours a day, seven days a week.
Electric energy consumption at the gray iron facility tends to be flat through the year and is highly correlated with casting 5,000,000
production, whether it
Ene
rgy
Usa
ge (k
Wh)
Exhibit 3.9 Monthly Load Profile for Electric Energy Use
at Gray Iron Cupola Foundry
is a cupola operation or an induction furnace operation. Exhibit 3.9, which is a summary of monthly electrical energy use over a one-year period at the gray iron-cupola
4,000,000
3,000,000
2,000,000
1,000,000
operation, illustrates this point. Electric use declines during the normal July shutdown and Christmas holidays.
0
Exhibit 3.10 Monthly Load Profile for Natural Gas at a Gray Iron Cupola
Facility (Natural Gas-Fired Hot Blast)
0
5, 0 0 0
10 , 0 0 0
15 , 0 0 0
20 , 0 0 0
25 , 0 0 0
30 , 0 0 0
35 , 0 0 0
Gas
Con
sum
ptio
n (M
MB
tu
Natural Gas Consumption: The cupola operation uses a natural gas-fired hot blast and approximately 10 gas-fired shell core machines. No heat treatment is performed at this facility. The base for process-related gas use is about 12,000 million Btu per month, which is approximately 65 percent of the total natural gas use at this facility. This was
20

selected for the base because there were no gas meters on individual pieces of equipment, and therefore the level had to be estimated. Exhibit 3.10 illustrates the monthly load profile for natural gas at the gray iron cupola facility. Exhibit 3.11 provides data on facility gas consumption. The melting department accounts for approximately 68 percent of the total natural gas consumption. Interestingly, the ductile-cupola facility (profiled later in this section), which uses a recuperative hot blast, consumes about the same amount of gas for its melting operation and heat treatment facility, which operates about once/week. Even though the ductile iron facility is not in the Midwest, it’s winter heating requirements are also substantial, resulting in a pattern that is similar to that shown in Exhibit 3.10.
Exhibit 3.11 Analysis of Annual Natural Gas Use at Gray Iron Cupola Facility
(Million Btu)
Gas Usage** Facility ft2 Btu /ft2
Annual Tons Btu/ton
Melting Department
Natural Gas Use
Plant Heating
207,246 312,000 0.66 87,500 2.37 140,304 66,942 * Based on extrapolated summer usage, assuming not general plant heat ** Average for 2003 year
Compressed Air: The coremaking department of the gray iron cupola facility is the largest of any of the assessed facilities. Air compressors account for almost 25 percent of the kW load of this facility. However, during the assessments it was also apparent that many systems had grown as the facility expanded and there was opportunity to re-engineer an optimized system that would maximize air-efficiency while minimizing energy usage. Air leaks and lack of air management of the compressors again creates substantial energy saving opportunities.
Exhibit 3.12 Connected Air Compressor Horsepower at a Ferrous Foundry
Motor Power (hp)
Measure d Power
(kW) Hours
Energy (KWh)
Loaded Fraction (%)
% Full Load HP
Compressor 1 150 92.5 4,590 424,444 55.1 83 Compressor 3 300 196.0 4,590 899,547 39.1 88 Compressor 4 200 120.4 6,120 736,801 53.9 81 Compressor 5 150 128.6 4,590 590,234 60.7 115 Compressor 8 350 251.8 4,590 1,155,819 100.0 96 Compressor 11 350 235.2 4,590 1,079,719 69.0 90 Compressor 14 350 298.0 8,760 2,610,549 100.0 114 Compressor 15 350 278.3 5,355 1,490,223 100.0 107 Compressor 16 350 284.6 5,355 1,524,104 100.0 109 Compressor 17 350 261.7 6,618 1,731,786 100.0 100 Compressor 18 350 256.5 4,590 1,177,415 60.7 98 Total 3,250 2,403.6 59,748 13,420,641
Exhibits 3.12, 3.13, and 3.14 provide additional details on the air compressors at the gray iron foundry. Exhibit 3.12 shows distribution of loading at this facility. This type of analysis can be used for control/capacity evaluations. Exhibit 3.13 presents information for profiling the gray iron facility against other metalcasting facilities. Exhibit 3.14 illustrates the tremendous amount of wasted heat and one-pass cooling
21
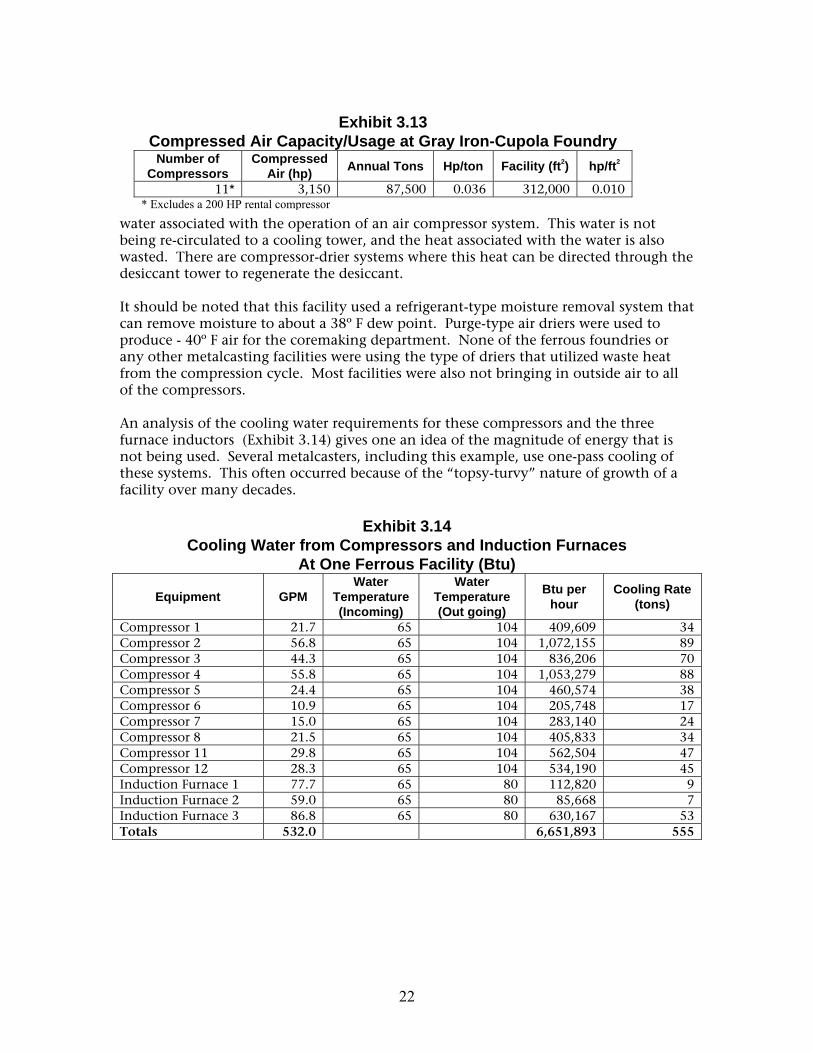
Exhibit 3.13 Compressed Air Capacity/Usage at Gray Iron-Cupola Foundry
Number of Compressors
Compressed Air (hp) Annual Tons Hp/ton Facility (ft2) hp/ft2
11* 3,150 87,500 0.036 312,000 0.010 * Excludes a 200 HP rental compressor
water associated with the operation of an air compressor system. This water is not being re-circulated to a cooling tower, and the heat associated with the water is also wasted. There are compressor-drier systems where this heat can be directed through the desiccant tower to regenerate the desiccant.
It should be noted that this facility used a refrigerant-type moisture removal system that can remove moisture to about a 38º F dew point. Purge-type air driers were used to produce - 40º F air for the coremaking department. None of the ferrous foundries or any other metalcasting facilities were using the type of driers that utilized waste heat from the compression cycle. Most facilities were also not bringing in outside air to all of the compressors.
An analysis of the cooling water requirements for these compressors and the three furnace inductors (Exhibit 3.14) gives one an idea of the magnitude of energy that is not being used. Several metalcasters, including this example, use one-pass cooling of these systems. This often occurred because of the “topsy-turvy” nature of growth of a facility over many decades.
Exhibit 3.14 Cooling Water from Compressors and Induction Furnaces
At One Ferrous Facility (Btu)
Equipment GPM Water
Temperature (Incoming)
Water Temperature (Out going)
Btu per hour
Cooling Rate (tons)
Compressor 1 21.7 65 104 409,609 34 Compressor 2 56.8 65 104 1,072,155 89 Compressor 3 44.3 65 104 836,206 70 Compressor 4 55.8 65 104 1,053,279 88 Compressor 5 24.4 65 104 460,574 38 Compressor 6 10.9 65 104 205,748 17 Compressor 7 15.0 65 104 283,140 24 Compressor 8 21.5 65 104 405,833 34 Compressor 11 29.8 65 104 562,504 47 Compressor 12 28.3 65 104 534,190 45 Induction Furnace 1 77.7 65 80 112,820 9 Induction Furnace 2 59.0 65 80 85,668 7 Induction Furnace 3 86.8 65 80 630,167 53 Totals 532.0 6,651,893 555
22
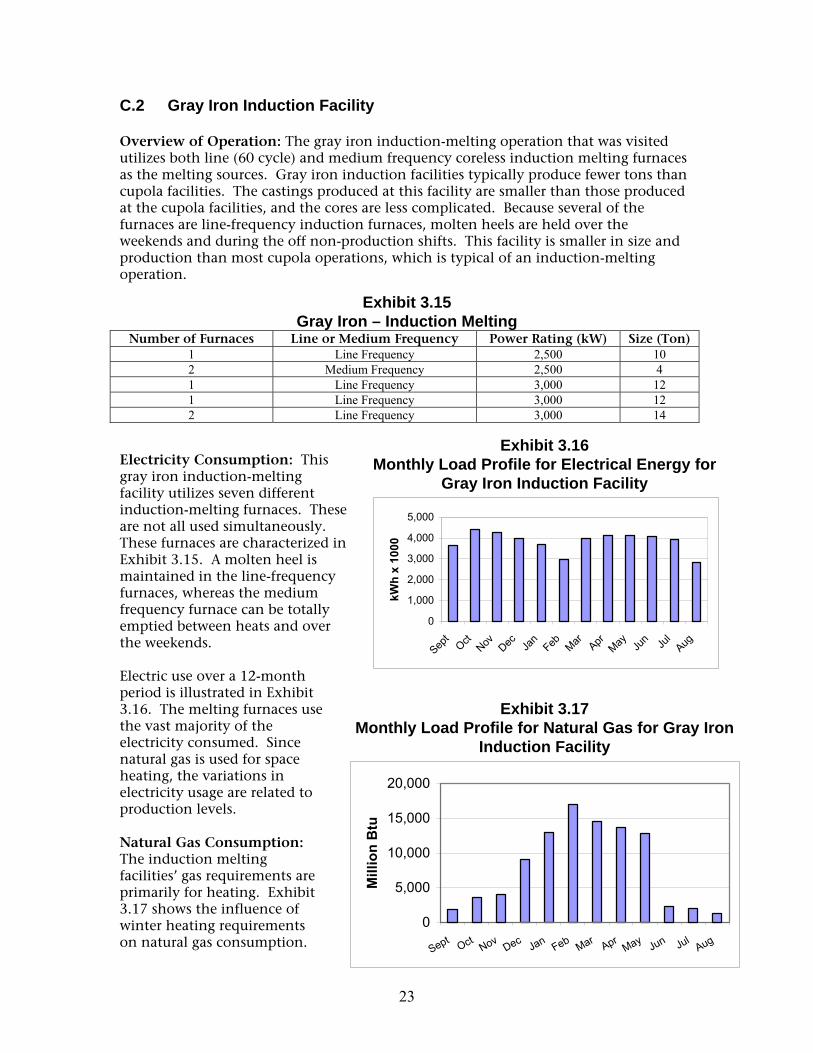
C.2 Gray Iron Induction Facility
Overview of Operation: The gray iron induction-melting operation that was visited utilizes both line (60 cycle) and medium frequency coreless induction melting furnaces as the melting sources. Gray iron induction facilities typically produce fewer tons than cupola facilities. The castings produced at this facility are smaller than those produced at the cupola facilities, and the cores are less complicated. Because several of the furnaces are line-frequency induction furnaces, molten heels are held over the weekends and during the off non-production shifts. This facility is smaller in size and production than most cupola operations, which is typical of an induction-melting operation.
Exhibit 3.15 Gray Iron – Induction Melting
Number of Furnaces Line or Medium Frequency Power Rating (kW) Size (Ton) 1 Line Frequency 2,500 10 2 Medium Frequency 2,500 4 1 Line Frequency 3,000 12 1 Line Frequency 3,000 12 2 Line Frequency 3,000 14
Electricity Consumption: This gray iron induction-melting facility utilizes seven different induction-melting furnaces. These are not all used simultaneously. These furnaces are characterized in Exhibit 3.15. A molten heel is maintained in the line-frequency furnaces, whereas the medium frequency furnace can be totally emptied between heats and over the weekends.
Electric use over a 12-month period is illustrated in Exhibit 3.16. The melting furnaces use the vast majority of the electricity consumed. Since natural gas is used for space heating, the variations in electricity usage are related to production levels.
Natural Gas Consumption: The induction melting facilities’ gas requirements are primarily for heating. Exhibit 3.17 shows the influence of winter heating requirements on natural gas consumption.
Exhibit 3.16 Monthly Load Profile for Electrical Energy for
Gray Iron Induction Facility
0
1,000
2,000
3,000
4,000
5,000
Sept
OctNov Dec Ja
nFeb Mar Apr
May Jun Ju
lAug
kWh
x 10
00
Exhibit 3.17 Monthly Load Profile for Natural Gas for Gray Iron
Induction Facility
23
0
5,000
10,000
15,000
20,000
Sept OctNov Dec
Jan Feb Mar AprMay
Jun JulAug
Mill
ion
Btu

Because the gray iron facility is located in the upper Midwest, it has higher heating requirements than the ductile iron facility located in the Plains States.
Exhibit 3.18 summarizes the natural gas usage and presents it against total good tons and consumption/ft2 of the facility. Again, none of the facilities utilize any heat recovery system to extract heat from the exhaust air.
Exhibit 3.18 Analysis of Natural Gas Use at Gray Iron Induction Facility
(Million Btu)
Annual Usage**
Btu Facility ft2 Btu/ft2 Annual
Tons Btu/ ton
Melting Department Annual* Btu
General Plant
(Heating) Annual Btu
87,369 126,380 0.69 13,250 6.59 23,219 64,150 * Based on extrapolated summer usage, assuming no general plant heat
Compressed Air: Compressed air use is typical for a green sand foundry. Air is used for coremaking, powering hand grinders, and other molding operations. Compressor horsepower is compared against several tonnage and facility factors in Exhibit 3.19.
Exhibit 3.19 Compressed Air Capacity/Usage at Gray Iron Induction
FoundryNumber of
Compressor s
Compressed Air hp*
Annual Tons hp/ton
Facility (ft2) hp/ft2
8 1,300.0 13,250 0.098 126,380 0.010 * Excludes a 200 HP rental compressor
C.3 Ductile Iron Cupola Facility
Overview of Operation: The ductile iron facility is very focused, producing a narrow line of product for the automotive industry. The ductile iron cupola operation analyzed uses a single-lined water-wall cupola with a recuperative hot blast as the primary melter. Oxygen is injected through the tuyeres to enhance melt rate and chemistry control. The production of ductile iron from cupola-melted iron requires de-sulfurization of the molten iron. This sulfur is picked up from the coke. The de-sulfurization process typically uses either calcium carbide – which was the material of choice at this facility – or a lime-fluorspar material in a continuous ladle process, immediately after the iron leaves the cupola during the continuous ladle process. The iron is then transferred to channel-induction holding furnaces for temperature control and to facilitate metal distribution. By the nature of their design, these channel furnaces hold molten iron continuously, 24 hours a day, seven days a week until the inductor is replaced, usually after 6 – 18 months. This facility was not located in the Midwest, and had fewer space heating requirements than the other facilities that were analyzed.
24

Electricity Consumption: This facility is considered a typical cupola melting facility, and the same electrical requirements that were shown for the cupola gray iron melting department, apply here
Exhibit 3.20(see Exhibit 3.3, page 15). Two 1,200 kW channel Monthly Load Profile for Electrical Energy at a furnaces are in use Ductile Iron Cupola Facility during normal operations and a third furnace is available, but is not operating. A profile of the annual electrical use is shown in Exhibit 3.20. Again, the month-to-month electric use is fairly flat and primarily related to production. The 1,200 kW holding furnace operates 24 hours a day, seven days a week until it
0
1,000
2,000
3,000
4,000
5,000
6,000
7,000
Oct Nov Dec
Jan Feb
Mar AprMay
Jun JulAug
Sep
kWh
X 10
00
is taken down for an inductor change.
Natural Gas Consumption: At this facility, natural gas is used for preheating the cupola blast air until the recuperative system comes up to the desired operating temperature. It is also used for space heating and ladle/trough heating. A heat treating operation that heat treats about 3 percent of the production runs one day per week, and uses natural gas. Even though this facility is located in the Mid-South, space heating requirements are reflected in the differences between winter and summer natural gas consumption, as illustrated in Exhibit 3.21. Exhibit 3.22 provides an
Exhibit 3.21 Monthly Load Profile for Natural Gas for a
Ductile Iron- Cupola Facility
0
5,000
10,000
15,000
20,000
25,000
30,000
Sep OctNov Dec Jan Feb Mar Apr
May Jun JulAug
Mill
ion
Btu
analysis of natural gas use against tonnage and size of the facility.
Exhibit 3.22 Analysis of Natural Gas Use at Ductile Iron Cupola Facility
(Million Btu) Annual Usage** Btu
Facility ft2 Btu/ ft2 Annual
Tons Btu/ ton
Melting Department Annual* Btu
Heat Treating Btu
General Plant (Heating) Annual Btu
203,222 386,700 0.53 103,277 1.97 71,850 26,842 97,997 * Based on extrapolated summer usage- assuming no general plant heat ** Average for 2003
25

Compressed Air: Seven reciprocating compressors provide compressed air, which is a large energy consumer in the facility. The four 400 hp units and three 350 hp units are water-cooled, producing compressed air at a pressure of 105 psi. Most of the compressed air is inter-cooled using a water-cooled heat exchanger before it enters a large receiver. Air is dried using one of two large refrigeration air dryers. This air is for general plant use such as powering air tools and pneumatic cylinders. Compressed air used in coremaking is further dried using a desiccant dryer. The core department of this facility is much smaller than that of the gray iron cupola operation. The cores are smaller and of a much simpler configuration.
Exhibit 3.23 Compressed Air Capacity/Usage at Ductile Iron Cupola Foundry
Number of Compressors
Compressed Air hp
Annual Tons hp/ton Facility
(ft2) hp/ft2
7 2,750.0 103,277 0.027 386,700 0.0071
C.4 Ductile Iron Pipe Cupola Facility
Overview of Operation: The centrifugal casting process produces ductile iron pipe. Molten iron is poured into a rotating steel mold where it Exhibit 3.24 rapidly solidifies, forming Monthly Load Profile for Electrical Energy at a the pipe. Because the Ductile Iron Pipe Facility process does not require any gates or risers, the yield as measured by pounds poured vs. pounds of pipe is very high, approaching 97 percent (excluding defective pipe, which is remelted). The ductile iron pipe facility that was visited utilized a single-lined water-wall cupola with a recuperative hot blast. Oxygen is injected through the tuyeres to enhance melt rate. All centrifugally cast pipe is annealed to eliminate carbides created by the rapid cooling of the permanent, steel-pipe molds and to achieve the desired mechanical properties. The cupola and associated melting equipment consumes 50 percent of the total energy used at the facility visited.
0
500
1,000
1,500
2,000
2,500
3,000
3,500
Jan Feb Mar AprMay Jun Jul
Aug Sep Oct
Nov Dec
kWh
X 10
00
Electricity Consumption: This particular facility uses an unheated holder (receiver) downstream from the cupola and thus does not use electrical energy normally associated with an induction-powered, channel-type holding furnace. This is very atypical of the industry. Exhibit 3.24 shows the monthly electricity load profile. It is reasonably level and is a function of production. Because there is no electric-powered
26

holding furnace, the plant can go virtually “black” during weekends and other nonproduction periods.
Natural Gas Consumption: The cupola only uses natural gas to ignite the off-gases. The recuperative hot blast system preheats the incoming air to the cupola. This system is similar to the recuperative system used at the ductile iron cupola facility. However, since all ductile iron pipes must be heat-treated to eliminate the carbides associated with the rapid solidification in the rotating pipe mold, considerable natural gas is used at this step in the process. Natural gas is also used to preheat ladles, for other minor drying operations, and to provide space Exhibit 3.25 heating when Monthly Load Profile for Natural Gas at Ductile Iron needed. Exhibit 3.25 Pipe Facility Over a 12-Month Periodsummarizes natural gas use throughout the year. The data exhibits average use over two years. July is the normal shutdown (vacation) period. Because the facility does not use an induction-powered holding furnace after the cupola, natural gas is
0
10,000
20,000
30,000
40,000
50,000
60,000
Jan Feb
Mar AprMay
Jun JulAug Sep
OctNov Dec
Mill
ion
Btu
utilized to establish necessary ladle and receiver temperatures.
Exhibit 3.26 Analysis of Natural Gas Use at Ductile Iron Pipe- Cupola Facility
(Million Btu) Annual Usage** Btu
Facility ft2 Btu/ ft2 Annual
Tons Btu/ ton
Melting Department Annual* Btu
Heat Treating Btu
General Plant (Heating) Annual Btu
544,986 360,135 1.51 205,774 2.65 402,000** 140,000** 3,300** * Includes ladle preheating and afterburners ** Estimated
Compressed Air: Compressed air is used for a number of processes within the plant. However, the use of air for coremaking and powering of hand tools is virtually nonexistent. Exhibit 3.27 provides comparative data on compressed air against the size of the facility and tonnage. Because of the high humidity in the region and the implications of Exhibit 3.27 excess water on the operation of Compressed Air Capacity/Usage at Ductile Iron Pipe-Cupola pneumatic
Number of Compressors*
Compressed Air hp
Annual Tons hp/ton Facility
(ft2) hp/ft2
3 1,050 205,774 0.005 360,135 0.003
Foundry cylinders, all air is dried to -40º F through a * There are 5 – 350 hp compressors; only three are being used at any one time. single drier.
27

C.5 Ductile Iron Induction Facility
Overview of Operation: The ductile iron induction-melting operation utilizes medium-frequency coreless induction furnaces for melting. Because coke is not used as an energy source, induction-melted ductile iron does not need to be de-sulfurized, as long as the charge materials are carefully selected. The facility analyzed in this study is smaller than the cupola operations visited. However this facility is a typical size for an induction facility.
Even though the ductile iron cupola facility and this ductile iron induction facility are different by an order of magnitude, the number of cored castings and the complexity of the cores are similar at each ductile iron Exhibit 3.28 facility. This facility is Monthly Load Profile for Electrical Energy at A Ductile currently producing about 5-6,000 tons/year
Iron – Induction Facility over a 24- Month Period
with a workforce of fewer than 75 employees. The average weight of their casting is about 5 lb. It is a typical green-sand foundry, utilizing modest-sized automatic molding equipment.
Electricity Consumption: Since electrical energy is used for melting, the vast majority of electrical usage is associated with the melting process. Exhibit 3.28 again illustrates the relative flatness of electricity usage, which is primarily associated with production (melting) requirements. Exhibit 3.29 illustrates the various electricity consuming equipment that is necessary for the operation of a small foundry. The approximate load of each piece of equipment is also summarized.
0
100
200
300
400
500
600
700
800
Sep
Nov
Jan
MarMay
Ju
l Sep
Nov
Ja
n Mar
May
Jul
kWh
X 10
00
28

Exhibit 3.29 Electric Use of Typical Equipment for a Ferrous Induction Metalcasting
Facility
No. Equipment Quantity Size (hp)
Energy Source
Capacity (kW)
Load Factor during normal operation (%)
Remarks
1 Setco single end snag grinder 1 30.0 Elec. 22.38 50 From
observation
2 Fox single end snag grinders 4 25.0 Elec. 18.65 50 From
observation
3 Wheelabrator with skip loader
1 50.0 Elec. 37.30 70
4 Furnace Brown
Boveri IT5 2 Elec. 2,200.00 95 One furnace
melt at a time
5 Redford coreblower for ISO-cure
2 7.5 Elec. 5.60 70
6 Beardsley & Pipe CB
1 7.5 Elec. 5.60 70
7 Semi automatic core blower for
ISO-cure 15 7.5 Elec. 5.60 70
8 Dependable shell
core machines (manual)
2 20.0 Elec. 14.92 70
9
SF6CA Beardsley & Piper shell core
machine (automatic)
1 30.0 Elec. 22.38 75
10 Shalco U-180 Shell
core machine automatic
1 100.0 Elec. 74.60 75
11 Gaylord charge dryer
1 Nat. Gas 351.70 50 1.2 MMBtu burner
12 3 ton overhead crane bridge crane 1 7.5 Elec. 5.60 30
13
Robert sinto FBN2S, 20x24 flask
automatic molding machine
2 30.0 Elec. 22.38 38 Measured
14
75B Beardsley & Piper Speedmullor
with Hartley Controls
1 75.0 Elec. 55.95 50 Measured
15 General Kinematics Vibra Drum 1 7.5 Elec. 5.60 75
16 General Kinematics Screener Seperator 1 100.0 Elec. 74.60 75
17 Conveyor motor 1 30.0 Elec. 22.38 80 18 Dust collector 150.0 Elec. 111.90 40 Measured 19 Dust collector 1 50.0 Elec. 37.30 40 Measured 20 Air compressor 1 100.0 Elec. 74.60 50 Measured 21 Air compressor 2 75.0 Elec. 55.95 60 Measured
22 Cooling tower 1 15.0 Elec. 11.19 50 From observation
Furnace Mold prep Finishing Cooling Misc
29

There are two melting furnaces supported by a single 2,200 kW – 120-cycle/sec power supply. The power is switched between the two furnaces. This general information is presented as a pie chart in Exhibit 3.30. Melting accounts for 88 percent of the electricity consumed at this facility.
Natural Gas Consumption: Natural gas is used for space heating, ladle preheating, charge preheating, and shell coremaking. Exhibit 3.31 shows the influence of seasonal temperature variations on natural gas consumption. It is also apparent that natural gas plays a minor role in energy consumption at this facility.
Exhibit 3.32 provides the information for natural gas consumption vs. size of the facility and tons produced. No heat-treating is carried out at this facility.
Exhibit 3.30Annual Energy Consumption by
DepartmentFinishing
2% Molding Supporting 7%
3%
Melting 88%
Exhibit 3.31 Monthly Load Profile for Natural Gas at a Ductile
Iron Induction Facility over a 24-Month Period
0 500
1,000 1,500 2,000 2,500 3,000 3,500
Sep Nov Jan
MarMay
Ju
lSep Nov Ja
nMar
May
Jul
Mill
ion
Btu
Exhibit 3.32 Analysis of Natural Gas Use at Ductile Iron Induction Facility
(Million Btu) Annual Natural Gas Usage** Btu
Facility ft2 Btu/ft2 Annual
Tons Btu/ton Melting Department Annual* Btu
General Plant (Heating) Annual Btu
33,736 44,000 0.77 5,510 6.12 7,020 26,716 * Based on extrapolated summer usage, assuming no general plant heat ** Based on 2003 average
Compressed Air: Compressed air is used for coremaking, powering air tools in the finishing department, and operating pneumatic cylinders on the molding machines.
Exhibit 3.33 Compressed Air Capacity/Usage at Ductile Iron-Induction Facility
Number of Compressors Compressed Air hp Annual Tons hp/ton Facility (ft2) hp/ft2
3 250.0 5,510 0.045 44,000 0.006
30

Steel Metalcasters (Ferrous)
Steel castings are ferrous-based, as are cast iron-based castings, but that is where much of the similarity ends. Steel is an iron-based alloy that is malleable in some temperature ranges as initially cast. It contains manganese, usually carbon, and often times other alloying elements.18 Molten steel (iron containing up to 1 percent carbon) has a higher melting point than the cast iron family. Cast irons, gray and ductile, are poured in the general range of 2,500º F. Steel is poured in the general range of 2,850º F. This 350º F gap makes a significant difference in the choices of furnaces for melting and the refractories that are used to contain the molten metal. Steel cannot be cupola melted. Therefore all steel is either arc-furnace melted or induction-furnace melted.
The annual steel casting demand in the U.S. is approximately 1 million tons, with about one-third of that demand for steel railroad wheels. The railroad industry consumes nearly one-half of the total steel casting production in the U.S. The balance is primarily divided among the valve, pump, construction, and power generating equipment industries.
Two steel facilities were visited with additional data from a third. The steel foundries are typically about 50-100 employees, with many tending toward the smaller end of the scale. One does not find the “mega” foundries with up to 1,000 employees that characterize a portion of the cast iron foundry industry. The three steel foundries visited had between 90-140 employees. Because of the lower total demand of steel castings, one does not find the large automated-type molding lines. The steel casting facilities visited serve individual niches and produce order volumes of 1-50 castings per order.
The casting yield total weight of casting per mold/total weight per mold is always less than that of the cast iron metalcasters. Yields in the steel casting industry can be as low as 35 percent. This is because there is a need to accommodate all of the solidification shrinkage associated with the solidification of the steel. The cast iron precipitates graphite during solidification, and this less-dense graphite counteracts some of this solidification shrinkage. Another factor that creates increased costs for the steel metalcaster is the need to remove the gating system and risers by cutting off these systems with either bandsaws or torches.
The steel foundries, as with many of the cast iron foundries, are using computer-assisted gating design, along with solidification/flow modeling. One of the reasons for the “lower than theoretical” yield is the high risk associated with making very small orders. Thus, yield is sacrificed to gain assurance that scrap (defective) castings will be minimized or totally avoided. The process flow for a typical green sand-air set steel foundry is shown in Exhibit 3.34.
18 Davis, J.R., Metals Handbook, ASM International, Materials Park, OH 1998 pg. 55.
31

Apr May
Ju
n Jul
Aug
Sep
Oct Nov
Dec
Ja
n Feb
Mar
Exhibit 3.34 Process Flow of a Green Sand Steel Foundry
C.6 Stainless Steel Induction Facility
Exhibit 3.35 Monthly Load Profile for Electrical Energy at a
Stainless Steel Induction Facility Overview of Operation: This facility is located in the Northeast and subject to seasonal heating requirements. Employment is approximately 100 people. The high alloy steel facility produces primarily stainless steel type valves and pump bodies in small order quantities. Monels and copper-nickel alloys are also poured at this facility. The size of the castings produced at this facility range from several pounds to several thousand pounds. The primary molding process is a chemically-bonded air set system. The chemically-bonded sand is reclaimed and reused at this facility. Casting yield, as measured by metal poured vs. castings sold, is relatively low due to the nature of the alloys and the conservative approach to gating/risering practice because of the small order quantities.
0
10 0
20 0
30 0
40 0
50 0
60 0
70 0
Kilo
wat
ts X
100
0
Electricity Consumption: Metal is melted in one of four electric induction furnaces at this facility. The molten metal may also be argon degassed, depending on the specific alloy and customer requirements. Two of the furnaces are 1,000 kW and two are 300 kW. The typical demand over a 15-minute period is 3.5 Megawatts. The monthly use is shown in Exhibit 3.35. The reported distribution of electrical usage for the stainless steel production at this facility is shown in Exhibit 3.36.
32

Natural Gas Consumption: This foundry has a different monthly distribution of natural gas usage than the other steel foundries examined in this study, as illustrated in Exhibit 3.37. General plant use in Exhibit 3.37 would include all the natural gas that is used for ladle/refractory heating. This facility has a significant need for heating in the winter, but a relatively small percentage of the stainless steel castings are heat treated, as compared to virtually 100% of the low carbon-low alloy steel castings.
Exhibit 3.38 shows the allocation of natural gas usage at the stainless steel foundry. Ladle pre-heating consumption is almost 50 percent of the annual consumption.
Exhibit 3.37
Exhibit 3.36 Distribution of
Electrical Usage in a Stainless Steel Foundry
Equipment/Area % Induction Melting Furnace* 28.3
Overhead** 29.2 Cleaning/Processing 14.5 Shell Molding 4.7 Cope/Drag 4.2 Shell- P 4.0 Shakeout 3.7 Floor Molding 3.1 Core Making 3.0 Maintenance 2.9 Argon-Oxygen Degassing
2.4
Total 100 * Metered ** Includes compressed air
Monthly Load Profile for Natural Gas at a Stainless Steel Foundry Over a 12-Month Period
0
500
1,000
1,500
2,000
2,500
3,000
3,500
4,000
Jun Jul Aug Sep Oct Nov Dec Jan Feb Mar Apr May
Month
Mill
ion
Btu
Heat Treating
Shell
Pattern
General Plant
33

Exhibit 3.38 Natural Gas Allocation for Stainless Steel Foundry
Equipment/Area Consumption (MMBtu) % Ladle Pre-Heaters 13,265 44.79 Makeup Air 4,908 16.57 High Temp Heat Treat Furnace 4,648 15.70 Thermal Reclaimer 1,742 5.88 Core Oven 1,525 5.15 Low-Temp Heat Furnace 1,162 3.92 Drying Tunnel 709 2.39 Shell Molding 556 1.88 Shell Core 549 1.86 Pattern Shop Boiler 318 1.07 AOD Pre-Hetaing 121 0.41 Water Heater 89 0.30 Emergency Generator 24 0.08 Total 29,616 100
Compressed Air: Compressed air used in this steel foundry is similar to that in the iron foundries that were analyzed. The compressed air is used primarily to power hand tools, molding machines, and core making equipment. Exhibit 3.39 summarizes the compressed air capacity for the stainless steel foundry compared to production and the size of the facility.
Exhibit 3.39 Compressed Air Capacity/Usage at Stainless Steel Induction Foundry
Number of Compressors
Compressed Air hp
Annual Tons hp/ton Facility (ft2) hp/ft2
3 450.0 900 0.500 110,000 0.004
C.7 Steel Arc Facility:
Overview of Operation: The steel arc melting facility is located in the Midwest. Steel is arc melted at times because of the ability of the arc furnace to reach the high molten metal temperatures required for casting steel, and its ability to use slag chemistry to perform metal refining. This facility produces steel casting of relatively small size. Approximately 30 percent of the production is cast in airset molds and 70
Exhibit 3.40 Monthly Load Profile for Electrical Energy at a Steel
Arc Furnace Facility Over One Year
0.0 100.0 200.0 300.0 400.0 500.0 600.0 700.0 800.0 900.0
Apr May Jun Ju
lAug Sep Oct Nov Dec Ja
nFeb Mar
'000
kW
h
34

percent is in green sand molds. The facility has an annual production of approximately 3,000 tons, with an annual capacity of 6,000 tons.
Electricity Consumption: The electrical use for the arc melting facility is relatively flat and closely related to production. The arc furnace at this facility is a 1.5 MW furnace and produces approximately 8,000 lb to 15,000 lb per heat. The furnaces use about 450-480 kWh per ton of metal melted. Exhibit 3.40 summarizes the monthly electrical use. (The facility shuts down in August for maintenance. The monthly average was calculated from September through July). The actual distribution of electrical energy use by equipment is summarized in Exhibit 3.41. The electric arc furnace consumes approximately 49 percent of the total electricity at this foundry.
Natural Gas Consumption: In the steel foundry industry, natural gas is used for both space heating and heat treating, which is either an annealing or a hardening operation. Virtually all steel castings are heat treated, whereas only a small percentage of the stainless steel castings undergo any heat treatment. Exhibit 3.42 and 3.43 reflect that information. Natural gas usage at this arc melting facility is only mildly impacted by the weather.
Exhibit 3.41Electrical Energy Use by
EquipmentShot Blast
Air 2% Cooling Lighting Compressors Tower 1%
Shakeout Dust Collection 1%
15% Other 12%
Arc Furnace
3%14%Mullers 3%
49%
Exhibit 3.42 Monthly Load Profile for Natural Gas at a Steel
Induction Arc Furnace
0
500
1000
1500
2000
2500
3000
3500
4000
4500
5000
May Jun Jul Aug Sep Oct Nov Dec Jan Feb Mar
Mill
ion
Btu
Exhibit 3.43 Approximate Distribution of Natural
Gas Use by Equipment at a Steel Induction Arc Facility
Equipment % of Total Ladle Heaters (3) 10.1 % Annealing Furnaces 50.7 % (3) Core Ovens 8.4 % Sand Reclaimer 16.9 % Unit Heaters 13.5 % Other 0.4 %
This is shown in Exhibit 3.42. The low period in July is associated with the normal summer plant shutdown. The gradual climb in usage is primarily associated with increasing production over the months shown. The distribution of natural gas by equipment is listed in Exhibit 3.43. Annealing and ladle preheating are considerable consumers of natural gas, with the total estimated use for these two activities accounting for 60.8 percent of the total natural gas use.
35

3. Compressed Air: Compressed air use at this steel foundry was typical for foundry operations. Air is used to power the hand-grinders in the finishing department, and with operating various pneumatic cylinders and pneumatically-powered molding machines. This facility, which is primarily a “squeezer” operation, uses air as the primary energy source for these molding machines. Air use is summarized
in Exhibit 3.44.
Exhibit 3.44 Compressed Air Capacity/Usage at a Steel Arc Foundry
Number of Compressors
Compressed Air hp
Annual Tons hp/tons Facility (ft2) hp/ft2
4 650 3,230 0.201 110,000 0.006
C.8 Steel Induction Melting Airset Facility
Overview of Operation: The final steel foundry included in the profiling effort was an induction melting airset facility in the South. The reported information was from a previous IAC assessment that was performed in 1996. The annual production of this facility is about 2,700 tons of steel castings.
Electricity Consumption: All the steel at this facility is melted in a single 1,000 kW induction furnace. Therefore, the induction-melting furnace at this facility drives electrical consumption. There is also a 600 kW furnace that has a standby status. It is not used simultaneously with the larger 1,000 kW furnace. Exhibit 3.45 shows the level electrical consumption over a 12month period at this foundry.
Exhibit 3.45 Monthly Load Profile for Electricity at a Steel
Induction Melting – Airset Facility Over a Year
0.0
100.0
200.0
300.0
400.0
500.0
600.0
Jan
Feb Mar Apr May Jun Ju
lAug Sep Oct Nov Dec
'000
kW
h
Exhibit 3.46Electrical End-Point Energy Usage
Other Compressed Process
Air Equipment 13% 13% Lighting
Motors 8%14% Space
Conditioning 1%
Induction Furnace
51%
Exhibit 3.46 shows the distribution of electrical energy use at this induction melting facility. The induction furnace uses approximately 51 percent of the electrical energy at this foundry. Other plant processes are approximately 13 percent each.
36

Natural Gas Consumption: Again, all castings are heat-treated. This facility is located in the Deep South and space-heating requirements are virtually non-existent. Approximately 94 percent of the natural gas use is devoted to the annealing/heat Exhibit 3.47 treatment of the steel Monthly Load Profile for Natural Gas at a Steelcastings. Annual natural gas use at this facility was
0
500
1,000
1,500
2,000
2,500
3,000
3,500
Jan Feb Mar AprMay Jun Jul
Aug Sep OctNov Dec
mill
ion
Btu
Induction Melting Airset Facility 27,985 million Btu. Natural gas use of this facility is illustrated over one-year period in Exhibit 3.47.
Compressed Air: This steel foundry has three air compressors, with one of them used as a backup. Exhibit 3.48 summarizes air compressor capacity vs. tonnage and the size of the facility.
Exhibit 3.48 Compressed Air Capacity/Usage at a Steel Induction Melting
Airset FacilityNumber of
Compressors Compressed
Air hp Annual
Tons hp/tons Facility (ft2) hp/ft2
2 225 2,700 0.083 64,200 0.004
37

D. Results and Observations: Ferrous
This section provides summary information and also incorporates the critically important coke use information into the report.
Iron
Exhibit 3.49 summarizes the overall energy use for each of the iron facilities that were involved in the assessment. Tacit energy is a term used to describe an energy value that equals the combination of onsite energy consumption, the process energy required to produce and transmit/transport the energy source, and feedstock energy.
Exhibit 3.49 Energy Use by Iron Foundries Directly Participating in the Profile Project
Type of Melting
Iron Type
Annual Tons
Electrical Btu/Ton (x 106)
Natural Gas
Btu/Ton (x 106)
O2 Equivalent
Btu/Ton (x 106)
Coke Btu/Ton (x 106)
Propane Btu/Ton
Fuel Oil Btu/Ton
Total Btu/ton (x 106)
Total Tacit
Btu/Ton (x 106)
Cupola Gray 87,500 2.07 2.37 0.047 5.10 0.00 0.00 9.59 13.44 Cupola Ductile 103,000 2.23 1.97 0.008 5.97 0.12 0.21 10.51 14.66
Cupola Ductile-Pipe 206,000 0.46 2.65 0.080 2.79 0.00 0.00 5.98 6.84
Induction Ductile 5,500 8.54 6.12 0.000 0.00 0.00 0.00 14.66 30.54 Induction Gray 13,250 11.8 6.59 0.000 0.00 0.00 0.00 18.39 40.34 Note: Tacit energy for electrical generation is 2.86 times the measured usage. It’s been assumed that the tacit energy for coke and natural gas is “1” or unity.
At the cupola ductile iron facility and the centrifugal pipe casting operation, natural gas is consumed at on-site heat-treating operations. The natural gas usage at the cupola ductile iron facility only accounts for 3 percent of their total natural gas use. Natural gas use at the pipe-making facility – where all pipe must be heat treated – accounts for an estimated 25 percent of gas use at this facility. This would be typical for these types of operations. Note that all information is based on “good tons” which is considering shipped tons and produced tons to be equally produced, not the melted tons. In a typical foundry operation, good tons are usually in the range of 40-70 percent of the melt tons because of the need for a gating system to deliver molten, clean iron to the mold, risers to compensate for solidification shrinkage, and also the re-melting of defective castings. The percentages are relatively constant for a specific operation. In a facility producing ductile iron pipe, the good tons will approach/exceed 90+ percent of the melt tons because of the nature of the centrifugal casting process, which does not require a runner (gating) system or risers.
It is apparent that there are wide differences in energy use across the industry and one must be very careful when attempting to draw conclusions regarding energy use. Exhibit 3.50 summarizes data that was obtained from other sources. This data represents about 2 million tons of cast products and is from high-production facilities. Even though this data was not gathered during the assessment efforts, there is a high degree of confidence in this information.
38

Exhibit 3.50 Energy Information from Foundries NOT DIRECTLY participating in the Profiling Effort
Type of Melting
Iron Type
Annual Tons
Electrical Btu/Ton (x 106)
Natural Gas
Btu/Ton (x 106)
O2
Equivalent Btu/Ton (x 106)
Coke Btu/Ton (x 106)
Propane Btu/Ton (x 106)
Fuel Oil Btu/Ton (x 106)
Total Btu/ton (x 106)
Total Tacit
Btu/Ton (x 106)
Cupola* Ductile - Pipe
750,000 0.58 3.12 0.009 ** 2.74 0.01 0.00 6.46 7.54
Cupola*** Gray 1,000,000 1.39 1.07 0.13 3.84 0.00 0.00 6.43 9.02
Cupola*** Gay and
Ductile 300,000 1.79 1.49 0.007 4.32 0.00 0.00 7.61 10.94
Induction*** Ductile 150,000 5.43 1.80 0.00 0.00 0.00 0.00 7.23 17.33 Induction*** Ductile 150,000 5.59 1.62 0.00 0.00 0.00 0.00 7.21 17.61 * Induction holding furnace after the cupola ** Estimated *** Green Sand Molding Note: Tacit energy for electrical generation is 2.86 times the measured usage. It’s been assumed that the tacit energy for coke and natural gas is “1” or unity.
Based on the information in Exhibit 3.49 (page 38), one can begin to state that this information in Exhibit 3.50 represents operations that are approaching “Best Industry Practice” and are not “typical.”
Discussion of Macro Results – Iron
There are several comments that need to be made when analyzing the data from the two tables:
1. Coke is more than a fuel for melting. Coke is also a source of carbon for the gray or ductile iron being produced in a cupola melting operation. Scrap steel is normally a significant part of the cupola charge and this steel only contains approximately 0.2-0.4 percent carbon. Gray iron contains 3.3-3.5 percent carbon and ductile iron will contain 3.5-3.7 percent carbon. The carbon requirements are primarily met by the coke, which contains 92-93 percent carbon. However, it usually takes 2-3 lb of coke to put 1 lb of carbon into steel.
2. Oxygen is used to increase the melt rate of a cupola. It can be used in levels ranging from two to 20+ percent of the air blown through the tuyeres at the base of the cupola. This increase in melt rate enables the foundry to melt more tons per hour from a given cupola and avoid capital expenditures for larger melting facilities, including a larger emission control systems. The ductile pipe operation that underwent profiling did not use an electric-powered holding furnace after the cupola. This may account for the difference in electrical use between the cupola operation summarized in Exhibit 3.49 vs. the ductile pipe data summarized in Exhibit 3.50, which is a composite of several similar pipe operations.
3. A ductile pipe operation takes less energy (6.8 tacit energy million Btu/ton) than either the gray iron or ductile iron cupola operations (134 and 143 tacit energy million Btu /ton respectively). This is due to the high yield of the centrifugal casting operation, as compared to the traditional green sand foundry operation.
39

This high yield is inherent in the centrifugal casting process because there is essentially no gating system or risers.
4. The smaller metalcasters are more energy intensive because of the economies-ofscale as compared to the larger facilities. This is because the smaller ferrous operations that were visited use an induction furnace to melt. The induction-melting facilities are more energy intensive than the cupola-melting facilities, regardless of tonnage, because they utilize electricity as their primary energy source. The cupola operations visited utilize coke as their primary energy source, which has less intermediate steps when compared to the electric furnaces.
5. The induction-gray iron facility primarily uses line frequency furnaces for melting. This older induction-melting technology requires that a molten heal be maintained in the furnace, even when there is no production. This is similar to the facilities that utilize horizontal or vertical induction channel furnaces for holding the molten iron after it leaves the cupola. These furnaces use power non-stop for up to 18 months before the furnace is shut down for major repairs. The more modern, current approach is to use medium-frequency batch melting. These furnaces can be emptied when it is not in use, i.e. over night or over weekends.
Micro Results – Ferrous
An analysis of the macro information shows that the energy to produce one ton of shipped castings far exceeds the energy required to melt the one-ton of iron for those castings. Because of the need for a runner system, risers, etc., approximately 1.6 tons of iron is melted for each ton of good castings. Beyond this practical minimum energy, is the other energy associated with charging the metal into the melter, efficiencies of the melting equipment, running emission control equipment, hydraulics associated with the molding machines, numerous motorized conveyors and associated finishing equipment. Heating the metalcasting facility in the winter is also a factor in the energy consumption equation. Other major electrical energy consumption is created by the need/use of compressed air.
Practical Minimum for Melting Iron for One-ton of Castings
The typical practical minimum energy (kW) per melted ton for induction and cupola melting is shown in Exhibit 3.51. This is only for the direct electrical or coke energy associated with melting. It does not take into account other necessary but still peripheral energy requirements, but is used as an example of the other factors influencing the total energy used by a metalcasting facility. It assumes a yield of 60 percent, the estimated minimum energy to provide molten iron is shown in the last column of Exhibit 3.51 (page 41). This only represents roughly 16 – 65 percent of the total energy consumed by the metalcasting facility. Note that these numbers are only used to illustrate a point and also do not apply to the pipe-making facilities, which have a yield of 90+ percent.
The cupola gray iron foundry produces a very large quantity of cores. It was also apparent in most facilities that there were considerable cost savings opportunities in the management of air systems and the use of air throughout the facilities.
40

Exhibit 3.51 Typical Energy to Melt One Ton of Molten Iron and Produce One Ton of
CastingsType of Melting
Energy Source
kWh/T on Coke Ton Btu/Ton Melted Btu per Ton of Castings
– Assuming a 60% Yield Induction Electrical 550 1,876,600 3,127,666
Cupola Coke 200 2,687,400 4,479,000
Steel
There are two major differences between the steel foundry in the south and the stainless steel foundry in the northeast.
1. Natural gas consumption for heat treating is 94 percent of the gas consumption for the steel southern foundry; but only 8 percent of the stainless foundry in the northeast.
2. Heating in the plant is a major factor for the stainless steel foundry. If one assumes a base-general plant use of about 850 million Btu/month and about 130 million Btu/month on the pattern meter, then heating uses 18,830 total million Btu/yr or about ½ of the total natural gas use.
The minimum energy to melt a ton of steel is essentially the same as that for cast iron. The balance of the energy use is consumed in the various areas of the foundry (metalcasting operation). All steel castings are annealed (heat treated), normally with gas-fired furnaces, and some of the castings may also undergo a quench and tempering operation.
41

Exhibit 3.52 Analysis of Annual Natural Gas Use by Ferrous Foundries
Facility Type Tons**
Natural Gas Btu
(x 106)
Facility Ft2
Btu/Ft2
(x 106) Btu/Ton (x 106)
Melting Department Btu (x 106)
Heat Treating
Btu (x 106)
Plant Heating
Btu (x 106)
Cupola-Gray Iron
87,500 207,246 312,000 0.66 2.37 140,304* 0 66,942
Cupola-Ductile Iron
103,000 203,222 386,700 0.53 1.97 71,850 26,842 97,997
Cupola-Ductile Pipe
206,000 544,986 360,135 1.51 2.65 402,000 140,000 3,300
Induction– Gray Iron 13,250 87,369 126,380 0.69 6.59 23,219 0 64,150
Induction– Ductile Iron
5,510 33,736 44,000 0.77 6.12 7,020 0 26,716
Induction– Stainless Steel
900 29,616 110,000 0.27 32.91 13,265 4,648 4,908
Induction-Steel
2,700 27,985 64,200 0.44 10.36 -- 26,306 --
Arc- Steel 3,230 37,106 110,000 0.34 11.48 3,711 18,553 4,824 * Based on extrapolated summer usage – assuming no general plant heating ** Average for 1-3 years.
42

IV. Non-Ferrous Castings
Shipments of non-ferrous castings are estimated to be 2.830 million tons in 2002 and grow at an annual rate of 2.3 percent to 3.550 million tons in 2012.19 This includes all aluminum, magnesium, copper, zinc, and minor amounts of other non-ferrous alloys such as cobalt, titanium, and nickel-base castings.
Energy profiles were developed for eight non-ferrous metalcasters with on-site efforts by one of the DOE/ITP sponsored Industrial Assessment Centers (IAC), accompanied by the Project Manager, Robert E. Eppich. Exhibit 4.1 summarizes the types of the facilities that were visited. The remainder of this section describes:
• Types of facilities visited, • Profiles individual ferrous-casting facilities analyzed, • Discussion of Melt Loss – Dross at some of these facilities, and • Provides observations and recommendations on energy efficiency in non-ferrous
casting facilities.
A. Types of Facilities Visited
As compared to the gray & ductile iron industry where the molding media is virtually always green sand, the product engineer designing a non-ferrous casting has a number of metalcasting process choices. The following are the types of non-ferrous facilities visited:
1. Lost foam casting 2. Green sand/permanent mold casting 3. High pressure die casting
Each process offers some unique characteristics and cost structures. In general, the mechanical properties of nonferrous alloy are improved (stronger) by cooling the alloy faster during solidification. The tensile and yield strengths of an alloy produced in green sand will be lower than the same alloy produced via permanent mold or high-pressure die casting. However, the
Exhibit 4.1 Non-ferrous Facilities Visited
Type of Metalcasters Alloy Product Produced High-Pressure Die Casting Aluminum General commercial
castings High Pressure Die Casting
Aluminum General commercial castings
Permanent Mold/ Sand – Air set & Green Sand (GS)
Aluminum General commercial castings
Lost Foam Aluminum Automotive – blocks & heads
High-Pressure Die Casting
Magnesium Automotive valve covers
High-Pressure Die Casting Zinc General commercial
castings Green Sand (GS) Copper Pumps & fittings Green Sand (GS) Induction
Copper Pumps & fittings
19 Kirgin, Ken, 2003 – AFS Metalcasting Forecast & Trends, Compiled October 2002 for AFS by Stratecasts, Inc, pg 19.
43

tooling costs for a die casting will be higher than those for green sand patterns or the permanent mold. On the other hand, lost foam allows the designer to create configurations that cannot be achieved with any of the other processes, thus several expensive machining steps can be avoided.
Better dimensional tolerances can be obtained with high-pressure die casting as compared to the other processes. Details on these processes, including the dimensional attributes of each process, can be found in American Foundry Society (AFS) and North American Die Casting Association (NADCA) publications.
B. Non-Ferrous Facility Profiles
This section profiles individual nonferrous metalcasting facilities. Profiles include an overview of operations followed by a discussion of electricity, natural gas, and compressed air usage in each facility.
B.1 Aluminum High Pressure Die Casting
Overview of Operation: Two high-pressure die casting facilities underwent evaluation/assessment. Both of these facilities are family-owned, job-shop-type facilities in the Midwest. One of the facilities receives molten metal in 15,000 lb ladles and transfers the metal directly to a reverberatory holding furnace. The other facility uses ingot as the metal source. Both facilities re-melt their gating systems and defective castings. Aluminum metalcasters often degass the molten aluminum prior to casting the molten alloy to remove dissolved hydrogen gas from the melt. Occasionally, the metalcaster will filter the metal to remove aluminum oxide dross that is entrained in the molten alloy.
Each of the high-pressure die casting facilities produces castings that average around four pounds. One facility has 18 die casting machines, ranging in size from 400 ton clamping capacity to 900 ton clamping capacity. The other die casting facility has 12 machines, ranging from 400 to 1,000 tons.
A typical process flow analysis of an aluminum die casting facility is shown in Exhibit 4.2. Some facilities use aluminum alloys that deliver molten metal in large covered ladles from the secondary smelter. The practical range for this type of delivery is about 150 miles. Most of the larger melting furnaces are gas-fired, whereas the holding furnaces may be either gas-fired or electric-resistance heated.
44

Exhibit 4.2 Schematic of Typical Aluminum Die Casting Operation
Melting Furnaces Natural Gas
Holding Furnace
Hand Ladle or Robot Natural Gas
or Electricity
Die Cast Machine Scrap Castings
Dross
Secondary Smelter
Electricity
Cooling Water
Manual or Robotic Placement into
Baskets
Trim Press or
Manual Removal of Gates
Scrap - includes castings, runner system
and flash
Undersize scrap to Secondary Smelter
Additional Operations (drilling tapping, machining)
Final Inspection
Shipping
Aluminum High Pressure Die Casting Facility 1
Electricity Consumption: Natural gas is used for melting and holding the aluminum. Thus the primary use of electricity is for powering the die casting machines, air compressors, lighting, and also the machining operation. The monthly electricity load profile is shown in Exhibit 4.3, which illustrates that electrical energy demand is relatively flat year-round.
Exhibit 4.3 Monthly Load Profile for Electrical Energy at Aluminum
Die Casting Facility No. 1 Over a 12-Month Period
'000
kW
h
700.0
600.0
500.0
400.0
300.0
200.0
100.0
0.0 Apr May Jun Jul Aug Sep Oct Nov Dec Jan Feb Mar
45

Natural Gas Consumption: This facility receives virtually its entire alloy in the molten state in large covered ladles, which are transported via semi-trailers from the smelter. The alloy is initially held in gas-fired reverberatory furnaces and then transferred to smaller gas-fired holding furnaces, which are positioned at each die casting machine. At this particular facility, there are 18 die casting machines and therefore there are 18 gas-fired holding furnaces. The facility is located in the Midwest, and there is some impact of seasonal heating, as reflected in Exhibit 4.4, which
Exhibit 4.4 Monthly Load Profile for Natural Gas at
Aluminum Die Casting Facility No. 1 Over a 12Month Period
0.0
1,000.0
2,000.0
3,000.0
4,000.0
5,000.0
6,000.0
7,000.0
AprMay Ju
n Jul
Aug Sep OctNov Dec Ja
nFeb Mar
Mill
ion
Btu
illustrates the monthly load profile for actual gas consumption over a 12-year period.
Even though die casting facilities exhaust through roof top ventilators, they do not move the tremendous quantities of air through scrubbers/bag houses that are typical of ferrous facilities. Thus die casting facilities do not make as extensive use of gas-fired air makeup units as do the ferrous operations.
Exhibit 4.5 summarizes the facility natural gas use compared to production and facility square footage.
Compressed Air: Compressed air plays a much smaller role in die casting operations, as compared to more sand cast foundry operations (represented by the ferrous foundries and the lost foam profiles). It is used for spraying die lubricant on the dies between cycles and to blow loose flash and trim from the equipment. All other equipment, except for a few occasionally-
Exhibit 4.5 Analysis of Natural Gas Use in an
Aluminum High-Pressure Die Casting No. 1 Facility
(Million Btu) Annual
Natural Gas Facility ft2 Btu/ft2
Usage Btu 57,525 130,000 0.44
used pneumatic cylinders associated with the furnaces, are hydraulically powered. Die castings are typically passed through trim dies to remove flash, and only very seldom are air-powered hand tools used to finish a casting. Table 4.6 summarizes the compressed air usage at this facility.
Exhibit 4.6 Analysis of Compressed Air Usage by
Aluminum High-Pressure Die Casting Facility No. 1Number of
Compressors Compressed
Air hp Annual lbs. hp/lb. Facility ft2 hp/ft2
2 175 3,424,000 0.00005 130,000 0.0013
46

Jul-01
Aug-01
Sep-01
Oct-01
Nov-01
Dec-01
Jan-02
Feb-02
Mar-02
Apr-02
May-02
Jun-02
Aluminum High-Pressure Die Casting Facility No. 2
Overview of Operation: This facility is smaller than sample facility No.1, and does not operate an on-site machining facility. This die casting operation is also located in the Midwest. This facility does not use molten aluminum alloy directly from the smelter, but takes the more traditional pre-alloyed ingot approach. Ingot is shipped to the die caster with a certified analysis, and the die caster simply melts the alloy. This facility has 12 die casting machines, and produces die castings for the commercial market.
Electricity Consumption: Since all melting and holding furnaces are gas-fired, electrical use at this facility is typically used for powering the die casting machines, air compressors, and other associated electric powered equipment, such as trim presses. The monthly summary of electrical use is given in Exhibit 4.7. The exhibit shows the relative flatness of electrical usage throughout the year, and also between the on- and off-peak usages. This is to be expected by the nature of the die casting process. Total electrical use during the referenced period was 1.99 million kWh. An analysis of energy use during the die casting cycle as a function of size of the casting was performed on seven machines. This information is summarized in Exhibit 4.8, and is expected to be typical of the industry.
Exhibit 4.7 Monthly Load Profile for Electrical Energy at Aluminum Die Casting
Facility 2 Over a 12-Month Period
On-Peak (kWh) Off-Peak (kWh)
120,000
100,000
80,000
60,000
40,000
20,000
0
Ene
rgy
Usa
ge (k
Wh)
47

Exhibit 4.8 Electric Energy Used by the Die Casting Machine to Produce an Aluminum Die Casting
at Facility - 2
Machine Shots/hr Castings
“on” Net
lbs/part Gross
lbs./part
Part yield
% kWh
Average kW
Net lbs/hr
Gross lbs/hr
kWh/ net lbs.
KWh/ gross lbs.
KWh/ yield
1 62 6 0.43 4.274 60 1,830 30.5 160 265 11.4 9.9 4.5 2 44 3 0.48 2.120 68 1,074 17.9 63 93 16.9 11.5 5.4 3 65 1 2.20 3.400 65 2,671 44.5 143 221 18.7 12.1 6.6 4 39 2 2.64 9.138 58 2,813 46.8 206 356 13.7 7.9 5.8 6 134 20 0.02 0.624 64 698 11.6 54 84 13.0 8.3 4.7 7 75 4 0.47 2.080 90 1,886 31.4 141 156 13.4 12.1 1.3
Average Standard Deviation
14.5 10.3 4.7 27.0 2.4 1.8
Natural Gas Consumption: Natural gas is used for both melting the aluminum alloy ingot and holding the molten alloy at the 12 smaller furnaces in front of each die casting machine. These furnaces each hold 1,690 lb of molten aluminum. The alloy is melted in four reverberatory type furnaces. This facility generated specific “micro” information on two re-melting furnaces, with a current holding capacity of 17,750 lb. One furnace was considered to be in the later stages of its normal life prior to rebuilding. The other furnace was considered to be in “fair” shape. The information in Exhibit 4.9 was obtained in both one-hour melting tests and extended holding tests.
Exhibit 4.9 Aluminum Melting Furnace Performance Tests at Facility – 2
Furnace Description Capacity Furnace
Condition
Test 1 – Melting Btu/lb.
Test 2 – Melting Btu/lb.
Holding Btu/lb/hr.
A Reverb 17,750 Poor 1,015 1127 26.3 B Reverb 17,750 Fair 885 975 25.3 C Stack 7,286 Good 703 24.8
The impact of furnace condition is apparent. But the performance of a stackmelter design vs. the traditional reverberatory design is especially evident. The monthly natural gas use is not influenced significantly by seasonal heating requirements at this facility, as illustrated in Exhibit 4.10. The next exhibit, Exhibit 4.11, illustrates the natural gas use per square foot of the facility.
Exhibit 4.10 Monthly Load Profile for Natural Gas at
Aluminum Die Casting Facility No. 2 Over a 12Month Period
Mill
ion
Btu
3,000
2,500
2,000
1,500
1,000
500
0
Jul Aug Sep Oct Nov Dec Jan Feb Mar Apr May Jun
48

Exhibit 4.11Compressed Air: Exhibit 4.12 shows Analysis of Natural Gas Use atthat compressed air is not a major factor in die casting facilities. It is used in Aluminum High-Pressure Die Casting spraying the die surfaces with die No. 2 Facility lubricant, but is used in little else other (Million Btu) than a few pneumatic cylinders. All flash removal is accomplished via
Annual Natural Gas
Facility ft2 Btu/ft2
hydraulic-powered trim presses. Usage Btu 27,847 42,200 0.66
Exhibit 4.12 Analysis of Compressed Air Usage by an Aluminum High-Pressure Die
Casting Facility 2 Number of
Compressors Compressed
Air hp Annual lbs. hp/lbs. Facility ft2 hp/ft2
2 100 2,203,130 0.00005 42,200 0.0023
B.2 Aluminum Permanent Mold/Sand Casting Facility
Overview of Operation: This facility is located in the Midwest and currently employs about 100 persons. It is a 3rd generation family-owned business, which is typical of the 100 employee-type companies in the metalcasting industry. This facility is primarily a green sand/permanent mold metalcasting facility, but it also utilizes the airset molding process for some of its production. The airset molding process is typically used for low production, larger castings. All of its production is sold to customers. This type of facility is therefore typically called a “job shop.” The metalcasting job shop terminology means that all of its production is sold to outside customers and that none of it is used internally to produce a final product.
The facility uses two small gas-fired reverberatory melters, along with a number of gas-fired crucible furnaces. The Exhibit 4.13majority, 80-85 percent, is 356
Monthly Load Profile for Electrical Energy ataluminum that is melted in the reverberatory furnaces. The an Aluminum Permanent Mold/Sand Casting remaining balances are Facility Over 12-Months aluminum 319 and 355 alloys, which are melted in the gas-fired crucible furnaces. This foundry, as most foundries of this size, uses pre-alloyed ingot from a secondary smelter. A significant percentage of the production is heat treated in three pit furnaces and one box furnace. The heat treatment is used to strengthen the casting.
0.0 50.0
100.0 150.0 200.0 250.0 300.0 350.0 400.0 450.0
Jan
Fe ar Ap yJu
n Jul
Au ctNo cb
Mp
Or
Ma gSe v
De
'000
kW
h
Several processes, including hotbox, shell, and the coldbox SO2 process, are used to produce cores. The airset sand is
49

reclaimed in a fluidized bed thermal reclaimer after undergoing some mechanical size reduction of the lumps. Overall this is a typical aluminum job shop.
Electricity Consumption: Electricity is used to power various pieces of equipment via hydraulics and pneumatics, but it is not used as a source of melting energy. However, four of the aging furnaces utilize electricity as a source of heat. Exhibit 4.13 summarizes Exhibit 4.14 the monthly electric use. Demand at this Analysis of Natural Gas Use atfacility is approximately 1MW.
Natural Gas: Natural gas is used as the energy source for two reverberatory furnaces of 10 million Btu/hr each and 10 crucible furnaces of 2 million Btu/hr each. There are also 12 space heaters and two small boilers. The crucible furnaces are older and appeared to be inefficient, which is typical of the older crucible furnaces. Exhibit 4.15 provides the information for comparing annual natural
Aluminum Permanent Mold/Sand Casting Facility
(Million Btu)
Annual Natural
Gas Usage**
Btu
83,208
Facility Btu/ft2
ft2
180,000 0.46
gas use vs. the size of the facility. Exhibit **Average annual use
4.15 summarizes the natural gas Exhibit 4.15consumption over a one-year period. Monthly Load Profile for Natural Gas at Aluminum
Permanent Mold/Sand Casting Facility Compressed Air: Compressed air is used for core production and also for powering the large pneumatic cylinders on the hand molding “squeezer” machines. It also powers the permanent mold machines. Exhibit 4.16 summarizes air use vs. production and size of the facility.
0 1,000 2,000 3,000 4,000 5,000 6,000 7,000 8,000 9,000
10,000
Jab
Mar Ap n Ju gSe t v
Dcn
Fe rMay Ju
lAu p
OcNo e
Mill
ion
Btu
Exhibit 4.16 Analysis of Compressed Air Usage by an
Aluminum Permanent Mold/Sand Casting FacilityNumber of
Compressors Compressed
Air hp Annual lbs. hp/lb. Facility ft2 hp/ft2
4 390 2,783,638 0.00014 180,000 0.0022
50
B.3 Aluminum Lost Foam Casting Facility
Overview of Operation: The lost foam aluminum casting facility is a large, part-specific facility located in the northeast. The facility was engineered to complement a total powertrain system and, thus, the full benefits of the lost foam process where design configurations can be incorporated that could not be used in other metalcasting processes. Incorporating such items as oil-passages into the casting can also minimize machining and drilling operations. The facility melts ingots and its own scrap returns as the sources for molten metal. This is a large, well-engineered facility with a plant-size of approximately 860,000 ft2. The lost foam patterns are produced on-site, aged and coated with refractory slurry. After drying under controlled conditions, the coated patterns and associated runner system are immersed in a fluidized bed of sand, which is vibrated into and around the pattern in a controlled manner. There are few emissions created during the casting process, and the sand, which contains condensed hydrocarbons from the volatilization/melting of the foam, is reclaimed and cooled; thus it is ready for the next casting cycle.
As seems to be typical of the large green sand facilities, compressed air is used extensively throughout the operation. The facility has 4,200 hp of compressed air capability, and is using about 3,000 hp at any one time. The facility employs about 600 employees and produces approximately 1.2 million engine blocks and heads per year.
The lost foam casting process was invented in the late 1950s. However it has only recently gained the technological understanding that has resulted in a quality level that meets today’s stringent requirements. Exhibit 4.17 visually summarizes the lost foam process steps.
The major raw materials used in the process are expandable polystyrene beads, aluminum, and sand. The expandable polystyrene (EPS) beads arrive at the facility as small grains. This material is then expanded, thereby greatly reducing the density of the foam. The foam beads are molded in metal molds using pressurized steam. After a very specific aging period, the foam patterns are assembled into the casting pattern. The pattern pieces are hot-melt bonded together, and several patterns are typically attached to a tree to form a pattern cluster. The cluster is dipped in a refractory slurry and allowed to dry before being introduced into a fluidized bed container of sand or similar refractory material. Aluminum comes into the facility as ingots. These ingots are melted in gas-fired reverberatory or “stack-melting” furnaces, along with rejected castings and gating systems. The molten metal is transported by fork truck to the pouring lines. When the aluminum is poured into the refractory-coated pattern in the sand mold, the foam vaporizes/melts and the metal fills the pattern in the sand.
51

PROCESS FLOW - LOST FOAM CASTING
Exhibit 4.17 Process Flow
Lost Foam Casting Process
Pattern Molding
Bead Lubrication, Expansion, and
Pattern Aging
Pattern & Cluster
Cluster Coating
Cluster Drying
Metal Preparation
Sand Preparation
Cluster Set, Sand Fill & Compaction
Metal Pouring
Casting Cooling &
Cluster Extraction
Cluster Quench
Casting Degate
Casting Cleaning
Casting Heat Treat
Casting Finishing, Machining
Inspection & Shipping
After being poured and solidified, the sand is shaken off the cluster and quenched. The sand that is shaken off is reused, with some of it undergoing a reclamation process to remove hydrocarbons deposited during the pouring process. The casting is reworked from the cluster and cleaned to remove any remaining coating and sand. Castings are then heat treated to improve the mechanical properties, or strengthened and shipped to a different facility for machining.
Natural gas is used extensively for melting, holding, sand reclamation, heat treating, and space heating. Electricity is used for all manufacturing functions such as powering manufacturing equipment, lighting and HVAC
As is the case with the other non-ferrous metalcasting facilities, all furnace dross is sent to a secondary smelter for recovery of aluminum from the dross.
52

Electricity Consumption: Cool sand is a must for the lost foam process. Warm or hot sand will cause deformation and degradation of the foam pattern. Thus, there is significant electrical energy used to power the chillers for sand cooling. The total sand cooler capacity is 2,650 tons, and an additional 450 tons is needed for mold cooling. This is over 3.5 megawatts in the summer months. Other electrical use is typical for a metalcasting operation, and includes over 700 hp for ventilation and 1,000 hp for pumping water. The water is used for cooling. Exhibit 4.18 illustrates the electricity load profile for the facility over a one-year period. Total electrical usage during this
Exhibit 4.18 Monthly Load Profile for Electrical Energy at Lost
Foam Casting Facility Over a 12-Month Period
0.0
2,000.0
4,000.0
6,000.0
8,000.0
10,000.0
12,000.0
Jan Feb Mar AprMay Jun Jul
Aug Sep OctNov Dec
'000
kW
h
one-year period was 107,448,400 kWh. Electric demand ranged between 13.5 megawatts and 16.5 megawatts.
Natural Gas Consumption: The lost foam facility, which is in a cold winter season area, has the highest per ft3 gas consumption of the facilities that underwent assessment. This facility is of modern construction, with 30+ ft. ceilings. The facility uses natural gas for melting and heating. The facility has four gas-fired reverberatory furnaces and one gas-fired stack melter to provide molten aluminum to the molding lines. Exhibit 4.19 illustrates the distribution of natural gas use within the facility. Although plant heating represents a large portion of the gas demand, the majority of gas consumption is from process operations.
The monthly natural gas load profile is illustrated in Exhibit 4.20. The effect of both the seasons and production variations can be seen in the exhibit. The total gas use for the year, as shown in Exhibit 4.21,
Exhibit 4.19 Analysis of Distribution of Natural Gas Use at Lost Foam Metalcasting Facility
Plant Heating 20.8% Sand Processing 35.8% Steam Production 15.5%
Aluminum Furnaces
27.3%
Heat Treating 0.6% Total 100.0%
Exhibit 4.20 Monthly Load Profile for Natural Gas at a Lost
Foam Facility Over a 12-Month Period
0 20,000 40,000 60,000 80,000
100,000 120,000 140,000
Jan
Feb Mar AprMay Ju
n Jul
Aug Sep OctNov Dec
Mill
ion
Btu
53

was 1.2 Quads. Most facilities do not have gas meters in the various areas. The sand must be heated to burn off the condensed hydrocarbons resulting from the vaporization/liquefaction of the foam patterns. Steam is
Exhibit 4.21 Analysis of Natural Gas Use in an
Aluminum Lost Foam Casting Facility (Million Btu)
Annual Usage Btu Facility ft2 Btu/ft2
1,173,722 862,000 1.36
required for the expansion of the beads to create the patterns.
Compressed Air: Air is used at a number of points in the process, ranging from blowing the foam patterns to fluidizing the sand. Exhibit 4.22 provides an approximate summary of where compressed air is being used in this aluminum lost foam metalcasting facility. Exhibit 4.23 illustrates the compressed air usage in comparison to the pounds reduced and the square footage of the facility.
Exhibit 4.22 Analysis of Distribution of Compressed Air Use At a Lost Foam Metalcasting Facility
Area % of Consumption Lost Foam 23.0 Patterns Pattern Assembly 2.4 Molding Lines 13.0 Desiccant Driers 17.7 Bead Blaster 31.0 Air Leaks 5.8 Finishing 2.0 Other – Misc. 5.1 Total 100%
Exhibit 4.23 Analysis of Compressed Air Usage by an Aluminum Lost Foam Casting
FacilityNumber of
Compressors Compressed
Air hp Annual lbs. hp/lb. Facility ft2 hp/ft2
7 4200* 33,792,000 0.00012 862,000 0.0049 *normally running 3000 Hp
B4. Magnesium Die Casting Facility
Overview of Operation: One magnesium die casting facility underwent the profiling process. This metal is seeing increased application in the automotive/transportation industry as a means of reducing weight, and therefore improving fuel economy.
Exhibit 4.24 Comparison of Physical Properties of Two Aluminum and Magnesium Die
Casting Alloys
Alloy Density lbs/in3
Melting Range (ºF)
Specific Heat Btu/lb (ºF)
Thermal Conductivity Btu/ft hr (ºF)
Heat of Fusion Btu/lb.
Aluminum 360
0.095 1,035-1,105 0.230 65.3 167
Magnesium AZ91D 0.066 875-1,105 0.250 41.8 160
54

However, it still represents only a very small percentage of the total weight or number of metalcastings produced in the United States. The differences in physical properties, including density and melting temperature, are summarized in Exhibit 4.24. Magnesium is about two-thirds the density of aluminum, melts at about the same temperature, and has about two-thirds the thermal conductivity of aluminum.
Exhibit 4.25 illustrates the energy use for this facility during 2001 and 2002. Since only one magnesium die caster was visited, the data for two different years is shown separately. As shown in the Exhibit 4.25, electricity per pound of casting declined from year one to year two, and natural gas per pound rose.
Exhibit 4.25 Energy Use by a Magnesium Die Caster
Year Annual
Production (lbs.)
Total kWh Electrical kWh per
lb.
Electrical Btu per
lb.
Total Natural
Gas (x106
Btu)
Natural Gas Btu per lb.
Total Btu
per lb.
Total Tacit
Energy Btu
per lb. 2001 3,931,097 11,876,000 3.02 10,308 9,565 2,433 12,741 31,913 2002 4,313,080 11,784,000 2.73 9,322 15,508 3,596 12,918 30,257
Electricity Consumption: The distribution of electrical use at a magnesium die caster is summarized in Exhibit 4.26. One-third of the electricity consumed is for melting and holding Exhibit 4.26 the magnesium. The die casting portion of the operation directly consumes 35.44 percent of total electricity. The compressed air, exhaust fans, and cooling towers consume approximately 13.44 percent of total electrical energy used during the one-year period. Secondary machining and assembly operations use 15.72 percent of total energy.
Natural Gas Consumption: The very minimal amount of process natural gas usage is illustrated in Exhibit 4.27. Process usage consists of a few gas torches. However the very high usage during the heating months is reflected in the illustration. This facility is located in the lower Midwest. This die casting facility exhausts all emissions associated with the application of die lubricants by using excellent hoods over the die casting machines. Thus, significant amount of natural gas is needed for heating during the cool/cold months. The difference between 2001 and 2002 is related to weather conditions.
Distribution of Electricity Use at a Magnesium Die Caster
Area kW % of Electricity Use
Furnaces 3,111,817 33.13 Ingot Loader 466,560 4.97 Die Heaters 568,996 6.06 Die Cast Machines
1,977,696 21.05
Trim Presses 315,360 3.36 Air Compressors 643,680 6.85
Cooling Tower 449,894 4.79 Exhaust 168,966 1.80 Manufacturing Line #1
1,004,265 10.69
Manufacturing Line #2 186,624 1.99
Manufacturing Line #3
285,120 3.04
Other 214,439 2.28 Total 9,393,417 100.00%
55

Compressed Air: As is the case for the other die casting operations, the magnesium die casting facility uses far less air than the sand casting operations. All castings are handled with robots, and trimming of flash is accomplished with trim-presses. Air use is limited to blowing loose chips/flash from around machining and trims operations, along with air use associated with application of die
Exhibit 4.27 Monthly Load Profile for Natural Gas at a Magnesium
Die Caster, Comparing Two Years
Natural Gas Usage - 2001 & 2002
0
1, 00 0
2, 00 0
3, 00 0
4, 00 0
Jan
Fab
Mar Apr May
Jun Ju
l Aug
Sep
Oct Nov
Dec
Month
Mill
ion
Btu
2001
2002
lubricants. Exhibit 4.28 summarizes air use in the same manner as was presented for other metalcasting facilities.
Exhibit 4.28 Analysis of Compressed Air Usage by a Magnesium Die Casting
Facility
Year Number of Compressors
Compressed Air hp
Annual lbs.
hp/lbs. Facility ft2 Hp/ft2
2001 2 300 3,931,097 0.00008 59,655 0.005 2002 2 300 4,313,080 0.00007 59,655 0.005
B5. Copper-Base Casting Facility 1
Copper-Base Casting: Two copper-based metalcasting facilities were part of the profiling effort to represent “typical” facilities. The copper-based metalcasting industry in the United States is not represented by the super-large facilities that one finds in the ferrous, or even some of the aluminum metalcasting facilities. These copper-based facilities tend to be operations that are a typical 50-100 person facility that is still family-owned. The markets are usually pump/plumbing/valve-related, with some marine fittings or even propellers in the product mix. Induction melting is the choice of virtually all copper-base metalcasters. The typical furnace charge consists of pre-alloyed certified ingot and gating/risers/scrap castings of the same analysis.
56

Overview of Operation: Induction-melting is the choice of virtually all copper-based metalcasters, and because a number of different alloys are being cast, these induction-
Exhibit 4.29 Energy Use by Copper Casting Facility No. 1
Type of Casting Facility
Annual Production
lb.
Total kWh kWh/ lb.
Electrical Btu/lb.
Total Natural
Gas (x106
Btu)
Natural Gas
Btu/lbs.
Total Btu/lb.
Total Tacit
Energy Btu/lb.*
Green Sand
4,322,840 5,210,800 1.21 4,113 5,303 1,227 5,340 12,990
* Assumes U.S. average of 2.86 Electrical Btu
melting furnaces are much smaller than those found in the ferrous cast iron operations. Exhibit 4.29 summarizes the overall energy use for two copper-based metalcasting operations. Copper-based metalcasting Facility No.1 is the traditional green sand foundry, with about 70 employees. The foundry uses both manual squeezers and a
Exhibit 4.30 Monthly Load Profile for Electrical Energy at Copper
Casting Facility No. 1 Over a 12-Month Period
0.0 100.0 200.0 300.0 400.0 500.0 600.0
Jan
Feb Mar AprMay Ju
n Jul
Aug Sep OctNov Dec
'000
kW
h
semi-automatic molding machine. The production is both captive (used in their own product) and jobbing (sold to customers for their product).
Electricity Consumption: Since all metal is induction melted in either a 1000 kW furnace or a 350 kW furnace, these furnaces are the major consumers of electricity. Other electrical use is typical for a metalcasting operation, and includes molding machines, dust collection equipment, air compressors and grinding machines. Exhibit 4.30 shows the monthly electrical load profile. It is
Exhibit 4.31 Electricity Demand at Copper
Casting Facility No. 1
1.00 1.20 1.40 1.60 1.80 2.00
Jan
Feb Mar AprMay Ju
n Jul
Aug Sep OctNov Dec
Meg
awat
ts
quite flat and generally only affected by production.
57

The average monthly demand at this facility is 1.84 MW, and even though total production was showing a decline in the fall, the demand as shown in Exhibit 4.31 is very flat. This is indicative of most metalcasting operations. Once the switch is “turned on,” the electrical demand is established, whether it is for one shift, one day, or one month.
Natural Gas Consumption: This facility is located in a very moderate climate and space heating is not a factor for natural gas use. Gas use is focused on ladle preheating. Exhibit 4.32 illustrates the monthly natural gas profile, showing the seasonal variations of natural gas use.
It is apparent that space heating and the seasonal variations associated with it are virtually insignificant in this facility. The table in Exhibit 4.33 summarizes natural gas use vs. size of the facility.
Compressed Air: Air is used at the manual molding lines and for limited core production. Exhibit 4.34 shows the use of compressed air vs. production and the size of the facility.
B.6 Copper-Based Casting Facility No. 2
Exhibit 4.32 Monthly Load Profile for Natural Gas at Copper Casting Facility No. 1 Over a 12-Month Period
0.0 100.0 200.0 300.0 400.0 500.0 600.0
Dec Jan Feb Mar Apr May Jun Jul Aug Sep Oct Nov
Mill
ion
Btu
Exhibit 4.33 Analysis of Natural Gas Use in Copper Casting Facility No. 1
(Million Btu) Annual Natural Gas Usage Btu Facility ft2 Btu/ft2
5,303 80,820 0.066
Exhibit 4.34 Analysis of Compressed Air Usage at Copper Casting Facility
No. 1Number of
Compressors Compressed
Air hp Annual lbs. hp/lbs. Facility ft2 hp/ft2
2* 100 4,322,840 0.00002 80,820 0.001 Overview of *100 HP running 23hr/day, 50 HP running 3hr/day
Operation: Induction-melting is the choice of virtually all copper-based metalcasters, and because a number of different alloys are being cast, these induction-melting furnaces Exhibit 4.35 are much smaller than those found in the Distribution of Energy Use atcast-iron operations. This second facility uses six small 3,000 pound (400 kW) furnaces for
Electric Process 67.3% Gas Process 23.1%
Lights 1.7% Gas Heating 7.9%
Copper-base Facility No. 2 melting. They also use two-2, 000 pound coreless induction furnace. The charge material consists of pre-alloyed ingot and returns, which consist of gates, risers, and defective castings. The facility produces copper-based castings for water-related
58

applications. Both manual and semi-automatic green sand molding equipment is used to produce the molds. Typical coremaking facilities consist of both hotbox and coldbox
Exhibit 4.36 Energy Use by a Copper Casting Facility No. 2
Type of Casting Facility
Annual lbs. Total kWh kWh/ lb.
Electrical Btu/lb.
Natural Gas (x106
Btu)
Natural Gas
Btu/ lb.
Total Btu/lb.
Total Tacit
Energy Btu/lb.*
Green Sand
3,268,944 6,164,400 1.89 6,434 9,460 2,894 9,328 21,296
* Assumes U.S. average of 2.86 Electrical Btu
support of molding operations. Any dross that is generated is returned to a secondary smelter for reclamation. This amounts to about 6 to 7 percent of the total alloy purchased. The scrap rate at this facility was higher than is normally observed, and appeared to be a result of inadequate temperature control. Exhibit 4.35 provides an overview of the distribution of energy use at Facility No. 2. The overall energy use by this facility is summarized in Exhibit 4.36.
Electricity: Because electrical energy is the primary source of energy for melting, it accounts for over 67 percent of all energy usage. Exhibit 4.37 summarizes the electric use on a monthly basis. The earlier months reflect a low production level, and July is the normal shutdown period.
Exhibit 4.37 Monthly Electricity Load Profile at No. 2 Copper
Casting Facility Over a 12-Month Period kW
h X
1000
300.0 250.0 200.0 150.0 100.0 50.0 0.0
Nov Dec Jan Feb Mar Apr May Jun Jul Aug Sep Oct
Exhibit 4.38 Monthly Load Profile for Natural Gas at Copper Casting
Facility No. 2
0.0 200.0 400.0 600.0 800.0
1,000.0 1,200.0 1,400.0 1,600.0
Nov Dec Jan Feb Mar Apr May Jun Jul Aug Sep Oct
Mill
ion
Btu
Exhibit 4.39 Analysis of Natural Gas Use in Copper
Casting Facility No. 2 (Million Btu)
Annual
Natural Gas: Natural gas is used for preheating three gas ladle pre-heaters, space heating, and for the hotbox core machines. Exhibit 4.38 summarizes the monthly use of natural gas at No. 2 facility. The seasonal use of natural gas for space
Natural Gas Facility ft2 Btu/ft2
Usage Btu 9,460 100,000 0.095
59

heating is clearly evident. During the winter months, gas use is almost three times that of the summer months.
Compressed Air: Compressed air is used to power some of the molding equipment, core machines, and air-powered tools in the finishing/processing department. Exhibit 4.40 summarizes the air consumption vs. pounds of production and size of the facility.
Exhibit 4.40 Analysis of Compressed Air Usage at Copper Casting FacilityNumber of
Compressors Compressed
Air hp Annual lbs. hp/lb. Facility ft2 hp/ft2
3** 250 3,268,944 0.00008 100,000 0.0025 **100HP Backup
B7. Zinc Die Casting Facility
Overview of Operation: Virtually all zinc castings are produced by the die casting process. Because of the low melting point, ranging from approximately 700º F to 900º F depending on the specific zinc-base alloy, these alloys are easy to contain, and very thin sections can be produced at high machine-cycle rates. Zinc die castings are used extensively in automotive application, power tools, household appliances, and numerous other commercial/industrial applications.
The die casting facility that underwent the profiling/assessment process is located in the upper Midwest and represents a “benchmark” type facility. This particular facility also performs machining and assembly operations to their cast product. As is the case with most other die casters, the alloy is brought into the facility in the form of pre-alloyed ingot, which is melted in a central melter and then distributed to the individual die casting machines. At this facility, this transfer is accomplished with a central launder system, rather than ladle-by-ladle. In some cases, the ingot is actually melted at the die casting machine, much in the same manner as that for the magnesium die caster. However, in the case of the zinc die caster, as is the case Exhibit 4.41 for the aluminum die caster, Distribution of Energy Use,all runner systems are Electric & Gas remelted at the facility rather than sending this material
Electric Heaters
back to a smelter (secondary metal) operation. Heating
18%
Natural gas is used for the two large melting furnaces and to Chiller
maintain temperature in the 9%
central-launder system, which delivers molten zinc to 16
Compressors 5%
7%
conventional hot-chamber die casting machines. Natural gas is also used for space heating requirements. Electrical energy is used for heating all holding furnaces and associated accessories requiring thermal energy.
Furnaces 54%
7%
Lighting Air
60

Exhibit 4.42 Energy Use by a Zinc Die Casting Facility
Type of Casting Facility
Annual lbs.
Total kWh kWh / lb.
Electrical Btu / lb.
Total Natural
Gas (x106
Btu)
Natural Gas
Btu lb.
Total Btu / lb.
Total Tacit
Energy Btu / lb.*
Hot Chamber Die Casting
13,869,000 8,539,200 0.62 2,102 68,653 4,954 7,056 10,966
* Electrical Tacit Energy = 2.86
Exhibit 4.41 provides a summary of the distribution of all energy use by the zinc die casting facility. Because both electricity and natural gas are used in various portions of the melting/molten metal areas, this pie chart shows total energy use. Exhibit 4.42 provides the total energy use by this die casting facility, along with the total tacit energy.
Electricity Consumption: The monthly electrical use vs. production is shown in Exhibit 4.43. Notice the relative Exhibit 4.43insensitivity of production to Monthly Electrical Usage vs. Production at Zinc Die
energy use. Unless Casting Facility a facility or a particular machine can be shut down, electrical energy is being consumed 24-hours a day, seven days a week to maintain furnace temperatures.
Natural Gas: Exhibit 4.44 illustrates the monthly natural gas consumption vs. production. Natural gas is used as the primary melting source for about two-thirds to three-fourths of the production. Natural gas is also used for space heating. As illustrated in Exhibit 4.44, there is not a direct connection between gas consumption and production. Plant heating plays a significant role in month-to-month demand.
0
500,000
1,000,000
1,500,000
2,000,000
2,500,000
Dc
Jab
Mar Ap lAu t
Nve n Ju p
Oc onFe r
May Jug
Se
Ener
gy u
se in
Khw
and
Pro
duct
ion
inPo
unds Kwh
Pounds
61

Exhibit 4.44 Natural Gas Usage Vs. Production at Zinc Die Casting Facility
0 1,000 2,000 3,000 4,000 5,000 6,000 7,000 8,000 9,000
Dec Jan Feb Mar Apr May Jun Jul Aug Sep Oct Nov
Mill
ion
Btu
0
500,000
1,000,000
1,500,000
2,000,000
2,500,000
lbs.
Natural Gas Production
One can observe that the heating requirements add some increment Exhibit 4.45 to the gas requirements, but it is Analysis of Natural Gas Use at Zincmore typical of the die cast Die Casting Facilityoperations than the traditional foundries. To provide some (Million Btu)
additional perspective on natural gas use at a zinc die caster, Exhibit 4.45 summarizes the use vs. size of the facility.
3. Compressed Air: Compressed air continues to play a minor role in the zinc die casting facility as it does in other die casting facilities. Air is used for the application of die lubricant and a few other minor applications, some of which could be replaced with direct application of electrical energy. Exhibit 4.46 illustrates this point.
Exhibit 4.46 Analysis of Compressed Air Usage by a
Zinc Die Casting Facility
Annual Natural Gas Usage** Btu
Size of Facility ft2 Btu/ft2
68,653 115,000 0.60 ** Annual Average
Number of Compressors
Compressed Air hp Annual lbs. hp/lb. Facility ft2 hp/ft2
1 250 13,869,000 0.00002 115,000 0.0022
62

C. Melt Loss – Dross
Dross is inherent to non-ferrous metalcasting operations. It represents wasted nonproductive energy, and is sold back to the smelter for 10-20 percent of the original purchase price of the ingot. It must undergo an energy-intensive reclamation process. In some cases, the presence of any dross renders the entire container to be labeled “all dross.” Thus, the profitability of a nonferrous operation is definitely affected by the amount of dross generated at the facility and the way that dross is handled. For a number of metallurgical and thermodynamic reasons, dross is not an issue with ferrous metalcasting facilities.
1. Aluminum: Dross is generated as a result of melting and holding aluminum. All aluminum metalcasting facilities generate dross. This is different than the ferrous metalcaster, in which the great density difference between the molten iron and molten slag results in the slag floating on the iron surface, virtually free of iron. Metallic aluminum (Al) and aluminum oxide (Al2O3) have similar densities, and the high-melting point oxide does not float free of the molten aluminum. Melt loss (dross) in aluminum casting facilities ranges between 3-7 percent of the purchased pounds. This dross normally contains about 60-65 percent by weight of metallic aluminum. The quantity of dross can be minimized through melting with a stack-melter, utilizing the latest melting equipment and/or utilizing fluxes to “free-up” the metallic portion of the dross. However, a number of metalcasters expressed a reluctance to use fluxes because of environmental concerns. Thus, this dross is sent back to the smelter for recovery. However, all energy associated with the initial melting of the aluminum is lost and then the smelting process must heat the dross to extract the molten metallic aluminum.
2. Copper: Dross for the copper-based metalcaster is also a source of energy loss. It appears that the typical dross loss is in the range of 6-9 percent. This includes actual dross generated from the melting/holding operations, and also some miscellaneous material, such as grinding swarf. Both metalcasters reported a smelter recovery level of around 35 percent by weight copper.
3. Zinc: As it occurred with both the aluminum and copper-based metalcasting facilities, dross is not an insignificant consumer of energy. This zinc die casting facility returns approximately 6-8 percent of the original purchased ingot as dross. This dross is sold to the secondary smelter for approximately one-third of the original purchase cost. The dross contains 30 to 40 percent metallic zinc. There is reluctance at this and other die casters to utilize flux or other dross recovery techniques because of possible changes in chemistry of alloy, environmental concerns and other reasons. Again, dross recovery offers considerable cost and energy savings.
63

D. Results and Observations: Non-Ferrous
Even though this profiling effort only involved 15 metalcasting facilities, several conclusions and observations can be made from these carefully selected facilities. In the aluminum facilities, there were considerable differences in the energy use/lb of castings among the various facilities. Some of it is explainable, and some is not. For example:
1. The large difference in kWh/lb for the two high-pressure die casters is most likely because the first facility performs value-added work, such as machining, to a substantial portion of their die casting.
2. Both of the aluminum dies casting facilities were using gas-fired melting and holding furnaces. However, the first facility was receiving virtually all of its metal as a molten alloy from a local smelter, whereas the other facility had to melt some of their alloy into a molten state.
3. The lost foam facility had several energy-demanding procedures that are unique to the lost foam process. One of these is the need to cool the sand to room temperature so that thermally-induced pattern distortion in the sand-filled molds is avoided. The lost foam facility is also very large facility with high 30+ foot ceilings. This height is unusual, as compared to most traditional smaller metalcasting facilities, and contributes to an annual heating component that exceeds one million dollars.
4. Because of geographical location, the winter heating requirements were greatest for the lost foam facility and lowest for the second die casting facility. This shows how weather plays a role in natural gas use in many facilities.
An assumption was made when calculating the total tacit energy/lb. That assumption was that the amount of tacit electrical energy for all facilities was the same. In actuality, this is not the case, but the data has been normalized using the constant of 2.86, which averages all methods of electrical production, i.e. coal, nuclear, and hydro, in the U.S.20 Additional assumptions were made assuming a tacit energy of 1 for both natural gas and coke.
Electrical use at the five aluminum metalcasting facilities is shown in Exhibit 4.47. The No. 1 aluminum die casting facility also provides value-added machining to a number of its products, whereas the No. 2 die casting facility does no onsite machining. This is probably the major reason for the difference in electrical energy use, as compared to natural gas use. The permanent mold/sand facility does no machining at the facility. Thus, its electrical use is comparable to a pure metalcasting facility. However, natural gas use is substantially greater per pound of castings than that associated with the two die casting facilities. This facility uses a number of very inefficient gas-fired crucible furnaces, which are probably the major reason for the high gas use relative to the die casting facilities.
20 Choate, William and Green, John A.S., U.S. Energy Requirements for Aluminum Production: Historical Perspective, Theoretical Limits and New Opportunities, U.S. Department of Energy, February 2003, pg. 9.
64
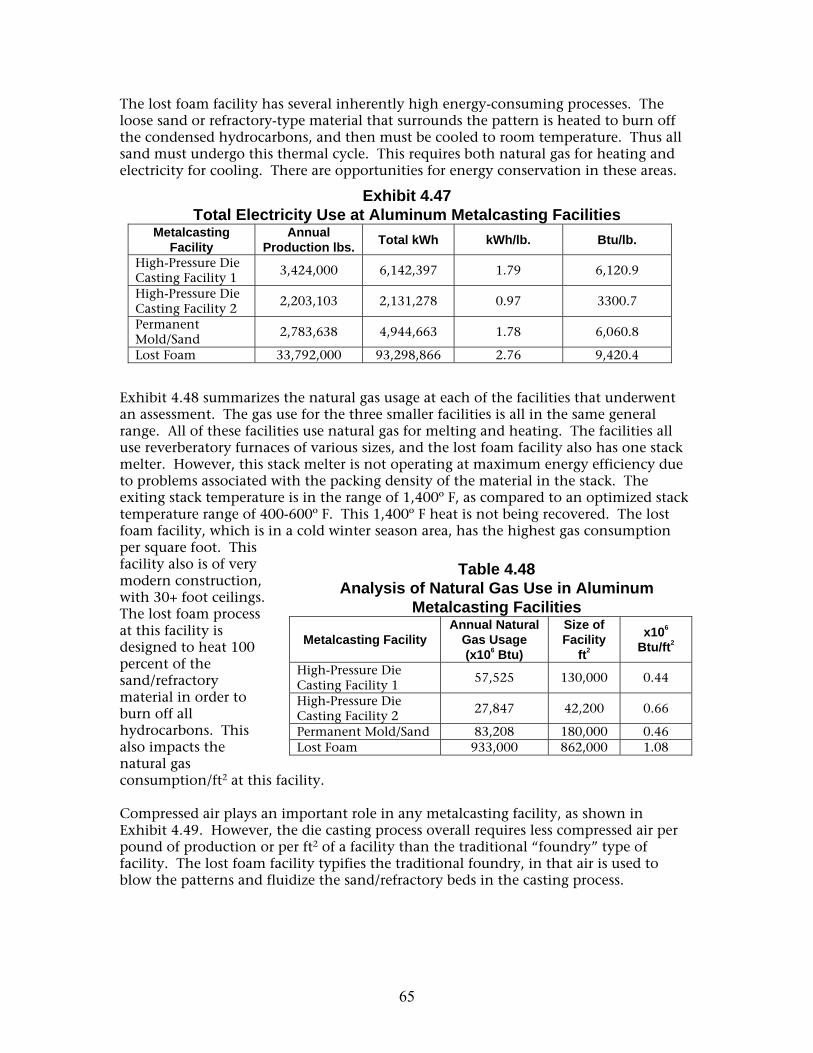
The lost foam facility has several inherently high energy-consuming processes. The loose sand or refractory-type material that surrounds the pattern is heated to burn off the condensed hydrocarbons, and then must be cooled to room temperature. Thus all sand must undergo this thermal cycle. This requires both natural gas for heating and electricity for cooling. There are opportunities for energy conservation in these areas.
Exhibit 4.47 Total Electricity Use at Aluminum Metalcasting Facilities
Metalcasting Facility
Annual Production lbs. Total kWh kWh/lb. Btu/lb.
High-Pressure Die Casting Facility 1 3,424,000 6,142,397 1.79 6,120.9
High-Pressure Die Casting Facility 2
2,203,103 2,131,278 0.97 3300.7
Permanent Mold/Sand 2,783,638 4,944,663 1.78 6,060.8
Lost Foam 33,792,000 93,298,866 2.76 9,420.4
Exhibit 4.48 summarizes the natural gas usage at each of the facilities that underwent an assessment. The gas use for the three smaller facilities is all in the same general range. All of these facilities use natural gas for melting and heating. The facilities all use reverberatory furnaces of various sizes, and the lost foam facility also has one stack melter. However, this stack melter is not operating at maximum energy efficiency due to problems associated with the packing density of the material in the stack. The exiting stack temperature is in the range of 1,400º F, as compared to an optimized stack temperature range of 400-600º F. This 1,400º F heat is not being recovered. The lost foam facility, which is in a cold winter season area, has the highest gas consumption per square foot. This facility also is of very Table 4.48 modern construction, with 30+ foot ceilings. The lost foam process at this facility is designed to heat 100 percent of the sand/refractory material in order to burn off all hydrocarbons. This also impacts the
Analysis of Natural Gas Use in Aluminum Metalcasting Facilities
Metalcasting Facility Annual Natural
Gas Usage (x106 Btu)
Size of Facility
ft2
x106
Btu/ft2
High-Pressure Die Casting Facility 1
57,525 130,000 0.44
High-Pressure Die Casting Facility 2 27,847 42,200 0.66
Permanent Mold/Sand 83,208 180,000 0.46 Lost Foam 933,000 862,000 1.08
natural gas consumption/ft2 at this facility.
Compressed air plays an important role in any metalcasting facility, as shown in Exhibit 4.49. However, the die casting process overall requires less compressed air per pound of production or per ft2 of a facility than the traditional “foundry” type of facility. The lost foam facility typifies the traditional foundry, in that air is used to blow the patterns and fluidize the sand/refractory beds in the casting process.
65

Exhibit 4.49 Analysis of Compressed Air Usage by Aluminum Foundries
Metalcasting Facility Number of Compressors hp Annual
lbs. hp/lb. Facility ft2 hp/ft2
High-Pressure Die Casting Facility No. 1
2 175 3,424,000 0.00005 130,000 0.0013
High-Pressure Die Casting Facility No. 2
2 100 2,203,130 0.00005 42,200 0.0024
Permanent Mold/Sand 4 390 2,783,638 0.00014 180,000 0.0022 Lost Foam 7 4,200* 33,792,000 0.00012 862,000 0.0049 * Normally running 3000 hp
Magnesium Die Casting Compared to Aluminum Die Casting: The magnesium die casting facility is different from a typical aluminum die casting facility in several ways:
1. Ingot is melted at each die casting furnace at the rate it is being consumed to produce magnesium die castings. In an aluminum facility, metal is always melted in a separate reverberatory or stack melter, and then transferred to the die casting machine.
2. The magnesium die caster melts only ingot. All scrap castings and runner/gating systems are sent back to the smelter to be reprocessed into ingot.
3. The magnesium die casting facility used electricity for melting/holding. Very little natural gas was used for process heating.
4. The facility is kept very clean to minimize the potential of ignition of miscellaneous magnesium turnings, flash from the die casting operation, etc.
In order to make some comparisons on the differences in energy consumption between magnesium die caster and aluminum die caster, Exhibit 4.50 has been included.
Exhibit 4.50 Comparison of a Magnesium and Aluminum Die Casting Facilities
(Based on Volume not Pounds)
Metalcasting Facility KWh/in3 Electrical Btu/in3
Natural Gas Btu /in3
Total Btu /in3
Total Tacit
Energy /in3
Magnesium Die Casting – Year 1 0.199 679 161 840 2,103 Magnesium Die Casting – Year 2 0.180 614 237 851 1,993 Aluminum Die Casting Facility No. 1 0.170 580 1,596 2,176 3,255 Aluminum Die Casting Facility No. 2 0.092 314 1,201 1,515 2,099
Copper-Based Casting Facilities:
Exhibit 4.51 provides some insight into the energy differences associated with the two copper-base facilities. The data shows Facility No. 2 is more energy intensive than Facility No. 1. The two facilities are relatively similar, except the primary melter for Facility No. 1 is a 1 Mw coreless induction furnace, and Facility No. 2 uses six 3,000
66

pounds 180 cycle coreless induction furnaces. Thus, the melting operation at No. 2 Facility is significantly less efficient than the 1 MW furnace at Facility No. 1.
Exhibit 4.51 Energy Use by the Copper Casting Facilities
Facility Type of Casting Facility
Annual lbs. Total kWh
Electrical KWh/lbs.
Electrical Btu/lbs.
Total Natural
Gas million
Btu
Natural Gas
Btu/lb.
Total Btu/lb.
Total Tacit
Energy Btu/lb.*
Copper-based Facility No. 1
Green Sand
4,322,840 5,210,800 1.21 4,113 5,303 1,227 5,340 12,990
Copper-Based Facility No. 2
Green Sand 3,268,944 6,164,400 1.89 6,434 9,460 2,894 9,328 21,296
* Assumes U.S. average of 2.86 Electrical Btu
Again, geographical location plays a role in natural gas consumption. Exhibit 4.51 and Exhibit 4.52 show that Facility No.2 is using almost twice as much natural gas as Facility No.1. Much of this difference is caused by the winter heating requirements at Facility No.2. Facility No.1 has virtually no winter heating requirement.
Air is used at Exhibit 4.52 the manual Analysis of Natural Gas Use in Copper Casting Facilities molding lines (Million Btu) and for limited core production. There is no single cause for the difference in compressed air consumption at the two facilities other than that the semi-automated molding line at No.1 is hydraulic powered, thus minimizing the need for compressed air, whereas most of the molding at the No.2 facility uses compressed air for the manual molding machines. Compressed air is summarized in Exhibit 5.53.
Annual Natural Gas Usage Btu
Size of Facility ft2 Btu/ft2
Copper-Based Facility 1 5,303 80,820 0.066 Copper-Based Facility 2 9,460 100,000 0.095
Exhibit 4.53 Analysis of Compressed Air Usage in Copper Casting Facilities
Metalcasting Facility
Number of Compressors hp Annual Lbs. hp/lb.
Facility ft2 hp/ft2
Copper-Based Facility No.1
2* 100 5,210,800 0.00002 80,820 0.00124
Copper-Based Facility No.2
3** 250 3,268,944 0.00008 100,000 0.0025
*100 HP running 23hr/day, 50 HP running 3hr/day ** 100 HP backup
67

Appendix
METALCASTING ENERGY PROFILE APPENDIX WITH ADDITIONAL DATA
Other Data
Exhibit A.1 summarizes data that was obtained, but was not part of the assessment procedure discussed earlier. This table illustrates the risks in obtaining data “long distance.” The data from two different, though similar facilities, exhibits a 13/1 difference in energy usage, and both are vastly different from data that was collected onsite and analyzed by the assessment teams. The data shown in Exhibit A.1 appears to be faulty and is being shown to illustrate the risks associated with the “long distance” approach. These data should not be used. Estimates were provide by each facility that attempted to give energy information for the die casting operations only, excluding office, finishing and machining operations. This “normalized” data is shown in Exhibit A.2. These two facilities utilized gas-fired reverberatory melting units and electric-heated holding furnaces at each die casting machine, whereas, all facilities shown in Exhibit 4.48 utilized gas-fired melting and holding furnaces.
Exhibit A.1 Total Energy Use by Two Non-Visited Die Casting Facilities (Data Supplied)
Facility Annual lbs. Total kWh Electrical
kWh/lb Electrical
Btu/lb.
Natural Gas
million Btu
Natural Gas
Btu/lb.
Total Btu/lb.
Total Tacit
Energy Btu/lb.
High-Pressure Die Casting 1A
14,800,000 97,688,125 6.60 22,521 44,790 3,026 25,574 67,437
High-Pressure Die Casting 2A
27,509,273 16,665,120 0.61 2,067 52,878 1,922 3,989 7,834
* Assumes U.S. average of 2.86 Electrical Btu
A-1

Exhibit A.2 Total Energy Use by Two Non-Visited Die Casting Facilities (Data ”Normalized”)
Type of Casting Facility
Annual Production
lb. Total kWh
Electrical kWh/lbs.
Electrical Btu/lb.
Natural Gas
million Btu
Natural Gas
Btu/lb.
Total Btu/lb.
Total Tacit
Energy Btu/lbs.*
High-Pressure Die Casting 1A
14,800,000 9,768,812 0.66 2,252 40,311 2,724 4,976 2,724
High-Pressure Die Casting 2A
27,509,273 15,498,561 0.56 1,922 50,234 1,826 3,748 1,826
* Assumes U.S. average of 2.86 Electrical Btu
The following table (Exhibit A.3) was developed using data loggers on seven aluminum die casting machines. This was done to provide some micro-data on the energy needed to operate only the die casting machine. No other energy needs were documented with data loggers at this facility.
Exhibit A.3 Electric Energy Used by the Die Casting Machine to Produce an Aluminum Die Casting
at Facility - 2
Machine Shots/hr Castings
“on” Net
lbs/part Gross
lbs./part
Part yield
% kWh
Average kW
Net lbs/hr
Gross lbs/hr
kWh/ net lbs.
kWh/ gross lbs.
kWh/ yield
1 62 6 0.43 4.274 60 1,830 30.5 160 265 11.4 9.9 4.5 2 44 3 0.48 2.120 68 1,074 17.9 63 93 16.9 11.5 5.4 3 65 1 2.20 3.400 65 2,671 44.5 143 221 18.7 12.1 6.6 4 39 2 2.64 9.138 58 2,813 46.8 206 356 13.7 7.9 5.8 6 134 20 0.02 0.624 64 698 11.6 54 84 13.0 8.3 4.7 7 75 4 0.47 2.080 90 1,886 31.4 141 156 13.4 12.1 1.3
Average 14.5 10.3 4.7 Standard Deviation 27 2.4 1.8
Exhibit A.4 shows specific shot-to-shot energy use from one of the machines shown in Exhibit A.3. It shows the instantaneous power required to produce a “shot” at the machine. Also note that the minimum power during the idle period does not go below about 14 kW. This illustrates the desirability of shutting down equipment during extended idle periods as one method of saving energy. The datalogger plays an important role as an analytical tool for gaining an understanding in energy.
A-2

Pow
er (k
W)
0.0
10.0
20.0
30.0
40.0
50.0
60.0
70.0
Exhibit A.4 Shot-to-Shot Electrical Energy Use by an Aluminum Die Casting Machine
8:30
:00
8:31
:39
8:33
:18
8:34
:57
8:36
:36
8:38
:15
8:39
:54
8:41
:33
8:43
:12
8:44
:51
8:46
:30
8:48
:09
8:49
:48
8:51
:27
8:53
:06
8:54
:45
8:56
:24
8:58
:03
8:59
:42
9:01
:21
9:03
:00
9:04
:39
9:06
:18
9:07
:57
9:09
:36
9:11
:15
9:12
:54
9:14
:33
9:16
:12
9:17
:51
9:19
:30
9:21
:09
9:22
:48
9:24
:27
9:26
:06
9:27
:45
9:29
:24
Exhibit A.5 is an attempt to take a “snapshot” of all of the electrical energy-consuming equipment at a single gray iron cupola facility. The data was then extrapolated to annual consumption. The energy data for the three induction furnaces was taken from meter readings at their respective control panels. Again, these are not absolute numbers obtained with data loggers, but information taken from instrumented kW readings at various control/power panels throughout the melting facility.
A-3

Exhibit A.5 Summary of the Electrical Energy Profile for the Gray Iron-Cupola Facility
System Power (kW) Annual Energy (kWh)
System Distribution
(%)
Total Distribution
(%) Charging
Bridge Crane E/W Travel 4.0 15,808 8.8 N/S Travel 3.5 13,832 7.7 Raise Lower 49.2 121,524 68.0 Magnet Lift 8.0 27,664 15.5 Total Crane 64.7 178,828 100 1.23
Metallic Feeders NW 5.0 24,875 NC 5.0 24,875 NE 5.0 24,875 SW 0.0 0 SC 0.0 0 SE 0.0 0 Total 15.1 74,626 0.51
Additional Charging Systems Cupola Feeder 3.4 16,584 7.8 Stone Feeder 0.5 2,488 1.2 Weigh Conveyor 6.7 33,167 15.6 Ferro Maganese Alloy Feeder
1.3 6,633 3.1
Charge Conveyor 20.1 99,501 46.7 Coke Feeder 0.7 3,317 1.6 Coke & Stone Hydraulic Unit 2.0 19,900 9.3
Skip Bucket Hoist 8.0 31,418 14.7 Total 42.7 213,008 100 1.47
Total Charging System 122.5 466,462
Cooling System Hot Well Pump 27.5 135,850 26.4 Cold Well Pump 50.7 250,458 48.6 Cooling Tower Fan 26.1 128,934 25.0 Total 104.3 515,242 100 3.55
Hot Blast Combustion Air Blower 19.4 95,836 4.8 West Spencer Turbine 376.4 1,859,272 93.2 East Spencer Turbine 0.0 0 0.0 Turbine Cooling Fan 8.0 39,520 2.0 Total 403.8 1,994,628 100 13.74
Emission System Emission Control Fan 631.3 1,559,344 75.0 Control Fan Cooling Fan 6.8 33,592 1.6 Wetcap Pump – South 57.0 281,580 13.5 Sunflow Pump – North 11.2 55,328 2.7 Booster Pump 7.2 35,568 1.7 Scrubber Pump – East 16.7 82,498 4.0 Mist Elm. Pump – South 6.2 30,628 1.5
A-4

Total 736.4 2,078,538 100 14.32 System
Melting Dust Collector 128.0 632,320 4.36
Ancillary Motors Afterburner Comb. Blower 4.5 22,230 15.0 Wetcap Tank Exhaust Fan 1.7 8,398 5.7 Substation (I&M) Vent. Fan
1.6 7,904 5.3
Substation (G) Vent. Fan 0.7 3,458 2.3 Melting Makeup Air Unit 21.0 10,740 70.0 Wetcap Conveyor 0.5 2,470 1.7 Total 30.0 55,200 100 0.38
Furnace 1 Peak Period 489.7 2,419,121 89.8 Power Reduction
Low 53.5 96,856 3.6 High 489.7 177,810 6.6
Total 2,693,787 100.0 18.55 Furnace 2
Peak Period 493.6 2,438,224 91.8 Power Reduction
Low 53.2 120,444 4.5 High 493.6 97,456 3.7
Total 2,656,124 100 18.30 Furnace 3
Peak Period 485.1 2,396,544 41.9 Power Reduction 485.1 630,669 20.9 Weekend Operation 125.0 312,000 37.2 Total 3,339,213 100 23.0
Furnace Hydraulics (Ancillary) Hydraulic Unit – Furnace 1 3.6 17,784 41.9 Hydraulic Unit – Furnace 2 1.8 8,892 20.9 Hydraulic Unit – Furnace 3 3.2 15,808 37.2 Total 8.6 42,484 100 0.29
Ancillary Motors Irvin Trough Exhaust Fan 3.4 16,584 38.3 3rd Deck Charge Wall Fan 3.9 19,266 44.5 Coke and Store Hopper Doors
1.5 7,410 17.2
Total 8.8 43,260 100 0.30
Total For Facility 3,010.8 14,517,258 100%
A-5