Embed Size (px)
Citation preview

8/7/2019 IT_Mid_Caps_The_Untold_Story
http://slidepdf.com/reader/full/itmidcapstheuntoldstory 1/38
FEBRUARY 2006
Lakshmi Nambiar, Senior Associate
(+91) 80 5152 4088
Sector Report : IT IndustryMid-Caps: The Untold Story

8/7/2019 IT_Mid_Caps_The_Untold_Story
http://slidepdf.com/reader/full/itmidcapstheuntoldstory 2/38
+ Strong Growth Driven By Structural Shifts In Global IT Industry:
The Indian IT industry is witnessing rapid growth as leading Indian IT
companies globalize their operations, IT multinationals enhance their offshore
presence and as players move up the value chain, offering services like design
conceptualization and implementation, product co-development and IT
infrastructure management.
+ Emergence Of Mid-Caps:
After going through a turbulent phase during the IT industry slowdownbetween 2001-2003, Mid-Caps have emerged larger and stronger. Mid-Caps
have taken bolder strategic decisions than Large-Caps, and have benefited by
them. Based on these strategies, Mid-Caps can be classified into four categories
Niche Service Providers, Multi-Domain Players, Consolidators, and
Solutions/Product Providers.
+ Drivers Of Mid-Cap Growth:
A three-year Compounded Annual Growth Rate (CAGR) analysis of Market Cap
of Mid-Cap companies, post the IT industry slowdown, indicates that
companies with a clear differentiated strategy have performed extremely well.
The strategies include one or a combination of the following - focusing on
intellectual property related products and services, developing leadership along
fast-growing niche markets, focusing on under-served markets and acquiring
strategically.
+ Differentiated Mid-Caps - A Compelling Proposition:
Mid-Cap Market Cap has grown dramatically compared to those of Large-Caps.
The difference is more compelling in the case of the Top 10 performing Mid-Cap
companies who have adopted a differentiated strategy and whose revenue
growth exceeds that of Large-Caps at comparable levels of profitability. The
median three-year CAGR in Market Cap (2002-2005) for Large-Caps was 32%,
compared with 37% for Mid-Caps and 65% for the top 10 performing Mid-Cap
companies.
+ The Road Ahead:
Going forward, we expect the Mid-Cap landscape to be action-packed, with a
number of mergers, acquisitions, private equity plays and public market
offerings, as companies try to move to the next level and fill the void between
the Large-Cap and the Mid-Cap players. (Revenues of the largest Mid-Cap player
in India are less than USD 200 million.) Also, as the level of risk capital available
increases over the next couple of years, we expect more product-centric
companies to grow into the Mid-Cap segment.
Sector Report : IT Industry
Mid-Caps: The Untold Story
Industry Coverage
Lakshmi Nambiar, Senior Associate
(+91) 80 5152 4088
Recent Reports- BPO opportunities in the US Residential
Mortgage Market
- Bioinfomatics
- Analysis of the Non-voice Back Office
Market in India
-The Indian Semiconductor Sector
8/7/2019 IT_Mid_Caps_The_Untold_Story
http://slidepdf.com/reader/full/itmidcapstheuntoldstory 3/38
Table of Contents
List of Exhibits
Executive Summary 01
The Indian IT Industry: A Snapshot 03
Mid-Caps: An Evolution 05
Mid-Caps: Building Market Competitiveness 06
Mid-Caps: Drivers for Growth 09
Differentiated Mid-caps: A Compelling Value Proposition 15
Mid-Caps: The Road Ahead 17
Appendix A: Company Specific Strategy of Top Ten Performers 18
Appendix B: Financials, Growth & Margins and Valuation Analysis 29
Exhibit 1: Indian IT Software and Services Revenues 03
Exhibit 2: Global Delivery Centers for Infosys, Satyam, TCS and Wipro 03
Exhibit 3: IT IPO's in Calendar Year 2005 07
Exhibit 4: Overview of Mid-Cap Landscape 07-08Exhibit 5: Market Cap CAGR Comparison for Mid-Cap Companies 09
Exhibit 6: Strategies of Top Performers 10
Exhibit 7: Emerging Service Offerings for Products 12
Exhibit 8: Acquisitions by Mid-Cap Companies in the Last Twelve Months 13-14
Exhibit 9: Market Cap CAGR for Large-Cap, Mid-Cap and the Top Performers 15
Exhibit 10: Median EBITDA and PAT Comparison 15
Exhibit 11: Median PAT Margin Comparison 15
Exhibit 12: Median Market Cap/Sales comparison 16
Exhibit 13: Median Market Cap/EBITDA Comparison 16
Exhibit 14: Median Market Cap/PAT Comparison 16
Exhibit 15: Private Companies That Might Go Public In The Near Future 17

8/7/2019 IT_Mid_Caps_The_Untold_Story
http://slidepdf.com/reader/full/itmidcapstheuntoldstory 4/38
Emergence of the Indian IT Multinational
Recognizing the impending competition from multinational IT
companies, large Indian IT companies have aggressively
expanded their global footprint over the last few years. They
now offer a Global Delivery Model (GDM) that enables them
to service diverse needs of their clients more effectively than a
“one-size-fits-all” approach. This will also help them hedge
their risks against rapid wage escalation in India and the
growth of other geographies like China and Eastern Europe as
more cost-competitive delivery options. Exhibit 2 illustrates
the emergence of the Indian IT multinational.
Global IT Vendors Embracing India
Indian companies face stiff competition from global IT
vendors (Accenture, IBM, EDS, Cap Gemini) who are
aggressively developing and enhancing their offshore delivery
capability. They are doing this through both organic growth
headcount as well selective strategic acquisitions. For
example, Accenture announced plans to increase its3headcount in India to 22,500 employees in fiscal year 2005 , a
growth of almost 50%.
Furthermore, global IT firms have started taking a long-term
strategic view on the Indian market to position themselves
well for the expected growth in the domestic IT market. IBM's
acquisition of Network Solutions, which provides it an entry
into the domestic IT Infrastructure Management business,
illustrates this early trend. This will create additional pressurefor Indian IT companies on their home turf, a market many
have neglected due to low revenue realizations.
The story of Indian IT Large-Caps is that of relentless
execution, supported by a strong global structural shift in1the IT industry, whereas that of the Indian IT Mid-Caps is
that of bold choices.
In this section, we take a brief snapshot of the Indian IT
industry.
It is a commonly accepted fact that the Indian IT industry
has leveraged offshore delivery capability to position India
as the 'go-to' IT destination in the world. This is evident in
the industry's double-digit growth rate, which validates the
compelling economics of offshore outsourcing.
As the industry assumed a larger scale, many predicted a
slowdown. However, the past year has proved to be a
watershed, as the industry has not only maintained itsmomentum for growth, but has also accelerated it. National
Association of Software and Service Companies (NASSCOM),
the premier Indian IT industry body, has estimated that the
Indian IT and BPO industry recorded revenues of USD 222billion in fiscal year 2005 (ending March 2005) . This
translates into a 32% growth, the highest since 2001, as
illustrated in Exhibit 1. This growth is underlined by certain
long-term structural shifts in the global IT outsourcing
industry as outlined below.
The Indian IT Industry: A Snapshot
Exhibit 1: Indian IT Software & Services Revenues
5
(US $ Billion)
FY04 FY05 FY06 (E)
30
25
20
15
10
0
3.6
3.9
5.2
12
4.8
9.2
15.2
7.3
6.0
ITES-BPO Exports IT Software & Services Exports Domestic Market
Exhibit 1: Indian IT Software & Services Revenues
Source: NASSCOM 2005 Report
Source: Avendus Research
Exhibit 2: Global Delivery Centers for Infosys, Satyam, TCS & Wipro
Infosys TCS SatyamWipro
1For the purpose of this report, we have segmented publicly listed Indian IT companies (comprising software services, products and training companies)
based on their market caps as follows:! Large-Caps : Companies with market cap of more than USD 1 billion! Mid-Caps: Companies with market cap between USD 100 million and USD 1 billion! Small-Caps: Companies with market cap of less than USD 100 million
Market Cap used to segment these companies is the 30-day trailing average as of December 30, 2005.
Besides listed companies, we expect several private companies to enter the mid-cap universe over the next couple of years through an IPO. Our analysis does not cover these companies,
though we have included a brief section on them in the report.2As per Nasscom 2005 Report
3Source: Financial Express: India is Accenture's Flagship Global Delivery Center - September 13, 2005

8/7/2019 IT_Mid_Caps_The_Untold_Story
http://slidepdf.com/reader/full/itmidcapstheuntoldstory 5/38
Scale And Offshore Leadership Is Enabling Indian IT Vendors
To Compete With MNCs For Large Global Projects
The year 2005 has seen leading Indian IT companies
breaking the glass ceiling and competing successfully with
IT multinational companies for large global projects. Two
factors have made this possible:
a. Offshore outsourcing of IT requirements has
assumed strategic importance for large global
corporations owing to its compelling cost-quality
equation.
b. Leading Indian IT companies have developed an
excellent track record and assumed a leadership
position for offshore delivery, making them 'go-to'
players for a company's offshore outsourcing
requirements. In addition, they have attained alevel of scale that enables them to compete
effectively for large multi-year IT contracts,
business that was previously ring-fenced by large
IT multinational companies.
Some examples of this trend include ABN Amro awarding a
USD 400 million, five-year contract to TCS, Infosys and Patni
for outsourcing of IT infrastructure, application support and4application development . More recently, General Motors
awarded Wipro a five-year contract that was valued at5around USD 300 million .
The significance of these contracts goes beyond size and
quality. It indicates an emerging trend towards unbundling
of large multi-year outsourcing contracts and distribution to
multiple vendors as opposed to the hitherto single-vendor
norm. This further increases the eligibility of Indian offshore
majors.
Movement up the Value Chain
Today, India as an offshore destination for IT services offers
more than just a cost proposition. Its demonstrated track
record of delivering global quality at low cost has enabled
the Indian IT industry to transition from being a lower-end
application development and maintenance services
provider to offering higher-end critical services like design
conceptualization and implementation, product co-
development and IT infrastructure management. This
validates the maturing of the Indian IT industry as a
provider of high-productivity, quality-driven services.
4Source: Company Website
5Source: Company Website

8/7/2019 IT_Mid_Caps_The_Untold_Story
http://slidepdf.com/reader/full/itmidcapstheuntoldstory 6/38
The IT industry has undergone significant changes as result
of the slowdown in the US economy in 2001. The sharp fall
in industry growth affected all IT companies adversely but
Mid-Caps were among the worst affected. In the last five
years, some companies (like DSQ, Pentafour and Silverline)
disappeared from the Mid-Cap IT landscape in India, while
some entirely new players emerged like Geodesic. Several
others took bold decisions and reorganized themselves
around strategies that could help them differentiate and
grow in highly dynamic and difficult market conditions.
Our analysis led us to classifying stages in the evolution of
Mid-Caps over the last five years into three distinct phases.
Phase 1: Unbridled Growth
Prior to the slowdown in the US economy in 2001, the
Indian IT sector enjoyed a phenomenal growth rate of morethan 60%. The scorching pace of growth was first led by the
Y2K wave, which was immediately followed by the Internet
hysteria.
With no demand constraints, medium-sized companies
adopted a carpet- bombing approach, claiming to offer
services in every vertical, technology or business practice.
These companies were also exposed to high customer
concentration and the US as the primary market for growth.
Lastly, the relative lack of competitive market pressure
made companies lose focus on creating differentiation and
on developing their sales capability.
Customers, on the other hand, adopted a diversified vendor
selection strategy by selecting different offshore suppliers
for each division. While this provided a large number of
projects for Mid-Cap vendors, revenues were mainly time-
bound, owing to their project-based nature. Coupled with
concentration of business around a few large clients left
Mid-Caps highly vulnerable to several business risks.
Phase 2: Challenged Growth
Phase 1 came to an abrupt halt with the slowdown in the
US economy in 2001, which severely affected the fortunes
of Indian companies and exposed the limitations of the
Indian model. This phase was characterized by:
+ Decline in the Industry Growth Rate: As customers in
the US started cutting back IT budgets, overall industry
growth fell from more than 60 per cent year-on-year to
around 35-40 per cent.
+ Margin Pressures and Increased Competition: Companies
faced margin pressures and gross profit growth reduced
dramatically as customers stopped being relationship-
oriented and began re-negotiating billing rates. As
customers threatened to withdraw future prospects if
billing rates were not brought down, companies were
forced to compete on price. Mid-Caps were the worst
affected because more often than not, larger companies
not only succumbed to pricing pressures but also started
competing for the smallest deals - mainly because
economies of scale allowed them to take a long-term
view of the customer relationship.
+ Business Model Challenges: Mid-Cap companies were
further challenged because more than 50% of their
revenues came from on-site work, which was under
severe pressure in terms of both volume and pricing. Insome cases, companies with high client concentration
saw a dramatic decline in revenues and profits due to a
loss of one customer.
Faced with the threat of being squeezed out of business, Mid-
Cap companies responded by streamlining operations and
devising strategies that helped them differentiate themselves,
which in turn, helped them survive and grow in a highly
dynamic market condition.
Phase 3: Focused Growth
By the end of 2003, the US economy started its path to
recovery and the third phase of the offshore outsourcing era
had begun. Large-Cap players scaled their business
dramatically by developing capabilities across multiple
verticals. Mid-Caps, on the other hand, focused on developin
a strong niche focus. This phase also witnessed the evolution
of new areas of outsourcing like product engineering services,
IT infrastructure management and software testing services.
Meanwhile, customers re-oriented their IT outsourcing
strategy by consolidating their vendor base and tightening the
norms for new vendor selection. These changes implied that
only large vendors or medium-sized companies with
specialization were positioned for growth.
In this report, we have tried to look at how Mid-Caps have
overcome the lack of scale leadership by adopting distinct
strategies in order to survive and thrive in a rapidly evolving IT
industry.
Mid-Caps : An Evolution

8/7/2019 IT_Mid_Caps_The_Untold_Story
http://slidepdf.com/reader/full/itmidcapstheuntoldstory 7/38
Mid-Caps : Building Market Competitiveness
The existing Large-Caps broke away from the pack in the
late 1990s to emerge as dominant market leaders. Around
this time, the rest of the Indian IT industry was highly
fragmented, with certain sources estimating that there
were more than 2,000 IT companies. In an industry where
scale came from qualifying for larger projects, which, in
turn, were awarded primarily to larger companies,
companies other than the market leaders were clearly
challenged for growth. As described in the previous section,
some of these companies focused on building strong niche
or domain differentiation to compete effectively. In this
section, we take a deeper look at some of these companies
and the strategies that have helped them survive and
thrive.
The publicly listed Mid-Cap landscape in India includes 23
companies with a cumulative Market Cap of USD 4.6 billion(based on a 30-day trailing average as of December 30,
2005). Exhibit 4 provides a summary listing of these
companies.
While the Mid-Caps constitute a fairly diverse universe, our
analysis provided insights that helped us classify them into
the following categories, based on the strategy they have
adopted to differentiate themselves:
1. Niche Service Providers: Some companies, such as
Aztec, and Hexaware, have diligently focused on developing
their capability around a specific niche with a goal to build aleadership position in that segment. For example,
Hexaware's positioning as a leading offshore ERP vendor
has helped it compete effectively with Large-Caps for large
ERP contracts.
2. Multi-Domain Players: This segment constitutes
companies that have achieved more than USD 50 million in
revenues by building capabilities across multiple domains.
Examples include companies such as KPIT Cummins, Mastek
and Zensar. While it is difficult to pinpoint a common
strategy adopted by these players, companies that have
developed a strong capability in a couple of high-growth
verticals and in some cases, a leadership position in one,
clearly stand out from the rest. For example, KPIT Cummins
enjoys a significant differentiation in the market owing to
its established track record in executing moderate-sized
manufacturing-related IT projects.
3. Consolidators: There seems to be an emerging segment
of players that are adopting a highly inorganic approach to
growing their businesses. Scandent Solutions is among the
first few that has relied largely on equal-sized mergers and
significant acquisitions to grow its business. Its merger with
SSI Technologies enabled the formation of a company that
leapfrogged into the Mid-Cap segment.
4. Solution/Product Providers: The surprise package from
our analysis was the product and solution providers. These
include companies such as Cranes Software, Geodesic and
Polaris, which have grown largely through a product-led
strategy. These companies seem to have defined their target
product/solution segments early and have aligned their
execution around this focus. One of the players, Cranes
Software, has acquired companies globally in a highly
methodical manner with a clear goal of enhancing its product
portfolio in the scientific products market.
In addition, there are a few other companies such as Sasken
and 3i Infotech that have listed their stocks on the capital
markets recently and are new additions to the Mid-Cap sector.
They have not been included in our analysis of Top Performing
Mid-Caps due to an inadequate track record of their stocks,
post listing.
Also, there are several privately held companies waiting to
break into the Mid-Cap segment. Amongst these, MindTree
Consulting and Caritor have witnessed significant growth in
recent times. While the former has positioned itself as one o
the only offshore vendors providing high-end systemsarchitecting capability, the latter has leveraged a couple of
large client relationships to build a USD 100 million+ revenue
company. Citigroup Venture Corporation (“CVC”) has recently
invested into the company.
We believe many more private companies will go public in the
next 24 months, thereby enhancing the depth of the Mid-Cap
sector. Calendar year 2005 saw nine IT companies list on the
Indian capital markets, the highest number after the Internet
hysteria in 1999-2000. Exhibit 3 lists all companies that went
public in 2005. For these companies, the median Market Cap
to-sales multiple was 2.85x and the Market Cap-to-earnings
multiple was 27.1x.

8/7/2019 IT_Mid_Caps_The_Untold_Story
http://slidepdf.com/reader/full/itmidcapstheuntoldstory 8/38
3i infotechwww.3i-infotech.com
Company Segment Key Focus Area Market Cap Revenue(TTM)
EBITDA(TTM)
Aftek Infosyswww.aftek.com
Aptech Ltd.www.aptech-worldwide.com
Aztec Software &Technology Serviceswww.aztek.com
Cranes Softwarewww.cranessoftware.com
Geodesic InformationSystemswww.geodesiconline.com
Product/Solution Provider
Product/Solution Provider
Niche Service Provider
Niche Service Provider(Product-Centric Services)
Product/Solution Provider
Product/Solution Provider
IT services company focused on BFSI,manufacturing, retail anddistribution space
Product cum services companyin the embedded space
IT training company
Product engineering company
Product-centric company inscientific and engineering space
Product company in thecommunication and collaborationspace
189
217
115
166
268
299
85
51
27
40
44
17
17
19
(5)
9
28
10
Exhibit 4: Overview of Mid-Cap Landscape
Continued on the next paMarket Cap is a 30-day trailing average, as on December 30, 2005.All figures in USD MillionSource: Avendus Estimates, CMIE Database, Company Annual Reports
*Revenue and PAT are for fiscal year prior to listingMarket Cap, Revenue, PAT in USD MillionSource: Avendus Estimates, CMIE Database
Change SinceListing as on
30 Dec 05
Company IssueOpening
Date
CapitalRaised
Revenue* PAT* MarketCap
MarketCap/Sales
Market/PAT
MarketCap
MarketCap/Sales
MarketCap/PAT
3i Infotech Apr-05 51.1 3.9 110.8 1.7 28.3 225.0 3.4 57.4 103%64.9
PrithviInformationSystems
Nov-05 30.0 6.3 113.4 1.7 17.8 136.0 2.0 21.6 21%67.8
Saksoft Mar-05 1.7 1.3 28.2 6.8 22.2 29.0 7.1 23.0 4%4.1
FCS Software Sep-05 3.9 2.5 55.7 2.9 27.1 34.0 1.8 16.6 -39%18.8
AurionproSolutions
Oct-05 6.0 0.5 25.6 13.4 48.5 23.0 12.0 43.6 -10%1.9
Paradyne Info Nov-05 3.1 1.1 18.2 1.2 16.4 19.0 1.2 16.9 4%15.2
CompulinkSystems
Dec-05 6.0 0.8 16.8 5.9 21 16.0 5.7 20.3 -3%2.8
KernexMicrosystems
Dec-05 22.0 2.0 87.1 7.5 43.7 78.0 6.6 38.9 -11%11.7
As on Listing As on December 30, 2005
Mid-Cap
Small-Cap
Exhibit 3: IT IPO’s in Calendar Year 2005
Sasken Sep-05 28.9 4.8 284.0 5.3 56.1 232.0 4.3 48.3 -18%53.3

8/7/2019 IT_Mid_Caps_The_Untold_Story
http://slidepdf.com/reader/full/itmidcapstheuntoldstory 9/38
Company Segment Key Focus Area Market Cap Revenue(TTM)
EBITDA(TTM)
Geometric Software
www.geometricsoftware.com
Hexaware Technologieswww.hexaware.com
iGATE Gobal Solutionswww.igate.com
Infotech Enterpriseswww.infotechsw.com
KPIT Cummins Infosystemswww.kpitcummins.com
Mastekwww.mastek.com
Mphasis BFLwww.mphasis.com
NIIT Ltdwww.niit.com
NIIT Technologieswww.niit.com/tech
Nucleus Software Exportswww.nucleussoftware.com
Polaris Software Labwww.polaris.co.in
Rolta Indiawww.rolta.com
Sasken CommunicationTechnologieswww.sasken.com
Scandent SolutionsCorporationwww.scandentgroup.com
Subex Systemswww.subexgroup.com
Visualsoft Technologieswww.visualsoft-tech.com
Niche Service Provider
(Product-Centric Services)
Niche Service Provider
Multi- Domain Player
Niche Service Provider
Multi-domain Player
Multi-domain Player
Multi-domain Player
Niche Service Provider
Multi-domain Player
Product/Solution Provider
Product/Solution Provider
Niche Service Provider
Consolidator
Product/Solution Provider
Product/Solution Provider
Niche Service Provider
Multi-domain Player
PLM software company
IT services company focused onairlines, HR IT, peoplesoft,insurance, testing and Assetmanagement solutions
IT services company focused on BFSIspace
IT services company focused on GIS,engineering design space
IT services company focused on BFSI,manufacturing space
IT services company focused on BFSI,telecom, education and governmentspace
IT services company focused onfinancial services, retail, logistics,transportation, technologyand healthcare space
IT training company
IT services company focused onfinance, retail, transport andmanufacturing space
Product company focused on BFSIspace
Product-cum-services companyin BFSI space
IT services company in engineeringservices, GIS and eSolutions space
135
314
158
158
111
168
528
127
140
138
290
288
235
136
186
106
100
47
147
129
71
65
140
199
92
109
30
183
88
51
71
37
41
78
11
23
13
14
8
24
49
11
22
11
18
41
6
12
11
9
13Zensar Technologieswww.zensar.com
IT services company focused onTelecom space
IT services company focused onmanufacturing, government, BFSIspace
Product company focused ontelecommunications space
Software solutions and productdevelopment company focusedon BFSI, retail and manufacturingspace
IT services and BPO company
Market Cap is a 30-day trailing average, as on December 30, 2005.All figures in USD MillionSource: Avendus Estimates, CMIE Database, Company Annual Reports
Exhibit 4: Overview of Mid-Cap Landscape

8/7/2019 IT_Mid_Caps_The_Untold_Story
http://slidepdf.com/reader/full/itmidcapstheuntoldstory 10/38
All Mid-Caps listed in the previous section are survivors of
the economic downturn witnessed during 2000-2002.
These companies have followed multiple growth strategies
but in most cases, it has been around a single foundation of
consolidation, niche services focus, product/solutions focus
or domain differentiation. In this section, we try to answer
the following questions:
+ Which are the top-performing Mid-Cap companies?
+ What is common among these top-performing
companies?
+ What lessons can be drawn from these top-performing
companies?
Top Performers
We have used Market Cap to compare the performance of
these companies. Our analysis excludes companies thathave recently listed on the capital markets, such 3i Infotech
and Sasken. We believe Market Cap is the most appropriate
metric for comparing companies as it takes into account
both, its past track record and future expectation of growth.
We have selected 10 companies that have outperformed
others, based on a three-year CAGR in their Market Cap.
This period provides a fair measure of the companies'
capabilities as it captures efforts made by them to deal with
extremely challenging market dynamics. The list of the top
ten companies is provided in Exhibit 5 (these companies
shall be referred to as “Top Performers” in the rest of the
report).
We have compiled the strategies adopted by each of the Top
Performers in Exhibit 6. Further details on each company
and their strategies are provided in the Appendix 1 to the
report.
As observed in Exhibit 6, five out of the Top Performers are
product companies, two are product-centric services
companies, two are niche services companies and one is a
multi domain player.
This data, in conjunction with an in-depth study of each
company, reveals some critical strategies adopted by most
of the Top Performers.
Strategy #1: Build a Product Either Your Own or Somebody
Else's
In the world of IT services companies, product-related
Mid-Caps : Drivers for Growth
companies seem to be positioned well for growth.
Companies such as Cranes, Geodesic, Nucleus, Subex and 3i
Infotech have demonstrated the ability of Indian companies
developing software products that have global applicability.
The capital markets have rewarded these companies with
attractive valuations that factor in the economics of product
plays.
Company Name
Geodesic
Cranes Software
HexawareTechnologies
Subex Systems
Aptech
K P I T CumminsInfosystems
Nucleus Software
Aftek Infosys
Aztec Software
GeometricSoftware Solutions
Mphasis B F L
ZensarTechnologies
InfotechEnterprises
Igate GlobalSolutions
Rolta India
Polaris SoftwareLab
Mastek
VisualsoftTechnologies
NIIT
3i Infotech
NIITTechnologies
Sasken
ScandentSolutions
2-yr CAGR inMarket Cap
268%
125%
84%
107%
62%
66%
149%
73%
132%
60%
22%
45%
57%
24%
33%
14%
10%
-8%
-11%
NA
NA
NA
NA
1yr CAGR inMarket Cap
353%
93%
44%
116%
63%
34%
248%
65%
240%
82%
0%
60%
122%
1%
70%
-23%
42%
4%
3%
NA
-5%
NA
-5%
3-yr CAGR inMarket Cap
211%
128%
125%
99%
68%
62%
62%
50%
45%
37%
32%
20%
12%
11%
6%
5%
4%
-10%
NA
NA
NA
NA
NA
All figures in USD MillionSource: Avendus Estimates, CMIE Database
Exhibit 5: Market Cap CAGR Comparison for Mid-Cap Companies

8/7/2019 IT_Mid_Caps_The_Untold_Story
http://slidepdf.com/reader/full/itmidcapstheuntoldstory 11/38
Geodesic InformationSystems Ltd.
Communication andcollaboration
Product/Solution Provider , Focused on the instant messaging space, Focused on constantly innovating product lines: Mundu,
its flagship product is the number 1 interoperable instantmessenger in the world
, Did three acquisitions in 2005 in technology companiesthat added to Geodesic's product range andfunctionality.
Cranes Software Intl. Ltd. Scientific and engineering Product/Solution Provider , Acquisition of under valued products, Enhancement of these products by leveraging the Indian
development center, Cross sell these products to their existing and new user
base, Acquired one company in 2005
IT Training Niche Service Provider , Focused exclusively on training from 2001
, Established a very strong brand- Second largest Indian ITtraining company.
, Focused on international Markets like China, Africa,Bangladesh, Latin America and Vietnam
, Focused on forming alliances with education institutes aswell as corporate for IT training
Aptech Ltd.
K P I T Cummins InfosystemsLtd.
BFSI, Manufacturing Multi-domain player , Focused on the verticals and domains includingadvanced technology solutions, information risk
, Focused on mining a few clientsmanagement andcontrol, SAP and BPO.
, Acquired two companies in 2005 in order to expand
its presence in the French market and add businessintelligence as a domain
Company Name Vertical Profile Strategy
Aztec Software & TechnologyServices
Technology Niche Service Provider(Product-Centric Services)
, Focused on Product Engineering.
, Strong focus on Technology.
, Select clients and annuity focus.
, Acquired Disha Technologies, a testing company tofacilitate rapid Product Development
Geometric Software SolutionsCo. Ltd.
Primarily Manufacturing Niche Service Provider(Product-Centric Services)
, Focused on Product Lifecycle Management.
, Used Intellectual Property effectively to differentiateitself.
, Has been expanding service offerings around the PLMspace.
, Started focusing on products with the launch of
Embedded Product/Solution Provider , Strong focus on the Embedded space., Following a product cum services strategy., Effective use of alliances to tap clients.
, Strong focus on inorganic growth with the acquisition of Arexera in 2003 to enter the European markets and V-Soft
Aftek Infosys Ltd.
Exhibit 6: Strategies of Top Performers
Source: Avendus Research
Airlines,HR IT, Peoplesoft,Insurance and morerecently testing and AssetManagement Solutions
Niche Service Provider , Identifying undeserved but scalable markets, and thenmaking substantial investment upfront to create marketleadership status
, Focus on niche segments like Airline, HR, Peoplesoft
, Focus on emerging & underserved markets in Europespecifically Germany
, Focus on client mining
Hexaware Technologies Ltd.
Telecom Product/Solution Provider , Focused on the fraud management and revenuemaximization space
, Focused initially on emerging markets and later entereddeveloped markets
Subex Systems Ltd.
BFSI Product/Solution Provider , Focused on niche segments like cash management andretail lending.
, Focused on untapped markets like Asia, Philippines andJapan in particular, Middle East and Europe.
, Focused on investment in IP creation and new productofferings
Nucleus Software Exports Ltd.

8/7/2019 IT_Mid_Caps_The_Untold_Story
http://slidepdf.com/reader/full/itmidcapstheuntoldstory 12/38
Refer the inset box for a profile of Subex, one of the top
performers that have adopted a product- focused strategy.
We expect more companies with a product-focused strategy
to access the public markets in coming years. According to a
recent NASSCOM report, the
products and technology
services market in India is
expected to grow to USD 8
billion by 2008.
Another rapidly growing
opportunity is the creation of
offshore players dedicated to
providing intellectual property
related services to technology or
manufacturing companies
globally. Aztec Software is anexample of a company that
provides outsourced product
development and software
testing services to Independent
Software Vendors (ISVs). A similar opportunity exists in
Engineering Design Services that help companies manage
their product lifecycles more effectively. Exhibit 7 highlights
each of these opportunities in more detail.
Strategy #2: Focus on A Fast-Growing Niche And Strive For
Global Leadership
Positioning, focus and leadership (actual and perceived) goa long way towards helping win customers. It does wonders
for your Market Cap as well. There was a time in the Indian
IT markets when being focused on financial services was
considered a niche. That is no longer true. In today's context,
a financial services niche implies focusing on something
more specific, such as Fixed Income Capital Markets.
Hexaware has leveraged its HR IT niche positioning to get
long-term contracts from large clients, whereas Subex has
kept redefining its telecom focus to define a niche where it
can claim to have a global leadership position.
Strategy #3: Target Under-Served Markets
Mid-Cap companies are also following a strategy of
exploring new markets to not only insulate themselves
against over-dependence on the US market, but to also
shield themselves from head-on competition with the
Large-Caps. Though the US will remain a dominant market
for software exporting, these companies are focusing on
expanding into newer geographies such as Middle East, Asia
and Latin America. For example, 3i Infotech Limited, a
software products company, is believed to achieve almost 25-
30% of its growth from emerging
markets like Central Asia, East
Asia and the Middle East.
When talking of under-served
markets, we need to take stock of
a latent opportunity right at our
doorstep. Some companies are
focusing on the Indian domestic
IT market that NASSCOM projects
will grow to USD 6 billion by
2006, a CAGR of 25%. While this
may seem lower when comparedto exports, we can expect the
domestic IT market to get a fillip
with increased penetration of
broadband, increased
investments in e-Governance projects, progressive
deregulation, etc. With this expectation, companies are
increasing their focus on the domestic market, especially in
emerging sectors such as retail, logistics, telecommunications
and SMEs. Companies such as Nucleus Software have a long
track record of serving the Indian market.
Strategy #4: Leverage Acquisitions, StrategicallyAcquisitions have been used fairly aggressively by the Mid-
Cap segment, as can be seen in Exhibit 8. While the jury is still
out on the success or failure of these acquisitions, Mid-Caps
have demonstrated the ability to leverage acquisitions to
complement their existing capabilities.
SUBEX: An Indian Software Product Company
Subex offers products focused on niches within the
telecom sector. The company identified an
opportunity in the fraud management and revenue
maximization solutions for telecom operators. A
survey conducted by Communications Fraud Control
Association (CFCA) estimated annual telecom fraud
losses to be in the range of USD 35-40 billion.
However, only 27% of operators currently use
'Revenue Maximization' solutions. Subex is among
the few product companies globally that has
developed solutions targeting this opportunity, afeat acknowledged by a 100% CAGR in their Market
Cap over the last three years.

8/7/2019 IT_Mid_Caps_The_Untold_Story
http://slidepdf.com/reader/full/itmidcapstheuntoldstory 13/38
Engineering Design Services
, Engineering services are those that augment or manage processes that are associated with the creation of a product or service, as wellas those associated with maximizing the life span and optimizing the yield associated with a product or asset.
, This not only includes design elements of the product or service itself, but also encompasses the infrastructure, equipment andprocesses engaged in manufacturing or delivering them.
Current slow down in the global automotive andaerospace sectors has increased the need for low costvendors for design services
Focused engineering design players:Infotech Enterprises, Rolta India, Geometric, OnwardTechnologies, KLG Systel, Hero Global Design, Axis/IT&T, Plexion& Quest
Market Size
The worldwide marketfor outsourcedengineering designservices is estimated tobe $12.4 billion in 2006.Source: IDC
Offshoring engineering design and services translateinto:
Market Drivers Service Providers
Captive MNCs:Bechtel, Ford, Daimler Chrysler, GM, Caterpillar
Large players with engineering design capabilities:TCS (recently signed a deal with Ferrari), Infosys (recently signeda deal with Airbus), Wipro, Satyam, NIIT, HCL Tech
25%-30% reduction in engineering cycle time
30%-40% reduction in cost
20%-30% increase in production efficiency(productivity and quality)
15%-20% reduction in maintenance cost(Source:Dataquest)
Lack of skilled manpower/bandwidth within OEMs tocater to their design needs in-house
Faster time to market- a critical factor in fluctuatingbusiness trends in sectors like automotives
Offshore Product Development (OPD)
, OPD is a term that refers to outsourcing pieces of ISV's product development functions to a specialist, A number of global ISV's like Siebel, Hyperion, BMC software and Autodesk are leveraging this model. partner.
, Increasing cost pressures, Need to shorten the time-to-market cycle, Failed attempt by some ISV's to set up captive, Significant traction in startups with many venture
capitalists specifically asking for an 'India plan'.centers in India due to issues with managing scaleand operations and keeping their team motivated
, Example: US$ 18 million investment byNorwest Capital Partners into Pune basedPersistent Systems.
Market Size
The Indian OPDmarket is estimated togrow to $8-11 billion by2008Source Nasscom
Market Drivers Service Providers
, Mid-Cap companies: Aztec software, Visualsoft
, Small Cap & Private Companies: Sonata Software,Symphony Services, Virtusa, ISG Novasoft, CybernetSoftware Systems, Aditi Software and PersistentSystems.
, Large-Caps: TCS, Infosys, Wipro
Outsourced Testing Service
Cost arbitrage
Increased need for rigor and transparency to the testingand defect reporting ocess of the software productdevelopment life cycle.
Stringent compliance norms set by regulatory bodies inUS and Europe for the banking, financial, insurance andhealthcare sectors, are also driving ISVs to outsourcetesting services
Pure play testing companies: Applabs (now merged withVisualsoft), Disha Technologies (now merged withAztec),ThinkSoft, RelQ and Ready Test Go
Market Size
The size of the Indiantesting market isestimated at $300million (CY05) and isprojected to grow to $1billion by the year 2007 Source Meta Group Time to market is becoming a key for ISVs to
differentiate from each other and capitalize on theearly mover advantage.
Market Drivers Service Providers
Large Players: Infosys, Wipro, TCS, Satyam, Cognizant, HCLTechnologies, Headstrong, Keane, Patni operate in this space. .
, This refers to quality assurance (QA) service outsourcing functions
, Globally companies endeavor to have a ratio of 3:1 between developers and QA professionals and therefore providing for a huge
market opportunity., Outsourced testing services includes services like white-box, black-box, functionality, compatibility, and stress testing
Exhibit 7: Emerging Service Offerings for Products

8/7/2019 IT_Mid_Caps_The_Untold_Story
http://slidepdf.com/reader/full/itmidcapstheuntoldstory 14/38
Continued on the next page
Dec-05 Geodesic Engage Solutions In line with the company's plan to makestrategic investments in technology
companies, that possess innovative ideas thatcan be integrated with the company'sexisting suit of products.
Nov-05 MBT Axes Technologies Bridge a gap in MBT's service offerings to theTelecom Equipment Manufacturers (TEM)segment of the telecom market.
Augment MBT's offerings in productengineering and enhance capabilities toprovide solutions to telecom service providers.
Strengthen MBT's delivery capabilities.
Nov-05 KPIT Cummins Pivolis Gateway to France (with large manufacturing& banking companies, KPIT's focus areas), a
new geographyfor KPIT.
Strengthen presence in BFSI segment.
Nov-05 Geodesic PicoPeta Simputers Provides Geodesic with new value addedproduct offerings by combining its instantmessaging platform with PicoPeta's Simputersand its complementary universal messagingsystem.
Leverage on PicoPeta's understanding of acomplete product for the local market with itsglobal product presence, in order to enableeffective cross selling of products andsolutions.
Nov-05 3i Infotech SDG SoftwareTechnologies
Acquisition of new products in banking(Anti Money Laundering) and capital markets(Fraud Management), erstwhile missing in thecompany's array of products.
Nov-05 KPIT Cummins SolvCentral.com Strengthen domain focus on BI by creating anew line of business (LoB).
Establish presence in new geographicarea - Washington DC.
Oct-05 Geodesic Clangula IT AB NA
Oct-05 Mastek Entegram Access to strong client base(Fortune 500 companies).
Sep-05 3i Infotech Innovative BusinessSolutions
Enhance company's niche consulting skills inEAI, BI and IT security.
Augment geographic reach to US
Credible customer base acquisition.
Aug-05 Aftek Infosys V-Soft Inc Enhance its footprint in the professionalservices arena in USA.
NA
54
2
7
NA
2
NA
2
4
4
Date Acquirer Target Deal Value Purpose/Outcome of Transaction
Exhibit 8: Acquisitions by Mid-Cap Companies in the Last Twelve Months

8/7/2019 IT_Mid_Caps_The_Untold_Story
http://slidepdf.com/reader/full/itmidcapstheuntoldstory 15/38
Jul-05 Scandent Solutions BWH France Entry into the French market.
Jun-05 Caritor Idgo Group Provides consulting to telecom and financialsverticals.
Entry into the Paris market.
May-05 MindtreeConsulting
Linc Software Provides expertise in the areas of applicationdevelopment and maintenance domains forIBM Mid-range systems- An importantcomponent in the growth strategy laid downMindtree.
May-05 Cranes Software Engineering MechanicsResearch CorporationIndia Operations
Provides consulting services and customizedsoftware in the field of computer aidedengineering.
May-05 Mphasis BFL Eldorado Computing Make a foray into the booming healthcareinsurance and payment processing business.
Strengthen presence in the US market.
Date Acquirer Target Deal Value Purpose/Outcome of Transaction
Mar-05 InfotechEnterprises
Tele Atlas India Pvt Ltd Strategic acquisition to see definitive inflow of revenue by ensuring a minimum amount of business to be carried out in the next 3 years.Structured to provide financial aid to TeleAtlas's large order book execution.
Feb-05 Mphasis BFL Princeton Consulting Add niche consultancy services focused onproviding customer management solutions;depth to existing service offerings.
Acquisition used as a route to scale operations(buy vs build model).
Jan-05 GeometricSoftware
Tecsoft Inc& Cimitronics Inc
NA
NA
4
NA
NA
17
2
8
2
All Figures in USD MillionSource: Avendus Estimates, Company Press Releases
Exhibit 8: Acquisitions by Mid-Cap Companies in the Last Twelve Months

8/7/2019 IT_Mid_Caps_The_Untold_Story
http://slidepdf.com/reader/full/itmidcapstheuntoldstory 16/38
What is important to note is that the Top Performers, with
median EBITDA margins of 26% and median PAT margins of
19% (for fiscal year ending March 31, 2005), were
comparable to the profitability levels of the Large-Caps
whose median EBITDA margins were 27% and PAT margins
were 20%, as illustrated in Exhibit 10 and 11.
As discussed in previous sections, Mid-Caps have followed a
different strategy, as compared with Large-Caps. While Large-
Caps have focused on building global delivery capability to
service large multi-year outsourcing engagements, Mid-Caps
have primarily focused on developing their competence
around niche areas for growth. Our analysis shows that
though Mid-Cap Market Cap has grown dramatically
compared to those of Large-Caps, they are relatively
undervalued as compared to Large-Caps. The difference is
more telling in the case of our Top Performers, whose revenue
growth rates exceed Large-Caps at comparable levels of
profitability.
Mid-Caps Have Outperformed Large-Caps in Market Cap
Growth
Contrary to the common perception, the Mid-Caps have
shown stronger growth in their Market Cap than the Large-Caps. We compared the 365-day trailing average Market Cap
(as of December 30, 2005) of all Mid-Caps and Large-Caps over
the last three years. Mid-Caps performed better than Large-
Caps for all three years.
The median three-year CAGR in Market Cap for Large-Caps
was 32%, compared with 37% for Mid-Caps and 65% for the
Top Performers. Mid-Caps have also outperformed Large-Caps
in terms of growth rates of both two-year and one-year
Market Cap, as illustrated in Exhibit 9.
Top Performers Beat Large-Caps in Terms of Revenue Growth,
at Comparable Margins
Mid-Cap companies as a whole have increased their revenue
in the last three years (2003-2005) at a CAGR of 31%.
However, our Top Performers have done better, growing at an
impressive 40%. This growth is better than that of Large-Caps,
who are growing at a CAGR of 36%.
Differentiated Mid-caps: A Compelling Value Proposition
Exhibit 9: Market Cap CAGR for Large-Cap, Mid-Cap
& the Top Performers
3 year CAGR 2 year CAGR 1 year CAGR
100%
80%
60%
40%
20%
0
65%
32%
37%
88%
62%
35%
95%
60%
47%
Median Mid-Cap Median Top Ten Players Median Large-Cap
Market Cap is the 365-day trailing average (as of December 30, 2005)Source: Avendus Research, CMIE Database
FY 03
25%
20%
15%
10%
5%
Median Mid-Cap Median Top Ten Players Median Large-Cap
Exhibit 11: Median PAT Margin Comparison
FY 04 FY 05 FY06(E)
11%
12%
20%
11%
15%
21%
11%
19%
12%
20%
19% 20%
Exhibit 10: Median EBITDA Margin Comparison
FY 03
35%
30%
25%
20%
15%
Median Mid-Cap Median Top Ten Players Median Large-Cap
FY 04 FY 05 FY06(E)
19%
23%
27%
21%
25%
27%
33%
20%
26%21%
26%25%
Source: Avendus Research, CMIE Database
Source: Avendus Research, CMIE Database

8/7/2019 IT_Mid_Caps_The_Untold_Story
http://slidepdf.com/reader/full/itmidcapstheuntoldstory 17/38
Large-Caps Are Still Trading At a Significant Valuation
Premium
For the trailing twelve months (ending December 30, 2005),
the Mid-Caps had a Market Cap/Sales, Market Cap/EBITDA
and Market Cap/PAT of 2.58x, 11.12x and 18.00x respectively.
As expected, the Mid-Caps are trading at lower multiples than
Large-Caps as illustrated in Exhibits 12, 13 and 14.
Based on the above facts, we believe there is a strong case to
be made for investing in Mid-Caps that have demonstrated
the ability to differentiate themselves in a market dominated
by the Large-Caps.
Exhibit 13: Median Market Cap/EBITDA Comparison
Exhibit 12: Median Market Cap/Sales Comparison
FY 03
5.00
4.00
3.00
2.00
1.00
0
Median Mid-Cap Median Top Ten Players Median Large-Cap
6.00
FY 04 FY 05 TTM
1.20
1.61
4.01
1.75
1.86
3.775.68
1.57
2.112.58
4.233.96
FY 03
15.00
12.00
9.00
6.00
3.00
0
24.00
FY 04 FY 05 TTM
21.00
18.00
27.00
6.45
6.98 7.73
12.45
7.68
6.617.09
11.12
13.26
14.22 13.96
24.13
Median Mid-Cap Median Top Ten Players Median Large-Cap
Source: Avendus Research, CMIE Database
Source: Avendus Research, CMIE Database
FY 03
20.00
16.00
12.00
8.00
4.00
0
Exhibit 14: Median Market Cap/PAT Comparison
32.00
FY 04 FY 05 TTM
28.00
24.00
36.00
13.02
11.22
21.48
Median Mid-Cap Median Top Ten Players Median Large-Cap
19.21
11.11
10.08
10.09
11.06
18.03
31.18
20.12
18.00
Source: Avendus Research, CMIE Database
8/7/2019 IT_Mid_Caps_The_Untold_Story
http://slidepdf.com/reader/full/itmidcapstheuntoldstory 18/38
Going forward, we expect the Mid-Cap landscape to be
action-packed with a number of mergers, acquisitions,
private equity plays and public market offerings as
companies try to move to the next level and fill the void
between the Large-Cap and the Mid-Cap players as the
revenues of the largest Mid-Cap player in India are less than
USD 200 million.
If we allow ourselves the liberty to indulge in some crystal
gazing, we expect the Mid-Cap segment to witness the
following:
+ As mentioned above, there is a huge gap between the
Large and Mid-Cap players today in terms of their
revenue base. This has created a unique market
opportunity for Mid-Caps to fill this void as clients look
for a second bracket of companies to outsource their
services rather than largely depend on the few Large-
Caps who are growing larger by the day. Mid-Caps will
adopt different approaches to exploit this opportunity.
The Niche Service Providers will continue to
specialize and gain scale to become global leaders in
their areas of focus. This will be facilitated by private
equity and venture capital firms looking to
participate in the next wave of opportunity in the
Indian IT industry. An early indicator of this is the
$18.8 million investment by Norwest Venture
Partners and Gabriel Venture Partners in Persistent6Systems .
Some of the multi-domain players with strong
capability in a couple of high-growth verticals, and
possibly a leadership position in one or more, will be
well positioned to grow rapidly. In these cases too,
we can expect private equity firms to provide the
capital for expansion through organic or inorganic
means.
We could see large global buy-out funds provide the
capital to successful managers to build companies
through the consolidator strategy, which relies on
equal-sized mergers or significant acquisitions in
order to leapfrog to a certain level of scale. However,
we would like to add a word of caution here because
the success of this strategy remains to be proven.
The biggest challenge in executing this strategy
would come from integrating cultures of
predominantly human capital-driven businesses.
+ Considering the outlook that several early stage India-
focused funds are expected to be raised in 2006, we
should expect to see the emergence and growth of
product companies over the next three-five years. The
+
+
+
last couple of years has witnessed a strong show of
interest by global venture capitalists that have invested
in product companies in India. This includes investments
by Nokia Growth Partners and Nortel in Sasken, Bank of
America in Ittiam and Battery Ventures and Intel Capital
in Tejas Networks.
+ We expect weaker Mid-Cap companies that are unable to
develop strong differentiation to get acquired by large IT
multinationals like EDS, Accenture, Cap Gemini, etc, who
are constantly looking for inorganic opportunities to
enhance their offshore presence.
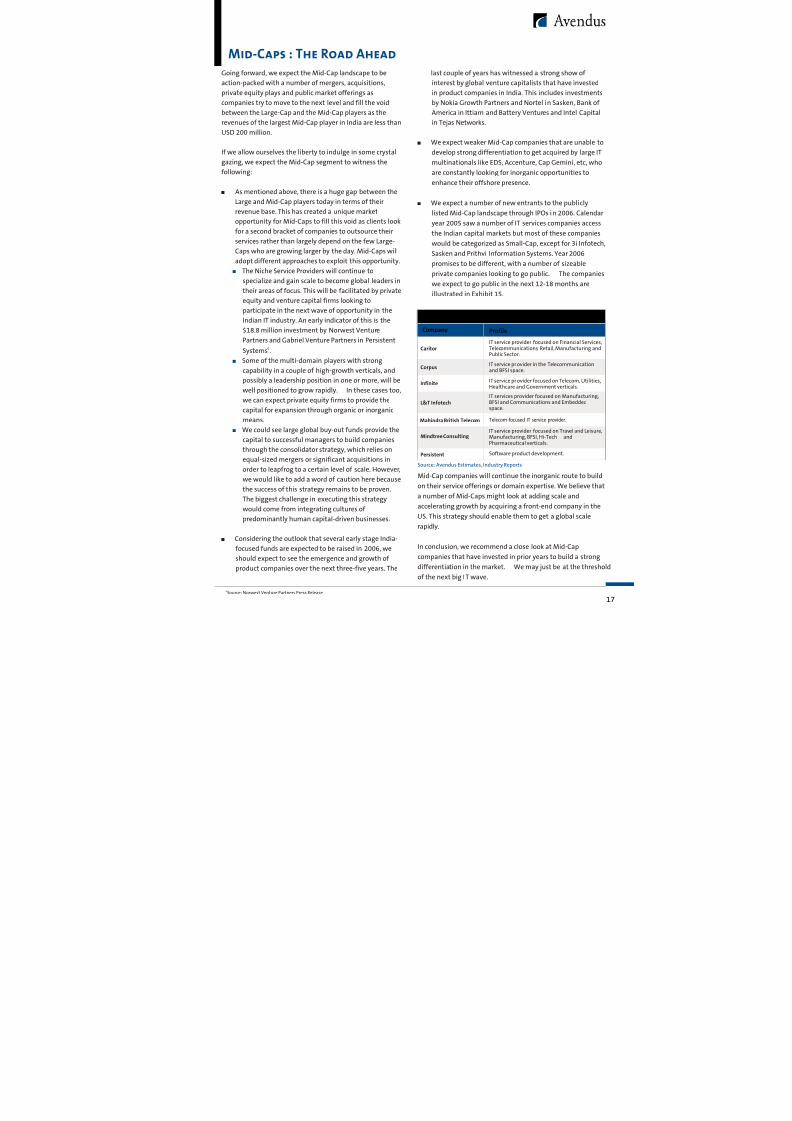
+ We expect a number of new entrants to the publicly
listed Mid-Cap landscape through IPOs in 2006. Calendar
year 2005 saw a number of IT services companies access
the Indian capital markets but most of these companieswould be categorized as Small-Cap, except for 3i Infotech
Sasken and Prithvi Information Systems. Year 2006
promises to be different, with a number of sizeable
private companies looking to go public. The companies
we expect to go public in the next 12-18 months are
illustrated in Exhibit 15.
Mid-Caps : The Road Ahead
Source: Avendus Estimates, Industry Reports
Company Profile
Mindtree ConsultingIT service provider focused on Travel and Leisure,Manufacturing, BFSI, Hi-Tech andPharmaceutical verticals.
L&T InfotechIT services provider focused on Manufacturing,BFSI and Communications and Embeddedspace.
Infinite IT service provider focused on Telecom, Utilities,Healthcare and Government verticals.
CaritorIT service provider focused on Financial Services,Telecommunications, Retail, Manufacturing and
Public Sector.
CorpusIT service provider in the Telecommunicationand BFSI space.
Persistent Software product development.
Mahindra British Telecom Telecom-focused IT service provider.
6
Source: Norwest Venture Partners Press Release
Exhibit 15: Private Companies that might Go Public In the Near Future
Mid-Cap companies will continue the inorganic route to buildon their service offerings or domain expertise. We believe that
a number of Mid-Caps might look at adding scale and
accelerating growth by acquiring a front-end company in the
US. This strategy should enable them to get a global scale
rapidly.
In conclusion, we recommend a close look at Mid-Cap
companies that have invested in prior years to build a strong
differentiation in the market. We may just be at the thresho
of the next big IT wave.

8/7/2019 IT_Mid_Caps_The_Untold_Story
http://slidepdf.com/reader/full/itmidcapstheuntoldstory 19/38
Appendix A :
Company Specific Strategy of Top Ten Performers
8/7/2019 IT_Mid_Caps_The_Untold_Story
http://slidepdf.com/reader/full/itmidcapstheuntoldstory 20/38
APPENDIX
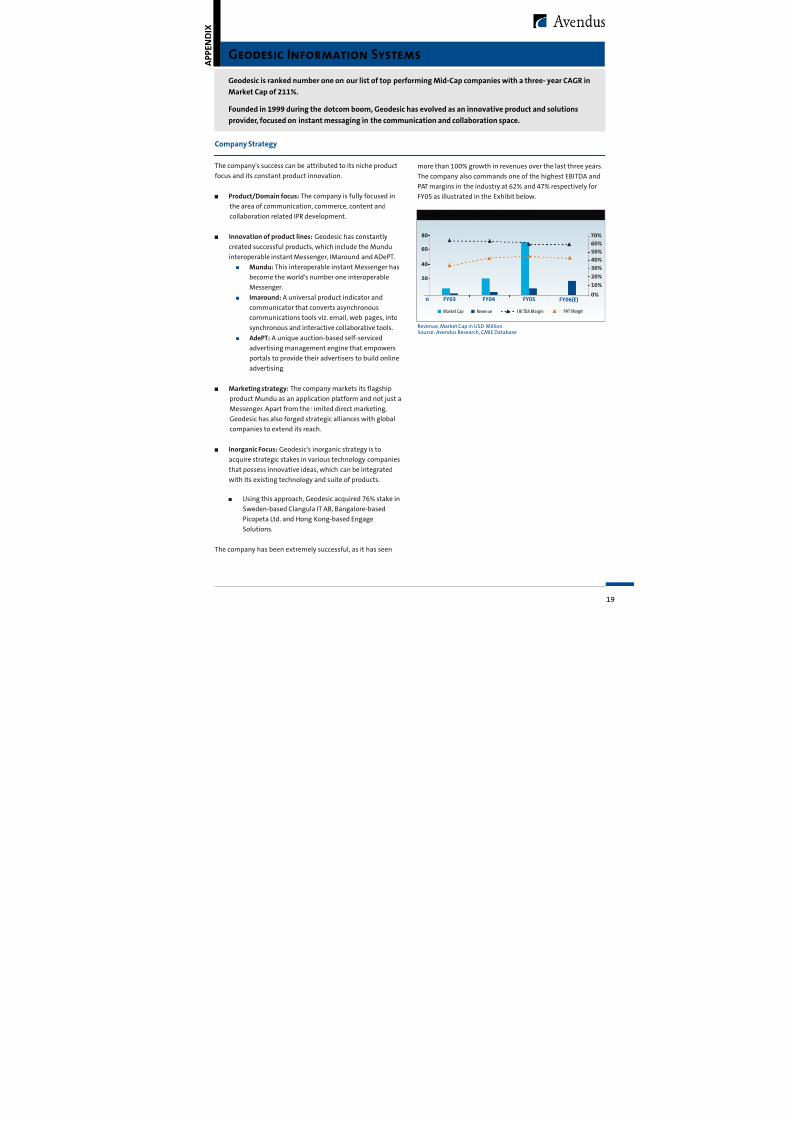
Geodesic is ranked number one on our list of top performing Mid-Cap companies with a three- year CAGR in
Market Cap of 211%.
Founded in 1999 during the dotcom boom, Geodesic has evolved as an innovative product and solutions
provider, focused on instant messaging in the communication and collaboration space.
Geodesic Information Systems
Company Strategy
+
+
+
The company's success can be attributed to its niche product
focus and its constant product innovation.
+ Product/Domain focus: The company is fully focused in
the area of communication, commerce, content and
collaboration related IPR development.
+ Innovation of product lines: Geodesic has constantlycreated successful products, which include the Mundu
interoperable instant Messenger, IMaround and ADePT.
Mundu: This interoperable instant Messenger has
become the world's number one interoperable
Messenger.
Imaround: A universal product indicator and
communicator that converts asynchronous
communications tools viz. email, web pages, into
synchronous and interactive collaborative tools.
AdePT: A unique auction-based self-serviced
advertising management engine that empowers
portals to provide their advertisers to build online
advertising.
+ Marketing strategy: The company markets its flagship
product Mundu as an application platform and not just a
Messenger. Apart from the l imited direct marketing,
Geodesic has also forged strategic alliances with global
companies to extend its reach.
+ Inorganic Focus: Geodesic's inorganic strategy is to
acquire strategic stakes in various technology companies
that possess innovative ideas, which can be integrated
with its existing technology and suite of products.
+ Using this approach, Geodesic acquired 76% stake in
Sweden-based Clangula IT AB, Bangalore-based
Picopeta Ltd. and Hong Kong-based Engage
Solutions.
The company has been extremely successful, as it has seen
more than 100% growth in revenues over the last three years.
The company also commands one of the highest EBITDA and
PAT margins in the industry at 62% and 47% respectively for
FY05 as illustrated in the Exhibit below.
FY03 FY04 FY05
20
00%
FY06(E)
40
60
80
10%
20%
30%
40%
50%
60%70%
Market Cap Reven ue EBI TDA Margin PAT Margin
Revenue, Market Cap in USD MillionSource: Avendus Research, CMIE Database
Exhibit A: Geodesic Financial Performance

8/7/2019 IT_Mid_Caps_The_Untold_Story
http://slidepdf.com/reader/full/itmidcapstheuntoldstory 21/38
Cranes Software International is ranked number two on our list of top performing Mid-Cap companies with
a three-year CAGR in Market Cap of 128%.
Founded in 1991, Cranes Software began business as a distributor of scientific and mathematical software
products from Mathworks Inc.,USA. In the late 1990's, the company also got into the training business. As adistributor, the company was focused on the domestic sector and established relationships with leading
global technology players and gained tremendous domain experience. However, the company did not own
any IPR. In 2001, the company changed its strategy and initiated its foray into software IPR through the
acquisition of a number of products. This strategy has paid off as the company has expanded over ten times
in the last four years.
Cranes Software International
Exhibit B : Cranes Financial Performance
Company Strategy
Since 2001, the company has followed a clear strategy of
acquiring under-valued products and then enhancing them byleveraging its Indian development center and then cross-
selling these products to its existing and new user base.
+ Acquisition: Acquisitions have been an integral part of
the company's strategy. It has acquired under-valued
products with demonstrated technical capabilities and a
strong brand among the user segments. It acquired AISN
Software along with its market-leading software
products (2000), SYSTAT and Sigma product line from
SPSS Inc (2001, 2004), and Engineering Mechanics
Research Corporation, the developer of the NISA family of
FEA programs and a pioneer in the field of ComputerAided Engineering Software (2005). With these
acquisitions, the company acquired a cumulative user
base of 350,000, which included customers like Merck,
Eli Lilly, Pfizer and NASA.
+ Enhancement: The company enhances product lines by
setting a clear product development roadmap and by
leveraging its domain expertise and the India
development center.
+ Expansion: Once the product is enhanced with added
capabilities, the company leverages its global presenceand 38 offices to sell. It also optimizes opportunities by
significantly cross-selling to existing and new users.
That the company's strategy has been successful can be seen
from a CAGR in revenue of 84% over the last five years. The
growth has been driven by product business, which
contributes 80% of its current revenues. (The rest of the 20%
in revenue is derived from the distribution of products and
from training on scientific software products.) The company
APPENDIX
FY03 FY04 FY0500%
FY06(E)
50
100
150
10%
20%
30%
40%
50%
60%
70%
Market Cap Revenue EBITDA Margin PAT Margin
Revenue, Market Cap in USD millionSource: Avendus Research, CMIE Database
delivered high EBITDA and PAT margins at 55% and 28%
respectively for FY05 as illustrated in the Exhibit below.
Exhibit B: Cranes Financial Performance

8/7/2019 IT_Mid_Caps_The_Untold_Story
http://slidepdf.com/reader/full/itmidcapstheuntoldstory 22/38
APPENDIX
Hexaware is ranked number three on our list of top performing Mid-Cap companies with a three-year CAGR in
Market Cap of 125%.
Founded in 1990, Hexaware operated independently till 2001 when it merged with the software division of
Aptech. This merged entity later de-merged from the training arm and subsequently went public. Hexawareprovides software services to organizations in the banking and financial, healthcare, airlines, insurance,
transportation and hospitality sectors. The company focuses primarily on marketing three technology practices
- PeopleSoft Services, Application Management Solutions and e-Solutions. Hexaware also offers offshore R&D
solutions practice comprising embedded software, chip development and testing services.
Hexaware Technologies Ltd.
Company Strategy
Hexaware has followed a strategy of identifying under-served
but scalable markets and making substantial upfront
investment to create market leadership status in these focus
areas.
+ Niche Focus: Hexaware differentiated itself by focusing
on niche areas such as ERP Offshoring, HR IT and the
airline industry. More recently, they have been trying to
make a mark in the testing and asset management
solutions space as well.
+ Expanding into under-served markets: Hexaware has
established a leadership position in the German market
and has also expanded their global footprint in the
Australian and Netherlands market. This is in line withtheir strategy to make a mark in relatively under-served
markets and create market leadership.
+ Alliances: The company has managed to form alliances
with partners who serve Fortune 500 clients, including
PeopleSoft, IBM, Unisys, and Valtech.
+ Client Mining: There is a clear focus on mining the top 35
accounts of the company who contribute close to 80% of
the revenues. Hexaware has been able to achieve
significant growth by purely by focusing on their top
customers.
Since Oracle's acquisition of PeopleSoft, there has been a
slowdown in outsourcing from this platform, which has
resulted in the poor performance of the Hexaware scrip in the
last year. However the release of PeopleSoft version 8.9 by
Oracle has seen a regaining of confidence among PeopleSoft
users, especially in North America, leading to a revival in the
PeopleSoft market. Also, Hexaware is simultaneously trying to
expand its portfolio in the ERP space. They have 14 clients
using systems other than PeopleSoft in this space. Hexaware
is making a conscious effort to de-risk its business from only
one or two services, by bringing in services like asset
management, testing services and leasing.
The company has seen 41% growth in revenues over the last
three years and its EBITDA and PAT margins were recorded at
17% and 12% respectively for FY05 as illustrated in the Exhibit
below.
Exhibit C : Hexaware Financial Performance
Market Cap Revenue EBITDA Margin PAT Margin
FY03 FY04 FY0500%
FY06(E)
100
200
300
5%
10%
15%
20%
Revenue, Market Cap in USD MillionSource: Avendus Research, CMIE Database
Exhibit C: Hexaware Financial Performance

8/7/2019 IT_Mid_Caps_The_Untold_Story
http://slidepdf.com/reader/full/itmidcapstheuntoldstory 23/38
Subex is ranked number four on our list of best performing Mid-Cap companies with a three-year CAGR in
Market Cap of 99%.
Subex was established in 1992 as a telecom hardware system integrator. In 1998 they diversified into
software development and started focusing on developing products in the fraud management and revenuemaximization space. Its clear focus on the telecom vertical and the domains within it has enabled the
company to emerge as the number 1 player in this space.
Subex Systems Ltd.
Company Strategy
Subex's organic strategy has been three-fold -- domain focus,
product focus and market focus.
+ Domain Focus: Subex has not only been focused on the
telecom vertical but within it on the fraud management
and revenue maximization space. This has helped the
company emerge as a leader in this space.
+ Product Focus: Since inception, Subex has been focusing
on developing products in its specialized domain.
Towards this end, Subex has developed Ranger, a fraud
management software and INcharge, a revenue
assurance system. The company derives 36% of their
revenue from the product business.
+ Developing Markets Focus: Subex follows a unique
strategy of focusing initially on the developing markets
in order to a build a good client list. With an availability
of an excellent reference base and suite of products, the
company later enters the developed markets.
+ Inorganic Focus: Subex has launched a proactive
acquisition program in order to fill gaps in its technology
offerings and also expand its geographical reach.
+ Subex acquired IVth Generation Inc, USA in 2000 and
Magardi Inc, Canada in 2001. In 2004, Subex
acquired Alcatel's Fraud Management Group and
Lightbridge's Fraud Centurion, making it the largestfraud management system vendor in the world.
The company has seen 34% growth in revenues over the last
three years, testimony to the success of its strategy. It also
commands high EBITDA and PAT margins at 31% and 22%
respectively for FY05 as illustrated in Exhibit F.
APPENDIX
FY03 FY04 FY0500%
FY06(E)
40
60
80
5%
10%
25%
35%
20
15%
20%
30%
Market Cap Revenue EBITDA Margin PAT Margin
Revenue, Market Cap in USD MillionSource: Avendus Research, CMIE Database
Exhibit D: Subex Financial Performance

8/7/2019 IT_Mid_Caps_The_Untold_Story
http://slidepdf.com/reader/full/itmidcapstheuntoldstory 24/38
APPENDIX
Aptech is ranked number five on our list of top performing Mid-Cap companies with a three-year CAGR in
Market Cap of 68%.
Aptech commenced its IT education and training business in 1986. Since its inception, the company has been
successfully addressing business opportunities in the retail training and education segment in informationtechnology, multimedia and soft skills. In 1998, with the slowdown in the domestic education and training
markets, Aptech expanded its portfolio to include software exports, ERP and knowledge management.
However, in 2001, Aptech Limited de-merged the Training and Software businesses as these markets had
different customer and growth profiles, as well as target markets. The training arm became Aptech Ltd.
Aptech Ltd.
Company Strategy
+ Training focus: Aptech has been traditionally an IT
training company till they entered the software services
space in 1998. However, with the de-merger in 2001, the
company has focused exclusively on training.
+ Brand Buiding: Thanks to the customer-centricity of the
training business, the company realized early on the need
to spend time and money on brand- building. This
strategy has paid off immensely for the company as they
have emerged as the second-largest Indian IT training
company.
+ Global Markets: Since its first foray into the Bahrain
market in 1993, the international business has grown
exponentially. Aptech has been aggressively expandingits international business. It now has training centers in
China, Africa, Bangladesh, Latin America and Vietnam.
Aptech has maintained leadership position in China,
Bangladesh and Nigeria.
+ Alliances: Aptech has formed alliances with education
institutes as well as corporates for IT training. On the
education institutions front, they have formed
collaborative alliances with Southern Cross University -
Australia, Beijing University - China, IIT - Allahabad and
Sikkim Manipal University - Mangalore. Corporate
training is focused only on IT and non-IT Fortune 500companies in developed countries.
However, the company has not done very well in terms of top
and bottom line growth in the past few years. We believe that
Aptech has done well on the indices because of its distinct
position in the Indian IT training industry and the future
global opportunity.
FY03 FY04 FY05
10
0-60%
FY06(E)
20
30
40
-40%
-20%
0%
20%
40%
60%
Market Cap Revenue EBITDA Margin PAT Margin
Revenue, Market Cap in USD MillionSource: Avendus Research, CMIE Database
Exhibit E: Aptech Financial Performance

8/7/2019 IT_Mid_Caps_The_Untold_Story
http://slidepdf.com/reader/full/itmidcapstheuntoldstory 25/38
FY03 FY04 FY05
20
00%
FY06(E)
40
60
80
5%
10%
15%
20%
Market Cap Revenue EBITDA Margin PAT Margin
Revenue, Market Cap in USD MillionSource: Avendus Research, CMIE Database
APPENDIX
KPIT Cummins Infosystems is ranked number six on our list of best performing companies with a three-year
CAGR in Market Cap of 62%.
KPIT Infosystems, incorporated in 1991, was focused on providing software services to the Financials Services
and Manufacturing Verticals. The promoters started with these two verticals because of their accountingbackgrounds, and the fact that the company was based in Pune - a strong manufacturing hub. In 2002, KPIT
merged with Cummins Infotech, a captive IT service unit for Cummins group. This merger provided greater
stability to the combined entity's earnings stream and a stronger presence in the market for the
manufacturing vertical. Recently Lehman Brothers acquired an 8% stake in company.
K P I T Cummins Infosystems.
Company Strategy
Inorganic Focus:
Since its inception, KPIT's strategy has been to be vertical and
domain- focused, as well as focused on client relationships for
growth.
+ Vertical and Domain-Focused: The company has not only
been vertically focused in the BFSI and manufacturing
but also domain-focused in advanced technology
solutions, information risk management and control, SAP
and BPO. Its exclusive focus on these verticals as well in
these segments has helped the company create a niche
in this space and grow rapidly.
+ Focus on strengthening client relationships: With only 24
active clients as of March 2005, its STAR customer
approach of focusing on a few clients has helped thecompany mine client relationships better. It has focused
only on a few clients as it aspires to be the number one
vendor of choice for at least five of its top 10 clients.
+ KPIT's acquisitive strategy has been
either to fulfill gaps in service offerings or to expand
service offerings or to enter new geographies.
+ Following this strategy, KPIT expanded its service
offering and added Business Intelligence expertise
through the acquisition of SolvCentral, and
established a stronger foothold in the French marketthrough the acquisition of Pivolis. These acquisitions
are also an effort to bring down the proportion of
revenue from Cummins.
The company has been extremely successful at its strategy, as
can be seen from its more than 62% growth in revenues over
the last three years. The company has seen a decrease in its
margin over the last year and recorded EBITDA and PAT
margins of 13% and 11% respectively for FY05 as illustrated in
the Exhibit below.
Exhibit F : KPIT Financial Performance

8/7/2019 IT_Mid_Caps_The_Untold_Story
http://slidepdf.com/reader/full/itmidcapstheuntoldstory 26/38
APPENDIX
Nucleus Software is ranked number seven on our list of top performing Mid-Cap companies with a three-year
CAGR in Market Cap of 62%.
Incorporated in 1989, Nucleus Software provides products and solutions to the Banking and Financial Services
industry. For long, Banking and Financial Services have been one of the most competitive segments in theindustry. However, Nucleus' strong domain knowledge, constant investment in IP creation, focus on niche
segments within the banking sector and efforts towards exploring untapped geographies have paid off. The
company has seen a 250% year-on-year increase in Market Cap and is well poised to leap into the next level of
growth through its distinctive strategy.
Nucleus Software Exports Ltd.
Company Strategy
Nucleus has been providing customized solutions to the
banking sector since its inception. The company's flagship
'FinnOne' suite of products has been competing with larger
peers such as Infosys' 'Finnacle' and i-Flex's 'Flexcube' for some
time now. In order to avoid being squeezed by these larger
players, the company adopted a differentiated strategy as
mentioned below:
+ Domain focus: As a distinctive focus, the company
forayed into development of solutions in niche segments
like cash management and retail lending.
+ Geographic focus: Nucleus has made inroads into new
untapped markets like Asia, Philippines and Japan in
particular, Middle East and Europe. One reason for thisdive into new markets is the fact that most Tier I
companies have a limited presence in these markets,
which has enabled Nucleus to bag contracts at
competitive prices.
+ Investment in IP creation and new product offerings:
Nucleus plans to invest up to 10% of annual revenues to
bolster its R&D and new product offerings. The company
introduced three new products in fiscal year 2005 to
position itself as a leader in the banking space.
+ Strategic alliances: The company recently signed a jointmarketing agreement with Sun Microsystems, under
which both companies would create joint marketing and
sales initiatives, apart from interoperability of Nucleus
products on Sun Microsystems' applications. Such an
arrangement would give Nucleus scalability and
flexibility in the choice of platform.
The company has seen a 20% growth in revenues over the last
three years. The company has also seen an increase in its
EBITDA and PAT margins, which were recorded at 24% and
20% respectively for FY05 as illustrated in the Exhibit below.
Exhibit E : Nucleus Financial PerformanceRevenue, Market Cap in USD MillionSource: Avendus Research, CMIE Database
FY03 FY04 FY0500%
FY06(E)
20
30
40
10%
20%
30%
40%
10
Market Cap Revenue EBITDA Margin PAT Margin
Exhibit G: Nucleus Fiancial Performance

8/7/2019 IT_Mid_Caps_The_Untold_Story
http://slidepdf.com/reader/full/itmidcapstheuntoldstory 27/38
APPENDIX
Aftek Infosys is ranked number eighth on our list of best performing Mid-Cap companies with a three-year
CAGR in Market Cap of 50%.
Five technocrats from PCS incorporated Aftek in 1986 with a focus on the hardware business - distribution and
servicing of computers and microprocessor-based terminals. With the changing IT scenario and dwindlingmargins in the hardware business, Aftek changed its focus to developing software products for export
purposes in addition to providing application development services.
Aftek Infosys
Company Strategy
The guiding principles of Aftek's growth strategy include
embedded focus, creation of IPR, movement up the value
chain, and scalability.
+ Embedded Focus: Aftek has always been focused on
embedded software services and products. As they
acquired expertise in the embedded space they also
began focusing on the wireless and mobile space - big
markets for deployment of embedded technologies.
+ Product focus: Although the products revenues account
for only 10% of the total, this share has been growing
steadily. The company has a UPS monitoring product
called Powersafe as well as a road transportation product
called 'Depot Manager'.
+ Moving Up the Value Chain:The company is also movingup from maintenance/data conversion to design,
development, implementation, consulting, products and
IPR. In the services area, while Aftek believes that
reusable and patentable modules and components can
and should be created in the areas of domain expertise,
IPRs on products (integrated or stand-alone) are the most
valuable.
+ Scalability: Aftek believes that rapid and global level
scalability can be achieved through products, alliances
and partnerships. Aftek has formed alliances with
companies like Computer Associates and Hewlett-Packard. These alliances have helped it market its
products to a large customer base of quality clients.
+ Future Growth Drivers: The company has identified
knowledge management and energy management as
high potential growth areas. It is planning to
acquire/enter into joint ventures with companies with
IPRs and a large client base and strong domain
knowledge in these areas.
+ Inorganic Focus: Aftek's acquisitive strategy has been to
expand its service offering, and its geographical reach.
Aftek acquired 49% stake in Arexera Information
Technologies in 2003 in order to expand its service
offerings in the knowledge management space. In
2005 Aftek invested in V-Soft Inc to enhance its
footprint in the professional services arena in USA.
The company has used these acquisitions effectively
to tap the European and US markets.
The company has recorded high EBITDA and PAT margins at
45% and 35% respectively for FY05 as illustrated in the Exhibit
below.
+
FY03 FY04 FY05
40
00%
FY06(E)
60
100
120
10%
20%
30%
40%
50%
60%
80
20
Market Cap Revenue EBITDA Margin PAT Margin
Revenue, Market Cap in USD MillionSource: Avendus Research, CMIE Database
Exhibit H: Aftek Financial Performance

8/7/2019 IT_Mid_Caps_The_Untold_Story
http://slidepdf.com/reader/full/itmidcapstheuntoldstory 28/38
APPENDIX
Aztec is ranked number nine on our list of top performing Mid-Cap companies with a three-year CAGR in
Market Cap of 45%.
Founded in 1995, Aztec Software provides a comprehensive suite of outsourced software product
development life cycle services to ISVs and Enterprise Software product companies. These includedevelopment, testing, professional services and sustenance engineering covering the entire life cycle.
Aztec Software & Technology Services Ltd
Company Strategy
+ Domain Focus: The company has a singular focus on
software product engineering services. This strategy has
paid off for Aztec as this space has seen a great deal of
interest lately.
+ Technology Focus: The company has focused on providing
total technology solutions and building robust and
highly scalable solutions. Aztec has built distinctive
competence in core technologies l ike data management,
integration engineering and web services, security and
identity management, and mobile applications. It is also
expanding its technology focus by entering into the
wireless and networking and embedded and device
segments, which will be key enablers for the company in
achieving rapid revenue growth. It has set up R&D teams
to track and test emerging technologies.
+ Selective client engagements: Since inception, Aztec has
been selective with respect to the clients it serves and
focuses on a few customers with prolonged relationships.
As a result, Aztec's clients include stable product
companies with annual revenues in excess of $1 billion.
+ Annuity Revenue Focus: The company has focused on an
annuity business, allowing for predictable and
sustainable revenue model. This has allowed Aztec to
achieve 75% of the business on annuity mode with long-
term customer relationships.
+ Inorganic Focus: Aztec has a clear strategy of pursuingopportunities for inorganic growth in order to diversify
into segments complementary to its existing service
offerings. Aztec has identified related areas in storage
management and embedded systems where it plans to
acquire expertise.
In 2004, Aztec acquired Disha Technologies, a
software product testing company as a strategic
response to their customers' needs to manage rapid
+
Product development while maintaining
independence in testing.
The Company has been successful at its strategy as it has seen
75% growth in revenues over the last three years. The
company has also seen an increase in its EBITDA and PAT
margins, which was recorded at 24% and 18% respectively as
illustrated in the Exhibit below.
Market Cap Revenue EB ITDA Margin PAT MarginFY03 FY04 FY05
20
0
-20%
FY06(E)
30
40
50
-10%
0%
10%
20%
30%
10
Revenue, Market Cap in USD MillionSource: Avendus Research, CMIE Database
Exhibit I: Aztec Financial Performance

8/7/2019 IT_Mid_Caps_The_Untold_Story
http://slidepdf.com/reader/full/itmidcapstheuntoldstory 29/38
Geometric is ranked number ten on our list of top performing Mid-Cap companies with a three-year CAGR in
Market Cap of 37%.
Geometric was founded in 1985 as a division of Godrej & Boyce and spun into an independent entity in 1994.
Geometric Software Solutions
Organic Strategy
+ Product Lifecycle Management (PLM) Focus: It has been
focused on CAD/CAM/CAE/PDM and MPM for the past 21
years and has emerged as a leading global PLM services
provider. Its clear focus on PLM has enabled it to create a
niche for itself.
+ Intellectual Property: Geometric's strategy of providing
services revolving around its intellectual property in the
PLM space has allowed the company to differentiateitself from the other players. It was one of the first
companies to go on the path of IP licensing when it
licensed its geometry-based algorithms to other
companies for improving their CAD/CAM processes.
+ Expanding offerings in the PLM space: Since PLM is a
highly specialized space, Geometric has been trying to
grow the market by adding more services. In late 2000
the company added Product Data Management (PDM)
services and visualization services to its focus. In early
2002, Geometric started focusing on partners with a
view of addressing more PLM software companies. In2004 it started to offer end-to-end PLM solutions by
offering services such as help desk and technical support.
+ Product focus: Till 2003 Geometric banked only OEM
deals for its products. However, in 2004 with the launch
of eDrawings for the Pro/Engineer platform, Geometric
forayed into the end user space.
The company has seen 37% growth in revenues over the last
three years. It commanded very high margins a couple of
years ago, but in the last year, the company has seen a decline
in its EBITDA and PAT margins, which were recorded at 27%
and 16% respectively for FY05 as illustrated in the Exhibit
below.
APPENDIX
Market Cap Revenue EBITDA Margin PAT Margin
FY03 FY04 FY0500%
FY06(E)
40
60
100
5%
10%
15%
20%
25%
30%
35%
80
20
Revenue, Market Cap in USD MillionSource: Avendus Research, CMIE Database
Exhibit J: Geometric Financial Performance

8/7/2019 IT_Mid_Caps_The_Untold_Story
http://slidepdf.com/reader/full/itmidcapstheuntoldstory 30/38
Appendix B :
Financials , Growth & Margins And Valuation

8/7/2019 IT_Mid_Caps_The_Untold_Story
http://slidepdf.com/reader/full/itmidcapstheuntoldstory 31/38
APPENDIX
Financials
*Certain companies among the Large-Cap and Mid-Cap segments do not follow a Financial Year end (April-March).For such companies, we have aggregated their financials for such period based on their published quarterly reportsSource- Avendus Estimate, Company Annual Reports, CMIE Database.
Mphasis B F L Ltd. 57.2 34.0171.1 36.6 27.5 21.9 96129.9 204.3
HexawareTechnologies Ltd. 22.7 17.8 134.422.8 16.7 87.0 145.0
Geodesic Informa-tion Systems Ltd. 11.8 8.8 9.1 5.6 4.2 1.7 2.22.64.0 1.4 0.819.4
Polaris SoftwareLab Ltd.
19.5 5.7 176.2 25.4 12.9 26.7142.3 12.1185.5
Rolta India Ltd. 42.3 27.276.8 35.2 20.0 14.2 32.361.7 29.590.4
Cranes SoftwareIntl. Ltd.
27.1 12.5 36.3 20.1 10.2 25.3 11.9 7.2 13.7 6.7 44.4
Aftek Infosys Ltd. 19.4 15.2 39.4 17.8 13.7 28.8 13.6 11.2 19.0 53.9
3i Infotech Ltd. 19.2 11.8 64.9 10.5 3.9 51.6 10.2 2.6 40.3 5.9 89.6
Subex Systems Ltd. 11.9 9.1 26.1 8.2 5.7 19.8 5.6 3.9 15.7 3.7 2.239.8
Mastek Ltd. 26.0 13.6 119.9 20.8 11.3 85.2 10.04.4 84.0 19.7 15.1143.4
Aztec Software& TechnologyServices Ltd.
10.0 7.8 21.8 5.2 4.0 9.2 1.1 0.3 (0.1) (0.9)42.5
Igate GlobalSolutions Ltd.
13.2 2.5 132.9 11.9 4.7 127.8 5.1 0.0 95.8 10.4 6.3138.8
InfotechEnterprises Ltd. 14.3 8.4 58.1 12.2 6.1 42.4 7.8 2.0 36.6 8.7 3.375.7
Nucleus SoftwareExports Ltd. 11.5 7.8 23.5 5.7 4.6 18.1 3.7 2.2 20.0 3.1 1.931.4
Geometric SoftwareSolutions Co. Ltd. 10.7 4.5 38.5 10.5 6.1 25.0 7.1 4.6 19.5 6.0 48.1
N I I T Ltd. 12.9 9.4 88.4 16.4 7.9 157.0 0.3 (17.2) 144.9 14.4 (4.3)99.3
Aptech Ltd. 11.5 5.2 25.7 (7.7) (12.7) 31.1 7.0 2.9 34.0 5.0 1.26.3
K P I T CumminsInfosystems Ltd. 9.2 6.6 56.1 7.6 6.3 28.2 4.3 3.2 15.2 2.3 1.467.6
VisualsoftTechnologies Ltd. 9.5 4.8 42.9 11.5 6.3 34.6 12.3 8.3 28.1 10.1 7.240.0
ZensarTechnologies Ltd. 90.9 10.6 5.0 77.7 12.2 8.7 60.8 5.9 2.8 51.7 5.3 2.2
N I I TTechnologies Ltd. 24.4 14.0 120.5 23.6 13.0 109.4 17.8 7.3 --130.8 -
Sasken
CommunicationTechnologies Ltd. 8.9 4.9 53.3 8.9 5.1 22.3 7.9 4.1 --68.2 -
Revenue
FY06E (US$ Mn)
EBITDA PAT Revenue
FY05 (US$ Mn)
EBITDA PAT Revenue
FY04 (US$ Mn)
EBITDA PAT Revenue
FY03 (US$ Mn)
EBITDA PAT
Mid-Cap Companies
Company Name
Scandent SolutionsCorporation 12.4 7.2 54.8 8.2 4.0 10.9 - - 40.3 - -72.3

8/7/2019 IT_Mid_Caps_The_Untold_Story
http://slidepdf.com/reader/full/itmidcapstheuntoldstory 32/38
Financials
Revenue
FY06E (US$ Mn)
EBITDA PAT Revenue
FY06E (US$ Mn)
EBITDA PAT Revenue
FY06E (US$ Mn)
EBITDA PAT Revenue
FY06E (US$ Mn)
EBITDA PAT
*Certain companies among the Large-Cap and Mid-Cap segments do not follow a Financial Year end (April-March).For such companies, we have aggregated their financials for such period based on their published quarterly reportsSource- Avendus Estimate, Company Annual Reports, CMIE Database.
APPENDIX
Company Name
Infosys Technologies 2,043.7 685.1 529.51,584.4 518.9 420.41,078.4 354.3 276.4 808.9 282
Tata ConsultancyServices
2,590.9 797.0 615.52,183.2 646.7 439.31,614.1 402.2 358.31,243.5 293.4 24
Wipro Technologies 2,140.4 549.1 1,834.5 476.9 361.91,327.0 311.2 229.2 978.8 260418.1
Satyam Computers 1,124.7 351.9 272.8 801.7 212.2 158.1 585.7 167.2114.1 502.6 124.9 77.1
HCL Technologies 874.7 196.9 152.2 755.0 208.4 146.0 542.7 132.2 89.8
i-flex Solutions 280.5 39.6 22.0 258.8 69.8 54.1 180.0 49.5 39.7
Patni Computers 444.9 82.7 59.7 353.8 86.7 63.0 276.1 62.9 43.9
Large-Cap Companies
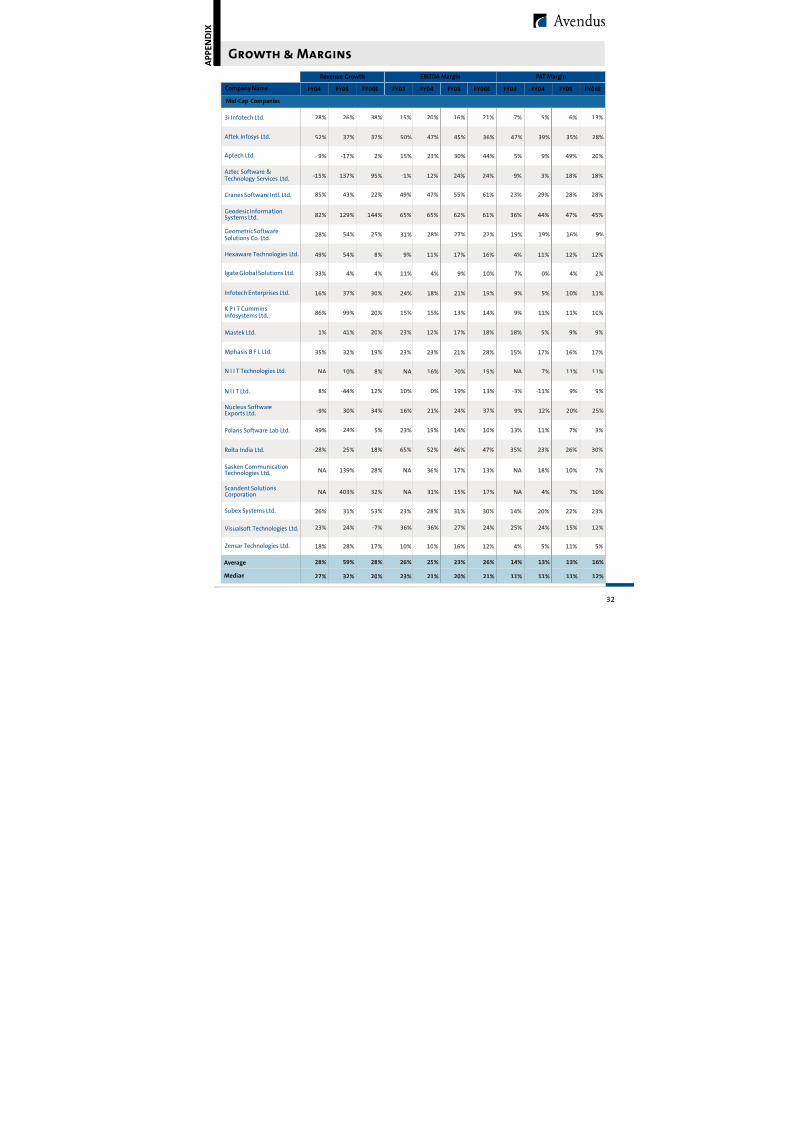
8/7/2019 IT_Mid_Caps_The_Untold_Story
http://slidepdf.com/reader/full/itmidcapstheuntoldstory 33/38
APPENDIX
Growth & Margins
Zensar Technologies Ltd. 18% 28% 17% 10% 10% 16% 12% 4% 5% 11% 5%
Average
Median
28% 59% 28% 26% 25% 23% 26% 14% 13% 13% 16%
27% 32% 20% 23% 21% 20% 21% 11% 11% 11% 12%
Geodesic InformationSystems Ltd. 82% 129% 144% 65% 65% 62% 61% 36% 44% 47% 45%
Cranes Software Intl. Ltd. 85% 43% 22% 49% 47% 55% 61% 23% 29% 28% 28%
Aftek Infosys Ltd. 52% 37% 37% 50% 47% 45% 36% 47% 39% 35% 28%
3i Infotech Ltd. 28% 26% 38% 15% 20% 16% 21% 7% 5% 6% 13%
Aztec Software &Technology Services Ltd. -15% 137% 95% -1% 12% 24% 24% -9% 3% 18% 18%
Aptech Ltd. -9% -17% 2% 15% 23% -30% 44% 5% 9% -49% 20%
Visualsoft Technologies Ltd. 23% 24% -7% 36% 36% 27% 24% 25% 24% 15% 12%
FY04
Revenue Growth EBITDA Margin PAT Margin
FY05 FY06E FY03 FY04 FY05 FY06E FY03 FY04 FY05 FY06ECompany Name
Mid-Cap Companies
Geometric Software
Solutions Co. Ltd. 28% 54% 25% 31% 28% 27% 22% 19% 19% 16% 9%
Mphasis B F L Ltd.35% 32% 19% 23% 23% 21% 28% 15% 17% 16% 17%
Hexaware Technologies Ltd. 49% 54% 8% 9% 11% 17% 16% 4% 11% 12% 12%
Polaris Software Lab Ltd. 49% 24% 5% 23% 19% 14% 10% 13% 11% 7% 3%
Rolta India Ltd. -28% 25% 18% 65% 52% 46% 47% 35% 23% 26% 30%
Subex Systems Ltd. 26% 31% 53% 23% 28% 31% 30% 14% 20% 22% 23%
Mastek Ltd. 1% 41% 20% 23% 12% 17% 18% 18% 5% 9% 9%
Igate Global Solutions Ltd. 33% 4% 4% 11% 4% 9% 10% 7% 0% 4% 2%
Infotech Enterprises Ltd. 16% 37% 30% 24% 18% 21% 19% 9% 5% 10% 11%
N I I T Technologies Ltd. NA 10% 8% NA 16% 20% 19% NA 7% 11% 11%
Nucleus SoftwareExports Ltd. -9% 30% 34% 16% 21% 24% 37% 9% 12% 20% 25%
N I I T Ltd. 8% -44% 12% 10% 0% 19% 13% -3% -11% 9% 9%
K P I T CumminsInfosystems Ltd. 86% 99% 20% 15% 15% 13% 14% 9% 11% 11% 10%
Sasken Communication
Technologies Ltd.NA 139% 28% NA 36% 17% 13% NA 18% 10% 7%
Scandent SolutionsCorporation NA 403% 32% NA 31% 15% 17% NA 4% 7% 10%

8/7/2019 IT_Mid_Caps_The_Untold_Story
http://slidepdf.com/reader/full/itmidcapstheuntoldstory 34/38
APPENDIX
Growth & Margins
FY04
Revenue Growth EBITDA Margin PAT Margin
FY05 FY06E FY03 FY04 FY05 FY06E FY03 FY04 FY05 FY06E
Cranes Software Intl. Ltd. 85% 43% 22% 49% 47% 55% 61% 23% 29% 28% 28%
Aftek Infosys Ltd. 52% 37% 37% 50% 47% 45% 36% 47% 39% 35% 28%
Aztec Software &Technology Services Ltd. -15% 137% 95% -1% 12% 24% 24% -9% 3% 18% 18%
Average
Median
37% 60% 41% 27% 30% 27% 34% 16% 20% 16% 22%
38% 49% 29% 19% 25% 26% 33% 12% 15% 19% 21%
Subex Systems Ltd. 26% 31% 53% 23% 28% 31% 30% 14% 20% 22% 23%
Aptech Ltd. -9% -17% 2% 15% 23% -30% 44% 5% 9% -49% 20%
K P I T CumminsInfosystems Ltd. 86% 99% 20% 15% 15% 13% 14% 9% 11% 11% 10%
Nucleus Software ExportsLtd.
-9% 30% 34% 16% 21% 24% 37% 9% 12% 20% 25%
HCL Technologies 32% 39% 16% 25% 24% 28% 23% 18% 17% 19% 17%
i-flex Solutions 28% 44% 8% 33% 27% 27% 14% 27% 22% 21% 8%
Patni Computers 177% 28% 26% 50% 23% 24% 19% 37% 16% 18% 13%
Average 50% 38% 22% 31% 26% 28% 25% 23% 20% 21% 19%
Median 32% 38% 19% 27% 25% 27% 26% 20% 19% 20% 20%
Top 10 Mid-Cap Companies
*Certain companies among the Large-Cap and Mid-Cap segments do not follow a Financial Year end (April-March).For such companies, we have aggregated their financials for such period based on their published quarterly reportsSource : Avendus Estimate, Company Annual Reports, CMIE Database.
Large-Cap Companies
Company Name
Geodesic InformationSystems Ltd. 82% 129% 114% 65% 65% 62% 61% 36% 44% 47% 45%
Hexaware Technologies Ltd. 49% 54% 8% 9% 11% 17% 16% 4% 11% 12% 12%
Geometric SoftwareSolutions Co. Ltd.
28% 54% 25% 31% 28% 27% 22% 19% 19% 16% 9%
Infosys Technologies 33% 47% 29% 35% 33% 33% 34% 26% 26% 27% 26%
Tata Consultancy Services 30% 35% 19% 24% 25% 30% 31% 20% 22% 20% 24%
Satyam Computers 17% 37% 40% 25% 29% 26% 31% 15% 19% 20% 24%
Wipro Technologies 36% 38% 17% 27% 23% 26% 26% 19% 17% 20% 20%

8/7/2019 IT_Mid_Caps_The_Untold_Story
http://slidepdf.com/reader/full/itmidcapstheuntoldstory 35/38
APPENDIX
Valuation
GeodesicInformationSystems Ltd.
5.7 7.9 17.0 6.2 8.8 12.8 28.0 11.3 13.0 16.9 37.44.0
Polaris SoftwareLab Ltd.
1.9 1.8 1.6 10.2 10.3 12.6 16.1 18.1 17.8 24.9 60.72.3
Rolta India Ltd. 1.8 1.4 3.3 2.5 3.4 3.0 6.9 4.7 7.6 5.2 10.91.6
Cranes SoftwareIntl. Ltd.
1.8 2.8 6.1 NA 3.9 5.1 9.3 NA 6.4 10.1 20.1NA
Sasken
CommunicationTechnologies Ltd. NA NA 4.6 NA NA NA 35.5 NA NA NA 63.8NA
Aftek Infosys Ltd. 2.3 2.8 4.2 4.7 4.8 6.3 11.1 5.0 5.8 8.2 14.22.4
3i Infotech Ltd. NA NA 2.2 NA NA NA 10.5 N17.9NA
Mphasis B F L Ltd. 2.8 2.6 2.6 10.2 12.2 12.2 10.6 15.0 16.6 16.2 16.32.3
SubexSystems Ltd. 1.9 2.4 4.9 4.2 6.7 7.7 16.2 7.0 9.4 11.1 21.61.0
Mastek Ltd. 1.0 0.8 1.2 6.8 8.2 4.7 6.9 8.8 18.7 8.6 12.71.6
Aztec Software& TechnologyServices Ltd.
2.4 2.1 4.1 NA 19.8 8.9 17.4 NA 75.2 11.6 22.72.9
Igate GlobalSolutions Ltd.
0.9 1.2 1.2 9.6 23.6 13.4 12.1 15.8 NA 33.8 48.31.0
InfotechEnterprises Ltd. 1.0 0.9 2.2 7.7 5.5 4.2 11.3 20.2 21.2 8.4 19.21.8
N I I TTechnologies Ltd. NA 1.1 1.3 NA NA 5.6 6.4 NA NA 10.1 11.0NA
Nucleus SoftwareExports Ltd. 0.8 1.6 4.5 6.7 4.1 6.5 12.4 11.1 7.0 8.0 18.01.0
ScandentSolutionsCorporation
NA 2.2 1.9 NA NA 14.4 10.9 NA NA 29.3 18.0NA
GeometricSoftwareSolutions Co. Ltd.
2.1 2.1 2.8 8.8 7.3 7.7 12.1 13.9 11.1 13.3 26.32.7
N I I T Ltd. 0.9 0.8 1.4 10.8 NA 4.4 10.7 NA NA 9.1 16.41.1
Aptech Ltd. 1.0 1.2 4.3 2.6 4.4 NA NA 8.3 10.7 NA NA0.4
K P I T CumminsInfosystems Ltd. 1.0 1.1 1.7 8.1 6.5 8.2 12.4 12.8 8.8 9.8 16.71.2
*Certain companies among the Large-Cap and Mid-Cap segments do not follow a Financial Year end (April-March).For such companies, we have aggregated their financials for such period based on their published quarterly reportsSource : Avendus Estimate, Company Annual Reports, CMIE Database.
Company Name FY04
Market Cap/Sales Market Cap/EBITDA Market Cap/PAT
FY05 TTM Dec 05 FY03 FY04 FY05 TTM Dec 05 FY03 FY04 FY05 TTM Dec 05FY03
Mid-Cap Companies
HexawareTechnologies Ltd. 1.4 2.0 2.2 7.2 12.6 11.5 13.2 15.2 13.2 15.7 17.00.6

8/7/2019 IT_Mid_Caps_The_Untold_Story
http://slidepdf.com/reader/full/itmidcapstheuntoldstory 36/38
Average
Median
1.8 2.0 3.47.4 8.7 8.0 13.112.8 15.9 13.4 1.8
1.8 1.6 2.67.7 7.0 7.1 11.2 1.6
VisualsoftTechnologies Ltd. 2.3 1.4 2.6 9.4 6.6 5.1 10.8 13.2 9.7 9.3 20.73.4
ZensarTechnologies Ltd. 0.8 0.9 1.3 9.9 8.0 5.6 7.6 23.9 17.1 7.9 12.31.0
Average
Median
Cranes SoftwareIntl. Ltd. 1.8 2.8 6.1 NA 3.9 5.1 9.3 NA 6.4 10.1 20.1NA
Aptech Ltd. 1.0 1.2 4.3 2.6 4.4 NA NA 8.3 10.7 NA NA0.4
K P I T CumminsInfosystems Ltd. 1.0 1.1 1.7 8.1 6.5 8.2 12.4 12.8 8.8 9.8 16.71.2
Nucleus SoftwareExports Ltd. 0.8 1.6 4.5 6.7 4.1 6.5 12.4 11.1 7.0 8.0 18.01.0
Aztec Software &TechnologyServices Ltd.
2.4 2.1 4.1 NA 19.8 8.9 17.4 NA 75.2 11.6 22.72.9
GeometricSoftwareSolutions Co. Ltd.
2.1 2.1 2.8 8.8 7.3 7.7 12.1 13.9 11.1 13.3 26.32.7
2.0 2.6 5.2 6.1 7.9 8.3 14.7 10.6 16.1 11.6 21.61.8
1.9 2.1 4.2 6.4 6.6 7.7 12.4 11.2 10.1 11.1 20.11.2
GeodesicInformationSystems Ltd.
5.7 7.9 17.0 6.2 12.6 11.5 13.2 15.2 13.2 15.7 17.04.0
*Certain companies among the Large-Cap and Mid-Cap segments do not follow a Financial Year end (April-March).For such companies, we have aggregated their financials for such period based on their published quarterly reportsSource : Avendus Estimate, Company Annual Reports, CMIE Database.
APPENDIX
Valuation
Company Name FY04
Market Cap/Sales Market Cap/EBITDA Market Cap/PAT
FY05 TTM Dec 05 FY03 FY04 FY05 TTM Dec 05 FY03 FY04 FY05 TTM Dec 05FY03
Mid-Cap Companies
Top 10 Mid-Cap Companies
Aftek Infosys Ltd. 2.3 2.8 4.2 4.7 4.8 6.3 11.1 5.0 5.8 8.2 14.22.4
Subex SystemsLtd.
1.9 2.4 4.9 4.2 6.7 7.7 16.2 7.0 9.4 11.1 12.61.0
HexawareTechnologies Ltd. 1.4 2.0 2.2 7.2 12.6 11.5 13.2 15.2 13.2 15.7 17.00.6

8/7/2019 IT_Mid_Caps_The_Untold_Story
http://slidepdf.com/reader/full/itmidcapstheuntoldstory 37/38
APPENDIX
Valuation
Company Name FY04
Market Cap/Sales Market Cap/EBITDA Market Cap/PAT
FY05 TTM Dec 05 FY03 FY04 FY05 TTM Dec 05 FY03 FY04 FY05 TTM Dec 05FY03
Average
Median
InfosysTechnologies 5.8 6.5 8.9 20.1 17.7 19.8 26.0 26.8 22.7 24.5 33.97.0
Tata ConsultancyServices
NA 6.0 7.0 NA NA 20.2 24.1 NA NA 29.7 31.2NA
Wipro
Technologies4.8 5.2 6.4 28.7 20.6 20.0 25.5 41.1 28.0 26.3 33.77.7
SatyamComputers 3.1 3.2 4.7 13.3 10.8 12.1 16.1 21.5 15.8 16.2 21.23.3
HCL Technologies 2.5 2.9 4.5 12.5 10.5 10.6 19.8 16.7 15.4 15.1 25.43.1
i-flex Solutions 5.8 3.8 5.7 12.1 21.1 14.0 25.5 14.9 26.3 18.0 39.24.0
Patni Computers 2.3 2.5 3.6 NA 10.0 10.2 17.2 NA 14.4 14.0 24.1NA
4.1 4.3 5.8 17.3 15.1 15.3 22.0 24.2 20.4 20.6 29.85.0
4.0 3.8 5.7 13.3 14.2 14.0 24.1 21.5 19.2 18.0 31.24.0
Large-Cap Companies
*Certain companies among the Large-Cap and Mid-Cap segments do not follow a Financial Year end (April-March).For such companies, we have aggregated their financials for such period based on their published quarterly reportsSource : Avendus Estimate, Company Annual Reports, CMIE Database.

8/7/2019 IT_Mid_Caps_The_Untold_Story
http://slidepdf.com/reader/full/itmidcapstheuntoldstory 38/38
Avendus Advisors Pvt. Ltd.
Mumbai
Disclaimer :
Bangalore www.avendus.com
This report should not be construed as an offer to sell or the solicitation of
an offer to buy any security in any jurisdiction where such an offer or
solicitation would be illegal. We are not soliciting any action based on this
material. Recipients of this report should conduct their own investigation
and analysis including that of the information provided. The information
contained in this report is based on the information available with the
company. Wherever information is sourced from a public source, the same
has been quoted. The advice/recommendations rendered in this report is
merely recommendatory in nature and not binding. Any decision or action
taken by this recipient based on this report shall be solely and entirely at
the risk of the recipient. Options expressed are our current opinions as of
the date appearing on this material only.
No part of this material may be (i) copied, photocopied, or duplicated in any
form by any means or (ii) redistributed without prior written consent of
Avendus.


