Embed Size (px)
Citation preview

ANALYST BRIEFING
11 May 2012
1Q12 Performance Result

Disclaimer
2
The views expressed here contain information derived from publicly available sources that have not been independently verified. No representation or warranty is made as to the accuracy, completeness or reliability of the information. Any forward looking
information in this presentation has been prepared on the basis of a number of assumptions which may prove to be incorrect. This presentation should not be relied upon as a recommendation or forecast by PT.Indo Tambangraya Megah Tbk. Nothing in this release should be construed as either an offer to buy or sell or a solicitation of
an offer to buy or sell shares in any jurisdiction

Agenda
3
1. Introduction
2. Operational Review
3. Commercial Review
4. Financial Review
Appendices

Disclaimer
4
Agenda
(a) Highlights of 1Q12 Results
(b) Board of Management
1. Introduction

5
Highlights of 1Q12 Results
Unit: USD Million
Total Revenue
Gross Profit Margin
EBIT
Net Income
ASP (USD/ton)
Q-Q
(21%)
(3%)
(23%)
(33%)
(2%)
1Q12
578
36%
169
124
$101.1
y-y
+23%
+4%
+44%
+31%
+16%
Coal Sales: 5.7 MtDown 1.4 Mt
-20% Q-QUp 0.2 Mt
+4% y-y
1Q11
468
32%
117
95
$87.3
4Q11
733
39%
220
185
$103.1

6
Somyot RuchirawatCommissioner
Rudijanto BoentoroCommissioner
Ir. Lukmanul Hakim, MMCommissioner
Prof. DR. Djisman S.SimandjuntakIndependent Commissioner
Ibrahim Yusuf
President Commissioner &Independent Commissioner
Somruedee ChaimongkolCommissioner
Board of Commissioners
Previously held the position as President Director (2001-2012)

2012 Board of Directors
7
Hartono WidjajaDirector
Leksono PoerantoDirector
Edward Manurung SE, MBADirector
Pongsak ThongampaiPresident Director
Sean Trehane PellowDirector
Previously held the position as Operational Director (2003-2012)
Also holds the position as President Director of PT Kitadin (2009-now)
Also holds the position as BontangOperation Group Head (2011-now)

Disclaimer
8
Agenda
2. Operational Review
(a) ITM Group Operations
(b) Indicative Output Targets
(c) Mine by Mine Operations

ITM Group Operations
9
1Q11 2Q11 3Q11 4Q11 1Q12 2Q12E
Units: Million Ton
QUARTERLY OUTPUT
5.2
5.8
6.77.2
5.7
6.8
Indominco
Trubaindo
Bharinto
Kitadin
Jorong
East Kalimantan
Bunyut Port
Balikpapan
Palangkaraya
Banjarmasin
Central Kalimantan
South Kalimantan
KITADIN-EMBALUT
0.7 Mt
INDOMINCO 15.0 Mt
TRUBAINDO 7.1 Mt
BHARINTO0.7 Mt
JORONG 1.0 Mt
Samarinda
Jorong Port
Bontang Coal Terminal
Captive coal-fired power
project
KITADINTANDUNG MAYANG2.7 Mt
2012 Target: 27mt2012 OUTPUT TARGET

Indicative output targets*
10
0
5
10
15
20
25
30
35
40
2008 2009 2010 2011 2012E 2013E 2014E 2015E
Indominco
Trubaindo
Bharinto
Kitadin
* Not including inorganic growth.** These finished coal output targets are indicative only and may subject to change.
Jorong
Units: Million Ton
MAJOR QUARTERLY UPDATES
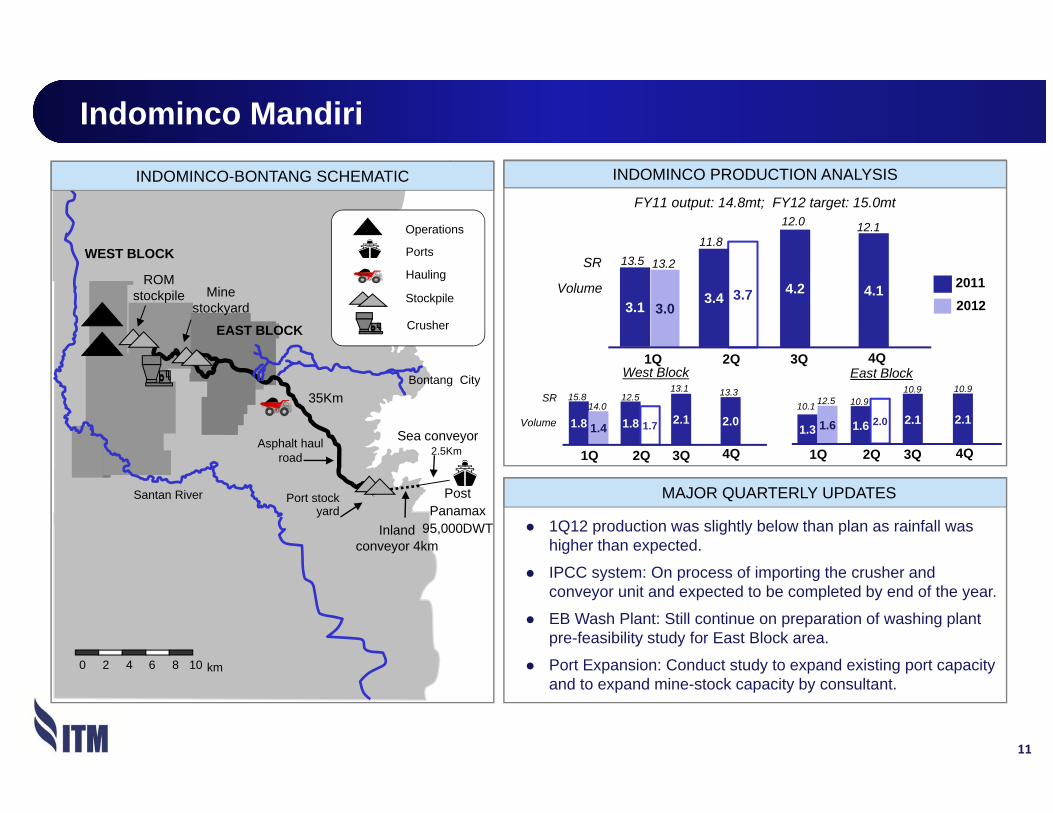
Indominco Mandiri
11
3.7
EAST BLOCK
Santan River Port stock yard
Bontang City
Asphalt haul road 2.5Km
35Km
Sea conveyor
Mine stockyard
Inland conveyor 4km
0 106 82 km4
WEST BLOCK
Operations
Stockpile
Ports
Hauling
Crusher
ROM stockpile
INDOMINCO-BONTANG SCHEMATIC
Post Panamax
95,000DWT
INDOMINCO PRODUCTION ANALYSIS
3.1 3.4 4.2 4.1
1Q 2Q 3Q 4Q
20112012
SR 13.511.8
12.0 12.1
West Block
1.8 1.8 2.1 2.0
1Q 2Q 3Q 4Q
East Block
1.3 1.6 2.1 2.1
1Q 2Q 3Q 4Q
SR 15.8 12.513.1 13.3
10.1 10.910.9 10.9
Volume
FY11 output: 14.8mt; FY12 target: 15.0mt
Volume
3.0
13.2
1.7 2.01.4 1.614.0 12.5
1Q12 production was slightly below than plan as rainfall was higher than expected.
IPCC system: On process of importing the crusher and conveyor unit and expected to be completed by end of the year.
EB Wash Plant: Still continue on preparation of washing plant pre-feasibility study for East Block area.
Port Expansion: Conduct study to expand existing port capacity and to expand mine-stock capacity by consultant.

Trubaindo and Bharinto
12
Mahakam River
Operation
Stockpile
Hauling
Barge Port
Crusher
South Block 1(Dayak Besar)
North Block
40kmMine to port
KedangpahuRiver
ROM stockpile
BunyutPort
0 10 2515 205 km
Product coal conveyor, stacking,
stockpile
TRUBAINDO-BHARINTO SCHEMATIC
EAST KALIMANTAN
Bharinto 60km south west of
TrubaindoNorth Block
South Block 2(Biangan)
PT. BHARINTO
PT. TRUBAINDO
TRUBAINDO PRODUCTION ANALYSIS
1.5 1.7 1.7 1.8 2.1
1Q 2Q 3Q 4Q
SR : 10.0 11.9 14.1
12.4FY11 output: 7.1mt; FY12 target: 7.1mt
20112012Volume :
BHARINTO PRODUCTION ANALYSIS
1Q 2Q 3Q 4Q
FY12 target: 0.7mt
Volume : 0.0 0.0 0.0 0.00.1
20112012
1.8
13.4
0.0
Trubaindo: 1Q12 production was slightly higher than plan due to additional stock from ROM stockyard.
Bharinto: Coal production already commenced since April 2012.Coal hauling and coal crushing activities already commenced since 1st week of May 2012.
MAJOR QUARTERLY UPDATES
TRUBAINDO PRODUCTION ANALYSIS

Kitadin Embalut and Td.Mayang
13
Balikpapan
MahakamRiver Samarinda to Muara Berau
Bontang city
EMBALUT
Embalut Port
to Muara Jawa
ROM stockpile
Operations
Stockpile
Ports
Hauling
Crusher
0 106 82 km4
5km Mine to port
TD. MAYANG
EAST KALIMANTAN
IMM EB
KITADIN SCHEMATIC
IMM WB
Bontang Port
EMBALUT PRODUCTION ANALYSIS
0.3 0.3 0.3 0.4
1Q 2Q 3Q 4Q
SR : 8.9 8.7 11.2 11.5FY11 output: 1.3mt; FY12 target: 0.7mt
Volume :
TD.MAYANG PRODUCTION ANALYSIS
1Q 2Q 3Q 4Q
Volume :0.0 0.0 0.0
0.3
FY11 output: 0.4mt; FY12 target: 2.7mt
20112012
201120120.40.5
15.1SR :
0.3
12.1
0.6
15.1
Kitadin Embalut: 1Q12 production achieved slightly higher than plan due to normal weather condition and good support from mining contractor.
Kitadin Tandung Mayang:1Q12 production achieved according to plan as most of the mining equipment has already put in place.Expect 2.7mt production for the full year of 2012.
MAJOR QUARTERLY UPDATES

Jorong
14
Coal terminal
Jorong
Pelaihari
Pacific Ocean
Haul road
Operations
Stockpile
Hauling
Barge Port
0 10 2515 205 km
20km
JORONG SCHEMATIC JORONG PRODUCTION ANALYSIS
0.3 0.3
1Q 2Q 3Q 4Q
SR :
FY11 output: 1.4mt; FY12 target: 1.0mt
8.6
Volume : 0.4
8.6
0.4
8.6
201120120.3
8.6
0.3
8.6
1Q12 production achieved slightly above target due to better weather condition.
Annual production output will be maintained at around 1.0mt due to limited reserves.
MAJOR QUARTERLY UPDATES

Disclaimer
15
Agenda
3. Commercial Review
(a) Long-term Coal Market Analysis
(b) Coal Market Update
(c) ITM Coal Sales
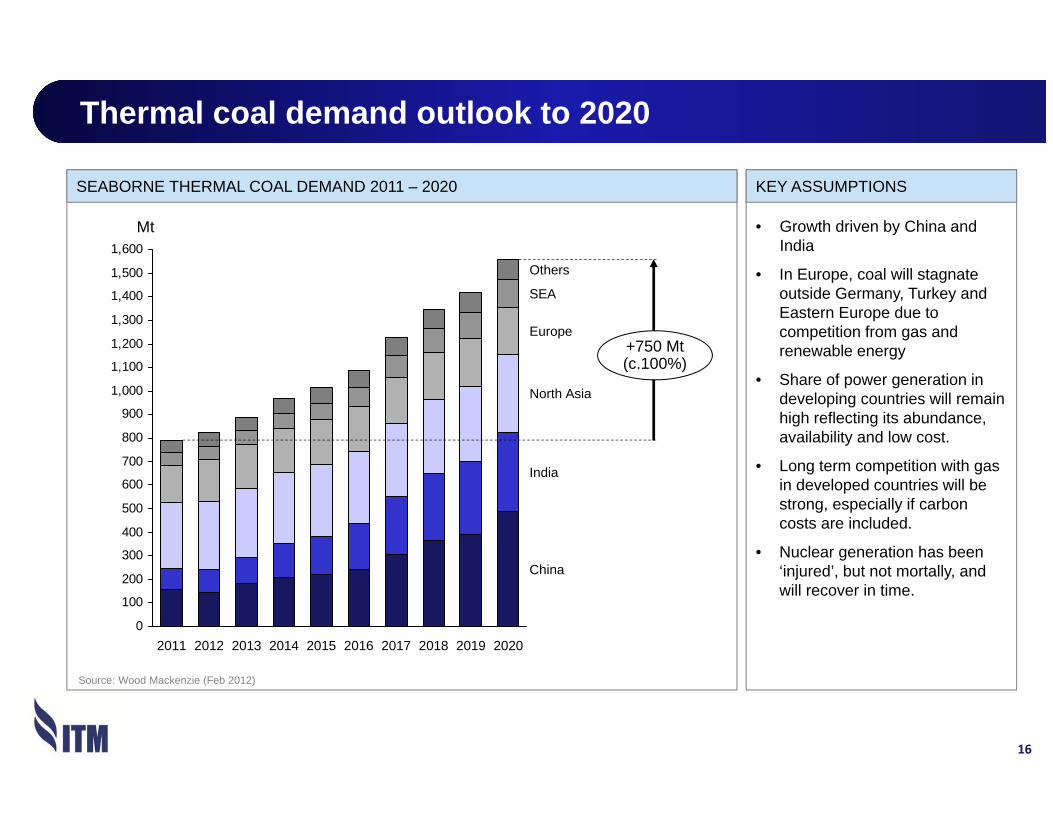
Thermal coal demand outlook to 2020
0
100
200
300
400
500
600
700
800
900
1,000
1,100
1,200
1,300
1,400
1,500
1,600
+750 Mt(c.100%)
China
India
North Asia
Europe
SEA
Others
2020201920182017201620152014201320122011
Source: Wood Mackenzie (Feb 2012)
Unit: MtSEABORNE THERMAL COAL DEMAND 2011 – 2020 KEY ASSUMPTIONS
• Growth driven by China and India
• In Europe, coal will stagnate outside Germany, Turkey and Eastern Europe due to competition from gas and renewable energy
• Share of power generation in developing countries will remain high reflecting its abundance, availability and low cost.
• Long term competition with gas in developed countries will be strong, especially if carbon costs are included.
• Nuclear generation has been ‘injured’, but not mortally, and will recover in time.
Mt
16

17
Key dynamics affecting long term Asian thermal coal marketIS
SU
ES
GOVERNMENT POLICY
DEMAND ELASTICITY
NUCLEAR GAS FREIGHTMACRO-ECONOMICS
+++
--
-
++
---
NE
T IM
PAC
T ?
+
• Developing countries growth
• EU debt risks
• Credit issues
• Exchange rate risks
• China: price cap
• India: nuclear policy, coal tax, environmental
• Indonesia: DMO, export tax, foreign % limits
• Australia: MRRT, carbon tax
• S.Africa: mining law, tax policy
• Demand-side management and new tech
• Japan: target to reduce energy consumption 7% by 2030
• China: target to reduce energy (by 16%) and carbon (by 17%) intensity by 2015
• Aftermath of Fukushima: delays, cancellations
• Japan: closed (c. 90 Mtce*) but how much will come back ?
• Taiwan: cap ?
• China and India diversification of supply security ?
• US: low gas price; availability of domestic coal
• China: shale gas; Russian and Burma pipelines
• Gas price in Asia linked to oil price: not competitive with coal (LNG delink ?)
• Low freight rates now
• Will rise
• Rise will limit Columbia, US and some South Africa exports to Asia
Development time lags
Medium term Time lags if recover
Time lags Short to medium term
* Million tonne of coal equivalent (based on 6,700 kcal/kg GAD)

18
Long term thermal demand and supply outlook 2011 – 2015
Source: Wood Mackenzie, Company
Change in supply (Mt)
Change in demand (Mt)
+112+75
+65 +15
+40
+20
+15REST OF WORLD
NORTHEAST ASIA
SOUTHEAST ASIA
CHINA
INDIA
EUROPE
+90+25
+40+80
- 5
COLOMBIA
SOUTH AFRICA
INDONESIA
AUSTRALIA
Total Change +230Mt

19
Long term thermal demand and supply outlook 2011 – 2020
Source: Wood Mackenzie, Company
+30
+320
+245
+45 NORTHEAST ASIA
SOUTHEAST ASIA+65
+45
Change in supply (Mt)
Change in demand (Mt)
REST OF WORLD
INDIA
CHINA
EUROPE
+290
+265
+65
+20
+30
+30
+60- 10
AUSTRALIA
INDONESIA
SOUTH AFRICA
MOZAMBIQUECOLOMBIA
USA
Total change +750Mt

20
New thermal coal supply considerations for Asian market
* Low Rank Coal or LRC (CV less than 4,500 kcal/kg GAR); note that Indonesian government defines as coal with CV less than 4,200 kcal/kg GAR)Source: Wood Mackenzie, Company
Change in supply (Mt)
QUALITY: Downward shift in coal quality. LRC* is forecast to have the fastest production growth and accounts for 50% of Indonesia’s marketable reserves
INFRASTRUCTURE: Required rail in the longer term (Sumatra, Central Kalimantan)
POLICY: Tax, DMO, etc.
INFRASTRUCTURE: Require commitment of production and infrastructure expansion (Surat, Galilee)
POLICY: Policy constraints delay timetables.
FREIGHT: Low competitiveness in Asia due to substantial freight disadvantage to Australia and Indonesia.
INFRASTRUCTURE: Require major logistic infrastructure improvement and commitments (esp. from growth markets like China and India)
COST: Cannot out compete Indonesian margins
FREIGHT: Low competitiveness in Asia esp. from east coast
POLICY: Environmental.
DOMESTIC COAL. QUALITY / COST: New production is lower CV while replacement production costs rising relatively quickly
AUSTRALIA
INDONESIA
CHINA
COLOMBIA
USA

21
Focus on Australian and Indonesian supply analysis
AUSTRALIA (40% of supply growth 2011 – 2020) INDONESIA (35% of supply growth 2011 – 2020)
0
50
100
150
200
250
Surat
SydneyGalileeGunnedahOthers
Identified vsunidentified
Required supply growth
Source: Wood Mackenzie, Company
Unidentified
0
50
100
150
200
250
BaritoE. KaliMahakamSumatraOthers
Identified vsunidentified
Required supply growth
Source: Wood Mackenzie, Company
• Requires additional supply for medium and long term needs• Reliance on Sydney basin in the short term and Surat in the
longer term• Surat and Galilee require new infrastructure• Environmental sensitivities and challenges
• Limited large scale projects in pipeline• More than half of identified supply is low ranked coal (LRC)• Environmental and policy constraints
Unidentified
Mt Mt

22
Seaborne thermal coal cost curve analysis
2012 CV ADJUSTED COST CURVE (6,322 GAR) 2020 CV ADJUSTED COST CURVE (6,322 GAR) ?
0
10
20
30
40
50
60
70
80
90
0 200 400 600 800CUMULATIVE SUPPLY (Mt)
Vietnam
Indonesia
Colombia
S.Africa Australia
RussiaChina
US
• Higher stripping ratio, lower quality, depleting reserves for current capacity
• Lower quality, higher-cost production for future capacity
• Indonesia continues to be competitive in Asia
• Australia less competitive due to stronger A$
• Columbia / US to Asia depends on low freight rate
CUMULATIVE SUPPLY (Mt)
0 100 200 300 400 500 600 700 800 9001,000 1,500
50
100
150
200
2012
20202020
DEMAND
???
$/t$/t
~$6/t
~$5/t
Source: Wood Mackenzie, Company Source: Wood Mackenzie, Company

23
Prices must rise to support cost of new capacity
ILLUSTRATIVE INCENTIVE PRICES FOR NEW COAL PROJECTS ($/t)INCENTIVE COAL PRICES FOR NEW COAL PROJECTS COMMENTS
Source: Wood Mackenzie, AWR Lloyd analysis
0
10
20
30
40
50
60
70
80
90
100
110
120
130
140
Min
Avg.*
Max
APPALACHIAUS
SURATAUSTRALIA
ILLINOISUS
LRC**INDONESIA
GALILEEAUSTRALIA
CV ADJUSTED FOB CASH COST
CAPITAL FOR RAIL,
PORT?CAPITAL
FOR LOGISTICS?
QUALITY, FREIGHT
DIFFERENTIAL?
CAPITAL
2012$/t
* Capacity weighted average** Low Rank Coal or LRC (CV less than 4,500 kcal/kg GAR); note that Indonesian government defines as coal with CV less than 4,200 kcal/kg GAR
• Most new projects are yesterday’s “undesirable projects” due to:
• Poorer quality
• Costly and difficult logistics
• More challenging policy issues
• Prices will have to be high enough to incentivize development of these projects

24
The trend to lower quality and higher cost coal supply
ESTIMATED PORTION OF LOW RANK COAL IN LONG TERM INDONESIAN SUPPLY COMMENTS
85%
LRC*
15% 25%
49%
Potential LRC*26%
300Mt 570 Mt
REQUIRED CAPACITY
2012 2020
Source: Wood Mackenzie, Company
* Low Rank Coal or LRC (CV less than 4,500 kcal/kg GAR); note that Indonesian government defines as coal with CV less than 4,200 kcal/kg GAR
SUPPLY
• Flat output for mid and high cvcoal
• Significant portion of new capacity could be LRC
• More blending of mid CV with LRC to improve attractiveness of LRC
BUYERS
• Need to be flexible and can be more flexible
• Blending for cost and quality
• High CV segment tighter requiring adjustments to purchase policy and coal handling

25
1Q 2012 seaborne thermal coal market drivers
WEATHER CHINESE DEMAND OTHER DRIVERS
• Indonesia wet season was normal. Stocks starting to build as rains lessen.
• Chinese winter was normal followed by water shortages.
• Australian storms/floods damage has been limited.
• GDP growth declining but still relatively good at 8.2%*
• Coal production increased beyond demand increase, but again levels vary by region.
• Imports in 1Q, double 1Q 2011, but 75% of 4Q 2011.
• Policy uncertainty affecting confidence.
• Downward trend in sentiment.
• Uncertainty impacting forecasts due to European debt concerns, Middle East/N. Africa unrest, and exchange rate trends.
• Rate/timing of Chinese import increase – a question?
• Can U.S.A. continue to sell below cost?
• Gas prices reverse to coal’s disadvantage, while short term USA diverts coal to export.
• 2012 world growth forecast 2.2% (Prev. 2.0%); Asian growth forecast 6.5% (Prev. 6.0%)

ASP held up well in 1Q 2012.
Some pressure from weaker market prices, and product mix should cap ASP improvement in 2Q-4Q 2012.
ITM remains protected by relatively high ‘sold with price’ status (+62%) and hedge status (+7%).
26
ITM ASP VS BENCHMARK PRICES COMMENTS
0
20
40
60
80
100
120
140
160
180
200
Mar
-07
Jun-
07
Sep
-07
Dec
-07
Mar
-08
Jun-
08
Sep
-08
Dec
-08
Mar
-09
Jun-
09
Sep
-09
Dec
-09
Mar
-10
Jun-
10
Sep
-10
Dec
-10
Mar
-11
Jun-
11
Sep
-11
Dec
-11
Mar
-12
Monthly BJIQuarterly BJIQuarterly Banpu Indonesia ASP
Unit: $/t
ITM ASPs vs seaborne thermal coal benchmark prices
Monthly NEXQuarterly NEXQuarterly ASP
ASP 1Q12 $101.1/tASP FY10 $97.1/t
NEX* May 03, 2012$101.0

Indicative 2012 Coal Sales
Coal sales contract and pricing status CommentCoal sales contract and pricing status
Contract Status Price Status
Contracted Fixed
Index
TARGET SALES 2012: 27 Mt
UncontractedUnpriced
Unsold
90%
10%
62%
24%4%
10%
Mostly insulated from market weakness (including hedged tonnes, 70% of sales)
27

28
ITM coal sales 1Q12
COAL SALES BREAKDOWN BY DESTINATION 1Q12 (Mt) COAL SALES 1Q12
Total Coal Sales: 5.7 Mt
31%
16%
10%
9%
9%
7%
5%
5%3%
3% 2%
Japan
China
Taiwan
S Korea
Italy
Thailand
Philippines
Hong KongIndia
Indonesia
JAPAN0.9 Mt
PHILIPPINES0.4 Mt
THAILAND0.5 MtINDIA
0.2 Mt
HK0.2 Mt
S KOREA0.3 Mt
CHINA1.8 Mt
TAIWAN0.5 Mt
ITALY0.3 Mt
1.5
INDONESIA0.6 Mt
MALAYSIA0.1 Mt
Malaysia

29
COAL SALES BREAKDOWN BY DESTINATION 2012e (Mt) COAL SALES 2012e
Total Coal Sales: 27.0 Mt
20%
18%
11%9%
8%
7%
6%
6%
4%2%
2% 5%
Japan
China
Taiwan
S Korea
Italy
Thailand
Philippines
Hong Kong
India
Indonesia
JAPAN4.9 Mt
PHILIPPINES1.6 Mt
THAILAND1.9 MtINDIA
2.2 Mt
HK0.6 Mt
S KOREA1.2 Mt
CHINA5.5 Mt
TAIWAN2.5 Mt
ITALY1.7 Mt
1.5
INDONESIA3.0 Mt
MALAYSIA0.5 Mt
Malaysia
ITM coal sales 2012e
Others
OTHERS 1.4 Mt

Disclaimer
30
Agenda
4. Financial Review
(a) Performance Results
(b) Cash Cost
(c) Capital Expenditure

Sales Revenue
31
1Q11 2Q11 3Q11 4Q11 1Q12
1Q11 2Q11 3Q11 4Q11 1Q12
Units: Million Ton
SALES VOLUME
Units: USD/Ton
AVERAGE SELLING PRICE
Units: USD Million
REVENUE* GROWTH
1Q11 2Q11 3Q11 4Q11 1Q12
5.5 5.2
6.8 7.1
97.4
87.3
98.4
103.1
1Q11 2Q11 3Q11 4Q11 1Q12
466500
675
729
5.7
101.1
575
+5% YoY-18% QoQ
+16% YoY-2% QoQ
+23% YoY-21% QoQ
Indominco
Trubaindo
Kitadin
Jorong
* excluding port revenue

1Q11 2Q11 3Q11 4Q11 1Q12
Average Cost
32
Units: US$/Ltr
FUEL PRICE
STRIP RATIO
Units: US$/Ton
TOTAL CASH COST
58.564.6
70.2 71.068.5
1Q11 2Q11 3Q11 4Q11 1Q12 1Q11 2Q11 3Q11 4Q11 1Q12
Units: US$/Ton
CASH PRODUCTION COST
1Q11 2Q11 3Q11 4Q11 1Q12
41.545.3
49.3 48.0 51.9
0.93
1.10 1.05 1.03 1.07
11.911.4
12.3 12.213.1
*Total cash cost including royalty and SG&ASource: Pertamina

Average Gross Margin
33
* COGS included royalty
Units: USD million
ITM Consolidated Indominco Trubaindo Kitadin Jorong1Q11
468
33%
364
22%
164
28%
37%44
18%
19
13%4Q11
733
39%
512
28%
242
38%
93
46%38
17%
Total Revenue
GPM* (%)
1Q12
578
36%
28%
341
27%
228
35%
83
42% 23
18%1Q11 4Q11 1Q12 1Q11 4Q11 1Q12 1Q11 4Q11 1Q12 1Q11 4Q11 1Q12

EBITDA
34
Units: USD million CONSOLIDATED
MINE BY MINE
*COGS = Prod cost + Transport cost + Inv. movement
Revenue4Q111Q11 1Q12
234.6
COGS SellingRoyalty Admin
131.7
71.6
47.0
10.61.9
Indominco Trubaindo1Q11
Kitadin Jorong4Q11
125.6
65.544.3
3.7
1Q12
88.0
64.5
34.8
3.2
Units: USD million
1Q11 4Q11 1Q12 1Q11 4Q11 1Q12 1Q11 4Q11 1Q12
183.8
+55.6+0.2
+25.5
Royalty decreased with revenues
Lower sales volume and ASP
+40% YoY-21% QoQ
(155.2)
+23.1

Net Income
35
4Q11 1Q12OthersEBIT IncomeTax
DerivativeTransactions
FOREXNet Fin.Charges
1Q11
CONSOLIDATED
MINE BY MINE
Units: USD million
95.2
184.9
124.5
55.2
5.4
33.0
(0.4)
Indominco Trubaindo JorongKitadin
116.9
30.145.7
(7.8)
61.442.5
23.3
1Q11 4Q11 1Q12 1Q11 4Q11 1Q12 1Q11 4Q11 1Q12 1Q11 4Q11 1Q12
Units: USD million
(0.6)
Derivative gain/loss
+31% YoY-33% QoQ(50.6)
+1.0
(0.9)(10.3) (12.1)
+12.5
Lower sales volume and ASP

Balance Sheet
36
Net Gearing (%)
Net D/E (times)
(0.34)
(34%)
(Units: USD million)CASH POSITION
2008
222
(Units: USD million)
DEBT POSITION
2008
11
55
2009
429
(0.47)
(44%)
2009
2011
612
0
2011
(0.57)
(57%)
295
2010
0
2010
(0.41)
(41%)
2008 2009 20112010
771
1Q12
0
1Q12
(0.64)
(64%)
1Q12

2012 Capital Expenditure Plan: USD 209 mln
37
Units: USD million
Indominco
Trubaindo
Bharinto
Kitadin
Jorong
ITM Consolidated
5
Realized up to Mar’12
2012 major Capex plan
108
80
9
209
1
6
13
2
1
Note: Total capex plan including Jakarta office
5
1

Disclaimer
38
Question & Answer

Disclaimer
39
Agenda
Appendices

ITM Structure and History
40
ITMG
65.00%
Indominco Trubaindo Bharinto Jorong
PT Indominco Mandiri
(CCOW Gen.I)
PT Trubaindo Coal Mining
(CCOW Gen II)
PT Kitadin-Embalut
(KP)
PT Bharinto Ekatama
(CCOW Gen III)
PT Jorong Barutama Greston
(CCOW Gen II)
50.00%
PT Indo Tambangraya Megah Tbk.
Banpu Minerals (Singapore) Pte Ltd
99.99% 99.99% 99.99%99.99% 99.67%
174 Mt
695 MtResources
Reserves102 Mt
327 MtResources
Reserves13 Mt
150 MtResources
Reserves112 Mt
298 MtResources
Reserves6 Mt
144 MtResources
Reserves
Banpu Minerals Co.Ltd
Reserves 411* Mt
Resources 1,627* Mt
BMS
99.99%
BMC
Banpu PCLBanpu
Public35.00%
Kitadin
PT Kitadin-Td.Mayang
(KP)
10 Mt13 Mt
Resources
Reserves
BCI50.00%
100.00%Banpu Coal
Investment Co.Ltd
Note: * Updated Coal Resources and Reserves as of 31 Mar 2012
East Kalimantan East Kalimantan South KalimantanEast KalimantanEast / Central Kalimantan
INDONESIAN STOCK EXCHANGEIPO 18th Dec 2007
6,500-7,300 kcal/kg6,000-6,300 kcal/kg 5,800 kcal/kg6,400-6,800 kcal/kg 6,700 kcal/kg 5,300 kcal/kg

Coal Resources and Reserves (as of 31 Mar 2012)
41
Indominco
Kitadin-Td.Mayang
Jorong
Trubaindo
W.Block
E.Block
242 Mt
26 Mt
453 Mt
151 Mt
14Mt
144 Mt
5Mt
327 Mt
100 Mt
298 Mt
112 Mt
12Mt
RESOURCES
RESERVES
Kitadin-Embalut
Total Reserves: 411 Mt
Total Resources: 1,627 Mt
145 Mt
9Mt
Bharinto
Note: * Updated Coal Resources and Reserves as of 31 Mar 2012 based on estimates prepared by Competent Persons (consider suitably experienced under the JORC Code)in 31 Dec 2010 and deducted from coal sales volume in 1Q12

42
Income Statement
Unit: US$ thousand 1Q12 4Q11 1Q11 QoQ% YoY%
Net Sales 577,955 733,123 468,330 -21% 23%Gross Profit 209,207 285,596 152,077 -27% 38%GPM 36% 39% 32%SG&A (40,025) (65,788) (34,646) EBIT 169,182 219,808 117,431 -23% 44%EBIT Margin 29% 30% 25%EBITDA 183,851 232,773 131,754 -21% 40%EBITDA Margin 32% 32% 28%Net Interest Income / (Expenses) 3,028 2,035 255 FX Gain / (Loss) (2,138) (1,222) 3,187 Derivative Gain / (Loss) 26,916 37,180 9,497 Others (21,492) (9,346) (3,379) Profit Before Tax 175,496 248,455 126,991 -29% 38%Income Tax (50,999) (63,539) (31,765) Net Income 124,497 184,916 95,226 -33% 31%Net Income Margin 22% 25% 20%