Embed Size (px)
Citation preview

DlIC It'L Copy III)
Lfl A
N
N
- DTICELECTDEC 11990
~OF ~ D
CUSTOMER SERVICE ANALYSIS OFTACTICAL AIR COMMAND
BASE LEVEL SUPPLY SUPPORT
THESIS
Esperanza Flores, B.S.Captain, USAF
AFI T/GLM/LSM/ 90 5-17
DEPARTMENT OF THE AIR FORCE
AIR UNIVERSITY
AIR FORCE INSTITUTE OF TECHNOLOGY
W right- Patterson Air Force Base, Ohio

AFIT/GLM/LSM/90S-17
DTICELECTE
S DEC 1 1990
CUSTOMER SERVICE ANALYSIS OFTACTICAL AIR COMMAND
BASE LEVEL SUPPLY SUPPORT
THESIS
Esperanza Flores, B.S.Captain, USAF
AFIT/GLM/LSM/90S-17
Approved for public release; distribution unlimited

The opinions and conclusions in this paper are those of theauthor and are not intended to represent the officialposition of the DOD, USAF, or any other government agency.
Acze,:ion For
iNTIS CRA&MDDC TAB3I~U j.-: ouoced L
By
i Avii xi~d jor

AFIT/GLM/LSM/90S-17
CUSTOMER SERVICE ANALYSIS OF
TACTICAL AIR COMMAND
BASE LEVEL SUPPLY SUPPORT
THESIS
Presented to the Faculty of the School of Systems and
Logistics of the Air Force Institute of Technology
Air University
In Partial Fulfillment of the
Requirements for the Degree of
Master of Science in Logistics Management
Esperanza Flores, B.S.
Captain, USAF
September 1990
Approved for public release; distribution unlimited

Acknowledgements
I would like to thank Lt Col Frederick W. Westfall, my
thesis advisor, and Major Robert F. McCauley, my reader, for
their guidance and assistance in completing this thesis. I
also would like to thank Dr. Guy S. Shane for assisting in
the statistical analysis portion of the research.
A very special thank you goes to Col Roger N. Seagrave,
HQ TAC/LGS, and Lt Col Michael A. Christensen, HQ TAC/LGSS,
for sponsoring this thesis and for giving me their full
support in obtaining the relevant data.
I also wish to express my appreciation to my good
friend and classmate Mr. Thomas J. Stout for his support and
encouragement during the 15 months at AFIT.
I am especially grateful to God for providing the
physical strength and clarity of mind I needed during the
seemingly endless hours of writing this thesis. His
presence made all the difference.
Esperanza F]n,.es
ii

Table of Contents.
4 Page
Acknowledgements............. . ... .. .. .. .... i
9 List of Figures. .................... v
List of Tables.....................vi
Abstract.......................viii
1. Introduction ................... 1
Customer Service Defined .. ......... 1General Issue................2Specific Problem ................ 7Investigative Questions and Hypotheses - 8Scope and Limitations ............ 11Summary...................11
ii. Literature Review. ............... 13
Introduction. ............... 13Current Literature. ............. 14Customer Service studies In ThePrivate Sector. ..................... 19Customer Service Studies In CivilEngineering (CE). ............. 34Summary...................35
III. Methodology .................... 37
Objectives .. .......................... 38Identification of Population. ........ 38Research Design .............. 40Statistical Analysis. ............ 47Summary...................50
IV, Results ...................... 51
Survey Response Rate. ............ 51Reliability Test Results. .......... 52
4 Univariate Analysis ............ 53Bivariate Analysis. ............ 61Analysis of open-Ended Questions . . . . 77Analysis Limitations. ........... 86Summary...................87
iii

Page
V. Analysis, Conclusions, and Recommendations. 89
Analysis And Conclusions ......... .. 89Implications of the ResearchMethodology .... .............. . 101Recommendations ... ............ 104Suggestions For Further Research .... 109Summary ..... .................. I
Appendix A: Survey Notification From HQ TAC/LGSTo Chiefs of Supply .. .......... .. 113
Appendix B: Example Of Letter Addressed ToCommanders Of Major CustomerOrganizations ... ............. . 114
Appendix C: Survey Instrument .. ........... .. 115
Appendix D: Frequency Distributions And HistogramsOf Customer Service Criteria ..... 131
Appendix E: Mean And Standard Deviation ScoresOf Importance Measurements ...... 173
Appendix F: Mean And Standard Deviation ScoresOf Performance Ratings Given To BaseSupply On All Criteria Used In Study 177
Appendix G: Comparison Of Importance AndPerformance Ratings For CustomerService Criteria .. ........... . 181
Bibliography ....... ................... 185
Vita ......... ....................... 188
iv

List of Fiqures
Figure Page
1 Frequency Distribution of Response Rateby Base ....... .................. 55
2) Frequency Distribution of Grade ofRespondents ...... ................ 56
3 Frequency Distribution of RespondentsYears of Service .... ............. 57
4 Frequency Distribution of the OrganizationalLevel of the Respondents .. ......... 58
5 Frequency Distribution of Responses byOrganizational Function ... .......... 60
6 Customer Service Analysis for TAC BaseSupply ....... .................. 95
v

List of Tables
Table Page
1 Guidelines For Customer Service ...... 17
2 Most Important Variables To RespondentsIn The Office System and FurnitureIndustry ...... ................. 26
3 Variables Ranked High In Importance ForWhich No Vendors Were Perceived To BeProviding Superior Service . ........ 28
4 Variables Rated Most Important In TheOffice Systems and Plastics Industries 32
5 Reliability Coefficients Of CompositeVariables ...... ................. 53
6 Composition of Organizational Functions inthe Population ..... .............. 59
7 Importance Measurements - PearsonCorrelation Coefficients for CompositeVariables ...... ................. 62
8 Performance Measurements - PearsonCorrelation Coefficients for CompositeVariables ...... ................. 63
9 Mean and Standard Deviation Scores ofCriteria Rated Very Important ........ 65
10 Mean and Standard Deviation Scores ofPerformance Ratings Given to Base Supplyon Criteria Rated as Very Important . .. 67
11 Comparison of Importance and PerformanceRatings for Customer Service Elements . . 70
12 Importance Perceptions: SignificantDifferences Between Customer Segmentsby Grade ...... ................. 73
13 Importance Perceptions: SignificantDifferences Between Customer Segmentsby Years of Military Fervice . ....... 74
vi

Table Page
14 Importance Perceptions: SignificantDifferences Between Customer Segmentsby Organizational Level .. .......... . 75
15 Performance Evaluation: SignificantDifferences Between Customer Segmentsby Organizational Level .. .......... . 76
16 Performance Evaluation: SignificantDifferences Between Customer Segmentsby Organizational Function . ........ 77
17 Comparison of Criteria Found VeryImportant In TAC Base Supply and OtherOrganizations Or Industries ......... .. 92
18 Summary of Service Criteria IdentifiedAs Important By TAC Base Supply MajorCustomers ...... ................. .. 102
vii

AFIT/GLM/LSM/90S-17
Abstract
The general purpose of this study was to evaluate the
perceptions of TAC Base Supply major customers. The
research had five major objectives: 1) identify the service
criteria important to the major customers of TAC Base
Supply; 2) identify their perceptions of Base Supply
performance; 3) measure the range of variation between
customer segments; 4) identify opportunities available to
Base Supply for improving customer satisfaction; and 5)
provide a benchmark for future evaluations of Base Supply
customer satisfaction.
The research methodology developed to meet the research
objectives was based on that used by the leading experts in
the field of customer service.
The research identified a total of 20 criteria rated as
very important to TAC supply major customers. In addition,
the findings suggested that the majority of major customers
perceived significant shortfalls in Base Supply support.
The identification of important criteria and the evaluation
of perceptions of performance highlighted the opportunities
available to TAC Base Supply for improving customer service
satisfaction of its major customer base.
This study provided additional evidence of the
importance of customer service, and it provided a benchmark
for evaluating Base Supply customer satisfaction.
viii

CUSTOMER SERVICE ANALYSIS OF TACTICAL AIR COMMAND
BASE LEVEL SUPPLY SUPPORT
I. Introduction
During the last 10-15 years, the emphasis iirms in the
private sector have placed on customer service and customer
satisfaction has been steadily increasing. According tj
customer service experts, two developments have fueled this
emphasis: a growing awareness of the im:ortance of personal
service ir the emerging service economy, and increasing
competition for market share (1:50). In a global market
environment, it has become increasingly difficult for
companies to achieve product differentiation. Many
companies offer the same product, and often for the same
price. Consequently, competing solely on the basis of
product or price is insufficient. The principal determinant
of success has become excellence in customer service (7:24).
Customer Service Defined
Leading experts agree the meaning of customer service
is subject to wide interpretttion (29:113). Some companies
define customer service in terms of performance standards, a
philosophy, an attitude, or a process that took place
between the supplier and the customer. In addition, it is
not unlikely for suppliers and their customers to have a
very different opinion of what customer service is. Keeping
1

that in mind, La Londe and Zinszer defined customer service
as "a customer oriented corporate philosophy which
integrates and manages all of the elements of the customer
interface within a predetermined optimum cost service mix:
(16:iv). Stock and Lambert defined it as "the measure of
how well the logistics system is performing in creating time
and place utility for a product, including postsale support"
(29:113). These two definitions are deemed appropriate for
Base Supply and the military environment in which it
operates. A customer oriented philosophy is indeed highly
desirable, if not necessary, in an organization whose
responsibility it is to support customers with great
diversity of military missions. But measuring how well Base
Supply is performing in creating time and place utility for
items that could ultimately determine the readiness of a
fighting wing or a bomb wing is nothing less than
imperative.
General Issue
Even though the importance of customer service has been
clearly established in recent years, many managers still do
not know just how i Cisfied or unsatisfied their customers
are because they do not actively seek their feedback. If
companies receive only a few and sporadic complaints, they
may wrongfully assume all is well on the customer service
front. But surveys have shown customers often do not bother
to complain. A survey conducted in 1988 by The Technical
2
Assistance Research Program, a Washington, DC consulting
agency, revealed that even though a dissatisfied customer
did not file a complaint, he told his story to at least 10
people. On the other hand, a happy customer told his story
to at least five people (11:38). In a survey conducted by
the Forum Corporation of 2,374 customers from 14
organizations more than 40 percent listed poor service as
the number-one reason for switching to the competition.
Only 8 percent listed price (3:25). Additionally, results
of a 1988 Gallup Survey on consumer issues, conducted for
the American Society for Quality Control, demonstrated that
the majority of consumers equated high quality service with
courtesy, promptness, and the perception that their needs
are being satisfied. Price was infrequently mentioned
(13:33-34).
The companies committed to superior customer service,
however, routinely survey their customers to determine what
they want and expect, and set customer service levels
accordingly. Examples of companies that have achieved
resounding success in customer satisfaction were: IBM,
Hewlett-Packard, Disney, McDonald's, and Frito-Lay. These
companies put into practice what Peters and Waterman
identify as the key factors to customer satisfaction in
their book "In Search for Excellence": get close to the
customer, and instill an obsessive concern for customer
service into the corporate culture (23:14).
3

As a result of this growing concern with customer
satisfaction, consulting firms specializing in customer
service training programs have begun to emerge across the
country. At the time of this writing, some of these firms
conducted only in-house training while others also held open
sessions. Examples of these were: Better than Money
Corporation in Bloomington, MN; Career Development Seminars
and Keye Productivity Center in Kansas City, MO; Kaset, Inc.
in Tampa, FL; Education Technology Consortium in Waltham,
MA; and Zenger-Miller in Cupertino, CA (1:50).
At the heart of the customer satisfaction issue,
however, is the level of inventory a compan_ is willing to
carry to protect itself against stockouts (29:397). After
all, any additional services a company provides would be
insufficient if customers cannot obtain the item they needed
when they needed it. But protection against stockouts
results in increased inventory carrying costs because the
higher the percentage of customer demands satisfied, the
greater the level of inventory that was needed to provide
that satisfaction. Hence, companies were faced with the
formidable challenge of finding the optimum tradeoff between
service and costs.
Like companies in the private sector, Base Supply seeks
to satisfy its customers by maintaining a level of inventory
that will satisfy customer demands while minimizing
inventory costs. To this end, a safety or buffer stock is
held in Base Supply warehouses. Safety stock is inventory
4

held in excess of replenishment stock to cover for short-
range variations in demand and leadtime, also referred to as
order and shipping time (29:400).
The current method used by Base Supply to determine the
optimum level of safety stock is based on a C factor. The C
factor "is a multiplier of the safety level and is used to
set the percent of time materiel should be on hand to
support a customer during a replenishment order" (2:4).
Specifically, it represents the number of standard
deviations of leadtime demand that will be available to
support customers during the reorder cycle. Per AFM 67-1,
Volume II, Part Two, a standard deviation of one is used to
compute safety levels in Base Supply. However, exceptions
to this rule may be authorized by HQ USAF/LEYS (6:19-24).
A statistical rule of thumb, which can be applied to a
demand distribution that is approximately normal, is useful
in understanding how this C factor of one (1) translates
into a customer service level of 84 percent. The rule of
thumb is called the Empirical Rule and it says the
following:
a. Approximately 68% of the measurements (demands)will fall within one standard deviation of the mean.
b. Approximately 95% of the measurements (demands)will fall within two standard deviations of the mean.
c. Essentially all measurements (99.74 percent ofdemands) will fall within three standard deviations of themean (21:105).
What this means is that a normal distribution of
customer demands with plus or minus one standard deviation
5

will contain approximately 68 percent of all customer
demands. This leaves 16 percent of the demands in each of
the tails of the normal distribution which translates into a
customer service level of 84 percent (29:413). In the same
fashion, a normal distribution with plus or minus two
standard deviations will contain approximately 95 percent of
all customer demands. This leaves 2.5 percent of the
demands in each of the tails, which translates into a
customer service level of approximately 97.5 percent. Thus,
by using a C factor of 1 (one standard deviation) Base
Supply is able to satisfy approximately 84 percent of all
possible demand occurrences.
An 84 percent service level implies that sixteen out of
every 100 customer demands will not be satisfied. This
sounds. acceptable considering the great variability in Base
Supply customer demands. But the critical issue to consider
is the perception of those customers whose demands are not
satisfied by Base Supply. Do they perceive Base Supply as
an organization supportive of the customer?
It is important to note that the customer service
objective currently in use by Base Supply is based almost
exclusively on the level of service that can be achieved by
inventory policies. Measures of customer support
effectiveness include stockage effectiveness rates, bench
stock fill rates, base service store and individual
equipment unit fill rates, mission capable (MICAP) rates,
etc. But no method exists to determine what factors affect
6

the customer's satisfaction and how to measure those
factors.
Although AFM 67-1 requires Chiefs of Supply to
designate highly experienced personnel to Supply/customer
assistance teams "responsible for visiting activities to
determine if customers are receiving quality support and
where Supply support is not satisfactory," no clear rules
exist to guide supply personnel in conducting these visits
(6:2-3). Thus, it is very possible that the majority of
these visits are done merely to fulfill a requirement rather
than to determine what the customer needs or expects from
Base Supply.
Indisputably, one of the main complaints voiced by Base
Supply customers is that they cannot get the items they need
when they need them. And unfortunately, Base Supply has had
limited options at the local level to remedy this particular
problem. Nevertheless, one of the objectives of this study
was to identify opportunities for Base Supply to improve its
level of customer satisfaction.
Specific Problem
Exploratory research showed that no formal studies have
been conducted to measure the customer's perception of
satisfaction with Base Supply in order to develop a customer
service strategy. The management question which was the
focus of this research was, "How is Base Supply meeting the
needs and expectations of its customers?"
7
The specific objectives of the research were: 1)
identify the service criteria important to the major
customers of TAC Base Supply; 2) identify customer
perceptions about the performance of TAC supply
organizations; 3) measure the range of variation between
customer segments; 4) identify opportunities available to
Base Supply for improving customer satisfaction; and 5)
provide a benchmark for future evaluations of Base Supply
customer satisfaction.
Investigative Questions and Hypotheses
To meet the objectives of this research, Tactical Air
Command (TAC) Base Supply customers were asked to rate the
importance of 45 customer service criteria, and to rate the
performance of Base Supply on those same criteria. The two
ratings were then analyzed to determine any statistically
significant differences between the two. The purpose of the
analysis was to answer the following investigative
questions:
1. What customer service criteria are most important
to TAC Base Supply customers and how do they perceive the
performance of Base Supply on those criteria they rate most
important to their satisfaction?
2. Are TAC Base Supply organizations performing
according to customers' expectations?
3. Are there differences in the perception of Base
Supply's performance according to:
8

a. Gradeb. Years of Servicec. Organizational Leveld. Organization typee. Base of Assignment
To measure the range of variation that may exist in the
perceptions of supply customers, respondents were segmented
into the following categories:
Grade groups: El - E3E4 - E6E7 - E901 - 0304 - 06
Years of service: Less than one year1-5 years6-10 years11-15 years16-20 years21 or more years
Organizational level: MAJCOM HeadquartersNumbered Air ForceWingSquadronBranchSection
Organization type: MaintenanceTransportationCommunications
Base: All CONUS TAC bases.
The following hypotheses were formulated to facilitate
quantitative analysis:
a. To identify variations by rank:
H01a: There is no statistically significantdifference between customer segments by grade in regards totheir view of the importance of customer service elements.
H01b: There is no statistically significantdifference between customer segments by grade in regards totheir perception of Base Supply's performance.
9

b. To identify variations by years of service:
H,2a: There is no statistically significantdifference between customer segments by years of service inregards to their view of the importance of customer serviceelements.
H02b: There is no statistically significantdifference between customer segments by years of service inregards to their perception of Base Supply's performance.
c. To identify variations by organizational level:
H,3a: There is no statistically significantdifference between customer segments by organizational levelin regards to their view of the importance of customerservice elements.
H03b: There is no statistically significantdifference between customer segments by organizational levelin regards to perception of Base Supply's performance.
d. To identify variations by organizational function:
H04a: There is no statistically significantdifference between customer segments by organizationalfunction in regards to their view of the importance ofcustomer service elements.
H04b: There is no statistically significantdifference between customer segments by organizationalfunction in regards to their perception of Base Supply'sperformance.
e. To determine variations by base of assignment:
H:5a: There is no statistically significantdifference between customer segments by base of assignmentin regards to their view of the importance of customerservice elements.
H05b: There is no statistically significantdifference between customer segments by base of assignmentin regards to their perception of Base Supply's performance.
10

Scope and Limitations
Due to the limited time available for conducting this
research, its scope was restricted to the external audit
phase of a full customer service audit. The external audit
was directed at identifying the customer service criteria
relevant to the supply customer's satisfaction, and the
evaluation of supply customer perceptions.
This research was also limited to investigating the
perceptions of the major customers of Base Supply in the
Tactical Air Command (TAC), with the exception of the two
TAC overseas bases; Howard and Keflavic. Consequently, the
results of this study only can be generalized to major
customers served by domestic TAC Base Supply organizations.
Summary
In the private sector it has been clearly established
that service is the new standard by which customers are
measuring an organization's performance. Extensive research
substantiated that excellence in customer service is not a
competitive edge, it is the competitive edge (7:2). In
regards to the applicability of customer service practices
in the private sector to the Base Supply environment, it is
important to recognize that in a government organization
such as Base Supply the absence of a profit motive has a
definite impact on its customer service orientation. While
it could be argued that Base Supply has no real motive to
keep its customers happy, the tremendous impact Base Supply
1i

support has on the Air Force mission supports the need to
develop specific strategies for customer satisfaction.
This thesis is organized in five chapters. In this
chapter (I) a general introduction to the research topic was
provided. In Chapter II a review of current literature in
the customer service area and the research studies that
provided the foundation background for this thesis is
presented. In Chapter III the methodology used for this
study is described. In Chapter IV the results of the data
analysis are presented and discussed. In Chapter V a
summary of the study and recommendations are provided.
12

II. Literature Review
Introduction
The objective of this review was to build a foundation
from which to conduct this research effort. This chapter,
divided in three sections, examines the current issues
related to customer service as reflected in the literature.
Section one briefly describes the customer service
guidelines and recommendations most commonly found in the
current literature. Section two describes studies conducted
in the area of customer service by the leading experts in
the field. These studies were reviewed to examine the
research methods used, and to identify the customer service
variables that could be incorporated into the survey
instrument used in this study. Therefore, emphasis was
given to the methodologies and the customer service models
which have been proposed by the experts for measuring
customer service and developing effective customer service
programs. Section three describes two customer service
studies conducted in Air Force Civil Engineering
organizations. The criteria identified as most important to
the satisfaction of Civil Engineering customers were
reviewed to determine if they could be incorporated into
this study.
13

Current Literature
The consumer surveys cited in Chapter I clearly
demonstrated that the majority of American consumers were
more interested in quality and service than in price.
Customers not only expected good quality and service, they
demanded them. It is not surprising, then, that the
companies identified as successful in this intensely
competitive market were those that provided unparalleled
quality and service. But the point emphasized by the
literature was that achieving an unparalleled level of
service does not happen by chance. All companies identified
as successful by the literature worked diligently at
satisfying their customers. They had a clear strategy for
the quality of customer service they provided. Most
important, these companies followed specific guidelines.
In order to provide Base Supply organizations with
specific information that will allow them to develop a
customer service strategy, the strategies which have proven
successful in the private sector, are briefly discussed in
this section. These strategies are: 1) Involve the whole
organization; 2) Develop specific guidelines for customer
service; 3) Segment the customer base; and 4) Measure the
service being provided.
Involve The Whole Organization. A commitment to
customer service must permeate the whole organization
because every level of the organization plays a key role in
providing excellence customer service. In this regard, the
14

experts emphasized that senior management must start the
whole process by making a commitment to service quality,
communicating ti-is commitment to all employees, and keeping
the organization focused on the goal of providing excellent
customer service (26:47). Some experts went even further by
pointing out that it is not enough to have a customer
service strategy that focuses only on treating the customer
right. They believed that if a customer strategy is to
succeed organization managers must treat their employees the
way they want the employees to treat the customers.
According to these experts, if employees are satisfied with
the work environment, they are more likely to be cooperative
with co-workers and customers (4:11). Desatnik emphasized
this viewpoint by stating that "Managing an organization's
human-resources equates with managing its customer services.
To put it another way, employee relations equals customer
relations. The two are inseparable" (7:15). The author's
,,iew is that, in regard to Base Supply, the importance of
focusing both on the customer and the employee cannot be
emphasized enough. The morale of Base Supply personnel
undoubtedly reflects itself on their attitude towards
customers. If supply managers want supply personnel to
demonstrate a commitment to customer service, managers must
demonstrate their own commitment to the well being of their
personnel.
Develop Specific Guidelines for Customer Service.
Experts agreed that employees must have specific guidelines
15

for delivering service to the company's customers. It is
not enough to tell employees to be nice and smile.
Employees should be trained on how to treat the customer
(10:12). This recommendation is particularly important for
the front-line workers in Base Supply who deliver service on
a day to day basis. These front-line workers communicate
loud and clear Base Supply's commitment, or the lack
thereof, to the customer's satisfaction.
Many recommendations were found in the literature in
regard to guidelines that employees can follow to service
customers, but the most comprehensive set of guidelines
which are particularly appropriate for the Base Supply
environment are presented in Table 1.
Segment The Customer Base. Not all customers should be
given'the same level of service. This is important because
all customers do not have the same needs or expectations,
and if a company tries to stretch its resources to satisfy
all customers, it might end up providing mediocre service to
all customers. People Express served as an example of the
futility of this approach. People Express tried to provide
the same level of service to budget and business travelers.
However, while budget travelers were willing to put up with
the inconvenience of long check-in lines and delayed
flights, business travelers expected fast check-in service
and on-time departures. People Express did not segment its
customer base and, therefore, it failed to establish a clear
strategy for satisfying their needs and expectations. This
16

resulted in dissatisfied customers taking their business
elsewhere (5:80).
Table 1
Guidelines For Customer Service
Meet the customer's needs.
Reduce the time it takes for the customer tocomplete his transaction.
Reduce the number of contacts the customer needsto make to get his question answered or aproblem resolved.
Tell the customer precisely what he needs toknow to get a problem resolved.
Bridge the language gap. Do not use companyjargon the customer does not understand.
Do not make the customer feel like a nuisance.
Never make the customer feel at fault.
Never embarrass the customer.
Optimize the use of automated equipment andpersonal attention.
Make line management accountable for servicequality.
Include quality of service as part of employeejob performance criteria.
Adapted from Garfein (10:12)
According to Davidow, it is important that a company
segment its customers based on the services they need and
their willingness to pay for the service. He emphasizes
that,
17

Only after a company has segmented its customers andchosen which ones to serve can it figure out whereto substitute low-touch (service) for high, thusimproving productivity without imperiling customersatisfaction. (5:80)
The idea of segmenting customer service is very
applicable to Base Supply because not all its customers
require the same level of service. Some organizations, by
virtue of their critical mission, require a stronger level
of service. By concentrating its customer service efforts
on satisfying its major customers, Base Supply would not
overstretch its resources, and it could satisfy the majority
of its customers.
Measure The Service Being Provided. To ensure a
company is meeting its customer service objective, it must
have a way of measuring the level of service it is providing
to its customers. Both external and internal measurements
are needed to get a balanced picture of how the company is
doing (19:178).
Stock and Lambert advocated external and internal
measurements and proposed that the best way to accomplish
this is with a customer service audit. An external customer
audit would aim to identify what type of service the
customer expects and how the customer perceives the service
being provided by the organization (29:132). The internal
audit, on the other hand, would evaluate the organization's
current service practices and determine if they are
consistent with customer expectations (29:137). Top
management could then use this information to evaluate its
18

customer service strategy and make the necessary adjustments
to customer service standards. These adjustments, however,
must be consistent with customer needs (29:141). For this
study, an external customer audit was conducted to identify
the customers' needs and evaluate their perception of the
service being provided by Base Supply.
Customer Service Studies In The Private Sector
This section reviews a number of studies that were
conducted in the area of customer service by some of the
recognized leaders on the subject; namely, La Londe and
Zinszer, Sterling and Lambert, and Lambert and Harrington.
The objective of this review was to identify a methodology
that could be used for the analysis of customer satisfaction
in Base Supply, and to identify the customer service
variables that could be incorporated to the survey
instrument. Some similarities existed in the approach the
recognized experts took on customer service. However, La
Londe and Zinszer concentrated on defining and measuring
customer service in order to develop and maintain an
effective customer service strategy. Sterling and Lambert
and Lambert and Harrington, on the other hand, concentrated
on integrating customer service with the other components of
the marketing mix, i.e. price, product, and promotion, and
identifying the contribution of each of these components to
the overall share of business achieved by a firm.
19

La Londe and Zinszer--1976. La Londe and Zinszer's
study was conducted across industries and was exploratory in
nature as the concept of customer service still lacked clear
definition. Hence, one of the main objectives of their
study was to determine how customer service was defined by
the industries involved in the study.
La Londe and Zinszer's methodology consisted of four
phases:
a. Concept Definition. First, a literature review was
conducted to evaluate previous research and writings in the
area of customer service. Second, field discussions were
conducted to evaluate the perceptions of customer service,
and develop and evaluate proposed questionnaires.
Questionnaires were then pretested (16:9).
b. Data Collection. Data was collected through a
series of three questionnaires. The purpose of this
procedure was to gather data concerning the perceptions of
the firm's customer service from three sources: the
individual responsible for product distribution, individuals
in other functional areas within the corporation, and the
customer's view of customer service in comparison with that
of the supplier corporation (16:10).
c. Data Analysis. The data were collected, edited,
coded and tabulated using standard research procedures (La
Londe:13).
d. Data Presentation. The findings were organized by
questionnaire stage and by type of industry.
20

La Londe and Zinszer found that not all firms
explicitly recognized a customer service activity or
function. A large number of respondents described customer
service as an activity such as order processing, handling of
complaints, or troubleshooting. Some regarded customer
service as synonymous with performance levels such as "95
percent in stock". La Londe and Zinszer claim that
performance levels might represent internal targets, but
they represent incomplete measures from the firm's point of
view rather than the customer's point of view (16:2).
The following is a summary of the findings of La Londe
and Zinszer's study (16:120-155):
a. Customer service perception and measurement was
situational to specific industries.
b. Respondents typically evaluated the sales and
advertising effort on the low side of the scale and service
as a more important element.
c. There was a substantial variation in customer
service perceptions between the Transportation and Public
Warehousing industries.
d. Product availability was considered the most
important element of customer service by all of the
industries.
b. Order cycle time was an especially critical element
in the Pharmaceutical industry and merchandising firms of
consumer products.
21

c. Distribution system information was especially
critical in the Food, Electrical, and Paper industries, and
relatively unimportant for Manufacturers of Machine Tools.
Based on their research findings, La Londe and Zinszer
proposed a general model for developing and evaluating a
customer service program. The model consists of the
following steps:
a. The customer service audit. The first part of this
audit involves identifying those factors on which customers
evaluate their suppliers. The second part involves focusing
on competitive service levels. The third part involves
focusing on the management information system support
requirements. The objectives of this part of the audit are
to determine the current levels of customer service within
the firm; the type of reports dealing with customer service
performance; and who in the firm receives the reports
(16:179).
b. Establish customer service standards. Standards
established should reflect the customer's point of view;
provide an operational and objective measure of service
performance; and provide management cues for corrective
action (16:180).
c. Test Cost Sensitivity of Standards. The objective
of this step is to determine the cost implications of
different levels of performance. Conceptually, the higher
the service level, the higher the price of providing and
maintaining those service levels (16:186).
22

d. Implement Customer Service Standards. This step
involves developing an explicit and operational customer
service policy statement. According to La Londe and
Zinszer,
Without a specific (customer servicepolicy) written statement, other functionalelements as well as different sections ofthe distribution function are free to interpretstandards as they see fit. This may result inconflicting or contradictory standards anduncertainty in the organization as to theservice goals of the firm. (16:191)
Another important component of this step involves
thoroughly educating the individuals involved with customer
service (16:192).
e. Develop A Reporting System. The firm must
determine what information is needed; who needs the
information; how often it is needed; and where the
information can be obtained. The objective is to provide
timely information to those accountable for the customer
service strategy of the firm (16:193).
f. Performance Evaluation. This step involves
comparing actual service performance to target performance
levels. This allows managers to take appropriate corrective
action where needed.
g. Periodic Review of Standards and Programs. The
customer service standards should be reviewed periodically
to adjust for any changes in customer needs, changes in the
environment, changes within the firm, and changes in the
information needs of management.
23

Sterling and Lambert--1987. Sterling and Lambert
conducted a customer service study in one type of industry--
office systems and furniture. Their objective was to test a
research methodology with respect to its ability to
determine the marketing variables important to customers,
and identify a customer service and marketing strategy
(28:6). They set out to test the hypothesis that the
"marketing mix components of product, price, promotion and
physical distribution/customer service contribute equally to
the levels of share of business that customers allocate to
manufacturers" (28:6).
They followed a sequential methodology that, in their
opinion, can be readily adapted to other industries.
The methodology consisted of the following phases:
a. External Audit. This phase was used to identify
the services that were important to customers and compile a
list of meaningful questions for their questionnaire.
For this purpose, personal interviews were conducted with
intermediary and end users that purchased office systems and
furniture products from all the major competitors in the
industry. Questionnaires then were mailed to representative
firms served by each major competitor in the industry
(28:8).
b. Internal Audit. During this phase, the internal
records of the industry competitors were audited to identify
their existing levels of customer service. The objectives
of this phase were: to identify how customer service
24

performance was being measured and reported to management;
to identify those services that offered potential
competitive advantages; and determine the potential impact
that improvements in marketing services would have on
overall market share (28:9).
c. Evaluation of Customer Perceptions. The objectives
of this phase were to identify the top rated vendor for each
of the service components evaluated by the respondents;
identify the services for which no vendor was providing
outstanding levels of performance, and those for which only
satisfactory performance was being provided. Another
objective of this phase was to identify those services being
used by customers to differentiate between vendors (28:9).
d. Identification of Opportunities. This phase
consigted of comparing and analyzing the relevant criteria
identified during the first three phases of the study to
determine a strategic marketing mix for the industry (28:9).
The variables used in their study were categorized by
the following marketing mix components: product, price,
promotion, and customer service. A total of 88 variables
were used. Of these, one third represented customer
service/physical distribution services.
The variables identified as most important to the
customers of the office system and furniture industry are
tabulated in descending order of importance in Table 2.
These are the variables for which continued or improved
25
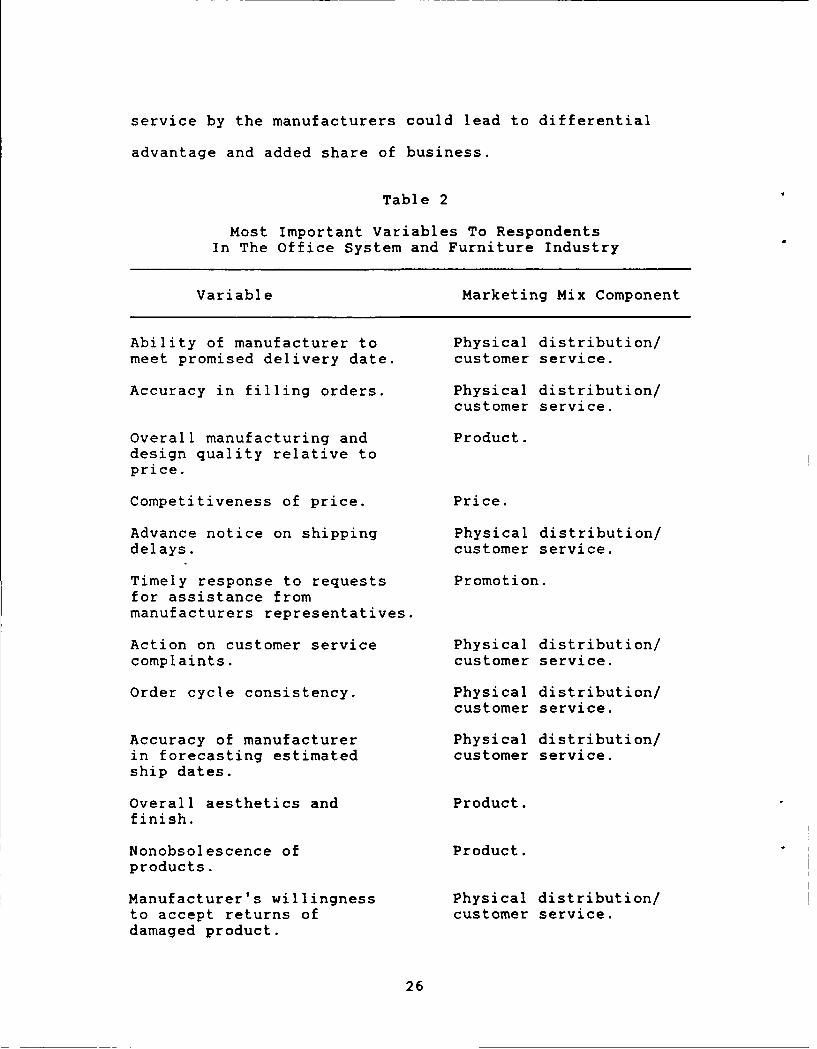
service by the manufacturers could lead to differential
advantage and added share of business.
Table 2
Most Important Variables To RespondentsIn The Office System and Furniture Industry
Variable Marketing Mix Component
Ability of manufacturer to Physical distribution/meet promised delivery date. customer service.
Accuracy in filling orders. Physical distribution/customer service.
Overall manufacturing and Product.design quality relative toprice.
Competitiveness of price. Price.
Advance notice on shipping Physical distribution/delays. customer service.
Timely response to requests Promotion.for assistance frommanufacturers representatives.
Action on customer service Physical distribution/complaints, customer service.
Order cycle consistency. Physical distribution/customer service.
Accuracy of manufacturer Physical distribution/in forecasting estimated customer service.ship dates.
Overall aesthetics and Product.finish.
Nonobsolescence of Product.products.
Manufacturer's willingness Physical distribution/to accept returns of customer service.damaged product.
26

Table 2 (Continued)
Variable Marketing Mix Component
Length of promised lead time Physical distribution/for quick ship orders. customer service.
Completeness of contract Physical distribution/orders. customer service.
Completeness of quick Physical distribution/ship orders. customer service.
Realistic, consistent Price.pricing policy.
Source: Sterling and Lambert (28:22).
Sterling and Lambert's research revealed that several
of the variables which respondents rated as very important
(a mean score of 5.9 or more, on a scale of 1 to 7) received
less than superior performance ratings from the respondents
(a mean score of less than 7). The variables are shown in
Table 3.
Based on their analysis, Sterling and Lambert concluded
that the four components of the marketing mix did not
contribute equally to the share of business allocated to
vendors by end users. In fact, they found that product and
physical distribution/customer service variables
consistently contributed more to the share of the vendors'
business and overall customer satisfaction. Most important,
however, the physical distribution/customer variables
appear to offer vendors the greatest opportunity for
customer satisfaction. These variables represented 10 of
27

Table 3
Variables Ranked High In ImportanceFor Which No Vendors Were Perceived To Be
Providing Superior Service
Variable Marketing Mix Component
Ability of manufacturer to meet Physical Distribution/promised delivery date. customer service.
Competitiveness of price. Price
Advance notice on shipping Physical Distribution/delays. customer service.
Special pricing discounts Priceavailable on contracts.
Timely response to requests Promotion.for assistance.
Accuracy of manufacturer to Physical Distribution/forecast estimated ship dates. customer service.
Ability to expedite/rush Physical Distribution/service on orders. customer service.
Adequate advance notice on Priceprice changes.
Action on customer service Physical Distribution/complaints, customer service.
Source: Sterling and Lambert (28:24).
the 16 variables identified as most important by customers
(see table 2); four of the eight variables identified as
most important in determining the share of business given to
each manufacturer; and four of the seven variables found to
offer the greatest opportunity to gain a differential
advantage in the market (28:1-29).
28
La Londe, Cooper and Noordewier--1988. The general
objective of this study was to reexamine the field of
customer service and the changes that had taken place in
this area since the first industry-wide study conducted by
La Londe and Zinszer in 1976. The focus of the study were
eight industry groupings: Food and Related, Chemical and
Plastics, Pharmaceutical and Health Care, Automotive, Paper,
Electronic, Clothing/Textiles, and Merchandise. The main
objectives of the research were to examine the following
areas:
a. The primary themes of the customer service
literature during the past decade.
b. The factors that had affected customer service
during the past 10 years, and how they had affected it.
c. Changes in the customer service baseline.
d. Ways to integrate customer service into the
strategic planning of the firm.
e. The future role of customer service in the firm
(17:2).
The methodology used for this study consisted of the
following phases: 1) a review of customer service literature
covering the period 1976-1986; 2) the design of
questionnaires to collect pertinent data; 3) the development
and execution of five case studies to illustrate "best
practice" areas in customer service.
A notable finding of La Londe's study was the
difference between how the respondents viewed customer
29

service in 1976 and how they viewed it in 1987. Whereas
respondents in 1976 viewed customer service as a relatively
narrow function or a performance standard, 1987 respondents
viewed it as a process that cut across organizational
functions inside the firm, and suppliers and customers
outside the firm (17:5).
The significant findings of La Londe's study were the
following:
a. Customer service had moved from a reactive to a
proactive activity. That is, firms measured customer
service to determine what level of service customers wanted.
b. Service performance expectations were evolving into
a window of acceptable performance rather than a specific
point, i.e. the ranqe of an acceptable fill rate was 89 to
95 percent.
c. Information had become the key ingredient in
providing effective customer service. This is because the
majority of industries in the study had to respond to
requests for order status information.
d. Changes in logistics systems such as Just-in-Time
(JIT), Materials Requirement Planning (MRP), Distribution
Resource Planning (DRP), etc. were driven by the customer
e. Contractual relationships between buyers and
sellers, rather than transactional relationships, were
becoming the dominant mode in many logistics systems.
f. Cuzto-mer service was considered important by the
respondents in general. But there were significant
30

differences among industries in regards to customer service
practices and performance expectations. For example,
customer service was considered the most important variable
in the automotive industry but relatively unimportant in the
pharmaceutical industry.
g. The scope of customer service had extended to the
international arena as firms became involved in global
markets.
h. Pressure from customers, competitors ana e,-
technology to maintain higher standards of customer service
was expected to increase. The pressures were created by
changes in logistics systems (JIT, MRP, DRP, etc.) (17:5-
69).
Lambert and Harrington--1989. Lambert and Harrington
replicated the methodology used by Sterling and Lambert in
1987 to evaluate whether their findings could be generalized
to other industries. The study was conducted in the
plastics industry to evaluate the customer service provided
by vendors, and to identify appropriate customer service and
marketing strategies (18:45-59).
The significant findings of this study were:
a. Customer service and product quality variables
represented 75 percent of the variables rated most important
by customers.
b. No vendor in the plastics industry was performing
according to customer expectations on the 18 variables rated
as most important by customers.
31

c. The common finding to both industries is that
customer service variables are integral components of the
marketing mix (18:45-59).
A comparison of the variables identified as important
in both industries is presented in table 4. The variables
are presented in the descending order of importance assessed
by the customers in each industry. An asterisk denotes the
variables common to both industries.
Table 4
Variables Rated Mrst ImportantIn The Office Systems and Plastics Industries
Office SystemsAnd Furniture PlasticsIndustry Industry
Ability to meet promised Supplier's resins are ofdelivery date.* consistent quality.
Accuracy in filling order.* Quality of sales force--honesty.
Overall manufacturing and Accuracy in fillingdesign quality relative orders.*to price.*
Competitiveness of Competitiveness ofprice.* price.*
Advance notice on Processability of resin.shipping delays.*
Timely response to requests Suppliers resins are offor assistance from consistent color.manufacturersrepresentatives.*
Action on customer service Consistent lead timescomplaints.* (vendor consistently
meets expected deliverydate).*
32

Table 4 (Continued)
Office SystemsAnd Furniture PlasticsIndustry Industry
Order cycle consistency Ability to expedite(small variability), emergency orders in a
fast responsive manner.
Accuracy of manufacturer Information providedin forecasting estimated when order is placed--ship dates.* projected shipping
date.*
Overall aesthetics and finish. Advance notice onshipping delays.*
Nonobsolescence of products. Adequate advance noticeof price changes.
Manufacturers's willingness Overall quality of resinto accept returns of damaged relative to price.*products.
Length of promised lead time Projected delivery date.for quick ship orders.*
Completeness of contract Actions on ccmplaints.*orders.
Completeness of quick Length of promised leadship orders. times--in-stock
products.*
Realistic, consistent Quality of sales force--pricing policy, prompt follow up.*
Overall demeanor of Information providedsales representatives, when order is placed.
Source: Lambert and Harrington (18:50)
Lambert and Harrington concluded that by focusing on
what is important to the customer, rather than focusing on
the competition, a firm can develop an integrated marketing
strategy and gain a differential advantage in the market
33

place. They also concluded that improved performance on the
information related customer service variables could be
achieved with a real-time logistics information system
(18:58).
Customer Service Studies In Civil Engineering (CE)
Singel--1986. The research conducted by Singel
examined Civil Engineering customer satisfaction in the
Tactical Air Command. The representative sample of the
population consisted of building managers and senior
officers at eight TAC bases. The study identified five
criteria which both building managers and senior officers
rated as very important. These were the following:
a. Notification of Delay (of work).
b. Professionalism of the CE workforce.
c. Completion of work in a timely manner.
d. Clean-up upon work completion.
e. Prompt, accurate information on work status.
In addition, Singel found that while civil
engineering's response time and work quality were also
identified as important by the respondents, they did not
influence customer satisfaction. Instead, "attitude and
professionalism of those providing the service and
information about the civil engineering organization were
factors related to customer satisfaction" (27:75)
Long--1986. Long's study concentrated on measuring
Civil Engineering customer satisfaction at non-TAC Air Force
34

bases. Building managers and Base Civil Engineering (BCE)
commanders from four major commands, SAC, MAC, ATC, and AFSC
were selected for the survey.
The study identified the following criteria as very
important to building managers:
a. Competence
b. Timeliness
c. Commitment of the customer service representatives
to doing a good job (a care about service).
d. A degree of concern about customer problems.
e. Support (20:48).
This study also identified a significant difference
between building managers and BCE commanders in regard to
their perception of the service provided by the Civil
Engineering Customer Service Unit. On a scale of one to
five, building managers showed a mean score of 3.383, while
BCE commanders showed a slightly more favorable mean score
of 3.786. The difference between the two was statistically
significant at the .05 level of significance.
Summary
The purpose of this chapter was to provide a foundation
for examining customer service in Base Supply. Three
different areas were discussed. First, the strategies
advocated by the popular and professional business
literature for establishing customer service programs were
presented. These were: involve the whole organization,
35
develop specific guidelines for customer service, segment
the customer base, and measure the service being provided.
Second, the formal approach to customer service studies
taken by the leading experts in the field was reviewed. The
foundation of the formal methodologies used by the experts
was the external audit because, in their view, no internal
performance measure can substitute for going directly to the
customers to determine what is important to them, and to
identify how they perceive the service being provided.
Finally, the significant findings of customer service
studies in Air Force Civil Engineering organizations were
presented.
36

III. Methodology
The literature review provided the background for the
methodology used in Lhis study. This background was an
important step for it was apparent at the onset of this
study that, because of the numerous and diverse service
functions provided by Base Supply, measuring customer
satisfaction would be a complex task. Many internal
performance measures of customer support effectiveness were
found in use by Base Supply, such as stockage effectiveness,
issue effectiveness, mission capable (MICAP) rates , etc.
But measures of customer service effectiveness, those that
represent the customer's point of view, were not available.
As pointed out in Chapter II, La Londe and Zinszer
claimed that internal performance measures, such as "95
percent in stock," represent incomplete measures of customer
service. Therefore, the drive behind this methodology was
to identify those measures that represent the customer's
point of view.
This chapter presents an explanation of the research
methodology designed to identify those measures that
customers use to evaluate the performance of Base Supply;
and the steps followed to collect the data necessary to
answer the investigative questions and hypotheses posed in
chapter I. The target population is identified, and the
methods used for analysis of the data are described.
37

Objectives
The specific objectives of the methodology designed for
this study were as follows. First, to identify the service
criteria that are important to the major customers of TAC
Base Supply. Second, to identify the customers' perceptions
about the performance of TAC supply organizations. Third,
to measure the range of variation that may exist between
customer segments, such as grade, years of service,
organizational level, organizational function, and base of
assignment. Fourth, to identify any opportunities available
to Base Supply for improving customer satisfaction. And
finally, to provide a benchmark for future evaluations of
Base Supply customer satisfaction.
Identification of Population
In identifying the population for this study the
author's intent was to survey military personnel who, by
direct consequence of their military duties, interacted
frequently with Base Supply and were familiar with its level
of customer service; instead of those who made contact with
Base Supply only sporadically. Although it was assumed the
entire base population was supported by Base Supply, it
could not be assumed that the entire population interacted
directy with Base Supply. A more valid assumption was that
every organization had a limited number of people who
regularly conducted the majority of organizational
transactions with Base Supply. It was assumed that the unit
38
commander and those designated to procure items from Base
Supply were cognizant of how the level of service provided
by Base Supply affected the mission of their organization.
Additionally, it was assumed that every supply organization
had major customers, those who accounted for the majority of
Base Supply's business; and irregular customers, those who
accounted for a small percentage of business. Based on
this, the author attempted to do a census of the population
defined as TAC Base Supply major customers located in the
Continental United States (CONUS) according to the following
conditions:
a. Major customers were defined as the top four
organizations that accounted for the largest
volume/frequency of transactions processed by Base Supply at
each TAC installation in the Continental United States
(CONUS).
b. The population was further defined to include the
following military personnel from each of the top four
customer organizations: the commander, or his equivalent;
and four individuals who routinely interacted with Base
Supply.
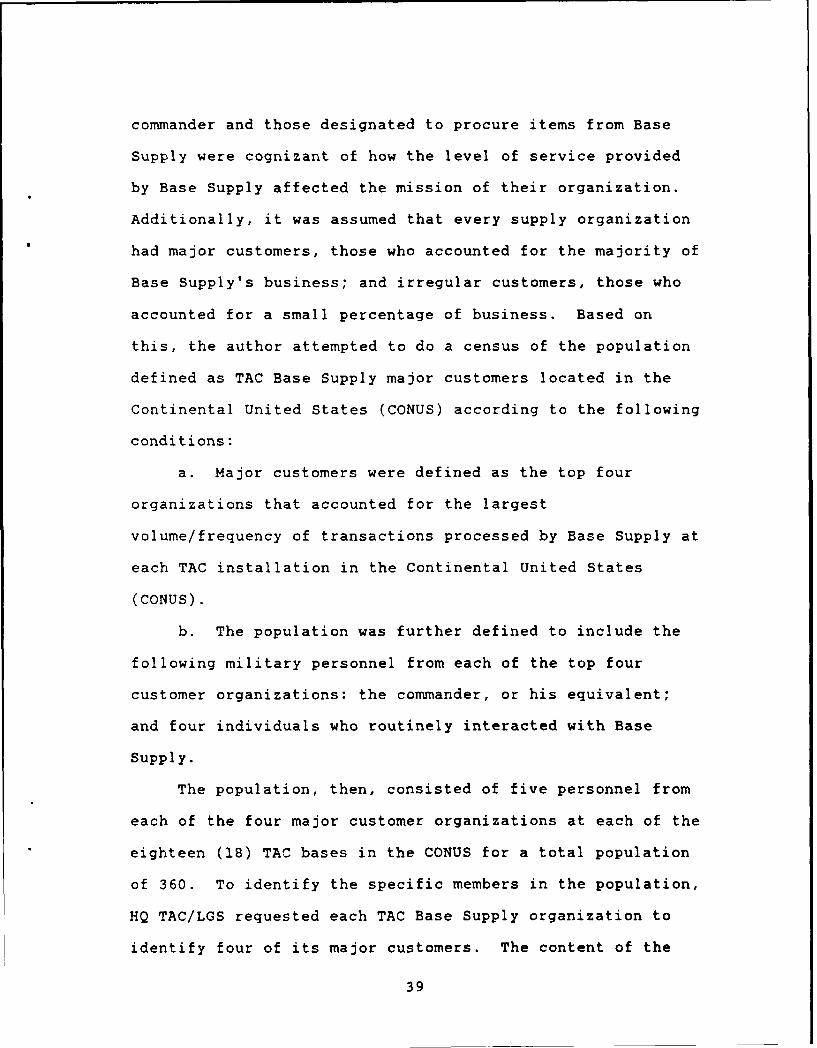
The population, then, consisted of five personnel from
each of the four major customer organizations at each of the
eighteen (18) TAC bases in the CONUS for a total population
of 360. To identify the specific members in the population,
HQ TAC/LGS requested each TAC Base Supply organization to
identify four of its major customers. The content of the
39

message from HQ TAC/LGS to TAC Chiefs of Supply is presented
in letter format in Appendix A.
Five surveys were mailed to the commanders of each
major customer organization, or his/her equivalent, with
instructions to answer one questionnaire and distribute the
remaining four to their personnel who routinely interacted
with Base Supply. A copy of the letter containing these
instructions is presented in Appendix B.
Research Design
The research design used for this study was based on
the methodologies advocated by the leading experts in the
field of customer service. Specifically, the methodology
tested by Sterling and Lambert was modified and adapted for
this study. Sterling and Lambert's study concentrated on
defining and measuring the importance of customer service
either across industries or for a specific industry (28:1)
Their methodology was tested again by Lambert and Harrington
in a study that provided additional evidence of the
significance of logistics/customer service within the
marketing mix (18:44). Their proposed methodology consisted
of the following sequential steps: (1) an external audit to
determine the customer service variables relevant to the
customer; (2) an internal audit to review the customer
service practices of the company; (3) evaluation of customer
perceptions; and (4) identification of the services that
offer the best opportunity for improved market share and/or
40

profit improvement. A full discussion of this methodology
is presented in Chapter II.
For the purposes of this research, a literature review
was incorporated in the methodology to examine how customer
service was measured and customer service levels established
in the private sector. The methodology, then, consisted of
two major steps:
a. A literature review
b. An external audit
(1) Evaluation of customer perceptions.
(2) Identification of opportunities.
The Literature Review. The basic objectives of the
literature review were to gain insights into customer
service in the private sector; examine how it was used to
gain a competitive advantage in the market place;
investigate how it was measured; and identify the customer
service criteria that could be incorporated into the survey
instrument used for this study.
External Audit. The first objective of this study was
to identify the customer service factors important to Base
Supply customers and compile meaningful questions for the
questionnaire portion of the research. To that end,
informal personal interviews were conducted with seven Base
Supply customers at Wright-Patterson AFB and five AFIT
students who were assigned to maintenance squadrons prior to
AFIT. Personnel interviewed were selected on the basis of
present or fairly recent routine interaction with at least
41

one section of Base Supply. A preliminary list of criteria
was prepared to facilitate the interview. Approximately 17
questions were developed from these interviews.
Second, two AFIT theses on customer service in Base
Civil Engineering organizations were reviewed (27; 20).
Four questions which the authors found to be correlated to
customer satisfaction were selected and modified for
applicability to Base Supply customers. The remaining
questions were derived from the literature sources reviewed
(16; 28). In particular, customer satisfaction measures
used by Sterling and Lambert, Stock and Lambert, and La
Londe and Zinszer were modified for use in this study.
Pretest Of The Survey Instrument. A preliminary survey
instrument was developed and pretested to verify its clarity
and measure its reliability. The preliminary questionnaire
contained six questions pertaining to demographic
characteristics of the respondents, 35 questions pertaining
to customer service, and three open-ended questions. The
questionnaire was pretested among 15 AFIT students who were
assigned to maintenance, transportation, and supply
organizations prior to coming to AFIT. Five of these AFIT
students came from TAC organizations.
A reliability test of the data collected by the pretest
yielded reliability coefficients ranging from .62 to .90
which indicated the survey instrument provided a sound
measure of the variables that it was designed to measure.
However, the survey instrument was modified to further
42
enhance its precision based on the feedback provided by the
AFIT survey respondents and faculty members who reviewed the
questionnaire. Five questions that were identified as
redundant were eliminated, and 11 new questions were added
to the survey to enhance the measurement of information
availability, order cycle, and responsive..ess factors.
Design of Survey Instrument. After the pretest of the
survey instrument, a definitive questionnaire was developed
to collect the pertinent data. The questionnaire was
divided into four parts:
PART A was designed to collect demographic data that
would allow for meaningful analysis of differences in
perception of the respondents. The specific data requested
were pay grade, length of military service, base of
assignment, and organizational level of the respondent; type
of organization to which the respondent is assigned; and the
section in Base Supply that the respondent primarily deals
with.
PART B contained the criteria used to Adentify customer
service activities and characteristics that customers
perceived as important to their satisfaction. This part of
the questionnaire asked respondents to rate, on a seven-
point Likert scale, the importance he/she would assign to 45
different customer service practices or characteristics.
The importance ratings allowed were:
43

1 and 2 = Not important
3, 4, 5 = Moderately important
6 and 7 = Very important
In addition, this part included two open-ended questions.
The first question was designed to allow respondents to
identify any additional customer service factors they
considered important to their satisfaction with Base Supply.
The second question invited respondents to explain the
actions they normally take when Base Supply cannot provide
an item when they need it. The purpose of this question was
to identify whether customers tend to use the options
available to them within the supply system, or whether they
tend to circumvent the system, i.e. contact other bases or
depot directly, instead of using supply channels.
PART C measured the customers' perception of Base
Supply's performance on the same customer service criteria
contained in PART B. Respondents were asked to rate, on a
seven-point Likert scale, the performance rating he/she
would give to Base Supply on the 45 customer service
criteria whose importance he/she rated in PART B. The
performance ratings allowed were:
1 and 2 = Poor
3, 4, 5 = Satisfactory
6 and 7 = Excellent
This part also allowed for open-ended responses and any
additional comments respondents might wish to make in regard
to their perceptions of Base Supply. Respondents were asked
44

to comment on anything they particularly liked or disliked
about Base Supply; and comment on any experience with Base
Supply which was particularly satisfying or dissatisfying.
PART D asked respondents to rank the customer service
factors (composite variables) used in the questionnaire in
order of importance. The ranking allowed was on a scale of
one to seven, with one being the most important. The
purpose of this ranking was to provide additional
information in regard to investigative question number one,
i.e. What customer service criteria are most important to
TAC Base Supply customers?
Questionnaires were coded by base and organization
prior to mailing in order to maintain an accurate count of
respondents should a second mailing prove necessary.
Because questionnaires were mailed to organization
commanders, the anonymity of the respondents was assured.
The questionnaire and the cover letter explaining the
purpose of the survey are presented in Appendix C.
Reliability of Survey Instrument. Reliability refers
to the accuracy and precision of a measurement procedure
(9:94). Accordingly, the purpose of evaluating the
reliability of the survey instrument was to assess whether
the measurements obtained with the questionnaire were free
of random error. For this purpose, Cronbach's Coefficient
Alpha was computed for each composite variable used in the
questionnaire. A coefficient of at least .65 for any one
45

composite variable was considered an indication of adequate
reliability (24).
Validity of Survey Instrument. The content and
criterion-related validity of the questionnaire were
evaluated to ascertain whether it provided adequate coverage
of the customer service practices relevant to Base Supply.
AFIT students and faculty members with a supply AFSC (64XX)
were asked to review and assess the content validity of the
questionnaire. In addition, AFIT faculty members with
experience in the customer service field and/or opinion
research methods reviewed the questionnaire to evaluate the
appropriateness of the elements and measurement scale used.
Moreover, the questionnaire was reviewed by the TAC Supply
Directorate, HQ TAC/LGS, for content and relevance. Several
modifications were made to the questionnaire as a result of
these reviews. Based on these reviews, and a reliability
measurement of .69 or higher for each composite variable,
the author concluded that the instrument had a sound content
and criterion-related validity.
Evaluation of Customer Perceptions: Comparison of
Performance Ratings to Importance Ratings. The importance
ratings collected in PART B of the questionnaire were
compared to the performance evaluation data collected in
PART C of the questionnaire. T-tests were used to evaluate
any differences statistically.
Identification of Opportunities. The purpose of this
step was to determine whether Base Supply was providing poor
46

service on criteria rated "very important" by supply
customers, or excellent service on criteria rated "not
important." For this purpose, the results of the comparison
of performance ratings to accomplished in the previous step,
evaluation of customer perceptions, were examined to
determine any opportunities available to Base Supply for
improved customer satisfaction.
Statistical Analysis
Survey responses were coded into a Statistical Package
for The Social Sciences (SPSS-X) data set to conduct the
following statistical analysis and hypothesis testing.
Data Analysis. To obtain an accurate description of
the data gathered, histograms were constructed to illustrate
the distribution of the data. In addition, frequency
distributions and the three measures of central tendency
(mean, median and mode) were calculated for each demographic
and customer service criterion. The measures of central
tendency were useful in locating the "center" of a relative
frequency distribution. The mean is the average measurement
in the data set; the mode is the measurement that occurs
with greatest frequency; and the median is the middle number
in the data set when the measurements are arranged in
ascending (or descending) order (21:76-82). Given that the
data for this study was large (n=257), the measures of
central tendency provide useful information about the
population.
47

The relationship between the composite variables used
in this study was analyzed using the Pearson product-moment
coefficient of correlation (r). Pearson's r is "a measure
of the strength of the linear relationship between two
variables" (21:514). A value of r near or equal to 0
implies little or no relationship between two variables; a
value close to 1 or -1 implies a strong relationship between
the two variables (21:515). The literature offered the
following guidelines for interpretation of the relationship
between variables (15:329):
r Strength of Relationship
> .70 Very Strong
.50 - .69 Strong
.30 - .49 Moderate
.15 - .29 Weak
< .15 Not Much
These guidelines were used to analyze whether the
composite variables were strongly related to each other.
Because the composite variables were measuring different
aspects of customer service, it was expected they would be
strongly related to each other.
Multivariate Analysis. Analysis of Variance (ANOVA)
tests and the Tukey-b procedure for multiple comparisons
were used to test null hypotheses H01a thru H05b. The ANOVA
procedure "examines the variability in the sample and, based
on the variability, it determines whether there is reason to
believe the population means are equal" (22:257) The
48
conclusion that can be drawn from this procedure, however,
is only whether a statistically significant difference
exists between two or more groups. To investigate what
groups differ and by how much, the Tukey-b multiple
comparison test was used. This procedure identifies what
pairs of groups are different at the .05 level of
significance (22:263).
T-tests were used to identify any significant
differences between importance and performance ratings. The
t-test identifies whether a difference is large enough to
represent a true difference between the groups rather than
the result of random score fluctuations (21:387).
Assumptions. The assumptions made in order to use the
procedures described above were as follows:
a. Observations were sampled from a normaldistribution.
b. The groups have equal variances.c. Observations are independent. That is, the
measurement of one item cannot affect themeasurement of another item (21:120).
It is important to note that because the data needed to
represent observations from a normal distribution, the
measurements had to be interval or ratio. The data
measurements collected for this study, however, were
ordinal. According to Emory, there is no consensus among
behavioral science researchers on whether parametric
significance tests, such as the ANOVA, Tukey's test, and
Regression Analysis are appropriate with ordinal measures.
Strong arguments have been offered by researchers in defense
49

of both parametric and nonparametric tests. But he notes
that "parametric tests are so versatile, accepted, and
understood that they will continue to be used with ordinal
data when they seem to approach interval scales in nature"
(9:90). Since a Likert scale was used for this study, and
the intervals between the scale responses were of equal
value, the assumption made was that the data collected by
the survey instrument could be treated as interval data.
Summary
This chapter presented the specific steps of the
research methodology developed for this study. The
population was identified and defined; and the method used
to develop the survey instrument was discussed. The methods
used to analyze the data were described. Univariate
analysis was used to describe the data and its distribution.
Bivariate analysis was used to test for relationships or
significant differences among the variables. The results of
this analysis are presented in Chapter IV.
50

IV. Results
This chapter describes the results of the analysis of
the data collected. The results are presented as follows.
First, the survey response rate is examined. Second, the
reliability of the survey instrument is presented. Third,
the results of the univariate analysis are discussed. This
includes a description of the demographic characteristics of
the respondents by grade, years of service, base of
assignment, organizational level, and organizational
function. Fourth, the results of the bivariate and
multivariate analysis of the data are presented in terms of
the investigative questions and hypotheses posed for this
study. Finally, the author's summary and analysis of the
responses to each open-ended question are presented.
Survey Response Rate
As mentioned in Chapter III, the author attempted to do
a census of the major customer population. To this end, a
total of twenty questionnaires were mailed to each major
customer organization of Base Supply at each of the 18 TAC
CONUS bases for a total distribution of 360 questionnaires
to all members in the population. The mailing resulted in
the return of 266 responses which equated to a response rate
of 73.9 percent. Of these, nine questionnaires were not
usable because they were incomplete. Five of the
questionnaires were completely blank, and the remaining four
51

were partially completed. This resulted in an effective
sample of 257 respondents. Based on this sample size, the
confidence in the results was determined to be 99.72
percent. This was calculated using the following formula:
N (Z2) x p(1 - p)n = __ _ _ _ _ _ _ _ _ _ _ _ _ _ _ _ _ _ _ (1)
(N-i) (d 2) + [ (z2) x p(l - p) ]
wheren = sample size (257)N = population size (360)p maximum sample size factor (.5)d = desired tolerance (.05)z = factor of assurance (the unknown)
(12:12)
Reliability Test Results
As mentioned in Chapter III, the reliability test
conducted after 'he pretest of the survey instrument
generated Cronbach coefficients of reliability that ranged
from .60 to .90 percent for each composite variable. The
test conducted on the final survey data, however, yielded a
reliability coefficient of only .44 percent for the
composite variable "information availability." The deletion
of any one question that made up this measure would not have
improved the reliability coefficient. Therefore, this
composite variable was deleted from the data. The remaining
six composite variables were used to measure the importance
customers placed on customer service factors (PART B of
questionnaire), as well as their perception of Base Supply's
performance (PART C of questionnaire). The reliability
52

coefficients yielded from the Cronbach's Alpha coefficient
of reliability are presented in Table 5.
Table 5
Reliability Coefficients Of Composite Variables
Question Variable Cronbach'sNumber Name Alpha
Importance Measurements:
7 thru 14 General Service .69
19 thru 28 Demeanor of Supply .86Representatives
29 thru 36 Order Processing .82
37 thru 40 Order Cycle Time .84
41 thru 45 Item Availability .84
46 thru 51 Responsiveness .83
Performance Measurements:
1 thru 8 General Service .85
13 thru 22 Demeanor of Supply .95Representatives
23 thru 30 Order Processing .83
31 thru 34 Order Cycle Time .75
35 thru 39 Item Availability .80
40 thru 45 Responsiveness .86
Univariate Analysis
Frequency distributions and histograms were
constructed to illustrate the response distribution of each
criterion used in this study; and measures of central
53

tendency were calculated to identify the "center" of the
responses. These are presented in Appendix D. The
frequency distributions constructed to describe the
characteristics of the population sampled are discussed
below.
Base Response Rate. The frequency distribution of the
response rate per base is presented in Figure 1. This
figure shows that of the 20 questionnaires mailed to each
base, at least 10 were returned. Exactly half of the bases
returned between 15 and 20 questionnaires. This equates to
a response rate per base ranging from 50 to 100 percent.
Respondent Characteristics. The frequency
distributions of the grade, years of military service,
organizational level, and organizational function of the
respondents, are presented in figures 2, 3, 4 and 5.
Histograms illustrate the distributions.
Grade. Figure 2 shows the frequency distribution of
the respondents by grade category. With 45.1 percent,
enlisted personnel in the grade of E4 thru E6 represented
the largest group of respondents. E7s thru E9s were the
second largest group representing 24.5 percent of the
respondents. Junior officers in the grade of 01 thru 03
were the third largest group represented accounting for 12.1
percent of the total.
54
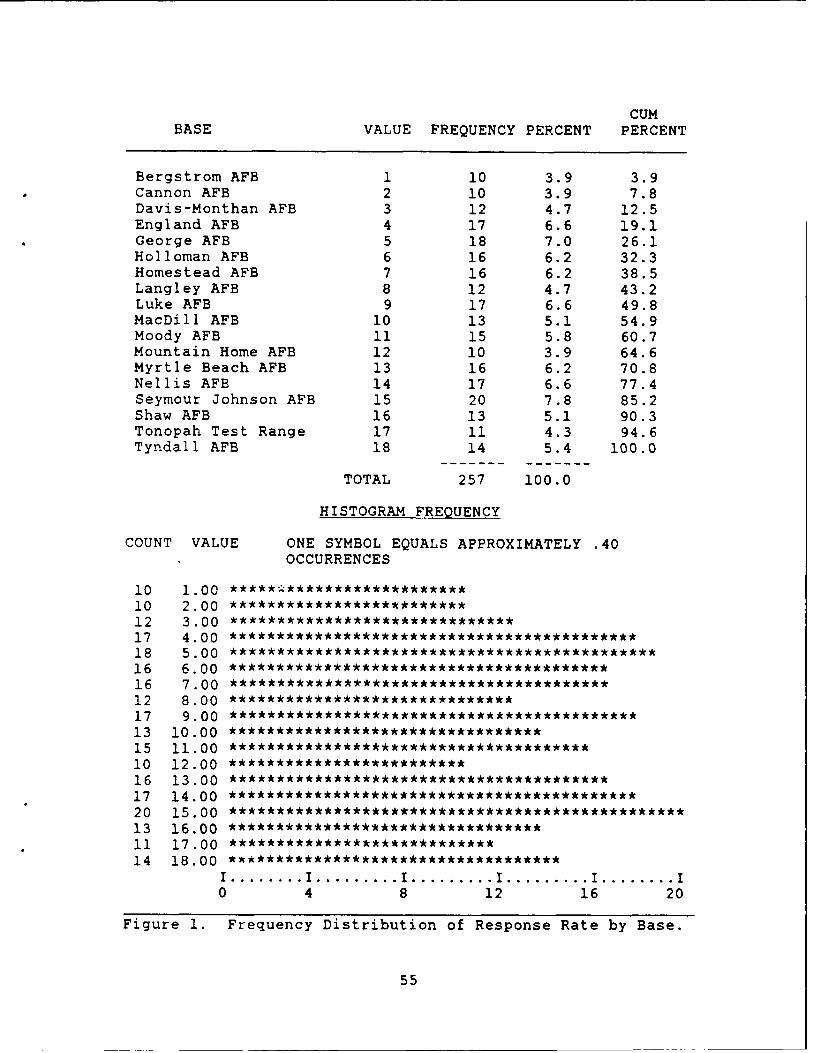
CUMBASE VALUE FREQUENCY PERCENT PERCENT
Bergstrom AFB 1 10 3.9 3.9Cannon AFB 2 10 3.9 7.8Davis-Monthan AFB 3 12 4.7 12.5England AFB 4 17 6.6 19.1George AFB 5 18 7.0 26.1Holloman AFB 6 16 6.2 32.3Homestead AFB 7 16 6.2 38.5Langley AFB 8 12 4.7 43.2Luke AFB 9 17 6.6 49.8MacDill AFB 10 13 5.1 54.9Moody AFB 11 15 5.8 60.7Mountain Home AFB 12 10 3.9 64.6Myrtle Beach AFB 13 16 6.2 70.8Nellis AFB 14 17 6.6 77.4Seymour Johnson AFB 15 20 7.8 85.2Shaw AFB 16 13 5.1 90.3Tonopah Test Range 17 11 4.3 94.6Tyndall AFB 18 14 5.4 100.0
TOTAL 257 100.0
HISTOGRAM FREQUENCY
COUNT VALUE ONE SYMBOL EQUALS APPROXIMATELY .40OCCURRENCES
10 1.00 ************************10 2.00 *************************12 3.00 ******************************17 4.00 *******************************************18 5.00 *********************************************16 6.00 ****************************************16 7.00 ****************************************12 8.00 ******************************17 9.00 *******************************************13 10.00 *********************************15 11.00 **************************************10 12.00 *************************16 13.00 ****************************************17 14.00 *******************************************20 15.00 ************************************************13 16.00 *********************************11 17.00 ****************************14 18.00 **********************************
I......... I.......... I.......... I.......... I......... I
0 4 8 12 16 20
Figure 1. Frequency Distribution of Response Rate by Base.
55

CUMGRADE VALUE FREQUENCY PERCENT PERCENT
E1 - E3 1 17 6.6 6.6E4 - E6 2 116 45.1 51.8E7 - E9 3 63 24.5 76.301 - 03 4 31 12.1 88.304 - 06 5 21 8.2 96.5OTHER* 6 9 3.5 100.0
TOTAL 257 100.0
HISTOGRAM FREQUENCY
COUNT VALUE ONE SYMBOL EQUALS APPROXIMATELY 4.00OCCURRENCES
17 1.00 ****
116 2.00 *****************************63 3.00 ****************31 4.00 ********21 5.00 *****9 6.00 **
I.......... I.......... I.......... I.......... I
0 40 80 120 160
* The nine respondents in the "other" category did notspecify their grade.
Figure 2. Frequency Distribution of Grade of Respondents.
Years of Military Service. Figure 3 shows the
frequency distribution of the respondents by years of
service. From this figure it can be determined that 78.2
percent of the respondents had at least six years of
military service which would indicate a significant level of
Air Force experience. Based on this, it could be assumed
that the respondents had at least an average level of
experience in interacting with Base Supply.
Organizational Level. The frequency distribution for
the orqanizational level of the population sample is shown
in Figure 4. Respondents in the Squadron, Branch, and
56

Section level, which generally represent Base Supply's
largest block of customers, comprised 78.9 percent of the
respondents. Respondents in the Numbered Air Force category
represent Headquarters (HQ) 12th Air Force, HQ 9th Air
Force, and HQ 10th Air Force. Respondents in the "other"
category included those assigned to Unified Command HQ,
Joint Command HQ, Deputy Commander for Maintenance (DCM)
staff, and Group HQ levels.
CUMYEARS IN SERVICE VALUE FREQUENCY PERCENT PERCENT
Less than one year 1 3 1.2 1.21 - 5 years 2 53 20.6 21.86 - 10 years 3 55 21.4 43.211 - 15 years 4 50 19.5 62.616 - 20 years 5 65 25.3 87.921 or more years 6 31 12.1 100.0
TOTAL 257 100.0 100.0
HISTOGRAM FREQUENCY
COUNT VALUE ONE SYMBOL EQUALS APPROXIMATELY 1.50OCCURRENCES
3 1.00 **53 2.00 ***********************************55 3.00 *************************************50 4.00 *********************************65 5.00 *******************************************31 6.00 *********************
I.......... I.......... I.......... I.......... I........ I
0 15 30 45 60 75
Figure 3. Frequency Distribution of Respondents Years ofService.
57

CUMOrganizational Level VALUE FREQUENCY PERCENT PERCENT
MAJCOM Headquarters 1 3 1.2 1.2Numbered Air Force 2 12 4.7 5.9Wing 3 18 7.0 12.9Squadron 4 88 34.4 47.3Branch 5 42 16.4 63.7Section 6 72 28.1 91.8Other 7 21 8.2 100.0
99 1 MISSING
TOTAL 257 100.0
HISTOGRAM FREQUENCY
COUNT VALUE ONE SYMBOL EQUALS APPROXIMATELY 2.00OCCURRENCES
3 1.00 **12 2.00 ******18 3.00 *********88 4.00 ********************************************42 5.00 *********************72 6.00 ************************************21 7.00 ***********
I.......... I.......... I.......... I.......... I......... I
0 20 40 60 80 100
Figure 4. Frequency Distribution of the OrganizationalLevel of the Respondents.
Organizational Function. As mentioned in Chapter III,
HQ TAC/LGS requested each TAC supply organization to
identify its top four (4) major customers. The commander of
each major-customer organization at each of the 18 TAC bases
in the CONUS, or his equivalent, and four individuals
selected by the commander were defined as the population.
From the information provided by supply organizations, the
number of customers from each organizational function in the
population were calculated. They are presented in Table 6.
58

The organizations shown in Table 6 represent the major
customers of TAC Base Supply. From this table it can be
concluded that the major organizational customers of TAC
Base Supply squadrons are maintenance organizations. The
next largest major customer is represented by communications
organizations followed by transportation organizations. The
"other" category is comprised of various organizational
functions; among these were: Civil Engineering, Security
Police, Air Base Operability, Air Refueling squadrons,
Combat Support Group organizations, the Air Force
Engineering and Services Center (AFESC), the United States
Central Command, and the US Special Operations Command.
Table 6
Composition Of Organizational Functionsin the Population
PercentOf Total
Organization Population Population
Maintenance 205 56.9Transportation 20 5.6Communications 35 9.7Other 100 27.8
Total 360 100.0
Figure 5 shows the percentage of responses received
from each of the organizational functions represented in the
population. Comparing these percentages to those in Table
6, it can be determined that the percentage of respondents
59

by organization type closely followed its representative
percentage of the population.
The only possible exception to this observation applies
to respondents from the "other" category of organizational
functions. They constituted 17.3 percent of the total
respondents versus 27.8 percent in the population. Because
of the difference between the percentage of responses
received and the percentage of representation in the
population of this category, the results might be treated
with some measure of caution in regards to "other"
organizations.
CUMORGANIZATION TYPE VALUE FREQUENCY PERCENT PERCENT
Maintenance 1 164 64.3 64.3Transportation 2 17 6.7 71.0Communications 3 30 11.8 82.7Other 4 44 17.3 100.0
2 Missing Responses
TOTAL 257 100.0
HISTOGRAM FREQUENCY
COUNT VALUE ONE SYMBOL EQUALS APPROXIMATELY 4.00OCCURRENCES
164 1.00 *****************************************17 2.00 ****30 3.00 ********44 4.00 ***********
I.......... I.......... I.......... I.......... I......... I
0 40 80 120 160 180
Figure 5. Frequency Distribution of Responses byOrganizational Function.
60

Bivariate Analysis
The linear relationship among all the composite
variables was analyzed using the Pearson product-moment
coefficient of correlation. The results of the
intercorrelations are shown in Table 7 and 8. Table 7 shows
the correlations among the composite variables used to
measure importance of customer service criteria in PART B of
the questionnaire. The strongest correlations were between
Order Cycle and Responsiveness (.6534); General Service and
Demeanor of Supply Representatives (.6218); Item
Availability and Responsiveness (.6005); Item Availability
and Order Cycle (.5409); Order Processing and Responsiveness
(.5335); Order Processing and Order Cycle (.5226); and Order
Processing and Item Availability (.5036). A weak
relationship existed between Order Cycle and General Service
(.2712).
The Pearson coefficient of .50 or above between each
pair of the composite variables mentioned above suggested
there was a relationship between the respective values of
the two variables. That is, if respondents rated one
composite variable as very important, they were just as
likely to rate the other composite variable as very
important. The weak correlation between Order Cycle and
General Service suggested that if respondents rated Order
Cycle as very important, they were just as likely to rate
General Service as either very important or not important
(14:204).
61
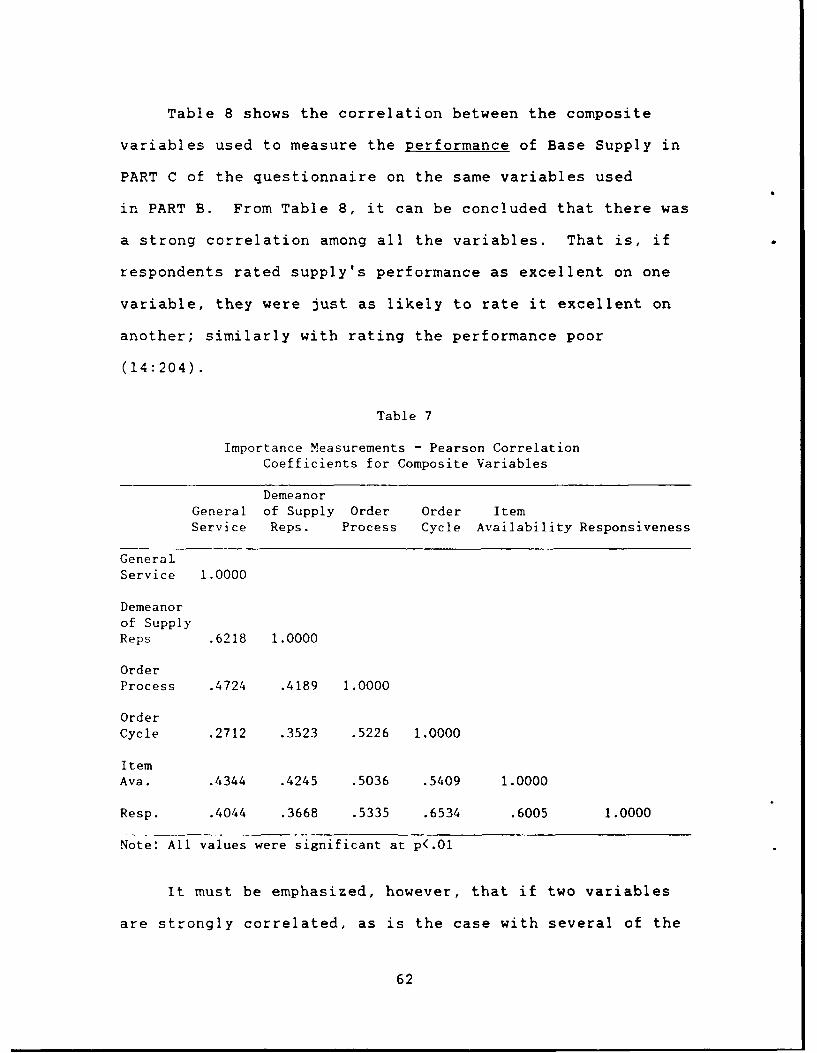
Table 8 shows the correlation between the composite
variables used to measure the performance of Base Supply in
PART C of the questionnaire on the same variables used
in PART B. From Table 8, it can be concluded that there was
a strong correlation among all the variables. That is, if
respondents rated supply's performance as excellent on one
variable, they were just as likely to rate it excellent on
another; similarly with rating the performance poor
(14:204).
Table 7
Importance Measurements - Pearson CorrelationCoefficients for Composite Variables
Demeanor
General of Supply Order Order ItemService Reps. Process Cycle Availability Responsiveness
GeneralService 1.0000
Demeanorof SupplyReps .6218 1.0000
OrderProcess .4724 .4189 1.0000
OrderCycle .2712 .3523 .5226 1.0000
ItemAva. .4344 .4245 .5036 .5409 1.0000
Resp. .4044 .3668 .5335 .6534 .6005 1.0000
Note: All values were significant at p<.Ol
It must be emphasized, however, that if two variables
are strongly correlated, as is the case with several of the
62

variables in this study, one cannot infer a causal
relationship. The only safe conclusion is that a linear
relationship exists between the two. However, it does not
imply that only a linear relationship exists between the two
variables (21:516).
Table 8
Performance Measurements - Pearson CorrelationCoefficients for Composite Variables
DemeanorGeneral of Supply Order Order ItemService Reps. Process Cycle Availability Responsiveness
GeneralService 1.0000
Demeanorof SupplyReps .8210 1.0000
OrderProcess. .7302 .6150 1.0000
OrderCycle .7034 .6623 .8139 1.0000
ItemAva. .6364 .6333 .6765 .7212 1.0000
Resp. .6132 .6342 .6910 .6949 .6781 1.0000
Note: All values were significant at p<.Ol
Investigative Questions. The results of the bivariate
and multivariate analyses conducted to answer the
investigative questions are discussed below. The
investigative questions will be addressed in the same order
as they were presented in Chapter I.
63

QI: What customer service criteria are most
important to TAC Supply customers and how dothey perceive the performance of Base Supplyon those criteria they rate most important totheir satisfaction?
The customer service criteria rated very important,
those with a mean score of 6.0 or higher on a scale of 1 to
7, are presented in Table 9 in descending order of
importance. A complete list of the importance ratings given
to each of the 45 service criteria used in this survey is
presented in Appendix E. Table 9 and the table in Appendix
E provide a description of each criterion followed by its
PART B question number in parenthesis. The standard
deviation is included to provide information about the
variability of the responses. Criteria marked as "Not used"
by the respondents received no points.
From Table 9 it can be ascertained that the criteria
rated most important, those with a mean score of 6.0 or
above, are questions number 13, 14, 26, 22, 46, 23, 12, 25,
40, 47, 37, 8, 28, and 42.
Analysis of the data showed that no single criterion
was rated as "not important" by the respondents. The lowest
mean score, 4.46, went to question number 11 in the
questionnaire. This question asked respondents to rate the
importance of Base Supply's visits to their organization to
ensure adequate support is being provided.
64

Table 9
Mean and Standard Deviation Scores of CriteriaRated Very Important
Description Variable Mean SD
A commitment to General Service 6.50 .73providing the bestservice possible. (13)
A commitment General Service 6.47 .76to customersatisfaction. (14)
Competence. (26) Demeanor Of 6.41 .74Supply Rep
Ability to solve Demeanor of 6.40 .71your problem. (22) Supply Rep
Ability to expedite Responsiveness 6.35 .99MICAP requests. (46)
Fulfill promises Demeanor Of 6.28 .94made. (23) Supply Rep
A good working General Service 6.24 .87relationship withyour organization. (12)
Professionalism. (25) Demeanor Of 6.20 .84Supply Rep
Minimum variation Order Cycle Time 6.22 1.15between requiredand actual deliverydates on MICAPitems. (40)
Ability to expedite Responsiveness 6.18 1.04out of the ordinaryMICAP requests. (47)
Ability to meet Order Cycle Time 6.08 1.02required deliverytimes on itemsavailable in stock. (37)
65

Table 9 (Continued)
Description Variable Mean SD
A method for General Service 6.04 .94handling customercomplaints. (8)
A concern about Demeanor Of 6.04 1.01your problem. (28) Supply Rep
Availability of Item Availability 6.01 1.05bench stock itemswhen needed. (42)
Further analysis of the data was conducted to determine
how customers perceived the performance of Base Supply on
those criteria they rated as most important to their
satisfaction. The results are shown in Table 10.
Table 10 summarizes the performance ratings respondents
gave to Base Supply on the criteria they rated very
important. A complete list of the performance ratings given
to each of the 45 service criteria used in this survey is
presented in Appendix F. Table 10 and Appendix F provide
adescription of each criterion followed by its PART C
question number in parenthesis. To ensure consistency, the
criteria are presented in the same order as in Table 9.
Appendix F presents the information in descending order of
performance ratings.
From Table 10 it can be determined that none of the 14
criteria which the respondents judged as very important to
66

their satisfaction were given a below-satisfactory
performance rating. However, none received an excellent
rating.
The lowest mean score of all the criteria, 4.46, went
to criterion number 11 in the questionnaire. This item
measured the respondents' perception of supply's visits to
their organization to ensure it is receiving adequate supply
support. This criterion also shows the lowest mean score of
importance (see Appendix E).
Table 10
Mean and Standard Deviation Scoresof Performance Ratings Given to Base Supply
on Criteria Rated as Very Important
Description Variable Mean SD
A commitment to General Service 4.80 1.60providing the bestservice possible. (13)
A commitment General Service 4.69 1.65to customersatisfaction. (14)
Competence. (26) Demeanor of 4.96 1.53Supply Rep
Ability to solve Demeanor of 4.91 1.54your problem. (22) Supply Rep
Ability to expediteMICAP requests. (46) Responsiveness 4.94 1.82
Fulfill promises Demeanor of 4.72 1.79made. (23) Supply Rep
A good working General Service 4.99 1.54relationship withyour organization. (12)
67

Table 10 (Continued)
Description Variable Mean SD
Professionalism. (25) Demeanor of 5.23 1.34Supply Rep
Minimum variation Order Cycle Time 4.21 2.04between requiredand actual deliverydates on MICAPitems. (40)
Ability to expedite Responsiveness 4.60 1.92out of the ordinaryMICAP requests. (47)
Ability to meet Order Cycle Time 4.63 1.59required deliverytimes on itemsavailable in stock. (37)
A method for General Service 4.71 1.58handling customercomplaints. (8)
A concern about Demeanor ofyour problem. (28) Supply Rep 4.58 1.64
Availability of Item Availability 4.35 1.72bench stock itemswhen needed. (42)
Further analysis of the data shows that criteria
numbers 13, 14 and 26 which were the top three rated as very
important by the respondents showed the 13th, 18th and 8th
highest mean scores respectively (see Appendix F). The
criteria that showed the top satisfactory performance mean
scores were, in descending order: accessibility of Base
Service Store and Individual Equipment Unit; courtesy,
military bearing, and appearance of supply representatives
(see Appendix F).
68

Q2: Is TAC Base Supply performing according tocustomer's expectations?
The major customers of TAC Base Supply were asked to
rate the importance of 45 customer service criteria in PART
B of the questionnaire. Respondents were asked to evaluate
the criteria based on the following scale:
Not Moderately VeryImportant Important Important
1 2 3 4 5 6 7
In PART C of the questionnaire respondents were asked
to rate the performance of Base Supply on the same 45
criteria whose importance he/she rated in PART B.
Respondents were asked to rate supply's performance based on
the following scale:
Poor Satisfactory Excellent
1 2 3 4 5 6 7
A series of t-tests were used to determine whether a
difference between the mean score of importance and the mean
score of performance ratings for each composite variable is
large enough that we can conclude it represents a true
difference rather than simply the result of random score
fluctuations (21:431-436). Table 11 shows the results of
the t-tests. This table compares the mean scores of
importance and performance ratings for the composite
variables. The mein, standard deviation, and the
t statistic are shown. An asterisk (*) placed beside the t-
value signifies that the difference between the importance
69

and performance ratings was large enough to be statistically
significant. Table 11 shows that at the highly significant
level of p<.01 there were significant differences between
the importance supply customers place on the customer
service composite variables, as constructed for this survey,
and their perception of Base Supply's performance on the
same variables.
Table 12
Comparison of Importance and Performance Ratingsfor Customer Service Elements
Importance Performance
Variable Mean/S.D. Mean/S.D t-value
General Service 5.73/.62 4.73/1.16 12.55*
Demeanor of Supply 6.00/.63 4.94/1.25 12.72*
Representatives
Order Processing 5.61/.81 4.56/1.29 8.70*
OLder Cycle Time 6.00/.91 4.25/1.37 15.08*
Item Availability 5.61/.87 4.53/1.24 9.61*
Responsiveness 5.79/.88 4.54/1.39 11.50*
*Indicates a statistically significant difference at the
p<.01 level.
A series of t-tests also were conducted to analyze any
differences between importance and performance ratings for
each of the 45 individual service criteria used in the
questionnaire. At a significance level of p<.05, there were
significant differences between the importance and
70

performance ratings on 44 out of the 45 criteria. Only one
criterion showed no significant difference. This was
question number 7 in the questionnaire which measured
promptness in answering the telephone. The comparison of
the importance and performance ratings for all 45 criteria
is presented in Appendix G.
The significant differences found between importance
and perceived performance identified above led to the
conclusion that TAC Base Supply was not performing according
to customers' expectations.
Q3: Are there differences in the perception of supplyperformance according to rank, years of service,organizational level, organization type, and base?
To examine this question, a oneway analysis of variance
(ANOVA) was conducted to determine whether to reject or fail
to reject the null hypotheses proposed in Chapter I. The
basic premise of all the null hypotheses was that there is
no statistically significant differences between the groups.
The Tukey-b procedure was used to identify exactly which
groups are significantly different at the .05 level of
significance.
To provide a balanced picture of any differences
between the customer segments, i.e.. by rank, yea:s of
service, organizational level, organization type, and base,
hypotheses were proposed to identify both the differences
between the customer segments perceptions of the importance
of customer service elements as well as differences in the
71

perceptions of Base Supply performance. Each hypothesis is
addressed in the same order presented in Chapter I. For
clarity and comparative purposes, the accompanying tables
show the mean and standard deviation (SD) scores, and the
minimum and maximum ratings given to the customer service
element (also referred to as composite variable) by
individual customer segments.
Null Hypothesis H01a: There is no statisticallysignificant difference between customer segments by grade inregards to their view of the importance of customer serviceelements.
The results of the ANOVA and Tukey procedures are shown
in Table 12. The results indicated a significant difference
between groups on only two customer service elements:
general service and demeanor of supply representatives.
There is a significant difference between O1-03s and 04-06s
in regards to their perception of the importance of GENERAL
SERVICE. A significant difference also exists between 01-
03s and E4-E6s in regards to their perception of the
importance of DEMEANOR OF SUPPLY REPRESENTATIVES. In both
cases, the 01-03 group rated the importance of the customer
service elements lower than the other two groups.
Nu1_1_Hypothesis H,1b: There is no statisticallysignificant difference between customer segments by grade inregards to their perception of Base Supply's performance.
No statistically significant differences were
determined between customers in the grades of EI-E3, E4-E6,
E7-F9, 01-03, and 04-06 in regards to their perception of
72

Base Supply's performance on any of the customer service
elements.
Table 12
Importance Perceptions: Significant DifferencesBetween Customer Segments by Grade
Customer GroupsService SignificantlyElement Different MEAN SD MIN MAX
01-03 5.52 .64 3.38 6.38General Service
04-06 6.09 .62 4.88 7.00
----------------- -- - - - - -- -- -- -- -- -- -- --
Demeanor Of 01-03 5.74 .66 4.70 6.90SupplyRepresentatives E4-E6 6.10 .60 4.30 7.00
Note: Pairs of groups are significantly different atthe .05 level of significance.
Null Hypothesis H.a2a: There is no statisticallysignificant difference between customer segments by years ofmilitary service in regards to their view of the importanceof customer service elements.
The results of the ANOVA and Tukey-b procedures are
presented in Table 13. The results indicated that there is
a significant difference between customers with 6-10 years
of military service and customers in the following groups:
1-5, 11-15, and 21 or more years of service. No significant
differences exist between the groups with 1-5, 11-15, and 21
or more years of service. Customers with 6-10 years of
service had a mean score response lower than the other three
73

groups and a greater variation in their assessment of the
importance of RESPONSIVENESS.
Table 13
Importance Perceptions: Significant Differences BetweenCustomer Segments by Years of Military Service
Customer GroupsService SignificantlyElement Different MEAN SD MIN MAX
1-5 years 5.84 .72 3.67 7.00
Responsiveness *6-10 years 5.38 1.04 2.00 6.83
11-15 years 5.89 .65 4.00 7.00
21 or more 6.12 .49 4.67 7.00years
* This group was significantly different from the othergroups at the .05 level of significance.
Null Hypothesis H 2b: There is no statisticallysignificant difference between customer segments by years ofservice in regards to their perception of Base Supply'sperformance.
No statistically significant differences were
determined between customers with less than one, 1-5, 6-10,
11-15, 16-20, and 21 or more years of service in regards to
their perception of Base Supply's performance on any of the
customer service elements.
Null Hypothesis H3a: There is no statisticallysignificant difference between customer segments byorganizational level and their view of the importance ofcustomer service elements.
Table 14 shows the results of the ANOVA and Tukey
procedures. Results indicated there is a significant
7;

difference between customers assigned to a Numbered Air
Force and customers assigned to the following organizational
levels: squadron, branch, section, and the "other" category.
Numbered Air Force customers had a mean score response lower
than the other four groups (4.90). No significant
differences existed between customers assigned to a
squadron, branch, section, or those in the "other" category.
Table 14
Importance Perceptions: Significant Differences BetweenCustomer Segments by Organizational Level
Customer GroupsService SignificantlyElement Different MEAN SD MIN MAX
*Numbered AF 4.90 1.04 3.17 6.33
Squadron 5.71 .79 2.00 7.00Respqnsiveness
Branch 5.84 .73 2.00 7.00
Section 5.91 .72 3.67 7.00
Other 5.86 .70 4.67 7.00
* This group was significantly different from the other
groups at the .05 level of significance.
Null Hypothesis H 3b: There is no statisticallysignificant differences between customer segments byorganizational level and their perception of Base Supply'sperformance.
Table 15 shows that the ANOVA and Tukey procedures
identified a significant difference between customers
assigned to the branch level and those assigned to the
section level. Those assigned to the branch level gave Base
Supply the lowest performance ratings ranging from 0.00 to
75
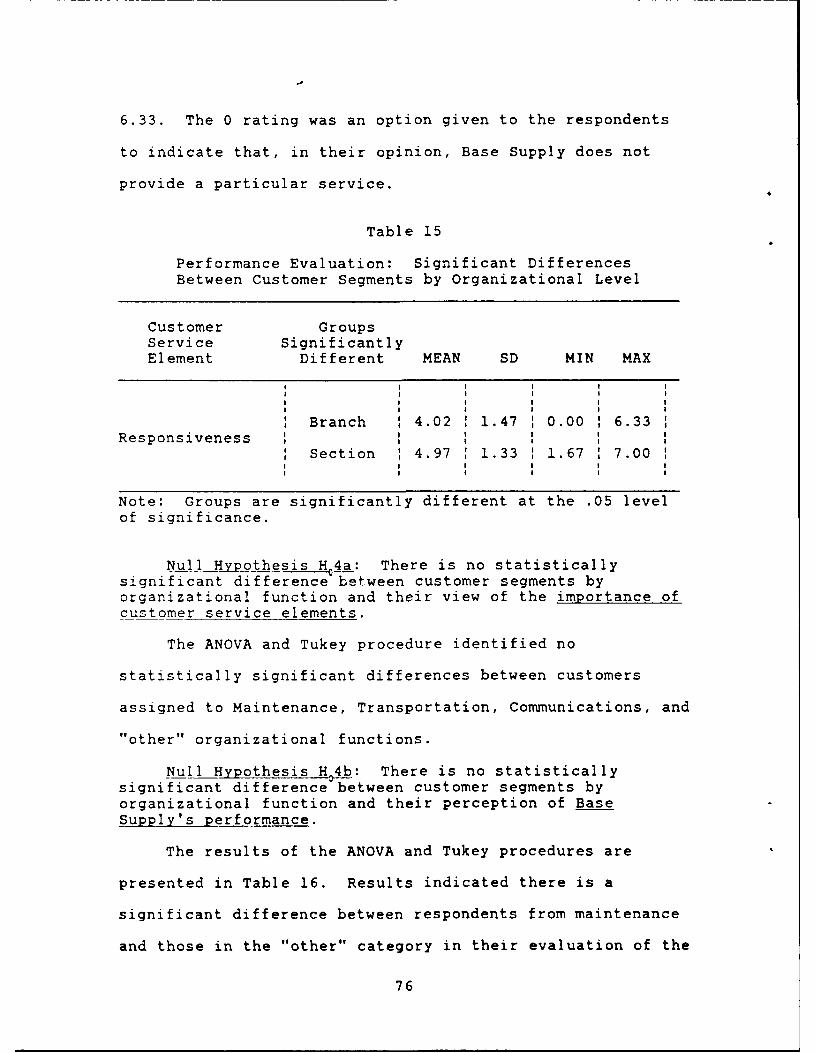
6.33. The 0 rating was an option given to the respondents
to indicate that, in their opinion, Base Supply does not
provide a particular service.
Table 15
Performance Evaluation: Significant DifferencesBetween Customer Segments by Organizational Level
Customer GroupsService SignificantlyElement Different MEAN SD MIN MAX
Branch 4.02 1.47 0.00 6.33Responsiveness
Section 4.97 1.33 1.67 7.00
Note: Groups are significantly different at the .05 levelof significance.
Null Hypothesis H.4a: There is no statisticallysignificant difference between customer segments byorganizational function and their view of the importance ofcustomer service elements.
The ANOVA and Tukey procedure identified no
statistically significant differences between customers
assigned to Maintenance, Transportation, Communications, and
"other" organizational functions.
Null Hypothesis H04b: There is no statisticallysignificant difference between customer segments byorganizational function and their perception of BaseSupply's performance.
The results of the ANOVA and Tukey procedures are
presented in Table 16. Results indicated there is a
significant difference between respondents from maintenance
and those in the "other" category in their evaluation of the
76

general service element. No statistically significant
differences were identified between any other groups.
Null Hypothesis H05a: There is no statisticallysignificant difference between customer segments by base ofassignment in regards to their view of the importance ofcustomer service elements.
The ANOVA and Tukey procedure identified no
statistically significant differences by base of assignment.
Table 16
Performance Evaluation: Significant DifferencesBetween Customer Segments by Organizational Function
Customer GroupsService SignificantlyElement Different MEAN SD MIN MAX
Maintenance 4.83 1.08 1.63 7.00General Service
Other 4.29 1.42 0.00 6.50
Note: Groups are significantly different at the .05 levelof significance.
Null Hypothesis H 5b: There is no statisticallysignificant difference between customer segments by base ofassignment in regards to their perception of Base Supply'sperformance.
Statistical analysis of this hypothesis identified no
significant differences between customers by base of
assignment.
Analysis of Open-Ended Questions
A total of five open-ended questions were included in
the survey instrument to allow respondents to freely express
their opinions or perceptions. The responses were analyzed
77

by the organizational function of the respondents, i.e.
maintenance, transportation, communications, and other, to
identify any possible trends in the opinions of each of
these organizational functions. However, no significant
differences were apparent to the author. Respondents from
all organizations voiced similar concerns about the service
criteria important to them and their perception of the
source of satisfaction or dissatisfaction with Base Supply.
Following is a summary of the responses to each open-
ended question provided in the same order as they appeared
in the questionnaire.
PART B, Q1: Are there any other customer servicefactors you consider important to your satisfactionwith Base Supply?
Roughly 50 percent of the respondents did not answer
this question. About 20 percent of those who did respond
indicated they could not think of any other factors or that
everything that was important to them was already included
in the questionnaire. The responses given by the remaining
30 percent of the respondents can be summarized as follows:
a. Not giving the customer the runaround.
b. Ability to work with the customer.
c. A positive attitude towards the customer.
d. Effective supply operations during computer
downtime.
e. More training for supply personnel on supply
procedures. In this regard, many expressed a concern that
78

many supply personnel lack the knowledge they need to help
the customer.
f. More effective training for personnel in the
organizations Base Supply supports, i.e. equipment
custodians, AMU personnel.
Selected responses which the author considered
representative of the opinions expressed by the majority of
those who answered this question were:
"It is important to me that Base supply work with thecustomer to ensure problems or concerns are being taken careof within a reasonable time frame. The customer should notbe given the runaround or passed on from one section toanother when either section is capable of handling thesituation."
"A positive attitude towards customer service and theinitiative to do what it takes, or to go the extra mile tokeep the customer happy."
"Just knowing that if you need something done theperson handling it knows what they are doing and has agenuine concern about doing it correctly."
"I believe it is very important for supply to be ableto operate effectively during computer down time. I knowthere are procedures and products available to do this. Toooften, however, it seems everything comes to a standstillwhen the computer is down."
"That each section of base supply would internallytrain each person to give out information consistent withthat section's policies and requirements."
"Item 51 (see questionnaire in Appendix C) cannot beemphasized enough: to be very flexible in meeting unit needson training. This should include training within thesupported organization, i.e. AMU support section, to allowover the shoulder hands on training."
"Training programs more individually directed to eachshop."
79

PART B Q2: What actions do you take when BaseSupply cannot provide an item when you need it?(wait; increase the priority; submit a SupplyDifficulty Report; contact other bases; contactthe depot, etc.)
Roughly 60 percent of the respondents answered this
question. Of these, only ten indicated they wait on supply.
About 25 said they increased the priority and/or submitted a
supply difficulty report. The remaining number indicated
they did all of the above depending on the circumstances;
but in particular, they indicated they contacted other bases
and the item managers at the depot. It was noted that most
of the personnel who answered this question were from
maintenance organizations. Most responses were short and to
the point i.e. contact other bases and call depot. A few
examples of the responses which, in the author's opinion,
cover the essence of what most of the respondents expressed
are the following:
"In the case of MICAPs, contact other bases, as well ascontact the depot IMs [item managers] to determine whenreplacements are going to become available."
"Increase priority, cann, supply difficulty; snmetimeswe [maintenance] do a much better (quicker) job of locatinga part at depot or another base than MICAP."
"We do all our own depot follow-ups."
"All of the above and more. It should be noted thatthese actions have become the norm, not the exception. Ihave one supply person assigned and use 10 maintenancepeople to help accomplish the task of getting supplies. Theoffices at Base Supply are more of a road block than a helpwhen it comes to dealing with off base agencies."
8o

PART C, QI: Please comment on anything you
particularly like or do not like about Base Supply.
Approximately 75 percent of the respondents answered
this question. Most of the positive or negative comments
expressed by the respondents pertained to the demeanor of
supply personnel. On the positive side, respondents
frequently mentioned courtesy, prompt service, and the
perception that supply personnel were there to support them.
On the negative side, they frequently mentioned lack of
competence, slow service, and a bad attitude.
Other than opinions about the demeanor of supply
representatives, customers expressed their appreciation for
prompt delivery of parts. On the negative side, there
appeared to be a widespread dissatisfaction with bench
stocks not filled on a timely basis, and poor communication
of DD Form 1348-6 information to Contracting. Only sporadic
comments were noted about excessive red tape to order items,
and the base service store being out of products quite
often.
Most of the responses, whether positive or negative,
came from maintenance personnel. This is not surprising
since they accounted for 64.3 percent of the respondents.
Negative opinions outweighed the positive ones at
approximately a 2 to 1 ratio. A representative sample o
the responses follows.
81

a. What customers liked about their Base Supply:
"Outstanding courtesy and helpfulness by customerservice representatives."
"The Chief of Supply is committed to providing hiscustomers with excellent support. Supply is doing a finejob supporting a weapon system with fewer and feweravailable spares."
"I get very good service from Base Supply, althoughthey never have the item I need."
"I particularly like it when Base Supply is able todeliver an item in the time that corresponds to thepriority."
"Senior leadership involvement from the Chief of Supplydown to the airman."
b. What customers didn't like about their Base Supply:
"Don't like the fact that supply people seem to beoverly specialized. Sometimes it seems the user has abroader understanding of the supply system than supplypeople themselves. Stock control will do only what pertainsto them. Document control will do only what pertains tothem, etc. Meanwhile, the poor customer has to explain theproblem over and over, and sometimes actually tell supplypeople, how to fix it."
"Many times I get projected feelings that I, thecustomer, am an interruption to their work instead of thepurpose of their work."
"When dealing with Supply on areas concerning supportof the customer, I often receive more reasons why supportcannot be provided rather than approaches to resolve theproblem at hand."
"Slow, very slow service at supply point warehouse. noenthusiasm towards customers."
"Other than MICAP section, it appears that Base Supplyis lacking in knowledge of their job. It seems everythingyou ask as far as follow-up action does not take place."
"Whenever an item is requested on a 2005 and 1348-6 forlocal purchase, the information (on the 1348-6) is oftendisregarded (point of contact, source of supply, address ofsupplier and phone number) or lost, even when stapledtogether. Base contracting is constantly calling and askingfor additional information on an item that was provided on
82

the 1348-6. Bench stock often forgets to fill requestedbins on orders that have many requisitions. Also someorders take 2 to 5 weeks to receive the property (not dueouts)."
"Outside of MICAP, SSC & AGS Parts Store, the attitudesare bad and competence level is lacking."
"In Equipment Management mainly but also in othersections, too much time is spent telling people that theycan't have something, instead of helping them get what theyneed. Also, the sections in Supply seem to fight too muchamong themselves, not wanting to help each other to help thecustomer."
"Bench Stock has too low of a priority and does notfill certain line items for six months at a time, whichdefeats its purpose."
"Bench stock not being checked on a regular basis."
PART C, Q2: Please comment on any experience with IlBase Supply which was particularly satisfying to you.J
Approximately 75 percent of the respondents answered
this question. Only five respondents answered this question
by explicitly writing "none." All the other respondents had
a positive experience to relate. Based on the author's
interpretation of the responses, customers said little about
satisfaction with any supply procedures, but much about
their satisfaction with a particular service they have
received from Base Supply personnel. In addition, the
majority of positive comments were about personnel in MICAP;
however, Customer Service, Equipment Managerpe't, and the
Base Service Store were mentioned frequently. Other
sections received sporadic comments.
Respondents appeared to be equally enthusiastic about
basically the same thing: the perception that someone in
83

supply cared about their needs and was willing to "go the
extra mile" for them.
In the author's opinion, the following responses were
the most representative of the majority:
"Weekend/night phone calls at home on the status ofhigh interest parts." (from a senior NCO ir. maintenance)
"MICAP controller seems to go out of his way to help usout even on non-micap items."
"Needed a particular item very recently. Depot said itwould take at least 3 months. This was a mission essentialitem but could not be placed for MICAP. A customer servicerep checked approximately 27 bases for this item for me, hefound some to keep us going. I was very pleased andimpressed. He did this within one day."
"Outstanding research facility. Great customerservice, answer to your question right on the phone, gobeyond normal procedures to help you in anyway they can.can also say the same thing about MICAP. Answer anyquestion, more than happy to help you with any problemwhether it's a MICAP problem or not. Both Units areoutstanding."
'MICAP goes out of their way to assist me in any waypossible."
"Customer service personnel are very helpful althoughmost of the time their hands are tied because of the problembeing at depot or contracting."
"When problems arise, I turn to CLO, TSgt Manning. Hehas always given us his best support and has been courtecusand sensitive to the needs of this unit's mission."
"As an equipment custodian for two different shops Ihave found the personnel in the Equipment Management sectionto be highly professional and knowledgeable of their jobs.I am also satisfied with the personnel working in storageand issue. (from an NCO in maintenance).
PART C. Q3: Please comment on anything which wasparticularly dissatisfying to you. I
Approximately 75 percent of the respondents answered
this question. Of these, approximately 15 indicated they
84
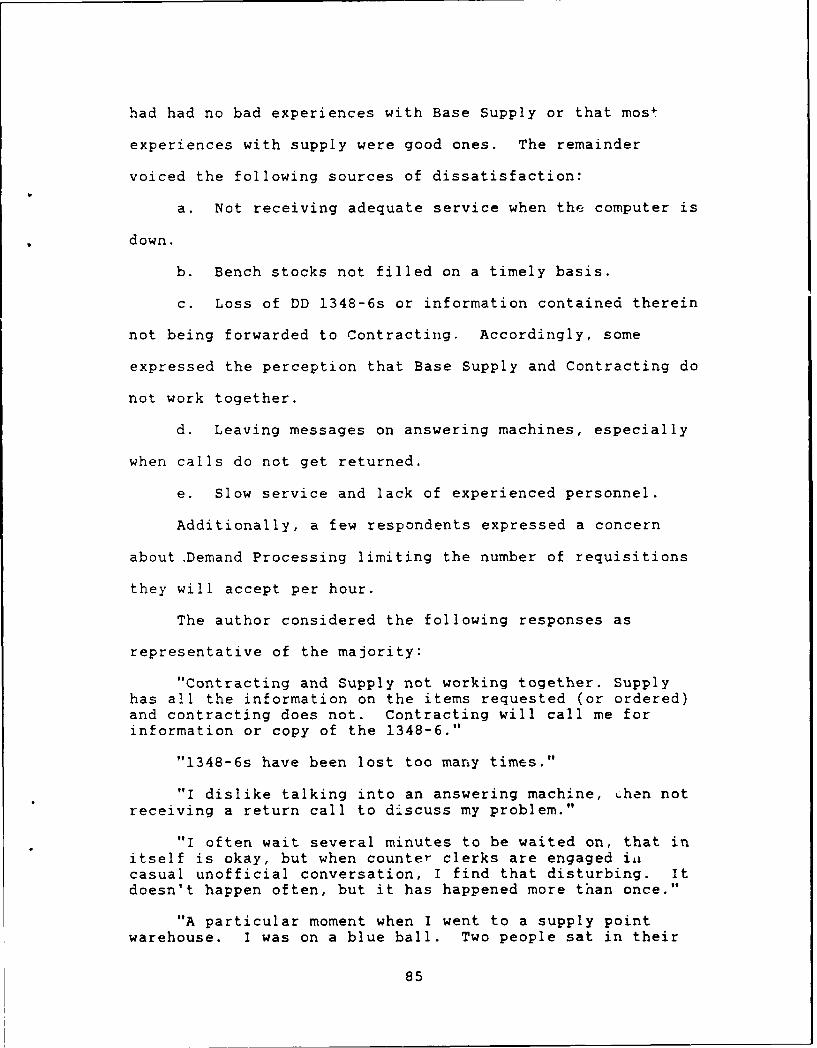
had had no bad experiences with Base Supply or that most
experiences with supply were good ones. The remainder
voiced the following sources of dissatisfaction:
a. Not receiving adequate service when the computer is
down.
b. Bench stocks not filled on a timely basis.
c. Loss of DD 1348-6s or information contained therein
not being forwarded to Contracting. Accordingly, some
expressed the perception that Base Supply and Contracting do
not work together.
d. Leaving messages on answering machines, especially
when calls do not get returned.
e. Slow service and lack of experienced personnel.
Additionally, a few respondents expressed a concern
about .Demand Processing limiting the number of requisitions
they will accept per hour.
The author considered the following responses as
representative of the majority:
"Contracting and Supply not working together. Supplyhas all the information on the items requested (or ordered)and contracting does not. Contracting will call me forinformation or copy of the 1348-6."
"1348-6s have been lost too many times."
"I dislike talking into an answering machine, then notreceiving a return call to discuss my problem."
"I often wait several minutes to be waited on, that initself is okay, but when counter clerks are engaged iicasual unofficial conversation, I find that disturbing. Itdoesn't happen often, but it has happened more than once."
"A particular moment when I went to a supply pointwarehouse. I was on a blue ball. Two people sat in their
85
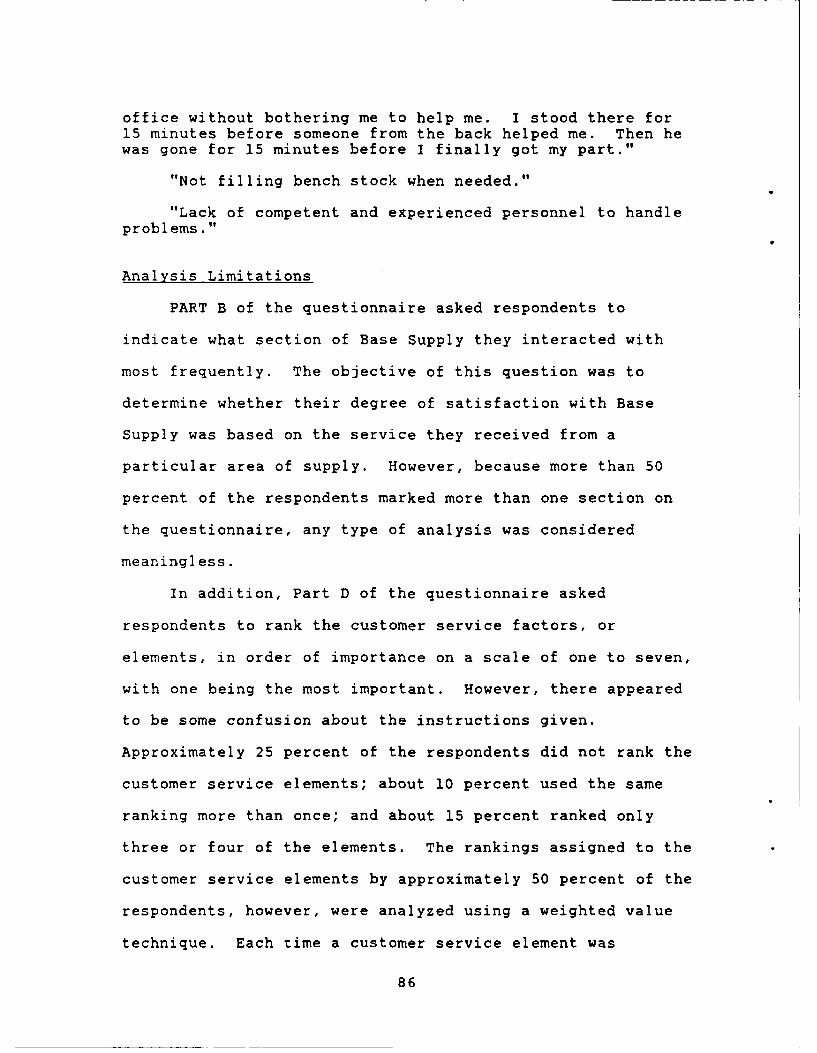
office without bothering me to help me. I stood there for15 minutes before someone from the back helped me. Then hewas gone for 15 minutes before I finally got my part."
"Not filling bench stock when needed."
"Lack of competent and experienced personnel to handleproblems."
Analysis Limitations
PART B of the questionnaire asked respondents to
indicate what section of Base Supply they interacted with
most frequently. The objective of this question was to
determine whether their degree of satisfaction with Base
Supply was based on the service they received from a
particular area of supply. However, because more than 50
percent of the respondents marked more than one section on
the questionnaire, any type of analysis was considered
meaningless.
In addition, Part D of the questionnaire asked
respondents to rank the customer service factors, or
elements, in order of importance on a scale of one to seven,
with one being the most important. However, there appeared
to be some confusion about the instructions given.
Approximately 25 percent of the respondents did not rank the
customer service elements; about 10 percent used the same
ranking more than once; and about 15 percent ranked only
three or four of the elements. The rankings assigned to the
customer service elements by approximately 50 percent of the
respondents, however, were analyzed using a weighted value
technique. Each time a customer service element was
86

selected as number one in importance, it was assigned seven
points; if selected as second most important, it was
assigned six points; if selected as third most important, it
was assigned five points, etc., etc. The total number of
points assigned to each element determined their ranking.
Based on this technique, the elements were ranked in the
following order of importance: Item Availability, Order
Cycle, Responsiveness, Order Processing, General Service,
Demeanor of Supply Representatives. However, in view of the
circumstances explained above, it was concluded that the
rankings were not very representative of the population.
Summary
This chapter described the survey response rate, the
reliability of the survey instrument, and the results of
univariate, bivariate and multivariate analysis of the data.
Each investigative question proposed for this study was
discussed in the same sequence as presented in Chapter I.
The customer service criteria rated very important by the
respondents were presented along with the performance
ratings given to these criteria by the respondents.
Additionally, the results of the statistical tests used to
test the null hypotheses were presented. Based on this
analysis, the following statistically significant
differences were identified:
87

a. Differences between customer segments by grade in
their perception of the importance of GENERAL SERVICE and
DEMEANOR OF SUPPLY REPRESENTATIVES.
b. Differences between customer segments by years of
military service in their perception of the importance of
RESPONSIVENESS.
c. Differences between customer segments by
organizational level in their perception of the importance
of RESPONSIVENESS.
d. Differences between customer segments by
organizational level in their evaluation of Base Supply's
performance on RESPONSIVENESS.
e. Differences between customer segments by
organizational function in their evaluation of Base Supply's
performance on GENERAL SERVICE.
In addition, significant differences were identified
between the importance customers place on the customer
service criteria used in this study and their perception of
Base Supply's performance on those same criteria. The
chapter concluded with the author's analysis of the open-
ended responses.
Further analysis of the results, and the author's
conclusions and recommendations are presented in Chapter V.
88

V. Analysis, Conclusions, and Recommendations
As stated in Chapter I and Chapter III, the specific
objectives of the research were: 1) identify the service
criteria important to the major customers of TAC Base
Supply; 2) identify customer perceptions about the
performance of TAC supply organizations; 3) measure the
range of variation between customer segments; 4) identify
opportunities available to Base Supply for improving
customer satisfaction; and 5) provide a benchmark for future
evaluations of Base Supply customer satisfaction. Hence, the
purpose of this chapter is to highlight the significant
findings of this research study. The analysis and
conclusions concerning the investigative questions are
presented, and the implications of the research methodology
are discussed. Finally, recommendations and suggestions for
further research are offered for the consideration of HQ
TAC/LGS and others interested in this study.
Analysis And Conclusions
The background provided by customer service literature,
the statistical analysis of the data collected, and the
analysis of the open-ended responses led to the following
conclusions regarding the investigative questions proposed
for this study.
89

Investigative Question No. 1. What customer service
criteria are most important to TAC Supply Customers?
Based on the analysis of the data collected, of the six
customer composite variables used in this study order cycle
time and demeanor of supply representatives were considered
the most important (a mean score of 6.0 or higher) by all
TAC Supply major customers. The importance supply customers
placed on the demeanor of supply representatives reinforces
the conclusions of consumer surveys. As mentioned in
Chapter I, a 1988 Gallup Survey demonstrated the majority of
customers equate high quality service with courtesy,
promptness, and the perception that their needs are being
satisfied (13:33-34). The importance of order cycle time is
fairly consistent with La Londe and Zinszer's findings. As
presented in the literature review, order cycle time was
important across industries, but was an especially critical
element in the Pharmaceutical and Merchandising firms of
consumer products.
Analysis of all 45 service criteria used in the study
revealed that 14 criteria were rated very important by the
major customers. Of these, nine were consistent with the
findings of the study across industries by La Londe and
Zinszer, the study of the Office Systems and Furniture
Industry by Sterling and Lambert, the study of the Plastics
Industry by Lambert and Harrington, and the studies of Air
Force Civil Engineering organizations by Long and Singel. A
comparison of the very important criteria common to TAC Base
90

Supply, Civil Engineering, and industries in the private
sector is presented in Table 17. While the wording of the
criteria used in the study of TAC Base Supply is not exactly
the same as that used in the other studies, the substance of
the criteria is basically the same.
In addition to the criteria presented in Table 17, the
following criteria, which had not been identified by
previous studies, also were rated very important:
a. A good working relationship with major customer
organizations (question #12).
b. A commitment to customer satisfaction (question
#14).
c. Ability of supply representatives to solve the
customer's problem (question #22).
d. Ability of supply representatives to fulfiil
promises made (question #23).
e. Base Supply's responsiveness in expediting MICAP
requests (question #46).
Summarizing the results, it was concluded that the
service criteria most important to TAC supply major
customers were as follows:
a. A commitment on the part of Base Supply to provide
the best service possible, to satisfy its customers, and to
maintain a good working relationship with the organizations
they support (questions #13, 14, and 12).
91

Table 17
Comparison of Criteria Found Very ImportantIn TAC Base Supply and Other Organizations Or Industries
OrganizationTAC Base Supply Other Studies or Industry
A commitment to Customer Service Civilproviding the best rep. commitment Engineeringservice possible. (13)
Competence. (26) Competence CivilEngineering
Professionalism. (25) Professionalism Civilof CE workforce Engineering
Minimum variation Minimum Variation Pharmaceuticalbetween required between expected and Consumerand actual delivery arrival date and Productsdates on MICAP actual arrivalitems. (40) date.
Ability to expedite Ability to expedite Plasticsout of the ordinary emergency orders inMICAP~requests. (47) a fast responsive
manner.
Ability to meet Order Cycle Officerequired delivery consistency Systemstimes on items (small variability)available in stock. (37)
A method for Action on Furniturehandling customer customer service andcomplaints. (8) complaints Plastics
A concern about Concern Civilyour problem. (28) Engineering
Availability of Fill Rate Acrossbench stock items Industrieswhen needed. (42)
92
b. Supply personnel that are competent and
professional; that show concern for customer problems and
have the ability to work them out; and that fulfill any
promises made to the customer (questions #22, 23, 25, 26,
and #28).
c. Base Supply's responsiveness in expediting MICAP
requests, and its ability to meet the customer's required
delivery date on MICAP items, (question #40, #46, #47).
d. On-time delivery of supply items when available in
stock (question #37).
e. Established procedures for handling supply customer
complaints (question #8).
f. Bench stock availability (question #42).
The open-ended responses supported the finding that one
of the most important criteria to the customer is the
demeanor of supply representatives. The customers'
impressions of Base Supply, whether favorable or
unfavorable, appeared to be based on how they are treated by
supply representatives. Those with favorable impressions
were very enthusiastic in their praise for supply
representatives who provided prompt service and demonstrated
a genuine interest in the problems of individual customers.
One satisfied customer expressed it thus:
Outstanding research facility. Great customerservice. They answer your question right on thephone; they go beyond normal procedures to help youin anyway they can. I can also say the same thingabout MICAP. They answer any question. They're morethan happy to help you with any problem whether it isMICAP or not. Both units are outstanding.
93

None of the 14 criteria rated overall as very important
by the respondents received a performance rating lower than
3 (on a seven point scale). This demonstrated customers
perceived supply's performance as satisfactory on the
criteria which they valued as very important. However,
supply's performance was not perceived as excellent on any
of the 14 criteria. It is interesting to note that a
similar finding was made by Lambert and Harrington in their
study of the Plastics Industry where no vendor in the
industry was performing to customer expectations on the 18
variables that were rated most important. Lambert and
Harrington attributed their finding to the business strategy
of focusing on the competition instead of focusing on the
customer (18:57). In Base Supply, it is conceivable that
this finding was attributable to supply's focus on internal
measures of performance rather than on the customer.
Investigative Question No. 2. Is TAC Base Supplyperforming in accordance with customer's expectations?
Analysis of the data showed a statistically significant
difference between the importance and performance ratings
for each of the six customer service composite variables.
The magnitude of the difference between importance and
performance ratings for the composite variables was
punctuated by the fact that 44 out of the 45 criteria that
comprised these variables also showed statistically
significant diffeiences. Figure 6 further illustrates the
disparity between customer expectations, as specified by the
94

importance they place on the customer service composite
variables, and customer evaluations of supply's performance.
Based on these results, it was concluded that TAC Base
Supply was not performing in accordance with customer
expectations.
CompositeImportance Variable Performance
None Moderate High Poor Sat Excellent
* Order Cycle *
* Demeanor Of *SupplyRepresentatives
* General Service *
* Responsiveness *
* Item Availability *
* Order Processing *
Figure 6. Customer Service Analysis for TAC Base Supply.Adapted from Sharman (25:76).
This finding was not very surprising given that the
focus of Base Supply has been on the traditional supply
performance measures which are internal. By meeting these
performance standards, Base Supply management may assume
it has fully met the needs of its customers. However, this
study has shown that for the majority of customers this was
not the case. The finding does not, however, necessarily
imply that Base Supply fails to do an excellent job of
95

supporting its customers. But it does suggest that the
majority of customers perceive significant shortfalls in
Base Supply support.
The greatest disparities between importance and
performance ratings were observed in the two composite
variables that customers rated as most important: DEMEANOR
OF SUPPLY REPRESENTATIVES and ORDER CYCLE. With regards to
demeanor of supply representatives, both the statistical
analysis and the open-ended responses strongly indicated the
service provided by supply personnel is not meeting the
expectations of supply major customers. This strongly
suggests that internal measures of performance are not, by
themselves, sufficient to meet customer expectations.
Impressive stockage effectiveness rates or MICAP rates might
not c6nvince customers that supply is dedicated to customer
service. But the behavior or attitudes of supply
representatives will generally convey to customers a
commitment to superior customer service, or the lack
thereof.
The composite variable ORDER CYCLE accounted for the
greatest significant difference between importance and
performance ratings. The four questions that constituted
this variable focused on the length of the order cycle for
MICAP, local purchase items, items procured from depot, and
items available in stock. Even though the statistical
analysis demonstrated that customers perceived a significant
shortfall in support of this area, the open-ended responses
96
suggested that the core of the problem was not in the length
or variability of the order cycle inherent in the supply
pipeline. Instead, it appeared that customers perceived
supply personnel were not using the capabilities of the
supply system to its fullest advantage. An example of this
was illustrated by the following open-ended response:
I went MICAP on an item which was not available atthe depot, but was available at [RAF] Bentwaters,England (per the Item Manager's report). MICAPwould not go lateral. They said that they wouldwait for Bentwaters to call them (like Bentwatersknew we needed a lateral check).
Open-ended responses suggested that customers did not
hold Base Supply responsible for the variation between
required and actual delivery dates for depot-procured items.
Customers appeared to understand the limitations confronted
by Base Supply in procuring items they needed. An example
of several responses that conveyed the customer's
understanding of supply's limitations were the following:
"Customer service personnel are very helpful although most
of the time their hands are tied because of the problem
being at depot or contracting." Another example was a
customer's reference to a particularly satisfying experience
with Base Supply: "The receipt of some long awaited MICAP
items from depot. The lead time was of no fault of Base
Supply; out of stock and no contract item at depot."
The responses suggested, however, that customers do
hold Base Supply responsible for the expedient delivery of
items available in stock. Further, in regards to the order
97

cycle for MICAP items, the responses suggested what
customers find unacceptable is the perception that supply
personnel are not doing everything possible to get the items
customers need. This was well illustrated by the customers'
responses to open-ended question number 2: What actions do
you take when Base Supply cannot provide an item when you
need it? The finding that the majority of respondents are
circumventing supply channels by directly contacting other
bases and depots suggests a lack of faith not in the system,
but in supply personnel. By taking matters into their own
hands, customers are communicating to supply that they
perceive supply personnel are not aggressive enough in
locating the part for them.
This finding highlights the need for a customer service
policy that is not based on internal performance measures
alone but one that includes measures reflecting the
customer's expectations of service.
Investigative Question No. 3. Are there differences inthe perception of supply perforrance according to rank,years of service, organizational level, organization type,and ba _?
The analysis of variance procedure revealee only two
significant differences between groups in regards to their
view of Base Supply's performance. There was a significant
difference between customers that work at the branch level
and those working at the section level in their perception
of supply's performance on the composite variable
RESPONSIVENESS. Customers at the branch level perceived
98

Base Supply's performance less favorably than those at the
section level. An analysis of the individual criteria that
made up this composite variable showed that the significant
difference existed in the perception of the ability of Base
Supply to handle out of the ordinary delivery requests. For
this criterion, TAC branch personnel had a mean score of
3.74 with a standard deviation of 1.72 on a performance
scale of one to seven. In contrast, section personnel
showed a mean score of 4.75 with a standard deviation of
1.69. A possible explanation for this difference is that
branch level personnel awareness of Base Supply's
performance normally centers around problems, because issues
that cannot be resolved at the section level are elevated to
the branch as problems needing branch attention. Branch
personnel are, in general, aware of more supply problems
and, therefore, are more likely to perceive Base Supply's
performance less positively than section personnel.
There was a significant difference between customers in
Maintenance and the various organizations that fell in the
"other" category in regards to their perception of Base
Supply's performance on the composite variable GENERAL
SERVICE. An analysis of the criteria that made up this
variable revealed the existence of significant differences
in the perception of two measures.
The f.irst measure dealt with visits by supply to ensure
adequate support is being provided to the organization. TAC
Maintenance organizations showed a mean score performance
99

rating of 3.47 with a standard deviation of 1.80 and the
various organizations in the "other" category showed a
dramatically lower mean score of 2.61 with a standard
deviation of 1.87. The relatively higher satisfaction of
maintenance organizations could be attributed to more
frequent supply visits, although neither group was
overwhelmingly satisfied. As the principal customer (56.9
percent of the major-customer population), it follows that
maintenance might receive more customer support visits from
Base Supply than units with les nission impact. Besides
the difference between the two groups, however, it was noted
that all groups rated this measure poor to marginally
satisfactory (2.61 to 3.60).
The second measure concerned a commitment by supply to
provide the best possible service. Maintenance
organizations showed a mean score of 5.04 with a standard
deviation of 1.48 and the "other" category showed a mean
score of 4.30 with a standard deviation of 1.81. The
difference between the two groups could be attributed to the
likelihood that TAC maintenance, because of the critical
nature of their mission, received a more tailored level of
service than the various organizations in the "other"
category.
The underlying theme in the two criteria that comprised
the composite variable GENERAL SERVICE was the interaction
of Base Supply with its major customers. This common theme
is a probable explanation for the significant difference in
100
perceptions of GENERAL SERVICE between customers in
maintenance and the various "other" organizations. A more
frequent interaction with base supply could lead to
different perceptions of performance. Due to their crucial
mission, maintenance organizations invariably interact more
frequently with Base Supply.
Management Question. The management question which was
the focus of this research was, "How is Base Supply meeting
the needs and expectations of its customers?" Based on the
findings for the three investigative questions posed for
this study and the analysis of the open-ended responses, it
was concluded that while customers perceived supply's
performance as satisfactory, they also perceived significant
shortfalls in Base Supply support.
Implications of the Research Methodology
The research methodology developed for this study made
four significant contributions to conducting an external
customer audit of Base Supply customers.
a. It provided service criteria which could be applied
across all sections of Base Supply that provide direct
service to customers.
b. It identified the criteria that are most important
to the satisfaction of TAC major supply customers. These
included 14 criteria used in the questionnaire plus 6
criteria identified by the open-ended responses. For
101

clarity, all the criteria have been compiled together and
are shown in Table 18.
c. The questionnaire used in the study provided a tool
for obtaining customer perceptions on the performance of
Base Supply.
Table 18
Summary of Service Criteria Identified As ImportantBy TAC Base Supply Major Customers
General Service:
A commitment to providing the best service
possible. (13)
A commitment to customer satisfaction. (14)
A good working relationship with your organization.(12)
A.method for handling customer complaints. (8)
Demeanor of Supply Representatives:
Competence. (26)
Ability to solve the customer's problem. (22)
Fulfill promises made. (23)
Professionalism. (25)
A concern about your problem. (28)
Responsiveness:
Ability to expedite MICAP requests. (46)
Ability to expedite out of the ordinary MICAP requests.(47)
Order Cycle Time:
Minimum variation between required and actual deliverydates on MICAP items. (40)
102

Table 18 (Continued)
Ability to meet required delivery times on itemsavailable in stock. (37)
Item Availability:
Availability of bench stock items when needed. (42)
From Open-Ended Responses:
Not giving the customer the runaround.
Ability to work with the customer.
A positive attitude towards the customer.
Effective supply operations during computer downtime.
More training for supply personnel on supplyprocedures.
More effective training for personnel in theorganizations Base Supply supports, i.e. equipmentcustodians, AMU personnel.
d' The identification of the criteria relevant to the
major customers, and their perception of supply's
performance provided HQ TAC/LGS information they could
employ to adjust or change Base Supply customer service
policy.
Although the methodology took a broad perspective of
TAC Base Supply customer satisfaction, it was very useful in
identifying customer perceptions. A more comprehensive list
of criteria could be developed to examine customer
satisfaction with specific work units in supply. But it
should be emphasized that the list of criteria should be
derived from personal interviews with the frequent customers
of the work unit because there is no better way to identify
103
what is important to the customer than to ask the customer
directly. Additionally, although the scope of this
research was limited to the major CONUS customers of TAC
Base Supply, the same methodology could be applied to
examine the perceptions of a representative sample of the
entire TAC supply customer population. Moreover, the same
methodology could be applied to the major supply customers
of other commands.
Recommendations
As stated in Chapter I, one of the specific objectives
of this research was to identify what opportunities are
available to Base Supply to improve customer satisfaction.
Based on the findings, the following recommendations are
offered.
a. Recommend that TAC Base Supply provide specific
customer service standards for TAC supply personnel. It
cannot be assumed that people intuitively know how to
demonstrate courtesy, a positive attitude, etc. Personnel
need to know how to communicate the desired or expected
behavior to the customer. This, in turn, will communicate
to the customer Base Supply's commitment to providing the
best possible service. A starting point could be the
adoption of the guidelines presented in Table 1, page 17.
These guidelines cover most of the criteria major customers
identified as important to their satisfaction with Base
Supply.
104

b. Recommend that HQ TAC/LGS develop an explicit
customer service policy statement for all TAC supply
organizations. The need for this policy statement is seen
by the leading experts as an integral component of an
organization customer service strategy (16:191). Without a
specific statement, each supply organization will interpret
customer service as they see fit. Further, recommend that
this statement, and the implied commitment of Base Supply to
fulfill it, be disseminated to customers. An appropriate
example of a policy statement is that of Federal Express.
Their statement based on people, service, and profit, reads
as follows:
Federal Express is committed to our PEOPLE-SERVICE-PROFIT philosophy. We will produce outstandingfinancial returns by providing totally, reliable,competitively superior global air-ground transportationo f high priority goods and documents that requirerapid, time certain delivery. Equally important,positive control of each package will be maintainedutilizing real time electronic tracking and tracingsystems. A complete record of each shipment anddelivery will be presented with our request forpayment. We will be helpful, courteous, andprofessional to each other and the public. We willstrive to have a completely satisfied customer atthe end of each transaction. (17:111)
c. Because the demeanor of supply representatives has
been identified as very important to TAC Supply major
customers, recommend supply organizations be more selective
in choosing personnel assigned to positions requiring direct
daily contact with customers. Personnel that are people-
oriented, enthusiastic, courteous, and knowledgeable of
supply procedures should be the norm in areas such as the
105

Customer Service Unit, MICAP, Demand Processing, Equipment
Management, Base Service Store, Individual Equipment Unit,
and Pick-Up and Delivery.
Traditionally, based on the author's experience, very
little attention has been given to this area. In fact, the
common practice has been to assign personnel just out of
supply technical school to customer service positions simply
because some of these positions are perceived as the best
starting point for new supply personnel. The impact that
the limited knowledge of these personnel has on customer
perceptions of Base Supply normally has not been a
consideration. However, since it is not always possible to
reassign personnel, the best solution is offered in the next
recommendation.
d. Develop an in-house customer service training
program/seminar for supply personnel that will focus on
feaching and reinforcing expected behavior toward customers.
This training could be integrated into on-the-job training
programs. Superior service organizations do not leave
anything to chance; they train their employees to ensure
they know exactly what conditions should exist if service
superiority is to be achieved (8:26).
e. To improve the customer's perception of the order
cycle for MICAP items, recommend that, in addition to the
requirements established by supply regulations, each Base
Supply develop specific standards that MICAP personnel will
use for locating MICAP parts. These standards should
106

address such areas as: will lateral support be requested via
phone or message? Will item managers be contacted via phone
or message? How often will the customer be directly
notified of actions taken? The standards must be attainable
given the volume of business at a particular base. Further,
these standards should be communicated to customers by
posting them in MICAP offices and sending a copy to each
major customer organization. The issue is to communicate to
the major customers, in no uncertain terms, Base Supply's
commitment to exhausting all possible alternatives to get
the part they need.
f. In regards to the order cycle for items available
in stock, it appears that customers might just have too high
of an expectation on delivery times for these items.
Recommend this area be examined to determine if supply is
meeting the delivery time requirements set by supply
regulations. If so, recommend customers be reeducated on
these standards.
g. Since approximately 40 percent of maintenance
customers expressed some dissatisfaction with the slow
response they received from supply in filling bench stock,
recommend the procedures used to respond to customer
requests be examined. If the response times are what can be
reasonably expected for bench stock items available from
stock, then supply needs to lower bench stock customer
expectations. To preclude customer dissatisfaction in this
107

area, suggest that a standard response time be established
so that customers know exactly what to expect from supply.
h. Develop guidelines for handling customer service
complaints. The customer should know who to go to get a
complaint resolved; the supply representative's name should
be posted where appropriate. The individual designated to
handle all complaints for his (her) section or branch,
should be aggressive in the treatment of those complaints
and perform this task in an expeditious. Waiting for an
answer, or never getting one, usually aggravates customers.
Additionally, if the complaint will take a few days to
research and resolve, a note to the customer letting him
know someone is working on his problem will go a long way to
making him (her) feel satisfied with Base Supply. A form
letter" could be useful for this purpose.
i. Since 30 percent of the respondents expressed
dissatisfaction with supply personnel's level of knowledge,
and another 30 percent indirectly addressed the issue,
recommend more emphasis be directed toward on-the-job
training. Specifically, management needs to determine
whether training is actually taking place and how often. In
this regard, supply personnel could, periodically, be
allowed to work in different areas of supply for a week at a
time. It is not very likely that this practice would have a
deleterious effect on the effectiveness of supply; however,
it would offer a triple benefit: 1) personnel knowledge of
supply procedures will greatly increase; 2) the importance
108

of teamwork would be emphasized; and 3) personnel would see
first hand how their work and mistakes affect others and,
ultimately, the customer.
j. Sin%.e customer expectations have been identified by
this research, the next logical step is to align Base Supply
internal performance measurements with those expectations.
However, if some customer expectations are too high, as it
appears to be the case with the order cycle for items
available in stock, then steps should be taken to lower
those expectations by stating exactly what Base Supply can
and cannot do for its major customers. The benefits of
doing this are twofold: 1) Base Supply will build better
relationships with its major customers; 2) customers might
willingly adjust their expectations to supply policies
without feeling alienated.
k. Stay in touch with the customer by periodically
measuring the customer's perception of the service provided.
For this purpose, the questionnaire used for this study
could be used as is or modified to include other areas of
interest to management.
Suggestions For Further Research
Based on the experience gained from this study, the
following recommendations for further research are offered:
a. The external audit conducted for this study has
identified the criteria relevant to TAC Base Supply major
customers and how they perceive the service provided by Base
109

Supply. The next step of the process, as supported by the
literature review, would be an internal audit. The audit
would evaluate supply personnel perceptions of the service
they provide. The information provided by the audit would
allow TAC Base Supply to determine if its service
orientation is consistent with customer expectations, and
provide the basis for the development and implementation of
customer service standards that reflect the customer's point
of view.
b. As stated in Chapter I, this research was limited
to the major customers of TAC Base Supply. Further research
could focus on evaluating the perceptions of all TAC Base
Supply customers using the same methodology.
c. The methodology used in this research could be
replicated to evaluate customer perceptions in other
commands and compare the results to those obtained by this
study.
d. Future research could focus on evaluating customer
perceptions of specific units of Base Supply, i.e. Demand
Processing, MICAP, Stock Control, etc. The results would be
used to set specific customer service standards for each of
these units.
e. Once additional data has been gathered by the
research studies recommended above, a future researcher
could compile all the informatior and develop a customer
service guide for supply personnel.
110

f. Future researchers who wish to use the survey
instrument developed for this study ace cautioned about the
questions that comprised the composite variable INFORMATION
AVAILABILITY. As mentioned in Chapter IV, the reliability
of this composite variable was not considered adequate. The
reliability of this measure should be improved before using
it again.
In addition, an effort should be made to further
improve the clarity of questions number 6 in PART A and the
ranking of customer service factors in PART D of the
questionnaire. As mentioned in Chapter IV, there appeared
to be some confusion about the instructions given for these
two questions.
Summary
The research identified the criteria important to TAC
Base Supply major customers, and evaluated their perceptions
of Base Supply's performance. The significant findings were
highlighted to provide supply organizations the information
needed to develop customer service strategies that reflect
the customer's point of view.
It must be emphasized that this study evaluated
customer expectations and perceptions at a point in time.
To stay in touch with customer needs, customer service
audits should be conducted periodically. TAC Base Supply
then could use this information to continually improve
ii1
and reinforce its commitment to providing the best possible
service.
This research provides a benchmark for evaluating Base
Supply customer satisfaction. In conjunction with an
internal audit, this research should prove valuable in
developing specific customer service strategies that will
lead to improved customer satisfaction, and to Base Supply
being held in high esteem by its customers.
112

Appendix A: Survey Notification From HO TAC/LGS
To Chiefs Of Supply
(Sent by message)
HQ TAC/LGS
Survey of Base Supply Customer Satisfaction
TAC Chiefs of Supply
1. As part of her thesis effort, Capt Esperanza Flores, asupply officer enrolled as a graduate student at the AFITSchool of Systems and Logistics at Wright Patterson AFB hasdeveloped a survey to examine customer perceptions ofservice rendered by Base Supply. Customers will be asked toidentify the service factors important to them, and toevaluate supply system performance on these factors.
2. The intent of the survey is not to identify the supplyorganizations that are doing a good or bad job at pleasingtheir customers. Rather, the intent is to identify what are"real" customer service needs, and potential gaps betweencustomer expectations and perceived performance.
3. In order to conduct this survey, please identify four(4) of your major customers, by message, to Capt Flores,AFIT/LSG, Wright Patterson AFB, OH by 23 April. Majorcustomers are those organizations that together account foryour largest volume of transactions. The questionnaireswill be mailed to these organizations approximately 15 May.
4. If you have any questions, feel free to contact CaptFlores at Autovon 785-4437, TELEFAX AV 785-8458.
HQ TAC/LGS
113

Appendix B: Example Of Letter Addressed To Commanders OfMajor Customer Organizations
AFIT/LSG (Capt Flores)
Base Supply Customer Satisfaction Survey
CC
1. HQ TAC/LGS is interested in determining how usersevaluate the level of customer service provided by BaseSupply. To obtain that information, they are asking theirmajor users to respond to some general questions about theservices and support provided by Base Supply organizations.Your organization was selected to participate in this surveybecause it was identified as a major customer of the 67thBase Supply Squadron. Therefore, your participation in thissurvey is very important.
2. Enclosed are five (5) questionnaires. Request yoursupport in conducting this survey by filling out onequestionnaire, and distributing the remaining four (4) topersonnel in your organization that routinely deal directly(by phone or in person) with Base Supply. To account fordifferences in organizational levels, request you select oneperson from each of the following rank structures:
a. El - E3b. E4 - E6c. E7 - E9d. 01 - 03
3. All responses to the questionnaires will be sentdirectly to me and aggregated for analysis. A pre-addressedenvelope is included for each respondent for theirconvenience. Please encourage your personnel to answer thequestionnaires carefully, and to return them within 10 daysof receipt.
4. Thank you very much for your cooperation in conductingthis survey. If you have any questions, please contact meat AV 785-4437.
ESPERANZA FLORES, Capt, USAF 5 AtchsAFIT Student Survey Packets
114
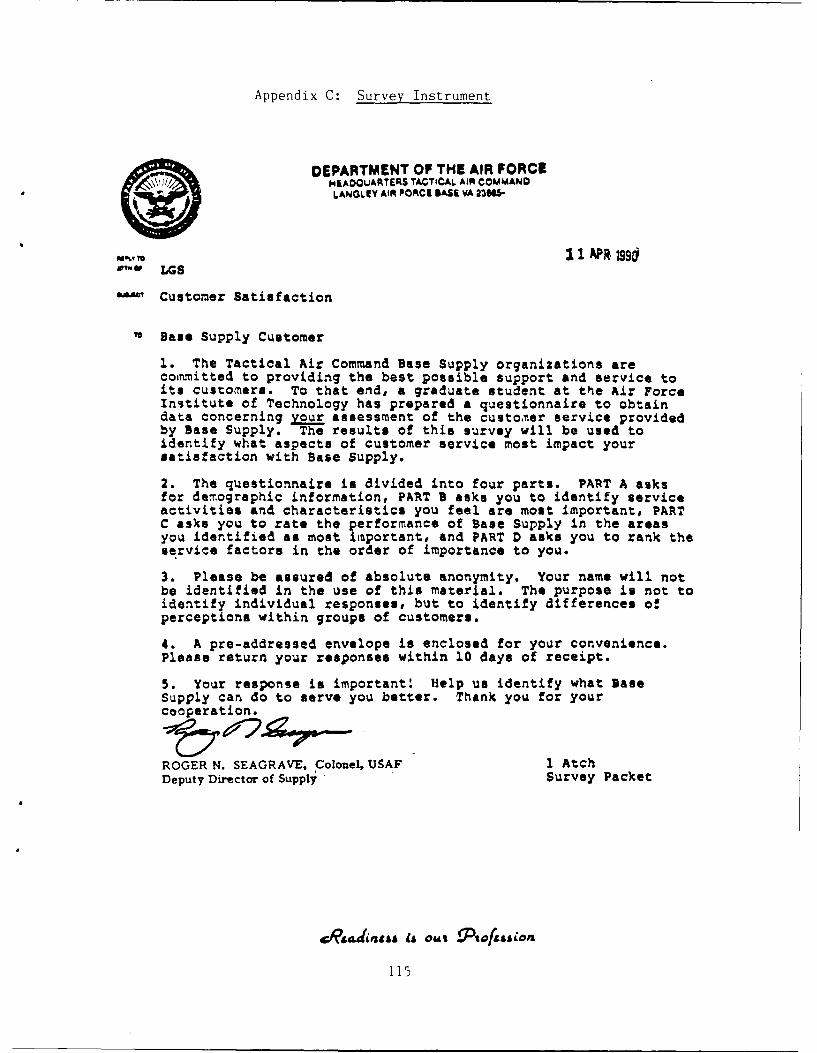
Appendix C: Survey Instrument
DEPARTMENT OF THE AIR FORCEHEADOOARTERS TACTICAL AIR COMMAND
* LANGLEY AIR POACII BASE VA 23U6-
11 A 199ism LGS
a Customer Satisfaction
Base Supply Customer
1. The Tactical Air Command Base Supply organizations arecommitted to providing the best possible support and service toits customers. To that end, a graduate student at the Air ForceInstitute of Technology has prepared a questionnaire to obtaindata concerning your assessment of the customter service providedby Base Supply. Te results of this survey will be used toidentify what aspects of customer service most impact yoursatisfaction with Base Supply.
2. The questionnaire is divided into four parts. PART A asksfor demographic information, PART B asks you to identify serviceactivities and characteristics you feel are most important, PARTC asks you to rate the performance of Base Supply in the areasyou identified as most important, and PART D asks you to rank theservice factors in the order of importance to you.
3. Please be assured of absolute anonymity. Your name will notbe identified in the use of this material. The purpose is not toidentify individual responses, but to identify differences ofperceptions within groups of customers.
4. A pre-addressed envelope is enclosed for your convenience.Please return your responses within 10 days of receipt.
5. Your response is important: Help us identify what BaseSupply can do to serve you better. Thank you for yourcooperation.
ROGER N. SEAGRAVE, Colonel, USAF 1 AtchDeputy Director of Supply Survey Packet
115

SURVEY OF CUSTOMER SATISFACTION WITH BASE SUPPLY
PART A: DEMOGRAPHIC FACTORS. This part of the questionnaire is designed
to collect demographic factors that will be used to evaluate individual
differences of the respondents. Please read each item carefully and
circle the item that more accurately describes your present situation.
1. What is your pay grade?
a. E1 - E3 d. 01 - 03
b. E4 - E6 e. 04 - 06
c. E7 - E9 f. Other (specify)
2. How long have you been in the Air Force?
a. Less than one yearb. 1 - 5 years
c. 6 - 10 yearsd. 11 - 15 yearse. 16 - 20 years
f. 21 or more years
3. To" which base are you currently assigned?
a. Bergstrom AFB j. MacDill AFBb. Cannon AFB k. Moody AFB
c. Davis-Monthan AFB 1. Mountain Home AFB
d. England APB m. Myrtle Beach AFB
e. George AFB n. Nellis APBf. Holloman AFB o. Seymour Johnson AFBg. Homestead AFB p. Shaw AFB
h. Langley AFB q. Tonopah Test Range
i. Luke AFB r. Tyndall AFB
4. To which organizational level are you assigned? (Choosethe level which best describes your current position, i.e.,
if you're a branch chief or assistant branch chief, check
item e).
a. MAJCOM Headquarters e. Branch
b. Numbered Air Force f. Section
c. Wing g. Other (specify)
d. Squadron
116
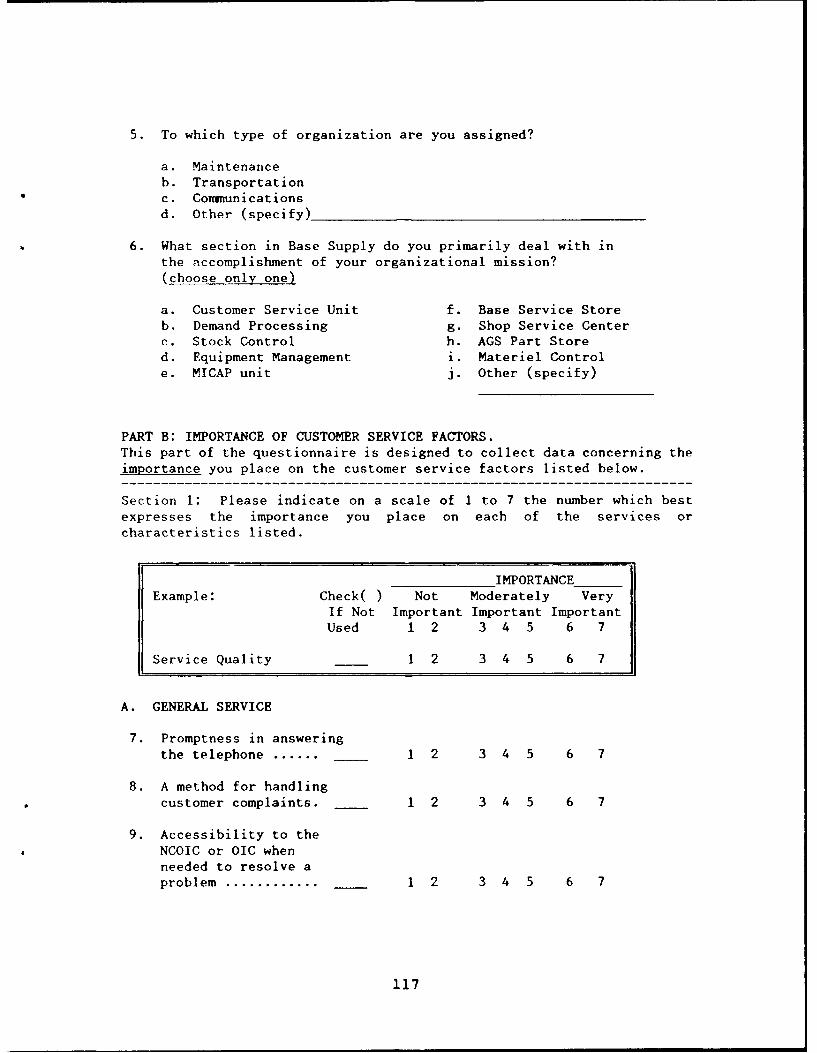
5. To which type of organization are you assigned?
a. Maintenance
b. Transportationc. Communications
d. Other (specify)
6. What section in Base Supply do you primarily deal with in
the accomplishment of your organizational mission?
(choose only one)
a. Customer Service Unit f. Base Service Storeb. Demand Processing g. Shop Service Center
c. Stock Control h. AGS Part Stored. Equipment Management i. Materiel Control
e. MICAP unit j. Other (specify)
PART B: IMPORTANCE OF CUSTOMER SERVICE FACTORS.This part of the questionnaire is designed to collect data concerning the
importance you place on the customer service factors listed below.
Section i: Please indicate on a scale of 1 to 7 the number which best
expresses the importance you place on each of the services orcharacteristics listed.
IMPORTANCEExample: Check( ) Not Moderately Very
If Not Important Important Important
Used 1 2 3 4 5 6 7
Service Quality 1 2 3 4 5 6 7
A. GENERAL SERVICE
7. Promptness in answering
the telephone ...... 1 2 3 4 5 6 7
8. A method for handlingcustomer complaints. 1 2 3 4 5 6 7
9. Accessibility to the
NCOIC or OIC whenneeded to resolve a
problem ............ 1 2 3 4 5 6 7
117

IMPORTANCE
Example: Check( ) Not Moderately Very
If Not Important Important ImportantUsed 1 2 3 4 5 6 7
Service Quality 1 2 3 4 5 6 7
10. Accessibility of Base
Service Store andIndividual Equipment
Unit ................. 1 2 3 4 5 6 7
11. Visits to yourorganization toensure adequatesupport is being
provided ............ 1 2 3 4 5 6 7
12. A good working
relationship withyour organization... 1 2 3 4 5 6 7
13. A commitment toproviding the best
service possible ..... 1 2 3 4 5 6 7
14. A commitment to customer
satisfaction ......... 1 2 3 4 5 6 7
B. INFORMATION AVAILABILITY
15. Availability oflistings showing
current statusof requisitions ...... 1 2 3 4 5 6 7
16. MICAP status updates 1 2 3 4 5 6 7
17. Advance notice ontemporary closuresof Base Service Storeor the Individual
Equipment Unitdue to inventory.... 1 2 3 4 5 6 7
18. Advance notice on
changes to localprocedures .......... 1 2 3 4 5 6 7
118

IMPORTANCE_Example: Check( ) Not Moderately Very
If Not Important Important ImportantUsed 1 2 3 4 5 6 7
Service Quality 1 2 3 4 5 6 7
C. DEMEANOR OF SUPPLY REPRESENTATIVES
19. Courtesy on thephone .............. 1 2 3 4 5 6 7
20. Courtesy in person.. 1 2 3 4 5 6 7
21. Military bearing andappearance ......... 1 2 3 4 5 6 7
22. Ability to solveyour problem ......... 1 2 3 4 5 6 7
23. Fulfill promises made 1 2 3 4 5 6 7
24. Ability to handle
the customer's anger
or frustration ...... 1 2 3 4 5 6 7
25. Prpfessionalism ... 1 2 3 4 5 6 7
26. Competence ......... 1 2 3 4 5 6 7
27. An enthusiasticattitude ............ 1 2 3 4 5 6 7
28. A concern aboutyour problem ........ 1 2 3 4 5 6 7
C. ORDER PROCESSING
29. Ease and simplicityof order form(AP Form 2005,DD Form 1348-6) ..... 1 2 3 4 5 6 7
30. Time required tofill out orderform ................ 1 2 3 4 5 6 7
119

IMPORTANCE_
Example: Check( ) Not Moderately VeryIf Not Important Important Important
Used 1 2 3 4 5 6 7
Service Quality 1 2 3 4 5 6 7
31. Assistance in searching
for a part numberor stock number ....... 1 2 3 4 5 6 7
32. Availability of more than
onp phone line for
placing orders ....... 1 2 3 4 5 6 7
33. Availability of remote
order transmission
(computer to computer
order entry) ......... 1 2 3 4 5 6 7
34. No restriction on number
of orders that can
be placed over the
phone ................ 1 2 3 4 5 6 7
35. Clear guidance
on due in frommaintenance (DIFM)procedures .......... 1 2 3 4 5 6 7
36. Clear guidance on local
purchase procedures. 1 2 3 4 5 6 7
D. ORDER CYCLE TIME (from order submission to delivery)
37. Ability to meetrequired delivery times
on items available in
base stock .......... 1 2 3 4 5 6 7
38. Minimum variation betweenprojected and actual
delivery dates on itemsprocured from depot.. 1 2 3 4 5 6 7
39. Ability to meet requireddelivery dat, s on local
purchase items ....... 1 2 3 4 5 6 7
120

IMPORTANCEExample: Check( ) Not Moderately Very
If Not Important Important Important
Used 1 2 3 4 5 6 7
Service Quality 1 2 3 4 5 6 7
40. Minimum variation between
required and actual delivery
dates on MICAP items. 1 2 3 4 5 6 7
E. ITEM AVAILABILITY
41. Fill rate on base levelstock items (% of orders
received completethe first time) ..... 1 2 3 4 5 6 7
42. Availability of benchstock items when
needed .............. 1 2 3 4 5 6 7
43. Availability of supply
point items whenneeded .............. 1 2 3 4 5 6 7
44. Adequate stock of baseservice store items.. 1 2 3 4 5 6 7
45. Adequate stock ofindividual equipmentitems ................ 1 2 3 4 5 6 7
F. RESPONSIVENESS
46. Ability to expedite
MICAP requests ....... 1 2 3 4 5 6 7
47. Ability to expedite
out of the ordinaryMICAP requests ....... 1 2 3 4 5 6 7
48. Ability to expedite
non-micap requestswhen necessary ....... 1 2 3 4 5 6 7
121

IMPORTANCE-Example: Check( ) Not Moderately Very
If Not Important Important Important
Used 1 2 3 4 5 6 7
Service Quality 1 2 3 4 5 6 7
49. Ability to handleout of the ordinary
delivery requests ..... . .. 1 2 3 4 5 6 7
50. Ability to expedite out
of the ordinary local
purchase requests.... 1 2 3 4 5 6 7
51. Ability to provide
training programsto suit the needs
of your organization(DIFM management,equipment manage-ent,
etc.) ....... ..... 1 2 3 4 5 6 7
G. ADDITIONAL COMMENTS
1. Are there any other customer service factors you considerimportant to your satisfaction with Base Supply?
PLEASE TURN THE PAGE FOR THE CONTINUATION OF ADDITIONAL COMMENTS
122

2. What actions do you take when Base Supply cannot provide anitem when you need it? (wait, increase the priority, submita Supply Difficulty Report, contact other bases, contact thedepot, etc.)
123

PART C: EVALUATION OF PERFORMANCE. This part of the questionnaire is
designed to evaluate your perception of Base Supply's performance with
respect to each of the factors listed in part B.
PERCEIVED PERFORMANCE__Example: Does Not Poor Satisfactory Excellent
Provide
1 2 3 4 5 6 7
Service Quality 1 2 3 4 5 6 7
A. GENERAL SERVICE
1. Promptness in answeringthe telephone ...... 1 2 3 4 5 6 7
2. A method for handlingcustomer complaints. 1 2 3 4 5 6 7
3. Accessibility to theNCOIC or OIC when
needed to resolve a
problem ............ 1 2 3 4 5 6 7
4. Accessibility of BaseService Store and
Individual Equipment
Unit ................. 1 2 3 4 5 6 7
5. Visits to yourorganization to
ensure adequatesupport is being
provided ............. _ 1 2 3 4 5 6 7
6. A good working
relationship withyour organization... _ 1 2 3 4 5 6 7
7. A commitment to
providing the bestservice possible ..... 1 2 3 4 5 6 7
8. A commitment to customer
satisfaction ......... 1 2 3 4 5 6 7
124

PERCEIVED PERFORMANCE__
Example: Does Not Poor Satisfactory Excellent
Provide1 2 3 4 5 6 7
Service Quality 1 2 3 4 5 6 7
B. INFORMATION AVAILABILITY
9. Availability oflistings showingcurrent status
of requisitions ..... 1 2 3 4 5 6 7
10. MICAP status updates 1 2 3 4 5 6 7
11. Advance notice ontemporary closures ofBase Service Store orthe Individual EquipmentUnit due to inventory 1 2 3 4 5 6 7
12. Advance notice onchanges to localprocedures .......... 1 2 3 4 5 6 7
C. DEMEANOR OF SUPPLY REPRESENTATIVES
13. Courtesy on thephone .............. 1 2 3 4 5 6 7
14. Courtesy in person.. 1 2 3 4 5 6 7
15. Military bearing andappearance ......... 1 2 3 4 5 6 7
16. Ability to solveyour problem .......... __ 1 2 3 4 5 6 7
17. Fulfill promises made 1 2 3 4 5 6 7
18. Ability to handle
the customer's angeror frustration ...... 1 2 3 4 5 6 7
19. Professionalism ... 1 2 3 4 5 6 7
20. Competence ......... 1 2 3 4 5 6 7
125

PERCEIVED PERFORMANCE_
Example: Does Not Poor Satisfactory Excellent
Provide1 2 3 4 5 6 7
Service Quality 1 2 3 4 5 6 7
21. An enthusiastic
attitude ............ 1 2 3 4 5 6 7
22. A concern about
your problem ........ 1 2 3 4 5 6 7
C. ORDER PROCESSING
23. Ease and simplicityof order form
(AF Form 2005,
DD Form 1348-6) ..... 1 2 3 4 5 6 7
24. lime required to
fill out order
form ................ 1 2 3 4 5 6 7
25. Assistance in searching
for a part numberor stock number ....... 1 2 3 4 5 6 7
26. Availability of more than
one phone line for
placing orders ....... 1 2 3 4 5 6 7
27. Availability of remote
order transmission
(computer to computerorder entry) ......... 1 2 3 4 5 6 7
28. No restriction on number
of orders that canbe placed over thephone ................ 1 2 3 4 5 6 7
29. Clear guidance
on due in frommaintenance (DIFM)
procedures .......... 1 2 3 4 5 b 7
30. Clear guidance on local
purchase procedures. 1 2 3 4 5 6 7
126

PERCEIVED PERFORMANCEExample: Does Not Poor Satisfactory Excellent
Provide1 2 3 4 5 6 7
Service Quality 1 2 3 4 5 6 7
D. ORDER CYCLE TIME (from order submission to delivery)
31. Ability to meetrequired delivery timeson items available inbase stock .......... 1 2 3 4 5 6 7
32. Minimum variation betweenprojected and actualdelivery dates on itemsprocured from depot.. 1 2 3 4 5 6 7
33. Ability to meet requireddelivery dates on localpurchase items ....... . 1 2 3 4 5 6 7
34. Minimum variation betweenrequired and actual deliverydates on MICAP items. 1 2 3 4 5 6 7
E. ITEM AVAILABILITY
35. Fill rate on base levelstock items (% of ordersreceived completethe first time) ..... 1 2 3 4 5 6 7
36. Availability of benchstock items whenneeded .............. 1 2 3 4 5 6 7
37. Availability of supplypoint items whenneeded .............. 1 2 3 4 5 6 7
38. Adequate stock of baseservice store items.. 1 2 3 4 5 6 7
127

PERCEIVED PERFORMANCEExample: Does Not Poor Satisfactory Excellent
Provide1 2 3 4 5 6 7
Service Quality 1 2 3 4 5 6 7
39. Adequate stock of
individual equipmentitems ................ 1 2 3 4 5 6 7
F. RESPONSIVENESS
40. Ability to expediteMICAP requests ....... 1 2 3 4 5 6 7
41. Ability to expedite
out of the ordinary
MICAP requests ....... 1 2 3 4 5 6 7
42. Ability to expeditenon-micap requestswhen necessary ....... 1 2 3 4 5 6 7
43. Ability to handle
out of the ordinarydelivery requests ..... . .. 1 2 3 4 5 6 7
44. Ability to expedite out
of the ordinary localpurchase requests .... 1 2 3 4 5 6 7
45. Ability to providetraining programs
to suit the needsof your organization
(DIFM management,equipment management,
etc.) ............... 1 2 3 4 5 6 7
128

G. ADDITIONAL COMMENTS
1. Please comment on anything you particularly like or don't like
about Base Supply.
2. Please comment on any experience with Base Supply which wasparticularly satisfying to you.
3. Please comment on any experience with Base Supply which was
particularly dissatisfying to you.
129

PART D: RANKING OF CUSTOMER SERVICE FACTORS
Please rank the service factors used in this questionnaire in the orderof importance to you. Rank on a scale of 1 to 7 with 1 being the mostimportant. Use each number only once.
GENERAL SERVICE
INFORMATION AVAILABILITY
DEMEANOR OF SUPPLY REPRESENTATIVES
ORDER PROCESSING
ORDER CYCLE TIME (from order submission
to delivery)
ITEM AVAILABILITY
RESPONSIVENESS
THANK YOU FOR PARTICIPATING IN THIS SURVEY
Please place your questionnaire in the envelope provided and send itthrough distribution.
130

Appendix D: Frequency Distributions And HistogramsOf Customer Service Criteria
MEASURES OF IMPORTANCE
(7) Promptness in answering the telephone
VALID CUMVALUE LABEL VALUE FREQUENCY PERCENT PERCENT PERCENT
Not Important 1 2 .8 .8 .8Not Important 2 5 1.9 2.0 2.8Moderately Important 3 20 7.8 8.0 10.8Moderately Important 4 45 17.5 17.9 28.7Moderately Important 5 80 31.1 31.9 60.6Very Important 6 63 24.5 25.1 85.7Very Important 7 36 14.0 14.3 100.0
99 6 2.3 MISSINGTOTAL 257 100.0 100.0
COUNT VALUE ONE SYMBOL EQUALS APPROXIMATELY 2.00 OCCURRENCES2 1.00 *5 2.00 ***20 3.00 **********45 4.00 ***********************80 5.00 *63 6.00 ********************************36 7.00 ******************
I ........I........I........I........I........I0 20 40 60 80 100
HISTOGRM FREQUENCY
MEAN 5.108 MEDIAN 5.000 MODE 5.000STD DEV 1.275 MINIMUM 1.000 MAXIMUM 7.000
(8) A method for handling customer complaints.
VALID CUMVALUE LABEL VALUE FREQUENCY PERCENT PERCENT PERCENT
Moderately Important 3 5 1.9 2.0 2.0Moderately Important 4 12 4.7 4.8 6.9Moderately Important 5 40 15.6 16.1 23.0Very Important 6 103 40.1 41.5 64.5Very Important 7 88 34.2 35.5 100.0
99 9 3.5 MISSING
TOTAL 257 100.0 100.0
COUNT VALUE ONE SYMBOL EQUALS APPROXIMATELY 4.00 OCCURRENCES
5 3.00 *12 4.00 ***40 5.00 **********
103 6.00 *************************88 7.00 *********************I ........ I........I........I........I........I
0 40 80 120 160 200
H!ISTOORAM FREQUENCY
MEAN 6.036 MEDIAN 6.000 MODE 6.000STD DEV .945 MINIMUM 3.000 MAXIMUM 7.000
131

(9) Accessibility to the NCOIC or OIC when needed to resolvea problem.
VALID CUMVALUE LABEL VALUE FREQUENCY PERCENT PERCENT PERCENT
Not Important 2 2 .8 .8 .8Moderately Important 3 9 3.5 3.6 4.4Moderately Important 4 17 6.6 6.9 11.3Moderately Important 5 61 23.7 24.6 35.9Very Important 6 86 33.5 34.7 70.6Very Important 7 73 28.4 29.4 100.0
99 9 3.5 MISSINGTOTAL 257 100.0 100.0
COUNT VALUE ONE SYMBOL EQUALS APPROXIMATELY 2.00 OCCURRENCES2 2.00 *9 3.00 ****t
17 4.00 *********61 5.00 **************************86 6.00 *******************************************73 7.00 *********************************
I.........I ........ I ........ I ............... I0 20 40 60 80 100
HISTOGRAM FREQUENCY
MEAN 5.770 MEDIAN 6.000 MODE 6.000STD DEV 1.106 MINIMUM 2.000 MAXIMUM 7.000
(1C) Accessibility of Base Service Store and Individual Equipment Unit.
VALID CUMVALUE LABEL VALUE FREQUENCY PERCENT PERCENT PERCENT
Not Important 1 2 .8 .8 .8Not Important 2 3 1.2 1.2 2.0Moderately Important 3 21 8.2 8.4 10.4Moderately Important 4 38 14.8 15.1 25.5Moderately Important 5 88 34.2 35.1 60.6Very Important 6 57 22.2 22.7 83.3Very Important 7 42 16.3 16.7 100.0
99 6 2.3 MISSING
TOTAL 257 100.0 100.0
COUNT VALUE ONE SYMBOL EQUALS APPROXIMATELY 2.00 OCCURRENCES2 1.00 *3 2.00 **
21 3.00 **********t38 4.00 *******************88 5.00 ****************************************57 6.00 *****************************42 7.00 ********************I ........ I.........I ........ I........I........I
0 20 40 60 80 100
HISTOGRAM FREQUENCY
MEAN 5.175 MEDIAN 5.000 MODE 5.000STD DEV 1.262 MINIMUM 1.000 MAXIMUM 7.000
132

(11) Visits to your organization to ensure adequate support isbeing provided.
........................................................................
VALID CUMVALUE LABEL VALUE FREQUENCY PERCENT PERCENT PERCENT
Not Important 1 10 3.9 4.1 4.1Not Important 2 15 5.8 6.2 10.3Moderately Important 3 42 16.3 17.3 27.6Moderately Important 4 48 18.7 19.8 47.3Moderately Important 5 63 24.5 25.9 73.3Very Important 6 43 16.7 17.7 90.9Very Important 7 22 8.6 9.1 100.0
99 14 5.4 MISSINGTOTAL 257 100.0 100.0
COUNT VALUE ONE SYMBOL EQUALS APPROXIMATELY 1.50 OCCURRENCES
10 1.00 ******15 2.00 *********42 3.00 **************************48 4.00 ******************************63 5.00 ************************************43 6.00 ****************************22 7.00 **************
I ........ I........I........I........I........I
0 15 30 45 60 75
HISTOGRAM FREQUENCY
MEAN 4.465 MEDIAN 5.000 MODE 5.000STD DEV 1.538 MINIMUM 1.000 MAXIMUM 7.000
(12) A good working relationship with your organization.........................................................................
VALID CumVALUE LABEL VALUE FREQUENCY PERCENT PERCENT PERCENT
Not I portant 2 1 .4 .4 .4Moderately Important 3 2 .8 .8 1.2Moderately Important 4 9 3.5 3.5 4.7Moderately Important 5 25 9.7 9.7 14.4Very Important 6 106 41.2 41.2 55.6Very Important 7 114 44.4 44.4 100.0
TOTAL 257 100.0 100.0
COUNT VALUE ONE SYMBOL EQUALS APPROXIMATELY 4.00 OCCURRENCES1 2.002 3.00 *9 4.00 **
25 5.00 ****106 6.00 ************************114 7.00 *****************************I ........I........I........I........I........I
0 40 80 120 160 200
HISTOGRAM FREQUENCY
MEAN 6.237 MEDIAN 6.000 MODE 7.000STD DEV .872 MINIMUM 2.000 MAXIMUM 7.000
133

(13) A commitment to providing the best service possible.
VALID cumVALUE LABEL VALUE FREQUENCY PERCENT PERCENT PERCENT
Moderately Important 3 1 .4 .4 .4Moderately Important 4 6 2.3 2.3 2.7Mo9 rately Important 5 12 4.7 4.7 7.4Very Important 6 81 31.5 31.6 39.1Very Important 7 156 60.7 60.9 100.0
99 1 .4 MISSINGTOTAL 257 100.0 100.0
COUNT VALUE ONE SYMBOL EQUALS APPROXIMATELY 4.00 OCCURRENCES1 3.006 4.00 **
12 5.00 **81 6.00 *******************156 7.00 *************************************
I ........ I........I........I........I........I
0 40 80 120 160 200
HISTOGRAM FREQUENCY
MEAN 6.504 MEDIAN 7.000 MODE 7.000STD DEV .730 MINIMUM 3.000 MAXIMUM 7.000
(14) A commitment to customer satisfaction.
VALID cUMVALUE LABEL VALUE FREQUENCY PERCENT PERCENT PERCENT
Moderately Important 3 1 .4 .4 .4Moderately Important 4 6 2.3 2.4 2.7Moderately Important 5 18 7.0 7.1 9.8Very Important 6 76 29.6 29.8 39.6Very important 7 154 59.9 60.4 100.0
99 2 .8 MISSINGTOTAL 257 100.0 100.0
COUNT VALUE ONE SYMBOL EQUALS APPROXIMATELY 4.00 OCCURRENCES1 3.006 4.00 **18 5.00 **'***76 6.00 ******************
154 7.00 **********************************I ....... I.......I.......I.......I.......I
0 40 80 120 160 200
HISTOGRAM FREQUENCY
MEAN 6.475 MEDIAN 7.000 MODE 7.000STD DEV .762 MINIMUM 3.000 MAXIMUM 7.000
134

(19) Courtesy on the phone.
VALID CUMVALUE LABEL VALUE FREQUENCY PERCENT PERCENT PERCENT
Moderately Important 3 4 1.6 1.6 1.6Moderately Important 4 24 9.3 9.4 11.0Moderately Important 5 72 28.0 28.3 39.4Very Important 6 99 38.5 39.0 78.3Very Important 7 55 21.4 21.7 100.0
99 3 1.2 MISSING
TOTAL 257 100.0 100.0
COUNT VALUE ONE SYMBOL EQUALS APPROXIMATELY 2.00 OCCURRENCES4 3.00 *
24 4.00 ************72 5.00 ********************************99 6.00 *************************************************55 7.00 **************************I ........ I........I........I........I........I
0 20 40 60 80 100
HISTOGRAM FREQUENCY
MEAN 5.697 MEDIAN 6.000 MODE 6.000STD DEV .965 MINIMUM 3.000 MAXIMUM 7.000
(20) Courtesy In Person........................................................................
VALID cUMVALUE LABEL VALUE FREQUENCY PERCENT PERCENT PERCENT
Moderately Important 3 1 .4 .4 .4Moderately Important 4 19 7.4 7.4 7.8Moderately Important 5 70 27.2 27.3 35.2Very Important 6 100 38.9 39.1 74.2Very Important 7 66 25.7 25.8 100.0
99 1 .4 MISSING
TOTAL 257 100.0 100.0
COUNT VALUE ONE SYMBOL EQUALS APPROXIMATELY 2.00OCCURRENCES
1 3.00 *19 4.00 **********70 5.00 ***********************************100 6,00 *************************************************66 7.00 *********************************
I ........ I........I........I........I........I0 20 40 60 80 100
HISTOGRAM FREQUENCY
MEAN 5.824 MEDIAN 6.000 MODE 6.000STD DEV .914 MINIMUM 3.000 MAXIMUM 7.000
135

(21) Military bearing and appearance
VALID CUMVALUE LABEL VALUE FREQUENCY PERCENT PERCENT PERCENT
Not Important 1 1 .4 .4 .4Not Important 2 2 .8 .8 1.2Moderately Important 3 13 5.1 5.1 6.3Moderately Important 4 23 8.9 9.0 15.2Moderately Important 5 58 22.6 22.7 37.9Very Important 6 84 32.7 32.8 70.7Very Important 7 75 29.2 29.3 100.0
99 1 .4 MISSINGTOTAL 257 100.0 100.0
COUNT VALUE ONE SYMBOL EQUALS APPROXIMATELY 2.00 OCCURRENCES1 1.00 *2 2.00 *
13 3.00 *******23 4.00 ************58 5.00 ****************************84 6.00 ******************************************75 7.00 **********************************I ........ I........I........I........I........I
0 20 40 60 80 100
HISTOGRAM FREQUENCY
MEAN 5.684 MEDIAN 6.000 MODE 6.000STD DEV 1.210 MINIMUM 1.000 MAXIMUM 7.000
(22) Abi'lity To Solve Your Problem........................................................................
VALID CUMVALUE LABEL VALUE FREQUENCY PERCENT PERCENT PERCENT
Moderately Important 4 3 1.2 1.2 1.2Moderately Important 5 24 9.3 9.4 10.5Very Important 6 96 37.4 37.5 48.0Very Important 7 133 51.8 52.0 100.0
99 1 .4 MISSING
TOTAL 257 100.0 100.0
COUNT VALUE ONE SYMBOL EQUALS APPROXIMATELY 4.00 OCCURRENCES3 4.00 *
24 5.00 ******96 6.00 ***********************133 7.00 ******** **I ........ I........I........I........I........I
0 40 80 120 160 200
HISTOGRAM FREQUENCY
MEAN 6.402 MEDIAN 7.000 MODE 7.000STD DEV .707 MINIMUM 4.000 MAXIMUM 7.000
136

(23) Fulfill Promises Made........................................................................
VALID CUMVALUE LABEL VALUE FREQUENCY PERCENT PERCENT PERCENT
Not Important 1 1 .4 .4 .4Not Important 2 1 .4 .4 .8Moderately Important 3 4 1.6 1.6 2.4Moderately Important 4 5 1.9 2.0 4.3Moderately Important 5 24 9.3 9.4 13.8Very Important 6 93 36.2 36.6 50.4Very Important 7 126 49.0 49.6 100.0
99 3 1.2 MISSINGTOTAL 257 100.0 100.0
COUNT VALUE ONE SYMBOL EQUALS APPROXIMATELY 4.00 OCCURRENCES1 1.001 2.004 3.00 *5 4.00 *24 5.00 ******93 6.00 ***********************126 7.00 *******************************
I ........I........I........I........I........I
0 40 80 120 160 200
HISTOGRAM FREQUENCY
MEAN 6.280 MEDIAN 6.000 MODE 7.000STD DEV .948 MINIMUM 1.000 MAXIMUM 7.000
(24) Ability to handle the customer's anger or frustration.
VALID CUMVALUE LABEL VALUE FREQUENCY PERCENT PERCENT PERCENT
Not Important 1 2 .8 .8 .8Not Important 2 1 .4 .4 1.2Moderately Important 3 10 3.9 4.0 5.1Moderately Important 4 32 12.5 12.6 17.8Moderately Important 5 70 27.2 27.7 45.5Very Important 6 84 32.7 33.2 78.7Very Important 7 54 21.0 21.3 100.0
99 4 1.6 MISSING
TOTAL 257 100.0 100.0
COUNT VALUE ONE SYMBOL EQUALS APPROXIMATELY 2.00 OCCURRENCES2 1.00 *1 2.00 *
10 3.00 *****32 4.00 ****************70 5.00 *84 6.00 ******************************************54 7.00 *I ........I........I........I........I........I
0 20 40 60 80 100
HISTOGRAM FREQUENCY
MEAN 5.510 MEDIAN 6.000 MODE 6.000STD DEV 1.174 MINIMUM 1.000 MAXIMUM 7.000
137

(25) Professionalism
VALID CUMVALUE LABEL VALUE FREQUENCY PERCENT PERCENT PERCENT
Moderately Important 3 1 .4 .4 .4Moderately Important 4 7 2.7 2.7 3.1Moderately Important 5 43 16.7 16.8 19.9Very Important 6 94 36.6 36.7 56.6Very Important 7 ill 43.2 43.4 100.0
99 1 .4 MISSINGTOTAL 257 100.0 100.0
COUNT VALUE ONE SYMBOL EQUALS APPROXIMATELY 4.00 OCCURRENCES1 3.007 4.00 **43 5.00 *********94 6.00 **********************ill 7.00 ****************************
I ............... I ........I ........I ........ I
0 40 80 120 160 200
HISTOGRAM FREQUENCY
MEAN 6.199 MEDIAN 6.000 MODE 7.000STD DEV .842 MINIMUM 3.000 MAXIMUM 7.000
(26) Competence
VALID CUMVALUE LABEL VALUE FREQUENCY PERCENT PERCENT PERCENT
Moderately Important 4 4 1.6 1.6 1.6Moderately Important 5 27 10.5 10.5 12.1Very Important 6 85 33.1 33.2 45.3Very Important 7 140 54.5 54.7 100.0
99 1 .4 MISSING
TOTAL 257 100.0 100.0
COUNT VALUE ONE SYMBOL EQUALS APPROXIMATELY 4.00 OCCURRENCES4 4.00 *27 5.00 ******85 6.00 *140 7.00 *******************************I ........ I........I........I........I........I
0 40 80 120 160 200
HISTOGRAM FREQUENCY
MEAN 6.410 MEDIAN 7.000 MODE 7.000STD DEV .741 MINIMUM 4.000 MAXIMUM 7.000
138
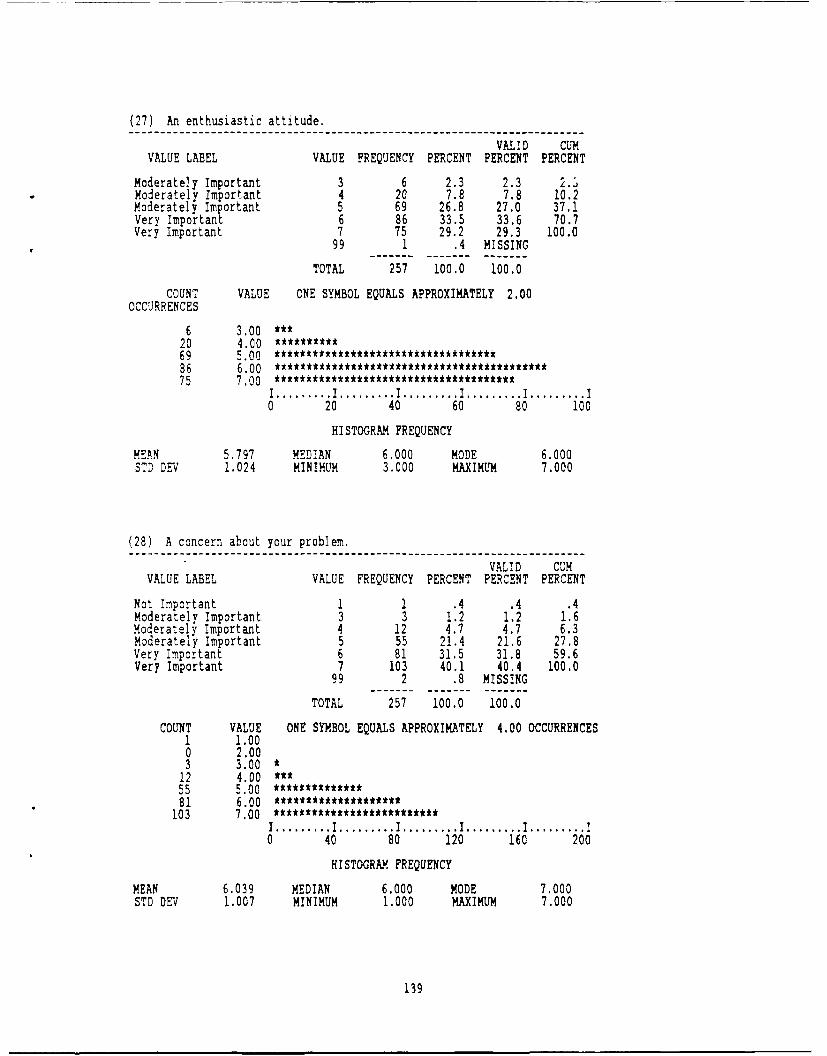
(27) An enthusiastic attitude.........................................................................
VALID CUMVALUE LABEL VALUE FREQUENCY PERCENT PERCENT PERCENT
Moderately Important 3 6 2.3 2.3 2.Moderately Important 4 20 7.8 7.8 10.2Moderately Important 5 69 26.8 27.0 37.1Very Important 6 86 33.5 33.6 70.7Very Important 7 75 29.2 29.3 100.0
99 1 .4 MISSING
TOTAL 257 100.0 100.0
COUNT VALUE ONE SYMBOL EQUALS APPROXIMATELY 2.00OCCURRENCES
6 3.00 ***20 4.00 *******69 5.00 **********************************86 6,00 ***********************************75 7.00 *************************************
I ........ I........I........I........I........I0 20 40 60 80 100
HISTOGRAM FREQUENCY
MEAN 5.797 MEDIAN 6.000 MODE 6.000STD DN 1.024 MINIMUM 3.000 MAXIMUM 7.000
(28) A concern about your problem.
VALID CUMVALUE LABEL VALUE FREQUENCY PERCENT PERCENT PERCENT
Not Important 1 1 .4 .4 .4Moderately Important 3 3 1.2 1.2 1.6Moderately Important 4 12 4.7 4.7 6.3Moderately Important 5 55 21.4 21.6 27.8Very Important 6 81 31.5 31.8 59.6Very Important 7 103 40.1 40.4 100.0
99 2 .8 MISSING
TOTAL 257 100.0 100.0
COUNT VALUE ONE SYMBOL EQUALS APPROXIMATELY 4.00 OCCURRENCES1 1.000 2.003 3.00 *
12 4.00 ***55 5.00 **************81 6.00 ******************
103 7.00 **************************I ........I........I........I........I........I0 40 80 120 160 200
HISTOGRAM FREQUENCY
MEAN 6,039 MEDIAN 6.000 MODE 7.000STD DEV 1.007 MINIMUM 1.000 MAXIMUM 7.000
139

(29) Ease and simplicity of order form.........................................................................
VALID CUMVALUE LABEL VALUE FREQUENCY PERCENT PERCENT PERCENT
Not Important 1 1 .4 .4 .4Not Important 2 1 .4 .4 .8Moderately Important 3 4 1.6 1.6 2.4Moderately Important 4 18 7.0 7.3 9.8Moderately Important 5 70 27.2 28.6 38.4Very Important 6 89 34.6 36.3 74.7Very Important 7 62 24.1 25.3 100.0
99 12 4.7 MISSINGTOTAL 257 100.0 100.0
COUNT VALUE ONE SYMBOL EQUALS APPROXIMATELY 2.00 OCCURRENCES1 1.00 *1 2.00 *4 3.00 tt
18 4.00 *********70 5.00 *************t********* *********89 6.00 ********************************************62 7.00 **************************
I ........I........I........I........I........I
0 20 40 60 80 100HISTOGRAM FREQUENCY
MEAN 5.735 MEDIAN 6.000 MODE 6.000STD DEV 1.040 MINIMUM 1.000 MAXIMUM 7.000
(30) Time Required To Fill Out Order Form
VALID CUMVALUE LABEL VALUE FREQUENCY PERCENT PERCENT PERCENT
Not Important 1 3 1.2 1.2 1.2Not Important 2 4 1.6 1.6 2.9Moderately Important 3 14 5.4 5.8 8.6Moderately Important 4 32 12.5 13.2 21.8Moderately Important 5 77 30.0 31.7 53.5Very Important 6 76 29.6 31.3 84.8Very Important 7 37 14.4 15.2 100.0
99 14 5.4 MISSINGTOTAL 257 100.0 100.0
COUNT VALUE ONE SYMBOL EQUALS APPROXIMATELY 2.00 OCCURRENCES3 1.00 **4 2.00 **14 3.00 *******32 4.00 ****************
77 5.00 ***************************************
76 6.00 **************************************37 7.00 ******************I ........ I........I........I........I........I
0 20 40 60 80 100
HISTOGRAM FREQUENCY
MEAN 5.272 MEDIAN 5.000 MODE 5.000STD DEV 1.250 MINIMUM 1.000 MAXIMUM 7.000
140

(31) Assistance in searching for a part number or stock number.
VALID CUMVALUE LABEL VALUE FREQUENCY PERCENT PERCENT PERCENT
Not Important 1 1 .4 .4 .4Not Important 2 3 1.2 1.2 1.6Moderately Important 3 4 1.6 1.6 3.3Moderately Important 4 21 8.2 8.6 11.9Moderately Important 5 53 20.6 21.8 33.7Very Important 6 90 35.0 37.0 70.8Very Important 7 71 27.6 29.2 100.0
99 14 5.4 MISSING
TOTAL 257 100.0 100.0
COUNT VALUE ONE SYMBOL EQUALS APPROXIMATELY 2.00 OCCURRENCES1 1.00 *3 2.00 **4 3.00 **
21 4.00 ***********53 5.00 ***************************90 6.00 t****71 7.00 ***********************************I ........ I........I........I........I........I
0 20 40 60 80 100
HISTOGRAM FREQUENCY
MEAN 5.782 MEDIAN 6.000 MODE 6.000STD DEV 1.123 MINIMUM 1.000 MAXIMUM 7.000
(32) Availability of more than one phone line for placing orders.
VALID CUMVALUE LABEL VALUE FREQUENCY PERCENT PERCENT PERCENT
Not Important 2 8 3.1 3.5 3.5Moderately Important 3 10 3.9 4.4 7.9Moderately Important 4 13 5.1 5.7 13.5Moderately Important 5 59 23.0 25.8 39.3Very Important 6 83 32.3 36.2 75.5Very Important 7 56 21.8 24.5 100.0
99 28 10.9 MISSINGTOTAL 251 100.0 100.0
COUNT VALUE ONE SYMBOL EQUALS APPROXIMATELY 2.00 OCCURRENCES8 2.00 ****
10 3.00 *****13 4.00 *******59 5.00 ***************83 6.00 ******************************************56 7.00 *************************I ........ I.........I ........ I........I.........I
0 20 40 60 80 100
HISTOGFAM FREQUENCY
MEAN 5.603 MEDIAN 6.000 MODE 6.000STD DEV 1.237 MINIMUM 2.000 MAXIMUM 7.000
141

(33) Availability of remote order transmission (computer to computerOrder Entry).
VALID CUMVALUE LABEL VALUE FREQUENCY PERCENT PERCENT PERCENT
Not Important 1 2 .8 1.0 1.0Not Important 2 4 1.6 1.9 2.9Moderately Important 3 9 3.5 4.4 7.3Moderately Important 4 16 6.2 7.8 15.0Moderately Important 5 62 24.1 30.1 45.1Very Important 6 70 27.2 34.0 79.1Very Important 7 43 16.7 20.9 100.0
99 51 19.8 MISSINGTOTAL 257 100.0 100.0
COUNT VALUE ONE SYMBOL EQUALS APPROXIMATELY 1.50 OCCURRENCES2 1.00 t4 2.00 ***9 3.00 '***
16 4.00 ***********62 5.00 *************************************70 6.00 **********************************************43 7.00 **************************
I ........ I........I........I........I........I0 15 30 45 60 75
HISTOGRAM FREQUENCY
MEAN 5.495 MEDIAN 6.000 MODE 6.000STD DEV 1.233 MINIMUM 1.000 MAXIMUM 7.000
(34) No restriction on number of orders that can be placed overthe phone.
VALID CUMVALUE LABEL VALUE FREQUENCY PERCENT PERCENT PERCENT
Not Important 1 7 2.7 3.1 3.1Not Important 2 13 5.1 5.8 8.9Moderafely Important 3 20 7.8 8.9 17.9Moderately Important 4 38 14.8 17.0 34.8Moderately Important 5 60 23.3 26.8 61.6Very Important 6 41 16.0 18.3 79.9Very Important 7 45 17.5 20.1 100.0
99 33 12.8 MISSINGTOTAL 257 100.0 100.0
COUNT VALUE ONE SYMBOL EQUALS APPROXIMATELY 1.20 OCCURRENCES7 1.00 *****
13 2.00 ***********20 3.00 t****************38 4.00 ******************************60 5.00 ****t ***********************************
41 6.00 ********************************45 7.00 **************************************
I ........ I.........I ........ I........I........I0 12 24 36 48 60
HISTOGRAM FREQUENCY
MEAN 4.938 MEDIAN 5.000 MODE 5.000STD DEV 1.595 MINIMUM 1.000 MAXIMUM 7.000
142

(35) Clear guidance on due in from maintenance (DIFM) procedures.
VALID CUMVALUE LABEL VALUE FREQUENCY PERCENT PERCENT PERCENT
Not Important 1 2 .8 .9 .9Not Important 2 3 1.2 1.4 2.3Moderately Important 3 13 5.1 6.0 8.3Moderately Important 4 17 6.6 7.9 16.2Moderately Important 5 39 15.2 18.1 34.3Very Important 6 84 32.7 38.9 73.1Very Important 7 58 22.6 26.9 100.0
99 41 16.0 MISSINGTOTAL 257 100.0 100.0
COUNT VALUE ONE SYMBOL EQUALS APPROXIMATELY 2.00 OCCURRENCES2 1.00 *3 2.00 **13 3.00 ******17 4.00 *********39 5.00 *84 6.00 ******************************************58 7.00 *****************************I ........ I........I........I........I........I
0 20 40 60 80 100
HISTOGRAM FREQUENCY
MEAN 5.648 MEDIAN 6.000 MODE 6.000STD DEV 1.282 MINIMUM 1.000 MAXIMUM 7.000
(36) Clear guidance on local purchase procedures.........................................................................
VALID CUMVALUE LABEL VALUE FREQUENCY PERCENT PERCENT PERCENT
Not Important 2 1 .4 .4 .4Moderately Important 3 8 3.1 3.2 3.6Moderately Important 4 20 7.8 8.0 11.6Moderately Important 5 59 23.0 23.7 35.3Very Important 6 93 36.2 37.3 72.7Very Important 7 68 26.5 27.3 100.0
99 8 3.1 MISSINGTOTAL 257 100.0 100.0
COUNT VALUE ONE SYMBOL EQUALS APPROXIMATELY 2.00 OCCURRENCES1 2.00 *8 3.00 ***
20 4.00 **********59 5.00 *****************************93 6.00 ************** *****.**68 7,00 ******************************
I ........I........I........I........I........I0 20 40 60 80 100
HISTOGRAM FREQUENCY
MEAN 5.763 MEDIAN 6.000 MODE 6.000STD DEV 1.064 MINIMUM 2.000 MAXIMUM 7.000
143

(37) Ability to meet required delivery times on items available instock.
........................................................................
VALID CUMVALUE LABEL VALUE FREQUENCY PERCENT PERCENT PERCENT
Not Important 1 1 .4 .4 .4Not Important 2 1 .4 .4 .8Moderately Important 3 3 1.2 1.2 2.0Moderately Important 4 13 5.1 5.2 7.1Moderately Important 5 37 14.4 14.7 21.8Very Important 6 92 35.8 36.5 58.3Very Important 7 105 40.9 41.7 100.0
99 5 1.9 MISSINGTOTAL 257 100.0 100.0
COUNT VALUE ONE SYMBOL EQUALS APPROXIMATELY 4.00 OCCURRENCES1 1.001 2.003 3.00 *
13 4.00 ***37 5.00 ********92 6.00 ***********************105 7.00 *************************
I ........I ........I ........I ............... I
0 40 80 120 160 200
HISTOGRAM FREQUENCY
MEAN 6.095 MEDIAN 6.000 MODE 7.000STD DEV 1.017 MINIMUM 1.000 MAXIMUM 7.000
(38) Minimum variation between projected and actual delivery dates onitems procured from depot.
.......................................................................
VALID CUMVALUE LABEL VALUE FREQUENCY PERCENT PERCENT PERCENT
Not Important 2 3 1.2 1.2 1.2Moderately Important 3 5 1.9 2.0 3.2Moderately Important 4 14 5.4 5.6 8.8Moderately Important 5 45 17.5 18.1 26.9Very Important 6 102 39.7 41.0 67.9Very Important 7 80 31.1 32.1 100.0
99 8 3.1 MISSING
TOTAL 257 100,0 100.0
COUNT VALUE ONE SYMBOL EQUALS APPROXIMATELY 4.00 OCCURRENCES3 2.00 *5 3.00 *
14 4.00 ****45 5.00 **********
102 6.00 ************************80 7.00 *******************I ........ I........I........I........I........I
0 40 80 120 160 200
HISTOGRAM FREQUENCY
MEAN 5.920 MEDIAN 6.000 MODE 6.000STD DEV 1.048 MINIMUM 2.000 MAXIMUM 7.000
144

(39) Ability to meet required delivery dates on local purchase items.
VALID CUMVALUE LABEL VALUE FREQUENCY PERCENT PERCENT PERCENT
Not Important 2 2 .8 .8 .8Moderately Important 3 7 2.7 2.8 3.5Moderately Important 4 16 6.2 6.3 9.8Moderately Important 5 57 22.2 22.4 32.3Very Important 6 92 35.8 36.2 68.5Very Important 7 80 31.1 31.5 100.0
99 3 1.2 MISSINGTOTAL 257 100.0 100.0
COUNT VALUE ONE SYMBOL EQUALS APPROXIMATELY 2.00 OCCURRENCES
2 2.00 *7 3.00 **
16 4.00 ********57 5.00 ****************************92 6.00 *********************************************80 7.00 ************************************I ........ I........I........I........I........I
0 20 40 60 80 100
HISTuGRAM FREQUENCY
MEAN 5.850 MEDIAN 6.000 MODE 6.000STD DEV 1.071 MINIMUM 2.000 MAXIMUM 7.000
(40) Minimum variation between required and actual delivery dateson M!CAP items.
VALID CUMVALUE LABEL VALUE FREQUENCY PERCENT PERCENT PERCENT
Not Important 2 4 1.6 1.9 1.9Moderately Important 3 4 1.6 1.9 3.7Moderately Important 4 13 5.1 6.1 9.8Moderately Important 5 20 7.8 9.3 19.2Very Important 6 54 21.0 25.2 44.4Very Important 7 119 46.3 55.6 100.0
99 43 16.7 MISSINGTOTAL 257 100.0 100.0
COUNT VALUE ONE SYMBOL EQUALS APPROXIMATELY 4.00 OCCURRENCES4 2.00 *4 3.00 *13 4.00 ***20 5.00 ****
54 6.00 *************119 7.00 ***************************
S.......I.......I.......I.......I.......I
0 40 80 120 160 200
HISTOGRAM FREQUENCY
MEAN 6.210 MEDIAN 7.000 MODE 7.000STD DEV 1.150 MINIMUM 2.000 MAXIMUM 7.000
145

(41) Fill rate on base level stock items (% of orders receivedcomplete the first time).
VALID CUMVALUE LABEL VALUE FREQUENCY PERCENT PERCENT PERCENT
Not Important 1 1 .4 .4 .4Not Important 2 2 .8 .8 1.2Moderately Important 3 3 1.2 1.2 2.4Moderately Important 4 26 10.1 10.6 13.0Moderately Important 5 59 23.0 24.0 37.0Very Important 6 100 38.9 40.7 77.6Very Important 7 55 21.4 22.4 100.0
99 11 4.3 MISSINGTOTAL 257 100.0 100.0
COUNT VALUE ONE SYMBOL EQUALS APPROXIMATELY 2.00 OCCURRENCES1 1.00 *2 2.00 *3 3.00 *t
26 4.00 *************59 5.00 ** ******
100 6.00 *55 7.00 **************************
I ........ I ........ I ............... I ........ I0 20 40 60 80 100
HISTOGRAM FREQUENCY
MEAN 5.683 MEDIAN 6.000 MODE 6.000STD DEV 1.064 MINIMUM 1.000 MAXIMUM 7.000
(42) Availability of bench stock items when needed.
VALID CUMVALUE LABEL VALUE FREQUENCY PERCENT PERCENT PERCENT
Not Important 1 1 .4 .4 .4Not Important 2 2 .8 .9 1.3Moderately Important 3 6 2.3 2.6 3.9Moderately Important 4 10 3.9 4.3 8.3Moderately Important 5 39 15.2 17.0 25.2Very Important 6 86 33.5 37.4 62.6Very Important 7 86 33.5 37,4 100.0
99 27 10.5 MISSING
TOTAL 257 100.0 100.0
COUNT VALUE ONE SYMBOL EQUALS APPROXIMATELY 2.00 OCCURRENCES1 1.00 '2 2.00 *6 3.00 ***
10 4.00 *****39 5.00 *'*******86 6.00 *******************************************86 7.00 ********************************t*****I ........ I........I........I........I........I
0 20 40 60 80 100
HISTOGRAM FREQUENCY
MEAN 5.983 MEDIAN 6.000 MODE 6.000STD DEV 1.098 MINIMUM 1.000 MAXIMUM 7.000
146

(43) Availability of supply point items when needed.
VALID cUMVALUE LABEL VALUE FREQUENCY PERCENT PERCENT PERCENT
Not Important 2 2 .8 .9 .9Moderately Important 3 8 3.1 3.6 4.5Moderately Important 4 15 5.8 6.8 11.3Moderately Important 5 42 16.3 19.0 30.3Very Important 6 90 35.0 40.7 71.0Very Important 7 64 24.9 29.0 100.0
99 36 14.0 MISSINGTOTAL 257 100.0 100.0
COUNT VALUE ONE SYMBOL EQUALS APPROXIMATELY 2.00 OCCURRENCES
2 2.00 *8 3.00 ****
15 4.00 ********42 5.00 *********************90 6.00 *********************************************64 7.00 *****************************I ........ I ............... I ........ I ........ I
0 20 40 60 80 100
HISTOGRAM FREQUENCY
MEAN 5.819 MEDIAN 6.000 MODE 6.000STD DEV 1.093 MINIMUM 2.000 MAXIMUM 7.000
(44) Adequate stock of base service store items.
VALID cUMVALUE LABEL VALUE FREQUENCY PERCENT PERCENT PERCENT
Not Important 1 1 .4 .4 .4Not Important 2 5 1.9 2.0 2.4Moderately Important 3 12 4.7 4.8 7.1Moderately Important 4 34 13.2 13.5 20.6Moderately Important 5 70 27.2 27.8 48.4Very Important 6 80 31.1 31.7 80.2Very Important 7 50 19.5 19.8 100.0
99 5 1.9 MISSINGTOTAL 257 100.0 100.0
COUNT VALUE ONE SYMBOL EQUALS APPROXIMATELY 2.00 OCCURRENCES1 1.00 *5 2.00 ***12 3.00 ******34 4.00 ****************70 5.00 **************************80 6.00 ****************************************50 7.00 ***********************
I ....... I.......I.......I.......I.......I
0 20 40 60 80 100
HISTOGRAM FREQUENCY
MEAN 5.409 MEDIAN 6.000 MODE 6.000STD DEV 1.232 MINIMUM 1.000 MAXIMUM 7.000
147

(45) Adequate stock of individual equipment items.
VALID CUMVALUE LABEL VALUE FREQUENCY PERCENT PERCENT PERCENT
Not Important 1 1 .4 .4 .4Not Important 2 4 1.6 1.7 2.1Moderately Important 3 18 7.0 7.4 9.5Moderately Important 4 39 15.2 16.1 25.6Moderately Important 5 74 28.8 30.6 56.2Very Important 6 72 28.0 29.8 86.0Very Important 7 34 13.2 14.0 100.0
99 15 5.8 MISSING
TOTAL 257 100.0 100.0
COUNT VALUE ONE SYMBOL EQUALS APPROXIMATELY 1.50 OCCURRENCES1 1.00 *4 2.00 **
18 3.00 ***********39 4.00 **************************74 5.00 ************************************************72 6,00 *********************************************34 7.00 **********************I ........ I........I........I........I........I
0 15 30 45 60 75
HISTOGRAM FREQUENCY
MEAN 5.202 MEDIAN 5.000 MODE 5.000STD DEV 1.224 MINIMUM 1.000 MAXIMUM 7.000
(46) Ability to expedite MICAP requests.
VALID CumVALUE LABEL VALUE FREQUENCY PERCENT PERCENT PERCENT
Not Important 2 3 1.2 1.5 1.5Moderately Important 3 3 1.2 1.5 2.9Moderately Important 4 7 2.7 3.4 6.4Moderately Important 5 16 6.2 7.8 14.2Very Important 6 56 21.8 27.5 41.7Very Important 7 119 46.3 58.3 100.0
99 53 20.6 MISSINGTOTAL 257 100.0 100.0
COUNT VALUE ONE SYMBOL EQUALS APPROXIMATELY 4.00 OCCURRENCES
3 2.00 *3 3.00 '7 4.00 *
16 5.00 ****56 6.00 **************119 7.00 *****************************I ........ I........I........I........I........I
0 40 80 120 160 200
HISTOGRAM FREQUENCY
MEAN 6.333 MEDIAN 7.000 MODE 7.000STD DEV 1.030 MINIMUM 2.000 MAXIMUM 7.000
148

(47) Ability to expedite out of the ordinary MICAP requests.
VALID CUmVALUE LABEL VALUE FREQUENCY PERCENT PERCENT PERCENT
Not Important 2 3 1.2 1.5 1.5Moderately ImportanL 3 4 1.6 2.0 3.4Moderately Important 4 7 2.7 3.4 6.9Moderately Important 5 28 10.9 13.8 20.7Very Important 6 62 24.1 30.5 51.2Very Important 7 99 38.5 48.8 100.0
99 54 21.0 MISSING
TOTAL 257 100.0 100.0
COUNT VALUE ONE SYMBOL EQUALS APPROXIMATELY 2.00 OCCURRENCES3 2.00 **4 3.00 *7 4.00 ****28 5.00 *** *********62 6.00 *******************************99 7.00 ************************************************I ........ I........I........I........I........I
0 20 40 60 80 100
HISTOGRAM FREQUENCY
MEAN 6.163 MEDIAN 6.000 MODE 7.000STD DEV 1.075 MINIMUM 2.000 MAXIMUM 7.000
(48) Ability to expedite non-MICAP requests when necessary.
VALID CUMVALUE LABEL VALUE FREQUENCY PERCENT PERCENT PERCENT
Not Important 2 2 .8 .9 .9Moderately Important 3 4 1.6 1.7 2.6Moderately Important 4 16 6.2 6.9 9.5Moderately Important 5 66 25.7 28.6 38.1Very Important 6 95 37.0 41.1 79.2Very Important 7 48 18.7 20.8 100.0
99 26 10.1 MISSINGTOTAL 257 100.0 100.0
COUNT VALUE ONE SYMBOL EQUALS APPROXIMATELY 2.00 OCCURRENCES2 2.00 *4 3.00 U16 4.00 ********66 5.00 ********** ******
95 6.00 ************************************************48 7.00 ************************
I ....... I.......I.......I.......I.......I
0 20 40 60 80 100
HISTOGRAM FREQUENCY
MEAN 5.697 MEDIAN 6.000 MODE 6.000STD DEV .989 MINIMUM 2.000 MAXIMUM 7.000
149

(49) Ability to handle out of the ordinary delivery requests.
VALID CUMVALUE LABEL VALUE FREQUENCY PERCENT PERCENT PERCENT
Not Important 2 2 .8 .8 .8Moderately Important 3 6 2.3 2.5 3.3Moderately Important 4 17 6.6 7.0 10.3Moderately Important 5 82 31.9 33.7 44.0Very Important 6 94 36.6 38.7 82.7Very Important 7 42 16.3 17.3 100.0
99 14 5.4 MISSINGTOTAL 257 100.0 100.0
COUNT VALUE ONE SYMBOL EQUALS APPROXIMATELY 2.00 OCCURRENCES
2 2.00 *6 3.00 ***17 4.00 *********82 5.00 ****************************************
94 6.00 **********************************************
42 7.00 *******************I ........ I......!......... ......... I ........ I0 20 40 60 80 100
HISTOGRAM FREQUENCY
MEAN 5.588 MEDIAN 6.000 MODE 6.000STD DEV .989 MINIMUM 2.000 MAXIMUM 7.000
(50) Ability to expedite out of the ordinary local purchase requests.
VALID CUMVALUE LABEL VALUE FREQUENCY PERCENT PERCENT PERCENT
Not Im ortant 2 3 1.2 1.2 1.2Moderately Important 3 5 1.9 2.0 3.2Moderately Important 4 41 16.0 16.4 19.6Moderately Important 5 75 29.2 30.0 49.6Very Important 6 89 34.6 35.6 85.2Very Important 7 37 14.4 14.8 100.0
99 7 2.7 MISSINGTOTAL 257 100.0 100.0
COUNT VALUE ONE SYMBOL EQUALS APPROXIMATELY 2.00 OCCURRENCES3 2.00 **5 3.00 **'41 4.00 *********************75 5.00 **************************************
89 6.00 *********************************************37 7.00 *****************I ........I........I........I........I........I
0 20 40 60 80 100HISTOGRAM FREQUENCY
MEAN 5.412 MEDIAN 6.000 MODE 6.000STD DEV 1.065 MINIMUM 2.000 MAXIMUM 7.000
150

(51) Ability to provide training programs to suit the needs of yourorganization.
........................................................................
VALID CUMVALUE LABEL VALUE FREQUENCY PERCENT PERCENT PERCENT
Not Important 2 5 1.9 2.0 2.0Moderately Important 3 7 2.7 2.8 4.8Moderately Important 4 28 10.9 11.2 16.0Moderately Important 5 68 26.5 27.2 43.2Very Important 6 82 31.9 32.8 76.0Very Important 7 60 23.3 24.0 100.0
99 7 2.7 MISSINGTOTAL 257 100.0 100.0
COUNT VALUE ONE SYMBOL EQUALS APPROXIMATELY 2.00 OCCURRENCES5 2.00 ***7 3.00 ***'28 4.00 **************68 5.00 *********************************t
82 6.00 *****************************************60 7.00 **************************
I ....... I.......I.......I.......I.......I
0 20 40 60 80 100
HISTOGRAM FREQUENCY
MEAN 5.580 MEDIAN 6.000 MODE 6.000STD DEV 1.167 MINIMUM 2.000 MAXIMUM 7.000
151
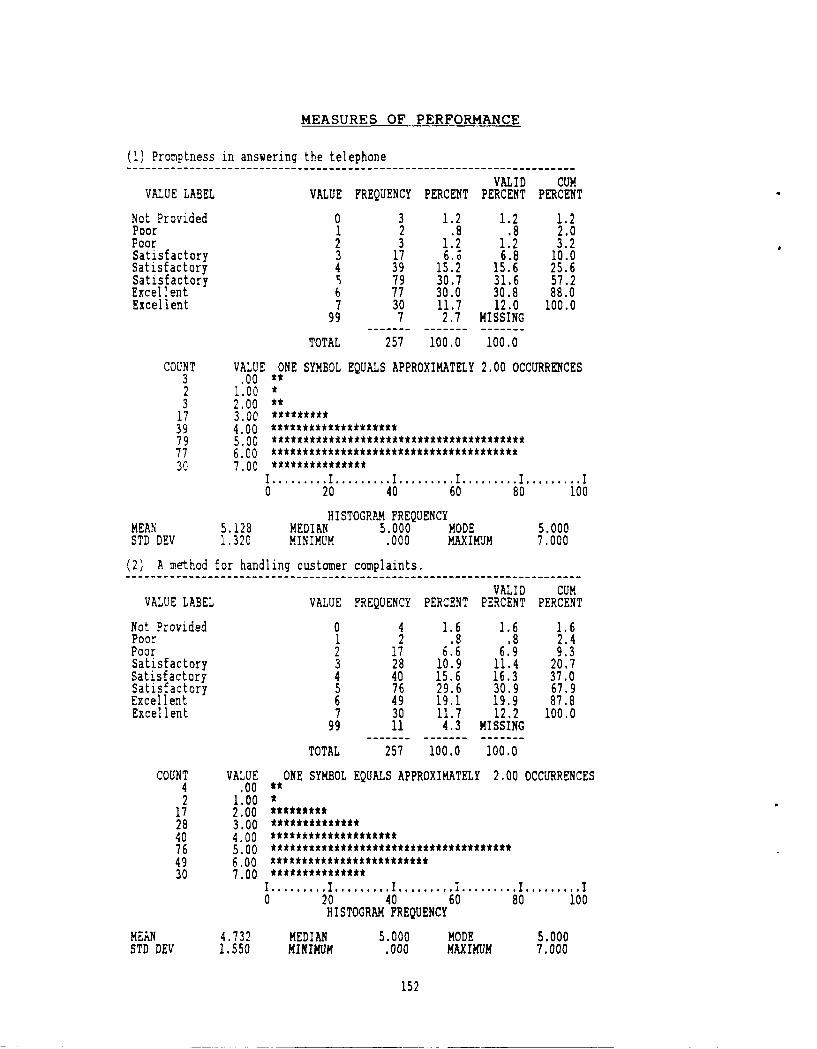
MEASURES OF PERFORMANCE
(1) Promptness in answering the telephone.......................................................................
VALID CUMVALUE LABEL VALUE FREQUENCY PERCENT PERCENT PERCENT
Not Provided 0 3 1.2 1.2 1.2Poor 1 2 .8 .8 2.0Poor 2 3 1.2 1.2 3.2Satisfactory 3 17 6.; 6.8 10.0Satisfactory 4 39 15.2 15.6 25.6Satisfactory S 79 30.7 31.6 57.2Excellent 6 77 30.0 30.8 88.0Excellent 7 30 11.7 12.0 100.0
99 7 2.7 MISSINGTOTAL 257 100.0 100.0
COUNT VALUE ONE SYMBOL EQUALS APPROXIMATELY 2.00 OCCURRENCES3 .00 **2 1.00 *3 2.00 **
17 3.00 *********39 4.00 ********************79 5.00 ****************************************77 6.00 ***************************************30 7.00 ***************
I ........I.........I ........ I........I........I
0 20 40 60 80 100
HISTOGRAM FREQUENCYMEAN 5.128 MEDIAN 5.000 MODE 5.000STD DEV 1.320 MINIMUM .000 MAXIMUM 7.000
(2) A method for handling customer complaints.
VALID CUMVALUE LABEL VALUE FREQUENCY PERCENT PERCENT PERCENT
Not Provided 0 4 1.6 1.6 1.6Poor 1 2 .8 .8 2.4Poor 2 17 6.6 6.9 9.3Satisfactory 3 28 10.9 11.4 20.7Satisfactory 4 40 15.6 16.3 37.0Satisfactory 5 76 29.6 30.9 67.9Excellent 6 49 19.1 19.9 87.8Excellent 7 30 11.7 12.2 100.0
99 11 4.3 MISSINGTOTAL 257 100.0 100.0
COUNT VALUE ONE SYMBOL EQUALS APPROXIMATELY 2.00 OCCURRENCES4 .00 **2 1.00 *17 2.00 t*********28 3.00 *************
40 4.00 ********************76 5.00 * * * ** * * *49 6.00 *************************30 7.00 **************t
I ....... I.......I.......I.......I.......I
0 20 40 60 80 100HISTOGRAM FREQUENCY
MEAN 4.732 MEDIAN 5.000 MODE 5.000STD DEV 1.550 MINIMUM .000 MAXIMUM 7.000
152
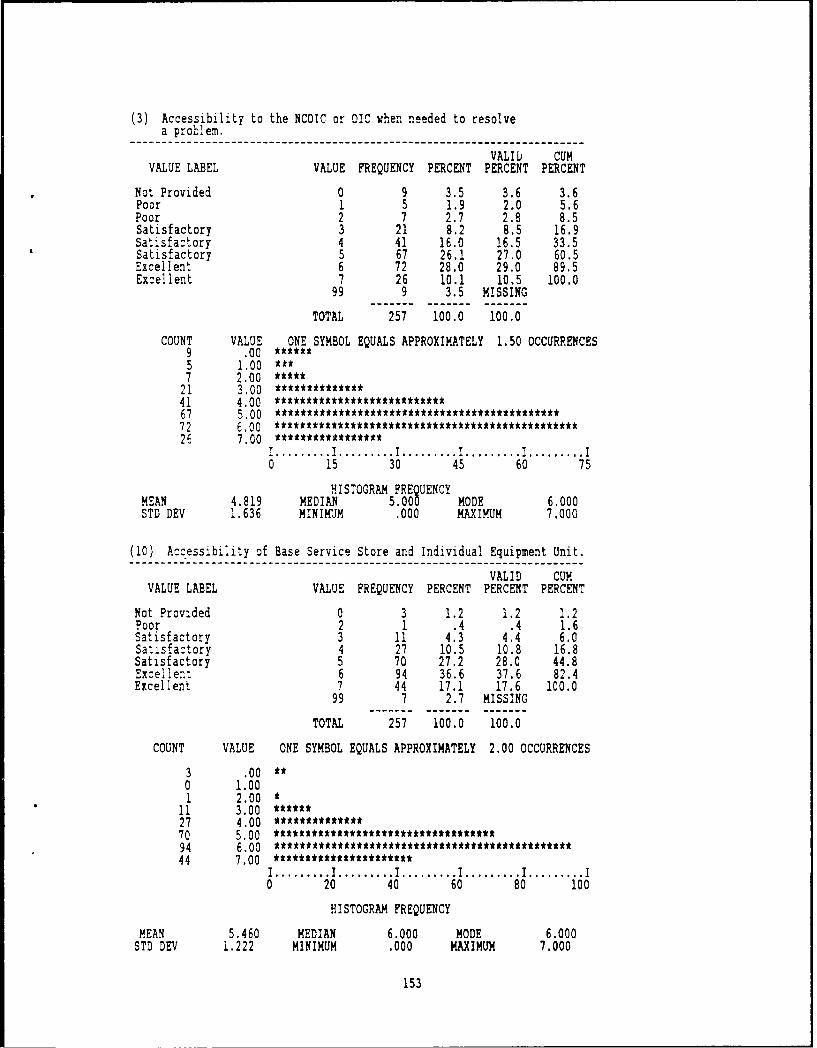
(3) Accessibility to the NCOIC or OIC when needed to resolvea problem
VALIb CUMVALUE LABEL VALUE FREQUENCY PERCENT PERCENT PERCENT
Not Provided 0 9 3.5 3.6 3.6Poor 1 5 1.9 2.0 5.6Poor 2 7 2.7 2.8 8.5Satisfactory 3 21 8.2 8.5 16.9Satisfactory 4 41 16.0 16.5 33.5Satisfactory 5 67 26.1 27.0 60.5Excellent 6 72 28.0 29.0 89.5Excellent 7 26 10.1 10.5 100.0
99 9 3.5 MISSINGTOTAL 257 100.0 100.0
COUNT VALUE ONE SYMBOL EQUALS APPROXIMATELY 1.50 OCCURRENCES9 .00 ******5 1.00 *7 2.00 ***t*21 3.00 ************
41 4.00 **************************67 5.00 ******************************************72 6.00 ***********************************************26 7.00 **************
I ....... I.......I.......I.......I.......I
0 15 30 45 60 75
HISTOGRAM FREQUENCYMEAN 4.819 MEDIAN 5.000 MODE 6.000STD DEV 1.636 MINIMUM .000 MAXIMUM 7.000
(10) Accessibility of Base Service Store and Individual Equipment Unit.
VALID CUMVALUE LABEL VALUE FREQUENCY PERCENT PERCENT PERCENT
Not Provided 0 3 1.2 1.2 1.2Poor 2 1 .4 .4 1.6Satisfactory 3 11 4.3 4,4 6.0Satisfactory 4 27 10.5 10.8 16.8Satisfactory 5 70 27.2 28.0 44.8Excellent 6 94 36.6 37.6 82.4Excellent 7 44 17.1 17.6 100.0
99 7 2.7 MISSING
TOTAL 257 100.0 100.0
COUNT VALUE ONE SYMBOL EQUALS APPROXIMATELY 2.00 OCCURRENCES
3 .00 *0 1.001 2.00 *
11 3.00 ******27 4.00 *70 5.00 ***********************************94 6.00 *********** U44 7.00 **********************I ........ I........I........I........I........I
0 20 40 60 80 100
HISTOGRAM FREQUENCY
MEAN 5.460 MEDIAN 6.000 MODE 6.000STD DEV 1.222 MINIMUM .000 MAXIMUM 7.000
153

(5) Visits to your organization to ensure adequate support isbeing provided.
VALID CUMVALUE LABEL VALUE FREQUENCY PERCENT PERCENT PERCENT
Not Provided 0 22 8.6 9.1 9.1Poor 1 25 9.7 10.4 19.5Poor 2 31 12.1 12.9 32.4Satisfactory 3 49 19.1 20.3 52.7Satisfactory 4 38 14.8 15.8 68.5Satisfactory 5 48 18.7 19.9 88.4Excellent 6 20 7.8 8.3 96.7Excellent 7 8 3.1 3.3 100.0
99 16 6.2 MISSINGTOTAL 257 100.0 100.0
COUNT VALUE ONE SYMBOL EQUALS APPROXIMATELY 1.00 OCCURRENCE22 .00 ***************25 1.00 ***********************31 2.00 ******************************49 3.00 *********************************************38 4.00 **************************************48 5.00 ********************************************20 6.00 ******************8 7.00 *******
I......... I.........I ........ I....... ......... I
0 10 20 30 40 50
HISTOGRAM FREQUENCYMEAN 3.328 MEDIAN 3.000 MODE 3.000STD DEV 1.872 MINIMUM .000 MAXIMUM 7.000
(6) A good working elationship with your organization.
VALID CUMVALUE LABEL VALUE FREQUENCY PERCENT PERCENT PERCENT
Not Provided 0 4 1.6 1.6 1.6Poor 1 3 1.2 1,2 2.7Poor 2 8 3.1 3.1 5.8Satisfactory 3 30 11.7 11.7 17.5Satisfactory 4 30 11.7 11.7 29.2Satisfactory 5 72 28.0 28.0 57.2Excellent 6 71 27.6 27.6 84.8Excellent 7 39 15.2 15.2 100.0
TOTAL 257 100.0 100.0
COUNT VALUE ONE SYMBOL EQUALS APPROXIMATELY 1.50 OCCURRENCES
4 .003 1.00 *t8 2.00 *****30 3.00 ********************
30 4.00 ****************72 5.00 ********************************* ********71 6.00 *******************************************39 7.00 *************************
I ....... I.......I.......I.......I.......I
0 15 30 45 60 75HISTOGRAM FREQUENCY
MEAN 5.012 MEDIAN 5.000 MODE 5.000STD DEV 1.527 MINIMUM .000 MAXIMUM 7.000
154

(7) A commitment to providing the best service possible.........................................................................
VALID CUMVALUE LABEL VALUE FREQUENCY PERCENT PERCENT PERCENT
Not Provided 0 2 .8 .8 .8Poor 1 6 2.3 2.3 3.1Poor 2 13 5.1 5.1 8.2Satisfactory 3 29 11.3 11.3 19.5Satisfactory 4 42 16.3 16.4 35.9Satisfactory 5 63 24.5 24.6 60.5Excellent 6 63 24.5 24.6 85.2Excellent 7 38 14.8 14.8 100.0
99 1 .4 MISSING
TOTAL 257 100.0 100.0
COUNT VALUE ONE SYMBOL EQUALS APPROXIMATELY 1.50 OCCURRENCES
2 .00 *6 1.00 ***t
13 2.00 *********29 3.00 ****************42 4.00 ****************************63 5.00 ***************************************63 6.00 ******************************************38 7.00 *************************
I ........ I........I......... ......... ....... I0 15 30 45 60 75
HISTOORAM FREQUENCY
MEAN 4 867 MEDIAN 5.000 MODE 5.000STD DEV 1.574 MINIMUM .000 MAXIMUM 7.000
(8) A commitment to customer satisfaction.......................................................................
VALID CUMVALUE LABEL VALUE FREQUENCY PERCENT PERCENT PERCENT
Not Provided 0 3 1.2 1.2 1.2Poor 1 7 2.7 2.7 3.9Poor 2 10 3.9 3.9 7.8Satisfactory 3 37 14.4 14.5 22.4Satisfactory 4 44 17.1 17.3 39.6Satisfactory 5 57 22.2 22.4 62.0Excellent 6 61 23.7 23.9 85.9Excellent 7 36 14.0 14.1 100.0
99 2 .8 MISSING
TOTAL 257 100.0 100.0
COUNT VALUE ONE SYMBOL EQUALS APPROXIMATELY 1.50 OCCURRENCES
3 .00 **7 1.00 *****
10 2.00 ******37 3,00 ************44 4.00 ***********************57 5.00 ***********************************61 6.00 ********************36 7.00 ***********************
I ........I........I........I........I........I0 15 30 45 60 75
HISTOGRAM FREQUENCY
MEAN 4.773 MEDIAN 5.000 MODE 6.000STD DEV 1.613 MINIMUM .000 MAXIMUM 7.000
155

(13) Courtesy on the phone.........................................................................
VALID CUMVALUE LABEL VALUE FREQUENCY PERCENT PERCENT PERCENT
Not Provided 0 2 .8 .8 .8Poor 2 8 3.1 3.2 4.0Satisfactory 3 18 7.0 7.1 11.1Satisfactory 4 31 12.1 12.3 23.4Satisfactory 5 72 28.0 28.6 52.0Excellent 6 84 32.7 33.3 85.3Excellent 7 37 14.4 14.7 100.0
99 5 1.9 MISSINGTOTAL 257 100.0 100.0
COUNT VALUE ONE SYMBOL EQUALS APPROXIMATELY 2.00 OCCURRENCES
2 .00 *0 1.008 2.00 ****
18 3.00 *********31 4.00 *************72 5.00 ************************************84 6.00 ******************************************37 7.00 ******************I ........ I........I........I........I........I
0 20 40 60 80 100HISTOGRAM FREQUENCY
MEAN 5.226 MEDIAN 5.000 MODE 6.000STD DEV 1.330 MINIMUM .000 MAXIMUM 7.000
(14) Courtesy In Person
VALID CUMVALUE LABEL VALUE FREQUENCY PERCENT PERCENT PERCENT
Not Provided 0 1 .4 .4 .4Poor 1 1 .4 .4 .8Poor 2 7 2.7 2.7 3.5Satisfactory 3 11 4.3 4.3 7.8Satisfactory 4 30 11.7 11.8 19.6Satisfactory 5 74 28.8 29.0 48.6Excellent 6 86 33.5 33.7 82.4Excellent 7 45 17.5 17.6 100.0
99 2 .8 MISSING
TOTAL 257 100.0 100.0
COUNT VALUE ONE SYMBOL EQUALS APPROXIMATELY 2.00 OCCURRENCES
1 .0c *1 1.00 *7 2.00 ****
11 3.00 *30 4.00 ***************74 5.00 ******************86 6.00 ******************************************45 7.00 **********************I ........ I........I........I........I........I
0 20 40 60 80 100HISTOGRAM FREQUENCY
MEAN 5.369 MEDIAN 6.000 MODE 6.000STE DEV 1.269 MINIMUM .000 MAXIMUM 7.000
156

(15) Military bearing and appearance
VALID CuMVALUE LABEL VALUE FREQUENCY PERCENT PERCENT PERCENT
Not Provided 0 1 .4 .4 .4Poor 2 6 2.3 2.3 2.7Satisfactory 3 16 6.2 6.3 9.0Satisfactory 4 30 11.7 11.7 20.7Satisfactory 5 77 30.0 30.1 50.8Excellent 6 93 36.2 36.3 87.1Excellent 7 33 12.8 12.9 100.0
99 1 .4 MISSINGTOTAL 257 100.0 100.0
COUNT VALUE ONE SYMBOL EQUALS APPROXIMATELY 2.00 OCCURRENCES
1 .00 *0 1.006 2.00 ***
16 3.00 ********30 4.00 ***************77 5.00 ************************************93 6.00 ***********************************************33 7.00 *
I ........ I ............... I ........ I ........ I0 20 40 60 80 100
HISTOGRAM FREQUENCY
MEAN 5.289 MEDIAN 5.000 MODE 6.000STD DEV 1.215 MINIMUM .000 MAXIMUM 7.000
(16) Ability To Solve Your Problem
VALID CUMVALUE LABEL VALUE FREQUENCY PERCENT PERCENT PERCENT
Not Provided 0 2 .8 .8 .8Poor 1 6 2.3 2.4 3.2Poor 2 10 3.9 4.0 7.1Satisfactory 3 25 9.7 9.9 17.0Satisfactory 4 46 17.9 18.2 35.2Satisfactory 5 62 24.1 24.5 59.7Excellent 6 66 25.7 26.1 85.8Excellent 7 36 14.0 14.2 100.0
99 4 1.6 MISSINGTOTAL 257 100.0 100.0
COUNT VALUE ONE SYMBOL EQUALS APPROXIMATELY 1.50 OCCURRENCES
2 .00 *6 1.00 ***
10 2.00 *******25 3.00 ******W'*********46 4.00 *******************************62 5.00 ***************************************66 6.00 *******************************************36 7.00 ************************
I ........ I........I........I........I........I0 15 30 45 60 75
HISTOGRAM FREQUENCY
MEAN 4.913 MEDIAN 5.000 MODE 6.000STD DEV 1.530 MINIMUM .000 MAXIMUM 7.000
157

(17) Fulfill Promises Made........................................................................
VALID CUMVALUE LABEL VALUE FREQUENCY PERCENT PERCENT PERCENT
Not Provided 0 8 3.1 3.2 3.2Poor 1 8 3.1 3.2 6.4Poor 2 8 3.1 3.2 9.6Satisfactory 3 36 14.0 14.3 23.9Satisfactory 4 35 13.6 13.9 37.8Satisfactory 61 23.7 24.3 62.2Excellent 6 64 24.9 25.5 87.6Excellent 7 31 12.1 12.4 100.0
99 6 2.3 MISSING
TOTAL 257 100.0 100.0
COUNT VALUE ONE SYMBOL EQUALS APPROXIMATELY 1.50 OCCURRENCES
8 .00 *****8 1.00 ***t8 2.00 *****
36 3.00 ***********************35 4.00 **********************61 5.00 **************************** **64 6.00 ***************************************31 7.00 ******************I ........I........I........I........I........I
0 15 30 45 60 75HISTOGRAM FREQUENCY
MEAN 4.693 MEDIAN 5.000 MODE 6.000STD DEV 1.724 MINIMUM .000 MAXIMUM 7.000
(18) Ability to handle the customer's anger or frustration.
VALID CUMVALUE LABEL VALUE FREQUENCY PERCENT PERCENT PERCENT
Not Provided 0 15 5.8 6.0 6.0Poor 1 5 1.9 2.0 8.0Poor 2 5 1.9 2.0 10.0Satisfactory 3 35 13.6 14.0 24.0Satisfactory 4 37 14.4 14.8 38.8Satisfactory 5 70 27.2 28.0 66.8Excellent 6 62 24.1 24.8 91.6Excellent 7 21 8.2 8.4 100.0
99 7 2.7 MISSING
TOTAL 257 100.0 100,0
COUNT VALUE ONE SYMBOL EQUALS APPROXIMATELY 1.50 OCCURRENCES
15 .00 **********5 1.00 ,"5 2.00 ***
35 3.00*******t****37 4.00 ************************70 5.00 ******************************* t***t62 6.00 ****************************************21 7.00 **********I ........ I........I........I........I........I
0 15 30 45 60 75HISTOGRAM FREQUENCY
MEAN 4.548 MEDIAN 5.000 MODE 5.000STD DEV 1.761 MINIMUM .000 MAXIMUM 7.000
158

(19) Professionalism........................................................................
VALID CUMVALUE LABEL VALUE FREQUENCY PERCENT PERCENT PERCENT
Not Provided 0 1 .4 .4 .4Poor 2 11 4.3 4.3 4.7Satisfactory 3 15 5.8 5.9 10.5Satisfactory 4 38 14.8 14.8 25.4Satisfactory 5 62 24.1 24.2 49.6Excellent 6 92 35.8 35.9 85.5Excellent 7 37 14.4 14.5 100.0
99 1 .4 MISSINGTOTAL 257 100.0 100.0
COUNT VALUE ONE SYMBOL EQUALS APPROXIMATELY 2.00 OCCURRENCES
1 .00 *0 1.00
11 2.00 *****15 3.00 ********38 4.00 ******************62 5.00 ******************************92 6.00 ********************************************37 7.00 *******************I ........ I........I........I........I........I
0 20 40 60 80 100HISTOGRAM FREQUENCY
MEAN 5.234 MEDIAN 6.000 MODE 6.000STD DEV 1.325 MINIMUM .000 MAXIMUM 7.000
(20) Competence
VALID CUMVALUE LABEL VALUE FREQUENCY PERCENT PERCENT PERCENT
Not Provided 0 1 .4 .4 .4Poor 1 7 2.7 2.7 3.1Poor 2 9 3.5 3.5 6.6Satisfactory 3 22 8.6 8.6 15.2Satisfactory 4 49 19.1 19.1 34.4Satisfactory 5 57 22.2 22.3 56.6Excellent 6 72 28.0 28.1 84.8Excellent 7 39 15.2 15.2 100.0
99 1 .4 MISSING
TOTAL 257 100.0 100.0
COUNT VALUE ONE SYMBOL EQUALS APPROXIMATELY 1.50 OCCURRENCES
1 .00 *7 1.00 ***tt9 2.00 ******22 3.00 ***************49 4.00 ********************************57 5.00 *******************72 6.00 **********************************************39 7.00 *************************I ............... I ........ I ........ I ........ I
0 15 30 45 60 75HISTOGRAM FREQUENCY
MEAN 4.988 MEDIAN 5.000 MODE 6.000STD DEV 1.512 MINIMUM .000 MAXIMUM 7.000
159

(21) An enthusiastic attitude.
VALID CUMVALUE LABEL VALUE FREQUENCY PERCENT PERCENT PERCENT
Not Provided 0 1 .4 .4 .4Poor 1 8 3.1 3.1 3.5Poor 2 15 5.8 5.9 9.4Satisfactory 3 32 12.5 12.5 21.9Satisfactory 4 47 18.3 18.4 40.2Satisfactory 5 72 28.0 28.1 68.4Excellent 6 56 21.8 21.9 90.2Excellent 7 25 9.7 9.8 100.0
99 1 .4 MISSINGTOTAL 257 100.0 100.0
COUNT VALUE ONE SYMBOL EQUALS APPROXIMATELY 1.50 OCCURRENCES
1 .00 *8 1.00 ****
15 2.00 **********32 3.00 *******************t47 4.00 ******************************72 5.00 ************* *56 6.00 ************************************25 7.00 ****************
I ....... I.......I.......I.......I.......
0 15 30 45 60 75HISTOGRAM FREQUENCY
MEAY 4.660 MEDIAN 5.000 MODE 5.000STD DEV 1.520 MINIMUM .000 MAXIMUM 7.000
(22, A concern about your problem.
VALID CUM1'1.LUE LABEL VALUE FREQUENCY PERCENT PERCENT PERCENT
No, Provided 0 2 .8 .8 .8Po- 1 10 3.9 3.9 4.7Po(,: 2 15 5.8 5.9 10.6Satisfactory 3 36 14.0 14.2 24.8Sat~sfactory 4 40 15.6 15.7 40.6Satisfactory 5 65 25.3 25.6 66.1Excillent 6 58 22.6 22.8 89.0Ex,!llent 7 28 10.9 11.0 100.0
99 3 1.2 MISSING
TOTAL 257 100.0 100.0
COUNT VALUE ONE SYMBOL EQUALS APPROXIMATELY 1.50 OCCURRENCES
2 .00 *10 1.00 t*****15 2.00 **********36 3.00 **********************40 4.00 **************************65 5.00 **************tt*********************58 6.00 ***************************
28 7.00 *I ........ I........I........I........I........I0 15 30 45 60 75
HISTOGRAM FREQUENCY
MEAN 4.634 MEDIAN 5.000 MODE 5.000STD DEV 1.621 MINIMUM .000 MAXIMUM 7.000
160

(23) Ease and simplicity of order form.
VALID CUMVALUE LABEL VALUE FREQUENCY PERCENT PERCENT PERCENT
Not Provided 0 11 4.3 4.5 4.5Poor 1 1 .4 .4 5.0Poor 2 10 3.9 4.1 9.1Satisfactory 3 26 10.1 10.7 19.8Satisfactory 4 34 13.2 14.0 33.9Satisfactory 5 73 28.4 30.2 64.0Excellent 6 64 24.9 26.4 90.5Excellent 7 23 8.9 9.5 100.0
99 15 5.8 MISSINGTOTAL 257 100.0 100.0
COUNT VALUE ONE SYMBOL EQUALS APPROXIMATELY 1.50 OCCURRENCES
11 .00 ******1 1.00 *
10 2.00 *******26 3.00 *34 4.00 **********************73 5.00 *********************************************64 6.00 ****23 7.00 ***************
I ........I ........ I......!......... ......... I0 15 30 45 60 75
HISTOGRAM FREQUENCY
MEAN 4.731 MEDIAN 5.000 MODE 5.000STD DEV 1.652 MINIMUM .000 MAXIMUM 7.000
(24) Time Required To Fill Out Order Form
VALID CUMVALUE LABEL VALUE FREQUENCY PERCENT PERCENT PERCENT
Not Provided 0 9 3.5 3.8 3.8Poor 2 6 2.3 2.5 6.3Satisfactory 3 25 9.7 10.4 16.7Satisfactory 4 34 13.2 14.2 30.8Satisfactory 5 80 31.1 33.3 64.2Excellent 6 63 24.5 26.2 90.4Excellent 7 23 8.9 9.6 100.0
99 17 6.6 MISSINGTOTAL 257 100.0 100.0
COUNT VALUE ONE SYMBOL EQUALS APPROXIMATELY 2.00 OCCURRENCES9 .00 *****0 1.006 2.00 *'
25 3.00 *************34 4,00*********80 5.00 ****************************************63 6.00 *****************************23 7.00 ************I ........ I ........ I ...... ......... I ........ I
0 20 40 60 80 100HISTOGRAM FREQUENCY
MEAN 4,842 MEDIAN 5.000 MODE 5.000STD DEV 1.533 MINIMUM .000 MAXIMUM 7.000
161

(25) Assistance in searching for a part number or stock number.
VALID cumVALUE LABEL VALUE FREQUENCY PERCENT PERCENT PERCENT
Not Provided 0 9 3.5 3.7 3.7Poor 1 5 1.9 2.1 5.8Poor 2 10 3.9 4.1 9.9Satisfactory 3 25 9.7 10.3 20.2Satisfactory 4 28 10.9 11.6 31.8Satisfactory 5 57 22.2 23.6 55.4Excellent 6 71 27.6 29.3 84.7Excellent 7 37 14.4 15.3 100.0
99 15 5.8 MISSINGTOTAL 257 100.0 100.0
COUNT VALUE ONE SYMBOL EQUALS APPROXIMATELY 1.50 OCCURRENCES
9 .00 *5 1.00 ***
10 2.00 *******25 3.00 ***************28 4.00 *******************57 5.00 **************************************71 6.00 *********************************************37 7.00 ********************'...*
I ........ I........I........I........I........I0 15 30 45 60 75
HISTOGRAM FREQUENCY
MEAN 4.884 MEDIAN 5.000 MODE 6.000STD DEV 1.751 MINIMUM .000 MAXIMUM 7.000
(26) Availability of more than one phone line for placing orders.
VALID CUMVALUE LABEL VALUE FREQUENCY PERCENT PERCENT PERCENT
Not Provided 0 13 5.1 5.8 5.8Poor 1 5 1.9 2.2 8.0Poor 2 8 3.1 3.6 11.6Satisfactory 3 18 7.0 8.0 19.6Satisfactory 4 42 16.3 18.8 38.4Satisfactory 5 61 23.7 27.2 65.6Excellent 6 49 19.1 21.9 87.5Excellent 7 28 10.9 12.5 100.0
99 33 12.8 MISSINGTOTAL 257 100.0 100.0
COUNT VALUE ONE SYMBOL EQUALS APPROXIMATELY 1.50 OCCURRENCES
13 .00 *********5 1.00 *8 2.00 *****18 3.00 ************
42 4.00 *************************61 5.00 ** * * * * * * **49 6.00 ********t******************28 7.00 "**"********
I ....... I.......I.......I.......I.......I
0 15 30 45 60 75HISTOGRAM FREQUENCY
MEAN 4.634 MEDIAN 5.000 MODE 5.000STD DEV 1.799 MINIMUM .000 MAXIMUM 7.000
162

(27) Availability of remote order transmission (computer to computerOrder Entry).
VALID CUMVALUE LABEL VALUE FREQUENCY PERCENT PERCENT PERCENT
Not Provided 0 27 10.5 13.4 13.4Poor 1 4 1.6 2.0 15.3Poor 2 4 1.6 2.0 17.3Satisfactory 3 19 7.4 9.4 26.7Satisfactory 4 28 10.9 13.9 40.6Satisfactory 5 56 21.8 27.7 68.3Excellent 6 47 18.3 23.3 91.6Excellent 7 17 6.6 8.4 iV0.0
99 55 21.4 MISSINGTOTAL 257 10.0 100.0
COUNT VALUE ONE SYMBOL EQUALS APPROXIMATELY 1.20 OCCURRENCES27 .00 *********************4 1.00 ***4 2.00 **
19 3.00 ****************28 4.00 ***********************56 5.00 ***********************************************47 6.00 ***************************************17 7.00 **************I ........ I........I........I........I........I
0 12 24 36 48 60HISTOGRAM FREQUENCY
MEAN 4.267 MEDIAN 5.000 MODE 5.000STD DEV 2.099 MINIMUM .000 MAXIMUM 7.000
(28) No restriction on number of orders that can be placed overthe phone.
VALID CUMVALUE LABEL VALUE FREQUENCY PERCENT PERCENT PERCENT
Not Provided 0 20 7.8 9.2 9.2Poor 1 11 4.3 5.1 14.3Poor 2 13 5.1 6.0 20.3Satisfactory 3 19 7.4 8.8 29.0Satisfactory 4 55 21.4 25.3 54.4Satisfactory 5 51 19.8 23.5 77.9Excellent 6 33 12.8 15.2 93.1Excellent 7 15 5.8 6.9 100.0
99 40 15.6 MISSINGTOTAL 257 100.0 100.0
COUNT VALUE ONE SYMBOL EQUALS APPROXIMATELY 1.20 OCCURRENCES20 .00 *****************11 1.00 *********13 2.00 ***********19 3.00 *55 4.00 *********************************************51 5.00 ****************************************33 6.00 ***************************15 7.00 ************
I.......I.......I.......I.......I.......I0 12 24 36 48 60
HISTOGRAM FREQUENCY
MEAN 4.018 MEDIAN 4.000 MODE 4.000STD DEV 1.934 MINIMUM .000 MAXIMUM 7.000
163

(29) Clear guidance on due in from maintenance (DIFM) procedures.........................................................................
VALID CUMVALUE LABEL VALUE FREQUENCY PERCENT PERCENT PERCENT
Not Provided 0 14 5.4 6.6 6.6Poor 2 9 3.5 4.2 10.8Satisfactory 3 21 8.2 9.9 20.7Satisfactory 4 42 16.3 19.7 40.4Satisfactory 5 60 23.3 28.2 68.5Excellent 6 49 19.1 23.0 91.5Excellent 7 18 7.0 8.5 100.0
99 44 17.1 MISSINGTOTAL 257 100.0 100.0
COUNT VALUE ONE SYMBOL EQUALS APPROXIMATELY 1.20 OCCURRENCES
14 .00 ************0 1.009 2.00 ********
21 3.00 ******************42 4.00 ***********************************60 5.00 **************************************************49 6.00 *************************************18 7.00 ***************I ........ I........I........I........I........I
0 12 24 36 48 60HISTOGRAM FREQUENCY
MEAN 4.549 MEDIAN 5.000 MODE 5.000STD DEV 1.730 MINIMUM .000 MAXIMUM 7.000
(30) Clear guidance on local purchase procedures.
VALID CUMVALUE LABEL VALUE FREQUENCY PERCENT PERCENT PERCENT
Not Provided 0 4 1.6 1.6 1.6Poor 1 5 1.9 2.0 3.7Poor 2 16 6.2 6.5 10.2Satisfactory 3 26 10.1 10.6 20.7Satisfactory 4 52 20.2 21.1 41.9Satisfactory 5 81 31.5 32.9 74.8Excellent 6 43 16.7 17.5 92.3Excellent 7 19 7.4 7.7 100.0
99 11 4.3 MISSINGTOTAL 257 100.0 100.0
COUNT VALUE ONE SYMBOL EQUALS APPROXIMATELY 2.00 OCCURRENCES
4 .00 **5 1.00 *16 2.00 ********26 3.00 ************
52 4.00 * ** * **81 5.00 ***********************************43 6.00 **********************19 7.00 ******
I ....... I.......I.......I.......I.......I
0 20 40 60 80 100HISTOGRAM FREQUENCY
MEAN 4.549 MEDIAN 5.000 MODE 5.000STD DEV 1.497 MINIMUM .000 MAXIMUM 7.000
164

(31) Ability to meet required delivery times on items available instock.
........................................................................
VALID CUMVALUE LABEL VALUE FREQUENCY PERCENT PERCENT PERCENT
Not Provided 0 4 1.6 1.6 1.6Poor 1 8 3.1 3.2 4.8Poor 2 12 4.7 4.8 9.6Satisfactory 3 34 13.2 13.7 23.3Satisfactory 4 35 13.6 14.1 37.3Satisfactory 5 74 28.8 29.7 67.1Excellent 6 58 22.6 23.3 90.4Excellent 7 24 9.3 9.6 100.0
99 8 3.1 MISSINGTOTAL 257 100.0 100.0
COUNT VALUE ONE SYMBOL EQUALS APPROXIMATELY 1.50 OCCURRENCES4 .00 *8 1.00 *****
12 2.00 *34 3.00 **********************35 4.00 ***********************74 5.00 ******58 6.00 ************************************24 7.00 **************I ............... I ........ I ........ I ........ I
0 15 30 45 60 75HISTOGRAM FREQUENCY
MEAN 4.659 MEDIAN 5.000 MODE 5.000STD DEV 1.596 MINIMUM .000 MAXIMUM 7.000
(32) Minimum variation between projected and actual delivery dates onite.rs procured from depot.
........................................................................
VALID CUMVALUE LABEL VALUE FREQUENCY PERCENT PERCENT PERCENT
Not Provided 0 7 2.7 2.8 2.8Poor 1 12 4.7 4.8 7.6Poor 2 25 9.7 10.0 17.7Satisfactory 3 40 15.6 16.1 33.7Satisfactory 4 54 21.0 21.7 55.4Satisfactory 5 71 27.6 28.5 83.9Excellent 6 31 12.1 12.4 96.4Excellent 7 9 3.5 3.6 100.0
99 8 3.1 MISSING
TOTAL 257 100.0 200.0
COUNT VALUE ONE SYMBOL EQUALS APPROXIMATELY 1.50 OCCURRENCES7 .00 *****
12 1.00 ********25 2.00 *****************40 3.00 ************************54 4.00 ************************************71 5.00 *****************************************31 6.00 *********************9 7.00 ****I ........ I........I........I........I........I
0 15 30 45 60 75HISTOGRAM FREQUENCY
MEAN 4.024 MEDIAN 4.000 MODE 5.000STD DEV 1.601 MINIMUM .000 MAXIMUM 7.000
165

(33) Ability to meet required delivery dates on local purchase items.........................................................................
VALID CUMVALUE LABEL VALUE FREQUENCY PERCENT PERCENT PERCENT
Not Provided 0 7 2.7 2.8 2.8Poor 1 11 4.3 4.4 7.2Poor 2 26 10.1 10.4 17.5Satisfactory 3 35 13.6 13.9 31.5Satisfactory 4 55 21.4 21.9 53.4Satisfactory 5 57 22.2 22.7 76.1Excellent 6 49 19.1 19.5 95.6Excellent 7 11 4.3 4.4 100.0
99 6 2.3 MISSINGTOTAL 257 100.0 100.0
COUNT VALUE ONE SYMBOL EQUALS APPROXIMATELY 1.20 OCCURRENCES
7 .00 *****11 1.00 *********26 2.00 **********************35 3.00 ***********************55 4.00 ********************************************57 5.00 t *************************************49 6.00 *****************************************11 7.00 *********
I ........ I........I........I........I........I0 12 24 36 48 60
HISTOGRAM FREQUENCY
MEAN 4.159 MEDIAN 4000 MODE 5.000STD DEV 1.668 MINIMUM .000 MAXIMUM 7.000
(34) Minimum variation between required and actual delivery dates onMICAP items.
VALID CUMVALUE LABEL VALUE FREQUENCY PERCENT PERCENT PERCENT
Not Provided 0 20 7.8 9.6 9.6Poor 1 10 3.9 4.8 14.4Poor 2 14 5.4 6.7 21.1Satisfactory 3 21 8.2 10.0 31.1Satisfactory 4 28 10.9 13.4 44.5Satisfactory 5 51 19.8 24.4 68.9Excellent 6 50 19.5 23.9 92.8Excellent 7 15 5.8 7.2 100.0
99 48 18.7 MISSINGTOTAL 257 100.0 100.0
COUNT VALUF ONE SYMBOL EQUALS APPROXIMATELY 1.20 OCCURRENCES
20 .00 *****************10 1.00 ********14 2.00 ******t******21 3.00 **************'28 4.00 *******************51 5.00 ****************** *************50 6.00 *****************************************
15 7.00 ***********tI ............... I ........ I ........ I ........ I0 12 24 36 48 60
HISTOGRAM FREQUENCYMEAN 4.177 MEDIAN 5.000 MODE 5.000
STD DEV 2.041 MINIMUM .000 MAXIMUM 7.000
166

(35) Fill rate on base level stock items (% of orders receivedcomplete the first time.
VALID CUMVALUE LABEL VALUE FREQUENCY PERCENT PERCENT PERCENT
Not Provided 0 3 1.2 1.2 1.2Poor 1 2 .8 .8 2.1Poor 2 13 5.1 7.4Satisfactory 3 26 10.1 10.1 18.2Satisfactory 4 48 18.7 19.8 38.0Satisfactory 5 80 31.1 33.1 71.1Excellent 6 56 21.8 23.1 94.2Excellent 7 14 5.4 5.8 100.0
99 15 5.8 MISSING
TOTAL 257 100.0 100.0
COUNT VALUE ONE SYMBOL EQUALS APPROXIMATELY 2.00 OCCURRENCES
3 .00 **2 I.00 *
13 2.00 *******26 3.00 *****48 4.00 ************************80 5.00 ***************************************56 6.00 ****************************14 7.00 *******
I ........ I........I........I........I........I0 20 40 60 80 100
HISTOGRAM FREQUENCY
MEAN 4.678 MEDIAN 5.000 MODE 5.000STD DEV 1.386 MINIMUM .000 MAXIMUM 7.000
(36) Availability of bench stock items when needed.
VALID CUMVALUE LABEL VALUE FREQUENCY PERCENT PERCENT PERCENT
Not Provided 0 10 3.9 4.4 4.4Poor 1 6 2.3 2.7 7.1Poor 2 24 9.3 10.6 17.7Satisfactory 3 23 8.9 10.2 27.9Satisfactory 4 32 12.5 14.2 42.0Satisfactory 5 72 28.0 31.9 73.9Excellent 6 41 16.0 18.1 92.0Excellent 7 18 7.0 8.0 100.0
99 31 12.1 MISSING
TOTAL 257 100.0 100.0
COUNT VALUE ONE SYMBOL EQUALS APPROXIMATELY 1.50 OCCURRENCES10 .00 ******6 1.00 ***
24 2.00 ****************23 3.00 *************32 4.00 ********************72 5.00 *41 6.00 ***************************18 7.00 ***********I ........ I........I........I........I........I
0 15 30 45 60 75HISTOGRAM FREQUENCY
MPAN 4.350 MEDIAN 5.000 MODE 5.000STD DEV 1.768 MINIMUM .000 MAXIMUM 7.000
167

(37) Availability of supply point items when needed.
VALID CUMVALUE LABEL VALUE FREQUENCY PERCENT PERCENT PERCENT
Not Provided 0 14 5.4 6.5 6.5Poor 2 8 3.1 3.7 10.2Satisfactory 3 26 10.1 12.1 22.3Satisfactory 4 37 14.4 17.2 39.5Satisfactory 5 65 25.3 30.2 69.8Excellent 6 48 18.7 22.3 92.1Excellent 7 17 6.6 7.9 100.0
99 42 16.3 MISSINGTOTAL 257 100.0 100.0
COUNT VALUE ONE SYMBOL EQUALS APPROXIMATELY 1.50 OCCURRENCES
14 .00 *****0 1,008 2.00 ****
26 3.00 ***************37 4.00 **********************65 5.00 *****************************************48 6.00 ***************************17 7.00 ***********! ......... I ......... I ........ I......... ........ I
0 15 30 45 60 75HISTOGRAM FREQUENCY
MEAN 4.530 MEDIAN 5.000 MODE 5.000SD DEV 1.718 MINIMUM .000 MAXIMUM 7.000
(30) Adequate stock of base service store items.
VALID CUMVALUE LABEL VALUE FREQUENCY PERCENT PERCENT PERCENT
0 2 .8 .8 .8Poor 1 4 1.6 1.6 2.4Poor 2 19 7.4 7.6 10.0Satisfactory 3 37 14.4 14.9 24.9Satisfactory 4 43 16.7 17.3 42.2Sat~sfa~tory 5 70 27.2 28.1 70.3Exce!:ent 6 55 21.4 22.1 92.4Excellent 7 19 7.4 7.6 100.0
99 8 3.1 MISSING
TOTAL 257 100.0 100.0
COUNT VALUE ONE SYMBOL EQUALS APPROXIMATELY 1.50 OCCURRENCES
2 .00 *4 1.00 **
19 2.00 *************37 3.00 *43 4.00 ************************70 5.00 *******************************************55 6.00 **********************************19 7.00 ***********I ........ I........I........I........I........I
0 15 30 45 60 75HISTOGRAM FREQUENCY
MEAN 4.570 MEDIAN 5.000 MODE 5.000STD DEV 1.504 MINIMUM .000 MAXIMUM 7.000
168

(39) Adequate stock of individual equipment items............................................................................
VALID CUMVALUE LABEL VALUE FREQUENCY PERCENT1 PERCENT PERCENT
0 5 1.9 2.1 2.1Poor 1 4 1.6 1.7 3.8Poor 2 12 4.7 5.0 8.8Satisfactory 3 26 10.1 10.8 19.6Satisfactory 4 46 17.9 19.2 38.8Satisfactory 5 81 31.5 33.8 72.5Excellent 6 50 19.5 20.8 93.3Excellent 7 16 6.2 6.7 100.0
99 17 6.6 MISSING
TOTAL 257 100.0 100.0
COUNT VALUE ONE SYMBOL EQUALS APPROXIMATELY 2.00 OCCURRENCES
5 .00 ***4 1.00 *
12 2.00 *****26 3.00 ************46 4.00 **********************81 5.00 *************t******************50 6.00 ***********************16 7.00 ********I ............... I ........ I ........ I ........ I
0 20 40 60 80 100HISTOGRAM FREQUENCY
MEAN 4.613 MEDIAN 5.000 MODE 5.000STD DEV 1.482 MINIMUM .000 MAXIMUM 7.000
(40) Ability to expedite MICAP requests.
VALID CUMVALUE LABEL VALUE FREQUENCY PERCENT PERCENT PERCENT
Not Provided 0 9 3.5 4.5 4.5Poor 1 4 1.6 2.0 6.6Poor 2 9 3.5 4.5 11.1Satisfactory 3 10 3.9 5.1 16.2Satisfactory 4 30 11.7 15.2 31.3Satisfactory 5 45 17.5 22.7 54.0Excellent 6 56 21.8 28.3 82.3Excellent 7 35 13.6 17.7 100.0
99 59 23.0 MISSING
TOTAL 257 100.0 100.0
COUNT VALUE ONE SYMBOL EQUALS APPROXIMATELY 1.20 OCCURRENCES
9 .00 *******4 1.00 *U9 2.00 ********
10 3.00 *******30 4.00 ************************45 5.00 ***********************t********56 6.00 *35 7.00 *********************I ........ I........I........I........I........I
0 12 24 36 48 60HISTOGRAM FREQUENCY
MEAN 4.939 MEDIAN 5.000 MODE 6 OnoSTD DEV 1.796 MINIMUM .000 MAXIMUM 7.000
169

(41) Ability to expedite out ot the ordinary MICAP requests.............................................................................
VALID CUMVALUE LABEL VALUE FREQUENCY PERCENT PERCENT PERCENT
Not Provided 0 13 5.1 6.6 E.6Poor 1 8 3.1 4.1 10.7Poor 2 8 3.1 4.1 14.8Satisfactory 3 16 6.2 8.2 23.0Satisfactory 4 32 12.5 16.3 39.3Satisfactory 5 40 15.6 20.4 59.7Excellent 6 54 21.0 27.6 87.2Excellent 7 25 9.7 12.8 100.0
99 61 23.7 MISSINGTOTAL 257 100.0 100.0
COUNT VALUE ONE SYMBOL EQUALS APPROXIMATELY 1.20 OCCURRENCES
13 .00 ***********8 1.00 ******8 2.00 *******
16 3.00 ***********32 4.00 **************************40 5.00 *54 6.00 *******************************************25 7.00 ****
i ......... ......... I ........ I ........ I ........ I0 12 24 36 48 60
HISTOGRAM FREQUENCY
MEAN 4.587 MEDIAN 5.000 MODE 6.000STD DEV 1.950 MINIMUM .000 MAXIMUM 7.000
(42) Ability to expedite non-MICAP requests when necessary.
VALID CUMVALUE LABEL VALUE FREQUENCY PERCENT PERCENT PERCENT
Not Provided 0 11 4.3 4.9 4.9Poor 1 6 2.3 2.7 7.6Poor 2 17 6.6 7.6 15.2Satisfactory 3 22 8.6 9.8 25.0Satisfactory 4 39 15.2 17.4 42.4Satisfactory 5 71 27.6 31.7 74.1Excellent 6 45 17.5 20.1 94.2Excellent 7 13 5.1 5.8 100.0
99 33 12.8 MISSING
TOTAL 257 100.0 100.0
COUNT VALUE ONE SYMBOL EQUALS APPROXIMATELY 1.50 OCCURRENCES
1i .00 *******1.00 "**
17 2.00 ***********22 3.00 **************39 4.00 *************************71 5.00 * * ** * * * * * * *45 6.00 *13 7.00 *******I ........I........I........I........I........I
0 15 30 45 60 75HISTOGRAM FREQUENCY
MEAN 4.366 MEDIAN 5.000 MODE 5.000STD DEV 1.718 MINIMUM .000 MAXIMUM 7.000
170

(43) Ability to handle out of the ordinary delivery requests...........................................................................
VALID Cum
VALUE LABEL VALUE FREQUENCY PERCENT PERCENT PERCENT
Not Provided 0 10 3.9 4.2 4.2Poor 1 5 1.9 2.1 6.3Poor 2 16 6.2 6.7 13.0Satisfactory 3 34 13.2 14.2 27.2Satisfactory 4 48 18.7 20.1 47.3Satisfactory 5 61 23.7 25.5 72.8Excellent 6 47 18.3 19.7 92.5Excellent 7 18 7.0 7.5 100.0
99 18 7.0 MISSINGTOTAL 257 100.0 100.0
COUNT VALUE ONE SYMBOL EQUALS APPROXIMATELY 1.50 OCCURRENCES
10 .00 *******5 1.00 '*
16 2.00 ***********34 3.00 *******************48 4.00 ********************************61 5.00 **************************************47 6.00 *******************************18 7.00 ***********
I ........I ........I ........I ...... ......... I
0 15 30 45 60 75HISTOGRAM FREQUENCY
MEAN 4.368 MEDIAN 5.000 MODE 5.000STD DEV 1.692 MINIMUM .000 MAXIMUM 7.000
(44) Ability to expedite out of the ordinary local purchase requests.
VALID CUMVALUE LABEL VALUE FREQUENCY PERCENT PERCENT PERCENT
Not Provided 0 14 5.4 5.6 5.6Poor 1 9 3.5 3.6 9.3Poor 2 18 7.0 7.3 16.5Satisfactory 3 38 14.8 15.3 31.9Satisfactory 4 39 15.2 15.7 47.6Satisfactory 5 72 28.0 29.0 76.6Excellent 6 42 16.3 16.9 93.5Excellent 7 16 6.2 6.5 100.0
99 9 3.5 MISSING
TOTAL 257 100.0 100.0
COUNT VALUE ONE SYMBOL EQUALS APPROXIMATELY 1.50 OCCURRENCES
14 .00 ********9 1.00 *
18 2.00 ********38 3.00 ** ** ***39 4.00 **************************72 5.00 ******************************* ****tt42 6.00 **************************16 7.00 ***********I ........ I........I........I........I........I
0 15 30 45 60 75HISTOGRAM FREQUENCY
MEAN 4.190 MEDIAN 5.000 MODE 5.000STD DEV 1.789 MINIMUM .000 MAXIMUM 7.000
171

(45) Ability to provide training programs to suit the needs of yourorganization.
VALID CUMVALUE LABEL VALUE FREQUENCY PERCENT PERCENT PERCENT
Not Provided 0 11 4.3 4.5 4.5Poor 1 4 1.6 1.6 6.1Poor 2 15 5.8 6.1 12.2Satisfactory 3 40 15.6 16.3 28.6Satisfactory 4 42 16.3 17.1 45.7Satisfactory 5 64 24.9 26.1 71.8Eafelent 6 46 17.9 18.8 90.6
Excellent 7 23 8.9 9.4 100.099 12 4.7 MISSING
TOTAL 257 100.0 100.0
COUNT VALUE ONE SYMBOL EQUALS APPROXIMATELY 1.50 OCCURRENCES
11 .00 *******4 1,00 ***
15 2.00 *********40 3.00 *************42 4.00 ****************************64 5.00 ***************************************46 6.00 *******************************23 7,00 **************I ........ I........I........I........I........I
0 15 30 45 60 75HISTOGRAM FREQUENCY
MEAN 4.404 MEDIAN 5.000 MODE 5.000STD DEV 1.726 MINIMUM .000 MAXIMUM 7.000
172

Appendix E: Mean And Standard Deviation ScoresOf Importance Measurements
Description Variable Mean SD
A commitment to General Service 6.50 .73providing the bestservice possible. (13)
A commitment General Service 6.47 .76to customersatisfaction. (14)
Competence. (26) Demeanor Of 6.41 .74Supply Rep
Ability to solve Demeanor of 6.40 .71your problem. (22) Supply Rep
Ability to expedite Responsiveness 6.35 .99MICAP requests. (46)
Fulfill promises Demeanor Of 6.28 .94made. (23) Supply Rep
A good working General Service 6.24 .87relationship withyour organization. (12)
Professionalism. (25) Demeanor Of 6.20 .84Supply Rep
Minimum variation Order Cycle Time 6.22 1.15between requiredand actual deliverydates on MICAPitems. (40)
Ability to expedite Responsiveness 6.18 1.04out of the ordinaryMICAP requests. (47)
Ability to meet Order Cycle Time 6.08 1.02required deliverytimes on itemsavailable in stock. (37)
173

Description Variable Mean SD
A method for General Service 6.04 .94handling customercomplaints. (8)
A concern about Demeanor Of 6.04 1.01your problem. (28) Supply Rep
Availability of Item Availability 6.01 1.05bench stock itemswhen needed. (42)
Minimum variation Order Cycle Time 5.92 1.05between projectedand actual deliverydates on items procuredfrom depot. (38)
Ease and simplicity Order Processing 5.74 1.03of order form(AF Form 2005,DD Form 1348-6). (29)
Courtesy in Person. (20) Demeanor of 5.83 .91Supply Rep
Availability of supply Item Availability 5.85 1.05point items whenneeded. (43)
Assistance in searching Order Processing 5.78 1.26for a part number orstock number. (31)
Ability to meet required Order Cycle Time 5.85 1.06delivery dates on localpurchase items. (39)
An enthusiastic Demeanor of 5.80 1.02attitude. (27) Supply Rep
Clear guidance on Order Processing 5.76 1.07local purchaseprocedures. (36)
Accessability to the General Service 5.77 1.11NCOIC or OIC whenneeded to resolvea problem. (9)
174
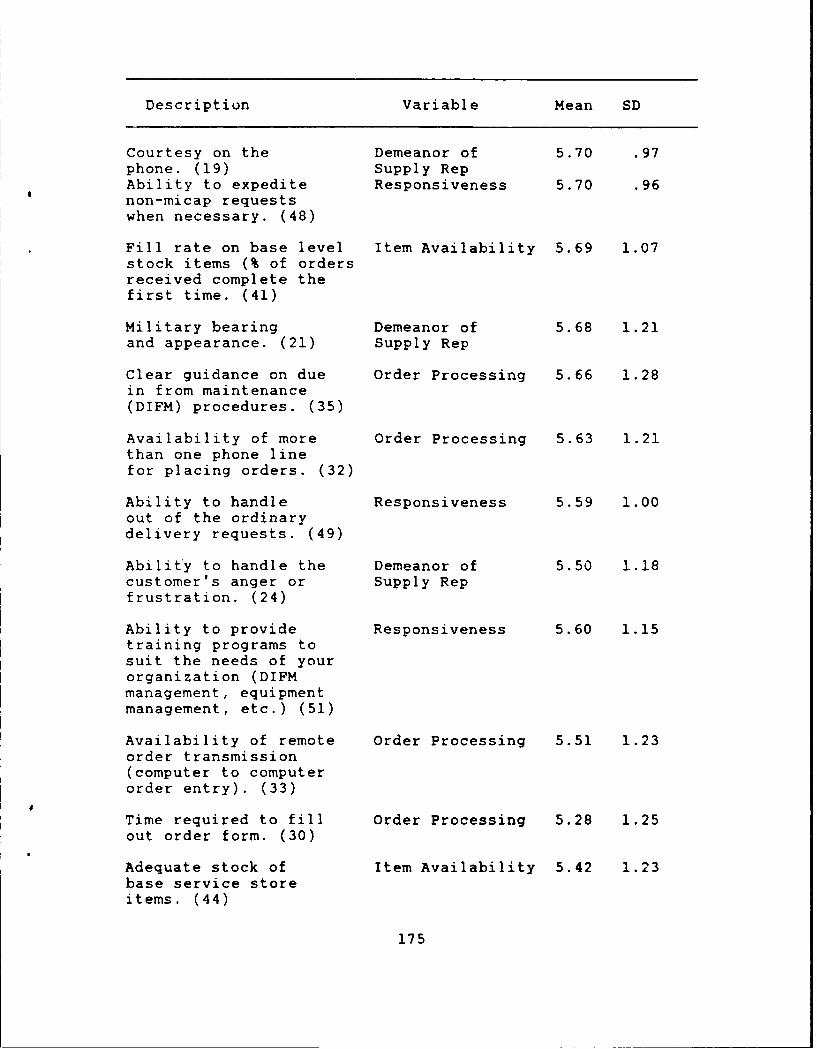
Description Variable Mean SD
Courtesy on the Demeanor of 5.70 .97phone. (19) Supply RepAbility to expedite Responsiveness 5.70 .96non-micap requestswhen necessary. (48)
Fill rate on base level Item Availability 5.69 1.07stock items (% of ordersreceived complete thefirst time. (41)
Military bearing Demeanor of 5.68 1.21and appearance. (21) Supply Rep
Clear guidance on due Order Processing 5.66 1.28in from maintenance(DIFM) procedures. (35)
Availability of more Order Processing 5.63 1.21than one phone linefor placing orders. (32)
Ability to handle Responsiveness 5.59 1.00out of the ordinarydelivery requests. (49)
Ability to handle the Demeanor of 5.50 1.18customer's anger or Supply Repfrustration. (24)
Ability to provide Responsiveness 5.60 1.15training programs tosuit the needs of yourorganization (DIFMmanagement, equipmentmanagement, etc.) (51)
Availability of remote Order Processing 5.51 1.23order transmission(computer to computerorder entry). (33)
Time required to fill Order Processing 5.28 1.25out order form. (30)
Adequate stock of Item Availability 5.42 1.23base service storeitems. (44)
175

Description Variable Mean SD
Ability to expedite Responsiveness 5.41 1.07out of the ordinarylocal purchaserequests. (50)
Accessibility of General Service 5.18 1.27Base Service Storeand IndividualEquipment Unit. (10)
Promptness in answering General Service 5.11 1.28the telephone. (7)
Adequate stock of Item Availability 5.22 1.22individual equipmentitems. (45)
No restriction on Order Processing 4.96 1.60number of orders thatcan be placed overthe phone. (34)
Visits to your General Service 4.47 1.53organization toensure adequatesuppor.t is beingprovided. (11)
176

Appendix F: Mean And Standard Deviation ScoresOf Performance Ratings Given to BaseSupply On All Criteria Used In Study
Description Variable Mean SD
Accessibility ofBase Service Storeand IndividualEquipment Unit. (10) General Service 5.46 1.22
Courtesy in Person. (20) Demeanor of 5.37 1.27Supply Rep
Military bearing Demeanor ofand appearance. (21) Supply Rep 5.29 1.22
Professionalism. (25) Demeanor Of 5.23 1.33Supply Rep
Courtesy on t he Demeanor ofphone. (19) Supply Rep 5.23 1.33
Promptness in answeringthe telephone. (7) General Service 5.13 1.32
A good workingrelationship withyour organization. (12) General Service 5.01 1.53
Competence. (26) Demeanor Of 4.99 1.51Supply Rep
Ability to expediteMICAP requests. (46) Responsiveness 4.94 1.80
Ability to solve Demeanoryour problem. (22) of Supply Rep 4.91 1.53
Time required to fillout order form. (30) Order rrocessing 4.84 1.53
Assistance in searchingfor a part number orstock number. (31) Order Processing 4.88 1.75
177

Description Variable Mean SD
A commitment toproviding the bestservice possible. (13) General Service 4.87 1.57
Accessability to theNCOIC or OIC whenneeded to resolvea problem. (9) General Service 4.82 1.64
Fulfill promises Demeanor Ofmade. (23) Supply Rep 4.69 1.72
Ease and simplicityof order form(AF Form 2005,DD Form 1348-6). (29) Order Processing 4.73 1.65
A method forhandling customercomplaints. (8) General Service 4.73 1.55
A commitmentto customersatisfaction. (14) General Service 4.77 1.61
Availability of morethan one phone linefor placing orders. (32) Order Processing 4.63 1.80
Clear guidance on duein from maintenance(DIFM) procedures. (35) Order Processing 4.55 1.73
Ability to meetrequired deliverytimes on itemsavailable in stock. (37) Order Cycle Time 4.66 1.60
Fill rate on base levelstock items (% of ordersreceived complete thefirst time. (41 Item Availability 4.68 1.39
An enthusiastic Demeanor ofattitude. (27) Supply Rep 4.66 1.52
178

Description Variable Mean SD
Ability to expediteout of the ordinaryMICAP requests. (47) Responsiveness 4.59 1.95
A concern about Demeanor Ofyour problem. (28) Supply Rep 4.63 1.62
Adequate stock ofindividual equipmentitems. (45) Item Availability 4.61 1.48
Adequate stock ofbase service stcreitems. (44) Item Availability 4.57 1.50
Clear guidance onlocal purchaseprocedures. (36 Order Processing 4.55 1.50
Ability to handle thecustomer's anger or Demeanor offrustration. (24) Supply Rep 4.55 1.76
Availability of supplypoint items whenneeded. (43) Item Availability 4.53 1.72
Ability to providetraining programs tosuit the needs ofyour organization(DIFM management,equipment management,etc. (51) Responsiveness 4.40 1.73
Ability to expeditenon-micap requestswhen necessary. (48) Responsiveness 4.37 1.72
Ability to handleout of the ordinarydelivery requests. (49) Responsiveness 4.37 1.70
Availability ofbench stock itemswhen needed. (42) Item Availability 4.35 1.77
179

Description Variable Mean SD
Ability to expediteout of the ordinarylocal pirchaserequests. (50) Responsiveness 4.21 1.77
Availability of remoteorder transmission(computer to computerorder entry). (33) Order Processing 4.27 2.10
Minirrum variationbetween requiredand actual deliverydates on MICAPitems. (40) Order Cycle Time 4.18 2.04
Ability to meet requireddelivery dates on localpurchase items. 3 9 ) Order Cycle Time 4.16 1.67
Minimum variationbetween projectedand actual deliverydates on items procuredfrom depot. (38) Order Cycle Time 4.04 1.58
No restriction onnumber of orders thatcan be placed overthe phone. (34) Order Processing 4.02 1.93
Visits to yourorganization toensure adequatesupport is beingprovided. (11) General Service 3.33 1.87
180

Appendix G: Comparison Of Importance AndPerformance Ratings Fjr CustomerService Criteria
Importance PerformanceCriterion Mean/S.D. Mean/S.D t-value
A. GENERAL SERVICE
Promptness in answering 5.11/1.28 5.13/1.32 -.18the telephone.
A method for handling 6.04/.94 4.73/1.55 12.23*customer complaints.
Accessibility to the 5.77/1.11 4.82/1.64 8.10*NCOIC or OIC whenneeded to resolve aproblem.
Accessibility of Base 5.18/1.27 5.46/1.22 -2.92*Service Store andIndividual EquipmentUnit.
Visits to your 4.47/1.53 3.33/1.87 7.94*organization toensure adequatesupport is beingprovided.
A good working 6.24/.87 5.01/1.53 12.68*relationship withyour organization.
A commitment to 6.50/.73 4.87/1.57 15.34*providing the bestservice possible.
A commitment to customer 6.47/.762 4.77/1.61 15.30*satisfaction.
C. DEMEANOR OF SUPPLY REPRESENTATIVES
Courtesy on the 5.70/.97 5.23/1.33 !,.301phone
Courtesy in person. 5.83/.91 5.37/1.27 5.25*
181

Importance PerformanceCriterion Mean/S.D. Mean/S.D t-value
Military bearing and 5.68/1.21 5.29/1.22 4.01*appearance. a
Ability to solve 6.40/.71 4.91/1.53 14.09*your problem.
Fulfill promises made. 6.28/.94 4.69/1.72 13.48*
Ability to handle 5.50/1.18 4.55/1.76 7.12*the customer's angeror frustration.
Professionalism. 6.20/.84 5.23/1.33 10.56*
Competence. 6.41/.74 4.99/1.51 13.77*
An enthusiastic 5.80/1.02 4.66/1.52 10.93*attitude.
A concern about 6.04/1.01 4.63/1.62 12.39*your problem.
D. ORDER PROCESSING
Ease and simplicity 5.74/1.03 4.73/1.65 8.26*of order form(AF Form 2005,DD Form 1348-6).
Time required to 5.28/1.25 4.84/1.53 3.50*fill out orderform.
Assistance in searching 5.78/1.26 4.88/1.75 7.07*for a part numberor stock number.
Availability of more than 5.63/1.21 4.63/1.80 7.18*one phone line forplacing orders.
Availability of remote 5.51/1.23 4.27/2.10 7.47*order transmission(computer to computerorder entry).
182

Importance PerformanceCriterion Mean/S.D. Mean/S.D t-value
No restriction on number 4.96/1.60 4.02/1.93 5.46*of orders that canbe placed over thephone.
Clear guidance 5.66/1.28 4.55/1.73 8.38*on due in frommaintenance (DIFM)procedures.
Clear guidance on local 5.76/1.07 4.55/1.50 10.29*purchase procedures.
D. ORDER CYCLE TIME (from order submission to delivery)
Ability to meetrequired delivery timeson items available in 6.08/1.02 4.66/1.60 11.90*base stock.
Minimum variation between 5.92/1.05 4.04/1.58 14.79*projected and actualdelivery dates on itemsprocured from depot.
Ability to meet required 5.85/1.06 4.16/1.67 13.51*delivery dates on localpurchase items.
Minimum variation between 6.22/1.15 4.18/2.04 13.35*required and actual deliverydates on MICAP items.
E. ITEM AVAILABILITY
Fill rate on base level 5.69/1.07 4.68/1.39 8.76*stock items (% of ordersreceived completethe first time).
Availability of bench 6.01/1.05 4.35/1.77 12.19*stock items whenneeded.
183

Importance PerformanceCriterion Mean/S.D. Mean/S.D t-value
Availability of supply 5.85/1.05 4.53/1.72 9.82*point items whenneeded.
Adequate stock of base 5.42/1.23 4.57/1.50 7.08*service store items.
Adequate stock of 5.22/1.22 4.61/1.48 5.23*individual equipmentitems.
F. RESPONSIVENESS
Ability to expedite 6.35/.99 4.94/1.80 11.07*MICAP requests.
Ability to expedite 6.18/1.04 4.59/1.95 11.05*out of the ordinaryMICAP requests.
Ability to expedite 5.70/.96 4.37/1.72 10.82*non-micap requestswhen necessary.
Ability to handle 5.59/.997 4.37/1.70 10.70*out of the ordinarydelivery requests.
Ability to expedite out 5.41/1.07 4.21/1.77 9.45*of the ordinary localpurchase requests.
Ability to provide 5.60/1.15 4.40/1.73 9.27*training programsto suit the needsof your organization(DIFM management,equipment management,etc.).
*Indicates a statistically significant difference at the
p<.005 level.
184

Bibliography
1. Bacas, Harry. "Make It right For The Customer,"
Nation's Business, 75: 49-51 (November 1987).
2. Blazer, Major Douglas J. et al. "AlternativeApproaches To The Standard Base Supply System EconomicOrder Quantity Depth Model," AFLMC Report 831107. AirForce Logistics Management Center, Gunter AFS AL, July1984.
3. Blume, Eric R. "Customer Service: Giving Companiesthe Competitive Edge," Training and DevelopmentJournal, 42: 24-32 (September 1988).
4. Cathcart, Jim. "Winning Customer Service," ManagementSolutions, 33: 10-17 (November 1988).
5. Davidow, William H. and Bro Uttal. "Service Companies:Focus or Falter," Harvard Business Review, 67: 77-85(July-August 1989).
6. Department of the Air Force. USAF Supply Manual.AFM 67-1, Volume II, Part Two. Washington: HQ USAF,1 February 1988.
7. Desatnick, Robert L. Managing to Keep the Customer.San Francisco: Jossey-Bass, Inc., 1987.
8.-. "Long Live the King," Quality Progress,22:24-26 (April 1989).
9. Emory, William C. Business Research Methods.Homewood IL: Richard D. Irwin, Inc., 1985.
10. Garfein, Richard T. "Guidelines for Improving CustomerService," Management Solutions, 33: 12-13 (November1988).
11. Goodman, John. "The Nature of Customer Satisfaction,"Quality Progress, 22: 37-40 (February 1989).
12. Headquarters United States Air Force/ACM. A Guide forthe Development of Attitude and Opinion Survey. HQUSAF/ACM, Pentagon, Washington DC, October 1974.
13. Hutchens, Spencer Jr. "What Customer Want: Results ofASQC/GALLUP Survey," Quality Progress, 22: 33-35(February 1989).
185

14. Kachigan, Sam Kash. Statistical Analysis. New York:Radius Press, 1986.
15. Kidder, L. H. Research Methods In Social Relations.New York: Holt, Reinhardt and Winston, 1981.
16. La Londe, Bernard J. and Paul H. Zinszer. CustomerService: Meaning And Measurement. Chicago: NationalCouncil of Physical Distribution Management, 1976.
17. La Londe, Bernard J., et al. Customer Service: AManagement Perspective. Oak Brook: The Council ofLogistics Management, 1988.
18. Lambert, Douglas M. and Thomas C. Harrington."Establishing Customer Service Strategies Within theMarketing Mix: More Empirical Evidence," Journal ofBusiness Logistics, 10: (No. 2, 1989).
19. Lash, Linda M. The Complete Guide to Customer Service.New York: John Wiley & Sons, Inc., 1989.
20. Long, Capt Danny S. Customer Management Skills ForEffective Air Force Civil Engineering Customer Service.MS thesis, AFIT/GEM/DEM/86S-17. School of Systems andLogistics, Air Force Institute of Technology (AU),Wright-Patterson AFB OH, September 1986 (AD-A174114).
21. McClave, James T. and George P. Benson. Statistics ForBusiness And Economics. San Francisco: DellenPublishing Co., 1988.
22. Norusis, Marija J. The SPSS Guide to Data Analysis forSPSSX. Chicago: SPSS Inc., 1986.
23. Peters, Thomas J. and Robert W. Waterman. In Search ofExcellence: Lessons From America's Best 7un Companies.New York: Harper & Row, 1982.
24. Shane, Guy S. Class lecture in COMM 630, ResearchMethods. School of Systems and Logistics, Air ForceInstitute of Technology (AU), Wright-Patterson AFB OH,November 1989.
25. Sharman, Graham. "The Rediscovery of Logistics,"Harvard Business Review, 5: i-79 (September-October1984).
26. Sherden, William A. "Gaining the Service QualityAdvantage," The Journal of Business Strategy, 9: 45-48(March-April 1989).
186
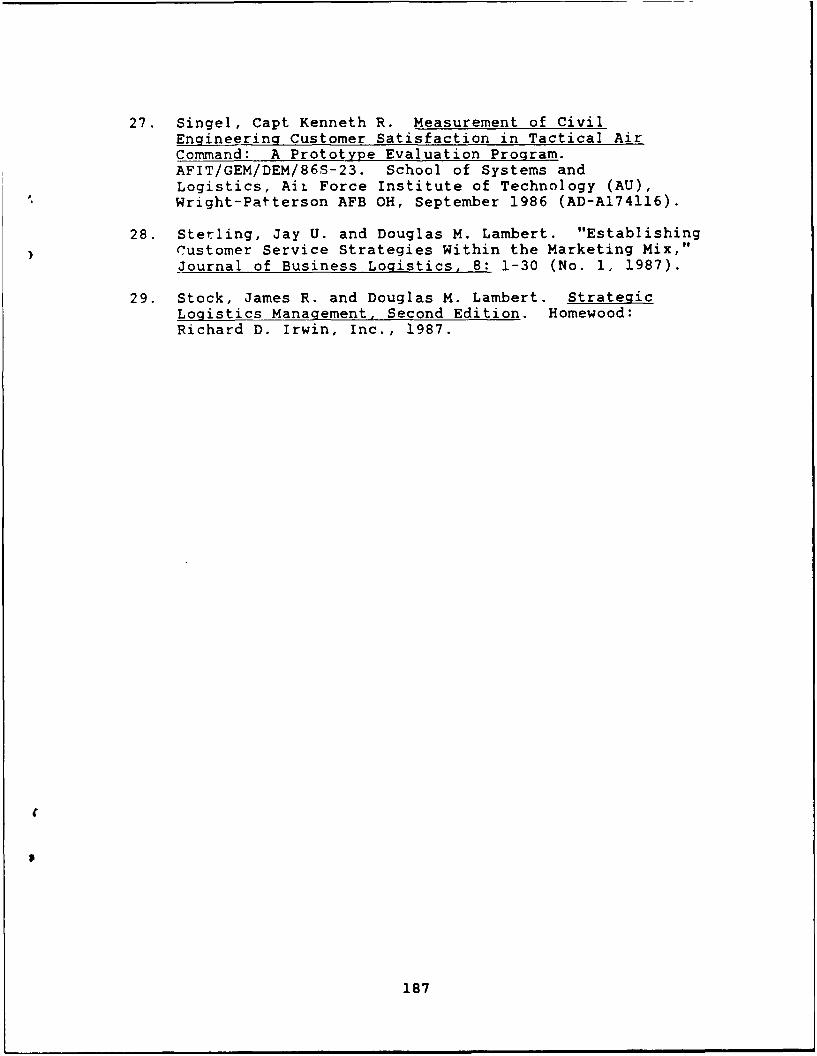
27. Singel, Capt Kenneth R. Measurement of CivilEngineering Customer Satisfaction in Tactical AirCommand: A Prototype Evaluation Program.AFIT/GEM/DEM/86S-23. School of Systems andLogistics, Ait Force Institute of Technology (AU),Wright-Patterson AFB OH, September 1986 (AD-A174116).
28. Sterling, Jay U. and Douglas M. Lambert. "EstablishingCustomer Service Strategies Within the Marketing Mix,"Journal of Business Logistics, 8: 1-30 (No. 1, 1987).
29. Stock, James R. and Douglas M. Lambert. StrategicLogistics Management, Second Edition. Homewood:Richard D. Irwin, Inc., 1987.
187
VITA
Captain Esperanza Flores _
lived in Mexico until 1968 when she
came to the United States. She graduated from high school
in Los Angeles, California in 1971 and attended the
University of Pennsylvania, where she received the Bachelor
of Science in Economics in 1974. She enlisted in the Air
Force the following year and served for three years at
Mountain Home AFB, Idaho; two years at Iraklion AS, Crete;
and 2 years at Travis AFB, California. She became a United
States citizen and obtained a commission in the USAF through
Officer Training School (OTS) in 1984. She served for two
years at Fairchild AFB, Washington as the Munitions
Accountable Supply Officer in the 92nd Munitions Maintenance
Squadron. She then transferred to the 501st Supply
Squadron, RAF Greenham Common, England. Over a period of
nearly three years she served as Chief, Materiel Management
Branch; Chief, Operations Support Branch; and chief
coordinator for all resupply operations in support of the
Ground Launched Cruise Missile (GLCM). In May 1989 she
entered the School of Systems and Logistics, Air Force
Institute of Technology.
188

REPORT DOCUMENTATION PAGE Form oveod07
Pbc reoof'iq burden 'or thus coleclon, of ifforiatioi '1 estimated to oerg ho Dfr r e.bor. f, including the time for rewwng , OuoL a ng existin data o esrs.gai r nd,'. maintaining the data needed, and Cofletng aond'evuewmn the Collection of information. end commnts regarding t is rftn estimate or im, otler aspec at Mcollectioni of informiation. including suggestion% for reducing this burden, to Washington 040adquarters Swrv.ca. Oirectorale for Inlprination Operaxtic., a" Repor. 121S jeonDavSi4Hghwgri. Suite 1204. Arlingon. VA 22202-4302. and to the Office of Manaqen-ert and Sudget. Paprwork Reduction Pro t (0704016). Washinton. C 205SO3.
1. AGENCY USE ONLY (Leave blank) 2. REPORT DATE 3. REPORT TYPE AND DATES COVERED1September 1990 Master's Thesis
4. TITLE AND SUBTITLE S. FUNDING NUMBERS
CUSTOMER SERVICE ANALYSIS OF TACTICAL AIR COMMAND
BASE LEVEL SUPPLY SUPPORT
6. AUTHOIR(S)
Esperanza Flores, Captain, USAF
7. PERFORMING ORGANIZATION NAME(S) AND ADDRESS(ES) 8. PERFORMING ORGANIZATIONREPORT NUMBER
Air Force Institute of Technology, WPAFB OH 45433-6583 AFIT/GLM/LSM/90S-17
3. SPONSORING /MONITORING AGENCY NAME(S) AND ADDRESS(ES) 10. SPONSORING/ MONITORING
AGENCY REPORT NUMBER
HQ TAC/LGS
LANGLEY AFB, VA 23665
11. SUPPLEMENTARY NOTES
12a. DISTRIBUTION/AVAILABILITY STATEMENT 12b. DISTRIBUTION CODE
Approved for public release; distribution unlimited
13. ABSTRACT (Maximum 200 words)
The general purpose of this study was to evaluate the perceptions oft ) Base Supply major custoiers.
The research had five major objectives: 1) identify the service criteria important to the major
custcmers of TAC Base Supply; 2) identify their perceptions of Base Supply performance; 3) measurethe range of variation between customer segments; 4) identify opportunities available to Base Supplyfor improving custcmer satisfaction; and 5) provide a benchnark for future evaluations of Base Supplycustamer satisfaction. The research methodology developed to meet the research objectives 'as based onthat used by the leading experts in the field of customer service. The research identified a total of 20criteria rated as very important to TAC supply major custamers. In addition, the findings suggestedthat the majority of major customers perceived significant shortfalls in Base Supply Support. Theidentification of important criteria and the evaluation of perceptions of performance highlightedthe opportunities available to TAC Base Supply for improving customer service satisfaction of itsmajor customer base. This study provided additional evidence of the importance of customer service,and it provided a benchmark for evaluating Base Supply customer satisfaction.
14. SUBJECT TERMS 15. NUMBER OF PAGES
Supply; Customer Service; Customer Satisfaction; Social i.PRmE CODESciences.
17. SECURITY CLASSIFICATION 16. SECURITY CLASSIFICATION 19. SECURITY CLASSIFICATION 20. UMITATION OF ABSTRACTOF REPORTj OF THIS PAGE OF ABSTRACT
Unclassified Unclassified Unclassified UL
NSN 7S40-01-280-5500 Standard Form 298 (Rev 2-89)Pecribed I ANSi StW Z39l-1


![It'l -f: ( * ) : ßJ4km : 30B 169 TEL 432-1 b Chu [Pfi] 72](https://img.pdfslide.us/doc/110x75/61fb48d94d51b449411dc36d/itl-f-j4km-30b-169-tel-432-1-b-chu-pfi-72-.jpg)