Embed Size (px)
Citation preview
97
A n n u a l W h e a t N e w s l e t t e r V o l. 5 1.
ITEMS FROM ROMANIA
AGRICULTURAL RESEARCH & DEVELOPMENT STATION — S.C.D.A.3350, Turda, Agriculturii Street, 27, Jud. Cluj, Romania.
Assessment of winter wheat cultivars for resistance to Fusarium head blight.
V. Moldovan, Maria Moldovan, and Rozalia Kadar.
Fusarium head blight or scab is a fungus disease that has become of increasing concern in most of wheat-growing areas.Yield losses from FHB are due to sterility of the florets and formation of shriveled kernels with light test-weight. FHB-infected grains may be downgraded by the market. The disease not only causes yield and quality losses, but also may beassociated with mycotoxins that are dangerous for human or animals health.
Disease incidence is related to wet and warm weather at flowering. Loose smut is seedborne and, therefore,widely distributed. Seed treatment with fungicide and certification of subsequent seed generations should ensure lowincidence of this disease. However, FHB occurs frequently in humid wheat-growing regions such as Transylvania inRomania. Damaging levels of disease occur about one year in ten. Although, a certain degree of control can be achievedby cultural practice and using fungicides, growing resistant cultivars is the most practicable and effective means ofreducing disease incidence. Evidence suggests that the current cultivars available to growers are more or less suscep-tible. FHB resistance is a trait that is subject to a large ‘genotype x environment’ interaction. Screening data based onnaturally infected nurseries is notoriously unreliable because of spatial and temporal heterogeneity leading to substantialvariation in the relative resistance status of genotypes.
We wanted to assess the FHB-resistance status of adapted cultivars currently grown in the Transylvanian region(Table 1). These cultivars were tested at ARDS–Turda under artificial inoculation in a field nursery over two growingseason (2001 and 2003). The cultivars were included in the Fusarium-screening nursery, where each entry consists of 2rows, 1-m rows with 25 cm between rows. Inoculation was made with local ecotypes of F. graminearum. Isolates wereobtained by culturing naturally infected wheat grains. Following purification and assessment for aggressiveness, highlyaggressive isolates were increased on liquid Czapek-Dox medium. The isolates were cultured for 7 days under continu-ous aeration from an aquarium pump through a sterile filter. After 7 days, the liquid media containing a mixture ofconidia and mycelia was homogenized by a mixer and adjusted with distilled water to approximately 50,000 spores/ml.For point inoculation, ten heads/plot (cultivar) were chosen at anthesis and 0.5 ml of inoculum was injected by a medicalsyringe directly through the glumes into a central floret of two spikelets at the middle of the spike (one on each side).The inoculated spikes were marked with colored clips. Disease progresses up and down from the central infectedspikelets and may infect up to all spikelets in a spike when weather conditions are favorable and the genotype is suscep-tible to FHB.
Disease severity was assessed in the point-inoculation treatment (marked heads) by counting the number ofvisually diseased spikelets 10 and 20 days after inoculation in relation to the total number of spikelets of the respectivehead. The result was percent infected spikelets. The results of observations were used to compute AUDPC for eachcultivar in each of the 2 years. AUDPC was calculated according to the function: n-1
AUDPC = ΣΣΣΣΣ [(yi + y
i+1)/2](t
i+1 - t
i);
iin which n is the number of assessment times (minimum 2), y is the disease measurement, and t is the time (days) frominoculation.
98
A n n u a l W h e a t N e w s l e t t e r V o l. 5 1.
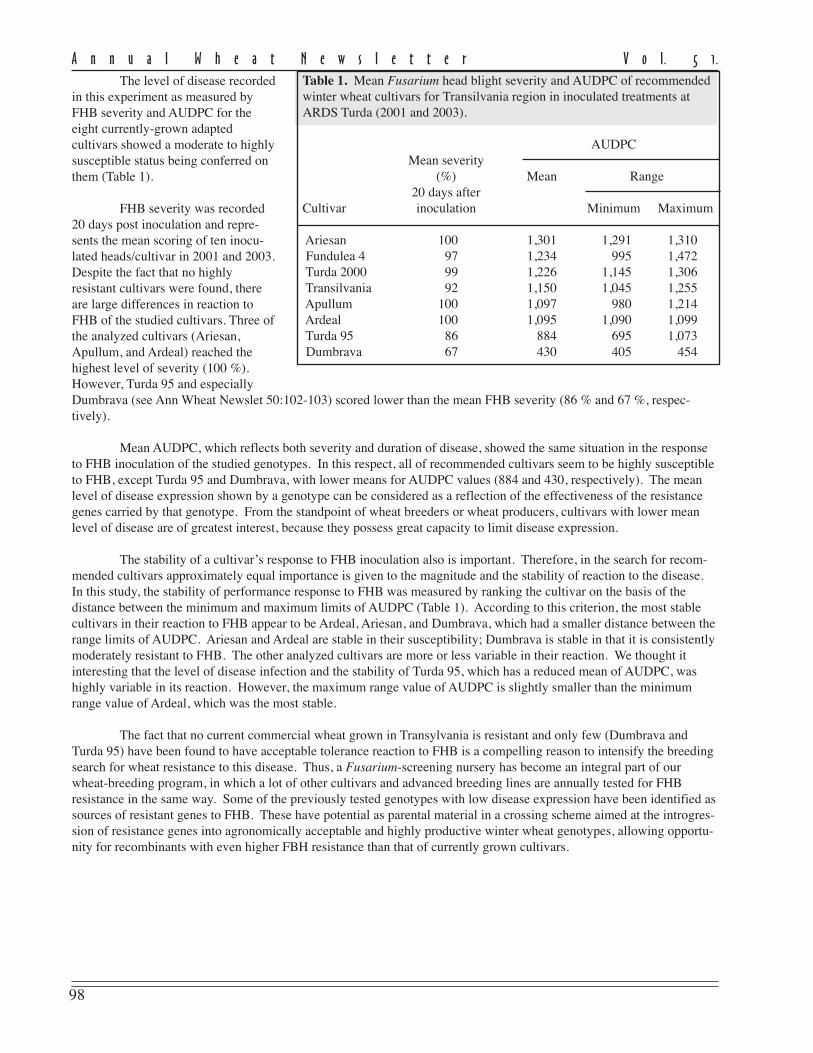
The level of disease recordedin this experiment as measured byFHB severity and AUDPC for theeight currently-grown adaptedcultivars showed a moderate to highlysusceptible status being conferred onthem (Table 1).
FHB severity was recorded20 days post inoculation and repre-sents the mean scoring of ten inocu-lated heads/cultivar in 2001 and 2003.Despite the fact that no highlyresistant cultivars were found, thereare large differences in reaction toFHB of the studied cultivars. Three ofthe analyzed cultivars (Ariesan,Apullum, and Ardeal) reached thehighest level of severity (100 %).However, Turda 95 and especiallyDumbrava (see Ann Wheat Newslet 50:102-103) scored lower than the mean FHB severity (86 % and 67 %, respec-tively).
Mean AUDPC, which reflects both severity and duration of disease, showed the same situation in the responseto FHB inoculation of the studied genotypes. In this respect, all of recommended cultivars seem to be highly susceptibleto FHB, except Turda 95 and Dumbrava, with lower means for AUDPC values (884 and 430, respectively). The meanlevel of disease expression shown by a genotype can be considered as a reflection of the effectiveness of the resistancegenes carried by that genotype. From the standpoint of wheat breeders or wheat producers, cultivars with lower meanlevel of disease are of greatest interest, because they possess great capacity to limit disease expression.
The stability of a cultivar’s response to FHB inoculation also is important. Therefore, in the search for recom-mended cultivars approximately equal importance is given to the magnitude and the stability of reaction to the disease.In this study, the stability of performance response to FHB was measured by ranking the cultivar on the basis of thedistance between the minimum and maximum limits of AUDPC (Table 1). According to this criterion, the most stablecultivars in their reaction to FHB appear to be Ardeal, Ariesan, and Dumbrava, which had a smaller distance between therange limits of AUDPC. Ariesan and Ardeal are stable in their susceptibility; Dumbrava is stable in that it is consistentlymoderately resistant to FHB. The other analyzed cultivars are more or less variable in their reaction. We thought itinteresting that the level of disease infection and the stability of Turda 95, which has a reduced mean of AUDPC, washighly variable in its reaction. However, the maximum range value of AUDPC is slightly smaller than the minimumrange value of Ardeal, which was the most stable.
The fact that no current commercial wheat grown in Transylvania is resistant and only few (Dumbrava andTurda 95) have been found to have acceptable tolerance reaction to FHB is a compelling reason to intensify the breedingsearch for wheat resistance to this disease. Thus, a Fusarium-screening nursery has become an integral part of ourwheat-breeding program, in which a lot of other cultivars and advanced breeding lines are annually tested for FHBresistance in the same way. Some of the previously tested genotypes with low disease expression have been identified assources of resistant genes to FHB. These have potential as parental material in a crossing scheme aimed at the introgres-sion of resistance genes into agronomically acceptable and highly productive winter wheat genotypes, allowing opportu-nity for recombinants with even higher FBH resistance than that of currently grown cultivars.
Table 1. Mean Fusarium head blight severity and AUDPC of recommendedwinter wheat cultivars for Transilvania region in inoculated treatments atARDS Turda (2001 and 2003).
AUDPCMean severity
(%) Mean Range20 days after
Cultivar inoculation Minimum Maximum
Ariesan 100 1,301 1,291 1,310 Fundulea 4 97 1,234 995 1,472 Turda 2000 99 1,226 1,145 1,306 Transilvania 92 1,150 1,045 1,255 Apullum 100 1,097 980 1,214 Ardeal 100 1,095 1,090 1,099 Turda 95 86 884 695 1,073 Dumbrava 67 430 405 454
99
A n n u a l W h e a t N e w s l e t t e r V o l. 5 1.
ITEMS FROM THE RUSSIAN FEDERATION
AGRICULTURAL RESEARCH INSTITUTE OF THE CENTRAL REGION OF NON-CHENOZEM ZONE143026, Moscow region, Nemchinovka, Kalinina 1, Russian Federation.
Previously unknown genes of soft wheat.
V.G. Kyzlasov.
The author created new lines of soft spring wheat possessing unique features and properties (multipistillate andstamenless flowers and xenia-type caryopsis coloration) that have no analogs in world collections.
Plants with multipistillate flowers were selected (Kyzlasov 1996) from hybrid populations of a T. aestivum/Ag.glaucum cross. From two to five caryopses are formed in every flower of such wheat. The more caryopses formed in aflower, the smaller their size. The weight of the caryopsis in the lines with multipistillate flowers varies from 10 to 90mg. The share of caryopses formed in a flower decreases as the number of pistils increases. The selected lines hadmultipistillate flowers more often in years of drought. The progeny of these lines consistently formed three stamens in aflower. The multipistillate feature is a result of duplicate action of three recessive genes in homozygote: A A B B C C(monopistillate line) / a a b b c c (multipistillate line) › F
1 A a B b C c monopistillate line. Segregation in the F
2 is 63
monopistillate plants : 1 multipistillate plant. In subsequent generations, the segregation is monohybrid (3:1), dihybrid(15:1), and trihybrid (63:1).
Stamenless plants were found (Kyzlasov 1998) in matromorphic populations obtained by pollination of softspring wheat with pollen of spring barley. No barley-type plants were found among the progeny examined. The spikesthat form pistils instead of stamens are characterized by high degree of sterility of the pistillate sphere. Therefore,solitary caryopses are formed in these spikes after free windblown pollination. The absence of stamens in the flowers ismaintained in reproduction at the heterozygous level and is inherited as a recessive trait: a a b b c c (stamenless plant) /A A B B C C (staminate plant) › F
1 A a B b C c (staminate plant). Segregation in the F
2 is 63 staminate plants : 1
stamenless plant. The absence of stamens in the flowers is caused by the action of three recessive genes.
Among the progeny of stamenless plants, lines with fertile pollen and dark coloration of caryopses wereselected (Kyzlasov 2001). Such coloration is inherited in the dark-caryopsis / light-caryopsis hybrids as a xenia-typefeature. The peculiarity of this segregation is the fact that caryopses of different colors are formed within one spike of anF
1-hybrid plant. Such caryopsis formation has never been observed previously in any known wheat. The xenia-type
inheritance, which was observed in caryopsis coloration, also was found in 1,000-kernel weight. A separate sampling ofdifferently colored caryopses from the same spike (Kyzlasov 2003) showed that the colored caryopses were heavier by10–12 % than the colorless ones. After pollination by a dark caryopsis wheat, dark-colored caryopses formed in theflowers of maternal light-caryopsis lines. The weight of these hybrid caryopses also is higher than that of the lightcaryopsis, self-pollinated maternal plants. Among the F
1 plants, segregation by caryopsis color is 9 dark-colored
caryopses : 7 light-colored. Dark coloration of caryopses appears in the phenotype as a result of complementary interac-tion of two hypostatic genes. In populations of the second and subsequent generations, dark-colored caryopses isinherited as monohybrid (3:1) or dihybrid (9:7). The dark-colored caryopses differ from normal by enhanced resistanceto germination in the spike under damp conditions.
This research has revealed expression of three recessive genes of multipistillate flowers, three recessive genesof stamenless flowers, and two hypostatic genes of xenia-type caryopsis coloration in the phenotype of soft wheat.
References.Kyzlasov VG. 1996. The phenomenon of multipistillity of wheat flowers. In: Abstr 5th Internat Wheat Conf, Ankara,
Turkey, p. 430.
100
A n n u a l W h e a t N e w s l e t t e r V o l. 5 1.
Kyzlasov VG. 1998. Wheat flowers of one sex. In: Proc 9th Internat Wheat Genetics Symp (Slinkard AE ed). Univer-sity Extension Press, Saskatoon, Saskatchewan, Canada. 2:269-.
Kyzlasov VG. 2001. Genes controlling xenia development of the caryopsis in soft wheat. Ann Wheat Newslet 47:142.Kyzlasov VG. 2003. Genetic linkage between endosperm color and caryopsis size in soft wheat hybrids. Ann Wheat
Newslet 49:95-96.
Apomictic development of seed in embryos of rye, soft wheat, and triticale.
V.G. Kyzlasov.
A single specimen of R-1 winter rye was found when planting the soft winter wheat W-1. Five hundred flowers of thisplant were emasculated and pollinated by the pollen of soft winter wheat. Seed set was 38 (7.6 % of the number ofpollinated flowers). The F
1 seed was sown in the autumn. All the plants overwintered successfully. No hybrid plants
were found in the progeny. All the plants were matromorphic diploids (2n = 14) of rye. No depression, like that ob-served in rye inbreeding, was detected in the plants. Upon flowering, 1,000 flowers were emasculated and againpollinated with winter wheat. Sixty-nine caryopses formed in the pollinated flowers (6.9 % of the number of pollinatedflowers).
The seed obtained after the second pollination by winter wheat were sown in a greenhouse. At flowering, allthe plants appeared to be matromorphic progeny of rye. The results of two pervious years of field experiments wereexactly the same. The matromorphic plants of R-1 winter rye may be reproduced by means of pollination of theirflowers by wheat pollen. No caryopses form in R-1 winter rye when emasculated and kept from pollination. In case ofinbreeding, the percentage of seed set is 0–5 %. Thus, the genes of self-incompatibility in matromorphic progeny of R-1 rye function properly.
The diploid (2n = 14), matromorphic plants of R-1 winter rye created by the method described above differ by culmlength (70–160 cm), 1,000-kernel weight (23–33 g), flowering period (1–20 days), and seed shape. The obtainedprogeny indicate that the original R-1 rye plant was heterozygous. The mechanism of origin and embryonic develop-ment of matromorphic progenies still needs to be investigated. Embryos were formed without pollination; possiblyoriginating from haploid cells of embryo sac after their fusion with one another or after diploidization. In the case ofapomictic development of seed embryos, the caryopsis endosperm may be of hybrid origin (2n = 14 chromosomes of rye+ 1n = 21 chromosomes of wheat). Apparently, somatogamy is manifested in this case.
Matromorphic plants also were discovered after pollinating of R-1 rye with triticale pollen. The fact thatmatromorphic plants arise after pollinating of soft wheat and triticale by R-1 rye pollen is of interest for breeding. Wenext emasculated 520 flowers of F
1 soft wheat hybrids and pollinated them with R-1 rye pollen. Forty-one caryopses
were obtained (7.9 % of the number of pollinated flowers). All the plants grown from these seeds were diploid (2n =42). The F
2 hybrid families reproduced after pollinating of F
1 hybrids by R-1 rye pollen did not segregate. This fact
indicates that they may be dihaploids. We need to investigate the fertilization and embryogenesis processes of soft wheatand triticale after pollinating of their flowers by R-1 winter rye pollen.
Cytological analysis of pollen grains of several R-1 rye plants showed that they have adequate nutrient reserves.However, vegetative nuclei and sperm are missing in most. Only some plants possess one, or occasionally two, sperm.Viable pollen grains (a vegetative nucleus + two sperms) are nearly absent. In further investigations, more detailedstudying of the anatomic peculiarities of R-1 rye pollen grains is planned.
Apomictic development of embryos in soft wheat and triticale is caused by pollination of the castrated flowerswith R-1 rye pollen. Matromorphic R-1 rye plants appear after pollination of the flowers by soft wheat or triticalepollen. Investigations aimed at enhancing the technology for reproducing soft wheat, rye, and triticale matromorphicplants will continue. Identifying the genetic factors determining formation of embryos without pollination is still aproblem. The regularities of embryo and endosperm formation during the process of embryonic development of thematromorphic plants is needed. Our process for obtaining matromorphic plants may eventually be applied for creatingsoft wheat and triticale lines that are homozygous for all the genes. In rye breeding, this technology may be applied forselection of lines with a high combining ability.
101
A n n u a l W h e a t N e w s l e t t e r V o l. 5 1.
Induction of doubled haploids in common wheat and its hybrids.
S.V. Klitsov and G.M. Artemeva.
We continued our long-term effort to development genetic stable homozygote material for wheat improvement in 2002–04. Our objective is to produce dihaploids of spring and winter wheat and its hybrids with Ae. speltoides and Agropironerectus. The 49 accessions include 30 F
1 of spring wheat, 15 F
1 of winter wheat, three hybrids with Ae. speltoides, and a
hybrid with Agropyron. We obtained DH lines by two methods. We started to use the ‘wheat/maize’ DH system in 2002.Emasculated wheat and hybrid heads were hand-pollinated with mature maize pollen. Embryos were excised 12–14days after pollination and cultured in tubes containing nutrient agar medium B5. The resulting seedlings were immersedin a 0.1 % colchicine solution, rinsed, and transplanted into pots with soil in greenhouse. This process was repeated in2003–04 with eight accessories. We also use anther and microspore culture technique for DH production. Wheat andhybrid anthers were isolated and immersed in a PII nutrient-agar medium for 20–30 days. Embryo-like structures weretransplanted onto 192 medium with 0.5 mg/l kinetin. The resulting plantlets were then immersed in a 0.1 % colchicinesolution, rinsed, and transplanted in pots in the greenhouse. These experiences were repeated in 2003–04. In total, weobtained four dihaploid lines by in vitro culture and 102 DH lines using the ‘wheat/maize’ DH system. We are nowtesting all our dihaploid lines in field plots.
AGRICULTURAL RESEARCH INSTITUTE FOR THE SOUTH-EAST REGIONS—ARISERDepartment of Genetics, 7 Toulaikov St., Saratov, 410020, Russian Federation.
High-yielding biotype of spring durum wheat cultivar Valentina.
N.S. Vassiltchouk, S.N. Gaponov, V.M. Popova, Yu.V. Italianskaya, S.V. Tuchin, and E.E. Khudoshina.
Protein markers are a simple and reliable way to identify crop plant genotypes that are some times difficult to distinguishby morphological or other characteristics. In wheat-breeding programs, the analysis of gliadin proteins make it possibletheoretically to distinguish up to 20 millions genotypes. Moreover, the quest for new protein markers linked to usefultraits is of great interest, because these proteins may be used in improving cultivars for desirable properties, especially inearly generation screening. We have analyzed the gliadin electrophoretic spectra of the spring durum wheat cultivarValentina, which was released for use in 1998. This cultivar was selected from the cross ‘Saratovskaya 59/Leukurum1897 (S
3F
6)//D-1973/Saratovskaya zolotistaya’. Valentina inherited the best characteristics of Saratov spring durum
wheat genotypes; increased resistance to loose smut and barley yellow dwarf virus, lodging and drought resistance, earlymaturity, high grain quality, and high yield capacity (3.1–3.4 t/ha).
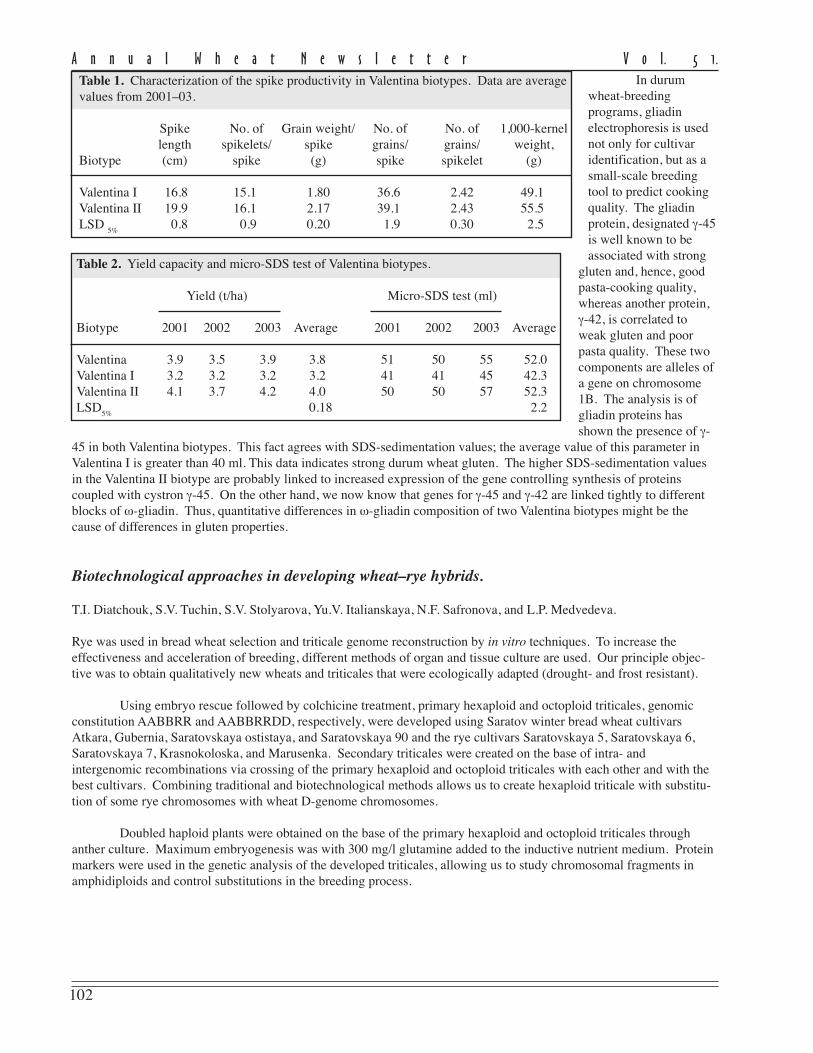
Gliadin proteins were extracted with 70 % ethanol from distal half of the seed and fractionated by PAGE usingaluminium lactate buffer (pH 3.1). Although Valentina is homogenous for morphological characters, it is polymorphicfor biotypes (designated Valentina I and Valentina II) occurring in a ratio of approximately 1:1. These biotypes differfrom one another in gliadin components of α- and ω-zones that are controlled by genes on chromosomes 6A and 1B,respectively. The embryo half of the seeds were used for propagation and seed production during the 2 years. Bothbiotypes were estimated for morphological and useful traits for 3 years, using plots 2.4 m2 (4x multiplication). Plants ofboth biotypes did not differ for morphological characters but were considerably different in head-producing capacity(Table 1, p. 102).
The data revealed that the increase in all Valentina II indices influenced head productivity compared withbiotype I. As a result, grain yield in biotype II considerably exceeded that of Valentina I and the parental cultivar in allyears tested (Table 2, p.102). Biotype II has been revealed to have stronger gluten (according to higher index of SDS-sedimentation) that of biotype I (Table 2, p. 102).
102
A n n u a l W h e a t N e w s l e t t e r V o l. 5 1.
In durumwheat-breedingprograms, gliadinelectrophoresis is usednot only for cultivaridentification, but as asmall-scale breedingtool to predict cookingquality. The gliadinprotein, designated γ-45is well known to beassociated with strong
gluten and, hence, goodpasta-cooking quality,whereas another protein,γ-42, is correlated toweak gluten and poorpasta quality. These twocomponents are alleles ofa gene on chromosome1B. The analysis is ofgliadin proteins hasshown the presence of γ-
45 in both Valentina biotypes. This fact agrees with SDS-sedimentation values; the average value of this parameter inValentina I is greater than 40 ml. This data indicates strong durum wheat gluten. The higher SDS-sedimentation valuesin the Valentina II biotype are probably linked to increased expression of the gene controlling synthesis of proteinscoupled with cystron γ-45. On the other hand, we now know that genes for γ-45 and γ-42 are linked tightly to differentblocks of ω-gliadin. Thus, quantitative differences in ω-gliadin composition of two Valentina biotypes might be thecause of differences in gluten properties.
Biotechnological approaches in developing wheat–rye hybrids.
T.I. Diatchouk, S.V. Tuchin, S.V. Stolyarova, Yu.V. Italianskaya, N.F. Safronova, and L.P. Medvedeva.
Rye was used in bread wheat selection and triticale genome reconstruction by in vitro techniques. To increase theeffectiveness and acceleration of breeding, different methods of organ and tissue culture are used. Our principle objec-tive was to obtain qualitatively new wheats and triticales that were ecologically adapted (drought- and frost resistant).
Using embryo rescue followed by colchicine treatment, primary hexaploid and octoploid triticales, genomicconstitution AABBRR and AABBRRDD, respectively, were developed using Saratov winter bread wheat cultivarsAtkara, Gubernia, Saratovskaya ostistaya, and Saratovskaya 90 and the rye cultivars Saratovskaya 5, Saratovskaya 6,Saratovskaya 7, Krasnokoloska, and Marusenka. Secondary triticales were created on the base of intra- andintergenomic recombinations via crossing of the primary hexaploid and octoploid triticales with each other and with thebest cultivars. Combining traditional and biotechnological methods allows us to create hexaploid triticale with substitu-tion of some rye chromosomes with wheat D-genome chromosomes.
Doubled haploid plants were obtained on the base of the primary hexaploid and octoploid triticales throughanther culture. Maximum embryogenesis was with 300 mg/l glutamine added to the inductive nutrient medium. Proteinmarkers were used in the genetic analysis of the developed triticales, allowing us to study chromosomal fragments inamphidiploids and control substitutions in the breeding process.
Table 1. Characterization of the spike productivity in Valentina biotypes. Data are averagevalues from 2001–03.
Spike No. of Grain weight/ No. of No. of 1,000-kernellength spikelets/ spike grains/ grains/ weight,
Biotype (cm) spike (g) spike spikelet (g)
Valentina I 16.8 15.1 1.80 36.6 2.42 49.1Valentina II 19.9 16.1 2.17 39.1 2.43 55.5LSD
5%0.8 0.9 0.20 1.9 0.30 2.5
Table 2. Yield capacity and micro-SDS test of Valentina biotypes.
Yield (t/ha) Micro-SDS test (ml)
Biotype 2001 2002 2003 Average 2001 2002 2003 Average
Valentina 3.9 3.5 3.9 3.8 51 50 55 52.0Valentina I 3.2 3.2 3.2 3.2 41 41 45 42.3Valentina II 4.1 3.7 4.2 4.0 50 50 57 52.3LSD
5%0.18 2.2
103
A n n u a l W h e a t N e w s l e t t e r V o l. 5 1.
Genetic and cytogenetic research of new spring bread wheat–Ae. speltoides lines.
S.N. Sibikeev and S.A. Voronina, and E.D. Badaeva (Vavilov Institute of General Genetics, Gubkina St.,3, Moscow).
The gene pool of Ae. speltoides is very useful for bread wheat breeding for resistance to leaf rust. At present, thefollowing Lr-genes have been identified: Lr28 (T4AS·4AL-7S#2S), Lr35 (2B), Lr36 (6BS), Lr47 (Ti7AS-7S#1S-7AS·7AL, T7AS-7S#1S·7S#1L, and Ti7AS·7AL-7S#1L-7AL), and Lr51 (T1AS·1AL-1S#F7-12L-1AL and T1BS·1BL-1S#F7L-1BL).
At ARISER, the bread wheat–Ae. speltoides lines were kindly provided by Dr. Odintsova (N.I. Vavilov Re-search Institute of Plant Industry, St. Petersburg). The Lr gene(s) of bread wheat–Ae. speltoides lines are highly effectiveto the Saratov population of P. triticina, IT = 0, 0;. These lines have a strong ‘cuckoo’ effect. We crossed these lineswere with Saratov-bred cultivars and lines of bread wheat. After crosses with cultivars L503 and Dobrynya, the cuckooeffect significantly decreased. In segregating F
2 populations of these hybrids for resistance to leaf rust, susceptible plants
were observed. Thus, the cultivars L503 and Dobrynya have gene(s) for suppression of gametocidal activity. The C-banding pattern of these lines showed the translocation T2D-2S. We confirmed the presence of the translocation bymeiotic analyses of the F
1 hybrids between bread wheat-Ae. speltoides lines and the leaf rust-susceptible cultivar
Saratovskaya 29. In the majority of PMCs, we detected 21 bivalents but observed univalents, trivalents, andquadrivalents in a few PMCs. The identification of Lr gene(s) in bread wheat–Ae. speltoides lines will be provided in2005.
The effects of alien Lr-gene combinations.
S.N. Sibikeev, M.R. Abdryev, V.A. Krupnov, S.A. Voronina, O.V. Krupnova, and A.E. Druzhin.
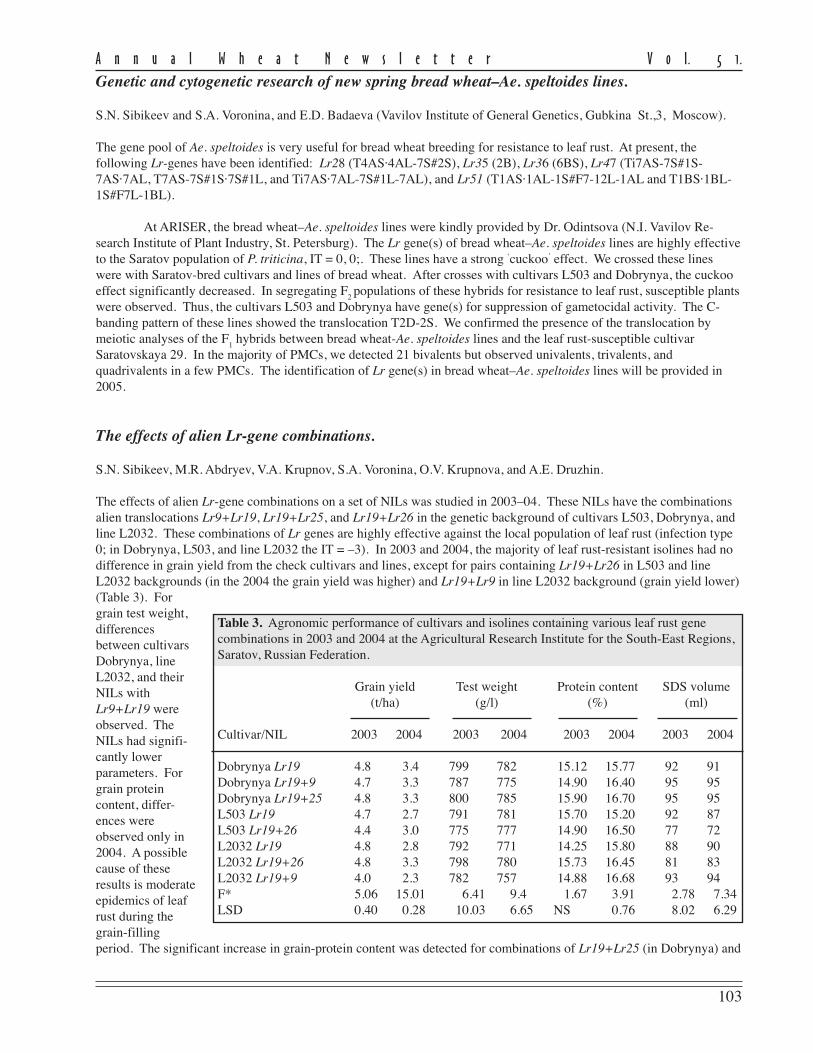
The effects of alien Lr-gene combinations on a set of NILs was studied in 2003–04. These NILs have the combinationsalien translocations Lr9+Lr19, Lr19+Lr25, and Lr19+Lr26 in the genetic background of cultivars L503, Dobrynya, andline L2032. These combinations of Lr genes are highly effective against the local population of leaf rust (infection type0; in Dobrynya, L503, and line L2032 the IT = –3). In 2003 and 2004, the majority of leaf rust-resistant isolines had nodifference in grain yield from the check cultivars and lines, except for pairs containing Lr19+Lr26 in L503 and lineL2032 backgrounds (in the 2004 the grain yield was higher) and Lr19+Lr9 in line L2032 background (grain yield lower)(Table 3). Forgrain test weight,differencesbetween cultivarsDobrynya, lineL2032, and theirNILs withLr9+Lr19 wereobserved. TheNILs had signifi-cantly lowerparameters. Forgrain proteincontent, differ-ences wereobserved only in2004. A possiblecause of theseresults is moderateepidemics of leafrust during thegrain-fillingperiod. The significant increase in grain-protein content was detected for combinations of Lr19+Lr25 (in Dobrynya) and
Table 3. Agronomic performance of cultivars and isolines containing various leaf rust genecombinations in 2003 and 2004 at the Agricultural Research Institute for the South-East Regions,Saratov, Russian Federation.
Grain yield Test weight Protein content SDS volume(t/ha) (g/l) (%) (ml)
Cultivar/NIL 2003 2004 2003 2004 2003 2004 2003 2004
Dobrynya Lr19 4.8 3.4 799 782 15.12 15.77 92 91Dobrynya Lr19+9 4.7 3.3 787 775 14.90 16.40 95 95Dobrynya Lr19+25 4.8 3.3 800 785 15.90 16.70 95 95L503 Lr19 4.7 2.7 791 781 15.70 15.20 92 87L503 Lr19+26 4.4 3.0 775 777 14.90 16.50 77 72L2032 Lr19 4.8 2.8 792 771 14.25 15.80 88 90L2032 Lr19+26 4.8 3.3 798 780 15.73 16.45 81 83L2032 Lr19+9 4.0 2.3 782 757 14.88 16.68 93 94F* 5.06 15.01 6.41 9.4 1.67 3.91 2.78 7.34LSD 0.40 0.28 10.03 6.65 NS 0.76 8.02 6.29
104
A n n u a l W h e a t N e w s l e t t e r V o l. 5 1.
Lr19+Lr26 (in L503). For grain quality, the differences for SDS volume was obtained only between cultivars L503 andL2032 and NILs with of Lr19+Lr26.
Intraracial structure and variability in virulence to Ustilago tritici.
A.E. Druzhin, V.A. Krupnov, T.D. Golubeva, and T.V. Kalintseva.
The severity of susceptibility to loose smut in bread wheat cultivars depends on many factors, including the pathogenic-ity of the inoculum. We inoculated a set of bread wheat cultivars and lines with race 23 of Ustilago tritici for a period of5 years and noted that the pathogenic reaction varied in highly susceptible cultivars, despite of optimum conditions forpathogen development.
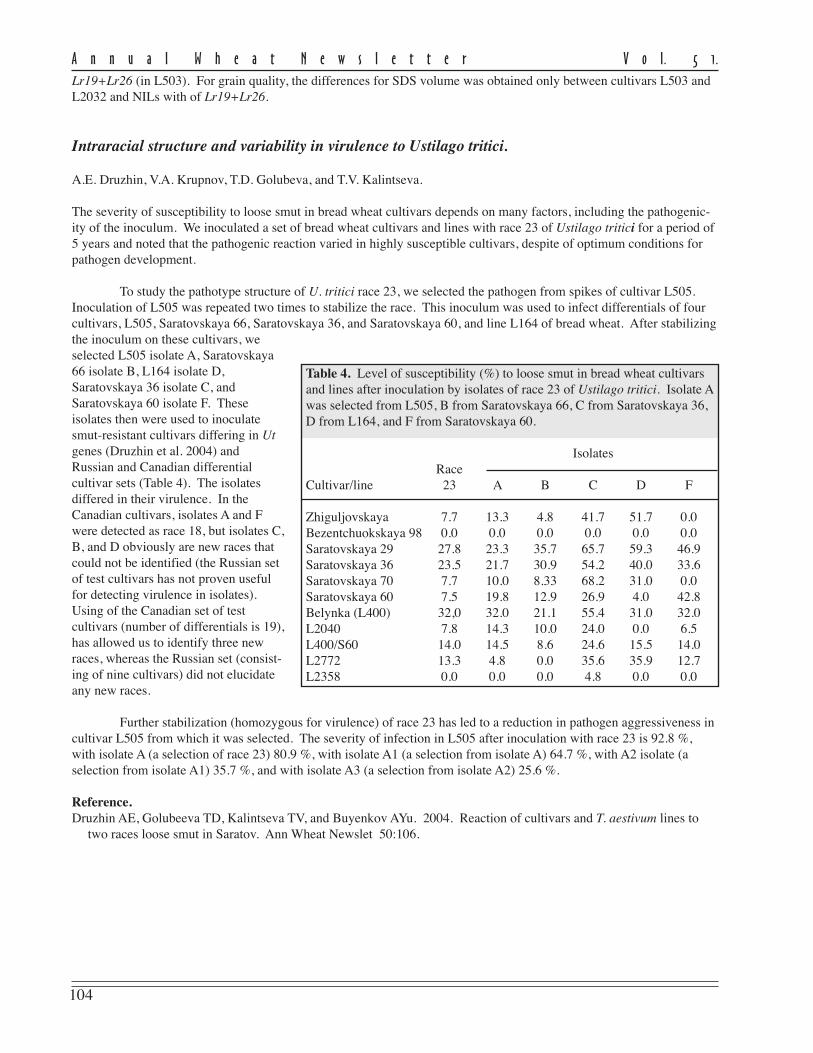
To study the pathotype structure of U. tritici race 23, we selected the pathogen from spikes of cultivar L505.Inoculation of L505 was repeated two times to stabilize the race. This inoculum was used to infect differentials of fourcultivars, L505, Saratovskaya 66, Saratovskaya 36, and Saratovskaya 60, and line L164 of bread wheat. After stabilizingthe inoculum on these cultivars, weselected L505 isolate A, Saratovskaya66 isolate B, L164 isolate D,Saratovskaya 36 isolate C, andSaratovskaya 60 isolate F. Theseisolates then were used to inoculatesmut-resistant cultivars differing in Utgenes (Druzhin et al. 2004) andRussian and Canadian differentialcultivar sets (Table 4). The isolatesdiffered in their virulence. In theCanadian cultivars, isolates A and Fwere detected as race 18, but isolates C,B, and D obviously are new races thatcould not be identified (the Russian setof test cultivars has not proven usefulfor detecting virulence in isolates).Using of the Canadian set of testcultivars (number of differentials is 19),has allowed us to identify three newraces, whereas the Russian set (consist-ing of nine cultivars) did not elucidateany new races.
Further stabilization (homozygous for virulence) of race 23 has led to a reduction in pathogen aggressiveness incultivar L505 from which it was selected. The severity of infection in L505 after inoculation with race 23 is 92.8 %,with isolate A (a selection of race 23) 80.9 %, with isolate A1 (a selection from isolate A) 64.7 %, with A2 isolate (aselection from isolate A1) 35.7 %, and with isolate A3 (a selection from isolate A2) 25.6 %.
Reference.Druzhin AE, Golubeeva TD, Kalintseva TV, and Buyenkov AYu. 2004. Reaction of cultivars and T. aestivum lines to
two races loose smut in Saratov. Ann Wheat Newslet 50:106.
Table 4. Level of susceptibility (%) to loose smut in bread wheat cultivarsand lines after inoculation by isolates of race 23 of Ustilago tritici. Isolate Awas selected from L505, B from Saratovskaya 66, C from Saratovskaya 36,D from L164, and F from Saratovskaya 60.
IsolatesRace
Cultivar/line 23 A B C D F
Zhiguljovskaya 7.7 13.3 4.8 41.7 51.7 0.0Bezentchuokskaya 98 0.0 0.0 0.0 0.0 0.0 0.0Saratovskaya 29 27.8 23.3 35.7 65.7 59.3 46.9Saratovskaya 36 23.5 21.7 30.9 54.2 40.0 33.6Saratovskaya 70 7.7 10.0 8.33 68.2 31.0 0.0Saratovskaya 60 7.5 19.8 12.9 26.9 4.0 42.8Belynka (L400) 32,0 32.0 21.1 55.4 31.0 32.0L2040 7.8 14.3 10.0 24.0 0.0 6.5L400/S60 14.0 14.5 8.6 24.6 15.5 14.0L2772 13.3 4.8 0.0 35.6 35.9 12.7L2358 0.0 0.0 0.0 4.8 0.0 0.0
105
A n n u a l W h e a t N e w s l e t t e r V o l. 5 1.
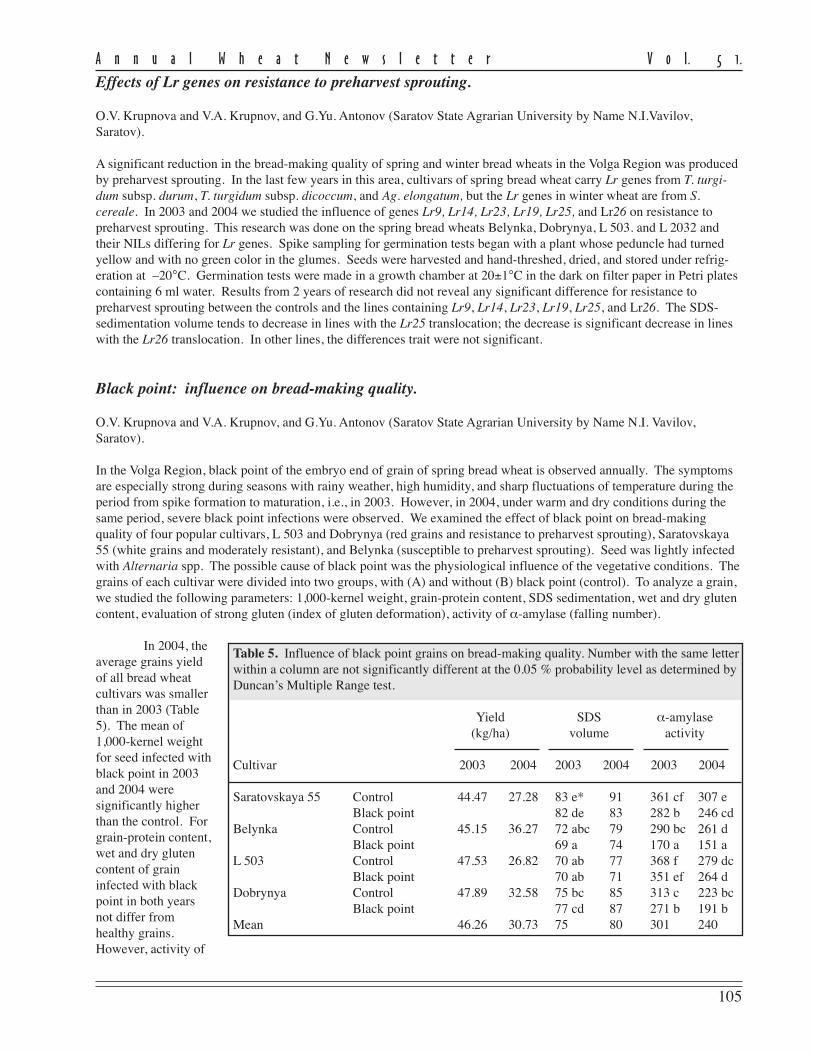
Effects of Lr genes on resistance to preharvest sprouting.
O.V. Krupnova and V.A. Krupnov, and G.Yu. Antonov (Saratov State Agrarian University by Name N.I.Vavilov,Saratov).
A significant reduction in the bread-making quality of spring and winter bread wheats in the Volga Region was producedby preharvest sprouting. In the last few years in this area, cultivars of spring bread wheat carry Lr genes from T. turgi-dum subsp. durum, T. turgidum subsp. dicoccum, and Ag. elongatum, but the Lr genes in winter wheat are from S.cereale. In 2003 and 2004 we studied the influence of genes Lr9, Lr14, Lr23, Lr19, Lr25, and Lr26 on resistance topreharvest sprouting. This research was done on the spring bread wheats Belynka, Dobrynya, L 503. and L 2032 andtheir NILs differing for Lr genes. Spike sampling for germination tests began with a plant whose peduncle had turnedyellow and with no green color in the glumes. Seeds were harvested and hand-threshed, dried, and stored under refrig-eration at –20°C. Germination tests were made in a growth chamber at 20±1°C in the dark on filter paper in Petri platescontaining 6 ml water. Results from 2 years of research did not reveal any significant difference for resistance topreharvest sprouting between the controls and the lines containing Lr9, Lr14, Lr23, Lr19, Lr25, and Lr26. The SDS-sedimentation volume tends to decrease in lines with the Lr25 translocation; the decrease is significant decrease in lineswith the Lr26 translocation. In other lines, the differences trait were not significant.
Black point: influence on bread-making quality.
O.V. Krupnova and V.A. Krupnov, and G.Yu. Antonov (Saratov State Agrarian University by Name N.I. Vavilov,Saratov).
In the Volga Region, black point of the embryo end of grain of spring bread wheat is observed annually. The symptomsare especially strong during seasons with rainy weather, high humidity, and sharp fluctuations of temperature during theperiod from spike formation to maturation, i.e., in 2003. However, in 2004, under warm and dry conditions during thesame period, severe black point infections were observed. We examined the effect of black point on bread-makingquality of four popular cultivars, L 503 and Dobrynya (red grains and resistance to preharvest sprouting), Saratovskaya55 (white grains and moderately resistant), and Belynka (susceptible to preharvest sprouting). Seed was lightly infectedwith Alternaria spp. The possible cause of black point was the physiological influence of the vegetative conditions. Thegrains of each cultivar were divided into two groups, with (A) and without (B) black point (control). To analyze a grain,we studied the following parameters: 1,000-kernel weight, grain-protein content, SDS sedimentation, wet and dry glutencontent, evaluation of strong gluten (index of gluten deformation), activity of α-amylase (falling number).
In 2004, theaverage grains yieldof all bread wheatcultivars was smallerthan in 2003 (Table5). The mean of1,000-kernel weightfor seed infected withblack point in 2003and 2004 weresignificantly higherthan the control. Forgrain-protein content,wet and dry glutencontent of graininfected with blackpoint in both yearsnot differ fromhealthy grains.However, activity of
Table 5. Influence of black point grains on bread-making quality. Number with the same letterwithin a column are not significantly different at the 0.05 % probability level as determined byDuncan’s Multiple Range test.
Yield SDS α-amylase(kg/ha) volume activity
Cultivar 2003 2004 2003 2004 2003 2004
Saratovskaya 55 Control 44.47 27.28 83 e* 91 361 cf 307 eBlack point 82 de 83 282 b 246 cd
Belynka Control 45.15 36.27 72 abc 79 290 bc 261 dBlack point 69 a 74 170 a 151 a
L 503 Control 47.53 26.82 70 ab 77 368 f 279 dcBlack point 70 ab 71 351 ef 264 d
Dobrynya Control 47.89 32.58 75 bc 85 313 c 223 bcBlack point 77 cd 87 271 b 191 b
Mean 46.26 30.73 75 80 301 240
106
A n n u a l W h e a t N e w s l e t t e r V o l. 5 1.
α-amylase in the black-pointed grains was significantly higher than the control, especial in the Saratovskaya 55 andBelynka. A similar tendency was seen after evaluation of SDS volume.
New, spring bread wheat cultivars for the Volga River region of the Russian Federation.
A.I. Kuzmenko, R.G. Saifullin, K.F. Guryanova, V.A. Danilova, T.K. Zotova, S.D. Davidov, G.A. Beketova, I.I.Grigoryeva, and O.V. Zubkova.
Wheat is a major cereal crop in Volga River region of the Russian Federation. Crop capacity fluctuates from 0.3 to 4.0 t/ha. The main stress factors are water deficiency, extremely high temperatures, fungal plant diseases, and pests. Thebreeding programs of ARISER aim to reduce abiotic and biotic stress influence on plant growth and increase yieldcapacity and grain quality. Plant breeders have been working these problems for the past 95 years.
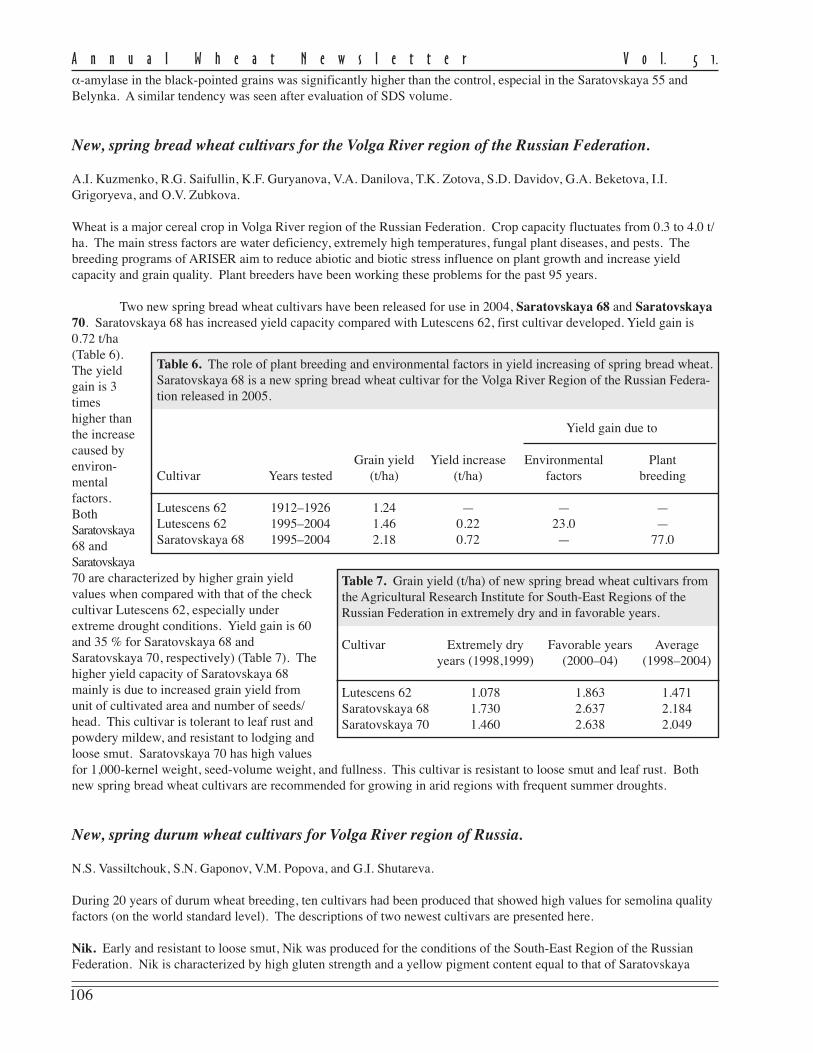
Two new spring bread wheat cultivars have been released for use in 2004, Saratovskaya 68 and Saratovskaya70. Saratovskaya 68 has increased yield capacity compared with Lutescens 62, first cultivar developed. Yield gain is0.72 t/ha(Table 6).The yieldgain is 3timeshigher thanthe increasecaused byenviron-mentalfactors.BothSaratovskaya68 andSaratovskaya70 are characterized by higher grain yieldvalues when compared with that of the checkcultivar Lutescens 62, especially underextreme drought conditions. Yield gain is 60and 35 % for Saratovskaya 68 andSaratovskaya 70, respectively) (Table 7). Thehigher yield capacity of Saratovskaya 68mainly is due to increased grain yield fromunit of cultivated area and number of seeds/head. This cultivar is tolerant to leaf rust andpowdery mildew, and resistant to lodging andloose smut. Saratovskaya 70 has high valuesfor 1,000-kernel weight, seed-volume weight, and fullness. This cultivar is resistant to loose smut and leaf rust. Bothnew spring bread wheat cultivars are recommended for growing in arid regions with frequent summer droughts.
New, spring durum wheat cultivars for Volga River region of Russia.
N.S. Vassiltchouk, S.N. Gaponov, V.M. Popova, and G.I. Shutareva.
During 20 years of durum wheat breeding, ten cultivars had been produced that showed high values for semolina qualityfactors (on the world standard level). The descriptions of two newest cultivars are presented here.
Nik. Early and resistant to loose smut, Nik was produced for the conditions of the South-East Region of the RussianFederation. Nik is characterized by high gluten strength and a yellow pigment content equal to that of Saratovskaya
Table 6. The role of plant breeding and environmental factors in yield increasing of spring bread wheat.Saratovskaya 68 is a new spring bread wheat cultivar for the Volga River Region of the Russian Federa-tion released in 2005.
Yield gain due to
Grain yield Yield increase Environmental PlantCultivar Years tested (t/ha) (t/ha) factors breeding
Lutescens 62 1912–1926 1.24 — — —Lutescens 62 1995–2004 1.46 0.22 23.0 —Saratovskaya 68 1995–2004 2.18 0.72 — 77.0
Table 7. Grain yield (t/ha) of new spring bread wheat cultivars fromthe Agricultural Research Institute for South-East Regions of theRussian Federation in extremely dry and in favorable years.
Cultivar Extremely dry Favorable years Averageyears (1998,1999) (2000–04) (1998–2004)
Lutescens 62 1.078 1.863 1.471Saratovskaya 68 1.730 2.637 2.184Saratovskaya 70 1.460 2.638 2.049
107
A n n u a l W h e a t N e w s l e t t e r V o l. 5 1.
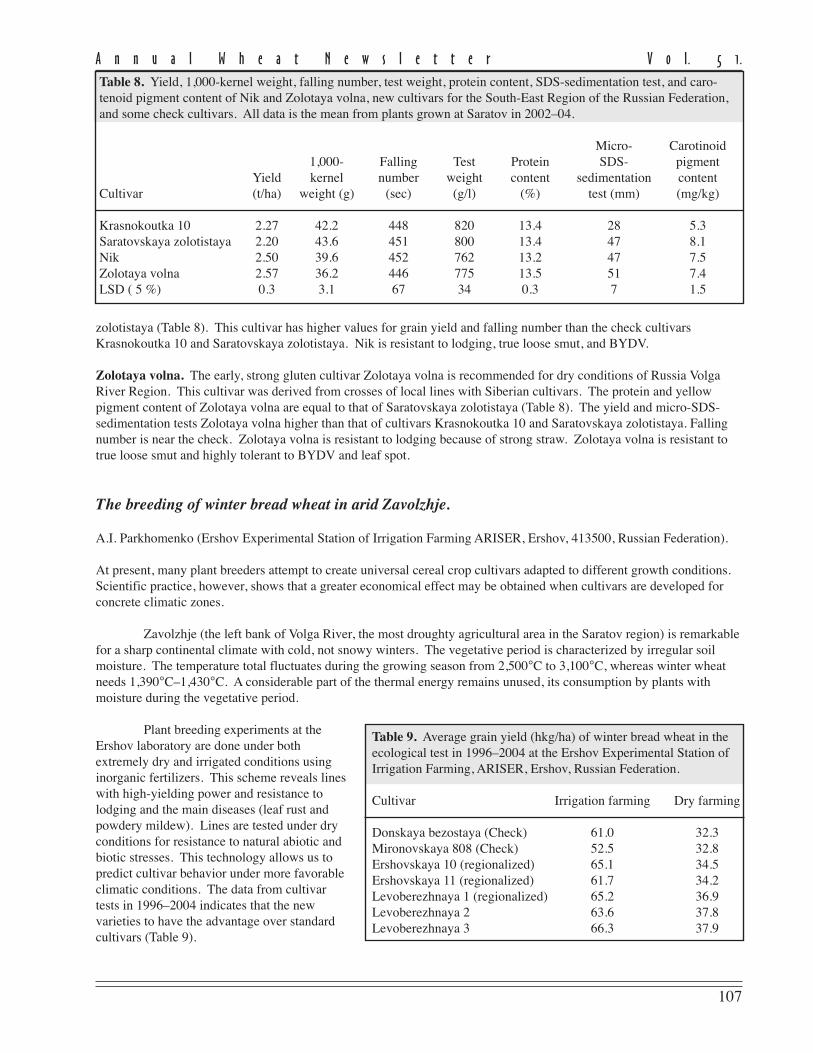
zolotistaya (Table 8). This cultivar has higher values for grain yield and falling number than the check cultivarsKrasnokoutka 10 and Saratovskaya zolotistaya. Nik is resistant to lodging, true loose smut, and BYDV.
Zolotaya volna. The early, strong gluten cultivar Zolotaya volna is recommended for dry conditions of Russia VolgaRiver Region. This cultivar was derived from crosses of local lines with Siberian cultivars. The protein and yellowpigment content of Zolotaya volna are equal to that of Saratovskaya zolotistaya (Table 8). The yield and micro-SDS-sedimentation tests Zolotaya volna higher than that of cultivars Krasnokoutka 10 and Saratovskaya zolotistaya. Fallingnumber is near the check. Zolotaya volna is resistant to lodging because of strong straw. Zolotaya volna is resistant totrue loose smut and highly tolerant to BYDV and leaf spot.
The breeding of winter bread wheat in arid Zavolzhje.
A.I. Parkhomenko (Ershov Experimental Station of Irrigation Farming ARISER, Ershov, 413500, Russian Federation).
At present, many plant breeders attempt to create universal cereal crop cultivars adapted to different growth conditions.Scientific practice, however, shows that a greater economical effect may be obtained when cultivars are developed forconcrete climatic zones.
Zavolzhje (the left bank of Volga River, the most droughty agricultural area in the Saratov region) is remarkablefor a sharp continental climate with cold, not snowy winters. The vegetative period is characterized by irregular soilmoisture. The temperature total fluctuates during the growing season from 2,500°C to 3,100°C, whereas winter wheatneeds 1,390°C–1,430°C. A considerable part of the thermal energy remains unused, its consumption by plants withmoisture during the vegetative period.
Plant breeding experiments at theErshov laboratory are done under bothextremely dry and irrigated conditions usinginorganic fertilizers. This scheme reveals lineswith high-yielding power and resistance tolodging and the main diseases (leaf rust andpowdery mildew). Lines are tested under dryconditions for resistance to natural abiotic andbiotic stresses. This technology allows us topredict cultivar behavior under more favorableclimatic conditions. The data from cultivartests in 1996–2004 indicates that the newvarieties to have the advantage over standardcultivars (Table 9).
Table 8. Yield, 1,000-kernel weight, falling number, test weight, protein content, SDS-sedimentation test, and caro-tenoid pigment content of Nik and Zolotaya volna, new cultivars for the South-East Region of the Russian Federation,and some check cultivars. All data is the mean from plants grown at Saratov in 2002–04.
Micro- Carotinoid1,000- Falling Test Protein SDS- pigment
Yield kernel number weight content sedimentation contentCultivar (t/ha) weight (g) (sec) (g/l) (%) test (mm) (mg/kg)
Krasnokoutka 10 2.27 42.2 448 820 13.4 28 5.3Saratovskaya zolotistaya 2.20 43.6 451 800 13.4 47 8.1Nik 2.50 39.6 452 762 13.2 47 7.5Zolotaya volna 2.57 36.2 446 775 13.5 51 7.4LSD ( 5 %) 0.3 3.1 67 34 0.3 7 1.5
Table 9. Average grain yield (hkg/ha) of winter bread wheat in theecological test in 1996–2004 at the Ershov Experimental Station ofIrrigation Farming, ARISER, Ershov, Russian Federation.
Cultivar Irrigation farming Dry farming
Donskaya bezostaya (Check) 61.0 32.3Mironovskaya 808 (Check) 52.5 32.8Ershovskaya 10 (regionalized) 65.1 34.5Ershovskaya 11 (regionalized) 61.7 34.2Levoberezhnaya 1 (regionalized) 65.2 36.9Levoberezhnaya 2 63.6 37.8Levoberezhnaya 3 66.3 37.9
108
A n n u a l W h e a t N e w s l e t t e r V o l. 5 1.
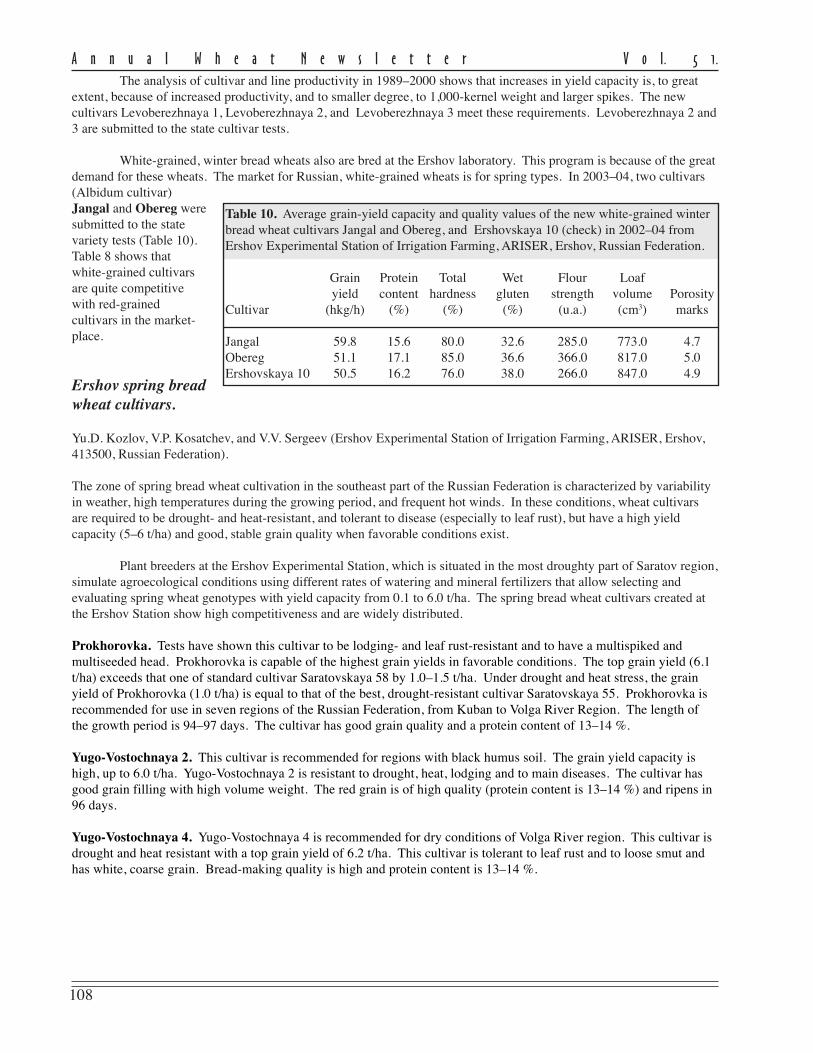
The analysis of cultivar and line productivity in 1989–2000 shows that increases in yield capacity is, to greatextent, because of increased productivity, and to smaller degree, to 1,000-kernel weight and larger spikes. The newcultivars Levoberezhnaya 1, Levoberezhnaya 2, and Levoberezhnaya 3 meet these requirements. Levoberezhnaya 2 and3 are submitted to the state cultivar tests.
White-grained, winter bread wheats also are bred at the Ershov laboratory. This program is because of the greatdemand for these wheats. The market for Russian, white-grained wheats is for spring types. In 2003–04, two cultivars(Albidum cultivar)Jangal and Obereg weresubmitted to the statevariety tests (Table 10).Table 8 shows thatwhite-grained cultivarsare quite competitivewith red-grainedcultivars in the market-place.
Ershov spring breadwheat cultivars.
Yu.D. Kozlov, V.P. Kosatchev, and V.V. Sergeev (Ershov Experimental Station of Irrigation Farming, ARISER, Ershov,413500, Russian Federation).
The zone of spring bread wheat cultivation in the southeast part of the Russian Federation is characterized by variabilityin weather, high temperatures during the growing period, and frequent hot winds. In these conditions, wheat cultivarsare required to be drought- and heat-resistant, and tolerant to disease (especially to leaf rust), but have a high yieldcapacity (5–6 t/ha) and good, stable grain quality when favorable conditions exist.
Plant breeders at the Ershov Experimental Station, which is situated in the most droughty part of Saratov region,simulate agroecological conditions using different rates of watering and mineral fertilizers that allow selecting andevaluating spring wheat genotypes with yield capacity from 0.1 to 6.0 t/ha. The spring bread wheat cultivars created atthe Ershov Station show high competitiveness and are widely distributed.
Prokhorovka. Tests have shown this cultivar to be lodging- and leaf rust-resistant and to have a multispiked andmultiseeded head. Prokhorovka is capable of the highest grain yields in favorable conditions. The top grain yield (6.1t/ha) exceeds that one of standard cultivar Saratovskaya 58 by 1.0–1.5 t/ha. Under drought and heat stress, the grainyield of Prokhorovka (1.0 t/ha) is equal to that of the best, drought-resistant cultivar Saratovskaya 55. Prokhorovka isrecommended for use in seven regions of the Russian Federation, from Kuban to Volga River Region. The length ofthe growth period is 94–97 days. The cultivar has good grain quality and a protein content of 13–14 %.
Yugo-Vostochnaya 2. This cultivar is recommended for regions with black humus soil. The grain yield capacity ishigh, up to 6.0 t/ha. Yugo-Vostochnaya 2 is resistant to drought, heat, lodging and to main diseases. The cultivar hasgood grain filling with high volume weight. The red grain is of high quality (protein content is 13–14 %) and ripens in96 days.
Yugo-Vostochnaya 4. Yugo-Vostochnaya 4 is recommended for dry conditions of Volga River region. This cultivar isdrought and heat resistant with a top grain yield of 6.2 t/ha. This cultivar is tolerant to leaf rust and to loose smut andhas white, coarse grain. Bread-making quality is high and protein content is 13–14 %.
Table 10. Average grain-yield capacity and quality values of the new white-grained winterbread wheat cultivars Jangal and Obereg, and Ershovskaya 10 (check) in 2002–04 fromErshov Experimental Station of Irrigation Farming, ARISER, Ershov, Russian Federation.
Grain Protein Total Wet Flour Loafyield content hardness gluten strength volume Porosity
Cultivar (hkg/h) (%) (%) (%) (u.a.) (cm3) marks
Jangal 59.8 15.6 80.0 32.6 285.0 773.0 4.7Obereg 51.1 17.1 85.0 36.6 366.0 817.0 5.0Ershovskaya 10 50.5 16.2 76.0 38.0 266.0 847.0 4.9
109
A n n u a l W h e a t N e w s l e t t e r V o l. 5 1.
FAR EASTERN RESEARCH INSTITUTE OF AGRICULTUREInstitute of Complex Analysis of Regional Problems, Karl Marx str., 105 A, kv. 167,Khabarovsk, 680009, Russian Federation.
Selection problems of high quality soft spring wheat cultivars in far-eastern Russian Federation.
Ivan Shindin and Vladimir Cherpak.
One of the most important problems when breeding T. aestivum subsp. aestivum cultivars for the far-eastern RussianFederation is good technological and bread-baking qualities. Wheat breeders from the far-eastern region have developed50 cultivars, including 20 that were entered in the Register of Selection Achievements of the Russian Federation.However, no cultivar that meets the parameters of strong wheat also is resistant to biotic and abiotic factors (drought,high humidity, and fungal diseases).
One of the reasons why we cannot develop a strong wheat cultivar is that there is not an integral wheat-qualityindex. We have to select a cultivar according to a great number of indicators to define technological properties of acultivar (Pumpyanskey 1971). There are 20 indicators under the State Russian Standard (GOST).
Second, forming high-quality grain in the far-eastern region of the Russian Federation is limited by heavyprecipitation, high temperatures, and high humidity (90–100 %) during the ripening stage. These negative factorsincrease fermentative process that leads to the decay of starch and protein and to further colonization of spikes and seedby saprophytic and semiparasitic fungus, because the secretion of soluble carbohydrates is a good nutrient medium. As aresult, seed carbohydrate and protein is reduced, which leads to the loss of organic substances and deterioration oftechnological and baking qualities. This phenomenon is called enzyme and mycosis exhaustion in seeds (Shindin et al.2004).
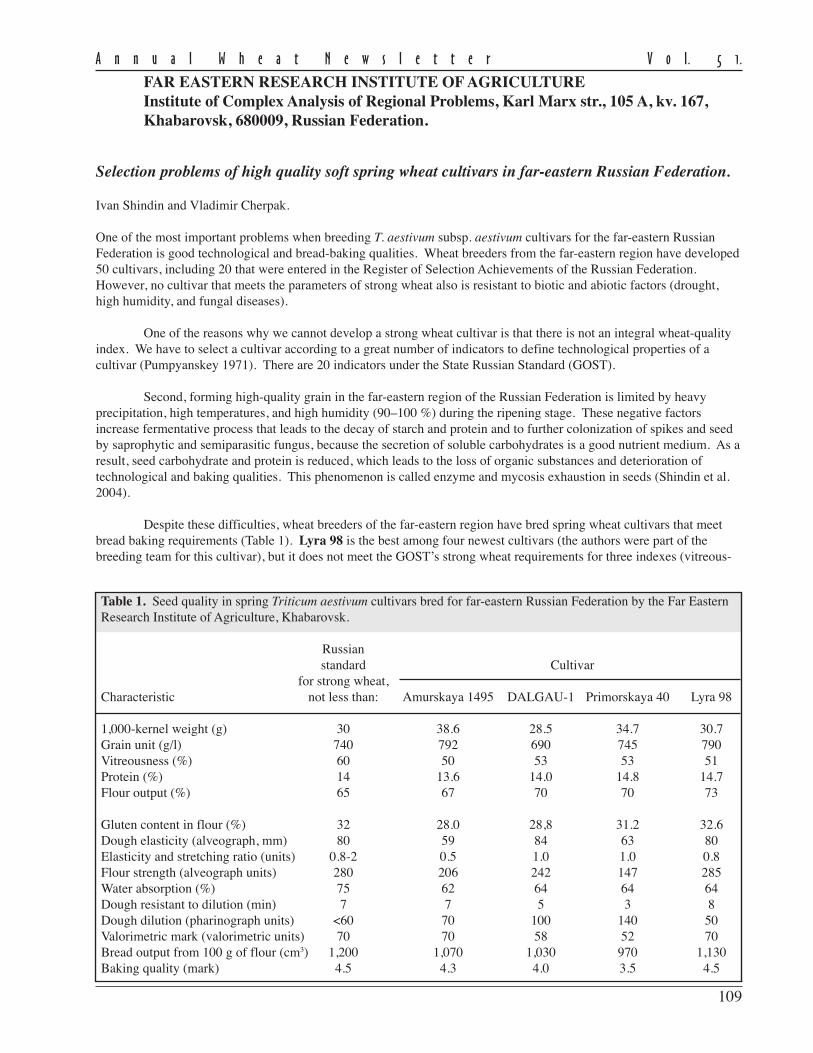
Despite these difficulties, wheat breeders of the far-eastern region have bred spring wheat cultivars that meetbread baking requirements (Table 1). Lyra 98 is the best among four newest cultivars (the authors were part of thebreeding team for this cultivar), but it does not meet the GOST’s strong wheat requirements for three indexes (vitreous-
Table 1. Seed quality in spring Triticum aestivum cultivars bred for far-eastern Russian Federation by the Far EasternResearch Institute of Agriculture, Khabarovsk.
Russianstandard Cultivar
for strong wheat,Characteristic not less than: Amurskaya 1495 DALGAU-1 Primorskaya 40 Lyra 98
1,000-kernel weight (g) 30 38.6 28.5 34.7 30.7Grain unit (g/l) 740 792 690 745 790Vitreousness (%) 60 50 53 53 51Protein (%) 14 13.6 14.0 14.8 14.7Flour output (%) 65 67 70 70 73
Gluten content in flour (%) 32 28.0 28,8 31.2 32.6Dough elasticity (alveograph, mm) 80 59 84 63 80Elasticity and stretching ratio (units) 0.8-2 0.5 1.0 1.0 0.8Flour strength (alveograph units) 280 206 242 147 285Water absorption (%) 75 62 64 64 64Dough resistant to dilution (min) 7 7 5 3 8Dough dilution (pharinograph units) <60 70 100 140 50Valorimetric mark (valorimetric units) 70 70 58 52 70Bread output from 100 g of flour (cm3) 1,200 1,070 1,030 970 1,130Baking quality (mark) 4.5 4.3 4.0 3.5 4.5
110
A n n u a l W h e a t N e w s l e t t e r V o l. 5 1.
ness, water absorption, and bread output). Thus, Lyra 98 needs further genetic improvement in these indexes. Othercultivars (Amurskaya 1495, Dalgau-1, and Primorskaya 40) are highly productive (5–5.5 t/ha) and resistant to lodgingand sprouting, are used in selection as donors of some value technological and agronomic characteristics. Research onimproving the technological and bread-making characteristics of soft wheat in the far-eastern region of the RussianFederation is on-going.
Reference.Pumpyanskey AY. 1971. Technological properties of soft wheat. Leningrad. P. 9 (in Russian).Shindin I, Cherpak V, and Phirstov S. 2004. Enzyme and mycosis exhaustion in seeds of Triticum aestivum in the far
eastern Russian Federation. Ann Wheat Newslet 50:109-111.
IRKUTSK STATE AGRICULTURAL ACADEMYMolodyozhnyi settlement, Irkutsk, 664038, Russian Federation.
Impact of long-term mineral fertilization on the spring wheat harvest on Pribaikal’ye Gray Forestland.
V.V. Zhitov, A.A. Dolgopolov, and O.S. Naumova, and A.K. Glyanko (Siberian Institute of Plant Physiology andBiochemistry Siberian Division of the Russian Academy of Sciences, PO Box 1243, Irkutsk, 664033, Russian Federa-tion).
The interaction of mineral fertilizers (as anthropogenic factor) on all the components of the agroecosystem are obvious.In the long term, soil fertility and harvests are affected. Early investigations (Zhitov et al. 2004) revealed that withoutmineral fertilizers soil fertility is gradually degraded, most pronounced in the reduction of the humus content of the soil.Long-term mineral fertilization (NPK) in the complex proportions optimal for a given soil type stabilizes this and otherparameters of soil fertility. The consolidated results of 20 years investigations on the productivity of spring wheat on thetypical Pribaikal’ye (Eastern Siberia) gray forest cultivated land depending on the mineral fertilization are summarizedhere.
Materials and methods. The studies were made in a five field-crop rotation regime: pure fallow, wheat, barley, side-rate fallow, wheat. and 8-variant scheme as follows: control (no fertilizer); N
60; P
40; K
60; P
40 K
60; N
60K
60; and N
60P
40K
60.
Tests were repeated four times. Potassium chloride, double super-phosphate, and ammonium nitrate were used asfertilizers. The area under crops equaled 480 m2 and the registered area was 240 m2. Test sites were located according tothe field tests using the spring wheat Tulunskaya 14 and the spring barley Odessky 115. Oily radish (Raphanus sativusL., var. oleifera) was used as a side-rate plant. Productivity in wheat and barley were expressed in metric centner/ha(mc/ha).
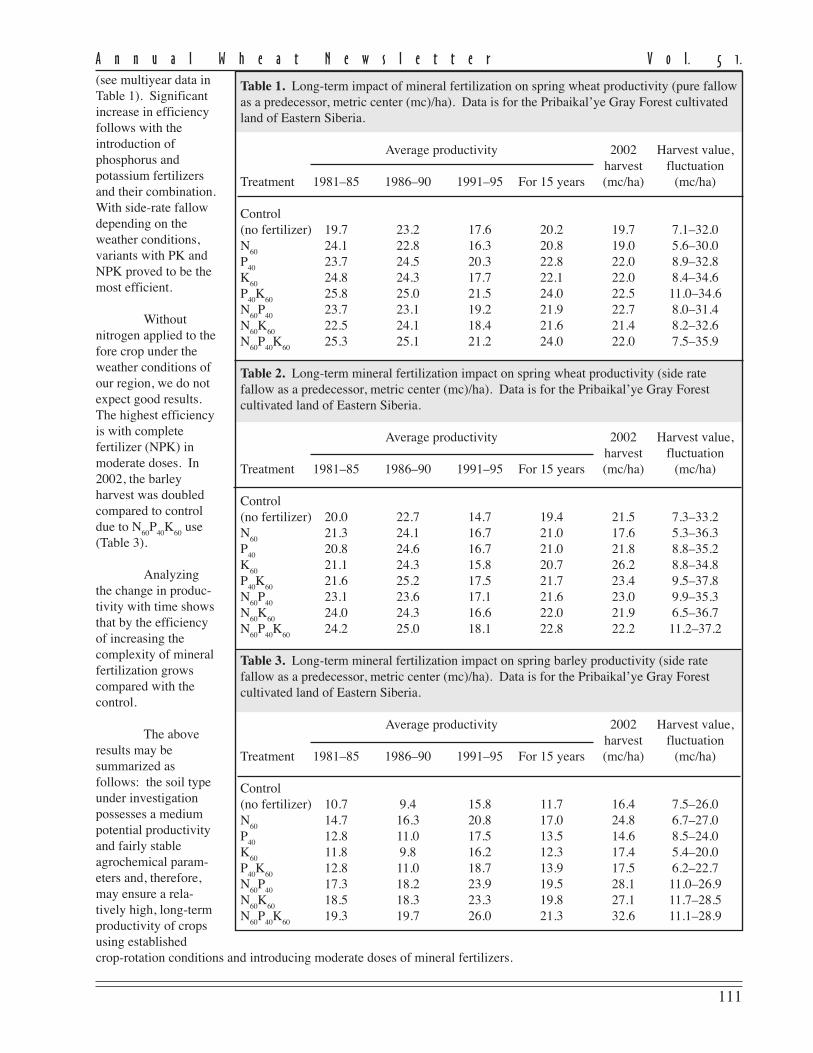
Results. Spring wheat productivity in the last 20 years with various predecessors in the crop rotation (Tables 1 and 2, p.111) confirms that potential soil productivity depends significantly on the climatic conditions. Productivity fluctuated inthe control variant throughout the years. With pure fallow before wheat, productivity ranges from 7.1 to 32.4 mc/ha;with side-rate fallow, from 7.3 to 33.2 mc/ha; and with a crop predecessor, from 7.5 to 26 mc/ha.
The most stable harvests were obtained with pure fallow as a predecessor in the variant with PK introduction,the harvest values ranged between 11.0 and 34.6 mc/ha. This variant demonstrated the highest average productivity in15 years, 24 mc/ha, which corresponded to the NPK variant, and exceeded the control variant by 3.8 mc/ha. This variantalso had the maximum harvests in 2002. With side-rate fallow as a predecessor, the most stable harvests were in thevariant with complete mineral fertilization, fluctuating from 11.2 to 37.2 mc/ha in the last 20 years.
When spring barley follows wheat, fairly stable harvests throughout the years were observed in variants withthe introduction of nitrogen in combination with phosphorus or potassium and complex.
Considering the efficiency of different forms of mineral fertilizers when crops precede, in the Pribaikal’yeForest-steppe Zone, introduction of nitrogen fertilizers, particularly with their one-sided use for pure fallow, is inefficient
111
A n n u a l W h e a t N e w s l e t t e r V o l. 5 1.
(see multiyear data inTable 1). Significantincrease in efficiencyfollows with theintroduction ofphosphorus andpotassium fertilizersand their combination.With side-rate fallowdepending on theweather conditions,variants with PK andNPK proved to be themost efficient.
Withoutnitrogen applied to thefore crop under theweather conditions ofour region, we do notexpect good results.The highest efficiencyis with completefertilizer (NPK) inmoderate doses. In2002, the barleyharvest was doubledcompared to controldue to N
60P
40K
60 use
(Table 3).
Analyzingthe change in produc-tivity with time showsthat by the efficiencyof increasing thecomplexity of mineralfertilization growscompared with thecontrol.
The aboveresults may besummarized asfollows: the soil typeunder investigationpossesses a mediumpotential productivityand fairly stableagrochemical param-eters and, therefore,may ensure a rela-tively high, long-termproductivity of cropsusing establishedcrop-rotation conditions and introducing moderate doses of mineral fertilizers.
Table 1. Long-term impact of mineral fertilization on spring wheat productivity (pure fallowas a predecessor, metric center (mc)/ha). Data is for the Pribaikal’ye Gray Forest cultivatedland of Eastern Siberia.
Average productivity 2002 Harvest value,harvest fluctuation
Treatment 1981–85 1986–90 1991–95 For 15 years (mc/ha) (mc/ha)
Control(no fertilizer) 19.7 23.2 17.6 20.2 19.7 7.1–32.0N
6024.1 22.8 16.3 20.8 19.0 5.6–30.0
P40
23.7 24.5 20.3 22.8 22.0 8.9–32.8K
6024.8 24.3 17.7 22.1 22.0 8.4–34.6
P40
K60
25.8 25.0 21.5 24.0 22.5 11.0–34.6N
60P
4023.7 23.1 19.2 21.9 22.7 8.0–31.4
N60
K60
22.5 24.1 18.4 21.6 21.4 8.2–32.6N
60P
40K
6025.3 25.1 21.2 24.0 22.0 7.5–35.9
Table 2. Long-term mineral fertilization impact on spring wheat productivity (side ratefallow as a predecessor, metric center (mc)/ha). Data is for the Pribaikal’ye Gray Forestcultivated land of Eastern Siberia.
Average productivity 2002 Harvest value,harvest fluctuation
Treatment 1981–85 1986–90 1991–95 For 15 years (mc/ha) (mc/ha)
Control(no fertilizer) 20.0 22.7 14.7 19.4 21.5 7.3–33.2N
6021.3 24.1 16.7 21.0 17.6 5.3–36.3
P40
20.8 24.6 16.7 21.0 21.8 8.8–35.2K
6021.1 24.3 15.8 20.7 26.2 8.8–34.8
P40
K60
21.6 25.2 17.5 21.7 23.4 9.5–37.8N
60P
4023.1 23.6 17.1 21.6 23.0 9.9–35.3
N60
K60
24.0 24.3 16.6 22.0 21.9 6.5–36.7N
60P
40K
6024.2 25.0 18.1 22.8 22.2 11.2–37.2
Table 3. Long-term mineral fertilization impact on spring barley productivity (side ratefallow as a predecessor, metric center (mc)/ha). Data is for the Pribaikal’ye Gray Forestcultivated land of Eastern Siberia.
Average productivity 2002 Harvest value,harvest fluctuation
Treatment 1981–85 1986–90 1991–95 For 15 years (mc/ha) (mc/ha)
Control(no fertilizer) 10.7 9.4 15.8 11.7 16.4 7.5–26.0N
6014.7 16.3 20.8 17.0 24.8 6.7–27.0
P40
12.8 11.0 17.5 13.5 14.6 8.5–24.0K
6011.8 9.8 16.2 12.3 17.4 5.4–20.0
P40
K60
12.8 11.0 18.7 13.9 17.5 6.2–22.7N
60P
4017.3 18.2 23.9 19.5 28.1 11.0–26.9
N60
K60
18.5 18.3 23.3 19.8 27.1 11.7–28.5N
60P
40K
6019.3 19.7 26.0 21.3 32.6 11.1–28.9
112
A n n u a l W h e a t N e w s l e t t e r V o l. 5 1.
Publication and reference.Zhitov BB, Dolgopolov AA, and Dmitriyev NN. 2004. Agrochemistry in the south of Eastern Siberia. Irkutsk. 336 pp
(In Russian).
MOSCOW STATE UNIVERSITY119992, Moscow, GSP-2, Leninskye Gory, Biology Faculty, Department of Mycologyand Algology, Russian Federation.www. [email protected]
The analysis of Pucciniagraminis f.sp. triticipopulations in the RussianFederation and the Ukraine in2001.
E.S. Skolotneva, V.T. Volkova, Yu.V.Maleeva, L.G. Zaitseva, and S.N.Lekomtseva.
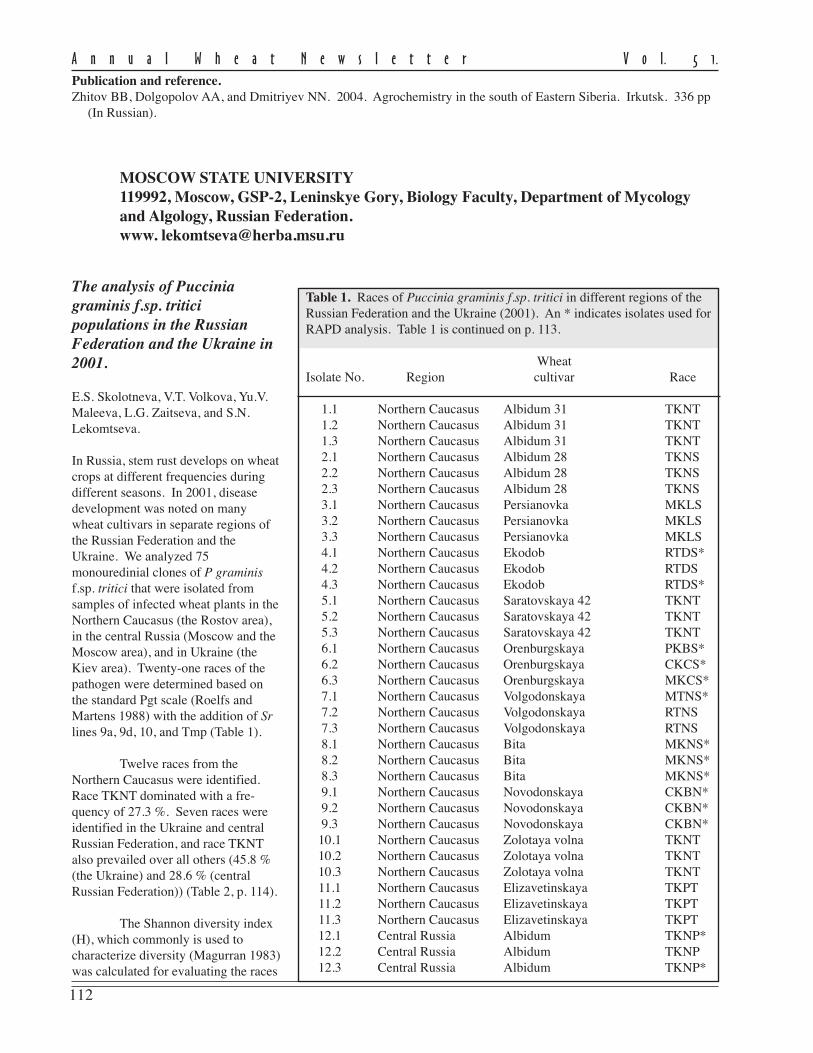
In Russia, stem rust develops on wheatcrops at different frequencies duringdifferent seasons. In 2001, diseasedevelopment was noted on manywheat cultivars in separate regions ofthe Russian Federation and theUkraine. We analyzed 75monouredinial clones of P graminisf.sp. tritici that were isolated fromsamples of infected wheat plants in theNorthern Caucasus (the Rostov area),in the central Russia (Moscow and theMoscow area), and in Ukraine (theKiev area). Twenty-one races of thepathogen were determined based onthe standard Pgt scale (Roelfs andMartens 1988) with the addition of Srlines 9a, 9d, 10, and Tmp (Table 1).
Twelve races from theNorthern Caucasus were identified.Race TKNT dominated with a fre-quency of 27.3 %. Seven races wereidentified in the Ukraine and centralRussian Federation, and race TKNTalso prevailed over all others (45.8 %(the Ukraine) and 28.6 % (centralRussian Federation)) (Table 2, p. 114).
The Shannon diversity index(H), which commonly is used tocharacterize diversity (Magurran 1983)was calculated for evaluating the races
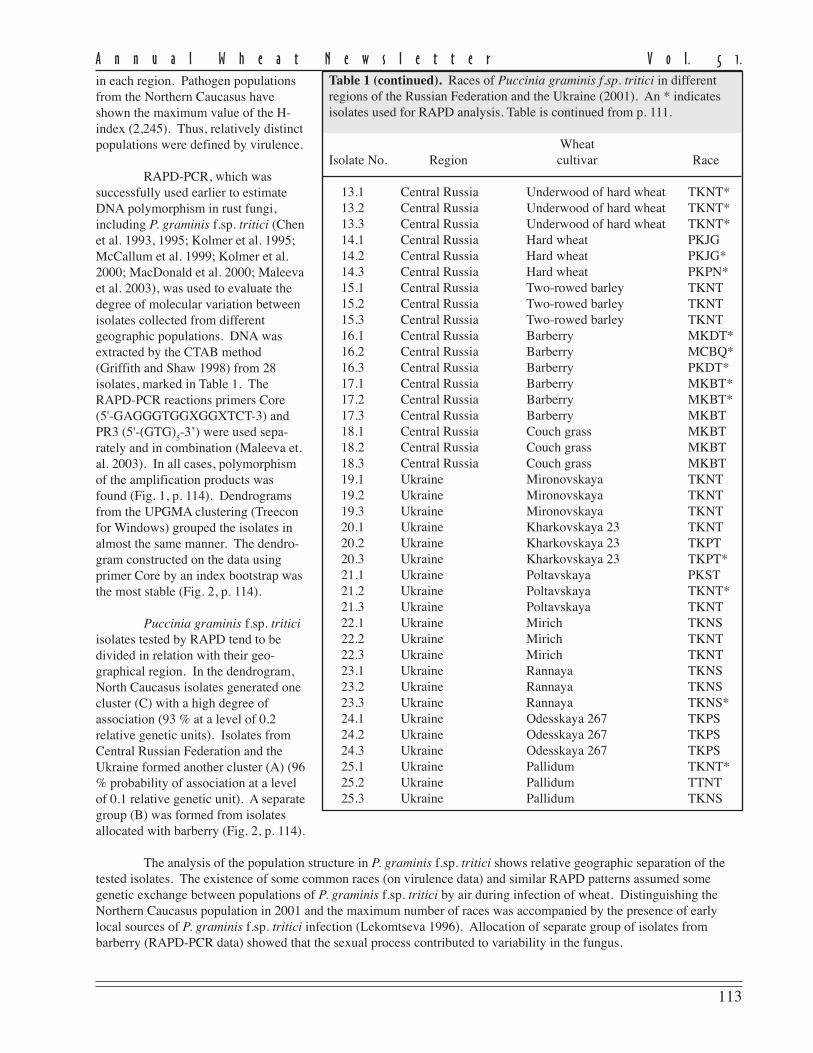
Table 1. Races of Puccinia graminis f.sp. tritici in different regions of theRussian Federation and the Ukraine (2001). An * indicates isolates used forRAPD analysis. Table 1 is continued on p. 113.
WheatIsolate No. Region cultivar Race
1.1 Northern Caucasus Albidum 31 TKNT1.2 Northern Caucasus Albidum 31 TKNT1.3 Northern Caucasus Albidum 31 TKNT2.1 Northern Caucasus Albidum 28 TKNS2.2 Northern Caucasus Albidum 28 TKNS2.3 Northern Caucasus Albidum 28 TKNS3.1 Northern Caucasus Persianovka MKLS3.2 Northern Caucasus Persianovka MKLS3.3 Northern Caucasus Persianovka MKLS4.1 Northern Caucasus Ekodob RTDS*4.2 Northern Caucasus Ekodob RTDS4.3 Northern Caucasus Ekodob RTDS*5.1 Northern Caucasus Saratovskaya 42 TKNT5.2 Northern Caucasus Saratovskaya 42 TKNT5.3 Northern Caucasus Saratovskaya 42 TKNT6.1 Northern Caucasus Orenburgskaya PKBS*6.2 Northern Caucasus Orenburgskaya CKCS*6.3 Northern Caucasus Orenburgskaya MKCS*7.1 Northern Caucasus Volgodonskaya MTNS*7.2 Northern Caucasus Volgodonskaya RTNS7.3 Northern Caucasus Volgodonskaya RTNS8.1 Northern Caucasus Bita MKNS*8.2 Northern Caucasus Bita MKNS*8.3 Northern Caucasus Bita MKNS*9.1 Northern Caucasus Novodonskaya CKBN*9.2 Northern Caucasus Novodonskaya CKBN*9.3 Northern Caucasus Novodonskaya CKBN*10.1 Northern Caucasus Zolotaya volna TKNT10.2 Northern Caucasus Zolotaya volna TKNT10.3 Northern Caucasus Zolotaya volna TKNT11.1 Northern Caucasus Elizavetinskaya TKPT11.2 Northern Caucasus Elizavetinskaya TKPT11.3 Northern Caucasus Elizavetinskaya TKPT12.1 Central Russia Albidum TKNP*12.2 Central Russia Albidum TKNP12.3 Central Russia Albidum TKNP*
113
A n n u a l W h e a t N e w s l e t t e r V o l. 5 1.
in each region. Pathogen populationsfrom the Northern Caucasus haveshown the maximum value of the H-index (2,245). Thus, relatively distinctpopulations were defined by virulence.
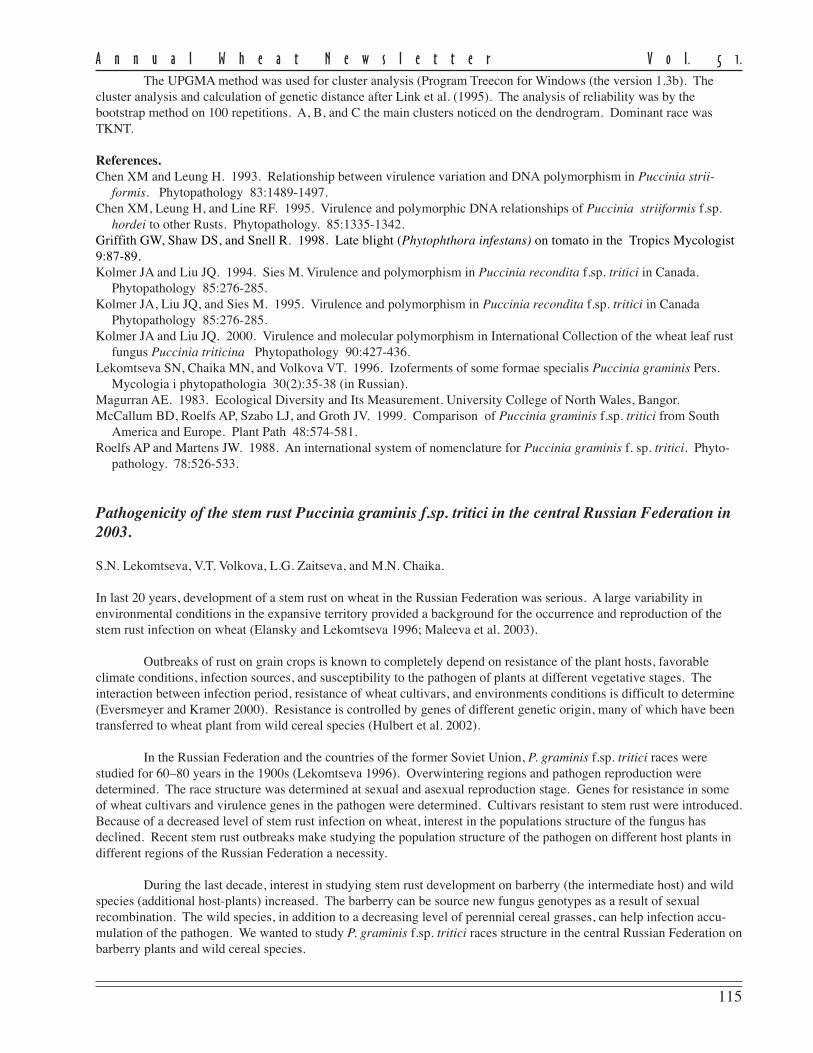
RAPD-PCR, which wassuccessfully used earlier to estimateDNA polymorphism in rust fungi,including P. graminis f.sp. tritici (Chenet al. 1993, 1995; Kolmer et al. 1995;McCallum et al. 1999; Kolmer et al.2000; MacDonald et al. 2000; Maleevaet al. 2003), was used to evaluate thedegree of molecular variation betweenisolates collected from differentgeographic populations. DNA wasextracted by the CTAB method(Griffith and Shaw 1998) from 28isolates, marked in Table 1. TheRAPD-PCR reactions primers Core(5'-GAGGGTGGXGGXTCT-3) andPR3 (5'-(GTG)
5-3’) were used sepa-
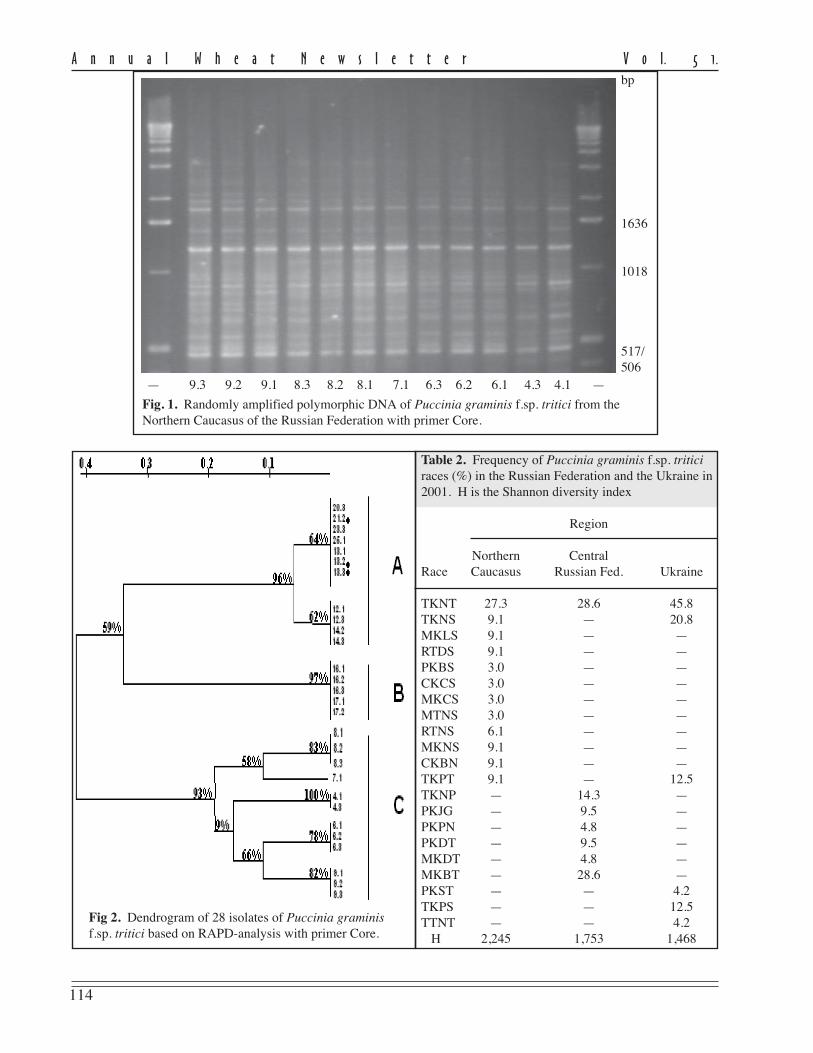
rately and in combination (Maleeva et.al. 2003). In all cases, polymorphismof the amplification products wasfound (Fig. 1, p. 114). Dendrogramsfrom the UPGMA clustering (Treeconfor Windows) grouped the isolates inalmost the same manner. The dendro-gram constructed on the data usingprimer Core by an index bootstrap wasthe most stable (Fig. 2, p. 114).
Puccinia graminis f.sp. triticiisolates tested by RAPD tend to bedivided in relation with their geo-graphical region. In the dendrogram,North Caucasus isolates generated onecluster (C) with a high degree ofassociation (93 % at a level of 0.2relative genetic units). Isolates fromCentral Russian Federation and theUkraine formed another cluster (A) (96% probability of association at a levelof 0.1 relative genetic unit). A separategroup (B) was formed from isolatesallocated with barberry (Fig. 2, p. 114).
The analysis of the population structure in P. graminis f.sp. tritici shows relative geographic separation of thetested isolates. The existence of some common races (on virulence data) and similar RAPD patterns assumed somegenetic exchange between populations of P. graminis f.sp. tritici by air during infection of wheat. Distinguishing theNorthern Caucasus population in 2001 and the maximum number of races was accompanied by the presence of earlylocal sources of P. graminis f.sp. tritici infection (Lekomtseva 1996). Allocation of separate group of isolates frombarberry (RAPD-PCR data) showed that the sexual process contributed to variability in the fungus.
Table 1 (continued). Races of Puccinia graminis f.sp. tritici in differentregions of the Russian Federation and the Ukraine (2001). An * indicatesisolates used for RAPD analysis. Table is continued from p. 111.
WheatIsolate No. Region cultivar Race
13.1 Central Russia Underwood of hard wheat TKNT*13.2 Central Russia Underwood of hard wheat TKNT*13.3 Central Russia Underwood of hard wheat TKNT*14.1 Central Russia Hard wheat PKJG14.2 Central Russia Hard wheat PKJG*14.3 Central Russia Hard wheat PKPN*15.1 Central Russia Two-rowed barley TKNT15.2 Central Russia Two-rowed barley TKNT15.3 Central Russia Two-rowed barley TKNT16.1 Central Russia Barberry MKDT*16.2 Central Russia Barberry MCBQ*16.3 Central Russia Barberry PKDT*17.1 Central Russia Barberry MKBT*17.2 Central Russia Barberry MKBT*17.3 Central Russia Barberry MKBT18.1 Central Russia Couch grass MKBT18.2 Central Russia Couch grass MKBT18.3 Central Russia Couch grass MKBT19.1 Ukraine Mironovskaya TKNT19.2 Ukraine Mironovskaya TKNT19.3 Ukraine Mironovskaya TKNT20.1 Ukraine Kharkovskaya 23 TKNT20.2 Ukraine Kharkovskaya 23 TKPT20.3 Ukraine Kharkovskaya 23 TKPT*21.1 Ukraine Poltavskaya PKST21.2 Ukraine Poltavskaya TKNT*21.3 Ukraine Poltavskaya TKNT22.1 Ukraine Mirich TKNS22.2 Ukraine Mirich TKNT22.3 Ukraine Mirich TKNT23.1 Ukraine Rannaya TKNS23.2 Ukraine Rannaya TKNS23.3 Ukraine Rannaya TKNS*24.1 Ukraine Odesskaya 267 TKPS24.2 Ukraine Odesskaya 267 TKPS24.3 Ukraine Odesskaya 267 TKPS25.1 Ukraine Pallidum TKNT*25.2 Ukraine Pallidum TTNT25.3 Ukraine Pallidum TKNS
114
A n n u a l W h e a t N e w s l e t t e r V o l. 5 1.
Table 2. Frequency of Puccinia graminis f.sp. triticiraces (%) in the Russian Federation and the Ukraine in2001. H is the Shannon diversity index
Region
Northern CentralRace Caucasus Russian Fed. Ukraine
TKNT 27.3 28.6 45.8TKNS 9.1 — 20.8MKLS 9.1 — —RTDS 9.1 — —PKBS 3.0 — —CKCS 3.0 — —MKCS 3.0 — —MTNS 3.0 — —RTNS 6.1 — —MKNS 9.1 — —CKBN 9.1 — —TKPT 9.1 — 12.5TKNP — 14.3 —PKJG — 9.5 —PKPN — 4.8 —PKDT — 9.5 —MKDT — 4.8 —MKBT — 28.6 —PKST — — 4.2TKPS — — 12.5TTNT — — 4.2 H 2,245 1,753 1,468
Fig 2. Dendrogram of 28 isolates of Puccinia graminisf.sp. tritici based on RAPD-analysis with primer Core.
— 9.3 9.2 9.1 8.3 8.2 8.1 7.1 6.3 6.2 6.1 4.3 4.1 —
bp
1636
1018
517/506
Fig. 1. Randomly amplified polymorphic DNA of Puccinia graminis f.sp. tritici from theNorthern Caucasus of the Russian Federation with primer Core.
115
A n n u a l W h e a t N e w s l e t t e r V o l. 5 1.
The UPGMA method was used for cluster analysis (Program Treecon for Windows (the version 1.3b). Thecluster analysis and calculation of genetic distance after Link et al. (1995). The analysis of reliability was by thebootstrap method on 100 repetitions. A, B, and C the main clusters noticed on the dendrogram. Dominant race wasTKNT.
References.Chen XM and Leung H. 1993. Relationship between virulence variation and DNA polymorphism in Puccinia strii-
formis. Phytopathology 83:1489-1497.Chen XM, Leung H, and Line RF. 1995. Virulence and polymorphic DNA relationships of Puccinia striiformis f.sp.
hordei to other Rusts. Phytopathology. 85:1335-1342.Griffith GW, Shaw DS, and Snell R. 1998. Late blight (Phytophthora infestans) on tomato in the Tropics Mycologist9:87-89.Kolmer JA and Liu JQ. 1994. Sies M. Virulence and polymorphism in Puccinia recondita f.sp. tritici in Canada.
Phytopathology 85:276-285.Kolmer JA, Liu JQ, and Sies M. 1995. Virulence and polymorphism in Puccinia recondita f.sp. tritici in Canada
Phytopathology 85:276-285.Kolmer JA and Liu JQ. 2000. Virulence and molecular polymorphism in International Collection of the wheat leaf rust
fungus Puccinia triticina Phytopathology 90:427-436.Lekomtseva SN, Chaika MN, and Volkova VT. 1996. Izoferments of some formae specialis Puccinia graminis Pers.
Mycologia i phytopathologia 30(2):35-38 (in Russian).Magurran AE. 1983. Ecological Diversity and Its Measurement. University College of North Wales, Bangor.McCallum BD, Roelfs AP, Szabo LJ, and Groth JV. 1999. Comparison of Puccinia graminis f.sp. tritici from South
America and Europe. Plant Path 48:574-581.Roelfs AP and Martens JW. 1988. An international system of nomenclature for Puccinia graminis f. sp. tritici. Phyto-
pathology. 78:526-533.
Pathogenicity of the stem rust Puccinia graminis f.sp. tritici in the central Russian Federation in2003.
S.N. Lekomtseva, V.T. Volkova, L.G. Zaitseva, and M.N. Chaika.
In last 20 years, development of a stem rust on wheat in the Russian Federation was serious. A large variability inenvironmental conditions in the expansive territory provided a background for the occurrence and reproduction of thestem rust infection on wheat (Elansky and Lekomtseva 1996; Maleeva et al. 2003).
Outbreaks of rust on grain crops is known to completely depend on resistance of the plant hosts, favorableclimate conditions, infection sources, and susceptibility to the pathogen of plants at different vegetative stages. Theinteraction between infection period, resistance of wheat cultivars, and environments conditions is difficult to determine(Eversmeyer and Kramer 2000). Resistance is controlled by genes of different genetic origin, many of which have beentransferred to wheat plant from wild cereal species (Hulbert et al. 2002).
In the Russian Federation and the countries of the former Soviet Union, P. graminis f.sp. tritici races werestudied for 60–80 years in the 1900s (Lekomtseva 1996). Overwintering regions and pathogen reproduction weredetermined. The race structure was determined at sexual and asexual reproduction stage. Genes for resistance in someof wheat cultivars and virulence genes in the pathogen were determined. Cultivars resistant to stem rust were introduced.Because of a decreased level of stem rust infection on wheat, interest in the populations structure of the fungus hasdeclined. Recent stem rust outbreaks make studying the population structure of the pathogen on different host plants indifferent regions of the Russian Federation a necessity.
During the last decade, interest in studying stem rust development on barberry (the intermediate host) and wildspecies (additional host-plants) increased. The barberry can be source new fungus genotypes as a result of sexualrecombination. The wild species, in addition to a decreasing level of perennial cereal grasses, can help infection accu-mulation of the pathogen. We wanted to study P. graminis f.sp. tritici races structure in the central Russian Federation onbarberry plants and wild cereal species.
116
A n n u a l W h e a t N e w s l e t t e r V o l. 5 1.
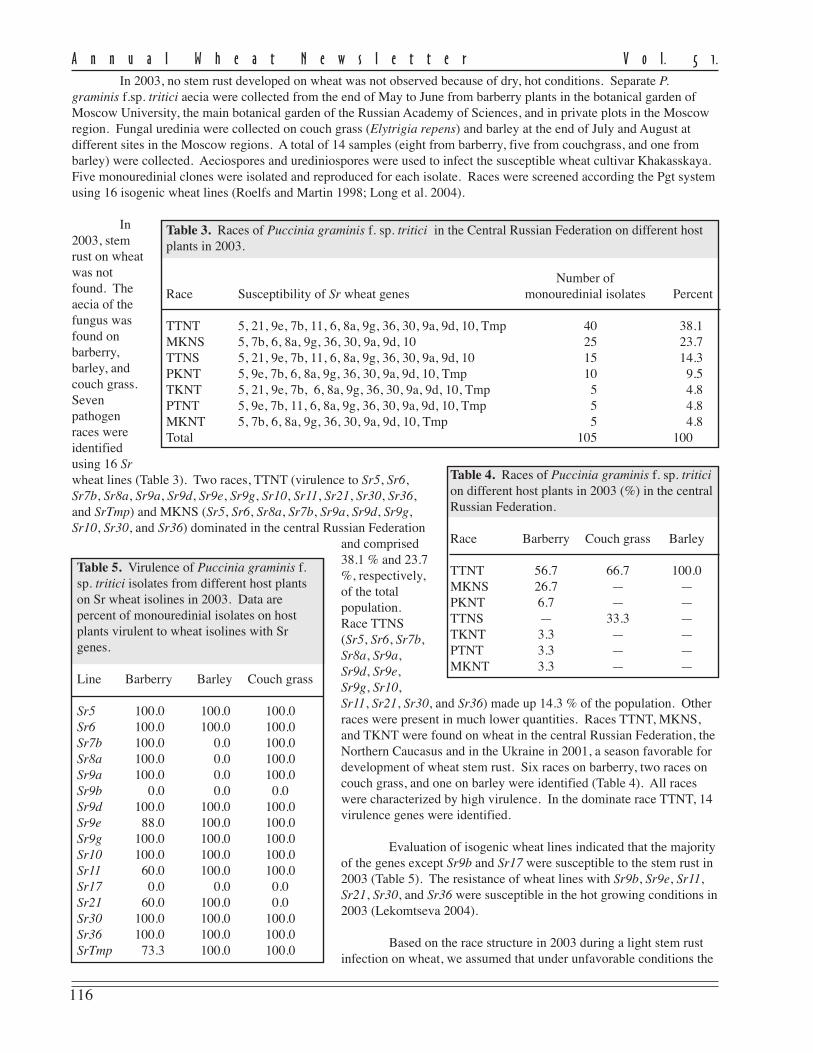
In 2003, no stem rust developed on wheat was not observed because of dry, hot conditions. Separate P.graminis f.sp. tritici aecia were collected from the end of May to June from barberry plants in the botanical garden ofMoscow University, the main botanical garden of the Russian Academy of Sciences, and in private plots in the Moscowregion. Fungal uredinia were collected on couch grass (Elytrigia repens) and barley at the end of July and August atdifferent sites in the Moscow regions. A total of 14 samples (eight from barberry, five from couchgrass, and one frombarley) were collected. Aeciospores and urediniospores were used to infect the susceptible wheat cultivar Khakasskaya.Five monouredinial clones were isolated and reproduced for each isolate. Races were screened according the Pgt systemusing 16 isogenic wheat lines (Roelfs and Martin 1998; Long et al. 2004).
In2003, stemrust on wheatwas notfound. Theaecia of thefungus wasfound onbarberry,barley, andcouch grass.Sevenpathogenraces wereidentifiedusing 16 Srwheat lines (Table 3). Two races, TTNT (virulence to Sr5, Sr6,Sr7b, Sr8a, Sr9a, Sr9d, Sr9e, Sr9g, Sr10, Sr11, Sr21, Sr30, Sr36,and SrTmp) and MKNS (Sr5, Sr6, Sr8a, Sr7b, Sr9a, Sr9d, Sr9g,Sr10, Sr30, and Sr36) dominated in the central Russian Federation
and comprised38.1 % and 23.7%, respectively,of the totalpopulation.Race TTNS(Sr5, Sr6, Sr7b,Sr8a, Sr9a,Sr9d, Sr9e,Sr9g, Sr10,Sr11, Sr21, Sr30, and Sr36) made up 14.3 % of the population. Otherraces were present in much lower quantities. Races TTNT, MKNS,and TKNT were found on wheat in the central Russian Federation, theNorthern Caucasus and in the Ukraine in 2001, a season favorable fordevelopment of wheat stem rust. Six races on barberry, two races oncouch grass, and one on barley were identified (Table 4). All raceswere characterized by high virulence. In the dominate race TTNT, 14virulence genes were identified.
Evaluation of isogenic wheat lines indicated that the majorityof the genes except Sr9b and Sr17 were susceptible to the stem rust in2003 (Table 5). The resistance of wheat lines with Sr9b, Sr9e, Sr11,Sr21, Sr30, and Sr36 were susceptible in the hot growing conditions in2003 (Lekomtseva 2004).
Based on the race structure in 2003 during a light stem rustinfection on wheat, we assumed that under unfavorable conditions the
Table 3. Races of Puccinia graminis f. sp. tritici in the Central Russian Federation on different hostplants in 2003.
Number ofRace Susceptibility of Sr wheat genes monouredinial isolates Percent
TTNT 5, 21, 9e, 7b, 11, 6, 8a, 9g, 36, 30, 9a, 9d, 10, Tmp 40 38.1MKNS 5, 7b, 6, 8a, 9g, 36, 30, 9a, 9d, 10 25 23.7TTNS 5, 21, 9e, 7b, 11, 6, 8a, 9g, 36, 30, 9a, 9d, 10 15 14.3PKNT 5, 9e, 7b, 6, 8a, 9g, 36, 30, 9a, 9d, 10, Tmp 10 9.5TKNT 5, 21, 9e, 7b, 6, 8a, 9g, 36, 30, 9a, 9d, 10, Tmp 5 4.8PTNT 5, 9e, 7b, 11, 6, 8a, 9g, 36, 30, 9a, 9d, 10, Tmp 5 4.8MKNT 5, 7b, 6, 8a, 9g, 36, 30, 9a, 9d, 10, Tmp 5 4.8Total 105 100
Table 4. Races of Puccinia graminis f. sp. triticion different host plants in 2003 (%) in the centralRussian Federation.
Race Barberry Couch grass Barley
TTNT 56.7 66.7 100.0MKNS 26.7 — —PKNT 6.7 — —TTNS — 33.3 —TKNT 3.3 — —PTNT 3.3 — —MKNT 3.3 — —
Table 5. Virulence of Puccinia graminis f.sp. tritici isolates from different host plantson Sr wheat isolines in 2003. Data arepercent of monouredinial isolates on hostplants virulent to wheat isolines with Srgenes.
Line Barberry Barley Couch grass
Sr5 100.0 100.0 100.0Sr6 100.0 100.0 100.0Sr7b 100.0 0.0 100.0Sr8a 100.0 0.0 100.0Sr9a 100.0 0.0 100.0Sr9b 0.0 0.0 0.0Sr9d 100.0 100.0 100.0Sr9e 88.0 100.0 100.0Sr9g 100.0 100.0 100.0Sr10 100.0 100.0 100.0Sr11 60.0 100.0 100.0Sr17 0.0 0.0 0.0Sr21 60.0 100.0 0.0Sr30 100.0 100.0 100.0Sr36 100.0 100.0 100.0SrTmp 73.3 100.0 100.0
117
A n n u a l W h e a t N e w s l e t t e r V o l. 5 1.
fungus maintains virulence phenotypes on the intermediate (barberry) and additional host-plants (wild cereals). Compar-ing the race structure of P. graminis f. sp. tritici in the central Russian Federation and the race structure in the U.S.during the same year, Long et al. (2004) showed a significant difference between populations of the fungus in theEuropean and American continents. Long-term observations of the decline in the stem rust pathogen on the host and asimultaneous increase of fungus development on wild cereals species can indicate that during years of low infection,infection potential changes from agrocenosis to biocenosis.
References.Elansky SN and Lekomtseva SN. 1998. Various fungal taxa spores frequency in the lowermost layer atmosphere in
Middle Russia. Micologia i fitopatologia P. 37-43 (In Russian).Eversmeyer MG and Kramer CL. 2001. Epidemiology of wheat leaf and stem rust in the Central Great Plants of the
USA. 2000. Ann Rev Phytopath 38:491-513.Hulbert SH, Webb CA, Smith SM, and Sun Q. 2001. Resistance gene complexes: Evolution and Utilization. Ann Rev
Phytopath 39:285-312.Lekomtseva SN. 1996. Intraspecial structure of Puccinia graminis Pers. Doctoral dissertation, Moscow State Univer-
sity. 37 pp. (In Russian).Lekomtseva SN and Volkova VT. 1999. Susceptibility of grain species to Puccinia graminis Pers. (Mycota, Basidi-
omycetes, Uredinales) and intraspecial structure of Puccinia graminis Pers. In: Materials of X Moscow Conf inPhylogeny of Plants, Moscow State University, Moscow. Pp. 99-101 (In Russian).
Lekomtseva SN, Volkova VT, and Chaika MN. 1999. Populations of stem rust pathogen Puccinia graminis tritici onPgt-lines of wheat. Vestnik Moskovskogo Universiteta, Ser Biologia Pp. 48-50 (In Russian).
Lekomtseva SN, Volkova VT, and Chaika MN. 2000. ‘Ecial populations’ of Puccinia graminis on barberry plants in theregion where sexual or asexual development of the fungus dominates. Micologia i fitopatologia Pp. 59-62 (InRussian).
Long DL, Kolmer YJ, Hughes ME, and Wanschura LA. 2004. Wheat rusts in the United States in 2003. Ann WheatNewslet 50:238-248.
Publications.Lekomtseva SN. 2003. The fungies of the genus Puccinia Pers. (Uredinales, Basidiomycota). The Taxonomic analysis.
New in Systematics and Nomenclature of fungies. Moscow. The National Academy Mycology. Pp. 402-417 (InRussian).
Lekomtseva SN, Maleeva YuV, Samochina IY, Insarova ID, and Zhemtchuzhina AI. 2003. Genetic polymorphism inpopulations of Puccinia triticina in Russia in 2000. In: ‘Actual Problems Genetics’ Materials II, Conf of MoscowVavilov Soc of Geneticists and Selectionist, Moscow, 20-21 February. Pp. 151-152 (In Russian).
Lekomtseva SN, Maleeva YuV, and Insarova ID. 2003. Methodical approaches to estimation of geographical variabilityof biotrophic fungi. In: ‘Actual Problems Genetics’ Materials II Conf of Moscow Vavilov Soc of Geneticists andSelectionist. Moscow. 20-21 February. Pp. 131-132 (In Russian).
Lekomtseva SN, Volkova VT, Zaitseva LG, and Chaika MN. 2003. Pathotypes Puccinia graminis f.sp. tritici in Russiaand Ukraine. In: ‘Actual Problems Genetics’ Materials II Conf of Moscow Vavilov Soc of Geneticists andSelectionist. Moscow, 20-21 February. Pp. 121-122 (In Russian).
Lekomtseva SN, Volkova VT, Zaitseva LG, Insarova ID, and Chaika MN. 2003. The estimation of parameters ofinraspecies variability Puccinia graminis Pers. (Basidiomycota, Urediniomycetes, Uredinales). In: Materials of XIMoscow Conf in Phylogeny of Plants. Moscow State University, Moscow. Pp. 99-101 (In Russian).
Maleeva YV, Lebedeva LA, Insarova ID, and Lekomtseva SN. 2003. Research of genetic variability of geographicalisolates of Puccinia graminis Pers. f.sp. tritici. J Rus Phytopath Soc 4:31-40 (In Russian).
Lekomtseva SN, Insarova ID, and Chaika MN. 2004. Isozyme analysis of special forms of Puccinia graminis Pers. In:Proc 14th Internat Reinhardsbrunn Symp Modern Fungicides and Antifungal Compounds. 25-29 April,Reinhardsbrunn. P. 30 (In Russian).
Lekomtseva SN, Maleeva YuV, Insarova ID, Skolotneva ES, and Chaika MN. 2004. The estimation of variability ofbiotrophs fungi. In: Genetics in XXI age: modern condition and prospects of development, Materials III Conf AllRussian Soc of Geneticists and Selectionist. Moscow, 6-12 June. 1:457 (In Russian).
Lekomtseva SN, Volkova VT, Zaitseva LG, and Chaika MN. 2004. Pathotypes of Puccinia graminis f.sp. tritici fromdifferent host-plants in 1996-2000. Micologia i fitopatologia 38(5):37-43 (In Russian).
Maleeva YuV, Samochina IY, and Lekomtseva SN. 2004. RAPD-analysis and structure of populations of leaf rust ofwheat (Puccinia triticina). In: Genetics in XXI age: modern condition and prospects of development, Materials IIIConf All Russian Soc of Geneticists and Selectionist. Moscow, 6-12 June. 2:212 (In Russian).
118
A n n u a l W h e a t N e w s l e t t e r V o l. 5 1.
SARATOV STATE AGRARIAN UNIVERSITY NAMED AFTER N.I. VAVILOVDepartment of Biotechnology, Plant Breeding and Genetics, 1 Teatralnaya Sg., Saratov,Russian Federation.
Cytogenetic and phytopathologic evaluation of bread wheat–alien lines.
N.V. Stupina, E.D. Badaeva (Engelhardt Institute of Molecular Biology, Vavilova St., 36, Moscow), Yu.V. Lobachev, andS.N. Sibikeev (Agricultural Research Institute for South-East regions, Tulaikov St., 7, Saratov, Russian Federation).
Bread wheat–alien lines were produced in the Agricultural Research Institute for South-East Regions by crossingcultivars of bread wheat with T. turgidum subsp. durum cultivars L1078 and L2505, T. turgidum subsp. dicoccoides lineL2560, Ae. speltoides lines L2608 and L2166, Ae. umbellulata lines L1046/2 and L1074/2, S. cereale line L2075, Ag.intermedium lines L1740, Multy 6R, and L1059, and Ag. elongatum lines L1015 and L1016. All investigated lines have42 chromosomes. C-banding patterns of the abovementioned lines showed that some of the lines have a substitution ofbread wheat chromosomes by alien chromosomes: L1059 and Multy 6R, 6Agi (6D); L1015 and L1016, 3Age (3D); andL1046/2 and L1074/2, 2U (2A). Other lines have translocations: L2608, T2BL-2SL (these lines were kindly providedby I.F. Lapochkinoj); L2166, T2D-2S; and L2075, T1RS·1BL.
Analysis of the first meiotic metaphase in the F1 hybrids ‘L1078/Saratovskaya 29’
and ‘L2505/Saratovskaya 29
shows that chromosome pairing is normal, but 2 to 4 univalents were observed in the ‘L2560/Saratovskaya 29 F1 hybrid.
Line L2560 may have a inversion in the from T. turgidum subsp. dicoccoides chromosome, which carries a gene forresistance to leaf rust.
Phytopathologic evaluation of perspective spring bread wheat–alien lines were made. The bread wheat cultivarsSaratovskaya 55 and L 503 served as controls. For resistance to leaf rust in 2003–04, we selected lines Multy 6R, L487,L484, and L2870, which had the infection type (IT) 0;. The IT in lines L784, L856, and the check cultivars was 3. Toevaluate powdery mildew resistance, all lines had an IT = 3, with the exception of L487, which had an IT = 2. The IT ofSaratovskaya 55 was 4 and that of L 503 was 1. For stem rust resistance, lines L784 (IT = 1) and L856 (IT = 0;) wereconsidered resistant; all other lines were IT = 3.
Study of embryogenic processes in the wheat somatic callus with the use of genetic models.
N.V. Evseeva, I.Yu. Fadeeva, and S.Yu. Shchyogolev (Institute of Biochemistry and Physiology of Plants and Microor-ganisms, Russian Academy of Sciences, 13 Entusiastov Ave., Saratov), and O.V. Tkachenko and Yu.V. Lobachev.
In vitro somatic embryogeny is used widely in investigations of specific gene expression and their translation products,which are representative of the embryogenic potential of plant callus cells. To solve these problems, we need to createexperimental genetic models based on isogenic lines with a known functional relationship between the gene expressionand the phenotypic behavior of the protein encoded.
Previously, we described the relationship between the embryogenic potential of wheat calli and the content ofthe proliferative antigen of initial cells (PAI) therein by a genetic model including a tall cultivar (Saratovskaya 29) of softspring wheat and its NILs differing in the dwarfing gene Rht-B1c. This genetic model is extended here by investigatinglines with RhtB1b and Rht14 alleles and their tall sibs. Relative, semiquantitative analysis of PAI content was done on abasis of a solid-phase immunoassay using monospecific antibodies to PAI. Dwarf lines have a higher embryogenicpotential than their tall sibs and Saratovskaya 29 in PAI content at certain stages of the callus genesis (24 and 30 days).In addition, the embryogenic potential of dwarf line RhtB1c exceeds that of the other dwarf lines (RhtB1b and Rht14),which have less embryogenic potential in the PAI content. This fact can be used in bioengineering work when evaluatingthe embryogenic potential of newly produced wheat lines in an in vitro culture.
119
A n n u a l W h e a t N e w s l e t t e r V o l. 5 1.
SIBERIAN INSTITUTE OF PLANT PHYSIOLOGY AND BIOCHEMISTRYSiberian Division of the Russian Academy of Sciences, Lermontov str., 132, Irkutsk-33,P.O Box 1243, Russian Federation, 664033.
The impact of early autumn frost on the efflux of nitrous substances in spring wheat.
A.K. Glyanko, N.V. Mironova, and G.G. Vasilieva.
Introduction. Frost during the period of ripening and maturing of spring wheat grain is a typical natural phenomenon inmany parts of the world (Russian Federation, Scandinavian countries, Canada, and the USA). The short-term impact ofnegative temperature on plants at this time (particularly during milky ripeness) is a decrease in the technological andsowing qualities of the grain resulting in the formation of so-called ‘frost-beaten grain’ with low germinating capacity,low test weight, and low flour production (Lamb 1967; Razumovsky and Zabotina 1969; Reimers and Illi 1974). Wheatfrom such grain have a low initial intensity of growth and morphological distortions (Pavlov 1967; Illi et al. 1979). Suchproperties of the grain after an early autumn frost are apparently conditioned by the negative influence of cold on thephysiological-biochemical processes that are responsible for grain ripening and maturing. Among these processes, thoseof nitrous substances efflux from vegetative parts of the plants to reproductive organs in the period of kernel formationare very important. The present work was aimed at determining the degree of impact of early autumn frost at milkyripeness on the nitrogen efflux from leaves, stems, and spike (chaff) towards the kernel.
Materials and Methods. The spring wheat Skala was grown in a climatic chamber with the temperature regime of 19± 1/1 5 ± 1°C (day/night). Illumination was by incandescent lamps DRL-700 with a light intensity of 14 ± 0.5 kl and a16-hour light period. Infrared radiation of the lamps was precluded by a water screen. Sandy soil with a low content oftotal nitrogen (0.009 %) was used for plant growth. Macroelements from Gelrigel’s mixture and microelements as perHogland (Grodzinsky and Grodzinsky 1973) were introduced in the enameled vessels with soil (tank capacity was 9 kgof dry soil). Soil moisture was maintained at 70 % of complete soil moisture capacity (SMC). Ten days prior to termina-tion of the experiment, soil moisture was reduced to 45–50 % SMC. Each vessel contained five plants at the end of theexperiment.
The plants were subjected to an artificial frost with the intensity of –6.5 ± 0.5°C at milky ripeness stage (mois-ture 55–60 %). The frost was simulated at night, in the dark. All temperature regulating operations in the freezer wereperformed automatically in compliance with the program, which included a gradual reduction of temperature from 15 to0°C (1°C/12 min). Further reduction down to a minimum negative temperature of –6.5 ± 0.5°C was at 1°C/22 min(Kurets 1974). After 1.5-h exposure at –6.5 ± 0.5°C, the temperature was increased to 0°C and then to 15°C with a speed1°C/12 min. Total duration of negative temperature impact on the plants was 6 hours. The plants did not show anyvisible damage.
Control plants were placed in the chamber with optimal growth temperature. One and one-half hours after thetermination of extreme temperature factor impact on the test plants, both sets of plants were fed via roots with 15N-labeled Ca(NO
3)
2 at a dose of 100 mg of nitrogen/vessel. Nitrogen enrichment was 95.05 atomic % 15N. Further growth
of both control and test plants was conducted at the temperature conditions preceding the frost.
Samples for analysis were selected after 7 days (beginning at waxy ripeness phase, grain moisture 38–40 %) and19 days (end of waxy ripeness phase, grain moisture 17–19 %). The plants were divided into leaves, stems, shaft, andgrain. After drying at 105°C, the samples were reduced to a powder. Plant material samples were burned in concentratedsulfuric acid with the catalyst (selenium). Nitrogen was determined per K’eldal’s micromethod (Ermakov et al. 1987).The samples were enriched with heavy-isotope nitrogen on an MI-1305 mass-spectrometer (Optical-mechanical Plant,Sumy, Ukraine). The content of marked nitrogen in the plants samples was calculated according to the formula ofisotope dilution (Korenkov 1977). The test was repeated six times. The results are presented as average arithmeticmeans with the standard error identified. Reliability of differences was assessed by Student criterion.
Results and Discussion. Depending on the state in which plants overcome the impact of negative temperature, super-cooling or ice formation in the cells, the degree of damage will vary (Drozdov et al. 1977). Our test wheat plants wentthrough the artificial frost apparently in the state of supercooling, because they showed no visible damage. The absolute
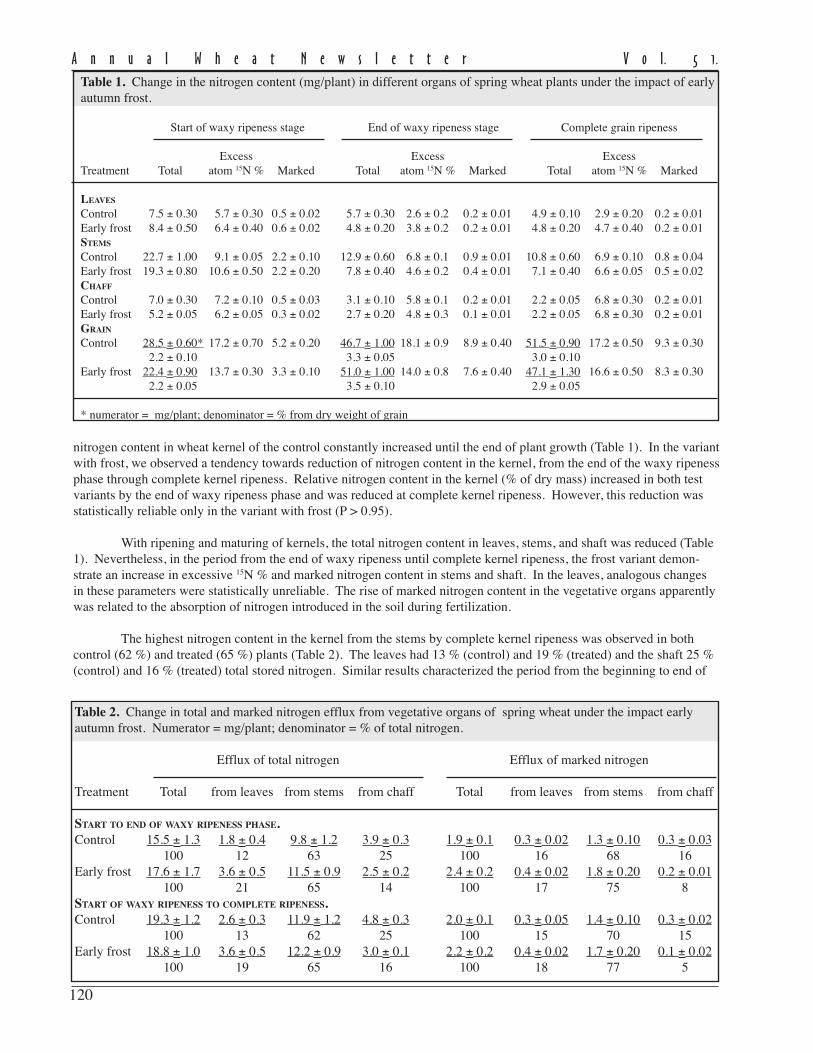
120
A n n u a l W h e a t N e w s l e t t e r V o l. 5 1.
nitrogen content in wheat kernel of the control constantly increased until the end of plant growth (Table 1). In the variantwith frost, we observed a tendency towards reduction of nitrogen content in the kernel, from the end of the waxy ripenessphase through complete kernel ripeness. Relative nitrogen content in the kernel (% of dry mass) increased in both testvariants by the end of waxy ripeness phase and was reduced at complete kernel ripeness. However, this reduction wasstatistically reliable only in the variant with frost (P > 0.95).
With ripening and maturing of kernels, the total nitrogen content in leaves, stems, and shaft was reduced (Table1). Nevertheless, in the period from the end of waxy ripeness until complete kernel ripeness, the frost variant demon-strate an increase in excessive 15N % and marked nitrogen content in stems and shaft. In the leaves, analogous changesin these parameters were statistically unreliable. The rise of marked nitrogen content in the vegetative organs apparentlywas related to the absorption of nitrogen introduced in the soil during fertilization.
The highest nitrogen content in the kernel from the stems by complete kernel ripeness was observed in bothcontrol (62 %) and treated (65 %) plants (Table 2). The leaves had 13 % (control) and 19 % (treated) and the shaft 25 %(control) and 16 % (treated) total stored nitrogen. Similar results characterized the period from the beginning to end of
Table 1. Change in the nitrogen content (mg/plant) in different organs of spring wheat plants under the impact of earlyautumn frost.
Start of waxy ripeness stage End of waxy ripeness stage Complete grain ripeness
Excess Excess ExcessTreatment Total atom 15N % Marked Total atom 15N % Marked Total atom 15N % Marked
LEAVES
Control 7.5 ± 0.30 5.7 ± 0.30 0.5 ± 0.02 5.7 ± 0.30 2.6 ± 0.2 0.2 ± 0.01 4.9 ± 0.10 2.9 ± 0.20 0.2 ± 0.01Early frost 8.4 ± 0.50 6.4 ± 0.40 0.6 ± 0.02 4.8 ± 0.20 3.8 ± 0.2 0.2 ± 0.01 4.8 ± 0.20 4.7 ± 0.40 0.2 ± 0.01STEMS
Control 22.7 ± 1.00 9.1 ± 0.05 2.2 ± 0.10 12.9 ± 0.60 6.8 ± 0.1 0.9 ± 0.01 10.8 ± 0.60 6.9 ± 0.10 0.8 ± 0.04Early frost 19.3 ± 0.80 10.6 ± 0.50 2.2 ± 0.20 7.8 ± 0.40 4.6 ± 0.2 0.4 ± 0.01 7.1 ± 0.40 6.6 ± 0.05 0.5 ± 0.02CHAFF
Control 7.0 ± 0.30 7.2 ± 0.10 0.5 ± 0.03 3.1 ± 0.10 5.8 ± 0.1 0.2 ± 0.01 2.2 ± 0.05 6.8 ± 0.30 0.2 ± 0.01Early frost 5.2 ± 0.05 6.2 ± 0.05 0.3 ± 0.02 2.7 ± 0.20 4.8 ± 0.3 0.1 ± 0.01 2.2 ± 0.05 6.8 ± 0.30 0.2 ± 0.01GRAIN
Control 28.5 ± 0.60* 17.2 ± 0.70 5.2 ± 0.20 46.7 ± 1.00 18.1 ± 0.9 8.9 ± 0.40 51.5 ± 0.90 17.2 ± 0.50 9.3 ± 0.302.2 ± 0.10 3.3 ± 0.05 3.0 ± 0.10
Early frost 22.4 ± 0.90 13.7 ± 0.30 3.3 ± 0.10 51.0 ± 1.00 14.0 ± 0.8 7.6 ± 0.40 47.1 ± 1.30 16.6 ± 0.50 8.3 ± 0.302.2 ± 0.05 3.5 ± 0.10 2.9 ± 0.05
* numerator = mg/plant; denominator = % from dry weight of grain
Table 2. Change in total and marked nitrogen efflux from vegetative organs of spring wheat under the impact earlyautumn frost. Numerator = mg/plant; denominator = % of total nitrogen.
Efflux of total nitrogen Efflux of marked nitrogen
Treatment Total from leaves from stems from chaff Total from leaves from stems from chaff
START TO END OF WAXY RIPENESS PHASE.Control 15.5 ± 1.3 1.8 ± 0.4 9.8 ± 1.2 3.9 ± 0.3 1.9 ± 0.1 0.3 ± 0.02 1.3 ± 0.10 0.3 ± 0.03
100 12 63 25 100 16 68 16Early frost 17.6 ± 1.7 3.6 ± 0.5 11.5 ± 0.9 2.5 ± 0.2 2.4 ± 0.2 0.4 ± 0.02 1.8 ± 0.20 0.2 ± 0.01
100 21 65 14 100 17 75 8START OF WAXY RIPENESS TO COMPLETE RIPENESS.Control 19.3 ± 1.2 2.6 ± 0.3 11.9 ± 1.2 4.8 ± 0.3 2.0 ± 0.1 0.3 ± 0.05 1.4 ± 0.10 0.3 ± 0.02
100 13 62 25 100 15 70 15Early frost 18.8 ± 1.0 3.6 ± 0.5 12.2 ± 0.9 3.0 ± 0.1 2.2 ± 0.2 0.4 ± 0.02 1.7 ± 0.20 0.1 ± 0.02
100 19 65 16 100 18 77 5
121
A n n u a l W h e a t N e w s l e t t e r V o l. 5 1.
waxy ripeness. We concluded that during both interphase periods, frost resulted in a reliable reduction of nitrogen effluxfrom shaft to kernel (P ≥ 0.99). We also observed a reliable (P > 0.95) increase in nitrogen efflux from the leaves duringthe period from beginning to end of waxy ripeness. Nevertheless, these changes were unreliable for the beginning of thewaxy ripeness phase.
Further data analysis showed that an increase in nitrogen content in the kernel of the plants subjected to frost bycomplete ripeness amounted to 24.7 ± 1.6 mg/plant (range 22.4 ± 0.9–47.1 ± 1.3 mg/plant), including marked nitrogen5.0 ± 0.3 mg/plant (range 3.3 ± 0.1–8.3 ± 0.3 mg/plant) (Table 1). Consequently, an increase in total and markednitrogen content in the kernel exceeded the amount of nitrogen arriving from the vegetative organs by 24 % (P > 0.95)and 57 % (P > 0,99 for total and marked nitrogen, respectively (the decrease in total and marked nitrogen from vegeta-tive organs amounted to 18.8 ± 1.0 and 2.2 ± 0.2 mg/plant, respectively). In other words, plants subjected to frost usedboth nitrogen accumulated in the vegetative organs and nitrogen from soil solution for kernel formation, a considerablepart of which was marked nitrogen.
The control plants showed similar regularities but used soil nitrogen to lesser extent. Thus, the total nitrogenincrease in the kernel exceeded its efflux from vegetative organs by 16 % (the difference is unreliable) and markednitrogen increased to 51 % (P > 0.99).
If we calculate the value of parameters considered in relation to the period beginning to the end of waxyripeness, we find that total nitrogen inflow into the kernel will exceed its efflux from the vegetative organs by 38 % (11.0± 2.1 mg/plant; P > 0.99) in the frost variant and 15 % (2.7 ± 18 mg/plant; the difference is unreliable) in control plants.Consequently, between the beginning and end of waxy ripeness, nitrogen from the soil also was used for kernel forma-tion.
In the plants subjected to frost, use of total nitrogen from soil for kernel formation from the end of waxyripeness to complete ripeness declined from 38 % (11.0 ± 2.1 mg/plant) to 24 % (5.9 ± 1.9 mg/plant) (the difference isunreliable) and that of marked nitrogen increased from 44 (1.9 ± 0.1 mg/plant) to 57 % (2.8 ± 0.2 mg/plant) (P > 0.95).We conclude that frost stimulated the use of marked nitrogen for kernel formation. However, frost did not produce areliable impact on the total nitrogen content in the kernel at maturity (Table 1). We note a reduction in the relativecontent of total nitrogen in the kernel from the end of waxy ripeness to complete ripeness (Table 1). Nitrogen loss fromthe kernel at maturity has been described (Kumakov 1987; Korovin 1984). Korovin (1984) indicated that this phenom-enon may be accounted for by increased moisture and low environmental temperature. The concrete physiological-biochemical mechanism of this fact is unknown.
Our tests on early autumn frosts produced a significant impact on the efflux of total and marked nitrogen fromthe vegetative organs to the kernel. Total nitrogen efflux from the leaves increased and from the shaft was reduced. Weobserved an increased of marked nitrogen efflux from the stems between the beginning and end of the waxy ripenessstage. Stimulating or hampering physiological functions after stress may be connected with the ability of the plant anddepend on the character and intensity of the stress (Drozdov at al. 1977; Al’tergot 1981). For the spike rachis and thecloseness of the nitrogen source used by maturing kernels, then a reduction in nitrogen after a frost could impact proteinsynthesis in the kernel. Earlier investigations showed that an early autumn frost causes changes in the proportion of vitalreserve proteins of spring wheat kernels (glutenin and gliadin) (Glyanko and Trufanov 1999). Similar changes mayaffect baking qualities of wheat grain.
References.Al’tergot VF. 1981. Increased temperature impact on the plants in experimental and natural conditions. Nauka, Mos-
cow (in Russian).Drozdov SN, Sycheva ZF, Budykina NP, et al. 1977. Ecological-physiological aspects of plants resistance to frost.
Nauka, Leningrad (in Russian).Ermakov AI, Arasimovich VV, and Jarosh NP. 1987. Methods of biochemical investigation of plants. VO
Agropromizdat, Leningrad (in Russian).Glyanko AK and Trufanov VA. 1999. Nitrogen accumulation and protein content in spring wheat corn under the
influence of frost. Agric Biol 5:36-43 (in Russian).Grodzinsky AM and Grodzinsky DM. 1973 . Concise manual on plant physiology. Naukova Dumka, Kiev (in Russian).Illi IE, Orekhova GV, and Lysak LN. 1979. Temperature impact on the dynamics of proteins of wheat seeds in the stage
of formation. In: Biochemical and physiological investigations of the seeds. (Reimers FE Ed). Irkutsk. Pp. 42-57(in Russian).
122
A n n u a l W h e a t N e w s l e t t e r V o l. 5 1.
Korenkov D. 1977. Methods of application of nitrogen isotope 15N in agricultural chemistry. Kolos Publishing House,Moscow (in Russian).
Kumakov VA. 1978. Biology of spring wheat. In: The spring wheat. Kolos Publishing House, Moscow. Pp 27-72 (inRussian).
Korovin -I. 1984. Plants and extreme temperatures. Hydrometeoizdat Publishing House, Leningrad (in Russian).Kurets V. 1974. The Irkutsk phytotron. Nauka, Novosibirsk (in Russian).Lamb C.A. 1967. Physiology of wheat. In: Wheat and Wheat Improvement (Reitz LP and Quisenberry KS, Eds).
Amer Soc Agron, Madison, WI. Pp. 199-249.Pavlov AN. 1967. Protein accumulation in wheat and maize grains. Nauka, Moscow (in Russian).Razumovsky AG and Zabotina EI. 1969. Sowing and technological qualities of frost-beaten corn. In: Materials of
Krasnoyarsk SRI of Agriculture. 5:18-22 (in Russia).Reimers FE and Illi I.E. 1974. Physiology of Siberian cultural plants seeds. Nauka, Novosibirsk (in Russian).
Influence of low-intensity laser radiation on lipid peroxidation in wheat callus cultures.
R.K. Salyaev, L.V. Dudareva, S.V. Lankevich, V.M. Sumtsova, and E.G. Rudikovcka.
During the last two decades, low-intensity laser radiation in the visible and near-infrared ranges is finding an increasingapplication in biological studies including biotechnological research (Grishko et al. 1999). However, up to now, the dataare scarce on the mechanism of the effect of laser light on biological subjects because of difficulties encountered inanalyzing light energy transformations in cells and the complexity of the response of a complex living system, multilevelin its organization, to laser effects. At present, we are actively pursued the effect of low-intensity laser radiation onanimal and human tissues (Skobelkin 1997). At the same time, we emphasize that plants are evolutionary more adaptedto the perception and assimilation of light energy, because they include a multitude of light-sensitive compounds, such asphytochromes and photosynthetic pigments. In our opinion, plants are particularly interesting for investigating themechanisms of laser radiation.
Previously, we showed that low-intensity laser radiation stimulates morphogenetic processes in tissue culturesof wheat and wild grasses, such as rhizogenesis and the formation of morphogenic calli and regenerated plants (Salyaev2001a and b). However, laser light can be regarded not only as a stimulant, but also as a stress agent damaging cells andtissues, most notably at the initial stages of radiation (Rogatkin and Chernyi 1999).
Generation of reactive oxygen species and an enhancement in lipid peroxidation processes are known to be theprimary responses to many stress agents (Baraboi 1991; Smirnoff 1993; Kurganova et al. 1997; Kuznetsov 2000). In thisconnection, establishing whether or not the low-intensity laser radiation can induce lipid peroxidation in plant tissueswas important. An analysis of accumulation of the primary and secondary products of lipid peroxidation can be regardedas one of possible lines of approaching such problem. Therefore, the objective of this work was to investigate the effectof low-intensity laser radiation on the process of accumulation of secondary lipid peroxidation products in wheat tissueculture.
The wheat cultivar Skala (bred in Siberia) tissue culture was used in this work. A mature embryo with half ofendosperm was used as an explant. Callus formation was induced on a modified Murashige-Skoog medium comple-mented with 2 % sucrose and 2 mg/l 2,4-D. The calli were irradiated on the 6th day of the first subculture.
Calli irradiation was performed during 5 min using a LG-79 helium-neon laser with a radiation wavelength of632.8 nm and an intensity of 10 mW at the sample level. Irradiation intensity was measured using a LM-2 device (CarlZeiss, Germany). The calli were irradiated directly in glass test tubes (10 mm in diameter) used for their culturing, andlight-intensity losses in passing through the glass did not exceed 12 %. Before and after irradiation, the calli were grownin the dark. In each independent experiment, 100 calli were used; half of them served as a control, and the other half wastreated by the helium-neon laser.
The content of the compounds under investigation in the calli was determined immediately following radiationand also after 48 h. The lipid peroxidation level was assessed spectrophotometrically (Kurganova et al. 1997) as anamount of lipid peroxidation products that react with thiobarbituric acid (TBA-reactive products). To this end, 0.2 g ofcallus tissue was ground in a homogenizer with 9 ml of heptane:isopropanol (1:1, v/v) mixture. The homogenate thus

123
A n n u a l W h e a t N e w s l e t t e r V o l. 5 1.
obtained was supplemented with 0.1 ml of saturated TBA solution and centrifuged at 4000 rev/min for 10 min. Thesupernatant diluted with distilled water was shaken; after phase separation, the upper heptane fraction was collected.This fraction was supplemented with ethanol (1:5, v/v), and the optical density of the mixture at 532 nm was determinedusing an SF-46 spectrophotometer (LOMO, Russia). In all cases, the amount of secondary lipid peroxidation products inthe samples was calculated from the spectrophotometric readings using molar extinction coefficient. Means from threeexperiments (each including nine biological replications) and their standard errors are shown in the figure. Eachbiological replication included from four to seven calli.
The changes in the accumulation of secondary lipidperoxidation products in wheat tissue culture induced by low-intensity laser radiation are sufficiently clear-cut (Fig. 1). TBA-reactive product content in the tissue increased from 0.73 nmol/g fr wt in the control to 1.17 nmol /g fr. wt immediately afterirradiation. Within 2 days after irradiation, this differencesomewhat decreased, but nevertheless remained quite signifi-cant: TBA-reactive product contents in the control and irradi-ated samples were 1.02 and 1.12 nmol/g fr. wt, respectively.Thus, after 48 h, the content of TBA-reactive products incontrol samples somewhat increased as compared to thatobserved immediately after irradiation. Judging from thepublished evidence (Smirnoff 1993), this can be related to acyclic stress-response pattern in the wheat tissue culture causedby subculturing to a new culture medium. In this case, thephases of these cycles in the control and laser-irradiated samplesmost likely do not coincide with each other.
The data suggest that low-intensity laser radiation caninduce lipid peroxidation in wheat tissue culture. We showedthat the initial response of a plant tissue to irradiation involvedan increase in the content of secondary lipid peroxidation
products (see Fig. 1). Moreover, we showed that, as an aftereffect, laser light stimulated the morphogenetic processes inplant tissues (Salyaev et al. 2001a and b). In our opinion, this stimulation could result from the metabolic changesinduced by the alterations in the contents of compounds, such as lipid peroxidation products, formed in the primaryphotoreactions. The changes in cells produced by the accumulation of these compounds could serve as a signal trigger-ing not only respective defense mechanisms, but also some secondary responses including those on the transcriptionlevel (Karu 2001). This suggestion is indirectly supported by stimulation of the morphogenetic processes in the tissuecultures of wheat and wild grasses under the effect of low-intensity coherent radiation (Salyaev et al. 2001a and b).
Thus, we suggest that a general cell response induced by laser-light irradiation can be divided into two specificresponses, which do not coincide in time. The first one consists of a rapid stress effect resulting in an increase in theamount of lipid peroxidation products, and the second and longer one, are the secondary reactions related to the adaptivemetabolic changes and apparently accompanied by the stimulation of morphogenetic processes.
References.Baraboi VA. 1991. Mechanisms of stress and lipid peroxidation, Usp Sovrem Biol 111:923-931.Grishko VP, Grishko VT, and Glick BR. 1999. Molecular laser technology. Biotech Adv 17:341-362.Karu TI. 2001. Cell mechanisms of low-intensity laser therapy. Usp Sovrem Biol 121:110-120.Kurganova LN, Veselov AP, Goncharova TA, and Sinitsina YuV. 1997. Lipid peroxidation and antioxidant system of
protection against heat shock in pea (Pisum sativum L.). Fiziol Rast (Moscow). 44:725-730 (Rus J Plant Physiol,Eng Transl).
Kuznetsov VlV. 2001. XII Congress of the Federation of European Societies of Plant Physiologists (FESPP, 21–25August, 2000, Budapest, Hungary). Fiziol Rast (Moscow) 48:644-648 (Rus J Plant Physiol, Eng Transl).
Rogatkin DA and Chernyi VV. 1999. Low-intensity laser therapy: The physical point of view on the mechanism ofaction and application. In: Vzaimodeistvie izluchenii i polei s veshchestvom (Interaction of radiation and fields withmaterials) (Denisyuk YuN et al. eds). Irkutsk: SiLaP, pp. 366-378.
Fig. 1. Effect of low-intensity laser radiation onthe thiobarbituric acid-reactive product (TBA)accumulation in wheat tissue culture.
124
A n n u a l W h e a t N e w s l e t t e r V o l. 5 1.
Salyaev RK, Dudareva LV, Lankevich SV, and Sumtsova VM. 2001a. The effect of low-intensity coherent radiation onthe processes of morphogenesis in the wheat callus culture. Dokl Akad Nauk 376:830-832.
Salyaev RK, Dudareva LV, Lankevich SV, and Sumtsova VM. 2001b. The effect of low-intensity coherent radiation onthe callus formation in the wild cereals. Dokl Akad Nauk 379:819-820.
Skobelkin OS, ed. 1997. Primenenie nizkointensivnykh lazerov v klinicheskoi praktike (Application of Low IntensityLasers in Clinical Practice). Moscow, Meditsyna (In Russian).
Smirnoff N. 1993. The role of active oxygen in the response of plants to water deficit and desiccation. New Phytol125:27-58.
Nitrate reductase activity at different levels of nitrate nitrogen availability for spring wheat.
A.K. Glyanko, O.A. Pochabova, N.V. Mironova, and G.G. Vasilieva.
Nitrate reductase (NR) is an enzyme well-known to plant biologists, which acts as a limiting link in the chain of nitratereduction to ammonium and catalyzes the first stage of nitrate reduction to nitrite. Most of the studies of NR physiologi-cal and biochemical properties were published in the 1960s–80s. In particular, plant physiologists revealed the connec-tion between NR activity and cultural plants productivity, protein synthesis in crops grain, as well as intensity of nitrogenassimilation by the plants (Deckard et al. 1973; Rautou et al. 1977; Peshkova and Khavkin 1980). Pekker and TOkarev(1984) suggest use of NR activity for diagnosing plants nitrogen nutrition. In the last few years, interest in NR has beenfostered by the discovery of NR ability to reduce nitrite to nitric oxide (NO), a molecule that plays an important role inthe vital processes of animals and plants (Yamasaki and Sakihama 2000; Desikan et al. 2002; Garcia-Mota andLamathina 2003). This article sums up the results of tests on determination of NR activity during the vegetation periodof spring wheat (Skala) depending on the dose of nitrogen fertilizer. The work was targeted at finding the dependencebetween NR activity and the degree of nitrate nitrogen availability for the plants.
Materials and Methods. The tests were performed in vegetation vessels with the capacity of 4 kg of dry soil with lowcontent of total nitrogen (0.009 %). The mixture with nitrate source of nitrogen was used as a nutritious mineral mixture(Thomas et al. 1979). The content of mineral nitrogen introduced in the vessels varied from 0 to 800 mg / vessel. Soilmoisture in the vessels was maintained at the level of 65–70 % of total moisture capacity. 10 plants grown in the vegeta-tion house from June to August were left in each vessel.
NR activity was determined in anaerobic medium according to the method described in Mulder et al. (1959)using disks (0.05–0.1 mm) cut out from the leaves. The samples (0.3 g of fresh tissue) were placed in retorts containingthe following: 0.1 M phosphate buffer with pH 7.8 (5 ml ); neutralized 0.1 M solution of malic acid (1 ml ); 5 % solutionKNO
3 (1 ml ) and 3 ml of distilled water. The retorts were placed in the vacuum-desiccator, with air pumped out, and
kept for 1 h at 27˚C. Enzyme reaction was terminated by adding 1 ml of 10 % acetic acid and 2 ml of saturated ammo-nium sulfate solution. In the control sample the enzyme reaction was terminated prior to incubation of the reactionmixture. NR activity was determined on the basis of the quantity of nitrites formed as a result of enzyme reaction; theircontent was determined in the filtrate with 0.6 % sulfanilamide in HCI and 0.6 % solution of N-(l- naphtyl) ethylenedi-amine hydrochloride. The color intensity was measured on the photocolorimeter (FEK-56M) at wave length of 546 nm.The samples for determination of enzyme activity were taken during the phases of two, three, four leaves, to come intoear and blooming. The upper growing and lower green leaves were subjected to analysis. The test was repeated fivetimes; the analytical repetition is three times. Data are presented as mean ± standard deviation.
Results and Discussion. Table 3 (p. 125) shows that NR activity on the medium without nitrogen introduction isminimal during all the phases of plants development as compared to the variants with nitrogen introduced. The highestenzyme activity in this option was observed in the phase of two leaves, then with the plants growth and development itgradually came down, particularly in the lower leaf. Thus, at anthesis, NR activity in the upper leaf reduced by 2.6times, in the lower leaf, by eight times compared to two-leaf phase.
In the options with nitrogen introduction regardless of the dose, enzyme activity in the upper and lower leaveseither did not differ, or was slightly higher in the lower leaf than in the upper leaf. Starting from the three-leaf phase, NRactivity in the variants with nitrogen dose 40 and 100 mg/vessel gradually decreased, and more so in the lower leaf. Inthe variant with nitrogen dose 200 mg/vessel the enzyme activity in the upper leaf remained approximately at the samelevel up to the blooming phase, whereas in the lower leaf it decreased. In the variants with high nitrogen content (400
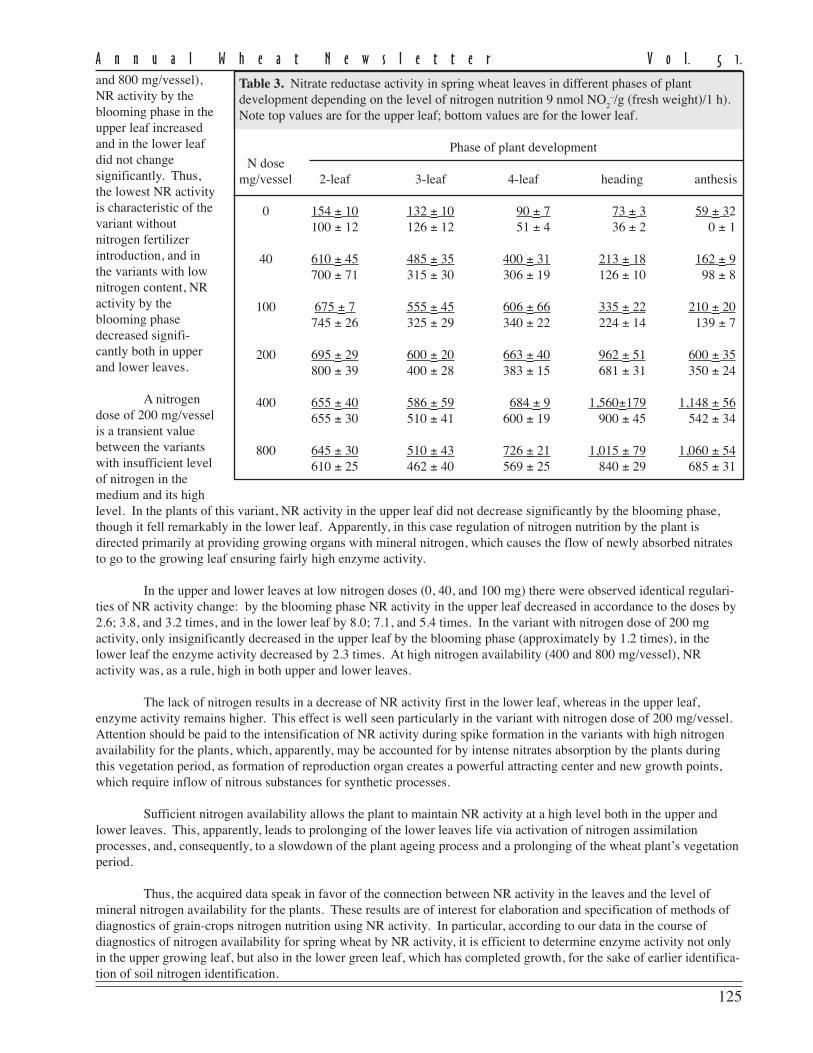
125
A n n u a l W h e a t N e w s l e t t e r V o l. 5 1.
and 800 mg/vessel),NR activity by theblooming phase in theupper leaf increasedand in the lower leafdid not changesignificantly. Thus,the lowest NR activityis characteristic of thevariant withoutnitrogen fertilizerintroduction, and inthe variants with lownitrogen content, NRactivity by theblooming phasedecreased signifi-cantly both in upperand lower leaves.
A nitrogendose of 200 mg/vesselis a transient valuebetween the variantswith insufficient levelof nitrogen in themedium and its highlevel. In the plants of this variant, NR activity in the upper leaf did not decrease significantly by the blooming phase,though it fell remarkably in the lower leaf. Apparently, in this case regulation of nitrogen nutrition by the plant isdirected primarily at providing growing organs with mineral nitrogen, which causes the flow of newly absorbed nitratesto go to the growing leaf ensuring fairly high enzyme activity.
In the upper and lower leaves at low nitrogen doses (0, 40, and 100 mg) there were observed identical regulari-ties of NR activity change: by the blooming phase NR activity in the upper leaf decreased in accordance to the doses by2.6; 3.8, and 3.2 times, and in the lower leaf by 8.0; 7.1, and 5.4 times. In the variant with nitrogen dose of 200 mgactivity, only insignificantly decreased in the upper leaf by the blooming phase (approximately by 1.2 times), in thelower leaf the enzyme activity decreased by 2.3 times. At high nitrogen availability (400 and 800 mg/vessel), NRactivity was, as a rule, high in both upper and lower leaves.
The lack of nitrogen results in a decrease of NR activity first in the lower leaf, whereas in the upper leaf,enzyme activity remains higher. This effect is well seen particularly in the variant with nitrogen dose of 200 mg/vessel.Attention should be paid to the intensification of NR activity during spike formation in the variants with high nitrogenavailability for the plants, which, apparently, may be accounted for by intense nitrates absorption by the plants duringthis vegetation period, as formation of reproduction organ creates a powerful attracting center and new growth points,which require inflow of nitrous substances for synthetic processes.
Sufficient nitrogen availability allows the plant to maintain NR activity at a high level both in the upper andlower leaves. This, apparently, leads to prolonging of the lower leaves life via activation of nitrogen assimilationprocesses, and, consequently, to a slowdown of the plant ageing process and a prolonging of the wheat plant’s vegetationperiod.
Thus, the acquired data speak in favor of the connection between NR activity in the leaves and the level ofmineral nitrogen availability for the plants. These results are of interest for elaboration and specification of methods ofdiagnostics of grain-crops nitrogen nutrition using NR activity. In particular, according to our data in the course ofdiagnostics of nitrogen availability for spring wheat by NR activity, it is efficient to determine enzyme activity not onlyin the upper growing leaf, but also in the lower green leaf, which has completed growth, for the sake of earlier identifica-tion of soil nitrogen identification.
Table 3. Nitrate reductase activity in spring wheat leaves in different phases of plantdevelopment depending on the level of nitrogen nutrition 9 nmol NO
2–/g (fresh weight)/1 h).
Note top values are for the upper leaf; bottom values are for the lower leaf.
Phase of plant developmentN dose
mg/vessel 2-leaf 3-leaf 4-leaf heading anthesis
0 154 ± 10 132 ± 10 90 ± 7 73 ± 3 59 ± 32100 ± 12 126 ± 12 51 ± 4 36 ± 2 0 ± 1
40 610 ± 45 485 ± 35 400 ± 31 213 ± 18 162 ± 9700 ± 71 315 ± 30 306 ± 19 126 ± 10 98 ± 8
100 675 ± 7 555 ± 45 606 ± 66 335 ± 22 210 ± 20745 ± 26 325 ± 29 340 ± 22 224 ± 14 139 ± 7
200 695 ± 29 600 ± 20 663 ± 40 962 ± 51 600 ± 35800 ± 39 400 ± 28 383 ± 15 681 ± 31 350 ± 24
400 655 ± 40 586 ± 59 684 ± 9 1,560±179 1,148 ± 56655 ± 30 510 ± 41 600 ± 19 900 ± 45 542 ± 34
800 645 ± 30 510 ± 43 726 ± 21 1,015 ± 79 1,060 ± 54610 ± 25 462 ± 40 569 ± 25 840 ± 29 685 ± 31
126
A n n u a l W h e a t N e w s l e t t e r V o l. 5 1.
References.Dalling MJ and Loyn RH. 1977. Level of activity of nitrate reductase at the seedlings stage as predictor of grain
nitrogen yield in wheat (Triticum aestivum L.). Aus J Agric Res 28:1-11.Deckard EZ, Lambert RJ, and Hageman RH. 1973. Nitrate reductase activity in corn leaves as related to yields of grain
and grain protein. Crop Sci 13:343-351.Desikan R, Griffiths R, Hancock J, and Neil S. 2002. A new role for on old enzyme: nitrate reductase - mediated nitric
oxide generation is required for abscisic acid induced stomatal closure in Arabidopsis thaliana. Proc Natl Acad SciUSA 99:16314-16318.
Garcia-Mata C and Lamathina L. 2003. Abscisic acid, nitric oxide and stomatal closure - is nitrate reductase one ofmissing links? TRENDS Plant Sci 8:20-26.
Mulder EG, Boxma R, and Van Veen WL. 1959. The effect of molybdenum and nitrogen deficiencies on nitratereduction in plant tissues. Plant and Soil 10:335-345.
Pekker EG and Tokarev BI. 1984. The biochemical approach to diagnostics of security of plants by nitrogen in a courseof vegetative period. In: Nitrogen exchange and crops productivity in the chimization of agriculture in WesternSiberia (Tokarev BI, Ed). Novosibirsk, pp. 27-42 (In Russian ).
Peshkova AA and Khavkin EE. 1980. Nitrate reductase activity and nitrates assimilation in connection with the growthspeed of maize sprouts. Fiziologia rastenii 27:1032-1039 (In Russian).
Rautou S, Boyat A, and Robin P. 1977. Because of the strategic role of nitrate reductase in nitrogen metabolism,relationschips between activity and productivity or quality of the kernel have been the subject of much research.Maize Genet Coop Newslet 51:27-29.
Thomas RJ, Feller H, and Erismann KN. 1979. The effect of different inorganic nitrogen sources and plant age on thecomposition of bleeding sap of Phaseoules vulgaris. New Phytol 82:657-669.
Yamasaki H and Sakihama Y. 2000. Simultaneous production of nitric oxide and peroxynitrite by plant nitrate reduc-tase: in vitro evidence for the NR-dependent formation of active nitrogen species. FEBS Lett 468:89-92.
Impact of disulfidreductase from the wheat caryopsis on certain technological characteristics ofwheat flour and dough.
S.V. Osipova, A.V. Permyakov, and T.N. Mitrofanova, and T.N. Pshenichnikova, M.F. Ermakova, andA.K. Chistyakova (Institute of Genetics and Cytology, Siberian Russian Academy of Sciences, Lavrentyev Ave. 10,Novosibirsk).
The technological quality of wheat flour is known to be largely dependent on highly-molecular subunits of glutenincontaining the biggest amount of SH-groups, capable of forming S-S links ( Payne 1987). Dependence of gluten qualityon the content of disulfide links was experimentally proven by Kretovich et al. (1978), Vakar et al. (1972 ), Bloksma(1975), and Kaczkowski et al. (1980). In our laboratory, we extracted the enzyme with thiol:proteindisulfide oxidoreduc-tase (EC 1.8.4.2) activity from wheat corn (Trufanov et al. 1999). The enzyme catalyzes dissociation of protein disul-fides using restored glutathione as a cofactor. Our model experiment has shown that wheat disulfidreductase reducesaggregation ability of gluten proteins, which is apparently caused by dissociation of proteins SS-links and consequentweakening of gluten matrix rigidity (Osipova et al. 2004). The investigation was focused on the impact ofdisulfidreductase preparation introduction in the course of dough kneading on certain technological characteristics offlour and dough.
Materials and Methods. Disulfidreductase was extracted and purified from flour of Siberian selection wheat,Tulunskaya 12 variety as per the earlier described methods (Trufanov et al. 1999). In the tests there were used partiallypurified disulfidreductase preparation containing admixture of glutathionreductase (N1) and preparation ofdisulfidreductase with enzyme purity, that is not containing admixtures of other thiol-disulfide metabolism (N2) en-zymes. Fifty mg of enzyme preparation containing approximately 3-5 units of disulfidreductase activity and NaCl wereadded to 50 g of flour of cultivar Mironovskaya 808. A similar portion (50 mg) of NaCl was added to control. Technicalparameters were analyzed in compliance with the methods of the State Variety Testing of Agricultures (Methods 1988).The physical properties of dough were studied using Chopin alveograph, which was used to determine specific work fordough deformation (strength of flour, W; units of alveograph, u.a.), tenacity (P, mm) and extensibility (L, mm), and P/Lratio. Table 4 presents average data of three independent tests ± standard error.
127
A n n u a l W h e a t N e w s l e t t e r V o l. 5 1.
Results and Discussion. The addition ofenzymes only insignificantly increases doughtenacity (P) (Table 4). Dough extensibility (L)values increase remarkably, N2 preparationaddition increases extensibility by 7 %, whereasthe addition of partially purified preparation(N1) by approximately 17 %. High efficiencyof N1 preparation may be accounted for by thefact that presence of glutathionreductaseensures fairly high amount of restored glutationrequired for catalytic activity ofdisulfidreductase. Flour strength reliablyincreases with the addition of enzyme prepara-tions. P/L proportion, however, practicallydoes not change, so on the whole gluten quality of the Mironovskaya 808 wheat does not improve. Nevertheless,significant, up to 17 %, increase of dough extensibility is of interest. These data allow us to infer that partially cleaneddisulfidreductase preparation containing glutathionreductase activity may be used to improve qualities of excessivelystrong, short-tearing gluten.
References.Bloksma AH. 1975. Thiol and disulfide groups in dough rheology. Cereal Chem 52:170-183.Gosagroprom M. 1988. Methods of state variety testing of agricultures.Kaczkovski J and Meleszko T. 1980. The role disulfide bonds and their localization in wheat protein molecules. Ann
Tech Agric 29:377-384.Kretovich VL and Zhmakina OA. 1978. On the nature of gluten links. Rep AS USSR 238:985-987.Osipova SV, Permyakov AV, Mitrofanova TN, and Trufanov VA. 2004. Thiol:protein disulfide oxidoreductase (EC
1.8.4.2) in wheat caryopses. C. Impact on aggregation of wheat storage proteins. Ann Wheat Newlet 50:144-145.Payne PI. 1987. Genetics of wheat storage proteins and the effect of allelic variation on breadmaking quality. Ann Rev
Plant Physiol 38:141-153.Trufanov VA, Kichatinova SV, and Permyakov AV. 1999. Enzymes of the thiol-disulfide exchange in wheat and their
effect on gluten proteins. Prikl Biochem Microbiol 35:219-222.Vakar AB, Demidov VS, and Zabrodina GM. 1972. Investigation of physical-chemical differences of various quality
gluten. Appl Biochem Microbiol 8:292-302.
Isoforms of glutathione reductase in wheat grains Triticum aestivum.
A.V. Permyakov, T.N. Mitrofanova, and S.V. Osipova.
Glutathione reductase (GR) catalyzes the NADPH-dependent reduction of oxidized glutathione (Foyer et al. 1997). Theprimary function of glutathione reductase is to maintain a high GSH/GSSG ratio in cells, which is crucial for a variety ofcellular functions, including the biosynthesis of DNA (Noctor et al. 1998). This flavoprotein oxidoreductase has acentral role in maintaining GSH within the cellular environment, particularly during stress. Most, if not all, stressesinclude an oxidative stress component (Prasad et al. 1994; Wise 1995) that leads to tissue damage if antioxidativedefenses are insufficient.
Wheat leaves contain two charge/mass-separable isoforms of glutathione reductase, one chloroplastic and theother probably cytosolic (De Lamotte et al. 2000). The endosperm of durum mature kernels contained a single form ofglutathione reductase; it appeared about the 18th day after anthesis, whereas another isoform, present at the early stagesof grain development, disappeared between the 20th and 30th days after flowering (Lascano et al. 2001).
Materials and Methods. Grains of the wheat cultivar Tulunskaya-12 were used in this research. The soluble, enzymati-cally active protein fraction of the wheat grains was extracted with a 0.1 Tris buffer, pH 7.5, containing 2 mM EDTA,from standard ground flour in the proportion 1:2 (weight:volume). The extract was subjected to chromatography onDEAE-Sephadex A-50. The protein fraction was eluted in a 0-0.6 M NaCl gradient. Fractions obtained were separatedaccording in 7 % PAAG to the method of Davis (1964) at the basic pH. Molecular forms of glutathione reductase were
Table 4. Alveograph parameters with enzyme additives introduction(Significant at * P > 0.05; ** P > 0.01).
Alveograph parameters
Flour strength Tenacity ExtensibilitySample W, u.a. P, mm L, mm P/L ratio
Control 188 ± 8 60 ± 0.5 112 ± 9 0.5 ± 0.04TREATMENT:Preparation N1 223 ± 6** 64 ± 4.0 131 ± 10* 0.5 ± 0.10Preparation N2 231 ± 2** 67 ± 4.0 120 ± 15 0.6 ± 0.10
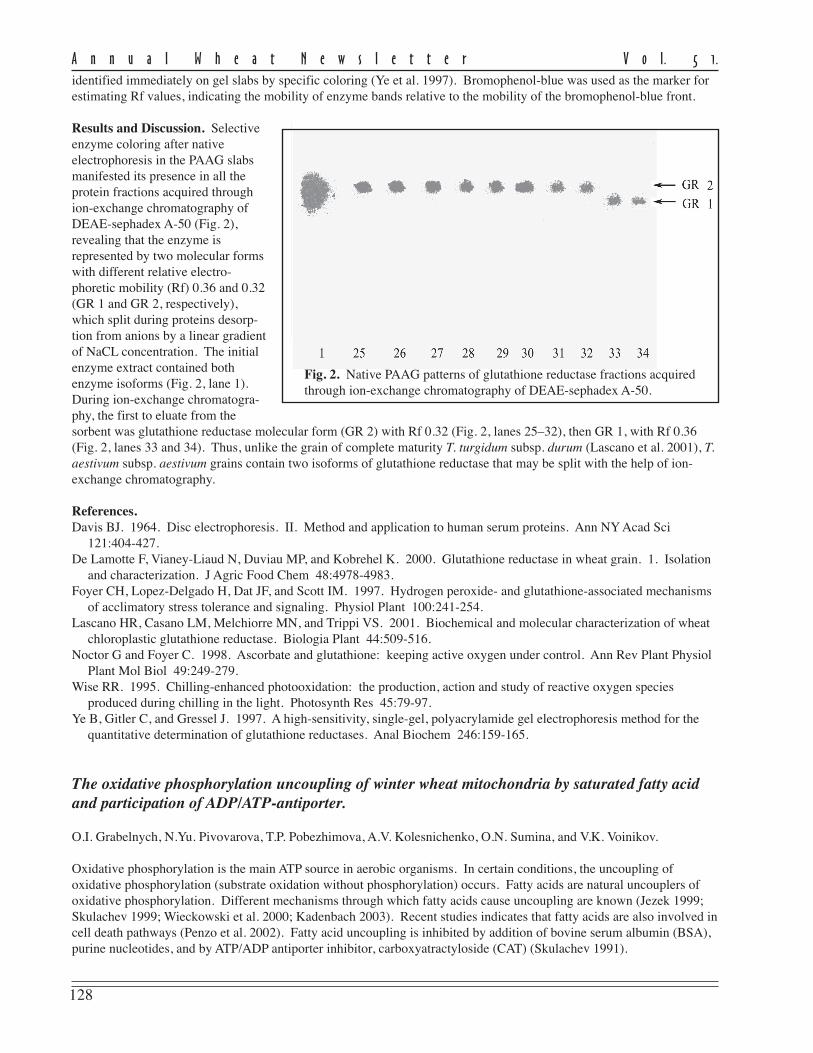
128
A n n u a l W h e a t N e w s l e t t e r V o l. 5 1.
identified immediately on gel slabs by specific coloring (Ye et al. 1997). Bromophenol-blue was used as the marker forestimating Rf values, indicating the mobility of enzyme bands relative to the mobility of the bromophenol-blue front.
Results and Discussion. Selectiveenzyme coloring after nativeelectrophoresis in the PAAG slabsmanifested its presence in all theprotein fractions acquired throughion-exchange chromatography ofDEAE-sephadex A-50 (Fig. 2),revealing that the enzyme isrepresented by two molecular formswith different relative electro-phoretic mobility (Rf) 0.36 and 0.32(GR 1 and GR 2, respectively),which split during proteins desorp-tion from anions by a linear gradientof NaCL concentration. The initialenzyme extract contained bothenzyme isoforms (Fig. 2, lane 1).During ion-exchange chromatogra-phy, the first to eluate from thesorbent was glutathione reductase molecular form (GR 2) with Rf 0.32 (Fig. 2, lanes 25–32), then GR 1, with Rf 0.36(Fig. 2, lanes 33 and 34). Thus, unlike the grain of complete maturity T. turgidum subsp. durum (Lascano et al. 2001), T.aestivum subsp. aestivum grains contain two isoforms of glutathione reductase that may be split with the help of ion-exchange chromatography.
References.Davis BJ. 1964. Disc electrophoresis. II. Method and application to human serum proteins. Ann NY Acad Sci
121:404-427.De Lamotte F, Vianey-Liaud N, Duviau MP, and Kobrehel K. 2000. Glutathione reductase in wheat grain. 1. Isolation
and characterization. J Agric Food Chem 48:4978-4983.Foyer CH, Lopez-Delgado H, Dat JF, and Scott IM. 1997. Hydrogen peroxide- and glutathione-associated mechanisms
of acclimatory stress tolerance and signaling. Physiol Plant 100:241-254.Lascano HR, Casano LM, Melchiorre MN, and Trippi VS. 2001. Biochemical and molecular characterization of wheat
chloroplastic glutathione reductase. Biologia Plant 44:509-516.Noctor G and Foyer C. 1998. Ascorbate and glutathione: keeping active oxygen under control. Ann Rev Plant Physiol
Plant Mol Biol 49:249-279.Wise RR. 1995. Chilling-enhanced photooxidation: the production, action and study of reactive oxygen species
produced during chilling in the light. Photosynth Res 45:79-97.Ye B, Gitler C, and Gressel J. 1997. A high-sensitivity, single-gel, polyacrylamide gel electrophoresis method for the
quantitative determination of glutathione reductases. Anal Biochem 246:159-165.
The oxidative phosphorylation uncoupling of winter wheat mitochondria by saturated fatty acidand participation of ADP/ATP-antiporter.
O.I. Grabelnych, N.Yu. Pivovarova, T.P. Pobezhimova, A.V. Kolesnichenko, O.N. Sumina, and V.K. Voinikov.
Oxidative phosphorylation is the main ATP source in aerobic organisms. In certain conditions, the uncoupling ofoxidative phosphorylation (substrate oxidation without phosphorylation) occurs. Fatty acids are natural uncouplers ofoxidative phosphorylation. Different mechanisms through which fatty acids cause uncoupling are known (Jezek 1999;Skulachev 1999; Wieckowski et al. 2000; Kadenbach 2003). Recent studies indicates that fatty acids are also involved incell death pathways (Penzo et al. 2002). Fatty acid uncoupling is inhibited by addition of bovine serum albumin (BSA),purine nucleotides, and by ATP/ADP antiporter inhibitor, carboxyatractyloside (CAT) (Skulachev 1991).
Fig. 2. Native PAAG patterns of glutathione reductase fractions acquiredthrough ion-exchange chromatography of DEAE-sephadex A-50.
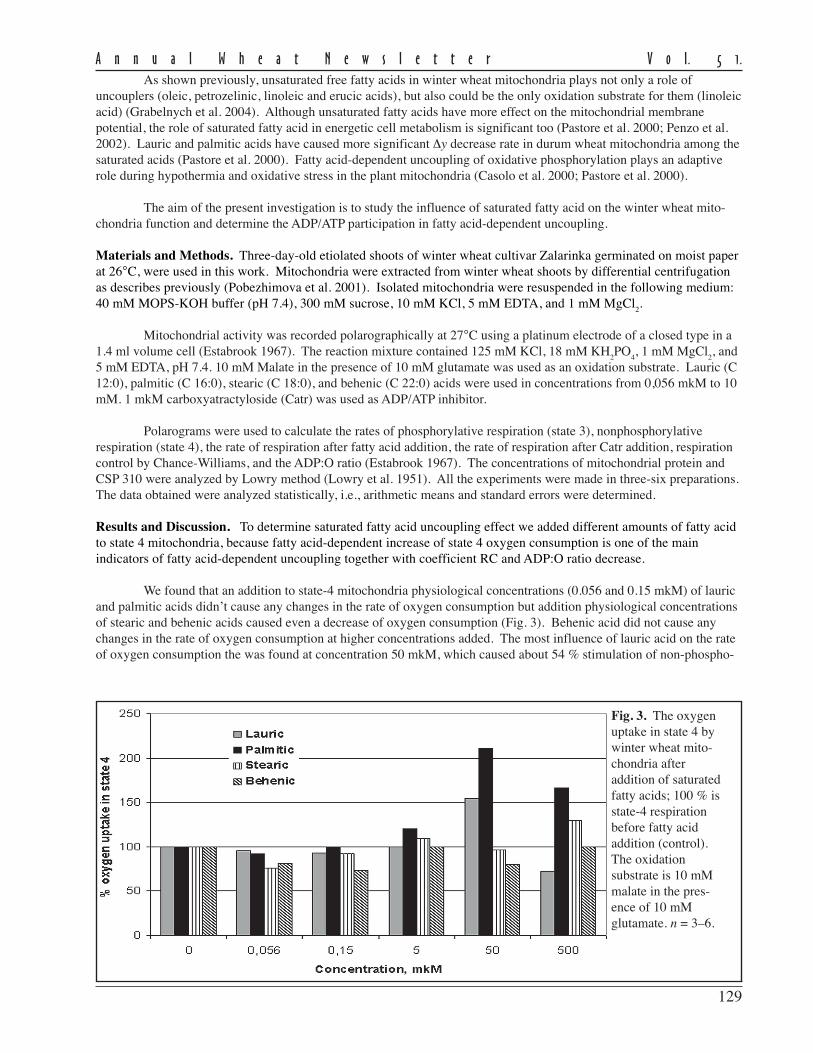
129
A n n u a l W h e a t N e w s l e t t e r V o l. 5 1.
As shown previously, unsaturated free fatty acids in winter wheat mitochondria plays not only a role ofuncouplers (oleic, petrozelinic, linoleic and erucic acids), but also could be the only oxidation substrate for them (linoleicacid) (Grabelnych et al. 2004). Although unsaturated fatty acids have more effect on the mitochondrial membranepotential, the role of saturated fatty acid in energetic cell metabolism is significant too (Pastore et al. 2000; Penzo et al.2002). Lauric and palmitic acids have caused more significant ∆y decrease rate in durum wheat mitochondria among thesaturated acids (Pastore et al. 2000). Fatty acid-dependent uncoupling of oxidative phosphorylation plays an adaptiverole during hypothermia and oxidative stress in the plant mitochondria (Casolo et al. 2000; Pastore et al. 2000).
The aim of the present investigation is to study the influence of saturated fatty acid on the winter wheat mito-chondria function and determine the ADP/ATP participation in fatty acid-dependent uncoupling.
Materials and Methods. Three-day-old etiolated shoots of winter wheat cultivar Zalarinka germinated on moist paperat 26°C, were used in this work. Mitochondria were extracted from winter wheat shoots by differential centrifugationas describes previously (Pobezhimova et al. 2001). Isolated mitochondria were resuspended in the following medium:40 mM MOPS-KOH buffer (pH 7.4), 300 mM sucrose, 10 mM KCl, 5 mM EDTA, and 1 mM MgCl
2.
Mitochondrial activity was recorded polarographically at 27°C using a platinum electrode of a closed type in a1.4 ml volume cell (Estabrook 1967). The reaction mixture contained 125 mM KCl, 18 mM KH
2PO
4, 1 mM MgCl
2, and
5 mM EDTA, pH 7.4. 10 mM Malate in the presence of 10 mM glutamate was used as an oxidation substrate. Lauric (C12:0), palmitic (C 16:0), stearic (C 18:0), and behenic (C 22:0) acids were used in concentrations from 0,056 mkM to 10mM. 1 mkM carboxyatractyloside (Catr) was used as ADP/ATP inhibitor.
Polarograms were used to calculate the rates of phosphorylative respiration (state 3), nonphosphorylativerespiration (state 4), the rate of respiration after fatty acid addition, the rate of respiration after Catr addition, respirationcontrol by Chance-Williams, and the ADP:O ratio (Estabrook 1967). The concentrations of mitochondrial protein andCSP 310 were analyzed by Lowry method (Lowry et al. 1951). All the experiments were made in three-six preparations.The data obtained were analyzed statistically, i.e., arithmetic means and standard errors were determined.
Results and Discussion. To determine saturated fatty acid uncoupling effect we added different amounts of fatty acidto state 4 mitochondria, because fatty acid-dependent increase of state 4 oxygen consumption is one of the mainindicators of fatty acid-dependent uncoupling together with coefficient RC and ADP:O ratio decrease.
We found that an addition to state-4 mitochondria physiological concentrations (0.056 and 0.15 mkM) of lauricand palmitic acids didn’t cause any changes in the rate of oxygen consumption but addition physiological concentrationsof stearic and behenic acids caused even a decrease of oxygen consumption (Fig. 3). Behenic acid did not cause anychanges in the rate of oxygen consumption at higher concentrations added. The most influence of lauric acid on the rateof oxygen consumption the was found at concentration 50 mkM, which caused about 54 % stimulation of non-phospho-
Fig. 3. The oxygenuptake in state 4 bywinter wheat mito-chondria afteraddition of saturatedfatty acids; 100 % isstate-4 respirationbefore fatty acidaddition (control).The oxidationsubstrate is 10 mMmalate in the pres-ence of 10 mMglutamate. n = 3–6.
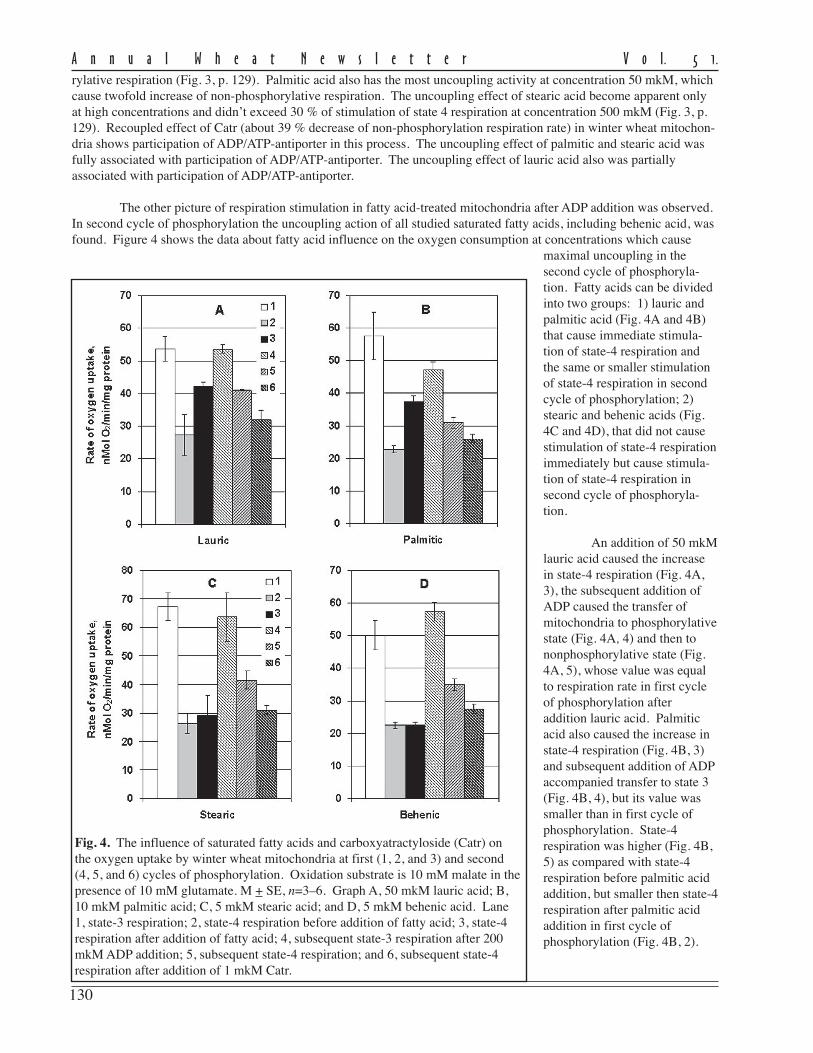
130
A n n u a l W h e a t N e w s l e t t e r V o l. 5 1.
rylative respiration (Fig. 3, p. 129). Palmitic acid also has the most uncoupling activity at concentration 50 mkM, whichcause twofold increase of non-phosphorylative respiration. The uncoupling effect of stearic acid become apparent onlyat high concentrations and didn’t exceed 30 % of stimulation of state 4 respiration at concentration 500 mkM (Fig. 3, p.129). Recoupled effect of Catr (about 39 % decrease of non-phosphorylation respiration rate) in winter wheat mitochon-dria shows participation of ADP/ATP-antiporter in this process. The uncoupling effect of palmitic and stearic acid wasfully associated with participation of ADP/ATP-antiporter. The uncoupling effect of lauric acid also was partiallyassociated with participation of ADP/ATP-antiporter.
The other picture of respiration stimulation in fatty acid-treated mitochondria after ADP addition was observed.In second cycle of phosphorylation the uncoupling action of all studied saturated fatty acids, including behenic acid, wasfound. Figure 4 shows the data about fatty acid influence on the oxygen consumption at concentrations which cause
maximal uncoupling in thesecond cycle of phosphoryla-tion. Fatty acids can be dividedinto two groups: 1) lauric andpalmitic acid (Fig. 4A and 4B)that cause immediate stimula-tion of state-4 respiration andthe same or smaller stimulationof state-4 respiration in secondcycle of phosphorylation; 2)stearic and behenic acids (Fig.4C and 4D), that did not causestimulation of state-4 respirationimmediately but cause stimula-tion of state-4 respiration insecond cycle of phosphoryla-tion.
An addition of 50 mkMlauric acid caused the increasein state-4 respiration (Fig. 4A,3), the subsequent addition ofADP caused the transfer ofmitochondria to phosphorylativestate (Fig. 4A, 4) and then tononphosphorylative state (Fig.4A, 5), whose value was equalto respiration rate in first cycleof phosphorylation afteraddition lauric acid. Palmiticacid also caused the increase instate-4 respiration (Fig. 4B, 3)and subsequent addition of ADPaccompanied transfer to state 3(Fig. 4B, 4), but its value wassmaller than in first cycle ofphosphorylation. State-4respiration was higher (Fig. 4B,5) as compared with state-4respiration before palmitic acidaddition, but smaller then state-4respiration after palmitic acidaddition in first cycle ofphosphorylation (Fig. 4B, 2).
Fig. 4. The influence of saturated fatty acids and carboxyatractyloside (Catr) onthe oxygen uptake by winter wheat mitochondria at first (1, 2, and 3) and second(4, 5, and 6) cycles of phosphorylation. Oxidation substrate is 10 mM malate in thepresence of 10 mM glutamate. M + SE, n=3–6. Graph A, 50 mkM lauric acid; B,10 mkM palmitic acid; C, 5 mkM stearic acid; and D, 5 mkM behenic acid. Lane1, state-3 respiration; 2, state-4 respiration before addition of fatty acid; 3, state-4respiration after addition of fatty acid; 4, subsequent state-3 respiration after 200mkM ADP addition; 5, subsequent state-4 respiration; and 6, subsequent state-4respiration after addition of 1 mkM Catr.
131
A n n u a l W h e a t N e w s l e t t e r V o l. 5 1.
Although 5 mkM stearic acid addition in state 4 did not cause statistically significant stimulation of respiration(Fig. 4C, 3; p. 130), we observed 58 % increase of non-phosphorylative rate of respiration in second cycle of phosphory-lation (Fig. 4C, 4; p. 130). Likewise the influence of stearicacid, behenic acid addition in state 4 didn’t cause stimulation ofrespiration (Fig. 4D, 2; p. 130), but we observed 56 % increaseof non-phosphorylative rate in the second cycle of phosphoryla-tion (Fig. 4D, 4; p. 130). In all cases the increase of non-phosphorylative respiration rate in second cycle of phosphoryla-tion was accompanied by decrease of RC coefficient and ADP:Oratio (Table 5). RC coefficient decrease was 26–49 % andADP:O ration decrease was 27–33 %. So, all saturated fattyacids studied cause the uncoupling of oxidative phosphorylationin second cycle phosphorylation; the increase of non-phosphory-lation respiration and decrease of RC coefficient and ADP:Oratio.
The stimulation of respiration by lauric acid was fullyassociated with ADP/ATP-antiporter participation (Fig. 4A, 6; p.130). At the same time, the stimulation of respiration bypalmitic, stearic and behenic acids decreased after addition of Catr only about 50 % (Fig. 4B, C, D, 6; p. 130). There-fore, we conclude that different carrier proteins participate in these fatty acid-dependent uncoupling.
All saturated fatty acids studied were able to cause the increase of winter wheat mitochondria respiration.Lauric, palmitic, and stearic acids caused oxidative phosphorylation uncoupling immediately, at the same time theuncoupling effect of behenic acid started after subsequent ADP stimulation. In our experiments with T. aestuvum subsp.aestivum, it is shown that palmitic acid have the most uncoupling effect, whereas Pastore with coauthors (2000) foundusing T. turgidum subsp. durum mitochondria that lauric acid have the most uncoupling effect. ADP/ATP-antiporterparticipated in fatty acid-dependent uncoupling the all studied saturated acids.
Acknowledgments. The work has been performed, in part, with the support of the Russian Science Support Foundation,Russian Foundation of Basic Research (projects 03-04-48151 and 05-04-97231) and Siberian Division of RussianAcademy of Sciences Youth Grant (project 78).
References.Casolo V, Bradiot E, Chiandussi E, Macri F, and Vianello A. 2000. The role of mild uncoupling and non-coupled
respiration in the regulation of hydrogen peroxide generation by plant mitochondria. FEBS Lett 474:53-57.Estabrook RW. 1967. Mitochondrial respiratory control and the polarographic measurement of ADP:O ratio. Methods
Enzymol 10:41-47.Grabelnych OI, Pivovarova NYu, Pobezhimova TP, Kolesnichenko AV, Sumina ON, and Voinikov VK. 2004. The
influence of monounsaturated acid fatty acid on the function of winter wheat mitochondria. Ann Wheat Newslet50:128-131.
Jezek P. 1999. Fatty acid interaction with mitochondrial uncoupling proteins. J Bioenerg Biomembr 31:457-466.Kadenbach B. 2003. Intrinsic and extrinsic uncoupling of oxidative phosphorylation. Biochim Biophys Acta 1604:77-
94.Lowry OH, Rosebrough NJ, Farr AL, and Randall RJ. 1951. Protein measurement with Folin phenol reagent. J Biol
Chem 193:265-275.Pastore D, Fratianni A, Di Pede S, and Passarela S. 2000. Effects of fatty acids, nucleotides and reactive oxygen species
on durum wheat mitochondria. FEBS Lett 471:88-92.Penzo D, Tagliapietra C, Colonna R, Petronilli V, and Bernardi P. 2002. Effects of fatty acids on mitochondria: implica-
tions for cell death. Biochim Biophys Acta 1555:160-165.Pobezhimova TP, Grabelnykh OI, Kolesnichenko AV, Sumina ON, and Voinikov VK. 2001. Localization of proteins
immunologically related to subunits of stress 310-kD protein in winter wheat mitochondria. Russ J Plant Physiol48:204-209.
Skulachev VP. 1991. Fatty acid circuit as a physiological mechanism of uncoupling of oxidative phosphorylation.FEBS Lett 294:158-162.
Skulachev VP. 1999. Anion carriers in fatty acid-mediated physiological uncoupling. J Bioenerg Biomembr 31:431-445.
Table 5. The decrease of RC coefficient andADP:O ratio in winter wheat mitochondria inpresence of fatty acids during second cycle ofphosphorylation. 100 % is RC coefficient orADP:O ratio of mitochondria at first cycle ofphosphorylation before fatty acid addition.
Saturated acid RC coefficient ADP:O ratioconcentration % %
Lauric, 50 mkM 66.16 72.47Palmitic, 10 mkM 51.00 71.27Stearic, 5 mkM 58.01 67.21Behenic, 5 mkM 73.87 66.86
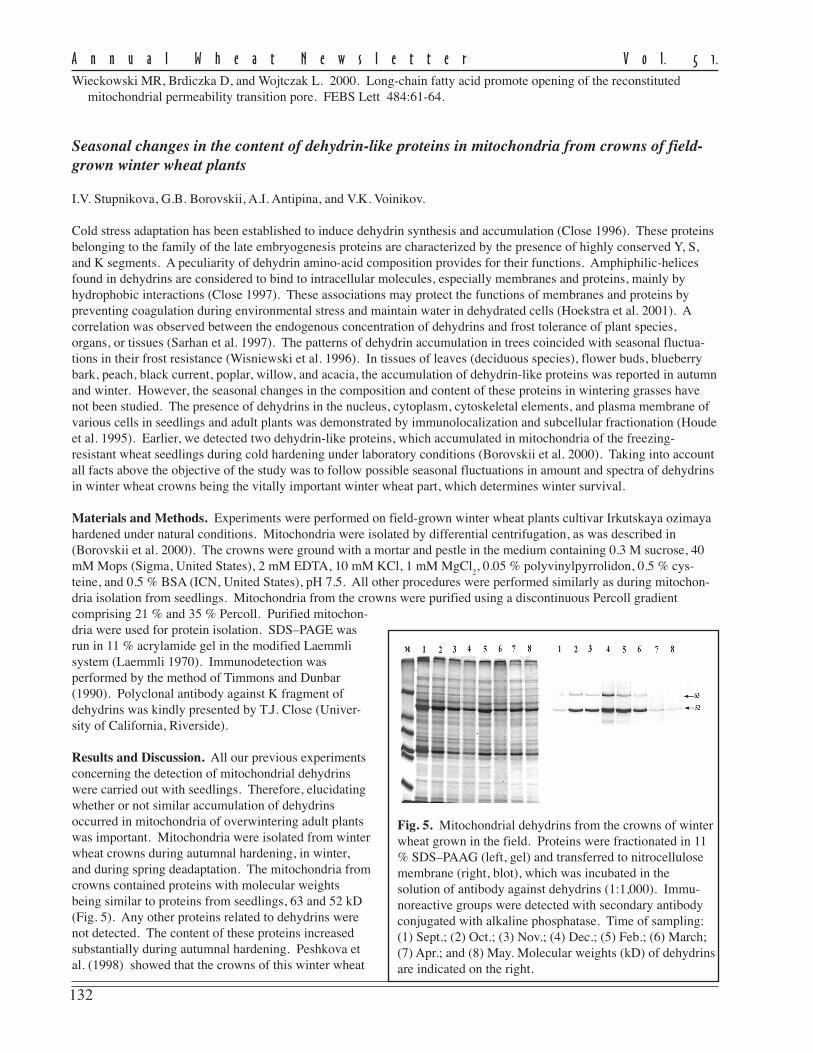
132
A n n u a l W h e a t N e w s l e t t e r V o l. 5 1.
Fig. 5. Mitochondrial dehydrins from the crowns of winterwheat grown in the field. Proteins were fractionated in 11% SDS–PAAG (left, gel) and transferred to nitrocellulosemembrane (right, blot), which was incubated in thesolution of antibody against dehydrins (1:1,000). Immu-noreactive groups were detected with secondary antibodyconjugated with alkaline phosphatase. Time of sampling:(1) Sept.; (2) Oct.; (3) Nov.; (4) Dec.; (5) Feb.; (6) March;(7) Apr.; and (8) May. Molecular weights (kD) of dehydrinsare indicated on the right.
Wieckowski MR, Brdiczka D, and Wojtczak L. 2000. Long-chain fatty acid promote opening of the reconstitutedmitochondrial permeability transition pore. FEBS Lett 484:61-64.
Seasonal changes in the content of dehydrin-like proteins in mitochondria from crowns of field-grown winter wheat plants
I.V. Stupnikova, G.B. Borovskii, A.I. Antipina, and V.K. Voinikov.
Cold stress adaptation has been established to induce dehydrin synthesis and accumulation (Close 1996). These proteinsbelonging to the family of the late embryogenesis proteins are characterized by the presence of highly conserved Y, S,and K segments. A peculiarity of dehydrin amino-acid composition provides for their functions. Amphiphilic-helicesfound in dehydrins are considered to bind to intracellular molecules, especially membranes and proteins, mainly byhydrophobic interactions (Close 1997). These associations may protect the functions of membranes and proteins bypreventing coagulation during environmental stress and maintain water in dehydrated cells (Hoekstra et al. 2001). Acorrelation was observed between the endogenous concentration of dehydrins and frost tolerance of plant species,organs, or tissues (Sarhan et al. 1997). The patterns of dehydrin accumulation in trees coincided with seasonal fluctua-tions in their frost resistance (Wisniewski et al. 1996). In tissues of leaves (deciduous species), flower buds, blueberrybark, peach, black current, poplar, willow, and acacia, the accumulation of dehydrin-like proteins was reported in autumnand winter. However, the seasonal changes in the composition and content of these proteins in wintering grasses havenot been studied. The presence of dehydrins in the nucleus, cytoplasm, cytoskeletal elements, and plasma membrane ofvarious cells in seedlings and adult plants was demonstrated by immunolocalization and subcellular fractionation (Houdeet al. 1995). Earlier, we detected two dehydrin-like proteins, which accumulated in mitochondria of the freezing-resistant wheat seedlings during cold hardening under laboratory conditions (Borovskii et al. 2000). Taking into accountall facts above the objective of the study was to follow possible seasonal fluctuations in amount and spectra of dehydrinsin winter wheat crowns being the vitally important winter wheat part, which determines winter survival.
Materials and Methods. Experiments were performed on field-grown winter wheat plants cultivar Irkutskaya ozimayahardened under natural conditions. Mitochondria were isolated by differential centrifugation, as was described in(Borovskii et al. 2000). The crowns were ground with a mortar and pestle in the medium containing 0.3 M sucrose, 40mM Mops (Sigma, United States), 2 mM EDTA, 10 mM KCl, 1 mM MgCl
2, 0.05 % polyvinylpyrrolidon, 0.5 % cys-
teine, and 0.5 % BSA (ICN, United States), pH 7.5. All other procedures were performed similarly as during mitochon-dria isolation from seedlings. Mitochondria from the crowns were purified using a discontinuous Percoll gradientcomprising 21 % and 35 % Percoll. Purified mitochon-dria were used for protein isolation. SDS–PAGE wasrun in 11 % acrylamide gel in the modified Laemmlisystem (Laemmli 1970). Immunodetection wasperformed by the method of Timmons and Dunbar(1990). Polyclonal antibody against K fragment ofdehydrins was kindly presented by T.J. Close (Univer-sity of California, Riverside).
Results and Discussion. All our previous experimentsconcerning the detection of mitochondrial dehydrinswere carried out with seedlings. Therefore, elucidatingwhether or not similar accumulation of dehydrinsoccurred in mitochondria of overwintering adult plantswas important. Mitochondria were isolated from winterwheat crowns during autumnal hardening, in winter,and during spring deadaptation. The mitochondria fromcrowns contained proteins with molecular weightsbeing similar to proteins from seedlings, 63 and 52 kD(Fig. 5). Any other proteins related to dehydrins werenot detected. The content of these proteins increasedsubstantially during autumnal hardening. Peshkova etal. (1998) showed that the crowns of this winter wheat
133
A n n u a l W h e a t N e w s l e t t e r V o l. 5 1.
cultivar lost up to 67–69 % of water during hardening. The highest content of mitochondrial dehydrins was in Decem-ber, and thereafter it began to decline gradually. In spring, the content of dehydrins in mitochondria from wheat crownsdecreased to their level in autumn. In April, dehydrin content was similar to that in September; in May, it was evenlower (Fig. 5, p. 132). We know that winter wheat cryotolerance increases during cold acclimation starting from earlyautumn and achieves its highest value by the beginning of winter, indicating the interrelation between dehydrin contentand winter wheat freezing tolerance, what is in agreement with the results of other researchers (Sarhan et al. 1997).Earlier we showed that in contrast to mitochondrial dehydrins, the spectra of those in total cell water-soluble fractioncontained much more protein groups. In the total water-soluble protein fraction, both the amount of dehydrins in eachgroup and the number of dehydrin groups of a particular molecular weight increased with autumnal hardening andattained the highest values by the end of January. At this time, dehydrins with molecular weights of 209, 196, 66, 50, 41,24, 22, 17, 15, and 12 kD were detected among soluble proteins (Stupnikova et al. 2004). Two protein groups (66 and 50kD) had molecular weights close to those of mitochondrial dehydrins (63 and 52 kD). The methods used did not permitus to decide whether these proteins with close molecular weights were similar or different proteins.
Adaptation process is known to include two stages: unspecific stress-response and specific adaptation(Kuznetsov et al. 1987). During the first stage, mobilization and development of plant defensive systems occur, whichprovide for organism short-term surviving. During the second stage, specific adaptation mechanisms develop, which areresponsible for plant life under the conditions of long-term stress (Kuznetsov et al. 1987). The accumulation of thesedehydrins during cold adaptation of field-grown plants and the absence of their further changes in autumn and winterindicate evidently that these proteins operate like cryoprotectors during both stages of adaptation.
References.Borovskii GB, Stupnikova IV, Antipina AI, Downs CA, and Voinikov VK. 2000. Accumulation of dehydrin-like
proteins in the mitochondria of cold-treated plants. J Plant Physiol 156:797-800.Close TJ. 1996. Dehydrins: emergence of a biochemical role of a family of plant dehydration proteins. Physiol Plant
97:795-803.Close TJ. 1997. Dehydrins: a commonalty in the response of plants to dehydration and low temperature. Physiol Plant
100:291-296.Hoekstra FA, Golovina EA, Buitink J. 2001. Mechanisms of plant desiccation tolerance. TRENDS Plant Sci 6:431-
438.Houde M, Daniel C, Lachapelle M, Allard F, Laliberte S, and Sarhan F. 1995. Immunolocalization of freezing-toler-
ance-associated proteins in the cytoplasm and nucleoplasm of wheat crown tissues. Plant J 8:583-593.Kuznetsov VV, Kimpel J, Gokdzhiyan D, and Ki J. 1987. Elements of nonspecificity of the plant genome responses to
cold and heat stresses. Fiziol Rast (Moscow) 34:859-868 (Sov Plant Physiol, Eng Transl).Laemmli UK. 1970. Cleavage of structural proteins during the assembly of the head of bacteriophage. Nature
227:680-685.Peshkova AA and Dorofeev NV. 1998. Winter tolerance of winter wheat according to conditions of vegetative growth
and mineral nutrition. Agrokhimiya 6:26-33.Sarhan F, Ouellet F, and Vazquez-Tello A. 1997. The wheat WCS120 gene family: a useful model to understand the
molecular genetics of freezing tolerance in cereals. Physiol Plant 101:439-445.Stupnikova IV, Borovskii GB, and Voinikov VK. 2004. Seasonal changes in the composition and content of dehydrins
in winter wheat plants. Rus J Plant Physiol 51:1-7.Timmons TM and Dunbar BS. 1990. Protein blotting and immunodetection. Methods Enzymol 182:679-688.Wisniewski M, Close TJ, Artlip T, and Arora R. 1996. Seasonal patterns of dehydrins and 70-kDa heat-shock proteins in
bark tissues of eight species of woody plants. Physiol Plant 96:496-505.
An effect of varied stresses on alternative oxidase and plant uncoupling mitochondrial proteinexpression in winter wheat seedlings.
A.A. Truhin, E.L. Tauson, and G.B. Borovskii.
The different stress effectors are able to create similar damages in cell: the increased viscidity of membranes, formationof gel phases, degradation, and destruction of proteins, phospholypids and other macromolecules. An identical phenom-enon was shown during treatment of cells by superoxide (Vanlerberghe et al. 1992). Accumulation of active oxygen andits derivatives also have been shown in plants in response to various environmental stresses. Oxidizing stress can be
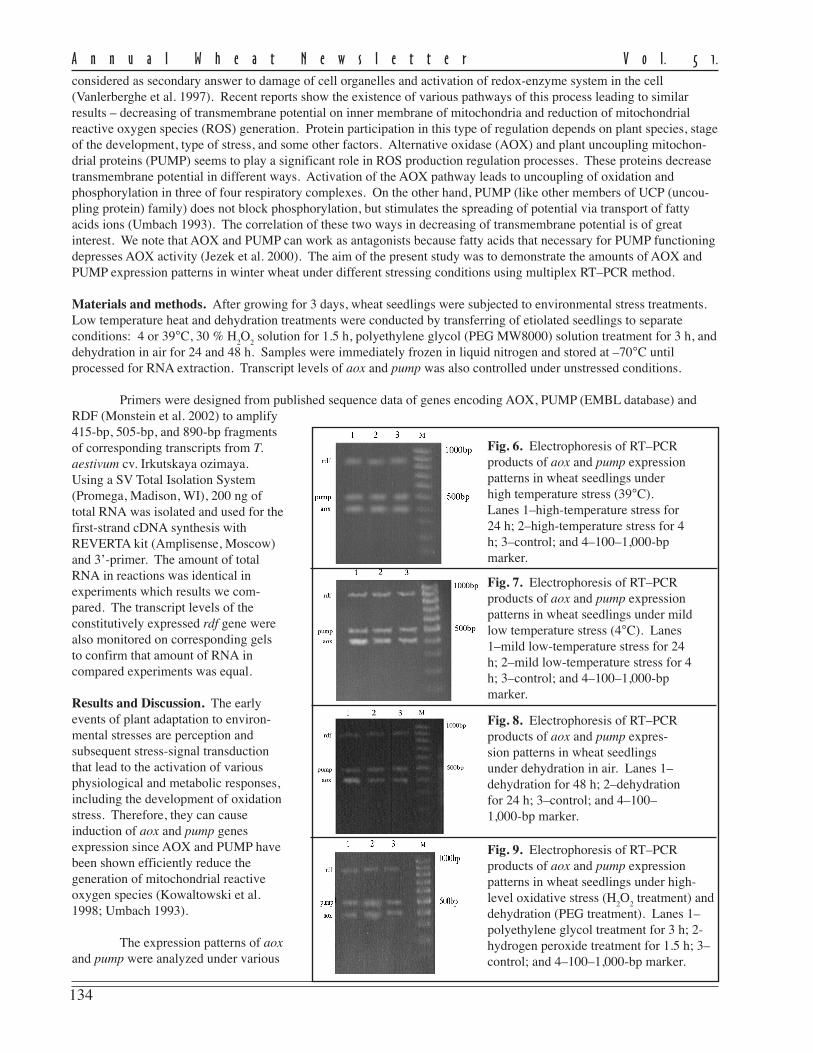
134
A n n u a l W h e a t N e w s l e t t e r V o l. 5 1.
Fig. 9. Electrophoresis of RT–PCRproducts of aox and pump expressionpatterns in wheat seedlings under high-level oxidative stress (H
2O
2 treatment) and
dehydration (PEG treatment). Lanes 1–polyethylene glycol treatment for 3 h; 2-hydrogen peroxide treatment for 1.5 h; 3–control; and 4–100–1,000-bp marker.
Fig. 6. Electrophoresis of RT–PCRproducts of aox and pump expressionpatterns in wheat seedlings underhigh temperature stress (39°C).Lanes 1–high-temperature stress for24 h; 2–high-temperature stress for 4h; 3–control; and 4–100–1,000-bpmarker.
Fig. 7. Electrophoresis of RT–PCRproducts of aox and pump expressionpatterns in wheat seedlings under mildlow temperature stress (4°C). Lanes1–mild low-temperature stress for 24h; 2–mild low-temperature stress for 4h; 3–control; and 4–100–1,000-bpmarker.
Fig. 8. Electrophoresis of RT–PCRproducts of aox and pump expres-sion patterns in wheat seedlingsunder dehydration in air. Lanes 1–dehydration for 48 h; 2–dehydrationfor 24 h; 3–control; and 4–100–1,000-bp marker.
considered as secondary answer to damage of cell organelles and activation of redox-enzyme system in the cell(Vanlerberghe et al. 1997). Recent reports show the existence of various pathways of this process leading to similarresults – decreasing of transmembrane potential on inner membrane of mitochondria and reduction of mitochondrialreactive oxygen species (ROS) generation. Protein participation in this type of regulation depends on plant species, stageof the development, type of stress, and some other factors. Alternative oxidase (AOX) and plant uncoupling mitochon-drial proteins (PUMP) seems to play a significant role in ROS production regulation processes. These proteins decreasetransmembrane potential in different ways. Activation of the AOX pathway leads to uncoupling of oxidation andphosphorylation in three of four respiratory complexes. On the other hand, PUMP (like other members of UCP (uncou-pling protein) family) does not block phosphorylation, but stimulates the spreading of potential via transport of fattyacids ions (Umbach 1993). The correlation of these two ways in decreasing of transmembrane potential is of greatinterest. We note that AOX and PUMP can work as antagonists because fatty acids that necessary for PUMP functioningdepresses AOX activity (Jezek et al. 2000). The aim of the present study was to demonstrate the amounts of AOX andPUMP expression patterns in winter wheat under different stressing conditions using multiplex RT–PCR method.
Materials and methods. After growing for 3 days, wheat seedlings were subjected to environmental stress treatments.Low temperature heat and dehydration treatments were conducted by transferring of etiolated seedlings to separateconditions: 4 or 39°C, 30 % H
2O
2 solution for 1.5 h, polyethylene glycol (PEG MW8000) solution treatment for 3 h, and
dehydration in air for 24 and 48 h. Samples were immediately frozen in liquid nitrogen and stored at –70°C untilprocessed for RNA extraction. Transcript levels of aox and pump was also controlled under unstressed conditions.
Primers were designed from published sequence data of genes encoding AOX, PUMP (EMBL database) andRDF (Monstein et al. 2002) to amplify415-bp, 505-bp, and 890-bp fragmentsof corresponding transcripts from T.aestivum cv. Irkutskaya ozimaya.Using a SV Total Isolation System(Promega, Madison, WI), 200 ng oftotal RNA was isolated and used for thefirst-strand cDNA synthesis withREVERTA kit (Amplisense, Moscow)and 3’-primer. The amount of totalRNA in reactions was identical inexperiments which results we com-pared. The transcript levels of theconstitutively expressed rdf gene werealso monitored on corresponding gelsto confirm that amount of RNA incompared experiments was equal.
Results and Discussion. The earlyevents of plant adaptation to environ-mental stresses are perception andsubsequent stress-signal transductionthat lead to the activation of variousphysiological and metabolic responses,including the development of oxidationstress. Therefore, they can causeinduction of aox and pump genesexpression since AOX and PUMP havebeen shown efficiently reduce thegeneration of mitochondrial reactiveoxygen species (Kowaltowski et al.1998; Umbach 1993).
The expression patterns of aoxand pump were analyzed under various
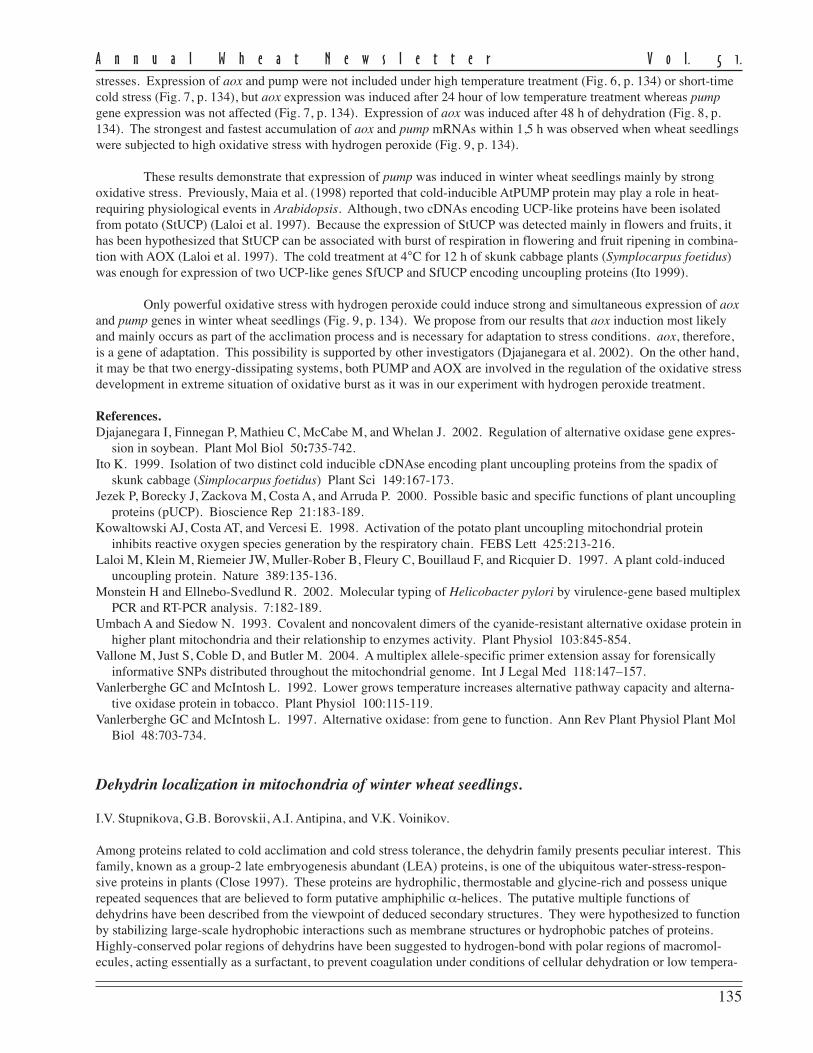
135
A n n u a l W h e a t N e w s l e t t e r V o l. 5 1.
stresses. Expression of aox and pump were not included under high temperature treatment (Fig. 6, p. 134) or short-timecold stress (Fig. 7, p. 134), but aox expression was induced after 24 hour of low temperature treatment whereas pumpgene expression was not affected (Fig. 7, p. 134). Expression of aox was induced after 48 h of dehydration (Fig. 8, p.134). The strongest and fastest accumulation of aox and pump mRNAs within 1,5 h was observed when wheat seedlingswere subjected to high oxidative stress with hydrogen peroxide (Fig. 9, p. 134).
These results demonstrate that expression of pump was induced in winter wheat seedlings mainly by strongoxidative stress. Previously, Maia et al. (1998) reported that cold-inducible AtPUMP protein may play a role in heat-requiring physiological events in Arabidopsis. Although, two cDNAs encoding UCP-like proteins have been isolatedfrom potato (StUCP) (Laloi et al. 1997). Because the expression of StUCP was detected mainly in flowers and fruits, ithas been hypothesized that StUCP can be associated with burst of respiration in flowering and fruit ripening in combina-tion with AOX (Laloi et al. 1997). The cold treatment at 4°C for 12 h of skunk cabbage plants (Symplocarpus foetidus)was enough for expression of two UCP-like genes SfUCP and SfUCP encoding uncoupling proteins (Ito 1999).
Only powerful oxidative stress with hydrogen peroxide could induce strong and simultaneous expression of aoxand pump genes in winter wheat seedlings (Fig. 9, p. 134). We propose from our results that aox induction most likelyand mainly occurs as part of the acclimation process and is necessary for adaptation to stress conditions. aox, therefore,is a gene of adaptation. This possibility is supported by other investigators (Djajanegara et al. 2002). On the other hand,it may be that two energy-dissipating systems, both PUMP and AOX are involved in the regulation of the oxidative stressdevelopment in extreme situation of oxidative burst as it was in our experiment with hydrogen peroxide treatment.
References.Djajanegara I, Finnegan P, Mathieu C, McCabe M, and Whelan J. 2002. Regulation of alternative oxidase gene expres-
sion in soybean. Plant Mol Biol 50:735-742.Ito K. 1999. Isolation of two distinct cold inducible cDNAse encoding plant uncoupling proteins from the spadix of
skunk cabbage (Simplocarpus foetidus) Plant Sci 149:167-173.Jezek P, Borecky J, Zackova M, Costa A, and Arruda P. 2000. Possible basic and specific functions of plant uncoupling
proteins (pUCP). Bioscience Rep 21:183-189.Kowaltowski AJ, Costa AT, and Vercesi E. 1998. Activation of the potato plant uncoupling mitochondrial protein
inhibits reactive oxygen species generation by the respiratory chain. FEBS Lett 425:213-216.Laloi M, Klein M, Riemeier JW, Muller-Rober B, Fleury C, Bouillaud F, and Ricquier D. 1997. A plant cold-induced
uncoupling protein. Nature 389:135-136.Monstein H and Ellnebo-Svedlund R. 2002. Molecular typing of Helicobacter pylori by virulence-gene based multiplex
PCR and RT-PCR analysis. 7:182-189.Umbach A and Siedow N. 1993. Covalent and noncovalent dimers of the cyanide-resistant alternative oxidase protein in
higher plant mitochondria and their relationship to enzymes activity. Plant Physiol 103:845-854.Vallone M, Just S, Coble D, and Butler M. 2004. A multiplex allele-specific primer extension assay for forensically
informative SNPs distributed throughout the mitochondrial genome. Int J Legal Med 118:147–157.Vanlerberghe GC and McIntosh L. 1992. Lower grows temperature increases alternative pathway capacity and alterna-
tive oxidase protein in tobacco. Plant Physiol 100:115-119.Vanlerberghe GC and McIntosh L. 1997. Alternative oxidase: from gene to function. Ann Rev Plant Physiol Plant Mol
Biol 48:703-734.
Dehydrin localization in mitochondria of winter wheat seedlings.
I.V. Stupnikova, G.B. Borovskii, A.I. Antipina, and V.K. Voinikov.
Among proteins related to cold acclimation and cold stress tolerance, the dehydrin family presents peculiar interest. Thisfamily, known as a group-2 late embryogenesis abundant (LEA) proteins, is one of the ubiquitous water-stress-respon-sive proteins in plants (Close 1997). These proteins are hydrophilic, thermostable and glycine-rich and possess uniquerepeated sequences that are believed to form putative amphiphilic α-helices. The putative multiple functions ofdehydrins have been described from the viewpoint of deduced secondary structures. They were hypothesized to functionby stabilizing large-scale hydrophobic interactions such as membrane structures or hydrophobic patches of proteins.Highly-conserved polar regions of dehydrins have been suggested to hydrogen-bond with polar regions of macromol-ecules, acting essentially as a surfactant, to prevent coagulation under conditions of cellular dehydration or low tempera-
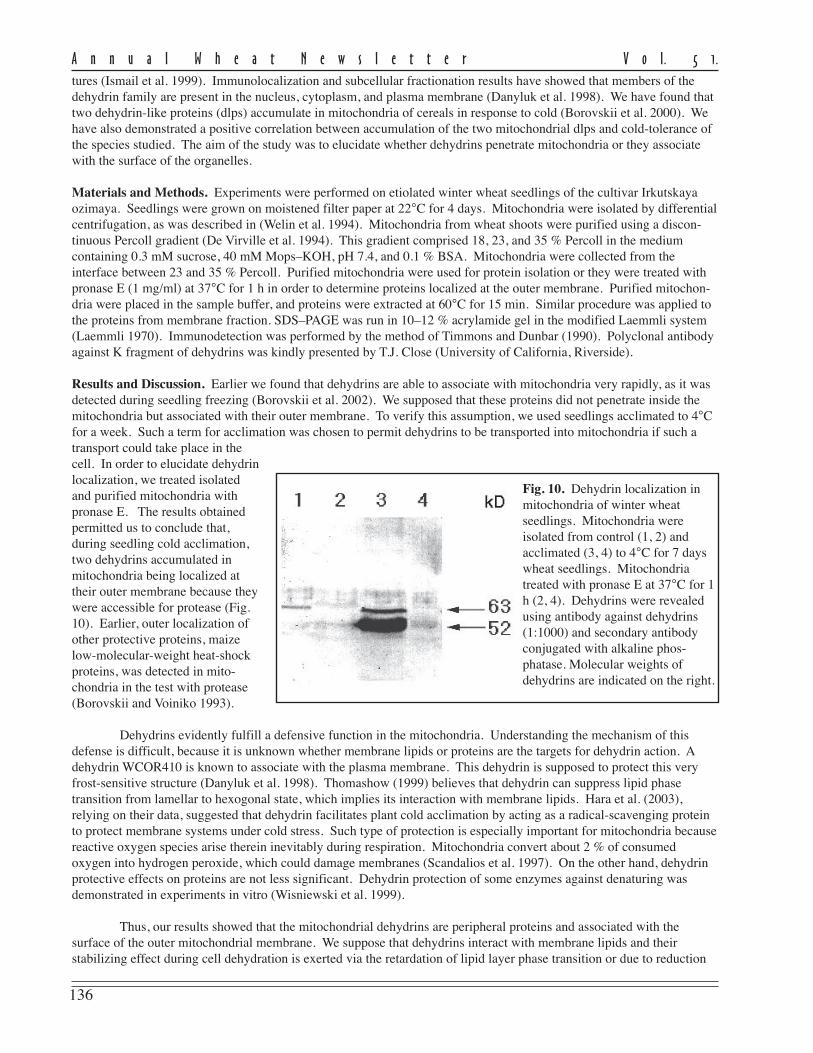
136
A n n u a l W h e a t N e w s l e t t e r V o l. 5 1.
tures (Ismail et al. 1999). Immunolocalization and subcellular fractionation results have showed that members of thedehydrin family are present in the nucleus, cytoplasm, and plasma membrane (Danyluk et al. 1998). We have found thattwo dehydrin-like proteins (dlps) accumulate in mitochondria of cereals in response to cold (Borovskii et al. 2000). Wehave also demonstrated a positive correlation between accumulation of the two mitochondrial dlps and cold-tolerance ofthe species studied. The aim of the study was to elucidate whether dehydrins penetrate mitochondria or they associatewith the surface of the organelles.
Materials and Methods. Experiments were performed on etiolated winter wheat seedlings of the cultivar Irkutskayaozimaya. Seedlings were grown on moistened filter paper at 22°C for 4 days. Mitochondria were isolated by differentialcentrifugation, as was described in (Welin et al. 1994). Mitochondria from wheat shoots were purified using a discon-tinuous Percoll gradient (De Virville et al. 1994). This gradient comprised 18, 23, and 35 % Percoll in the mediumcontaining 0.3 mM sucrose, 40 mM Mops–KOH, pH 7.4, and 0.1 % BSA. Mitochondria were collected from theinterface between 23 and 35 % Percoll. Purified mitochondria were used for protein isolation or they were treated withpronase E (1 mg/ml) at 37°C for 1 h in order to determine proteins localized at the outer membrane. Purified mitochon-dria were placed in the sample buffer, and proteins were extracted at 60°C for 15 min. Similar procedure was applied tothe proteins from membrane fraction. SDS–PAGE was run in 10–12 % acrylamide gel in the modified Laemmli system(Laemmli 1970). Immunodetection was performed by the method of Timmons and Dunbar (1990). Polyclonal antibodyagainst K fragment of dehydrins was kindly presented by T.J. Close (University of California, Riverside).
Results and Discussion. Earlier we found that dehydrins are able to associate with mitochondria very rapidly, as it wasdetected during seedling freezing (Borovskii et al. 2002). We supposed that these proteins did not penetrate inside themitochondria but associated with their outer membrane. To verify this assumption, we used seedlings acclimated to 4°Cfor a week. Such a term for acclimation was chosen to permit dehydrins to be transported into mitochondria if such atransport could take place in thecell. In order to elucidate dehydrinlocalization, we treated isolatedand purified mitochondria withpronase E. The results obtainedpermitted us to conclude that,during seedling cold acclimation,two dehydrins accumulated inmitochondria being localized attheir outer membrane because theywere accessible for protease (Fig.10). Earlier, outer localization ofother protective proteins, maizelow-molecular-weight heat-shockproteins, was detected in mito-chondria in the test with protease(Borovskii and Voiniko 1993).
Dehydrins evidently fulfill a defensive function in the mitochondria. Understanding the mechanism of thisdefense is difficult, because it is unknown whether membrane lipids or proteins are the targets for dehydrin action. Adehydrin WCOR410 is known to associate with the plasma membrane. This dehydrin is supposed to protect this veryfrost-sensitive structure (Danyluk et al. 1998). Thomashow (1999) believes that dehydrin can suppress lipid phasetransition from lamellar to hexogonal state, which implies its interaction with membrane lipids. Hara et al. (2003),relying on their data, suggested that dehydrin facilitates plant cold acclimation by acting as a radical-scavenging proteinto protect membrane systems under cold stress. Such type of protection is especially important for mitochondria becausereactive oxygen species arise therein inevitably during respiration. Mitochondria convert about 2 % of consumedoxygen into hydrogen peroxide, which could damage membranes (Scandalios et al. 1997). On the other hand, dehydrinprotective effects on proteins are not less significant. Dehydrin protection of some enzymes against denaturing wasdemonstrated in experiments in vitro (Wisniewski et al. 1999).
Thus, our results showed that the mitochondrial dehydrins are peripheral proteins and associated with thesurface of the outer mitochondrial membrane. We suppose that dehydrins interact with membrane lipids and theirstabilizing effect during cell dehydration is exerted via the retardation of lipid layer phase transition or due to reduction
Fig. 10. Dehydrin localization inmitochondria of winter wheatseedlings. Mitochondria wereisolated from control (1, 2) andacclimated (3, 4) to 4°C for 7 dayswheat seedlings. Mitochondriatreated with pronase E at 37°C for 1h (2, 4). Dehydrins were revealedusing antibody against dehydrins(1:1000) and secondary antibodyconjugated with alkaline phos-phatase. Molecular weights ofdehydrins are indicated on the right.
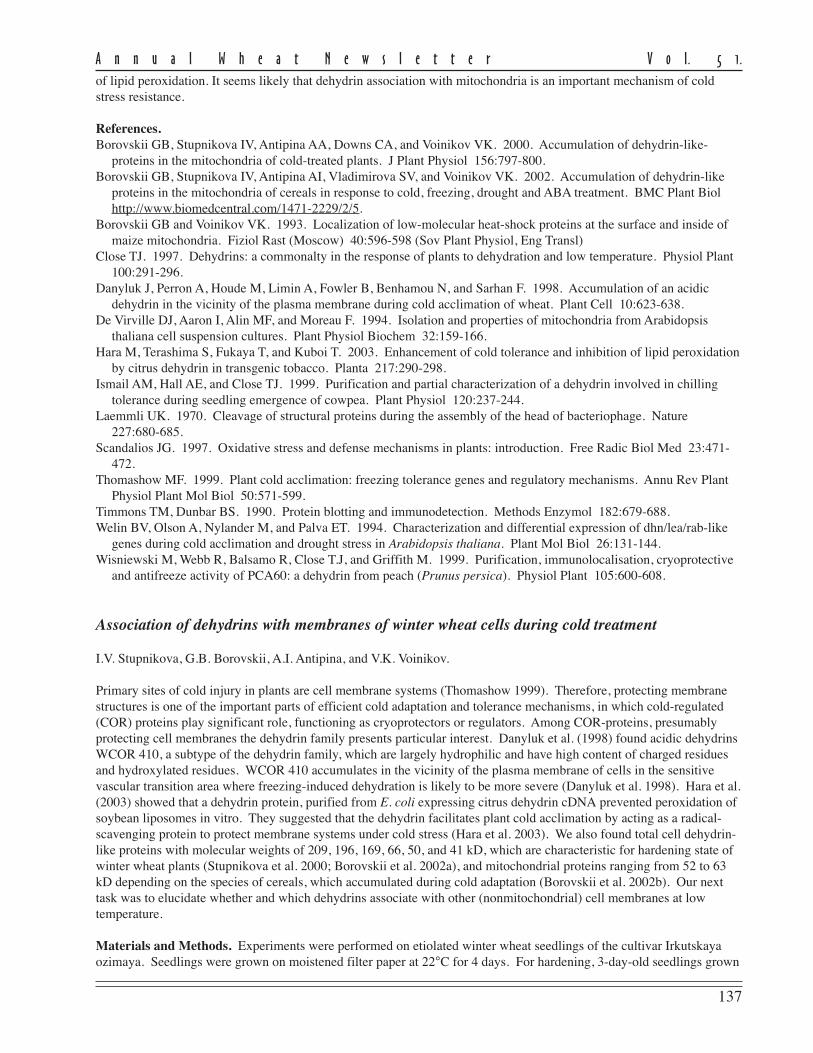
137
A n n u a l W h e a t N e w s l e t t e r V o l. 5 1.
of lipid peroxidation. It seems likely that dehydrin association with mitochondria is an important mechanism of coldstress resistance.
References.Borovskii GB, Stupnikova IV, Antipina AA, Downs CA, and Voinikov VK. 2000. Accumulation of dehydrin-like-
proteins in the mitochondria of cold-treated plants. J Plant Physiol 156:797-800.Borovskii GB, Stupnikova IV, Antipina AI, Vladimirova SV, and Voinikov VK. 2002. Accumulation of dehydrin-like
proteins in the mitochondria of cereals in response to cold, freezing, drought and ABA treatment. BMC Plant Biolhttp://www.biomedcentral.com/1471-2229/2/5.
Borovskii GB and Voinikov VK. 1993. Localization of low-molecular heat-shock proteins at the surface and inside ofmaize mitochondria. Fiziol Rast (Moscow) 40:596-598 (Sov Plant Physiol, Eng Transl)
Close TJ. 1997. Dehydrins: a commonalty in the response of plants to dehydration and low temperature. Physiol Plant100:291-296.
Danyluk J, Perron A, Houde M, Limin A, Fowler B, Benhamou N, and Sarhan F. 1998. Accumulation of an acidicdehydrin in the vicinity of the plasma membrane during cold acclimation of wheat. Plant Cell 10:623-638.
De Virville DJ, Aaron I, Alin MF, and Moreau F. 1994. Isolation and properties of mitochondria from Arabidopsisthaliana cell suspension cultures. Plant Physiol Biochem 32:159-166.
Hara M, Terashima S, Fukaya T, and Kuboi T. 2003. Enhancement of cold tolerance and inhibition of lipid peroxidationby citrus dehydrin in transgenic tobacco. Planta 217:290-298.
Ismail AM, Hall AE, and Close TJ. 1999. Purification and partial characterization of a dehydrin involved in chillingtolerance during seedling emergence of cowpea. Plant Physiol 120:237-244.
Laemmli UK. 1970. Cleavage of structural proteins during the assembly of the head of bacteriophage. Nature227:680-685.
Scandalios JG. 1997. Oxidative stress and defense mechanisms in plants: introduction. Free Radic Biol Med 23:471-472.
Thomashow MF. 1999. Plant cold acclimation: freezing tolerance genes and regulatory mechanisms. Annu Rev PlantPhysiol Plant Mol Biol 50:571-599.
Timmons TM, Dunbar BS. 1990. Protein blotting and immunodetection. Methods Enzymol 182:679-688.Welin BV, Olson A, Nylander M, and Palva ET. 1994. Characterization and differential expression of dhn/lea/rab-like
genes during cold acclimation and drought stress in Arabidopsis thaliana. Plant Mol Biol 26:131-144.Wisniewski M, Webb R, Balsamo R, Close T.J, and Griffith M. 1999. Purification, immunolocalisation, cryoprotective
and antifreeze activity of PCA60: a dehydrin from peach (Prunus persica). Physiol Plant 105:600-608.
Association of dehydrins with membranes of winter wheat cells during cold treatment
I.V. Stupnikova, G.B. Borovskii, A.I. Antipina, and V.K. Voinikov.
Primary sites of cold injury in plants are cell membrane systems (Thomashow 1999). Therefore, protecting membranestructures is one of the important parts of efficient cold adaptation and tolerance mechanisms, in which cold-regulated(COR) proteins play significant role, functioning as cryoprotectors or regulators. Among COR-proteins, presumablyprotecting cell membranes the dehydrin family presents particular interest. Danyluk et al. (1998) found acidic dehydrinsWCOR 410, a subtype of the dehydrin family, which are largely hydrophilic and have high content of charged residuesand hydroxylated residues. WCOR 410 accumulates in the vicinity of the plasma membrane of cells in the sensitivevascular transition area where freezing-induced dehydration is likely to be more severe (Danyluk et al. 1998). Hara et al.(2003) showed that a dehydrin protein, purified from E. coli expressing citrus dehydrin cDNA prevented peroxidation ofsoybean liposomes in vitro. They suggested that the dehydrin facilitates plant cold acclimation by acting as a radical-scavenging protein to protect membrane systems under cold stress (Hara et al. 2003). We also found total cell dehydrin-like proteins with molecular weights of 209, 196, 169, 66, 50, and 41 kD, which are characteristic for hardening state ofwinter wheat plants (Stupnikova et al. 2000; Borovskii et al. 2002a), and mitochondrial proteins ranging from 52 to 63kD depending on the species of cereals, which accumulated during cold adaptation (Borovskii et al. 2002b). Our nexttask was to elucidate whether and which dehydrins associate with other (nonmitochondrial) cell membranes at lowtemperature.
Materials and Methods. Experiments were performed on etiolated winter wheat seedlings of the cultivar Irkutskayaozimaya. Seedlings were grown on moistened filter paper at 22°C for 4 days. For hardening, 3-day-old seedlings grown
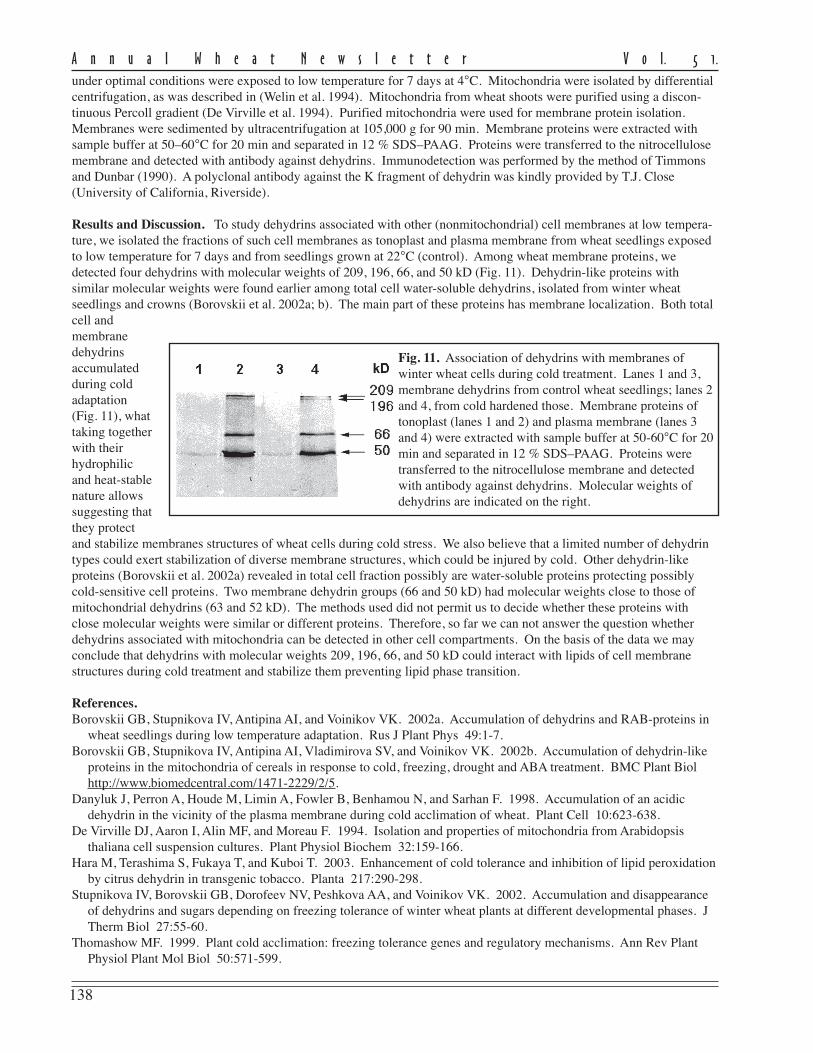
138
A n n u a l W h e a t N e w s l e t t e r V o l. 5 1.
under optimal conditions were exposed to low temperature for 7 days at 4°C. Mitochondria were isolated by differentialcentrifugation, as was described in (Welin et al. 1994). Mitochondria from wheat shoots were purified using a discon-tinuous Percoll gradient (De Virville et al. 1994). Purified mitochondria were used for membrane protein isolation.Membranes were sedimented by ultracentrifugation at 105,000 g for 90 min. Membrane proteins were extracted withsample buffer at 50–60°C for 20 min and separated in 12 % SDS–PAAG. Proteins were transferred to the nitrocellulosemembrane and detected with antibody against dehydrins. Immunodetection was performed by the method of Timmonsand Dunbar (1990). A polyclonal antibody against the K fragment of dehydrin was kindly provided by T.J. Close(University of California, Riverside).
Results and Discussion. To study dehydrins associated with other (nonmitochondrial) cell membranes at low tempera-ture, we isolated the fractions of such cell membranes as tonoplast and plasma membrane from wheat seedlings exposedto low temperature for 7 days and from seedlings grown at 22°C (control). Among wheat membrane proteins, wedetected four dehydrins with molecular weights of 209, 196, 66, and 50 kD (Fig. 11). Dehydrin-like proteins withsimilar molecular weights were found earlier among total cell water-soluble dehydrins, isolated from winter wheatseedlings and crowns (Borovskii et al. 2002a; b). The main part of these proteins has membrane localization. Both totalcell andmembranedehydrinsaccumulatedduring coldadaptation(Fig. 11), whattaking togetherwith theirhydrophilicand heat-stablenature allowssuggesting thatthey protectand stabilize membranes structures of wheat cells during cold stress. We also believe that a limited number of dehydrintypes could exert stabilization of diverse membrane structures, which could be injured by cold. Other dehydrin-likeproteins (Borovskii et al. 2002a) revealed in total cell fraction possibly are water-soluble proteins protecting possiblycold-sensitive cell proteins. Two membrane dehydrin groups (66 and 50 kD) had molecular weights close to those ofmitochondrial dehydrins (63 and 52 kD). The methods used did not permit us to decide whether these proteins withclose molecular weights were similar or different proteins. Therefore, so far we can not answer the question whetherdehydrins associated with mitochondria can be detected in other cell compartments. On the basis of the data we mayconclude that dehydrins with molecular weights 209, 196, 66, and 50 kD could interact with lipids of cell membranestructures during cold treatment and stabilize them preventing lipid phase transition.
References.Borovskii GB, Stupnikova IV, Antipina AI, and Voinikov VK. 2002a. Accumulation of dehydrins and RAB-proteins in
wheat seedlings during low temperature adaptation. Rus J Plant Phys 49:1-7.Borovskii GB, Stupnikova IV, Antipina AI, Vladimirova SV, and Voinikov VK. 2002b. Accumulation of dehydrin-like
proteins in the mitochondria of cereals in response to cold, freezing, drought and ABA treatment. BMC Plant Biolhttp://www.biomedcentral.com/1471-2229/2/5.
Danyluk J, Perron A, Houde M, Limin A, Fowler B, Benhamou N, and Sarhan F. 1998. Accumulation of an acidicdehydrin in the vicinity of the plasma membrane during cold acclimation of wheat. Plant Cell 10:623-638.
De Virville DJ, Aaron I, Alin MF, and Moreau F. 1994. Isolation and properties of mitochondria from Arabidopsisthaliana cell suspension cultures. Plant Physiol Biochem 32:159-166.
Hara M, Terashima S, Fukaya T, and Kuboi T. 2003. Enhancement of cold tolerance and inhibition of lipid peroxidationby citrus dehydrin in transgenic tobacco. Planta 217:290-298.
Stupnikova IV, Borovskii GB, Dorofeev NV, Peshkova AA, and Voinikov VK. 2002. Accumulation and disappearanceof dehydrins and sugars depending on freezing tolerance of winter wheat plants at different developmental phases. JTherm Biol 27:55-60.
Thomashow MF. 1999. Plant cold acclimation: freezing tolerance genes and regulatory mechanisms. Ann Rev PlantPhysiol Plant Mol Biol 50:571-599.
Fig. 11. Association of dehydrins with membranes ofwinter wheat cells during cold treatment. Lanes 1 and 3,membrane dehydrins from control wheat seedlings; lanes 2and 4, from cold hardened those. Membrane proteins oftonoplast (lanes 1 and 2) and plasma membrane (lanes 3and 4) were extracted with sample buffer at 50-60°C for 20min and separated in 12 % SDS–PAAG. Proteins weretransferred to the nitrocellulose membrane and detectedwith antibody against dehydrins. Molecular weights ofdehydrins are indicated on the right.
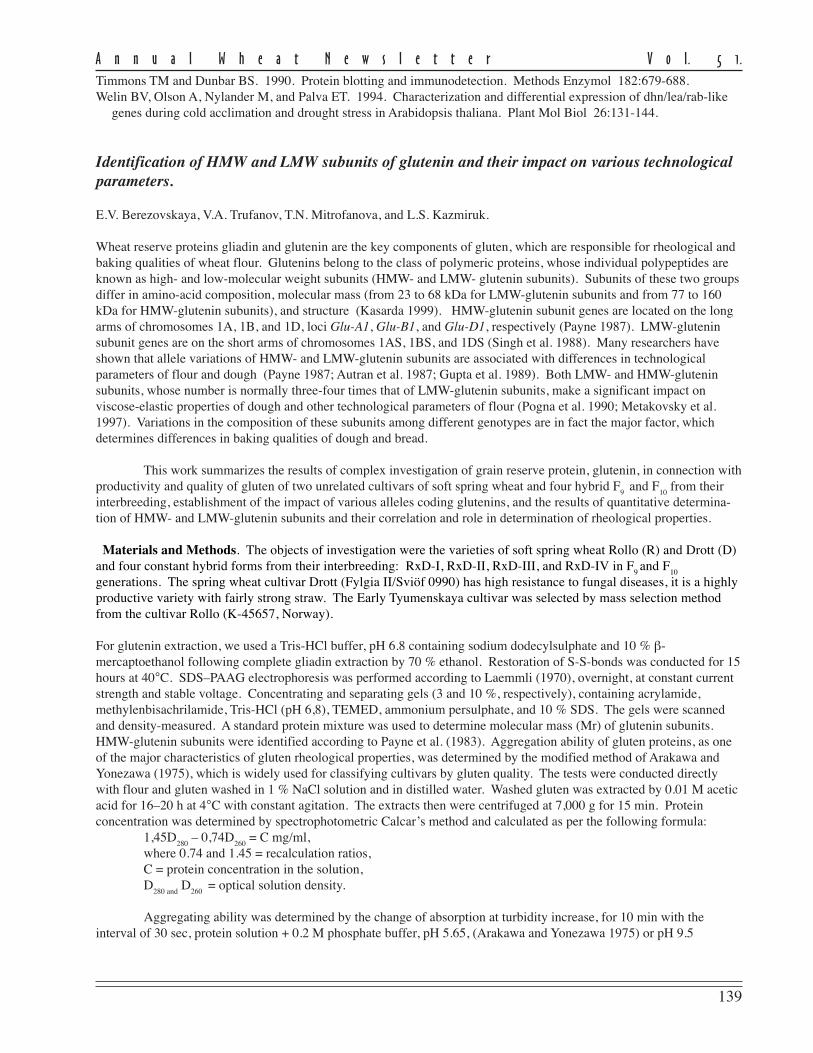
139
A n n u a l W h e a t N e w s l e t t e r V o l. 5 1.
Timmons TM and Dunbar BS. 1990. Protein blotting and immunodetection. Methods Enzymol 182:679-688.Welin BV, Olson A, Nylander M, and Palva ET. 1994. Characterization and differential expression of dhn/lea/rab-like
genes during cold acclimation and drought stress in Arabidopsis thaliana. Plant Mol Biol 26:131-144.
Identification of HMW and LMW subunits of glutenin and their impact on various technologicalparameters.
E.V. Berezovskaya, V.A. Trufanov, T.N. Mitrofanova, and L.S. Kazmiruk.
Wheat reserve proteins gliadin and glutenin are the key components of gluten, which are responsible for rheological andbaking qualities of wheat flour. Glutenins belong to the class of polymeric proteins, whose individual polypeptides areknown as high- and low-molecular weight subunits (HMW- and LMW- glutenin subunits). Subunits of these two groupsdiffer in amino-acid composition, molecular mass (from 23 to 68 kDa for LMW-glutenin subunits and from 77 to 160kDa for HMW-glutenin subunits), and structure (Kasarda 1999). HMW-glutenin subunit genes are located on the longarms of chromosomes 1A, 1B, and 1D, loci Glu-A1, Glu-B1, and Glu-D1, respectively (Payne 1987). LMW-gluteninsubunit genes are on the short arms of chromosomes 1AS, 1BS, and 1DS (Singh et al. 1988). Many researchers haveshown that allele variations of HMW- and LMW-glutenin subunits are associated with differences in technologicalparameters of flour and dough (Payne 1987; Autran et al. 1987; Gupta et al. 1989). Both LMW- and HMW-gluteninsubunits, whose number is normally three-four times that of LMW-glutenin subunits, make a significant impact onviscose-elastic properties of dough and other technological parameters of flour (Pogna et al. 1990; Metakovsky et al.1997). Variations in the composition of these subunits among different genotypes are in fact the major factor, whichdetermines differences in baking qualities of dough and bread.
This work summarizes the results of complex investigation of grain reserve protein, glutenin, in connection withproductivity and quality of gluten of two unrelated cultivars of soft spring wheat and four hybrid F
9 and F
10 from their
interbreeding, establishment of the impact of various alleles coding glutenins, and the results of quantitative determina-tion of HMW- and LMW-glutenin subunits and their correlation and role in determination of rheological properties.
Materials and Methods. The objects of investigation were the varieties of soft spring wheat Rollo (R) and Drott (D)and four constant hybrid forms from their interbreeding: RxD-I, RxD-II, RxD-III, and RxD-IV in F
9 and F
10
generations. The spring wheat cultivar Drott (Fylgia II/Sviöf 0990) has high resistance to fungal diseases, it is a highlyproductive variety with fairly strong straw. The Early Tyumenskaya cultivar was selected by mass selection methodfrom the cultivar Rollo (K-45657, Norway).
For glutenin extraction, we used a Tris-HCl buffer, pH 6.8 containing sodium dodecylsulphate and 10 % β-mercaptoethanol following complete gliadin extraction by 70 % ethanol. Restoration of S-S-bonds was conducted for 15hours at 40°C. SDS–PAAG electrophoresis was performed according to Laemmli (1970), overnight, at constant currentstrength and stable voltage. Concentrating and separating gels (3 and 10 %, respectively), containing acrylamide,methylenbisachrilamide, Tris-HCl (pH 6,8), TEMED, ammonium persulphate, and 10 % SDS. The gels were scannedand density-measured. A standard protein mixture was used to determine molecular mass (Mr) of glutenin subunits.HMW-glutenin subunits were identified according to Payne et al. (1983). Aggregation ability of gluten proteins, as oneof the major characteristics of gluten rheological properties, was determined by the modified method of Arakawa andYonezawa (1975), which is widely used for classifying cultivars by gluten quality. The tests were conducted directlywith flour and gluten washed in 1 % NaCl solution and in distilled water. Washed gluten was extracted by 0.01 M aceticacid for 16–20 h at 4°C with constant agitation. The extracts then were centrifuged at 7,000 g for 15 min. Proteinconcentration was determined by spectrophotometric Calcar’s method and calculated as per the following formula:
1,45D280
– 0,74D260
= C mg/ml,where 0.74 and 1.45 = recalculation ratios,C = protein concentration in the solution,D
280 and D
260 = optical solution density.
Aggregating ability was determined by the change of absorption at turbidity increase, for 10 min with theinterval of 30 sec, protein solution + 0.2 M phosphate buffer, pH 5.65, (Arakawa and Yonezawa 1975) or pH 9.5
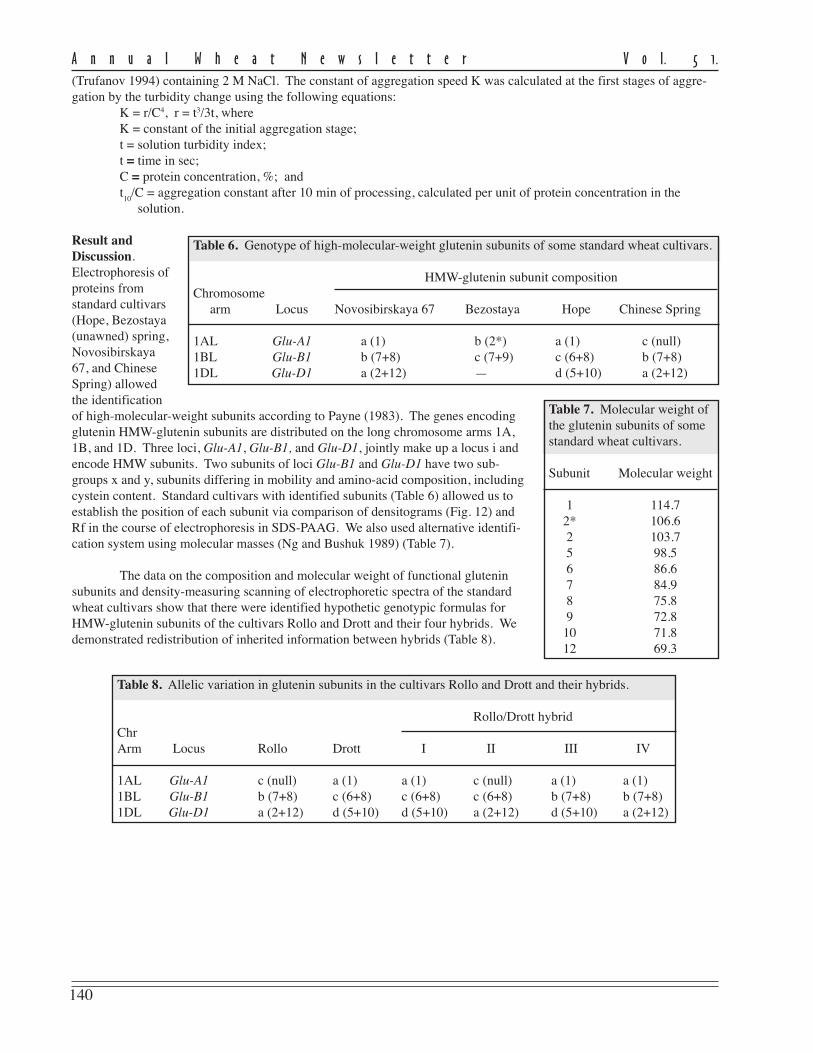
140
A n n u a l W h e a t N e w s l e t t e r V o l. 5 1.
(Trufanov 1994) containing 2 M NaCl. The constant of aggregation speed K was calculated at the first stages of aggre-gation by the turbidity change using the following equations:
K = r/C4, r = t3/3t, whereK = constant of the initial aggregation stage;t = solution turbidity index;t = time in sec;C = protein concentration, %; andt10
/C = aggregation constant after 10 min of processing, calculated per unit of protein concentration in thesolution.
Result andDiscussion.Electrophoresis ofproteins fromstandard cultivars(Hope, Bezostaya(unawned) spring,Novosibirskaya67, and ChineseSpring) allowedthe identificationof high-molecular-weight subunits according to Payne (1983). The genes encodingglutenin HMW-glutenin subunits are distributed on the long chromosome arms 1A,1B, and 1D. Three loci, Glu-A1, Glu-B1, and Glu-D1, jointly make up a locus i andencode HMW subunits. Two subunits of loci Glu-B1 and Glu-D1 have two sub-groups x and y, subunits differing in mobility and amino-acid composition, includingcystein content. Standard cultivars with identified subunits (Table 6) allowed us toestablish the position of each subunit via comparison of densitograms (Fig. 12) andRf in the course of electrophoresis in SDS-PAAG. We also used alternative identifi-cation system using molecular masses (Ng and Bushuk 1989) (Table 7).
The data on the composition and molecular weight of functional gluteninsubunits and density-measuring scanning of electrophoretic spectra of the standardwheat cultivars show that there were identified hypothetic genotypic formulas forHMW-glutenin subunits of the cultivars Rollo and Drott and their four hybrids. Wedemonstrated redistribution of inherited information between hybrids (Table 8).
Table 6. Genotype of high-molecular-weight glutenin subunits of some standard wheat cultivars.
HMW-glutenin subunit compositionChromosome arm Locus Novosibirskaya 67 Bezostaya Hope Chinese Spring
1AL Glu-A1 a (1) b (2*) a (1) c (null)1BL Glu-B1 b (7+8) c (7+9) c (6+8) b (7+8)1DL Glu-D1 a (2+12) — d (5+10) a (2+12)
Table 7. Molecular weight ofthe glutenin subunits of somestandard wheat cultivars.
Subunit Molecular weight
1 114.72* 106.62 103.75 98.56 86.67 84.98 75.89 72.8
10 71.812 69.3
Table 8. Allelic variation in glutenin subunits in the cultivars Rollo and Drott and their hybrids.
Rollo/Drott hybridChrArm Locus Rollo Drott I II III IV
1AL Glu-A1 c (null) a (1) a (1) c (null) a (1) a (1)1BL Glu-B1 b (7+8) c (6+8) c (6+8) c (6+8) b (7+8) b (7+8)1DL Glu-D1 a (2+12) d (5+10) d (5+10) a (2+12) d (5+10) a (2+12)
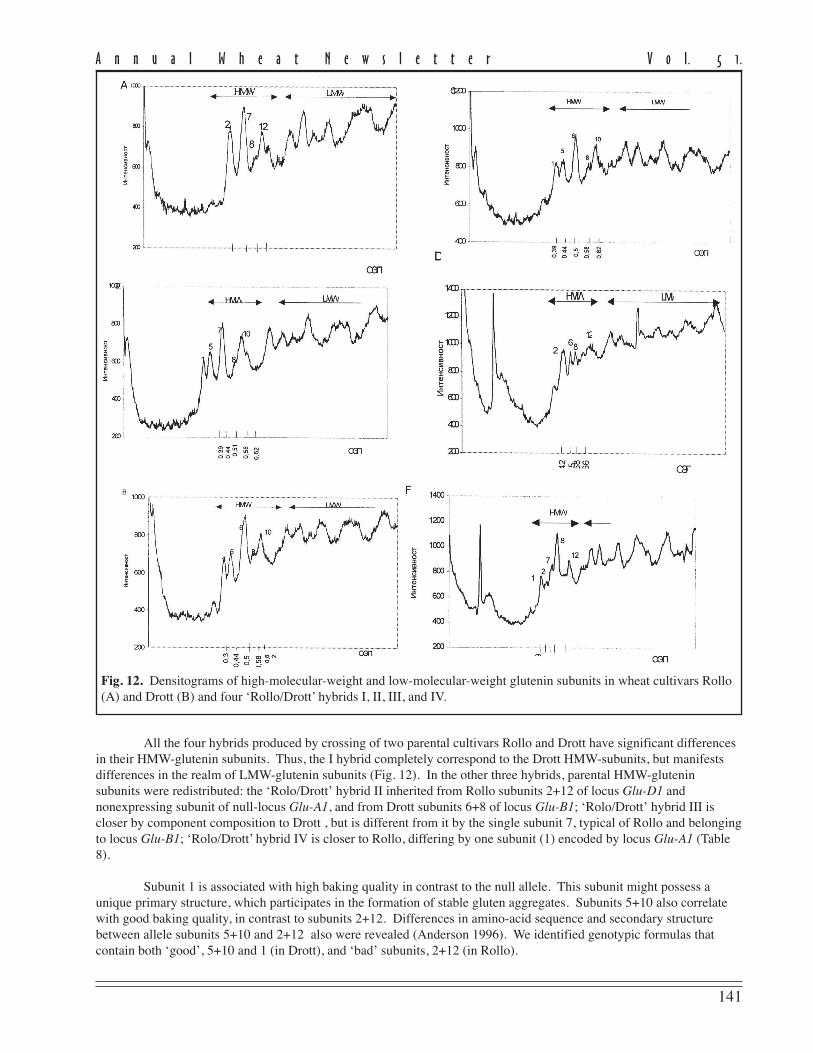
141
A n n u a l W h e a t N e w s l e t t e r V o l. 5 1.
All the four hybrids produced by crossing of two parental cultivars Rollo and Drott have significant differencesin their HMW-glutenin subunits. Thus, the I hybrid completely correspond to the Drott HMW-subunits, but manifestsdifferences in the realm of LMW-glutenin subunits (Fig. 12). In the other three hybrids, parental HMW-gluteninsubunits were redistributed: the ‘Rolo/Drott’ hybrid II inherited from Rollo subunits 2+12 of locus Glu-D1 andnonexpressing subunit of null-locus Glu-A1, and from Drott subunits 6+8 of locus Glu-B1; ‘Rolo/Drott’ hybrid III iscloser by component composition to Drott , but is different from it by the single subunit 7, typical of Rollo and belongingto locus Glu-B1; ‘Rolo/Drott’ hybrid IV is closer to Rollo, differing by one subunit (1) encoded by locus Glu-A1 (Table8).
Subunit 1 is associated with high baking quality in contrast to the null allele. This subunit might possess aunique primary structure, which participates in the formation of stable gluten aggregates. Subunits 5+10 also correlatewith good baking quality, in contrast to subunits 2+12. Differences in amino-acid sequence and secondary structurebetween allele subunits 5+10 and 2+12 also were revealed (Anderson 1996). We identified genotypic formulas thatcontain both ‘good’, 5+10 and 1 (in Drott), and ‘bad’ subunits, 2+12 (in Rollo).
Fig. 12. Densitograms of high-molecular-weight and low-molecular-weight glutenin subunits in wheat cultivars Rollo(A) and Drott (B) and four ‘Rollo/Drott’ hybrids I, II, III, and IV.
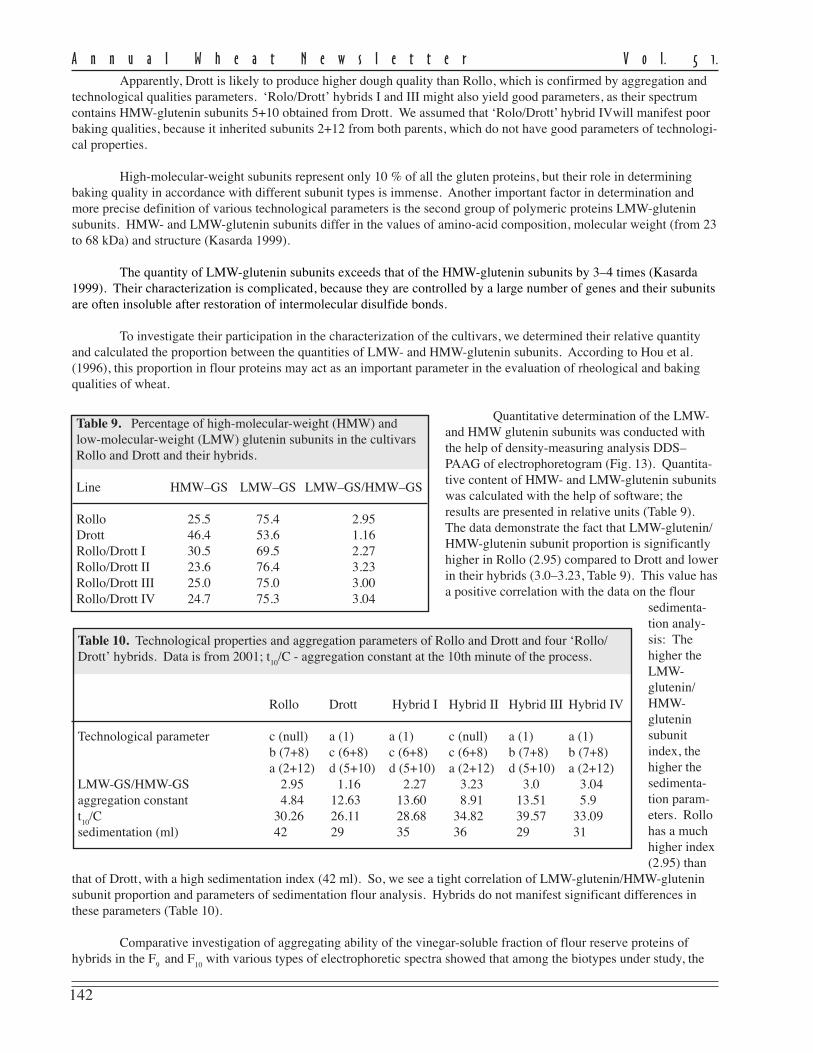
142
A n n u a l W h e a t N e w s l e t t e r V o l. 5 1.
Apparently, Drott is likely to produce higher dough quality than Rollo, which is confirmed by aggregation andtechnological qualities parameters. ‘Rolo/Drott’ hybrids I and III might also yield good parameters, as their spectrumcontains HMW-glutenin subunits 5+10 obtained from Drott. We assumed that ‘Rolo/Drott’ hybrid IVwill manifest poorbaking qualities, because it inherited subunits 2+12 from both parents, which do not have good parameters of technologi-cal properties.
High-molecular-weight subunits represent only 10 % of all the gluten proteins, but their role in determiningbaking quality in accordance with different subunit types is immense. Another important factor in determination andmore precise definition of various technological parameters is the second group of polymeric proteins LMW-gluteninsubunits. HMW- and LMW-glutenin subunits differ in the values of amino-acid composition, molecular weight (from 23to 68 kDa) and structure (Kasarda 1999).
The quantity of LMW-glutenin subunits exceeds that of the HMW-glutenin subunits by 3–4 times (Kasarda1999). Their characterization is complicated, because they are controlled by a large number of genes and their subunitsare often insoluble after restoration of intermolecular disulfide bonds.
To investigate their participation in the characterization of the cultivars, we determined their relative quantityand calculated the proportion between the quantities of LMW- and HMW-glutenin subunits. According to Hou et al.(1996), this proportion in flour proteins may act as an important parameter in the evaluation of rheological and bakingqualities of wheat.
Quantitative determination of the LMW-and HMW glutenin subunits was conducted withthe help of density-measuring analysis DDS–PAAG of electrophoretogram (Fig. 13). Quantita-tive content of HMW- and LMW-glutenin subunitswas calculated with the help of software; theresults are presented in relative units (Table 9).The data demonstrate the fact that LMW-glutenin/HMW-glutenin subunit proportion is significantlyhigher in Rollo (2.95) compared to Drott and lowerin their hybrids (3.0–3.23, Table 9). This value hasa positive correlation with the data on the flour
sedimenta-tion analy-sis: Thehigher theLMW-glutenin/HMW-gluteninsubunitindex, thehigher thesedimenta-tion param-eters. Rollohas a muchhigher index(2.95) than
that of Drott, with a high sedimentation index (42 ml). So, we see a tight correlation of LMW-glutenin/HMW-gluteninsubunit proportion and parameters of sedimentation flour analysis. Hybrids do not manifest significant differences inthese parameters (Table 10).
Comparative investigation of aggregating ability of the vinegar-soluble fraction of flour reserve proteins ofhybrids in the F
9 and F
10 with various types of electrophoretic spectra showed that among the biotypes under study, the
Table 9. Percentage of high-molecular-weight (HMW) andlow-molecular-weight (LMW) glutenin subunits in the cultivarsRollo and Drott and their hybrids.
Line HMW–GS LMW–GS LMW–GS/HMW–GS
Rollo 25.5 75.4 2.95Drott 46.4 53.6 1.16Rollo/Drott I 30.5 69.5 2.27Rollo/Drott II 23.6 76.4 3.23Rollo/Drott III 25.0 75.0 3.00Rollo/Drott IV 24.7 75.3 3.04
Table 10. Technological properties and aggregation parameters of Rollo and Drott and four ‘Rollo/Drott’ hybrids. Data is from 2001; t
10/C - aggregation constant at the 10th minute of the process.
Rollo Drott Hybrid I Hybrid II Hybrid III Hybrid IV
Technological parameter c (null) a (1) a (1) c (null) a (1) a (1)b (7+8) c (6+8) c (6+8) c (6+8) b (7+8) b (7+8)a (2+12) d (5+10) d (5+10) a (2+12) d (5+10) a (2+12)
LMW-GS/HMW-GS 2.95 1.16 2.27 3.23 3.0 3.04aggregation constant 4.84 12.63 13.60 8.91 13.51 5.9t10
/C 30.26 26.11 28.68 34.82 39.57 33.09sedimentation (ml) 42 29 35 36 29 31
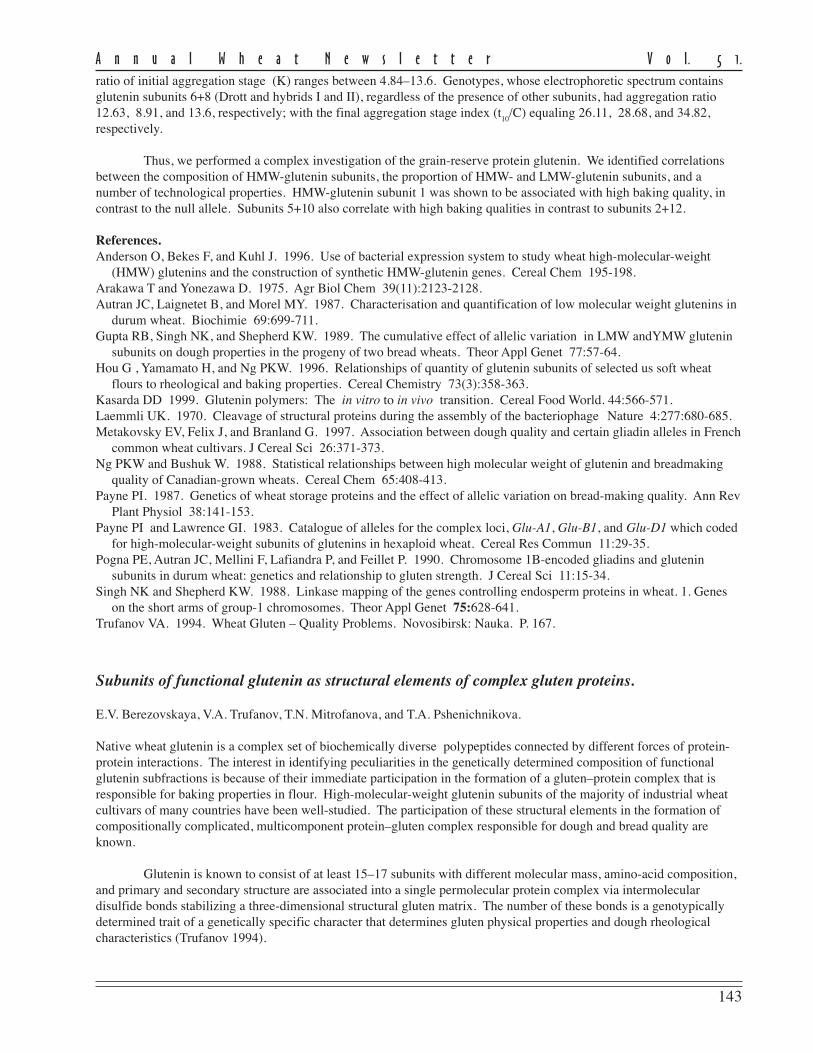
143
A n n u a l W h e a t N e w s l e t t e r V o l. 5 1.
ratio of initial aggregation stage (K) ranges between 4.84–13.6. Genotypes, whose electrophoretic spectrum containsglutenin subunits 6+8 (Drott and hybrids I and II), regardless of the presence of other subunits, had aggregation ratio12.63, 8.91, and 13.6, respectively; with the final aggregation stage index (t
10/C) equaling 26.11, 28.68, and 34.82,
respectively.
Thus, we performed a complex investigation of the grain-reserve protein glutenin. We identified correlationsbetween the composition of HMW-glutenin subunits, the proportion of HMW- and LMW-glutenin subunits, and anumber of technological properties. HMW-glutenin subunit 1 was shown to be associated with high baking quality, incontrast to the null allele. Subunits 5+10 also correlate with high baking qualities in contrast to subunits 2+12.
References.Anderson O, Bekes F, and Kuhl J. 1996. Use of bacterial expression system to study wheat high-molecular-weight
(HMW) glutenins and the construction of synthetic HMW-glutenin genes. Cereal Chem 195-198.Arakawa T and Yonezawa D. 1975. Agr Biol Chem 39(11):2123-2128.Autran JC, Laignetet B, and Morel MY. 1987. Characterisation and quantification of low molecular weight glutenins in
durum wheat. Biochimie 69:699-711.Gupta RB, Singh NK, and Shepherd KW. 1989. The cumulative effect of allelic variation in LMW andYMW glutenin
subunits on dough properties in the progeny of two bread wheats. Theor Appl Genet 77:57-64.Hou G , Yamamato H, and Ng PKW. 1996. Relationships of quantity of glutenin subunits of selected us soft wheat
flours to rheological and baking properties. Cereal Chemistry 73(3):358-363.Kasarda DD 1999. Glutenin polymers: The in vitro to in vivo transition. Cereal Food World. 44:566-571.Laemmli UK. 1970. Cleavage of structural proteins during the assembly of the bacteriophage
Nature 4:277:680-685.
Metakovsky EV, Felix J, and Branland G. 1997. Association between dough quality and certain gliadin alleles in Frenchcommon wheat cultivars. J Cereal Sci 26:371-373.
Ng PKW and Bushuk W. 1988. Statistical relationships between high molecular weight of glutenin and breadmakingquality of Canadian-grown wheats. Cereal Chem 65:408-413.
Payne PI. 1987. Genetics of wheat storage proteins and the effect of allelic variation on bread-making quality. Ann RevPlant Physiol 38:141-153.
Payne PI and Lawrence GI. 1983. Catalogue of alleles for the complex loci, Glu-A1, Glu-B1, and Glu-D1 which codedfor high-molecular-weight subunits of glutenins in hexaploid wheat. Cereal Res Commun 11:29-35.
Pogna PE, Autran JC, Mellini F, Lafiandra P, and Feillet P. 1990. Chromosome 1B-encoded gliadins and gluteninsubunits in durum wheat: genetics and relationship to gluten strength. J Cereal Sci 11:15-34.
Singh NK and Shepherd KW. 1988. Linkase mapping of the genes controlling endosperm proteins in wheat. 1. Geneson the short arms of group-1 chromosomes. Theor Appl Genet 75:628-641.
Trufanov VA. 1994. Wheat Gluten – Quality Problems. Novosibirsk: Nauka. P. 167.
Subunits of functional glutenin as structural elements of complex gluten proteins.
E.V. Berezovskaya, V.A. Trufanov, T.N. Mitrofanova, and T.A. Pshenichnikova.
Native wheat glutenin is a complex set of biochemically diverse polypeptides connected by different forces of protein-protein interactions. The interest in identifying peculiarities in the genetically determined composition of functionalglutenin subfractions is because of their immediate participation in the formation of a gluten–protein complex that isresponsible for baking properties in flour. High-molecular-weight glutenin subunits of the majority of industrial wheatcultivars of many countries have been well-studied. The participation of these structural elements in the formation ofcompositionally complicated, multicomponent protein–gluten complex responsible for dough and bread quality areknown.
Glutenin is known to consist of at least 15–17 subunits with different molecular mass, amino-acid composition,and primary and secondary structure are associated into a single permolecular protein complex via intermoleculardisulfide bonds stabilizing a three-dimensional structural gluten matrix. The number of these bonds is a genotypicallydetermined trait of a genetically specific character that determines gluten physical properties and dough rheologicalcharacteristics (Trufanov 1994).
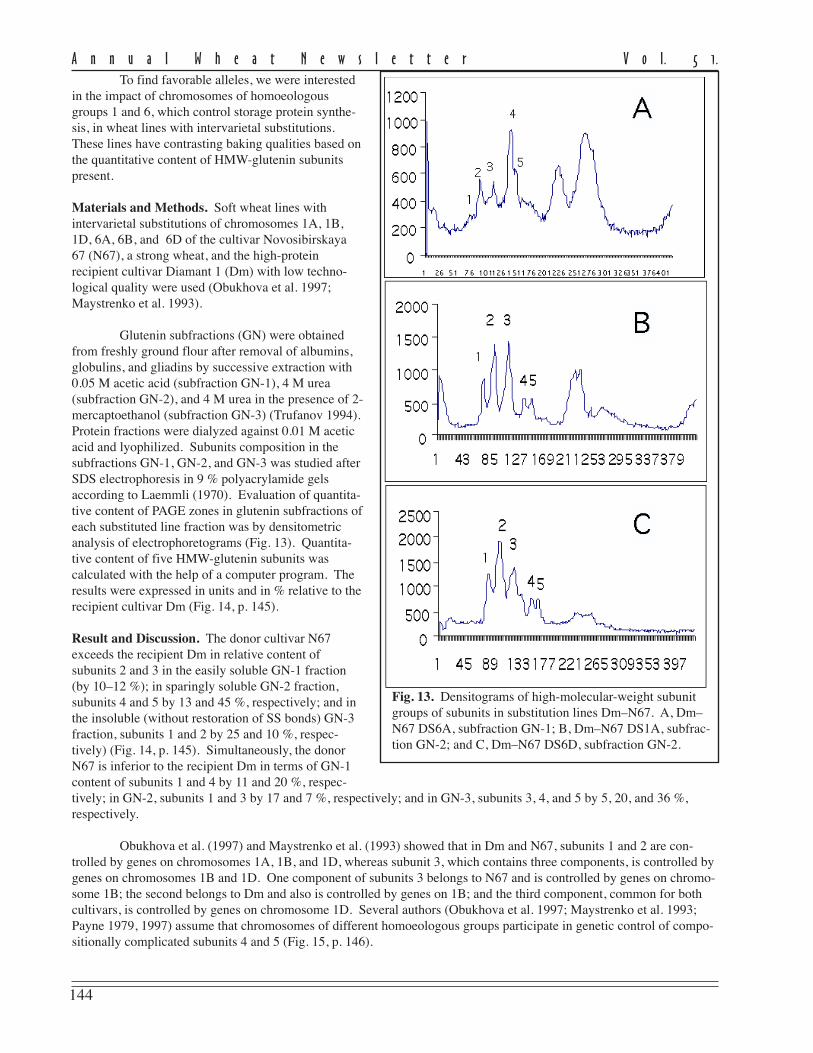
144
A n n u a l W h e a t N e w s l e t t e r V o l. 5 1.
To find favorable alleles, we were interestedin the impact of chromosomes of homoeologousgroups 1 and 6, which control storage protein synthe-sis, in wheat lines with intervarietal substitutions.These lines have contrasting baking qualities based onthe quantitative content of HMW-glutenin subunitspresent.
Materials and Methods. Soft wheat lines withintervarietal substitutions of chromosomes 1A, 1B,1D, 6A, 6B, and 6D of the cultivar Novosibirskaya67 (N67), a strong wheat, and the high-proteinrecipient cultivar Diamant 1 (Dm) with low techno-logical quality were used (Obukhova et al. 1997;Maystrenko et al. 1993).
Glutenin subfractions (GN) were obtainedfrom freshly ground flour after removal of albumins,globulins, and gliadins by successive extraction with0.05 M acetic acid (subfraction GN-1), 4 M urea(subfraction GN-2), and 4 M urea in the presence of 2-mercaptoethanol (subfraction GN-3) (Trufanov 1994).Protein fractions were dialyzed against 0.01 M aceticacid and lyophilized. Subunits composition in thesubfractions GN-1, GN-2, and GN-3 was studied afterSDS electrophoresis in 9 % polyacrylamide gelsaccording to Laemmli (1970). Evaluation of quantita-tive content of PAGE zones in glutenin subfractions ofeach substituted line fraction was by densitometricanalysis of electrophoretograms (Fig. 13). Quantita-tive content of five HMW-glutenin subunits wascalculated with the help of a computer program. Theresults were expressed in units and in % relative to therecipient cultivar Dm (Fig. 14, p. 145).
Result and Discussion. The donor cultivar N67exceeds the recipient Dm in relative content ofsubunits 2 and 3 in the easily soluble GN-1 fraction(by 10–12 %); in sparingly soluble GN-2 fraction,subunits 4 and 5 by 13 and 45 %, respectively; and inthe insoluble (without restoration of SS bonds) GN-3fraction, subunits 1 and 2 by 25 and 10 %, respec-tively) (Fig. 14, p. 145). Simultaneously, the donorN67 is inferior to the recipient Dm in terms of GN-1content of subunits 1 and 4 by 11 and 20 %, respec-tively; in GN-2, subunits 1 and 3 by 17 and 7 %, respectively; and in GN-3, subunits 3, 4, and 5 by 5, 20, and 36 %,respectively.
Obukhova et al. (1997) and Maystrenko et al. (1993) showed that in Dm and N67, subunits 1 and 2 are con-trolled by genes on chromosomes 1A, 1B, and 1D, whereas subunit 3, which contains three components, is controlled bygenes on chromosomes 1B and 1D. One component of subunits 3 belongs to N67 and is controlled by genes on chromo-some 1B; the second belongs to Dm and also is controlled by genes on 1B; and the third component, common for bothcultivars, is controlled by genes on chromosome 1D. Several authors (Obukhova et al. 1997; Maystrenko et al. 1993;Payne 1979, 1997) assume that chromosomes of different homoeologous groups participate in genetic control of compo-sitionally complicated subunits 4 and 5 (Fig. 15, p. 146).
Fig. 13. Densitograms of high-molecular-weight subunitgroups of subunits in substitution lines Dm–N67. A, Dm–N67 DS6A, subfraction GN-1; B, Dm–N67 DS1A, subfrac-tion GN-2; and C, Dm–N67 DS6D, subfraction GN-2.
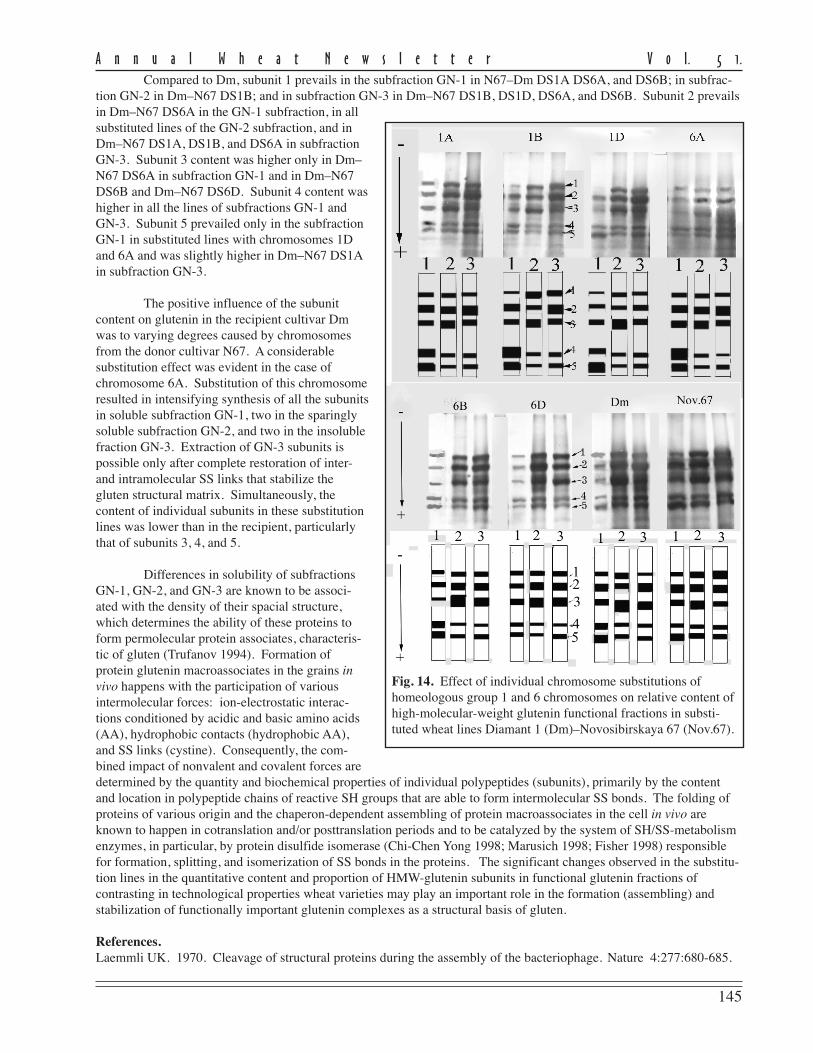
145
A n n u a l W h e a t N e w s l e t t e r V o l. 5 1.
Compared to Dm, subunit 1 prevails in the subfraction GN-1 in N67–Dm DS1A DS6A, and DS6B; in subfrac-tion GN-2 in Dm–N67 DS1B; and in subfraction GN-3 in Dm–N67 DS1B, DS1D, DS6A, and DS6B. Subunit 2 prevailsin Dm–N67 DS6A in the GN-1 subfraction, in allsubstituted lines of the GN-2 subfraction, and inDm–N67 DS1A, DS1B, and DS6A in subfractionGN-3. Subunit 3 content was higher only in Dm–N67 DS6A in subfraction GN-1 and in Dm–N67DS6B and Dm–N67 DS6D. Subunit 4 content washigher in all the lines of subfractions GN-1 andGN-3. Subunit 5 prevailed only in the subfractionGN-1 in substituted lines with chromosomes 1Dand 6A and was slightly higher in Dm–N67 DS1Ain subfraction GN-3.
The positive influence of the subunitcontent on glutenin in the recipient cultivar Dmwas to varying degrees caused by chromosomesfrom the donor cultivar N67. A considerablesubstitution effect was evident in the case ofchromosome 6A. Substitution of this chromosomeresulted in intensifying synthesis of all the subunitsin soluble subfraction GN-1, two in the sparinglysoluble subfraction GN-2, and two in the insolublefraction GN-3. Extraction of GN-3 subunits ispossible only after complete restoration of inter-and intramolecular SS links that stabilize thegluten structural matrix. Simultaneously, thecontent of individual subunits in these substitutionlines was lower than in the recipient, particularlythat of subunits 3, 4, and 5.
Differences in solubility of subfractionsGN-1, GN-2, and GN-3 are known to be associ-ated with the density of their spacial structure,which determines the ability of these proteins toform permolecular protein associates, characteris-tic of gluten (Trufanov 1994). Formation ofprotein glutenin macroassociates in the grains invivo happens with the participation of variousintermolecular forces: ion-electrostatic interac-tions conditioned by acidic and basic amino acids(AA), hydrophobic contacts (hydrophobic AA),and SS links (cystine). Consequently, the com-bined impact of nonvalent and covalent forces aredetermined by the quantity and biochemical properties of individual polypeptides (subunits), primarily by the contentand location in polypeptide chains of reactive SH groups that are able to form intermolecular SS bonds. The folding ofproteins of various origin and the chaperon-dependent assembling of protein macroassociates in the cell in vivo areknown to happen in cotranslation and/or posttranslation periods and to be catalyzed by the system of SH/SS-metabolismenzymes, in particular, by protein disulfide isomerase (Chi-Chen Yong 1998; Marusich 1998; Fisher 1998) responsiblefor formation, splitting, and isomerization of SS bonds in the proteins. The significant changes observed in the substitu-tion lines in the quantitative content and proportion of HMW-glutenin subunits in functional glutenin fractions ofcontrasting in technological properties wheat varieties may play an important role in the formation (assembling) andstabilization of functionally important glutenin complexes as a structural basis of gluten.
References.Laemmli UK. 1970. Cleavage of structural proteins during the assembly of the bacteriophage.
Nature 4:277:680-685.
Fig. 14. Effect of individual chromosome substitutions ofhomeologous group 1 and 6 chromosomes on relative content ofhigh-molecular-weight glutenin functional fractions in substi-tuted wheat lines Diamant 1 (Dm)–Novosibirskaya 67 (Nov.67).
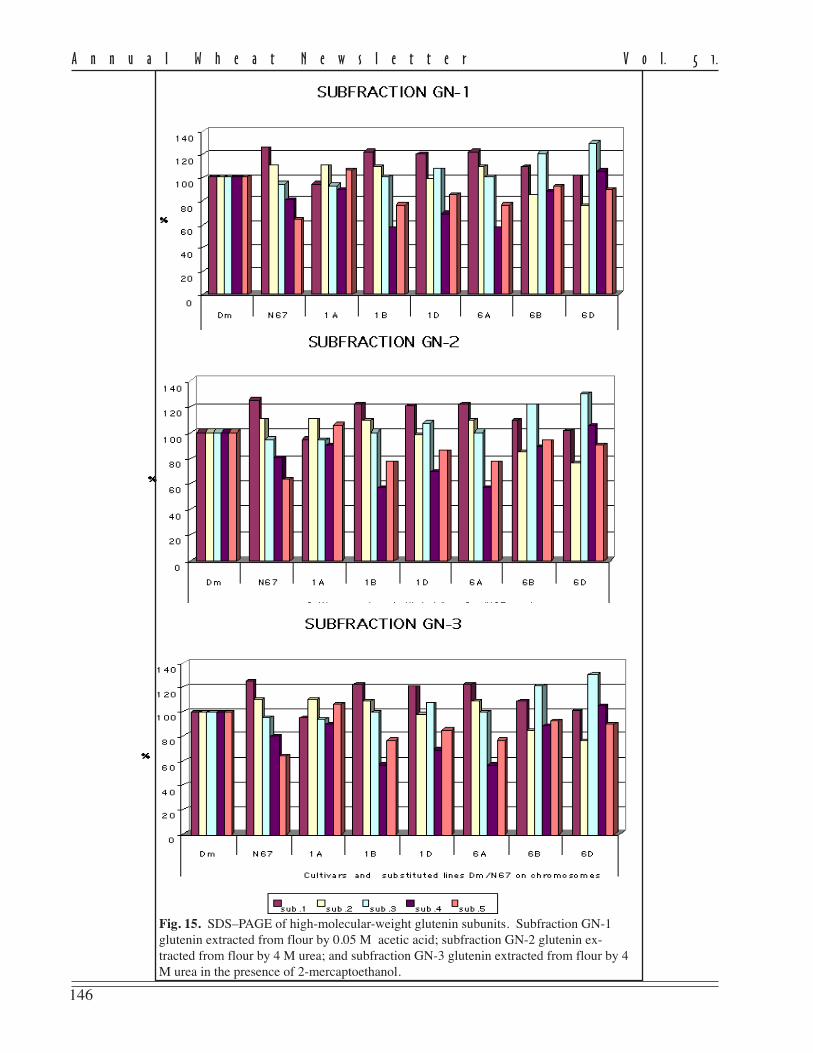
146
A n n u a l W h e a t N e w s l e t t e r V o l. 5 1.
Fig. 15. SDS–PAGE of high-molecular-weight glutenin subunits. Subfraction GN-1glutenin extracted from flour by 0.05 M acetic acid; subfraction GN-2 glutenin ex-tracted from flour by 4 M urea; and subfraction GN-3 glutenin extracted from flour by 4M urea in the presence of 2-mercaptoethanol.
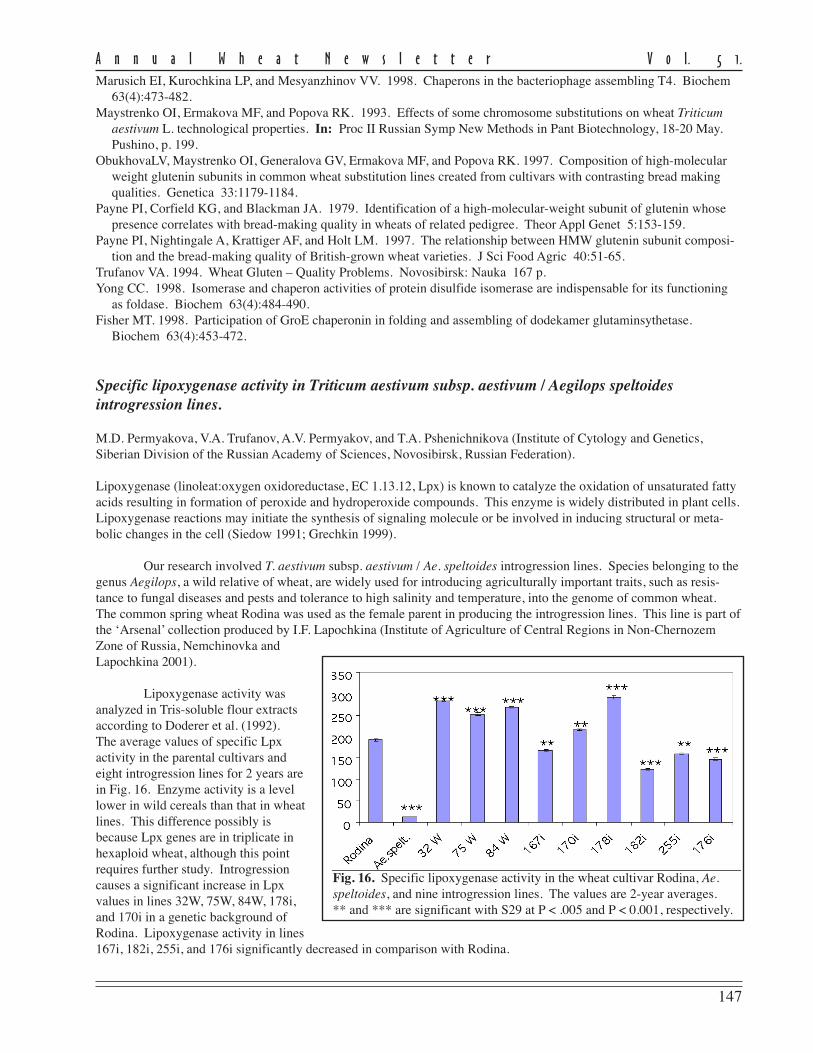
147
A n n u a l W h e a t N e w s l e t t e r V o l. 5 1.
Marusich EI, Kurochkina LP, and Mesyanzhinov VV. 1998. Chaperons in the bacteriophage assembling T4. Biochem63(4):473-482.
Maystrenko OI, Ermakova MF, and Popova RK. 1993. Effects of some chromosome substitutions on wheat Triticumaestivum L. technological properties. In: Proc II Russian Symp New Methods in Pant Biotechnology, 18-20 May.Pushino, p. 199.
ObukhovaLV, Maystrenko OI, Generalova GV, Ermakova MF, and Popova RK. 1997. Composition of high-molecularweight glutenin subunits in common wheat substitution lines created from cultivars with contrasting bread makingqualities. Genetica 33:1179-1184.
Payne PI, Corfield KG, and Blackman JA. 1979. Identification of a high-molecular-weight subunit of glutenin whosepresence correlates with bread-making quality in wheats of related pedigree. Theor Appl Genet 5:153-159.
Payne PI, Nightingale A, Krattiger AF, and Holt LM. 1997. The relationship between HMW glutenin subunit composi-tion and the bread-making quality of British-grown wheat varieties. J Sci Food Agric 40:51-65.
Trufanov VA. 1994. Wheat Gluten – Quality Problems. Novosibirsk: Nauka 167 p.Yong CC. 1998. Isomerase and chaperon activities of protein disulfide isomerase are indispensable for its functioning
as foldase. Biochem 63(4):484-490.Fisher MT. 1998. Participation of GroE chaperonin in folding and assembling of dodekamer glutaminsythetase.
Biochem 63(4):453-472.
Specific lipoxygenase activity in Triticum aestivum subsp. aestivum / Aegilops speltoidesintrogression lines.
M.D. Permyakova, V.A. Trufanov, A.V. Permyakov, and T.A. Pshenichnikova (Institute of Cytology and Genetics,Siberian Division of the Russian Academy of Sciences, Novosibirsk, Russian Federation).
Lipoxygenase (linoleat:oxygen oxidoreductase, EC 1.13.12, Lpx) is known to catalyze the oxidation of unsaturated fattyacids resulting in formation of peroxide and hydroperoxide compounds. This enzyme is widely distributed in plant cells.Lipoxygenase reactions may initiate the synthesis of signaling molecule or be involved in inducing structural or meta-bolic changes in the cell (Siedow 1991; Grechkin 1999).
Our research involved T. aestivum subsp. aestivum / Ae. speltoides introgression lines. Species belonging to thegenus Aegilops, a wild relative of wheat, are widely used for introducing agriculturally important traits, such as resis-tance to fungal diseases and pests and tolerance to high salinity and temperature, into the genome of common wheat.The common spring wheat Rodina was used as the female parent in producing the introgression lines. This line is part ofthe ‘Arsenal’ collection produced by I.F. Lapochkina (Institute of Agriculture of Central Regions in Non-ChernozemZone of Russia, Nemchinovka andLapochkina 2001).
Lipoxygenase activity wasanalyzed in Tris-soluble flour extractsaccording to Doderer et al. (1992).The average values of specific Lpxactivity in the parental cultivars andeight introgression lines for 2 years arein Fig. 16. Enzyme activity is a levellower in wild cereals than that in wheatlines. This difference possibly isbecause Lpx genes are in triplicate inhexaploid wheat, although this pointrequires further study. Introgressioncauses a significant increase in Lpxvalues in lines 32W, 75W, 84W, 178i,and 170i in a genetic background ofRodina. Lipoxygenase activity in lines167i, 182i, 255i, and 176i significantly decreased in comparison with Rodina.
Fig. 16. Specific lipoxygenase activity in the wheat cultivar Rodina, Ae.speltoides, and nine introgression lines. The values are 2-year averages.** and *** are significant with S29 at P < .005 and P < 0.001, respectively.
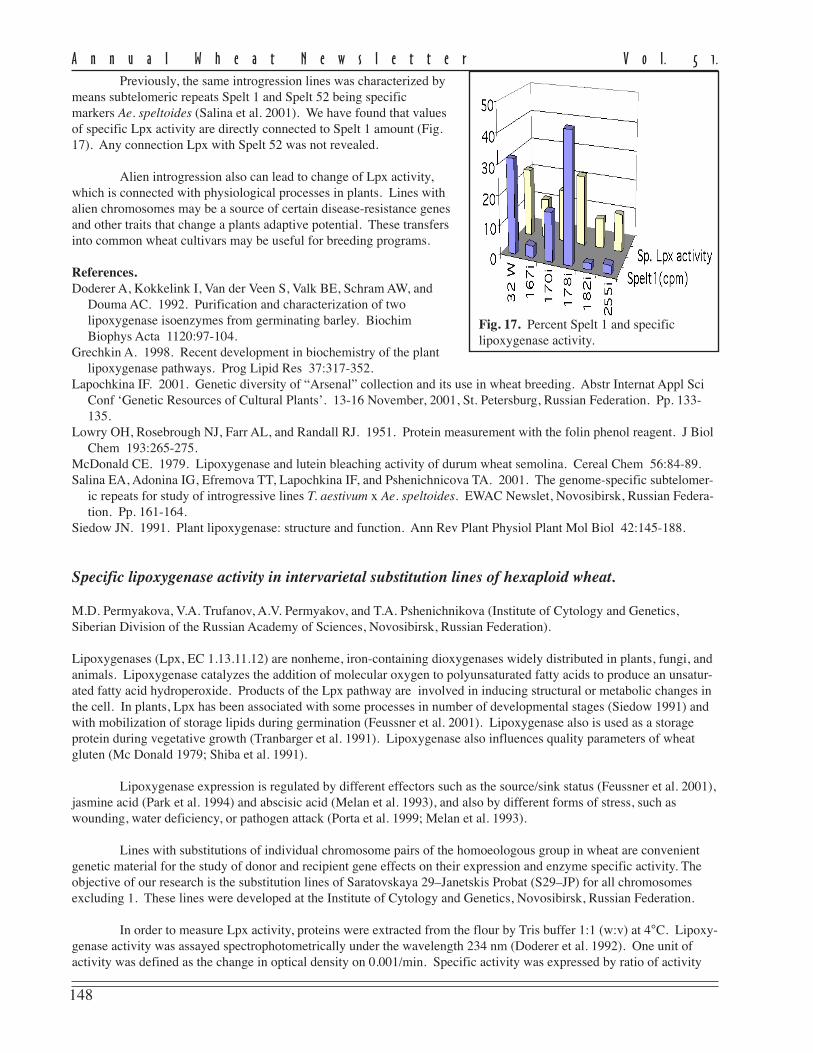
148
A n n u a l W h e a t N e w s l e t t e r V o l. 5 1.
Previously, the same introgression lines was characterized bymeans subtelomeric repeats Spelt 1 and Spelt 52 being specificmarkers Ae. speltoides (Salina et al. 2001). We have found that valuesof specific Lpx activity are directly connected to Spelt 1 amount (Fig.17). Any connection Lpx with Spelt 52 was not revealed.
Alien introgression also can lead to change of Lpx activity,which is connected with physiological processes in plants. Lines withalien chromosomes may be a source of certain disease-resistance genesand other traits that change a plants adaptive potential. These transfersinto common wheat cultivars may be useful for breeding programs.
References.Doderer A, Kokkelink I, Van der Veen S, Valk BE, Schram AW, and
Douma AC. 1992. Purification and characterization of twolipoxygenase isoenzymes from germinating barley. BiochimBiophys Acta 1120:97-104.
Grechkin A. 1998. Recent development in biochemistry of the plantlipoxygenase pathways. Prog Lipid Res 37:317-352.
Lapochkina IF. 2001. Genetic diversity of “Arsenal” collection and its use in wheat breeding. Abstr Internat Appl SciConf ‘Genetic Resources of Cultural Plants’. 13-16 November, 2001, St. Petersburg, Russian Federation. Pp. 133-135.
Lowry OH, Rosebrough NJ, Farr AL, and Randall RJ. 1951. Protein measurement with the folin phenol reagent. J BiolChem 193:265-275.
McDonald CE. 1979. Lipoxygenase and lutein bleaching activity of durum wheat semolina. Cereal Chem 56:84-89.Salina EA, Adonina IG, Efremova TT, Lapochkina IF, and Pshenichnicova TA. 2001. The genome-specific subtelomer-
ic repeats for study of introgressive lines T. aestivum x Ae. speltoides. EWAC Newslet, Novosibirsk, Russian Federa-tion. Pp. 161-164.
Siedow JN. 1991. Plant lipoxygenase: structure and function. Ann Rev Plant Physiol Plant Mol Biol 42:145-188.
Specific lipoxygenase activity in intervarietal substitution lines of hexaploid wheat.
M.D. Permyakova, V.A. Trufanov, A.V. Permyakov, and T.A. Pshenichnikova (Institute of Cytology and Genetics,Siberian Division of the Russian Academy of Sciences, Novosibirsk, Russian Federation).
Lipoxygenases (Lpx, EC 1.13.11.12) are nonheme, iron-containing dioxygenases widely distributed in plants, fungi, andanimals. Lipoxygenase catalyzes the addition of molecular oxygen to polyunsaturated fatty acids to produce an unsatur-ated fatty acid hydroperoxide. Products of the Lpx pathway are involved in inducing structural or metabolic changes inthe cell. In plants, Lpx has been associated with some processes in number of developmental stages (Siedow 1991) andwith mobilization of storage lipids during germination (Feussner et al. 2001). Lipoxygenase also is used as a storageprotein during vegetative growth (Tranbarger et al. 1991). Lipoxygenase also influences quality parameters of wheatgluten (Mc Donald 1979; Shiba et al. 1991).
Lipoxygenase expression is regulated by different effectors such as the source/sink status (Feussner et al. 2001),jasmine acid (Park et al. 1994) and abscisic acid (Melan et al. 1993), and also by different forms of stress, such aswounding, water deficiency, or pathogen attack (Porta et al. 1999; Melan et al. 1993).
Lines with substitutions of individual chromosome pairs of the homoeologous group in wheat are convenientgenetic material for the study of donor and recipient gene effects on their expression and enzyme specific activity. Theobjective of our research is the substitution lines of Saratovskaya 29–Janetskis Probat (S29–JP) for all chromosomesexcluding 1. These lines were developed at the Institute of Cytology and Genetics, Novosibirsk, Russian Federation.
In order to measure Lpx activity, proteins were extracted from the flour by Tris buffer 1:1 (w:v) at 4°C. Lipoxy-genase activity was assayed spectrophotometrically under the wavelength 234 nm (Doderer et al. 1992). One unit ofactivity was defined as the change in optical density on 0.001/min. Specific activity was expressed by ratio of activity
Fig. 17. Percent Spelt 1 and specificlipoxygenase activity.
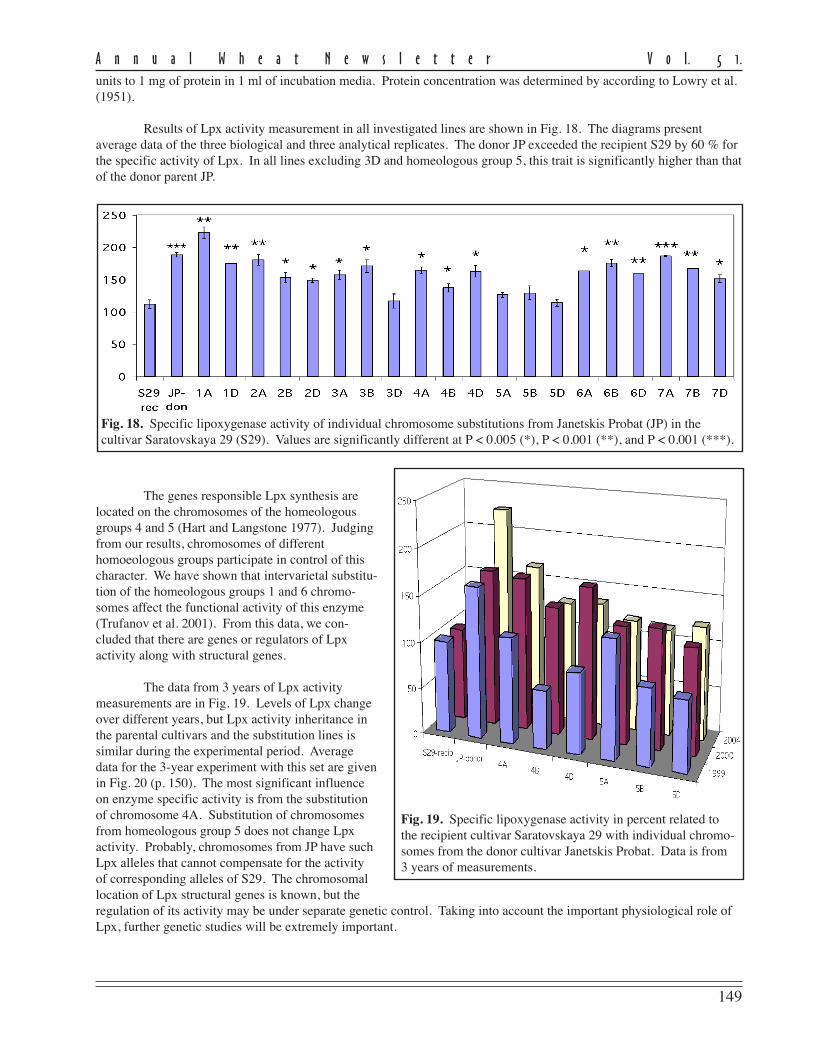
149
A n n u a l W h e a t N e w s l e t t e r V o l. 5 1.
units to 1 mg of protein in 1 ml of incubation media. Protein concentration was determined by according to Lowry et al.(1951).
Results of Lpx activity measurement in all investigated lines are shown in Fig. 18. The diagrams presentaverage data of the three biological and three analytical replicates. The donor JP exceeded the recipient S29 by 60 % forthe specific activity of Lpx. In all lines excluding 3D and homeologous group 5, this trait is significantly higher than thatof the donor parent JP.
The genes responsible Lpx synthesis arelocated on the chromosomes of the homeologousgroups 4 and 5 (Hart and Langstone 1977). Judgingfrom our results, chromosomes of differenthomoeologous groups participate in control of thischaracter. We have shown that intervarietal substitu-tion of the homeologous groups 1 and 6 chromo-somes affect the functional activity of this enzyme(Trufanov et al. 2001). From this data, we con-cluded that there are genes or regulators of Lpxactivity along with structural genes.
The data from 3 years of Lpx activitymeasurements are in Fig. 19. Levels of Lpx changeover different years, but Lpx activity inheritance inthe parental cultivars and the substitution lines issimilar during the experimental period. Averagedata for the 3-year experiment with this set are givenin Fig. 20 (p. 150). The most significant influenceon enzyme specific activity is from the substitutionof chromosome 4A. Substitution of chromosomesfrom homeologous group 5 does not change Lpxactivity. Probably, chromosomes from JP have suchLpx alleles that cannot compensate for the activityof corresponding alleles of S29. The chromosomallocation of Lpx structural genes is known, but theregulation of its activity may be under separate genetic control. Taking into account the important physiological role ofLpx, further genetic studies will be extremely important.
Fig. 19. Specific lipoxygenase activity in percent related tothe recipient cultivar Saratovskaya 29 with individual chromo-somes from the donor cultivar Janetskis Probat. Data is from3 years of measurements.
Fig. 18. Specific lipoxygenase activity of individual chromosome substitutions from Janetskis Probat (JP) in thecultivar Saratovskaya 29 (S29). Values are significantly different at P < 0.005 (*), P < 0.001 (**), and P < 0.001 (***).
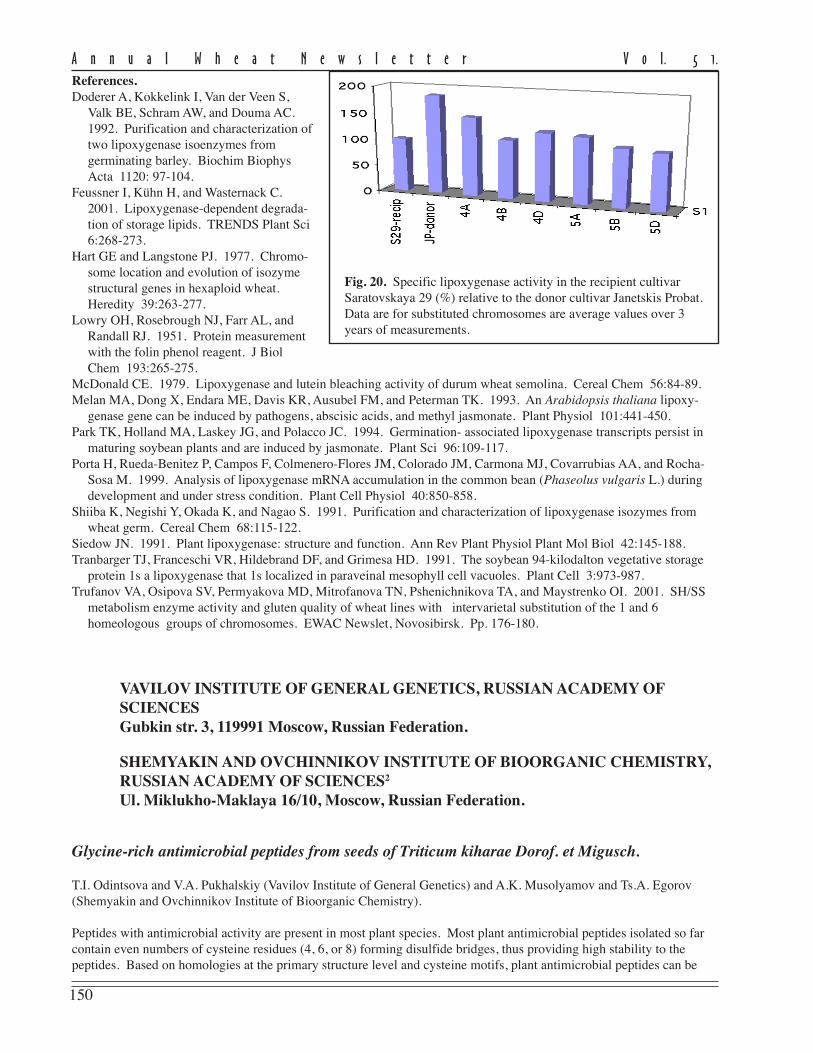
150
A n n u a l W h e a t N e w s l e t t e r V o l. 5 1.
References.Doderer A, Kokkelink I, Van der Veen S,
Valk BE, Schram AW, and Douma AC.1992. Purification and characterization oftwo lipoxygenase isoenzymes fromgerminating barley. Biochim BiophysActa 1120: 97-104.
Feussner I, Kühn H, and Wasternack C.2001. Lipoxygenase-dependent degrada-tion of storage lipids. TRENDS Plant Sci6:268-273.
Hart GE and Langstone PJ. 1977. Chromo-some location and evolution of isozymestructural genes in hexaploid wheat.Heredity 39:263-277.
Lowry OH, Rosebrough NJ, Farr AL, andRandall RJ. 1951. Protein measurementwith the folin phenol reagent. J BiolChem 193:265-275.
McDonald CE. 1979. Lipoxygenase and lutein bleaching activity of durum wheat semolina. Cereal Chem 56:84-89.Melan MA, Dong X, Endara ME, Davis KR, Ausubel FM, and Peterman TK. 1993. An Arabidopsis thaliana lipoxy-
genase gene can be induced by pathogens, abscisic acids, and methyl jasmonate. Plant Physiol 101:441-450.Park TK, Holland MA, Laskey JG, and Polacco JC. 1994. Germination- associated lipoxygenase transcripts persist in
maturing soybean plants and are induced by jasmonate. Plant Sci 96:109-117.Porta H, Rueda-Benitez P, Campos F, Colmenero-Flores JM, Colorado JM, Carmona MJ, Covarrubias AA, and Rocha-
Sosa M. 1999. Analysis of lipoxygenase mRNA accumulation in the common bean (Phaseolus vulgaris L.) duringdevelopment and under stress condition. Plant Cell Physiol 40:850-858.
Shiiba K, Negishi Y, Okada K, and Nagao S. 1991. Purification and characterization of lipoxygenase isozymes fromwheat germ. Cereal Chem 68:115-122.
Siedow JN. 1991. Plant lipoxygenase: structure and function. Ann Rev Plant Physiol Plant Mol Biol 42:145-188.Tranbarger TJ, Franceschi VR, Hildebrand DF, and Grimesa HD. 1991. The soybean 94-kilodalton vegetative storage
protein 1s a lipoxygenase that 1s localized in paraveinal mesophyll cell vacuoles. Plant Cell 3:973-987.Trufanov VA, Osipova SV, Permyakova MD, Mitrofanova TN, Pshenichnikova TA, and Maystrenko OI. 2001. SH/SS
metabolism enzyme activity and gluten quality of wheat lines with intervarietal substitution of the 1 and 6homeologous groups of chromosomes. EWAC Newslet, Novosibirsk. Pp. 176-180.
VAVILOV INSTITUTE OF GENERAL GENETICS, RUSSIAN ACADEMY OFSCIENCESGubkin str. 3, 119991 Moscow, Russian Federation.
SHEMYAKIN AND OVCHINNIKOV INSTITUTE OF BIOORGANIC CHEMISTRY,RUSSIAN ACADEMY OF SCIENCES2
Ul. Miklukho-Maklaya 16/10, Moscow, Russian Federation.
Glycine-rich antimicrobial peptides from seeds of Triticum kiharae Dorof. et Migusch.
T.I. Odintsova and V.A. Pukhalskiy (Vavilov Institute of General Genetics) and A.K. Musolyamov and Ts.A. Egorov(Shemyakin and Ovchinnikov Institute of Bioorganic Chemistry).
Peptides with antimicrobial activity are present in most plant species. Most plant antimicrobial peptides isolated so farcontain even numbers of cysteine residues (4, 6, or 8) forming disulfide bridges, thus providing high stability to thepeptides. Based on homologies at the primary structure level and cysteine motifs, plant antimicrobial peptides can be
Fig. 20. Specific lipoxygenase activity in the recipient cultivarSaratovskaya 29 (%) relative to the donor cultivar Janetskis Probat.Data are for substituted chromosomes are average values over 3years of measurements.
151
A n n u a l W h e a t N e w s l e t t e r V o l. 5 1.
classified into distinct families including thionins, plant defensins, lipid transfer proteins, and hevein- and knottin-typeantimicrobial peptides (Garcia-Olmedo et al. 1998). All antimicrobial peptides studied so far exert their antimicrobialactivity at the level of the plasma membrane of the target microorganism, but different peptide types are likely to operatevia different mechanisms. In a number of plant species, a considerable induction of genes expressing antimicrobialpeptides has been observed upon infection with pathogens suggesting their role in inducible defense response of plants.Constitutive expression of heterologous antimicrobial peptide genes, which has resulted in enhanced resistance toparticular microbial pathogens, has been achieved for several plant species. New potent antimicrobial peptides are ofconsiderable interest for production of transgenic resistant crops, they also have a considerable potential as noveltherapeutic agents, disinfectants and food preservatives. Considerable progress has been made recently in the identifica-tion of new antimicrobial peptides in different plant species. However, wild relatives of wheat and related species highlyresistant to pathogenic microorganisms are poorly studied. In this work, we analyzed the peptide composition of seedsof Triticum kiharae, a synthetic allopolyploid produced by crossing T. timopheevii subsp. timopheevii with Ae. tauschii,which is highly resistant to most fungal pathogens.
Materials and Methods. The peptide fraction was extracted from T. kiharae flour with acids (1 % trifluoroacetic acid, 1M HCl, and 5 % HCOOH) for 1 h at room temperature and precipitated overnight with cold acetone, redissolved, andsubjected to chromatography on Heparin Sepharose. Proteins and peptides were eluted with a stepwise NaCl gradient.The unbound, 100- and 500-mM NaCl fractions were desalted on a C8 cartridge, dried on a Speedvac concentrator, andseparated by size-exclusion chromatography on a Superdex Peptide HR 10/30 column (Amersham–Pharmacia, Biotech,Uppsala, Sweden). Proteins and peptides were eluted with 0.05 % TFA, containing 5 % acetonitrile at a flow rate of 250l/min, and monitored by absorbance at 214 nm. The peptide fraction was further separated by RP–HPLC on a VydacC18 column (4.6 x 250 mm, particle size 5 m) with a linear acetonitrile gradient (10–50 %) for 1 h at a flow rate of 1 ml/min and 40°C. Peptides were detected at 214 nm. The chromatographic fractions were tested for the antifungal activityagainst Helminthosporium sativum and characterized by mass spectrometry (MS) and N-terminal sequencing. Massspectra were acquired on a model Reflex III mass spectrometer (Bruker Daltonics, Bremen, Germany). Dehydrobenzoicacid was used as matrix. N-terminal amino acid sequences were determined by automated Edman degradation on amodel 492 Procise sequencer (Applied Biosystems) according to the manufacturer’s protocol.
Results and Discussion. Previous analysis showed that the seeds of T. kiharae contained several families of antimicro-bial peptides with molecular masses from 3 to 6 kD. I n this work, we focused on the glycine-rich peptides. We discov-ered least eight glycine-rich peptides. Their molecular masses varied from 4,295 to 4,750 Da. N-terminal sequencing(from 10 to 50 amino acid residues) showed that they were homologous, extremely glycine-rich, and cysteine-free. Insequenced regions, glycine constituted 70–80 % of amino acids, and only few other amino-acid residues were found(Tyr, His, Pro, and Ala). A remarkable feature of these peptides was the presence of different repeat motifs, such asG
nYPGH, G
nYP or G
nYPGR, where n is a variable number. Similar repeat motifs were discovered in glycine-rich
proteins involved in plant defense against biotic and abiotic stress. The glycine-rich peptides are low-abundant constitu-ents of T. kiharae seeds, their yields were as follows: 0.4 g/g dry weight for Tk-AMP-G1, 0.6 g/g for Tk-AMP-G2, 0.7g/g for peptides Tk-AMP-G3 and Tk-AMP-G4. Preliminary antifungal tests with H. sativum showed that the Tk-AMP-G peptides caused morphological changes in the fungus at concentrations of 100-150 mg/ml in a dose-dependent manner.These data indicate that T. kiharae is a valuable source of glycine-rich peptides, whose biological activities will beinvestigated in more detail.
Reference.Garcia-Olmedo B, Molina A, Alamillo J, and Rodriguez-Palenzuela P. 1998. Plant defense peptides. Biopolymers
(Peptide Science) 47:479-491.
The alterations in several yield-contributing traits in transgenic wheat.
T.V. Korostyleva, G.V. Kozlovskaya, and V.A. Pukhalskiy.
During the last years, knockout technology based on molecular mechanisms of silencing (RNA interference) is activelyused in experiments to study of gene functions. Now this approach has become a tool for wheat research. The methodincludes transformation of plant with the genetic construct providing the synthesis or endogenous formation in the cellsof double-stranded RNA homologous to any transcribed region of the target gene. The appearance in cells of suchdsRNA triggers specific defensive mechanisms of restriction of dsRNA and mRNA with homology to it, which results in
152
A n n u a l W h e a t N e w s l e t t e r V o l. 5 1.
silencing of target gene. This process was believed to be very specific. However, recently it was reported that dsRNAmight exert unspecific effects on expression of the genome and the genes of the transgenic construct.
Earlier in laboratory the transgenic plants of spring, common wheat cultivar Khakasskaya were obtained usingAgrobacterium transformation in planta. T-DNA of these plants contains inverted repeat of 350-bp fragment of tetracy-cline resistance gene from pBR322 under the control of 35S CaMV promoter and nptII gene as marker. This constructprovides the synthesis of untranslatable dsRNA in wheat cells. It is supposed that its nucleotide sequence has no homol-ogy to the wheat genome.
In the present study we have investigated morphological stability of 18 independent transgenic lines on T1selfed progeny. The presence of T-DNA in individual plant has been confirmed by PCR-analyses with primer toinverted repeat sequence from pBR322. Segregation of T-DNA in progeny was observed only in 2 from 18 transgeniclines (with non -Mendelian ratio), in other lines all offspring plants had transgenic insertion. In contrast to T1 plants withnormal phenotype, T2 progeny of some lines displayed alteration in several traits in field conditions. Using analysis ofvariance by statistical program AGROS 2.10 we have estimated a significance of differences between transgenic plantsfrom individual lines and control group of non-transgenic wheat plants of Khakasskaya. The established changesmanifested in the decrease of spike length (a significant decrease in 13 from 18 lines, i.e., 16.6 % of transformants), aspikelet number per spike (16.6 %), kernel weight (a significant decrease in 13 from 18 lines, i.e., 72 %), and in theincreasing of productive tillering in wheat (11 %).
The reason of these changes might be in the shifts in the hormonal balance in transformants; however, thisassumption demands additional investigations. We are studying inheritance of these alterations. With regard to thenature of observed changes, we can conclude that a high frequency of similar-type changes in independent lines cannotresult of either insertion mutagenesis or somaclonal variability. We believe that the insertion expressing dsRNA inducesunspecific pleiotropic effect on the recipient wheat genome.
N.I. VAVILOV RESEARCH INSTITUTE OF PLANT INDUSTRY42, B. Morskaya Str., St. Petersburg, 190000, Russian Federation.
Genealogical analysis of winter bread wheat cultivars resistant and susceptible to Fusarium headblight from Southern Russia and Ukraine.
S.P. Martynov and T.V. Dobrotvorskaya.
We studied winter bread wheat cultivars from southern Russian Federation (Krasnodar, Stavropol, and Rostov regions)and the Ukraine. For the analysis, cultivars with known pedigrees and were used not conflicting with estimates ofreaction to Fusarium spp. Among the lines were 40 resistant and moderately resistant cultivars (see Table 5, p. 155) and61 susceptible cultivars from southern Russia including Bezostaya 1 (Borojevic and Dencic 1988, Buerstmayr et al.1996), Avrora (Borojevic and Dencic 1988), Lgovskaya 167 (Anonymous 1990), Bystritsa, Delta, Podarok Donu,Donskoj Mayak, Tarasovskaya Ostistaya, Zernogradka 10, Zarnitsa, Stanichnaya, Bat’ko, Donskoj Syurpriz,Zernogradka 11, Rodnik Tarasovskij (Anonymous 1994-2003), Sfera (Puchkov et al. 1996), Spartanka (Terekhina 1993),Dialog 1061-10, KN-1221-k-7-2-14, KN-201-90-k-2, KN-2503-h-112-6-11, KN-2503-h-112-6-3, KN-3071-h-16-16,KN-3303-h-117, KN-3385-h-756, KN-4594-h-370-41, KN-5835-h-427, Massiv 809-1016, Rannyaya 47, Zamena,Krasnodarskaya 70, Olimpiya 2, Skifyanka, Soratnitsa, Ejka, Novokubanka, Otrada, Yugtina, Krasnodarskaya 90, NikaKubani, Ofeliya, Polovchanka, Azau, Aliza, Zimorodok, Nak, Umanka, Kupava, Uskoryanka, Krasota, Selyanka,Krasnodarskaya 99, Yashkulyanka, Fisht (Puchkov et al. 2001); and from Ukraine: Albatros Odesskij, Donetskaya 46(Anonymous 1989), Kiyanka (Anonymous 1981), Lutescens 7 (Anonymous 1990), Mironovskaya Yubilejnaya(Mesterhazy 2001), Odesskaya 132 (Anonymous 1976-1995), and Odesskaya Polukarlikovaya (Babayants et al. 2001).
For each of cultivars a genetic profile was constructed and transfer of scab resistance from ancestors to thedescendants was traced on genealogical trees with the help of the Genetic Resources Information and Analysis SystemGRIS3.5 (Martynov and Dobrotvorskaya 2000). All cultivars of the analyzed set are the descendants of the most popularcultivars Bezostaya 1 (frequency of presence in pedigrees 94.5 %), Mironovskaya 808 (62.6 %), and/or Odesskaya 16
153
A n n u a l W h e a t N e w s l e t t e r V o l. 5 1.
(65.9 %). To reveal differences in the contributions of these parents in groups of resistant and susceptible cultivars thetwo-way ANOVA of the parentage coefficients for the randomized design was used (Table 1). The investigated factorswere cultivar groups (factor A) with two gradations (resistant and susceptible) and dominant ancestors (factor B) withnumber of gradations b = 3.
The ANOVA (Table 1) hasshown the significance of differences ofgroups of resistance/susceptibility (factorA) and ancestor contributions (factor B).The greatest interest represents interac-tion of the investigated factors. Thesignificant interaction (A´B) specifiesdifferences in distribution of the contri-butions of the same ancestors in groupsof resistant and susceptible cultivars.The comparison of average coefficientsof parentage in cultivar groups (Table 2)shows, that the contributions of cultivarsBezostaya 1 and Mironovskaya 808 areidentical in both groups, and the contribution of Odesskaya 16 issignificant higher in group of resistant cultivars. It is known, thatBezostaya 1 is susceptible to FHB (Borojevic and Dencic 1988,Buerstmayr et al. 1996), and the estimates of reaction to Fusariumspp. for Mironovskaya 808 are conflicting, from moderately resistant(Javor et al. 1997) up to susceptible (Buerstmayr et al. 1996). Theresults of our analysis show that most likely Mironovskaya 808, aswell as Bezostaya 1, does not carry genes of resistance to FHB.Moderately resistant cultivar Odesskaya 16 (Kazmin and Shindin1997) most frequently was the donor of resistance of scab-resistancegenes in cultivars from southern Russian Federation and theUkraine. Odesskaya 16 was selected from cultivar Odesskaya 12(Hostianum 237/Zemka, where Hostianum237 is selection from Kharkovskaya, alandrace of Kharkov region, and Zemka islocal variety from Odessa region).Odesskaya 16 is absent in pedigrees of someresistant cultivars (Dakha, Russa, Echo, andZimdar 4), but there are other derivedcultivars of Hostianum 237. Therefore, weassume that a source of resistance to FHB incultivars from southern Russian Federationand the Ukraine was the landraceKharkovskaya via Hostianum 237.
To understand the role of othersources of resistance, we used ANOVA ofthe contributions of some known donors of resistance, which are in pedigrees of the investigated cultivar set (Table 3).The investigated factors were groups of resistant/susceptible cultivars (factor A) and donors of resistance genes (factor B)with the number of gradation b = 9. The ANOVA (Table 3) shows significant differences in the average parentagecoefficients of groups of resistant/susceptible cultivars (factor A) and donors (factor B). The significant ‘A x B’ interac-tion specifies differences in distribution of the contributions of the donors in groups of resistant and susceptible cultivars.
Comparing average coefficients of parentage of the donors (Table 4, p. 154) shows that in addition toOdesskaya 16 in the group of resistant cultivars are the significant cultivars Redcoat, Frontana, and Cheyenne. Thesedonor cultivars are in pedigrees of the southern Russian and Ukrainian cultivars via Biserka (Redcoat), Red River 68(Frontana), and Colt (Cheyenne).
Table 2. Average coefficients of parentage ofimportant ancestors in groups of resistant toscab and susceptible winter bread wheatcultivars from southern Russian Federation andthe Ukraine. Items with an * are significantlydifferent at P < 0.01.
Ancestor name Resistant Susceptible
Bezostaya 1 0.37 0.38Mironovskaya 808 0.15 0.16Odesskaya 16 0.25* 0.10
Table 3. The two-way ANOVA of the parentage coefficients of donorsof resistance to scab in pedigrees of bread wheat cultivars from South-ern Russia and Ukraine (original data are transformed througharcsin√x). Values with an * are significant at P < 0.001.
Source SS DF MS F
General 23578.6 246Groups (factor A) 1669.8 1 1669.8 39.73*Donors of resistance (factor B) 10716.3 8 1339.5 31.88*Interaction (AxB) 1568.8 8 196.1 4.67*Error 9623.7 229 42.0
Table 1. Two-way ANOVA of the parentage coefficients of the three mostimportant ancestors of winter bread wheat cultivars from southern RussianFederation and the Ukraine (original data are transformed througharcsin√x) . Items with an * are significant at P < 0.001.
Source SS DF MS F
General 40,936.9 202Cultivar groups (factor A) 545.6 1 545.6 4.08*Ancestors (factor B) 12,132.7 2 6,066.3 45.41*Interaction (A x B) 1,940.3 2 970.1 7.26*Error 26,318.3 197 133.6
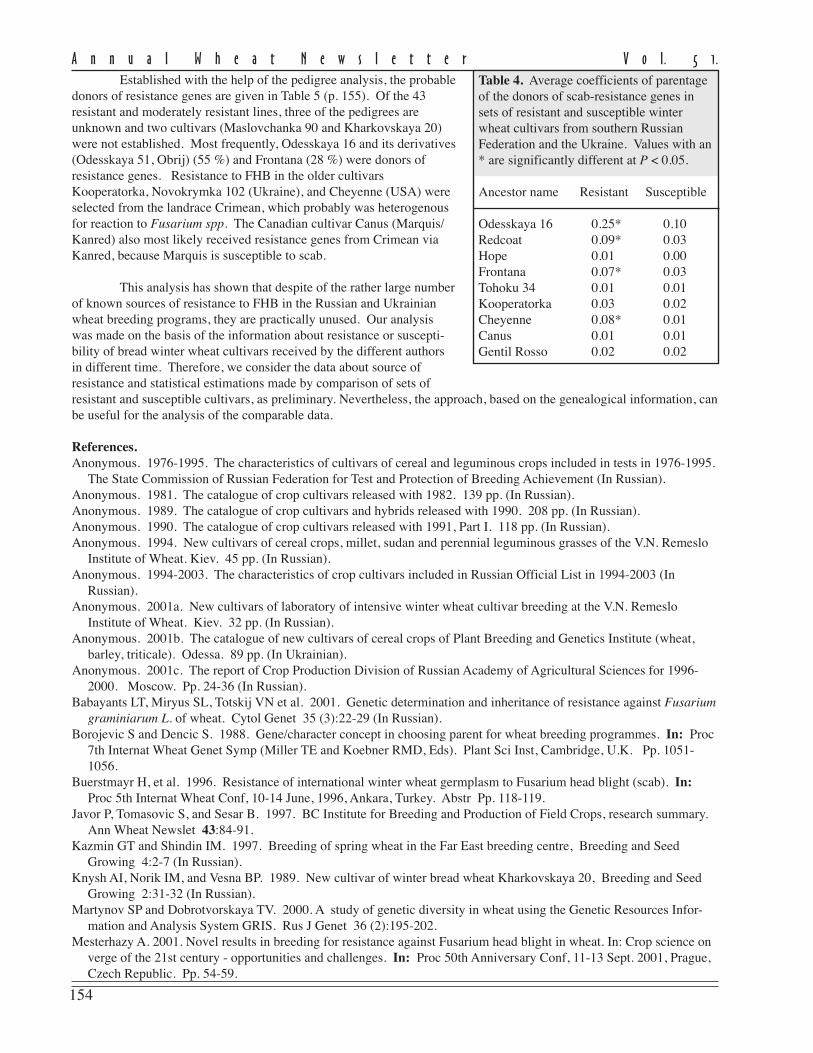
154
A n n u a l W h e a t N e w s l e t t e r V o l. 5 1.
Established with the help of the pedigree analysis, the probabledonors of resistance genes are given in Table 5 (p. 155). Of the 43resistant and moderately resistant lines, three of the pedigrees areunknown and two cultivars (Maslovchanka 90 and Kharkovskaya 20)were not established. Most frequently, Odesskaya 16 and its derivatives(Odesskaya 51, Obrij) (55 %) and Frontana (28 %) were donors ofresistance genes. Resistance to FHB in the older cultivarsKooperatorka, Novokrymka 102 (Ukraine), and Cheyenne (USA) wereselected from the landrace Crimean, which probably was heterogenousfor reaction to Fusarium spp. The Canadian cultivar Canus (Marquis/Kanred) also most likely received resistance genes from Crimean viaKanred, because Marquis is susceptible to scab.
This analysis has shown that despite of the rather large numberof known sources of resistance to FHB in the Russian and Ukrainianwheat breeding programs, they are practically unused. Our analysiswas made on the basis of the information about resistance or suscepti-bility of bread winter wheat cultivars received by the different authorsin different time. Therefore, we consider the data about source ofresistance and statistical estimations made by comparison of sets ofresistant and susceptible cultivars, as preliminary. Nevertheless, the approach, based on the genealogical information, canbe useful for the analysis of the comparable data.
References.Anonymous. 1976-1995. The characteristics of cultivars of cereal and leguminous crops included in tests in 1976-1995.
The State Commission of Russian Federation for Test and Protection of Breeding Achievement (In Russian).Anonymous. 1981. The catalogue of crop cultivars released with 1982. 139 pp. (In Russian).Anonymous. 1989. The catalogue of crop cultivars and hybrids released with 1990. 208 pp. (In Russian).Anonymous. 1990. The catalogue of crop cultivars released with 1991, Part I. 118 pp. (In Russian).Anonymous. 1994. New cultivars of cereal crops, millet, sudan and perennial leguminous grasses of the V.N. Remeslo
Institute of Wheat. Kiev. 45 pp. (In Russian).Anonymous. 1994-2003. The characteristics of crop cultivars included in Russian Official List in 1994-2003 (In
Russian).Anonymous. 2001a. New cultivars of laboratory of intensive winter wheat cultivar breeding at the V.N. Remeslo
Institute of Wheat. Kiev. 32 pp. (In Russian).Anonymous. 2001b. The catalogue of new cultivars of cereal crops of Plant Breeding and Genetics Institute (wheat,
barley, triticale). Odessa. 89 pp. (In Ukrainian).Anonymous. 2001c. The report of Crop Production Division of Russian Academy of Agricultural Sciences for 1996-
2000. Moscow. Pp. 24-36 (In Russian).Babayants LT, Miryus SL, Totskij VN et al. 2001. Genetic determination and inheritance of resistance against Fusarium
graminiarum L. of wheat. Cytol Genet 35 (3):22-29 (In Russian).Borojevic S and Dencic S. 1988. Gene/character concept in choosing parent for wheat breeding programmes. In: Proc
7th Internat Wheat Genet Symp (Miller TE and Koebner RMD, Eds). Plant Sci Inst, Cambridge, U.K. Pp. 1051-1056.
Buerstmayr H, et al. 1996. Resistance of international winter wheat germplasm to Fusarium head blight (scab). In:Proc 5th Internat Wheat Conf, 10-14 June, 1996, Ankara, Turkey. Abstr Pp. 118-119.
Javor P, Tomasovic S, and Sesar B. 1997. BC Institute for Breeding and Production of Field Crops, research summary.Ann Wheat Newslet 43:84-91.
Kazmin GT and Shindin IM. 1997. Breeding of spring wheat in the Far East breeding centre, Breeding and SeedGrowing 4:2-7 (In Russian).
Knysh AI, Norik IM, and Vesna BP. 1989. New cultivar of winter bread wheat Kharkovskaya 20, Breeding and SeedGrowing 2:31-32 (In Russian).
Martynov SP and Dobrotvorskaya TV. 2000. A study of genetic diversity in wheat using the Genetic Resources Infor-mation and Analysis System GRIS. Rus J Genet 36 (2):195-202.
Mesterhazy A. 2001. Novel results in breeding for resistance against Fusarium head blight in wheat. In: Crop science onverge of the 21st century - opportunities and challenges. In: Proc 50th Anniversary Conf, 11-13 Sept. 2001, Prague,Czech Republic. Pp. 54-59.
Table 4. Average coefficients of parentageof the donors of scab-resistance genes insets of resistant and susceptible winterwheat cultivars from southern RussianFederation and the Ukraine. Values with an* are significantly different at P < 0.05.
Ancestor name Resistant Susceptible
Odesskaya 16 0.25* 0.10Redcoat 0.09* 0.03Hope 0.01 0.00Frontana 0.07* 0.03Tohoku 34 0.01 0.01Kooperatorka 0.03 0.02Cheyenne 0.08* 0.01Canus 0.01 0.01Gentil Rosso 0.02 0.02
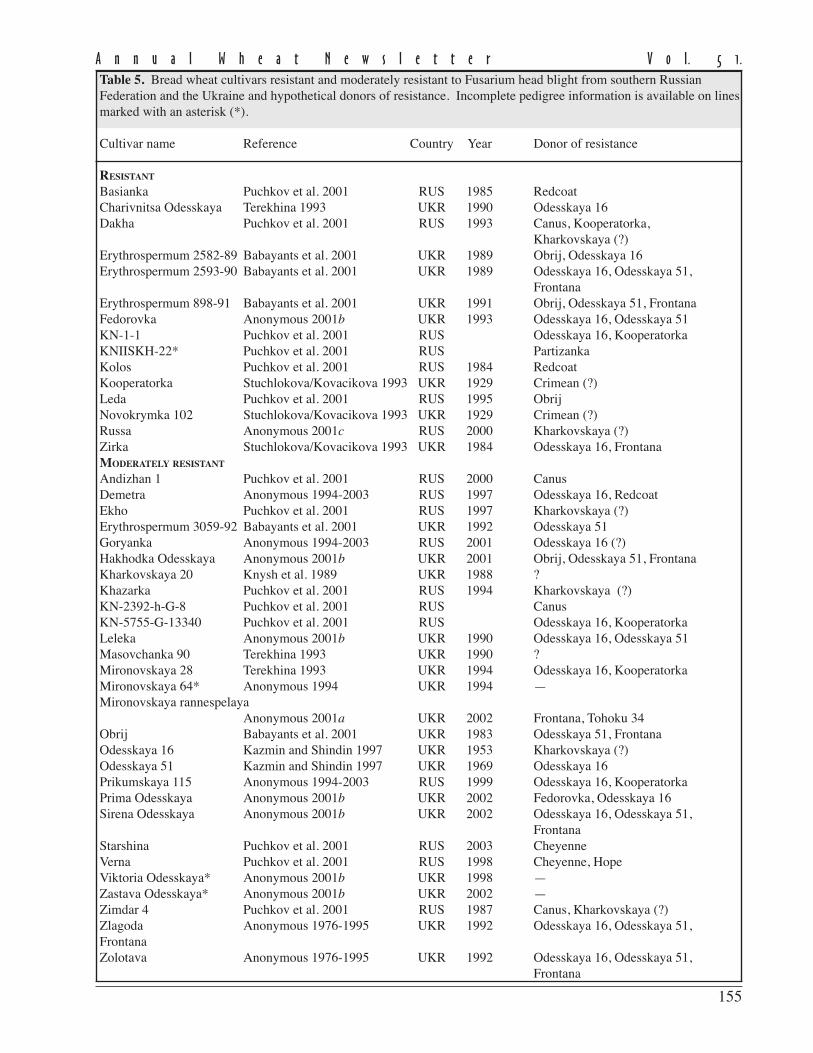
155
A n n u a l W h e a t N e w s l e t t e r V o l. 5 1.
Table 5. Bread wheat cultivars resistant and moderately resistant to Fusarium head blight from southern RussianFederation and the Ukraine and hypothetical donors of resistance. Incomplete pedigree information is available on linesmarked with an asterisk (*).
Cultivar name Reference Country Year Donor of resistance
RESISTANT
Basianka Puchkov et al. 2001 RUS 1985 RedcoatCharivnitsa Odesskaya Terekhina 1993 UKR 1990 Odesskaya 16Dakha Puchkov et al. 2001 RUS 1993 Canus, Kooperatorka,
Kharkovskaya (?)Erythrospermum 2582-89 Babayants et al. 2001 UKR 1989 Obrij, Odesskaya 16Erythrospermum 2593-90 Babayants et al. 2001 UKR 1989 Odesskaya 16, Odesskaya 51,
FrontanaErythrospermum 898-91 Babayants et al. 2001 UKR 1991 Obrij, Odesskaya 51, FrontanaFedorovka Anonymous 2001b UKR 1993 Odesskaya 16, Odesskaya 51KN-1-1 Puchkov et al. 2001 RUS Odesskaya 16, KooperatorkaKNIISKH-22* Puchkov et al. 2001 RUS PartizankaKolos Puchkov et al. 2001 RUS 1984 RedcoatKooperatorka Stuchlokova/Kovacikova 1993 UKR 1929 Crimean (?)Leda Puchkov et al. 2001 RUS 1995 ObrijNovokrymka 102 Stuchlokova/Kovacikova 1993 UKR 1929 Crimean (?)Russa Anonymous 2001c RUS 2000 Kharkovskaya (?)Zirka Stuchlokova/Kovacikova 1993 UKR 1984 Odesskaya 16, FrontanaMODERATELY RESISTANT
Andizhan 1 Puchkov et al. 2001 RUS 2000 CanusDemetra Anonymous 1994-2003 RUS 1997 Odesskaya 16, RedcoatEkho Puchkov et al. 2001 RUS 1997 Kharkovskaya (?)Erythrospermum 3059-92 Babayants et al. 2001 UKR 1992 Odesskaya 51Goryanka Anonymous 1994-2003 RUS 2001 Odesskaya 16 (?)Hakhodka Odesskaya Anonymous 2001b UKR 2001 Obrij, Odesskaya 51, FrontanaKharkovskaya 20 Knysh et al. 1989 UKR 1988 ?Khazarka Puchkov et al. 2001 RUS 1994 Kharkovskaya (?)KN-2392-h-G-8 Puchkov et al. 2001 RUS CanusKN-5755-G-13340 Puchkov et al. 2001 RUS Odesskaya 16, KooperatorkaLeleka Anonymous 2001b UKR 1990 Odesskaya 16, Odesskaya 51Masovchanka 90 Terekhina 1993 UKR 1990 ?Mironovskaya 28 Terekhina 1993 UKR 1994 Odesskaya 16, KooperatorkaMironovskaya 64* Anonymous 1994 UKR 1994 —Mironovskaya rannespelaya
Anonymous 2001a UKR 2002 Frontana, Tohoku 34Obrij Babayants et al. 2001 UKR 1983 Odesskaya 51, FrontanaOdesskaya 16 Kazmin and Shindin 1997 UKR 1953 Kharkovskaya (?)Odesskaya 51 Kazmin and Shindin 1997 UKR 1969 Odesskaya 16Prikumskaya 115 Anonymous 1994-2003 RUS 1999 Odesskaya 16, KooperatorkaPrima Odesskaya Anonymous 2001b UKR 2002 Fedorovka, Odesskaya 16Sirena Odesskaya Anonymous 2001b UKR 2002 Odesskaya 16, Odesskaya 51,
FrontanaStarshina Puchkov et al. 2001 RUS 2003 CheyenneVerna Puchkov et al. 2001 RUS 1998 Cheyenne, HopeViktoria Odesskaya* Anonymous 2001b UKR 1998 —Zastava Odesskaya* Anonymous 2001b UKR 2002 —Zimdar 4 Puchkov et al. 2001 RUS 1987 Canus, Kharkovskaya (?)Zlagoda Anonymous 1976-1995 UKR 1992 Odesskaya 16, Odesskaya 51,FrontanaZolotava Anonymous 1976-1995 UKR 1992 Odesskaya 16, Odesskaya 51,
Frontana

![DEZVOLTAREA RURAL~ {I REFORMA AGRICULTURII ROMÂNE{TI …beta.ier.ro/documente/working_papers/wp_10-11.pdf · PSE Estimarea Sprijinului Producatorului SAU Suprafa]` Agricol` Utilizat`](https://img.pdfslide.us/doc/110x75/5e0eb552e472aa5ce26814b9/dezvoltarea-rural-i-reforma-agriculturii-romneti-betaierrodocumenteworkingpaperswp10-11pdf.jpg)