Embed Size (px)
Citation preview
314
Item Response Theoryand Rasch Models
I tem response theory (IRT) is a second contemporary alternative to classical testtheory (CTT). Although the roots of IRT have a long history (e.g., Lord, 1953;Rasch, 1960), IRT has emerged relatively recently as an alternative way of con-
ceptualizing and analyzing measurement in the behavioral sciences. IRT is morecomputationally complex than CTT, but proponents of IRT suggest that this com-plexity is offset by several important advantages of IRT over CTT.
Basics of IRT
At its heart, IRT is a psychometric approach emphasizing the fact that an individ-ual’s response to a particular test item is influenced by qualities of the individualand by qualities of the item. IRT provides procedures for obtaining informationabout individuals, items, and tests. Advocates of IRT state that these proceduresproduce information that is superior to the information produced by CTT. Variousforms of IRT exist, representing different degrees of complexity or different applic-ability to various kinds of tests.
Imagine that Suzy takes a five-item test of mathematical ability. According to themost basic form of IRT, the likelihood that Suzy will respond correctly to Item 1 onthe test is affected by two things. If Suzy has high mathematical ability, then she willhave a relatively high likelihood of answering the item correctly. In addition, if Item1 is difficult, then Suzy will have a relatively low likelihood of answering the itemcorrectly. Therefore, the probability that she will respond correctly to Item 1 isaffected by her mathematical ability and by the difficulty of Item 1. This logic canbe extended to various kinds of psychological measures, but the basic form of IRTstates that an individual’s response to an item is affected by the individual’s traitlevel (e.g., Suzy’s mathematical ability) and the item’s difficulty level. More complex
CHAPTER 13
13-Furr-45314.qxd 8/30/2007 5:44 PM Page 314
Item Response Theory and Rasch Models——315
forms of IRT include additional factors (or parameters) affecting an individual’sresponses to items.
Respondent Trait Levelas a Determinant of Item Responses
One factor affecting an individual’s probability of responding in a particular wayto an item is the individual’s level on the psychological trait being assessed by theitem. An individual who has a high level of mathematical ability will be more likelyto respond correctly to a math item than will an individual who has a low level ofmathematical ability. Similarly, an individual who has a high level of extraversionwill be more likely to endorse or agree with an item that measures extraversion thanwill an individual who has a low level of extraversion. An employee who has a highlevel of job satisfaction will be more likely to endorse an item that measures job sat-isfaction than will an employee with a low level of job satisfaction.
Item Difficulty as a Determinant of Item Responses
An item’s level of difficulty is another factor affecting an individual’s probabil-ity of responding in a particular way. A math item that has a high level of diffi-culty will be less likely to be answered correctly than a math item that has a lowlevel of difficulty (i.e., an easy item). For example, the item “What is the squareroot of 10,000?” is less likely to be answered correctly than is the item “What is2 + 2?” Similarly, an extraversion item that has a high level of difficulty will be lesslikely to be endorsed than an extraversion item that has a low level of difficulty.At first, the notion of “difficulty” might not be intuitive in the case of personalitytrait such as extraversion, but consider these two hypothetical items—“I enjoyhaving conversations with friends” and “I enjoy speaking before large audiences.”Assuming that these two items are validly interpreted as measures of extraversion,the first item is, in a sense, easier to endorse than the second item. Put anotherway, it is likely that more people would agree with the statement about having aconversation with friends than with the statement about speaking in front ofa large audience. In the context of job satisfaction, the statement “My job is OK”is likely an easier item to agree with than is the statement “My job is the best thingin my life.”
Although they are separate issues in an IRT analysis, trait level and item difficultyare intrinsically connected. In fact, item difficulty is conceived in terms of trait level.Specifically, a difficult item requires a relatively high trait level in order to be answeredcorrectly, but an easy item requires only a low trait level to be answered correctly.Returning to the two mathematical items, students might need to have a ninth-grademathematical ability in order to have a good chance of answering correctly a squareroot question. In contrast, they might need only a second-grade mathematical abilityto have a good chance of answering correctly an addition question.
13-Furr-45314.qxd 8/30/2007 5:44 PM Page 315
The connection between trait level and difficulty might be particularly useful forunderstanding the concept of item difficulty in personality inventories or attitudesurveys. Recall the extraversion items mentioned earlier—“I enjoy having conversa-tions with friends” and “I enjoy speaking before large audiences.” We suggested thatthe first item is easier than the second. Put another way, the first item requires onlya low level of extraversion to be endorsed, but the second would seem to require amuch higher level of extraversion to be endorsed. That is, even people who are fairlyintroverted (i.e., people who have relatively low levels of extraversion) would belikely to agree with the statement that they enjoy having conversations with theirfriends. In contrast, a person would probably need to be very extraverted to agreewith the statement that he or she enjoys speaking in front of a large audience.
In an IRT analysis, trait levels and item difficulties are usually scored on a stan-dardized metric, so that their means are 0 and the standard deviations are 1.Therefore, an individual who has a trait level of 0 has an average level of that trait,and an individual who has a trait level of 1.5 has a trait level that is 1.5 standarddeviations above the mean. Similarly, an item with a difficulty level of 0 is an aver-age item, and an item with a difficulty level of 1.5 is a relatively difficult item.
In IRT, item difficulty is expressed in terms of trait level. Specifically, an item’sdifficulty is defined as the trait level required for participants to have a .50 proba-bility of answering the item correctly. If an item has a difficulty of 0, then an indi-vidual with an average trait level (i.e., an individual with a trait level of 0) will havea 50/50 chance of correctly answering the item. For an item with a difficulty of 0,an individual with a high trait level (i.e., a trait level greater than 0) will have ahigher chance of answering the item correctly, and an individual with a low traitlevel (i.e., a trait level less than 0) will have a lower chance of answering the itemcorrectly. Higher difficulty levels indicate that higher trait levels are required inorder for participants to have a 50/50 chance of answering the item correctly. Forexample, if an item has a difficulty of 1.5, then an individual with a trait level of 1.5(i.e., a trait level that is 1.5 standard deviations above the mean) will have a 50/50chance of answering the item correctly. Similarly, lower difficulty levels indicatethat only relatively low trait levels are required in order for participants to have a50/50 chance of answering the item correctly.
Item Discrimination as aDeterminant of Item Responses
Just as the items on a test might differ in terms of their difficulties (some itemsare more difficult than others), the items on a test might also differ in terms of thedegree to which they can differentiate individuals who have high trait levels fromindividuals who have low trait levels. This item characteristic is called item discrim-ination, and it is analogous to an item–total correlation from CTT (Embretson &Reise, 2000).
An item’s discrimination value indicates the relevance of the item to the traitbeing measured by the test. An item with a positive discrimination value is at least
316——ADVANCED PSYCHOMETRIC APPROACHES
13-Furr-45314.qxd 8/30/2007 5:44 PM Page 316
somewhat consistent with the underlying trait being measured, and a relatively largediscrimination value (e.g., 3.5 vs. .5) indicates a relatively strong consistency betweenthe item and the underlying trait. In contrast, an item with a discrimination value of0 is unrelated to the underlying trait supposedly being measured, and an item witha negative discrimination value is inversely related to the underlying trait (i.e., hightrait scores make it less likely that the item will be answered correctly). Thus, it is gen-erally desirable for items to have a large positive discrimination value.
Why would some items have good discrimination and others have poor discrim-ination? Consider the following two items that might be written for a mathematicstest:
1. “How many pecks are in three bushels?” (a) 12 (b) 24
2. “What is the square root of 10,000?” (a) 10 (b) 100
Think about the first item for a moment. What is required of a respondent inorder to answer this item correctly? To answer the item correctly, the student needsto have enough mathematical ability to perform multiplication. However, this itemalso requires additional knowledge of the number of pecks in a bushel. The fact thatthis item requires something aside from basic mathematical ability means that it isnot very closely related to mathematical ability. In other words, having a high levelof mathematical ability is not enough to answer the item correctly. The studentmight have the ability to multiply 4 times 3, but he or she might not have a verygood chance of answering the item correctly without the knowledge that there arefour pecks in a bushel. Thus, this item would likely have a low discrimination value,as it is only weakly related to the underlying trait being assessed by the test of math-ematical ability. In other words, this item does not do a very good job of discrimi-nating students who have a relatively high level of mathematical ability from thosewho have relatively low mathematical ability. Even if Suzy answers the item cor-rectly and Johnny answers the items incorrectly, we might not feel confident con-cluding that Suzy has a higher level of mathematical ability than does Johnny—perhapsJohnny has the mathematical ability, but he simply does not know the number ofpecks in a bushel.
Now consider the second math item. What is required of a respondent in orderto answer it correctly? This item requires the ability to solve for square roots, but itrequires no additional knowledge or ability. The only quality of the student that isrelevant to answering the item correctly is mathematical ability. Therefore, it isa much more “pure” mathematical item, and it is more strongly related to theunderlying trait of mathematical ability than is the first item. Consequently, itwould likely have a relatively high discrimination value. In other words, this itemdoes a better job of discriminating individuals who have a relatively high level ofmathematical ability from those who have relatively low mathematical ability. Thatis, if Suzy answers the item correctly and Johnny answers the items incorrectly, thenwe feel fairly confident concluding that Suzy has a higher level of mathematicalability than does Johnny.
Item Response Theory and Rasch Models——317
13-Furr-45314.qxd 8/30/2007 5:44 PM Page 317
IRT Measurement Models
From an IRT perspective, we can specify the components affecting the probabilitythat an individual will respond in a particular way to a particular item. A measure-ment model expresses the mathematical links between an outcome (e.g., a respon-dent’s score on a particular item) and the components that affect the outcome (e.g.,qualities of the respondent and/or qualities of the item).
A variety of models have been developed from the IRT perspective, and thesemodels differ from each other in at least two important ways. One important dif-ference among the measurement models is in terms of the item characteristics, orparameters, that are included in the models. A second important difference amongmeasurement models is in terms of the response option format.
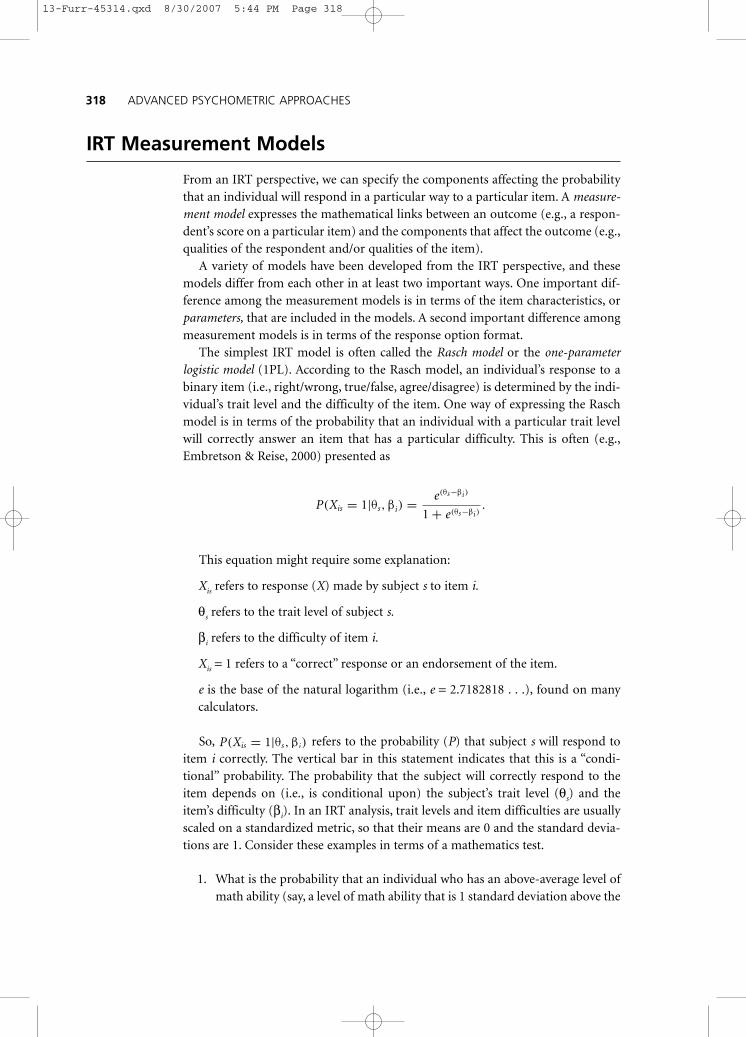
The simplest IRT model is often called the Rasch model or the one-parameterlogistic model (1PL). According to the Rasch model, an individual’s response to abinary item (i.e., right/wrong, true/false, agree/disagree) is determined by the indi-vidual’s trait level and the difficulty of the item. One way of expressing the Raschmodel is in terms of the probability that an individual with a particular trait levelwill correctly answer an item that has a particular difficulty. This is often (e.g.,Embretson & Reise, 2000) presented as
This equation might require some explanation:
Xis refers to response (X) made by subject s to item i.
θs refers to the trait level of subject s.
βi refers to the difficulty of item i.
Xis = 1 refers to a “correct” response or an endorsement of the item.
e is the base of the natural logarithm (i.e., e = 2.7182818 . . .), found on manycalculators.
So, refers to the probability (P) that subject s will respond toitem i correctly. The vertical bar in this statement indicates that this is a “condi-tional” probability. The probability that the subject will correctly respond to theitem depends on (i.e., is conditional upon) the subject’s trait level (θs) and theitem’s difficulty (βi). In an IRT analysis, trait levels and item difficulties are usuallyscaled on a standardized metric, so that their means are 0 and the standard devia-tions are 1. Consider these examples in terms of a mathematics test.
1. What is the probability that an individual who has an above-average level ofmath ability (say, a level of math ability that is 1 standard deviation above the
P(Xis = 1|θs, βi)
P(Xis = 1|θs, βi) = e(θs−βi )
1 + e(θs−βi ).
318——ADVANCED PSYCHOMETRIC APPROACHES
13-Furr-45314.qxd 8/30/2007 5:44 PM Page 318
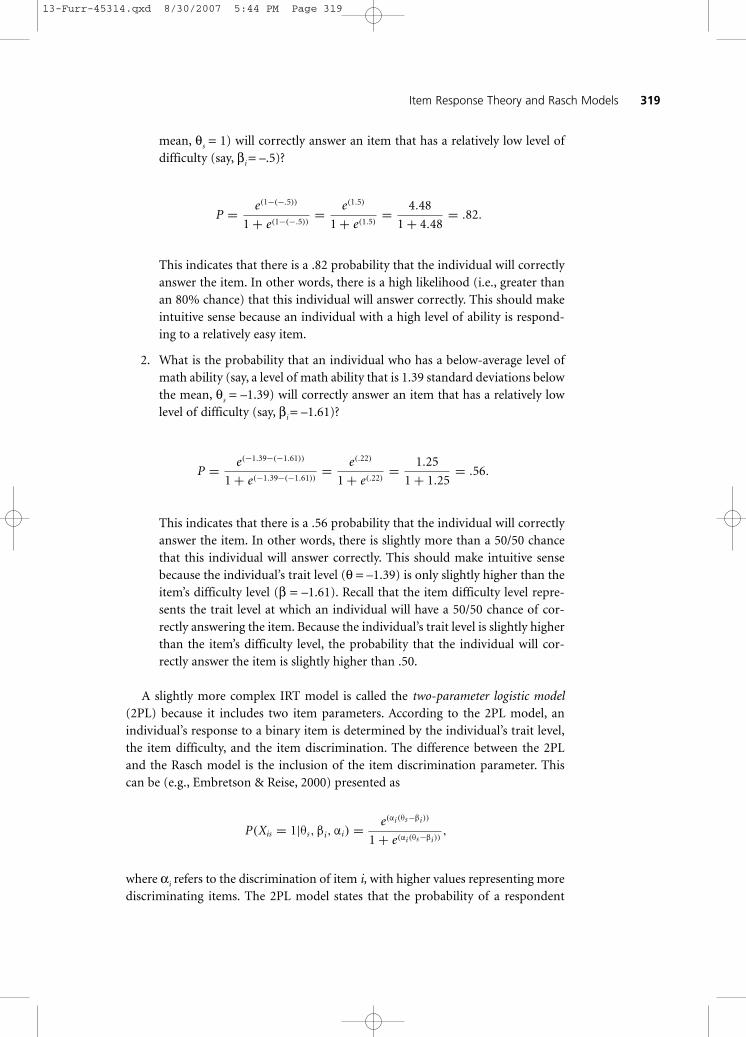
mean, θs = 1) will correctly answer an item that has a relatively low level ofdifficulty (say, βi = –.5)?
This indicates that there is a .82 probability that the individual will correctlyanswer the item. In other words, there is a high likelihood (i.e., greater thanan 80% chance) that this individual will answer correctly. This should makeintuitive sense because an individual with a high level of ability is respond-ing to a relatively easy item.
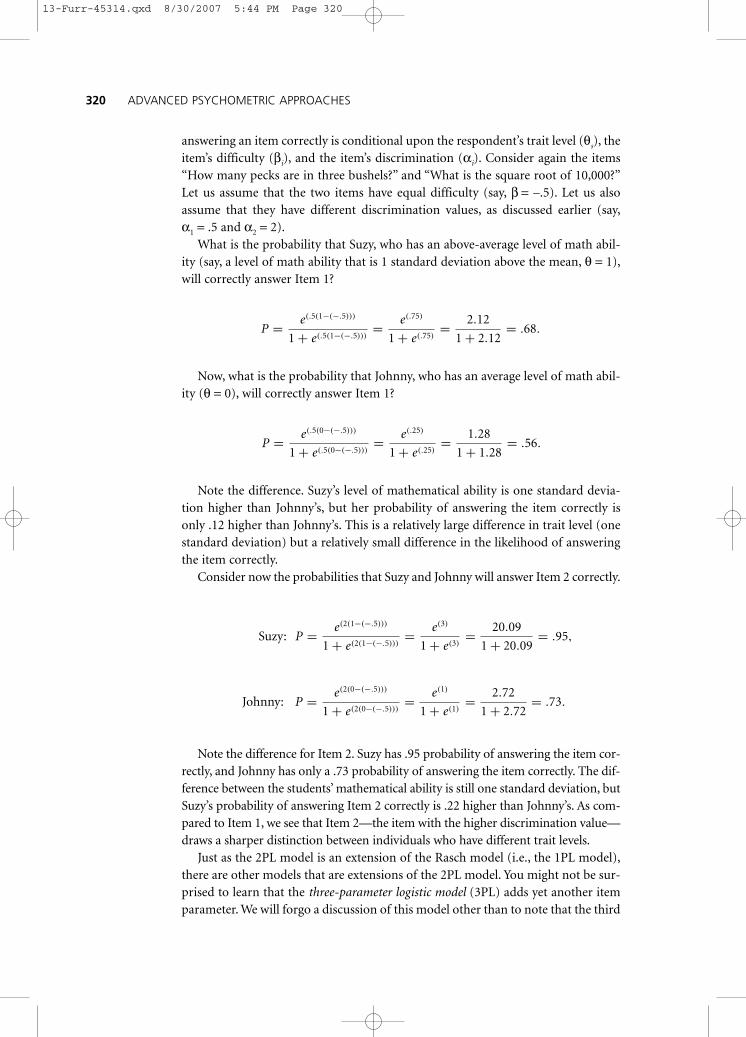
2. What is the probability that an individual who has a below-average level ofmath ability (say, a level of math ability that is 1.39 standard deviations belowthe mean, θs = –1.39) will correctly answer an item that has a relatively lowlevel of difficulty (say, βi = –1.61)?
This indicates that there is a .56 probability that the individual will correctlyanswer the item. In other words, there is slightly more than a 50/50 chancethat this individual will answer correctly. This should make intuitive sensebecause the individual’s trait level (θ = –1.39) is only slightly higher than theitem’s difficulty level (β = –1.61). Recall that the item difficulty level repre-sents the trait level at which an individual will have a 50/50 chance of cor-rectly answering the item. Because the individual’s trait level is slightly higherthan the item’s difficulty level, the probability that the individual will cor-rectly answer the item is slightly higher than .50.
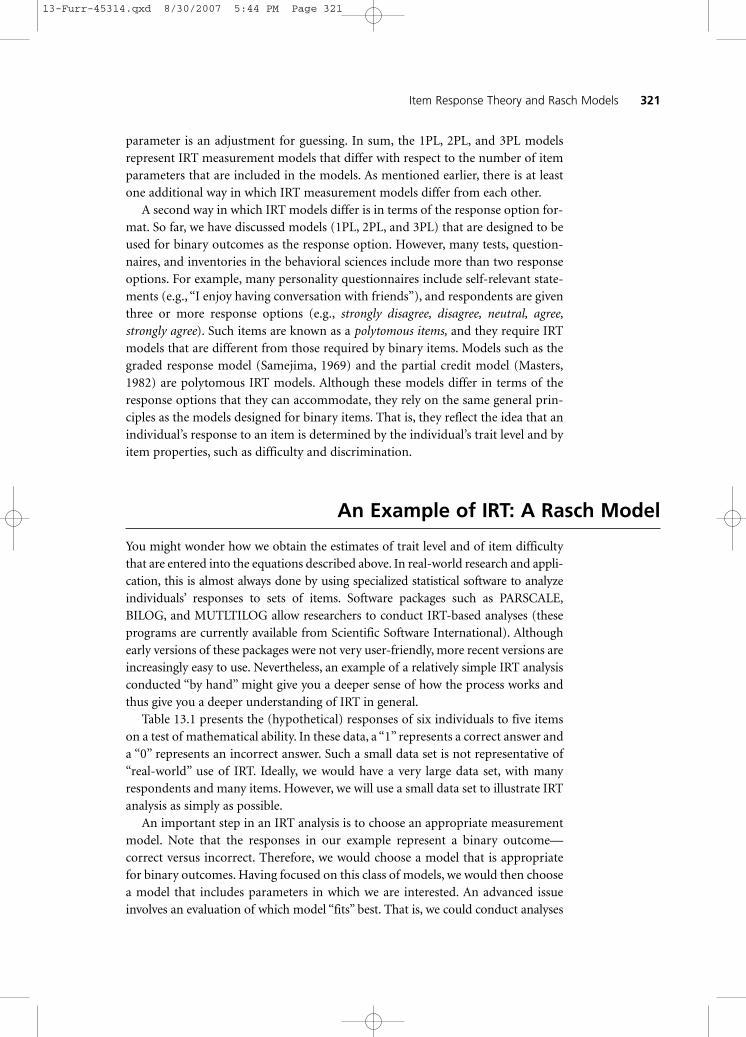
A slightly more complex IRT model is called the two-parameter logistic model(2PL) because it includes two item parameters. According to the 2PL model, anindividual’s response to a binary item is determined by the individual’s trait level,the item difficulty, and the item discrimination. The difference between the 2PLand the Rasch model is the inclusion of the item discrimination parameter. Thiscan be (e.g., Embretson & Reise, 2000) presented as
where αi refers to the discrimination of item i, with higher values representing morediscriminating items. The 2PL model states that the probability of a respondent
P(Xis = 1|θs, βi, αi) = e(αi (θs−βi ))
1 + e(αi (θs−βi )),
P = e(−1.39−(−1.61))
1 + e(−1.39−(−1.61))= e(.22)
1 + e(.22)= 1.25
1 + 1.25= .56.
P = e(1−(−.5))
1 + e(1−(−.5))= e(1.5)
1 + e(1.5)= 4.48
1 + 4.48= .82.
Item Response Theory and Rasch Models——319
13-Furr-45314.qxd 8/30/2007 5:44 PM Page 319
answering an item correctly is conditional upon the respondent’s trait level (θs), theitem’s difficulty (βi), and the item’s discrimination (αi). Consider again the items“How many pecks are in three bushels?” and “What is the square root of 10,000?”Let us assume that the two items have equal difficulty (say, β = –.5). Let us alsoassume that they have different discrimination values, as discussed earlier (say,α1 = .5 and α2 = 2).
What is the probability that Suzy, who has an above-average level of math abil-ity (say, a level of math ability that is 1 standard deviation above the mean, θ = 1),will correctly answer Item 1?
Now, what is the probability that Johnny, who has an average level of math abil-ity (θ = 0), will correctly answer Item 1?
Note the difference. Suzy’s level of mathematical ability is one standard devia-tion higher than Johnny’s, but her probability of answering the item correctly isonly .12 higher than Johnny’s. This is a relatively large difference in trait level (onestandard deviation) but a relatively small difference in the likelihood of answeringthe item correctly.
Consider now the probabilities that Suzy and Johnny will answer Item 2 correctly.
Note the difference for Item 2. Suzy has .95 probability of answering the item cor-rectly, and Johnny has only a .73 probability of answering the item correctly. The dif-ference between the students’ mathematical ability is still one standard deviation, butSuzy’s probability of answering Item 2 correctly is .22 higher than Johnny’s. As com-pared to Item 1, we see that Item 2—the item with the higher discrimination value—draws a sharper distinction between individuals who have different trait levels.
Just as the 2PL model is an extension of the Rasch model (i.e., the 1PL model),there are other models that are extensions of the 2PL model. You might not be sur-prised to learn that the three-parameter logistic model (3PL) adds yet another itemparameter. We will forgo a discussion of this model other than to note that the third
Johnny: P = e(2(0−(−.5)))
1 + e(2(0−(−.5)))= e(1)
1 + e(1)= 2.72
1 + 2.72= .73.
Suzy: P = e(2(1−(−.5)))
1 + e(2(1−(−.5)))= e(3)
1 + e(3)= 20.09
1 + 20.09= .95,
P = e(.5(0−(−.5)))
1 + e(.5(0−(−.5)))= e(.25)
1 + e(.25)= 1.28
1 + 1.28= .56.
P = e(.5(1−(−.5)))
1 + e(.5(1−(−.5)))= e(.75)
1 + e(.75)= 2.12
1 + 2.12= .68.
320——ADVANCED PSYCHOMETRIC APPROACHES
13-Furr-45314.qxd 8/30/2007 5:44 PM Page 320
parameter is an adjustment for guessing. In sum, the 1PL, 2PL, and 3PL modelsrepresent IRT measurement models that differ with respect to the number of itemparameters that are included in the models. As mentioned earlier, there is at leastone additional way in which IRT measurement models differ from each other.
A second way in which IRT models differ is in terms of the response option for-mat. So far, we have discussed models (1PL, 2PL, and 3PL) that are designed to beused for binary outcomes as the response option. However, many tests, question-naires, and inventories in the behavioral sciences include more than two responseoptions. For example, many personality questionnaires include self-relevant state-ments (e.g., “I enjoy having conversation with friends”), and respondents are giventhree or more response options (e.g., strongly disagree, disagree, neutral, agree,strongly agree). Such items are known as a polytomous items, and they require IRTmodels that are different from those required by binary items. Models such as thegraded response model (Samejima, 1969) and the partial credit model (Masters,1982) are polytomous IRT models. Although these models differ in terms of theresponse options that they can accommodate, they rely on the same general prin-ciples as the models designed for binary items. That is, they reflect the idea that anindividual’s response to an item is determined by the individual’s trait level and byitem properties, such as difficulty and discrimination.
An Example of IRT: A Rasch Model
You might wonder how we obtain the estimates of trait level and of item difficultythat are entered into the equations described above. In real-world research and appli-cation, this is almost always done by using specialized statistical software to analyzeindividuals’ responses to sets of items. Software packages such as PARSCALE,BILOG, and MUTLTILOG allow researchers to conduct IRT-based analyses (theseprograms are currently available from Scientific Software International). Althoughearly versions of these packages were not very user-friendly, more recent versions areincreasingly easy to use. Nevertheless, an example of a relatively simple IRT analysisconducted “by hand” might give you a deeper sense of how the process works andthus give you a deeper understanding of IRT in general.
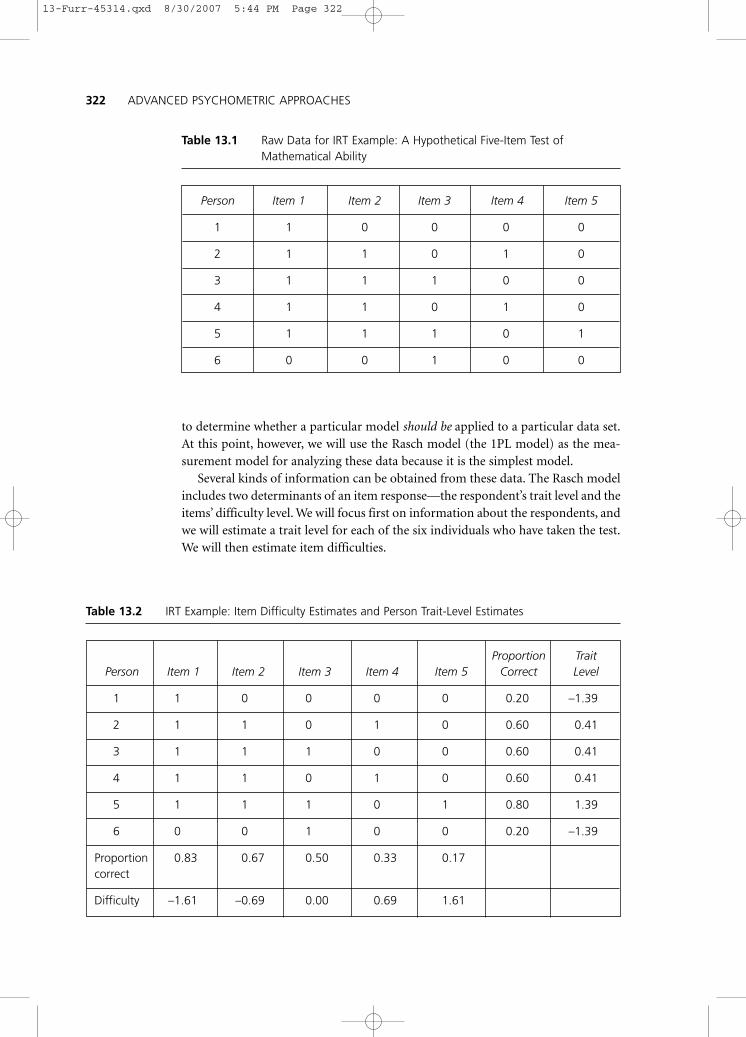
Table 13.1 presents the (hypothetical) responses of six individuals to five itemson a test of mathematical ability. In these data, a “1” represents a correct answer anda “0” represents an incorrect answer. Such a small data set is not representative of“real-world” use of IRT. Ideally, we would have a very large data set, with manyrespondents and many items. However, we will use a small data set to illustrate IRTanalysis as simply as possible.
An important step in an IRT analysis is to choose an appropriate measurementmodel. Note that the responses in our example represent a binary outcome—correct versus incorrect. Therefore, we would choose a model that is appropriatefor binary outcomes. Having focused on this class of models, we would then choosea model that includes parameters in which we are interested. An advanced issueinvolves an evaluation of which model “fits” best. That is, we could conduct analyses
Item Response Theory and Rasch Models——321
13-Furr-45314.qxd 8/30/2007 5:44 PM Page 321
322——ADVANCED PSYCHOMETRIC APPROACHES
to determine whether a particular model should be applied to a particular data set.At this point, however, we will use the Rasch model (the 1PL model) as the mea-surement model for analyzing these data because it is the simplest model.
Several kinds of information can be obtained from these data. The Rasch modelincludes two determinants of an item response—the respondent’s trait level and theitems’ difficulty level. We will focus first on information about the respondents, andwe will estimate a trait level for each of the six individuals who have taken the test.We will then estimate item difficulties.
Person Item 1 Item 2 Item 3 Item 4 Item 5
1 1 0 0 0 0
2 1 1 0 1 0
3 1 1 1 0 0
4 1 1 0 1 0
5 1 1 1 0 1
6 0 0 1 0 0
Table 13.1 Raw Data for IRT Example: A Hypothetical Five-Item Test ofMathematical Ability
Proportion TraitPerson Item 1 Item 2 Item 3 Item 4 Item 5 Correct Level
1 1 0 0 0 0 0.20 –1.39
2 1 1 0 1 0 0.60 0.41
3 1 1 1 0 0 0.60 0.41
4 1 1 0 1 0 0.60 0.41
5 1 1 1 0 1 0.80 1.39
6 0 0 1 0 0 0.20 –1.39
Proportion 0.83 0.67 0.50 0.33 0.17correct
Difficulty –1.61 –0.69 0.00 0.69 1.61
Table 13.2 IRT Example: Item Difficulty Estimates and Person Trait-Level Estimates
13-Furr-45314.qxd 8/30/2007 5:44 PM Page 322
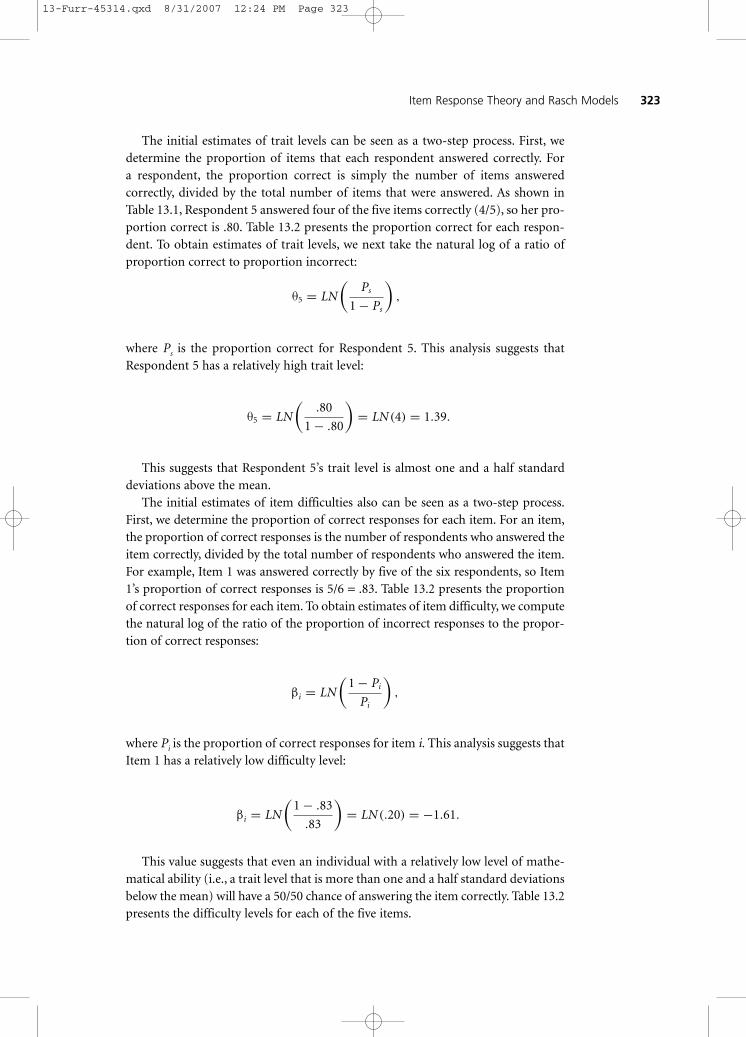
The initial estimates of trait levels can be seen as a two-step process. First, wedetermine the proportion of items that each respondent answered correctly. For a respondent, the proportion correct is simply the number of items answered correctly, divided by the total number of items that were answered. As shown inTable 13.1, Respondent 5 answered four of the five items correctly (4/5), so her pro-portion correct is .80. Table 13.2 presents the proportion correct for each respon-dent. To obtain estimates of trait levels, we next take the natural log of a ratio ofproportion correct to proportion incorrect:
where Ps is the proportion correct for Respondent 5. This analysis suggests thatRespondent 5 has a relatively high trait level:
This suggests that Respondent 5’s trait level is almost one and a half standarddeviations above the mean.
The initial estimates of item difficulties also can be seen as a two-step process.First, we determine the proportion of correct responses for each item. For an item,the proportion of correct responses is the number of respondents who answered theitem correctly, divided by the total number of respondents who answered the item.For example, Item 1 was answered correctly by five of the six respondents, so Item1’s proportion of correct responses is 5/6 = .83. Table 13.2 presents the proportionof correct responses for each item. To obtain estimates of item difficulty, we computethe natural log of the ratio of the proportion of incorrect responses to the propor-tion of correct responses:
where Pi is the proportion of correct responses for item i. This analysis suggests thatItem 1 has a relatively low difficulty level:
This value suggests that even an individual with a relatively low level of mathe-matical ability (i.e., a trait level that is more than one and a half standard deviationsbelow the mean) will have a 50/50 chance of answering the item correctly. Table 13.2presents the difficulty levels for each of the five items.
βi = LN
(1 − .83
.83
)= LN (.20) = −1.61.
βi = LN
(1 − Pi
Pi
),
θ5 = LN
(.80
1 − .80
)= LN (4) = 1.39.
θ5 = LN
(Ps
1 − Ps
),
Item Response Theory and Rasch Models——323
13-Furr-45314.qxd 8/31/2007 12:24 PM Page 323
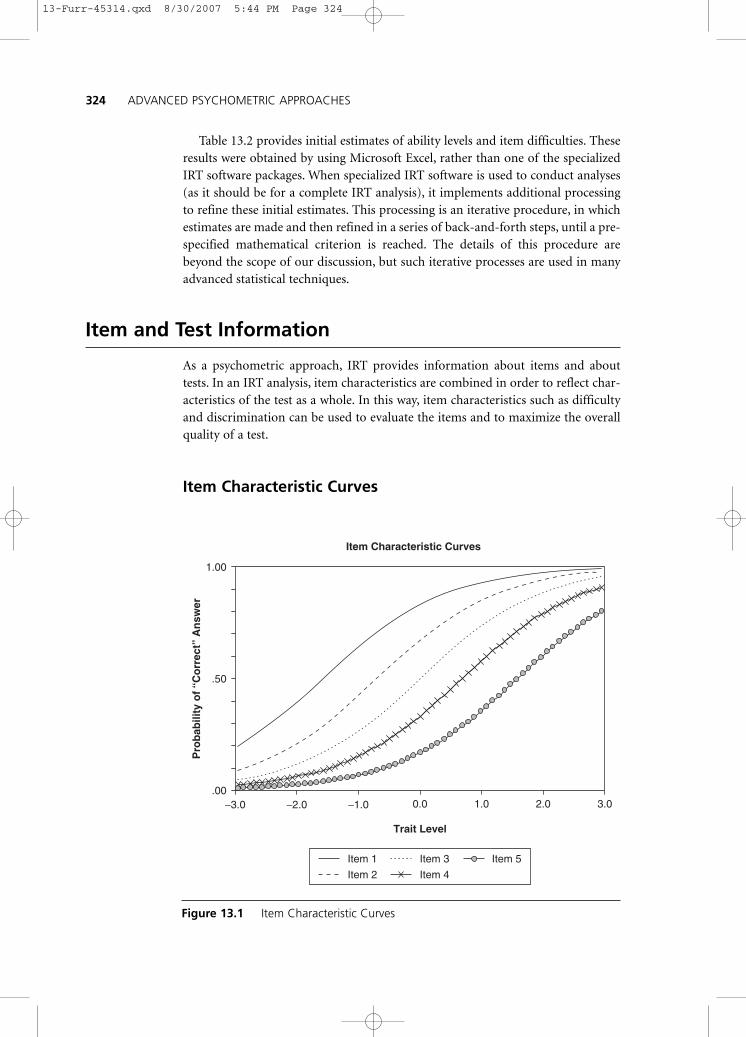
Table 13.2 provides initial estimates of ability levels and item difficulties. Theseresults were obtained by using Microsoft Excel, rather than one of the specializedIRT software packages. When specialized IRT software is used to conduct analyses(as it should be for a complete IRT analysis), it implements additional processingto refine these initial estimates. This processing is an iterative procedure, in whichestimates are made and then refined in a series of back-and-forth steps, until a pre-specified mathematical criterion is reached. The details of this procedure arebeyond the scope of our discussion, but such iterative processes are used in manyadvanced statistical techniques.
Item and Test Information
As a psychometric approach, IRT provides information about items and abouttests. In an IRT analysis, item characteristics are combined in order to reflect char-acteristics of the test as a whole. In this way, item characteristics such as difficultyand discrimination can be used to evaluate the items and to maximize the overallquality of a test.
Item Characteristic Curves
324——ADVANCED PSYCHOMETRIC APPROACHES
Item Characteristic Curves
.00
.50
1.00
−3.0 −2.0 −1.0 0.0 1.0 2.0 3.0
Trait Level
Pro
bab
ility
of
“Co
rrec
t” A
nsw
er
Item 1
Item 2
Item 3
Item 4
Item 5
Figure 13.1 Item Characteristic Curves
13-Furr-45314.qxd 8/30/2007 5:44 PM Page 324
Psychometricians who use IRT often examine item characteristic curves to pre-sent and evaluate characteristics of the items on a test. Item characteristic curves,such as those presented in Figure 13.1, reflect the probabilities with which individ-uals across a range of trait levels are likely to answer each item correctly. The itemcharacteristic curves in Figure 13.1 are based on the five items from the hypotheti-cal mathematics test analyzed earlier. For item characteristic curves, the X-axisreflects a wide range of trait levels, and the Y-axis reflects probabilities ranging from0 to 1.0. Each item has a curve, and we can examine an item’s curve to find the like-lihood that an individual with a particular trait level will answer the item correctly.Take a moment to study the curve for Item 1—what is the probability that an indi-vidual with an average level of mathematical ability will answer the item correctly?We find the point on the Item 1 curve that is directly above the “0” point on theX-axis (recall that the trait level is in z score units, so zero is the average trait level),and we see that this point lies between .80 and .90 on the Y-axis. Looking at theother curves, we see that an individual with an average level of mathematical abil-ity has about a .65 probability of answering Item 2 correctly, a .50 chance of answer-ing Item 3 correctly, and a .17 probability of answering Item 5 correctly. Thus, theitem characteristic curves provide clues about the likelihoods with which individu-als of any trait level would answer any of the five items correctly. Note that the orderof the curves, from left to right on the X-axis, reflects their difficulty levels. Item 1,with the left-most curve, is the easiest item, and Item 5, with the right-most curve,is the most difficult item.
The item characteristic curves are drawn based on the mathematical modelspresented above (in our case, the equation for the Rasch model). To draw an itemcharacteristic curve for an item, we can repeatedly use the model to compute theprobabilities of correct responses for many trait levels. By entering an item’s diffi-culty and a particular trait level (say, –3.0) into the model, we obtain the probabil-ity with which an individual with that particular trait level will answer that itemcorrectly. We can then enter a different trait level into the model (say, –2.9) andobtain the probability with which an individual with the different trait level willanswer the item correctly. After conducting this procedure for many different traitlevels, we simply plot the probabilities that we have obtained. The line connectingthese probabilities reflects the item’s characteristic curve. We conduct this proce-dure for each of the items on the test. To obtain Figure 13.1, we used the spread-sheet software package Microsoft Excel to compute 305 probabilities for the fiveitems (61 probabilities for each item) and to plot the points onto curves.
Test Information
From the perspective of CTT, reliability was an important psychometric consid-eration for a test. Recall that, from the perspective of CTT, we were able to obtainan estimate of the reliability of the test. For example, we might compute coefficientalpha as an estimate of the test’s reliability. An important point to note is that wewould compute only one reliability estimate for a test, and that estimate wouldindicate the degree to which observed test scores are correlated with true scores.
Item Response Theory and Rasch Models——325
13-Furr-45314.qxd 8/30/2007 5:44 PM Page 325
326——ADVANCED PSYCHOMETRIC APPROACHES
The idea that there is a single reliability for a particular test is an important way inwhich CTT differs from IRT.
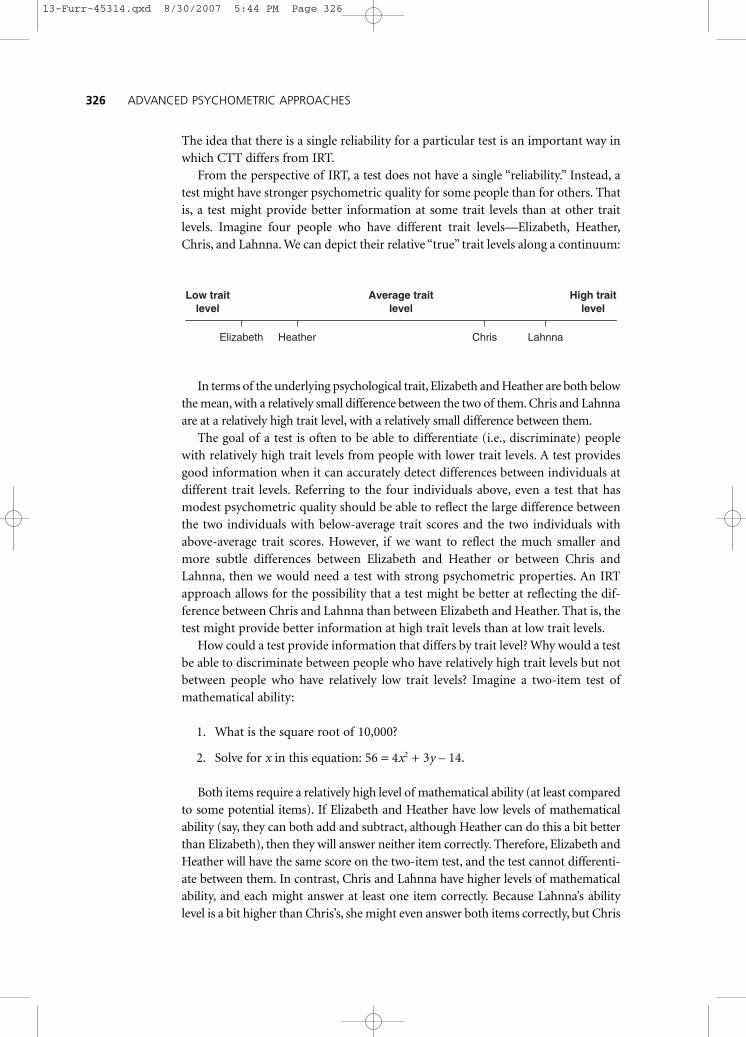
From the perspective of IRT, a test does not have a single “reliability.” Instead, atest might have stronger psychometric quality for some people than for others. Thatis, a test might provide better information at some trait levels than at other traitlevels. Imagine four people who have different trait levels—Elizabeth, Heather,Chris, and Lahnna. We can depict their relative “true” trait levels along a continuum:
Elizabeth Heather Chris Lahnna
Low traitlevel
Average traitlevel
High traitlevel
In terms of the underlying psychological trait, Elizabeth and Heather are both belowthe mean, with a relatively small difference between the two of them. Chris and Lahnnaare at a relatively high trait level, with a relatively small difference between them.
The goal of a test is often to be able to differentiate (i.e., discriminate) peoplewith relatively high trait levels from people with lower trait levels. A test providesgood information when it can accurately detect differences between individuals atdifferent trait levels. Referring to the four individuals above, even a test that hasmodest psychometric quality should be able to reflect the large difference betweenthe two individuals with below-average trait scores and the two individuals withabove-average trait scores. However, if we want to reflect the much smaller andmore subtle differences between Elizabeth and Heather or between Chris andLahnna, then we would need a test with strong psychometric properties. An IRTapproach allows for the possibility that a test might be better at reflecting the dif-ference between Chris and Lahnna than between Elizabeth and Heather. That is, thetest might provide better information at high trait levels than at low trait levels.
How could a test provide information that differs by trait level? Why would a testbe able to discriminate between people who have relatively high trait levels but notbetween people who have relatively low trait levels? Imagine a two-item test ofmathematical ability:
1. What is the square root of 10,000?
2. Solve for x in this equation: 56 = 4x2 + 3y – 14.
Both items require a relatively high level of mathematical ability (at least comparedto some potential items). If Elizabeth and Heather have low levels of mathematicalability (say, they can both add and subtract, although Heather can do this a bit betterthan Elizabeth), then they will answer neither item correctly. Therefore, Elizabeth andHeather will have the same score on the two-item test, and the test cannot differenti-ate between them. In contrast, Chris and Lahnna have higher levels of mathematicalability, and each might answer at least one item correctly. Because Lahnna’s abilitylevel is a bit higher than Chris’s, she might even answer both items correctly, but Chris
13-Furr-45314.qxd 8/30/2007 5:44 PM Page 326
might answer only one item correctly. Thus, Chris and Lahnna might have differentscores. So, the test might differentiate Chris from Lahnna, and the test might differen-tiate Chris and Lahnna from Elizabeth and Heather, but the test does not differenti-ate Elizabeth from Heather. In sum, if a test’s items have characteristics (e.g., itemdifficulty levels) that are more strongly represented at some trait levels than at others,then the test’s psychometric quality might differ by trait levels. The two-item mathe-matics test has only items that have high difficulty levels, and thus it does not provideclear information discriminating among people at low trait levels.
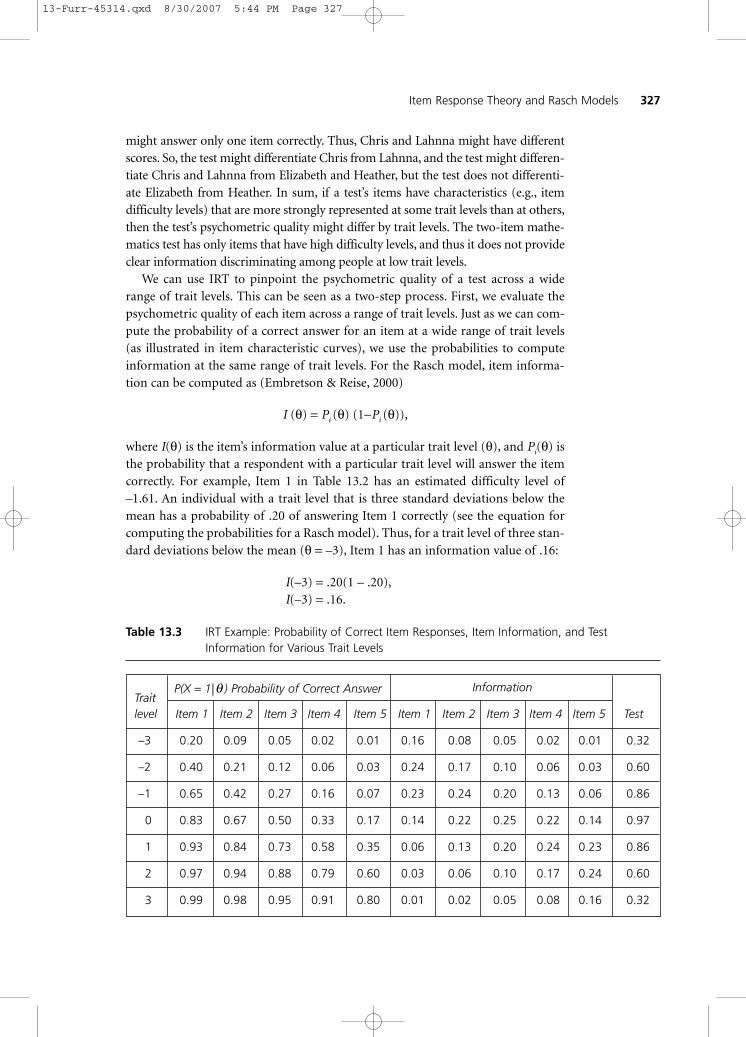
We can use IRT to pinpoint the psychometric quality of a test across a widerange of trait levels. This can be seen as a two-step process. First, we evaluate thepsychometric quality of each item across a range of trait levels. Just as we can com-pute the probability of a correct answer for an item at a wide range of trait levels(as illustrated in item characteristic curves), we use the probabilities to computeinformation at the same range of trait levels. For the Rasch model, item informa-tion can be computed as (Embretson & Reise, 2000)
I (θ) = Pi (θ) (1−Pi (θ)),
where I(θ) is the item’s information value at a particular trait level (θ), and Pi(θ) isthe probability that a respondent with a particular trait level will answer the itemcorrectly. For example, Item 1 in Table 13.2 has an estimated difficulty level of–1.61. An individual with a trait level that is three standard deviations below themean has a probability of .20 of answering Item 1 correctly (see the equation forcomputing the probabilities for a Rasch model). Thus, for a trait level of three stan-dard deviations below the mean (θ = –3), Item 1 has an information value of .16:
I(–3) = .20(1 – .20),I(–3) = .16.
Item Response Theory and Rasch Models——327
TraitP(X = 1|θ ) Probability of Correct Answer Information
level Item 1 Item 2 Item 3 Item 4 Item 5 Item 1 Item 2 Item 3 Item 4 Item 5 Test
–3 0.20 0.09 0.05 0.02 0.01 0.16 0.08 0.05 0.02 0.01 0.32
–2 0.40 0.21 0.12 0.06 0.03 0.24 0.17 0.10 0.06 0.03 0.60
–1 0.65 0.42 0.27 0.16 0.07 0.23 0.24 0.20 0.13 0.06 0.86
0 0.83 0.67 0.50 0.33 0.17 0.14 0.22 0.25 0.22 0.14 0.97
1 0.93 0.84 0.73 0.58 0.35 0.06 0.13 0.20 0.24 0.23 0.86
2 0.97 0.94 0.88 0.79 0.60 0.03 0.06 0.10 0.17 0.24 0.60
3 0.99 0.98 0.95 0.91 0.80 0.01 0.02 0.05 0.08 0.16 0.32
Table 13.3 IRT Example: Probability of Correct Item Responses, Item Information, and TestInformation for Various Trait Levels
13-Furr-45314.qxd 8/30/2007 5:44 PM Page 327
In contrast, Item 1 has an information value of .01 at a trait level of three stan-dard deviations above the mean (θ = 3).
Higher information values indicate greater psychometric quality. Therefore,Item 1 has higher psychometric quality at relatively low trait levels than at relativelyhigh trait levels. That is, it is more capable of discriminating among people with lowtrait levels than among high trait levels (presumably because most people with hightrait levels will answer the item correctly). Table 13.3 includes probability valuesand information values that have been computed for each item at seven trait levels.If we compute information values at many more trait levels, we could display theresults in a graph called an item information curve.
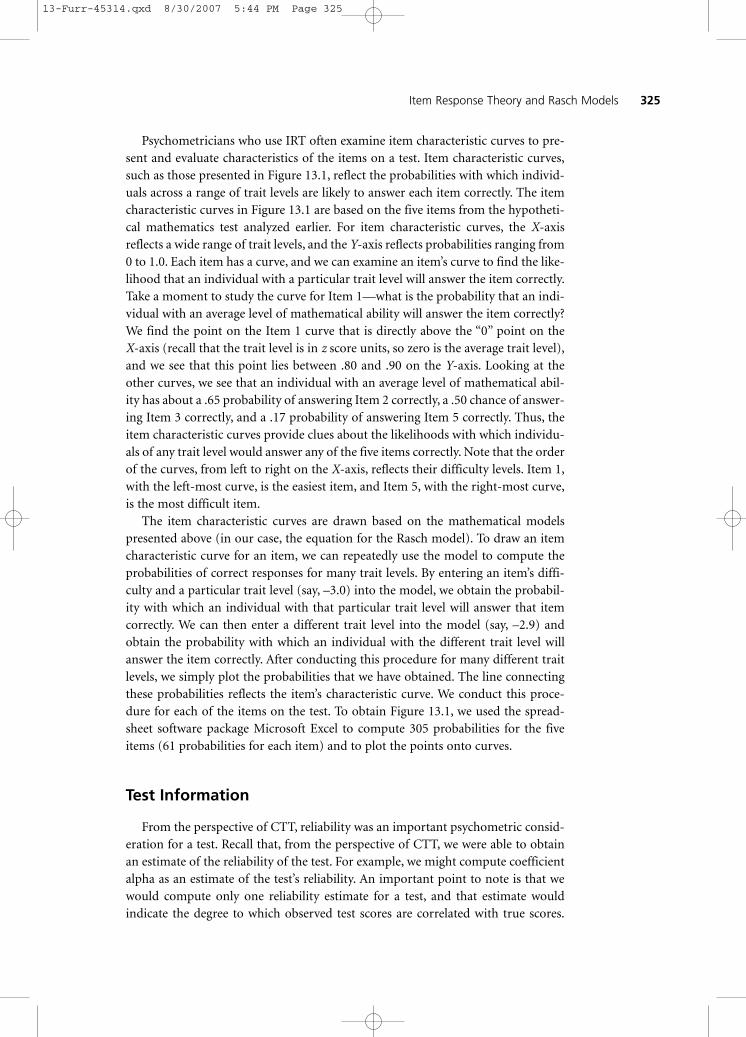
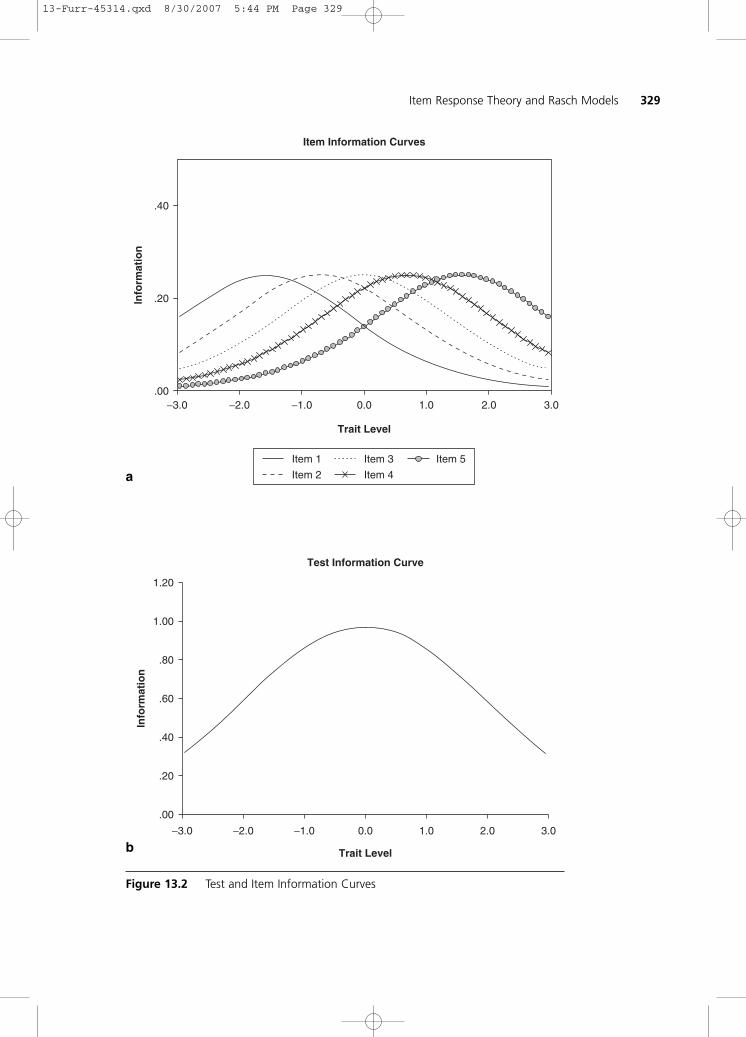
Figure 13.2 presents item information curves for each item in our hypotheticalfive-item test of mathematics. Note that the height of the curve indicates theamount of information that the item provides. The highest point on a curve repre-sents the trait level at which the item provides the most information. In fact, anitem provides the most information at a trait level that corresponds with its diffi-culty level, estimated earlier. For example, Item 1 (the easiest item) provides the bestinformation at a trait level of –1.61, which is its difficulty level. In contrast, Item 1does not provide much information at trait levels that are above average. Also notethat the items differ in the points at which they provide good information. Item 1provides good information at relatively low trait levels, Item 3 provides good infor-mation at average trait levels, and Item 5 provides good information at relativelyhigh trait levels.
Of course, when we actually use a psychological test, we are concerned with thequality of the test as a whole more than the qualities of individual items. Therefore,we can combine item information values to obtain test information values.Specifically, item information values at a particular trait level can be added togetherto obtain a test information value at that trait level. Table 13.3 provides test infor-mation values for our five-item hypothetical test of mathematical ability at seventrait levels. For example, the test information score at an average trait level (θ = 0)is simply the sum of the item information values at this trait level.
.97 = .14 + .22 + .25 + .22 + .14.
Again, if we compute test information scores at many trait levels, we can plot theresults in a test information curve, as shown in Figure 13.2.
A test information curve is useful for illustrating the degree to which a test pro-vides different quality of information at different trait levels. Note that our hypo-thetical test provides the greatest information at an average trait level, and itprovides less information at more extreme trait levels. That is, our test does well atdifferentiating among people who have trait levels within one or two standard devi-ations of the mean. In contrast, it is relatively poor at differentiating among peoplewho have trait levels that are more than two standard deviations below the mean,and it is relatively poor at differentiating among people who have trait levels thatare more than two standard deviations above the mean.
328——ADVANCED PSYCHOMETRIC APPROACHES
13-Furr-45314.qxd 8/30/2007 5:44 PM Page 328
Item Response Theory and Rasch Models——329
Item Information Curves
.00
.20
.40
−3.0 −2.0 −1.0 0.0 1.0 2.0 3.0
Trait Level
Info
rmat
ion
Item 1
Item 2
Item 3
Item 4
Item 5
Test Information Curve
.00
.20
.40
.60
.80
1.00
1.20
−3.0 −2.0 −1.0 0.0 1.0 2.0 3.0
Trait Level
Info
rmat
ion
Figure 13.2 Test and Item Information Curves
a
b
13-Furr-45314.qxd 8/30/2007 5:44 PM Page 329
Take a moment to consider again the difference between IRT and CTT, withregard to test reliability. From a CTT perspective, a test has one reliability that canbe estimated using an index such as coefficient alpha. From an IRT perspective,a test’s psychometric quality can vary across trait levels. This is an important butperhaps underappreciated difference between the two approaches to test theory.
Applications of IRT
IRT is a theoretical perspective with tools that have many applications for measure-ment in a variety of psychological domains. The discussion of item difficulty anddiscrimination is perhaps most intuitively applied to the measurement of abilities.Indeed, Educational Testing Service has used IRT as the basis of the ScholasticAptitude Test for several years. In addition, several states use IRT as the basis oftheir achievement testing in public school systems. Beyond its application to abil-ity testing, IRT has been applied to domains such as the measurement of attitudes(e.g., Strong, Breen, & Lejuez, 2004) and personality traits (Chernyshenko, Stark,Chan, Drasgow, & Williams, 2001; Fraley, Waller, & Brennan, 2000).
Test Development and Improvement
A fundamental application of IRT is the evaluation and improvement of basicpsychometric properties of items and tests. Using information about item proper-ties, test developers can select items that reflect an appropriate range of trait levelsand that have a strong degree of discriminative ability. Guided by IRT analyses,these selections can create a test with strong psychometric properties across a rangeof trait levels.
For example, Fraley et al. (2000) used IRT to examine the psychometric proper-ties of four inventories (with a total of 12 subscales) associated with adult attach-ment. By computing and plotting test information curves for each subscale, Fraleyand his colleagues revealed that one inventory in particular, the Experiences inClose Relationships scales (ECR; K. A. Brennan, Clark, & Shaver, 1998), provides ahigher level of information than the other inventories. Even further, Fraley and hiscolleagues used IRT to guide and evaluate modifications to the ECR scales. Thesemodifications produced revised ECR scales with better overall test informationquality than the original ECR scales. Notably, this increase in test information wasobtained without increasing the number of items.
Differential Item Functioning
Earlier in this book, we discussed test bias. From an IRT perspective, analysescan be conducted to evaluate the presence and nature of differential item function-ing (DIF). Differential item functioning occurs when an item’s properties in onegroup are different from the item’s properties in another group. For example, DIF
330——ADVANCED PSYCHOMETRIC APPROACHES
13-Furr-45314.qxd 8/30/2007 5:44 PM Page 330
exists when a particular item has one difficulty level for males and a different diffi-culty level for females. Put another way, the presence of differential item function-ing means that a male and a female who have the same trait level have differentprobabilities of answering the item correctly. The existence of DIF between groupsindicates that the groups cannot be meaningfully compared on the item.
For example, L. L. Smith and Reise (1998) used IRT to examine the presenceand nature of DIF for males and females on the Stress Reaction scale of the Multi-dimensional Personality Questionnaire (MPQ; Tellegen, 1982). The Stress Reactionscale assesses the tendency to experience negative emotions such as guilt and anxiety,and previous research had shown that males and females often have different meanson such scales. Smith and Reise argued that this difference could reflect a true genderdifference in such traits or that it could be produced by differential item functioningon such scales. Their analysis indicated that, although females do appear to havehigher trait levels of stress reaction, DIF does exist for several items. Furthermore,their analyses revealed interesting psychological meaning for the items that did showDIF. Smith and Reise state that items related to “emotional vulnerability and sensitiv-ity in situations that involve self-evaluation” were easier for females to endorse, butitems related to “the general experience of nervous tensions, unexplainable moodi-ness, irritation, frustration, and being on-edge” (p. 1359) were easier for males toendorse. Smith and Reise conclude that inventories designed to measure negativeemotionality will show a large gender difference when “female DIF-type items” areoverrepresented and that such inventories will show a small gender difference when“male DIF-type items” are overrepresented. Such insights can inform the develop-ment and interpretation of important psychological measures.
Person Fit
Another interesting application of IRT is a phenomenon called person fit (Meijer& Sijtsma, 2001). When we administer a psychological test, we might find an indi-vidual whose pattern of responses seems strange compared to typical responses.Consider two items that might be found on a measure of friendliness:
1. I like my friends.
2. I am willing to lend my friends as much money as they might ever want.
Most people would probably agree with the first statement (i.e., it is an “easy”item). In contrast, fewer people might agree with the second statement. Althoughmost of us like our friends and would be willing to help them, not all of us wouldbe willing to lend our friends “as much money as they might ever want.” Certainly,those of us who would lend any amount of money to our friends also would be verylikely to state that we like our friends (i.e., endorse the first item). That is, it wouldnot be very strange to find someone who is willing to lend any amount of moneyto her friends if she also likes her friends, but it would be quite odd to find some-one who would be willing to lend any amount of money to her friends if she does
Item Response Theory and Rasch Models——331
13-Furr-45314.qxd 8/30/2007 5:44 PM Page 331
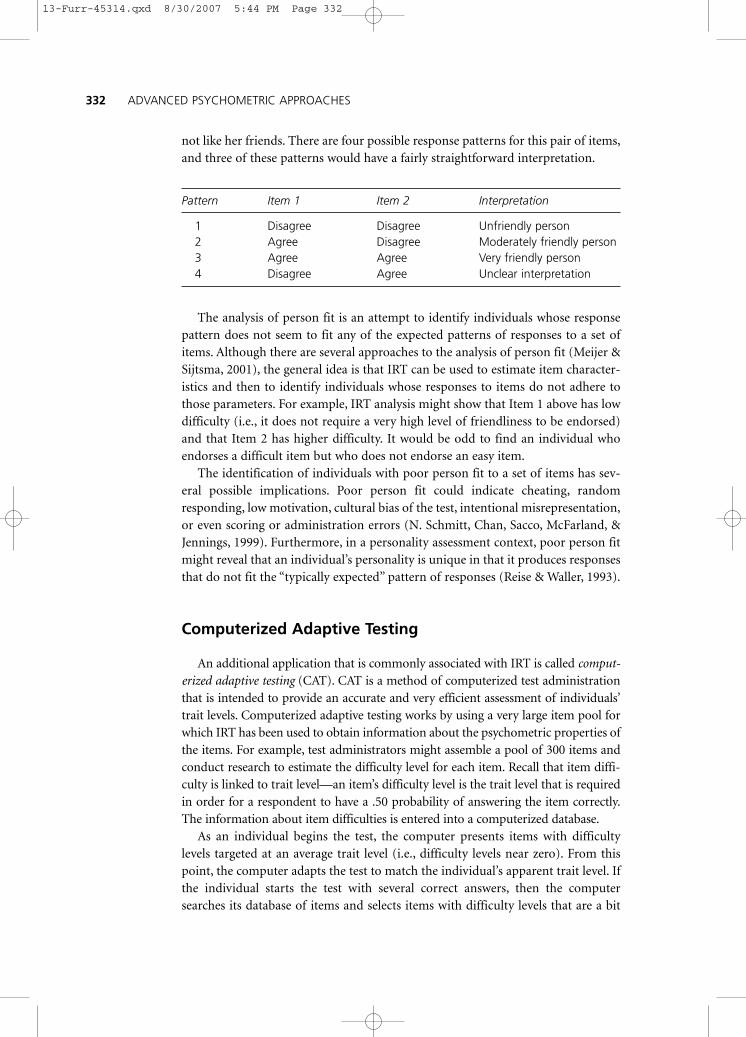
not like her friends. There are four possible response patterns for this pair of items,and three of these patterns would have a fairly straightforward interpretation.
Pattern Item 1 Item 2 Interpretation
1 Disagree Disagree Unfriendly person2 Agree Disagree Moderately friendly person3 Agree Agree Very friendly person4 Disagree Agree Unclear interpretation
The analysis of person fit is an attempt to identify individuals whose responsepattern does not seem to fit any of the expected patterns of responses to a set ofitems. Although there are several approaches to the analysis of person fit (Meijer &Sijtsma, 2001), the general idea is that IRT can be used to estimate item character-istics and then to identify individuals whose responses to items do not adhere tothose parameters. For example, IRT analysis might show that Item 1 above has lowdifficulty (i.e., it does not require a very high level of friendliness to be endorsed)and that Item 2 has higher difficulty. It would be odd to find an individual whoendorses a difficult item but who does not endorse an easy item.
The identification of individuals with poor person fit to a set of items has sev-eral possible implications. Poor person fit could indicate cheating, randomresponding, low motivation, cultural bias of the test, intentional misrepresentation,or even scoring or administration errors (N. Schmitt, Chan, Sacco, McFarland, &Jennings, 1999). Furthermore, in a personality assessment context, poor person fitmight reveal that an individual’s personality is unique in that it produces responsesthat do not fit the “typically expected” pattern of responses (Reise & Waller, 1993).
Computerized Adaptive Testing
An additional application that is commonly associated with IRT is called comput-erized adaptive testing (CAT). CAT is a method of computerized test administrationthat is intended to provide an accurate and very efficient assessment of individuals’trait levels. Computerized adaptive testing works by using a very large item pool forwhich IRT has been used to obtain information about the psychometric properties ofthe items. For example, test administrators might assemble a pool of 300 items andconduct research to estimate the difficulty level for each item. Recall that item diffi-culty is linked to trait level—an item’s difficulty level is the trait level that is requiredin order for a respondent to have a .50 probability of answering the item correctly.The information about item difficulties is entered into a computerized database.
As an individual begins the test, the computer presents items with difficultylevels targeted at an average trait level (i.e., difficulty levels near zero). From thispoint, the computer adapts the test to match the individual’s apparent trait level. Ifthe individual starts the test with several correct answers, then the computersearches its database of items and selects items with difficulty levels that are a bit
332——ADVANCED PSYCHOMETRIC APPROACHES
13-Furr-45314.qxd 8/30/2007 5:44 PM Page 332
above average. These relatively difficult items are then presented to the individual.In contrast, if the individual starts the test with several incorrect answers, then thecomputer searches its database of items and selects items with difficulty levels thatare a bit below average. These relatively easy items are then presented to the indi-vidual. Note that the two individuals might respond to two tests that are almostcompletely different.
As the individual continues the test, the computer continues to select items thatpinpoint the individual’s trait level. The computer tracks the individual’s responsesto specific items with known difficulty levels. By tracking this information, thecomputer continually reestimates the individual’s trait level as the individual answerssome items correctly and others incorrectly. The computer ends the test when it has presented enough items to provide a solid final estimation of the individual’strait level.
Interestingly, the accuracy and efficiency of computerized adaptive tests areobtained by giving different tests to different individuals. This might at first seemcounterintuitive, but consider the purpose of adaptive testing. The purpose ofadaptive testing is to present items that target each individual’s trait level efficiently.That is, it presents only the items that really help to estimate precisely each exami-nee’s trait level. If an individual clearly has a high level of ability, then it is unnec-essary to require the individual to respond to very easy questions. Similarly, if anindividual clearly has a lower level of ability, then we learn nothing by requiring theindividual to respond to difficult items. Therefore, instead of presenting a common300-item test to every individual, a CAT program presents each individual withonly as many items as are required to pinpoint his or her trait level—probablymuch less than 300 items. Ideally, this method of test administration is more effi-cient and less aversive for respondents.
Computerized adaptive testing has been used mainly in ability, knowledge, and/orachievement testing. For example, the National Council of State Boards of Nursing(NCSBN) maintains licensure standards for nurses across the United States. For this,licensure requires a testing process that uses a pool of nearly 2,000 items with knowndifficulty levels, and it uses a CAT administration process to present items and scorerespondents. The Web site for the NCSBN assures candidates for licensure that “CATprovides greater measurement efficiency as it administers only those items which willoffer the best measurement of the candidate’s ability” (NCSBN, 2006). Similarly, theGraduate Record Examination (GRE) is, as of this writing, primarily administeredthrough computerized adaptive testing. The Web site for the GRE informs readersthat the computerized versions of the tests “are tailored to your performance leveland provide precise information about your abilities using fewer test questions thantraditional paper-based tests” (Educational Testing Service, 2006).
Summary
In sum, IRT is an approach to psychometrics that is said to have several advantagesover traditional CTT. IRT encompasses a variety of statistical models that represent
Item Response Theory and Rasch Models——333
13-Furr-45314.qxd 8/30/2007 5:44 PM Page 333
the links between item responses, examinee trait level, and an array of item charac-teristics. Knowledge of item characteristics, such as item difficulty and item dis-crimination, can inform the development, interpretation, and improvement ofpsychological tests.
Although IRT-based analyses are computationally complex, specialized softwarehas been designed to conduct the analyses, and this software is becoming more andmore user-friendly. Continued research and application will reveal the nature anddegree of practical advantage that IRT has over CTT.
An accessible introduction to a variety of issues in IRT, oriented toward psychologists:
Embretson, S. E., & Reise, S. (2000). Item response theory for psychologists. Mahwah, NJ:
Lawrence Erlbaum.
This is a classic source in the history of IRT:
Lord, F. M. (1953). The relation of test score to the trait underlying the test. Educational
and Psychological Measurement, 13, 517–548.
This is an accessible discussion of the issues and challenges of using IRT in person-ality assessment:
Reise, S. P., & Henson, J. M. (2003). A discussion of modern versus traditional psychomet-
rics as applied to personality assessment scales. Journal of Personality Assessment, 81,
93–103.
This reference provides a thorough and in-depth description of many issues involv-ing the Rasch model (1PL):
Bond, T. G., & Fox, C. M. (2001). Applying the Rasch model: Fundamental measurement in
the human sciences. Mahwah, NJ: Lawrence Erlbaum.
This is a nice example of the application of IRT to psychological data:
Fraley, R. C., Waller, N. G., & Brennan, K. A. (2000). An item-response theory analysis of
self-report measures of adult attachment. Journal of Personality and Social
Psychology, 78, 350–365.
This is a nice conceptual introduction to IRT:
Hambleton, R. K., Swaminathan, H., & Rogers, H. J. (1991). Fundamentals of item
response theory. Newbury Park, CA: Sage.
334——ADVANCED PSYCHOMETRIC APPROACHES
Suggested Readings
13-Furr-45314.qxd 8/30/2007 5:44 PM Page 334