Embed Size (px)
Citation preview

Richard C. Gershon, PhDDepartment of Medical Social Sciences
Feinberg School of MedicineNorthwestern University
Item Response Theory and Computerized Adaptive Testing
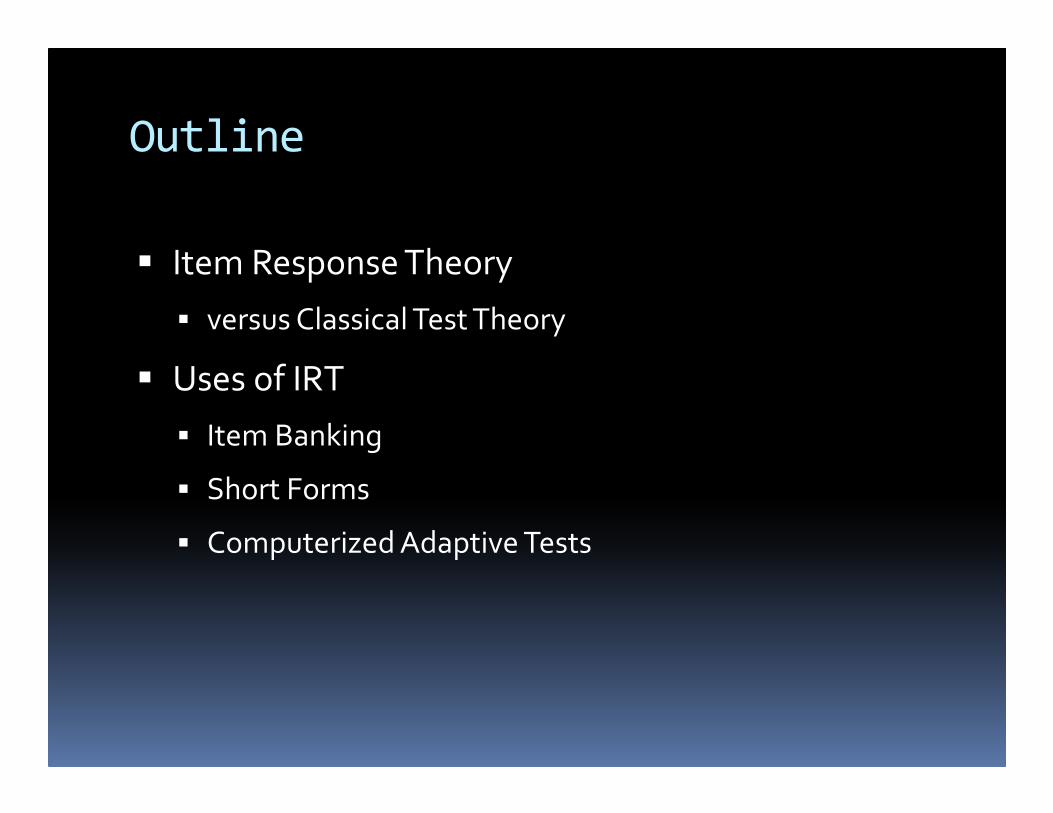
Outline
� Item Response Theory
� versus Classical Test Theory
� Uses of IRT
� Item Banking
� Short Forms
� Computerized Adaptive Tests
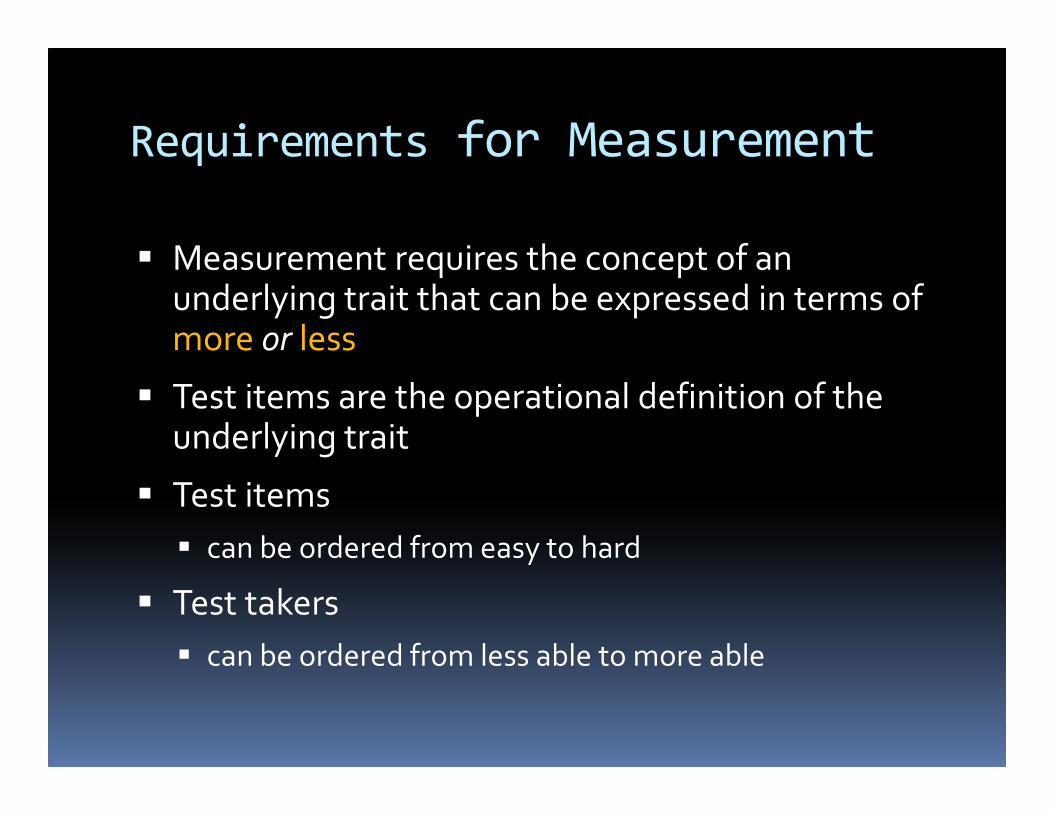
Requirements for Measurement
� Measurement requires the concept of an underlying trait that can be expressed in terms of more or less
� Test items are the operational definition of the underlying trait
� Test items
� can be ordered from easy to hard
� Test takers
� can be ordered from less able to more able
IRT Modeling is Latent Trait
Modeling
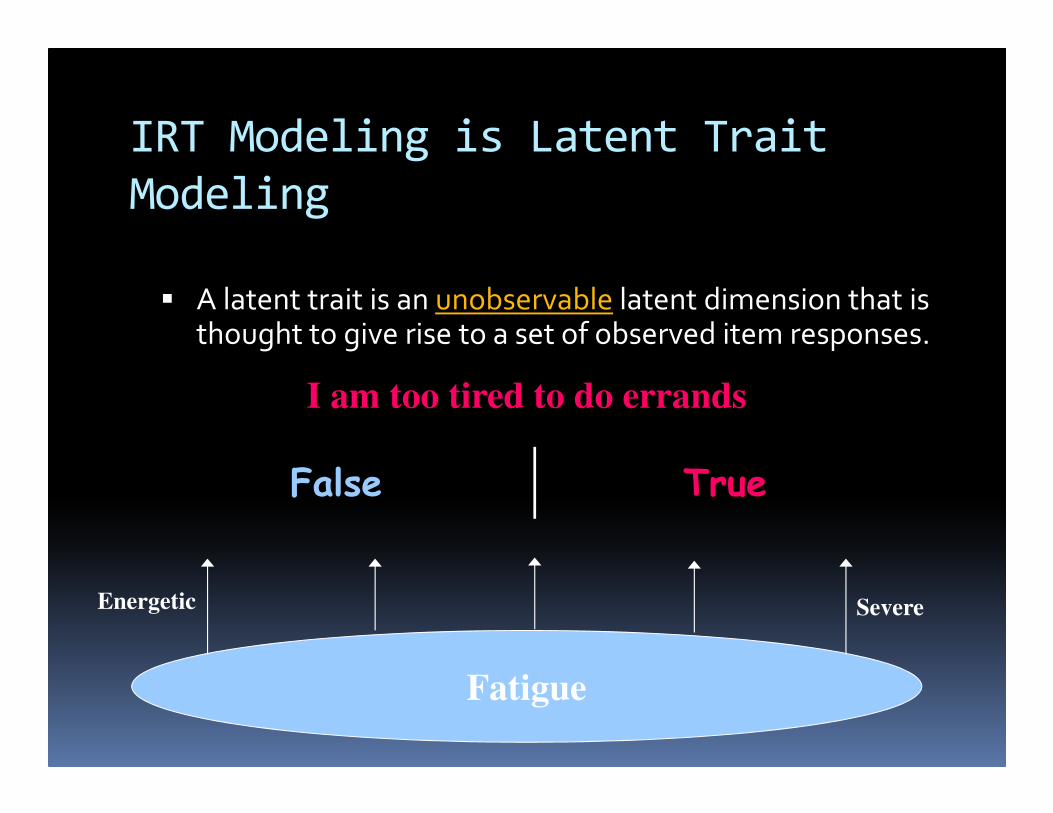
� A latent trait is an unobservable latent dimension that is thought to give rise to a set of observed item responses.
I am too tired to do errands
False True
Fatigue
Energetic Severe
Latent Traits (cont.)
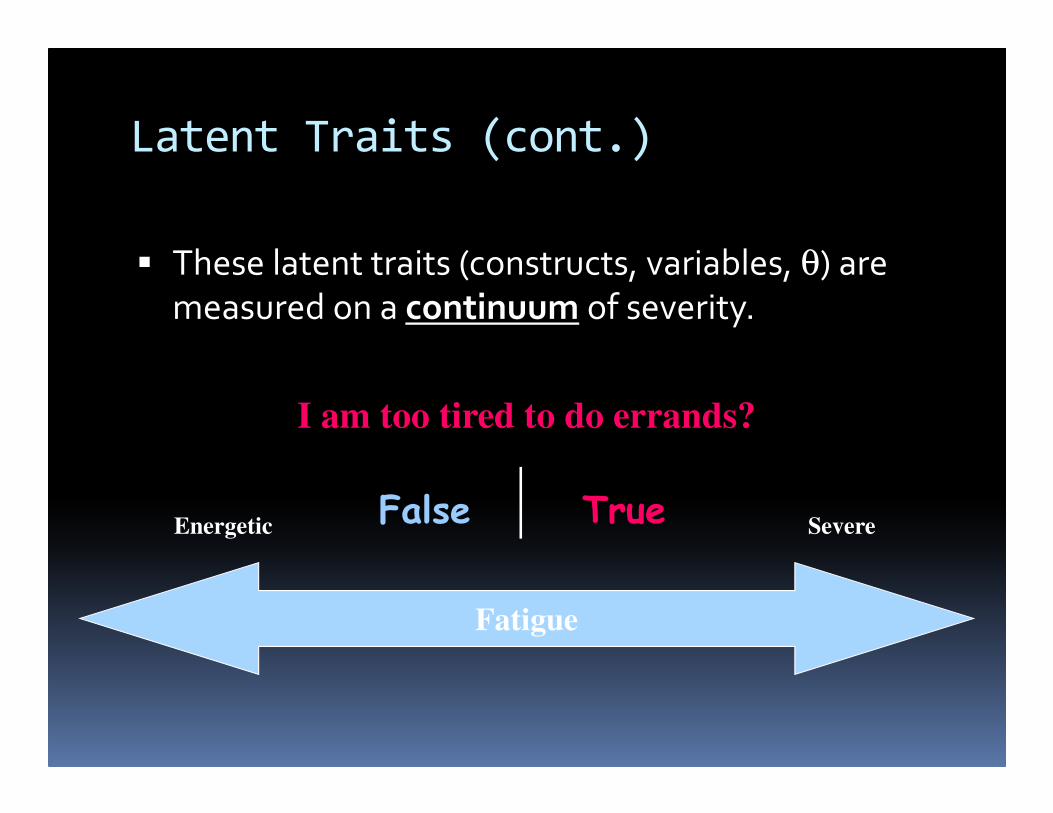
� These latent traits (constructs, variables, θ) are measured on a continuum of severity.
I am too tired to do errands?
Fatigue
Energetic SevereFalse True
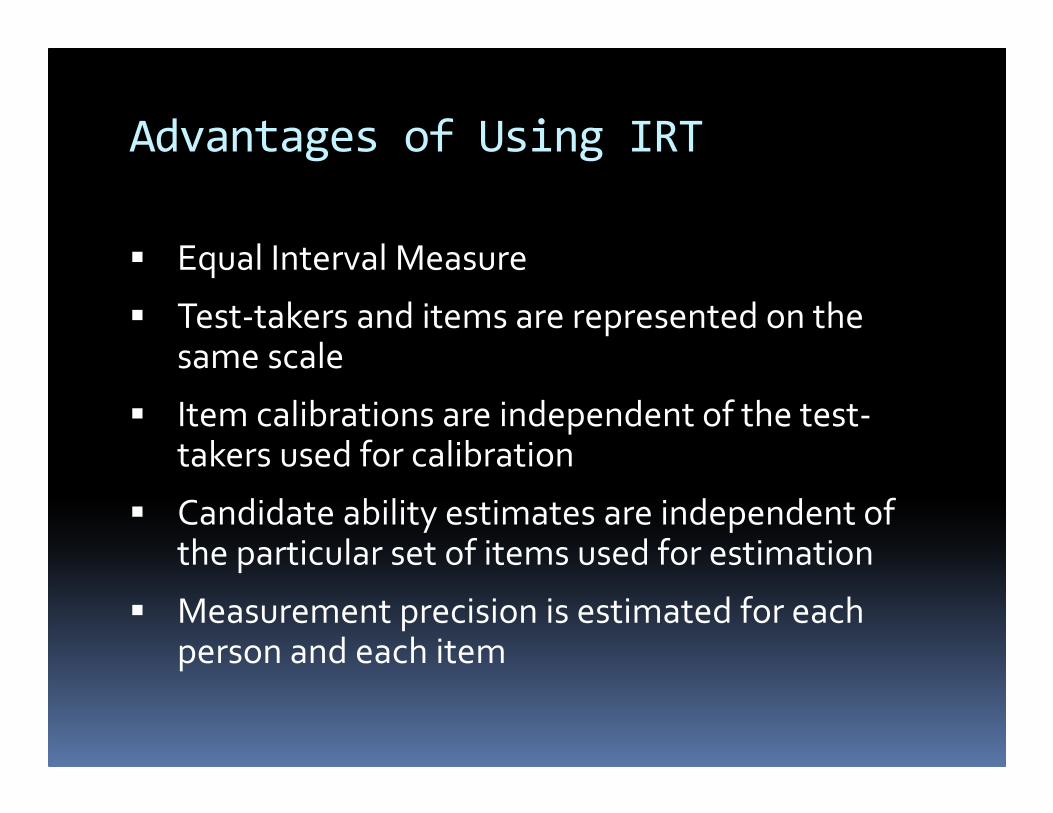
Advantages of Using IRT
� Equal Interval Measure
� Test-takers and items are represented on the same scale
� Item calibrations are independent of the test-takers used for calibration
� Candidate ability estimates are independent of the particular set of items used for estimation
� Measurement precision is estimated for each person and each item
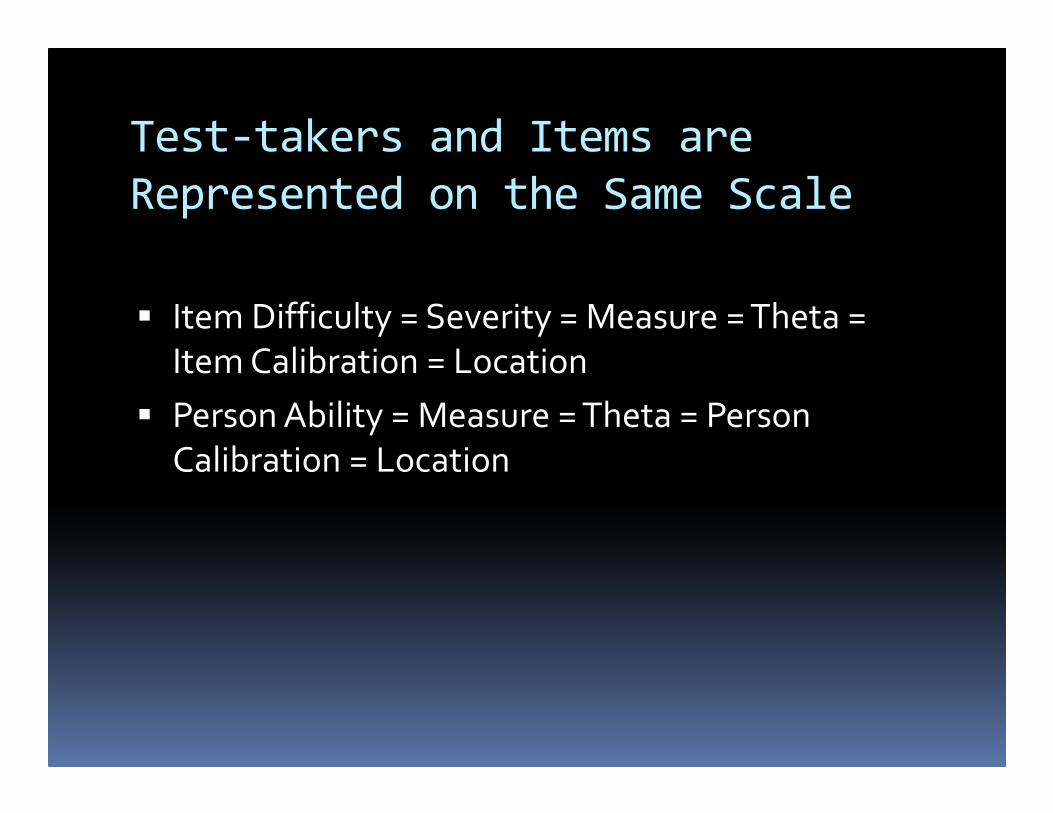
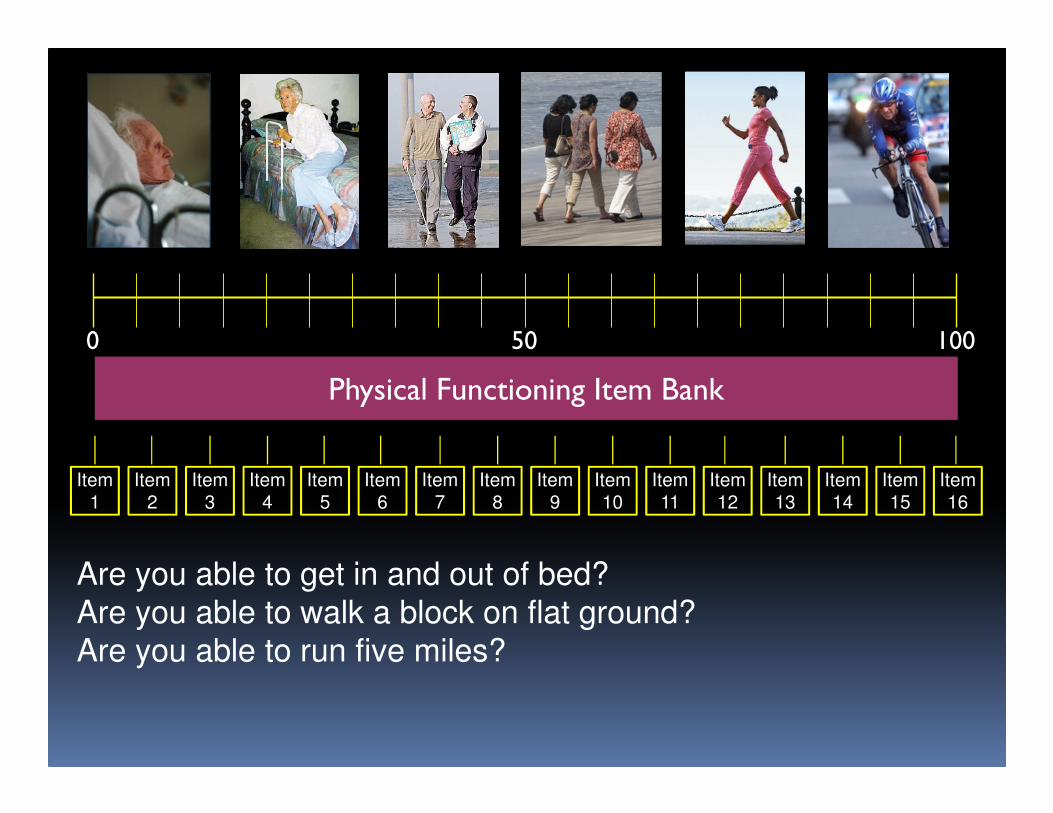
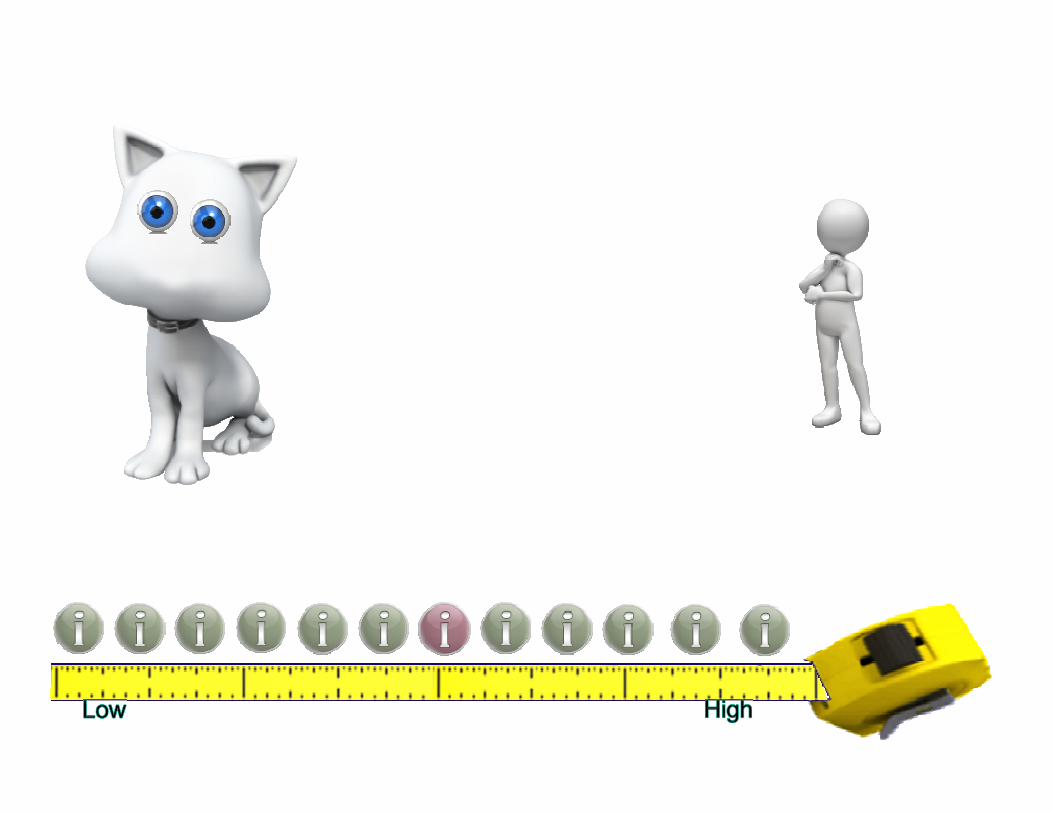
Test-takers and Items are
Represented on the Same Scale
� Item Difficulty = Severity = Measure = Theta =
Item Calibration = Location
� Person Ability = Measure = Theta = Person
Calibration = Location
Item1
Item2
Item11
Item10
Item9
Item8
Item7
Item6
Item5
Item4
Item3
Item16
Item15
Item14
Item13
Item12
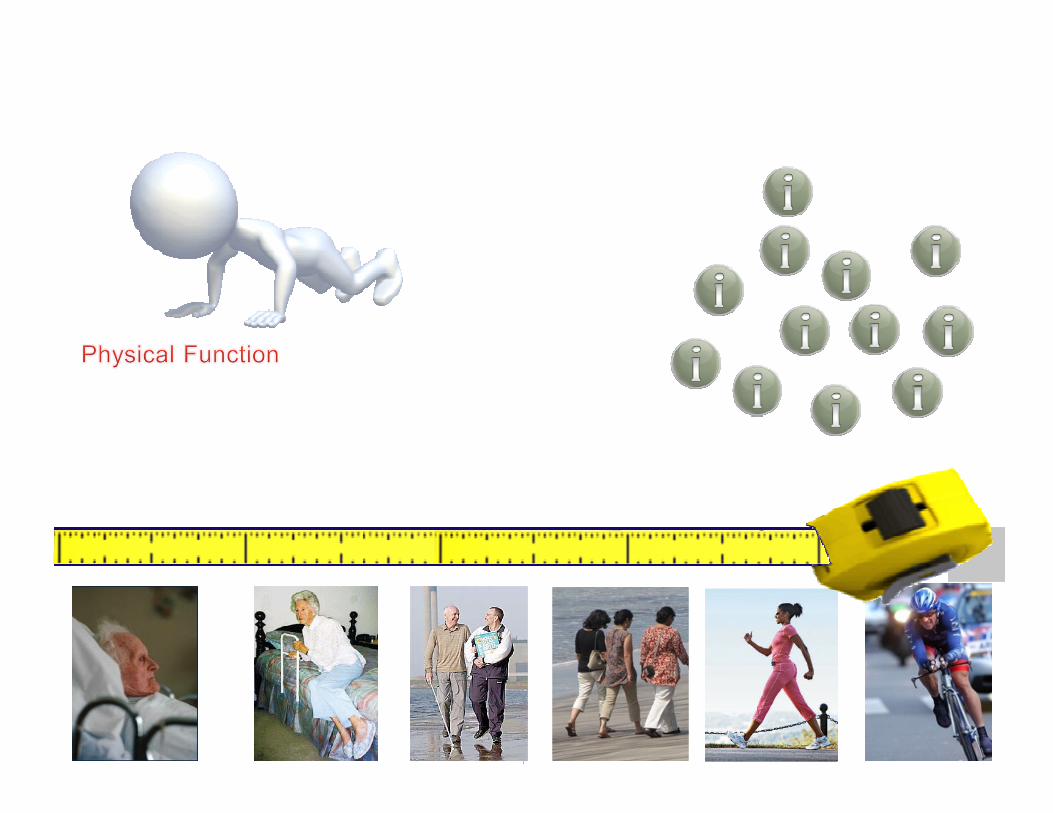
Physical Functioning Item Bank
Are you able to get in and out of bed?
Are you able to walk a block on flat ground?
Are you able to run five miles?
100500
More Basic Terms
� Discrimination = the degree to which an item discriminates person ability
� Item Information = the area where an item discriminates
� Test Information = the area where the test discriminates
Item “Parameters”
� IRT statistics about an item
� Primary: Item Difficulty
� Often: Item Discrimination
� Sometimes: Guessing
� Lots of other “ugly looking numbers”
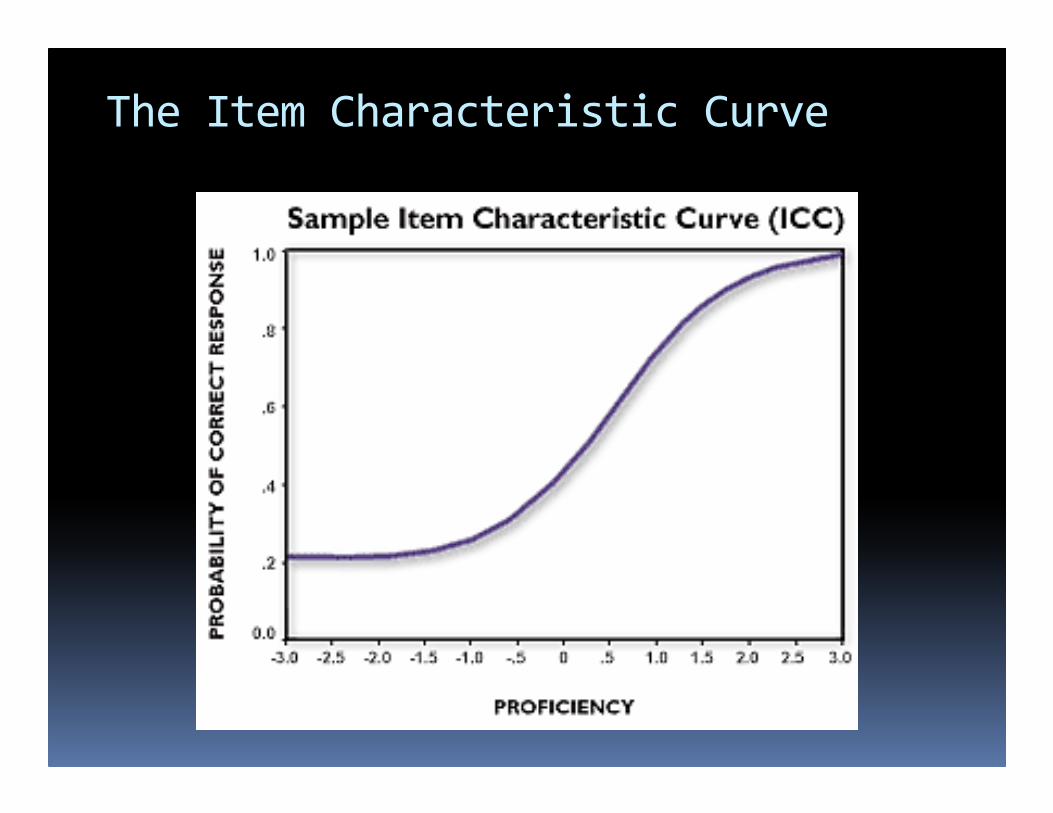
The Item Characteristic Curve
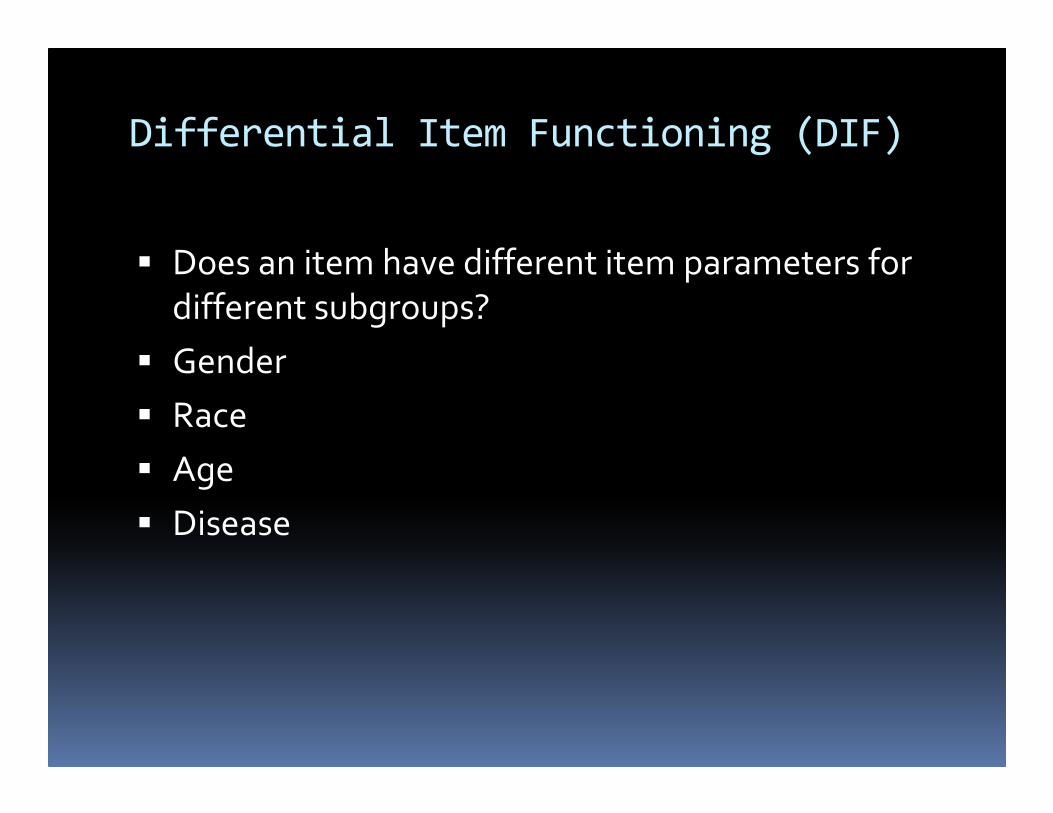
Differential Item Functioning (DIF)
� Does an item have different item parameters for
different subgroups?
� Gender
� Race
� Age
� Disease
The Three Main IRT Models
� Rasch model one parameter logistic model
(1PL)
� Two parameter logistic model (2PL)
� Three parameter logistic model (3PL)
How to choose an appropriate IRT Model
OR
My religion is better than your religion!
WARNING!
You are about to see mathematical formulas!
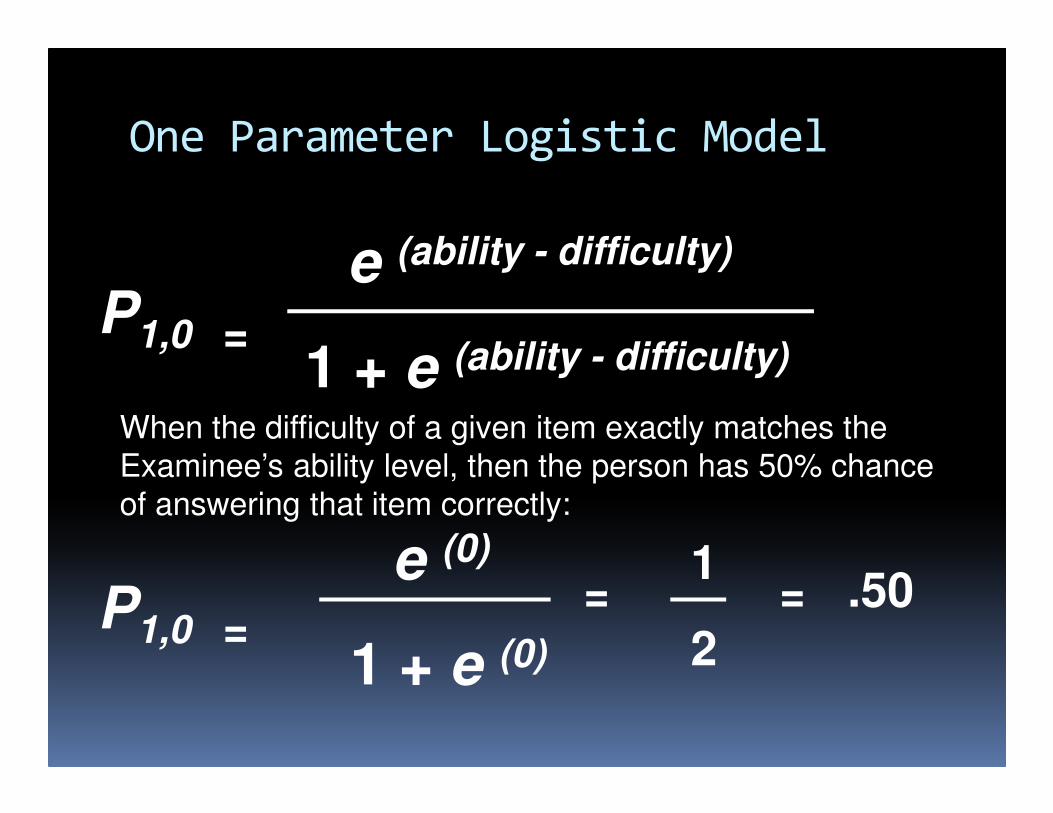
P1,0 =
e (0)
1 + e (0)
=1
2= .50
e (ability - difficulty)
1 + e (ability - difficulty)P1,0 =
When the difficulty of a given item exactly matches the
Examinee’s ability level, then the person has 50% chance
of answering that item correctly:
One Parameter Logistic Model
One Parameter Logistic Model
� Only option for small sample sizes
� Often the real model underlying a test labeled as
three parameter
� Less costly
� “The simple solution is always the best”
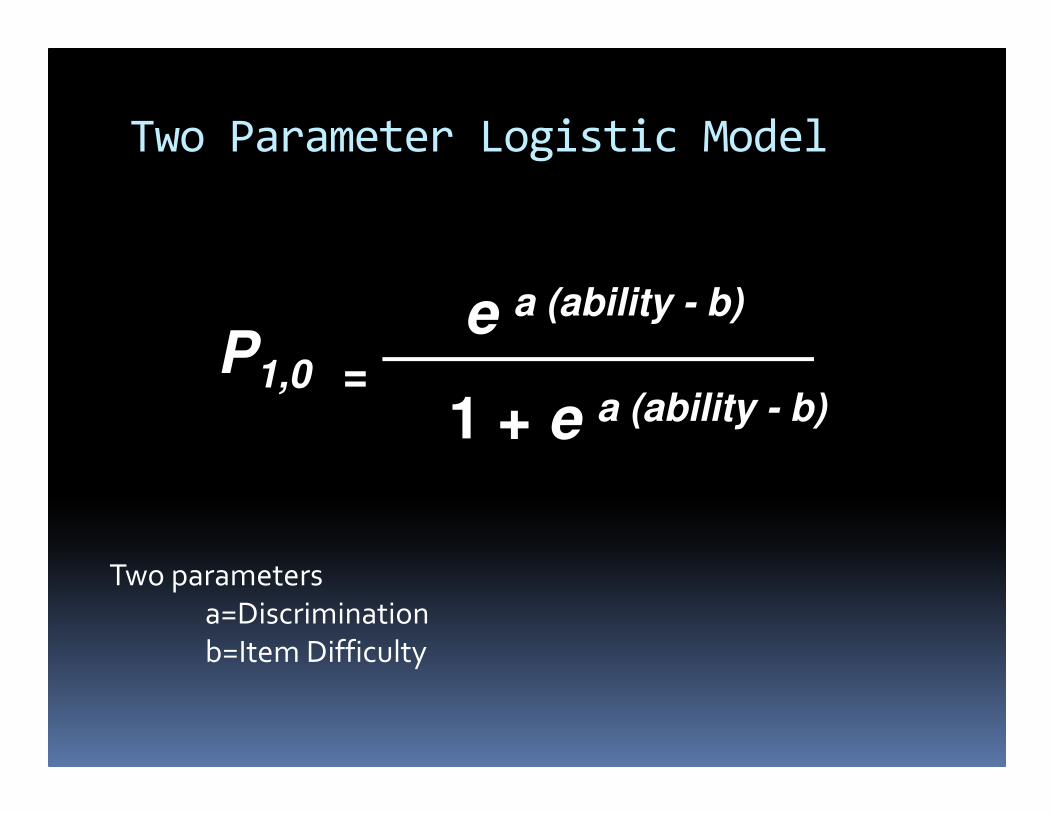
e a (ability - b)
1 + e a (ability - b)
P1,0 =
Two parameters
a=Discrimination
b=Item Difficulty
Two Parameter Logistic Model
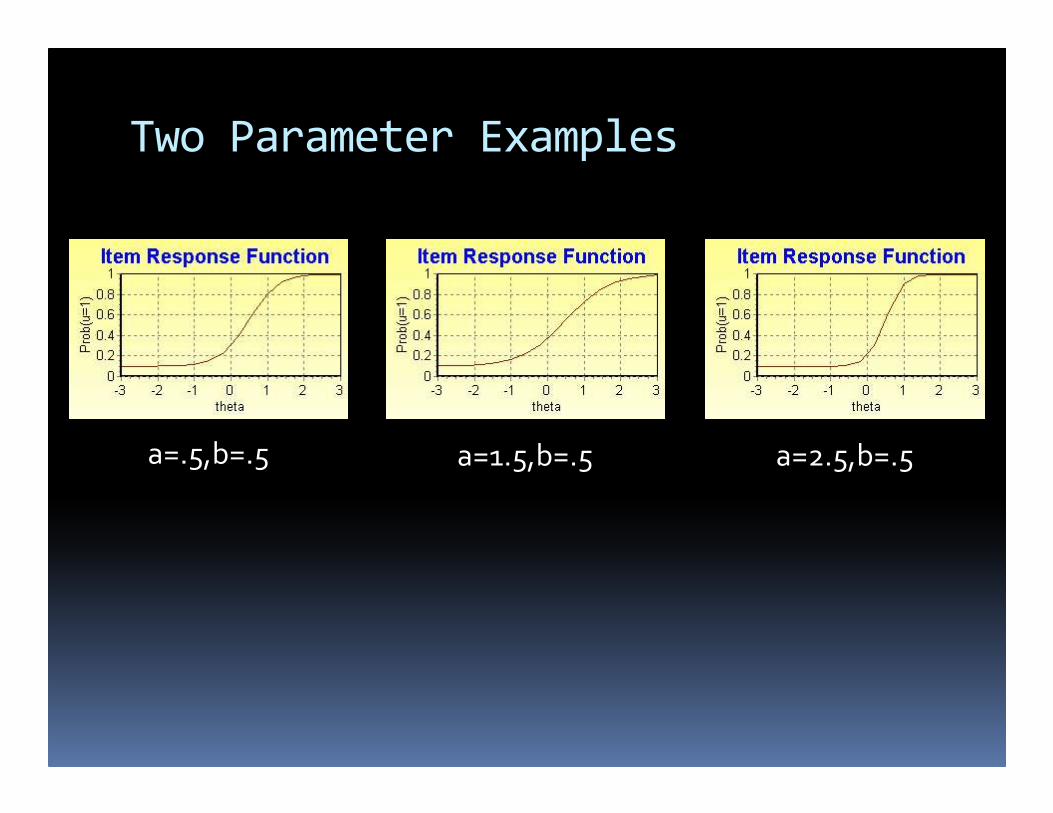
Two Parameter Examples
a=.5,b=.5 a=1.5,b=.5 a=2.5,b=.5
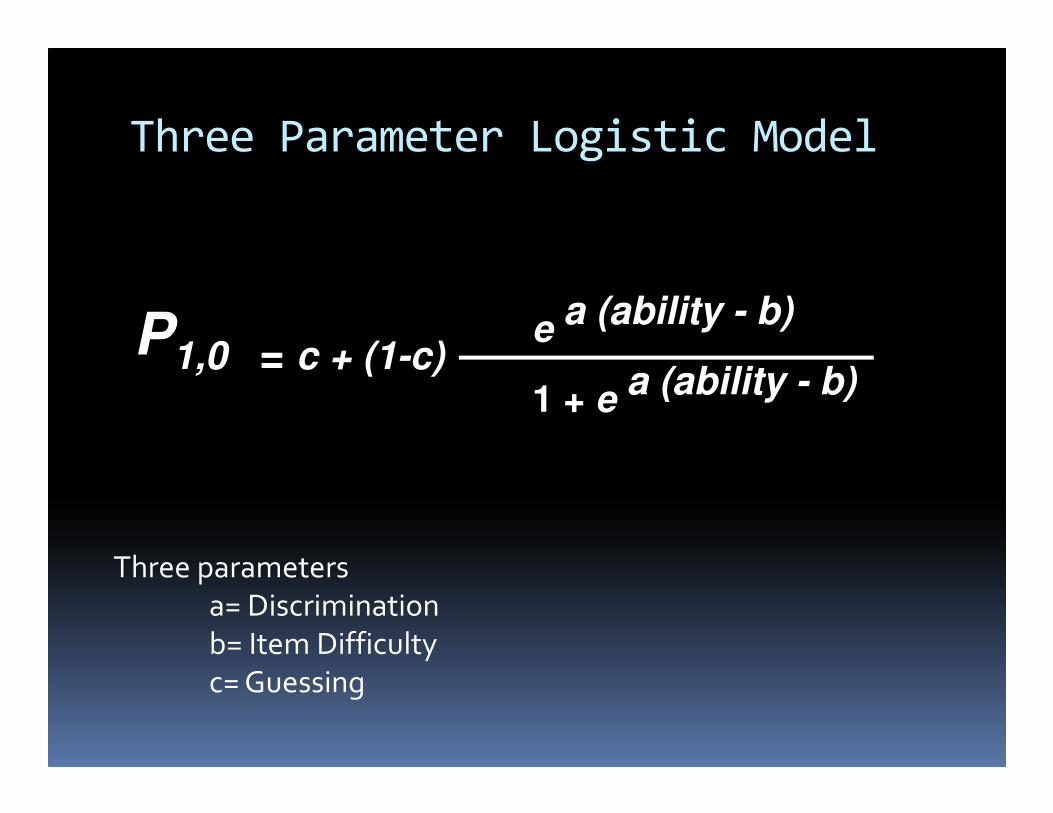
e a (ability - b)
1 + e a (ability - b)P1,0 = c + (1-c)
Three parameters
a= Discrimination
b= Item Difficulty
c= Guessing
Three Parameter Logistic Model
Three Parameter Logistic Model
(3PL)
� Requires a large sample size
� Significant research demonstrating that theoretically
3PL is better, but practically has little advantage over 1PL
� “Most accepted theoretical model”
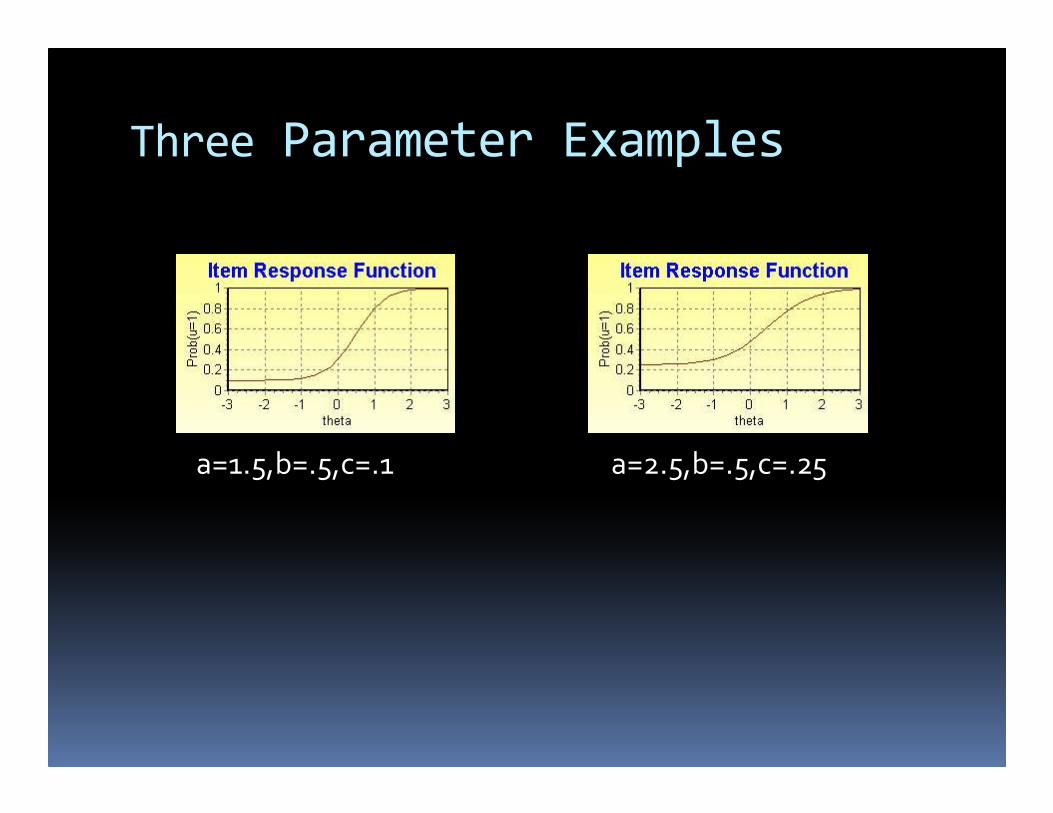
Three Parameter Examples
a=1.5,b=.5,c=.1 a=2.5,b=.5,c=.25
Polytomous Models
One Parameter
� Rating Scale Model
� Partial Credit Model
Two Parameter
� Graded Response Model
� Generalized Partial Credit Model
Multi-dimensional Models
There are also IRT models which consider more
than one unidimensional trait at a time
How does IRT differ from conventional test
theory?
Classical Test Theory
� An individual takes an assessment
� Their total score on that assessment is used for
comparison purposes
� High Score – The person is higher on the trait
� Low Score-The person is lower on the trait
Item Response Theory
� Each individual item can be used for comparison purposes
� Person endorses better rating on “hard items”-The person is higher on the trait
� Person endorses worse rating on “easy items” -The person is lower on the trait
� Items that measure the same construct can be aggregated into longer assessments
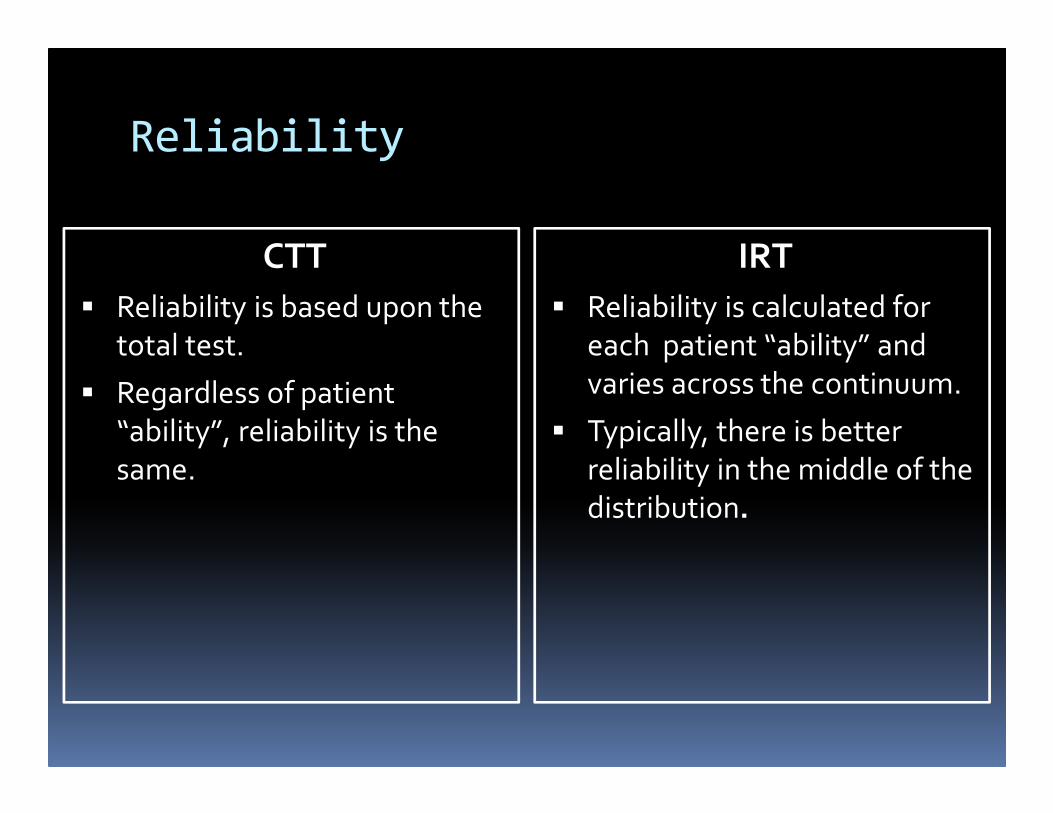
Reliability
CTT
� Reliability is based upon the
total test.
� Regardless of patient
“ability”, reliability is the
same.
IRT
� Reliability is calculated for
each patient “ability” and
varies across the continuum.
� Typically, there is better
reliability in the middle of the
distribution.
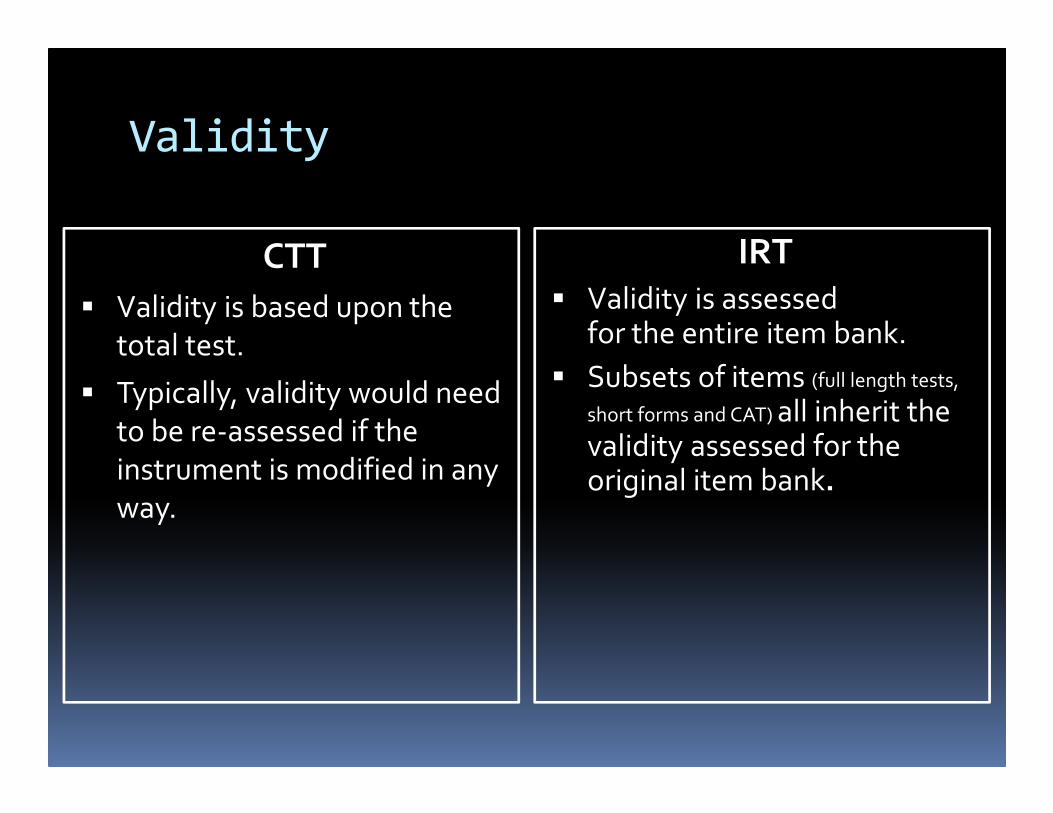
Validity
CTT
� Validity is based upon the
total test.
� Typically, validity would need
to be re-assessed if the
instrument is modified in any
way.
IRT
� Validity is assessed for the entire item bank.
� Subsets of items (full length tests,
short forms and CAT) all inherit the validity assessed for the original item bank.
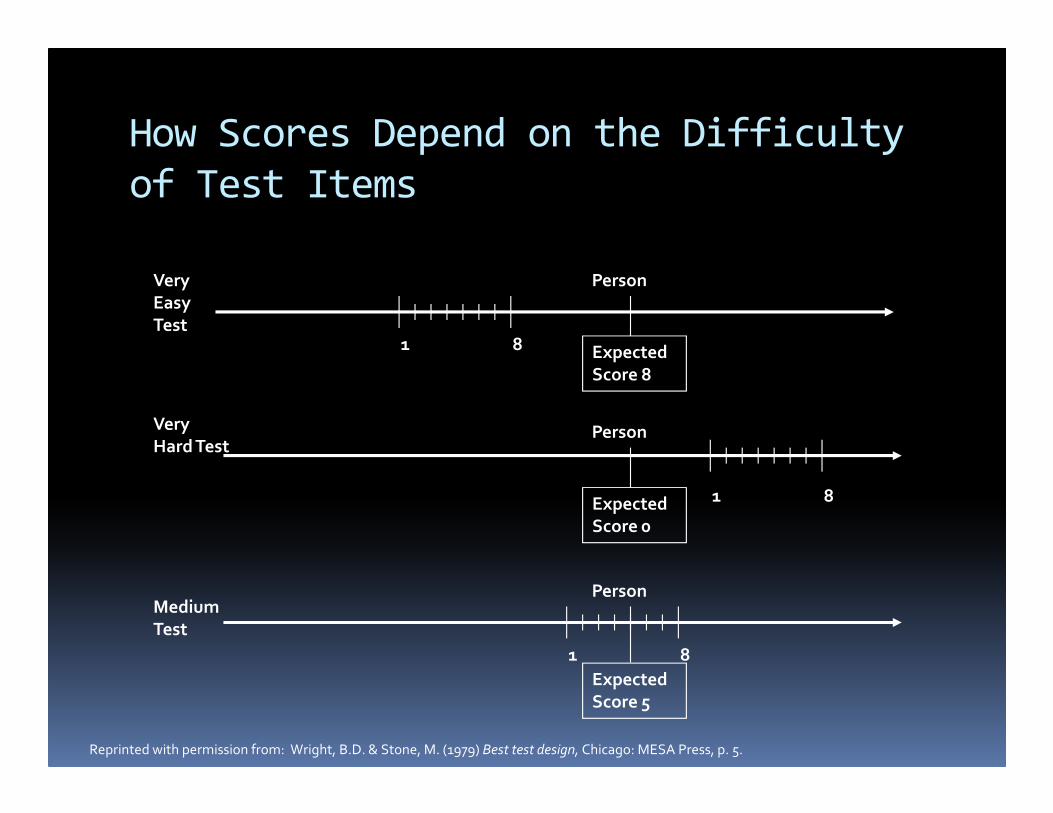
Very
Easy
Test
Very
Hard Test
Medium
Test
1 8
1 8
1
Expected
Score 8
Person
Expected
Score 0
Person
Expected
Score 5
Person
8
Reprinted with permission from: Wright, B.D. & Stone, M. (1979) Best test design, Chicago: MESA Press, p. 5.
How Scores Depend on the Difficulty
of Test Items
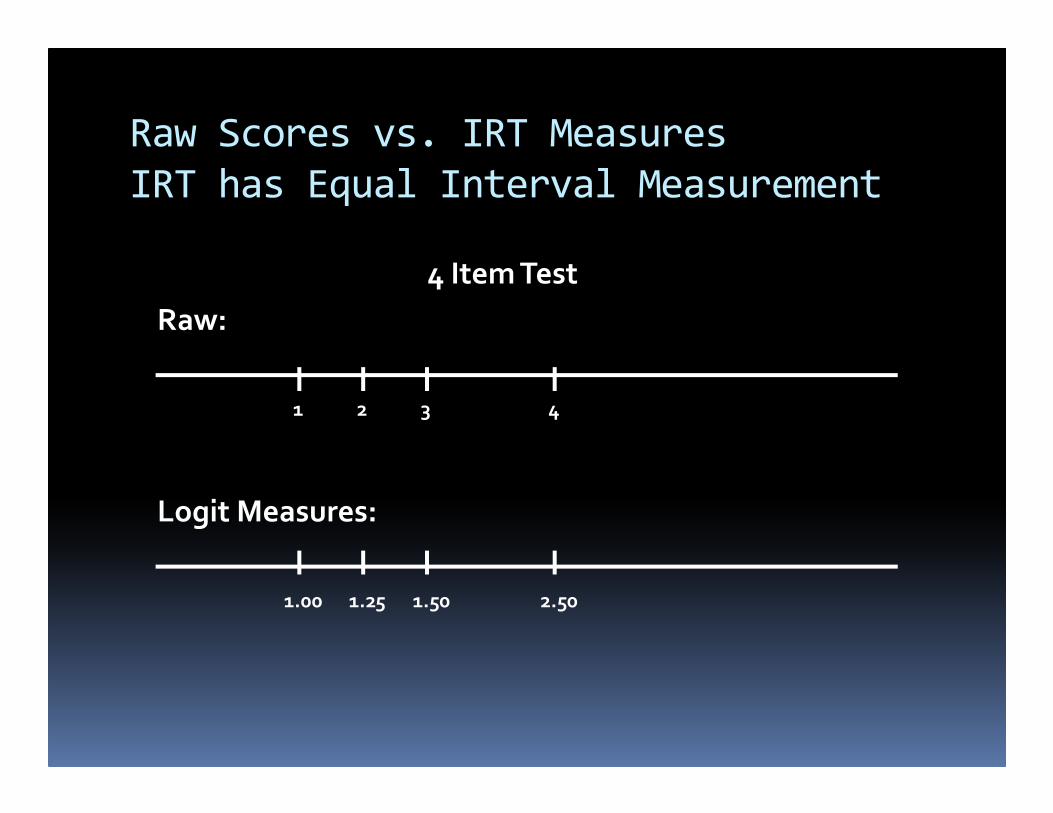
4 Item Test
Raw:
Logit Measures:
1 2 3 4
1.00 1.25 1.50 2.50
Raw Scores vs. IRT Measures
IRT has Equal Interval Measurement
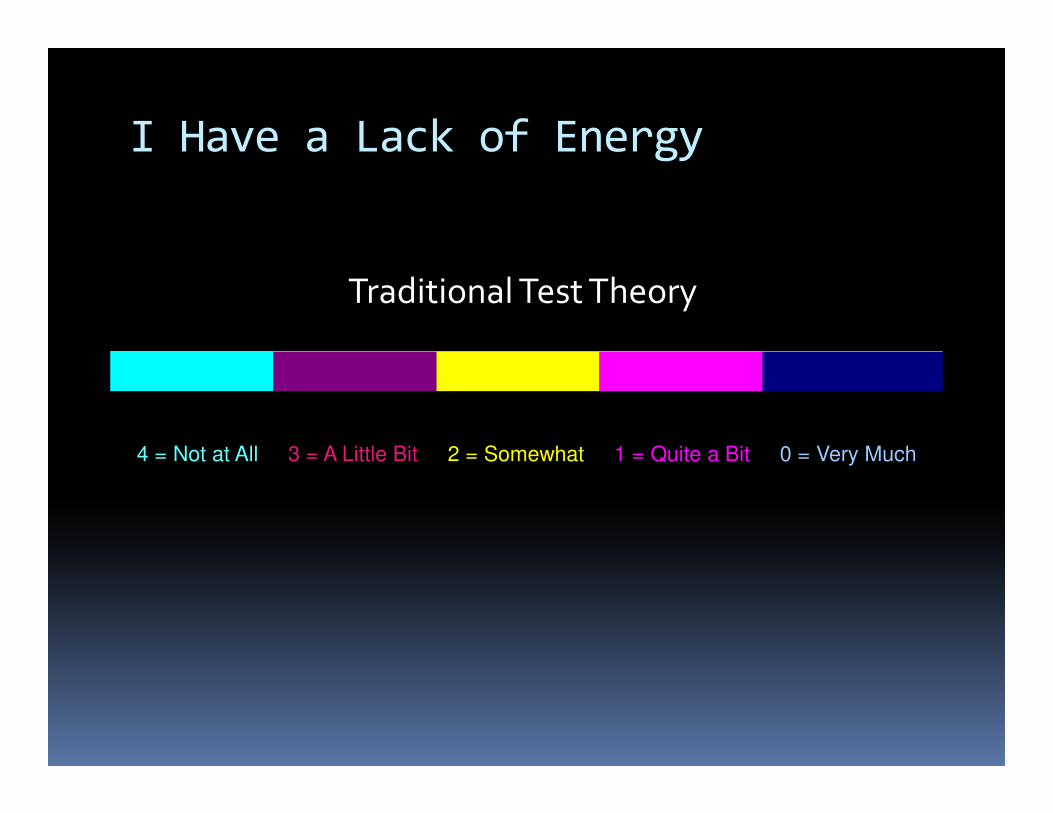
4 = Not at All 3 = A Little Bit 2 = Somewhat 1 = Quite a Bit 0 = Very Much
Traditional Test Theory
I Have a Lack of Energy
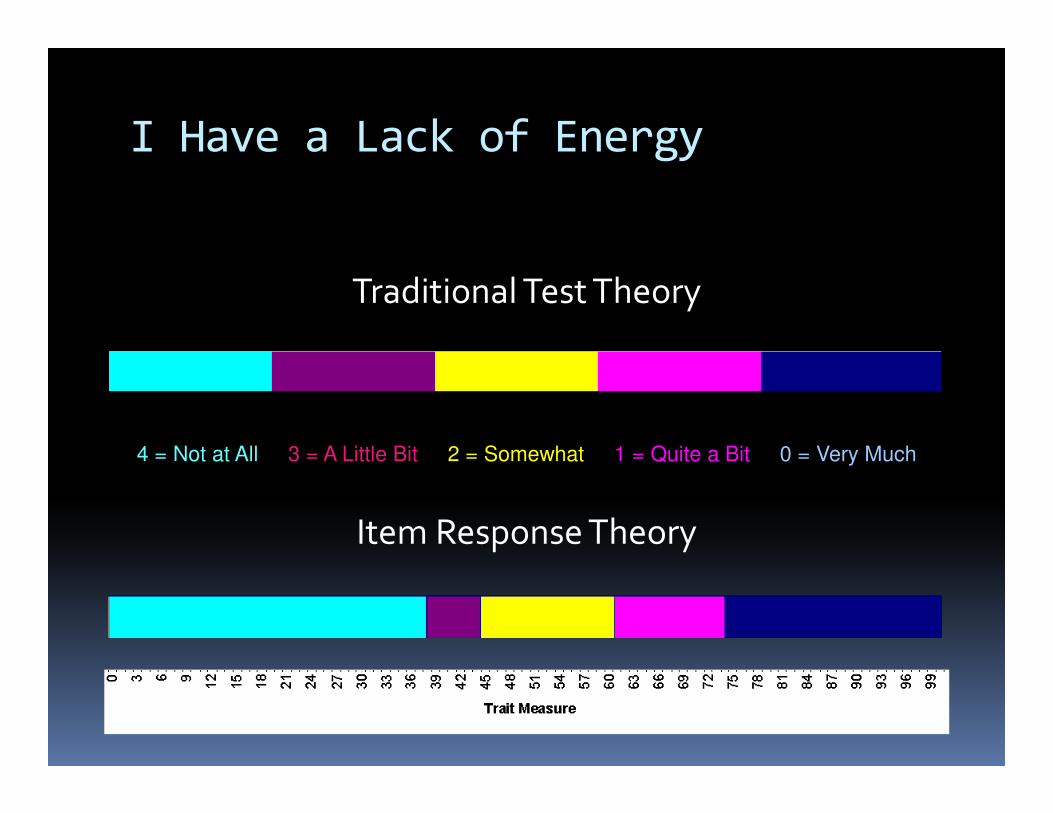
Traditional Test Theory
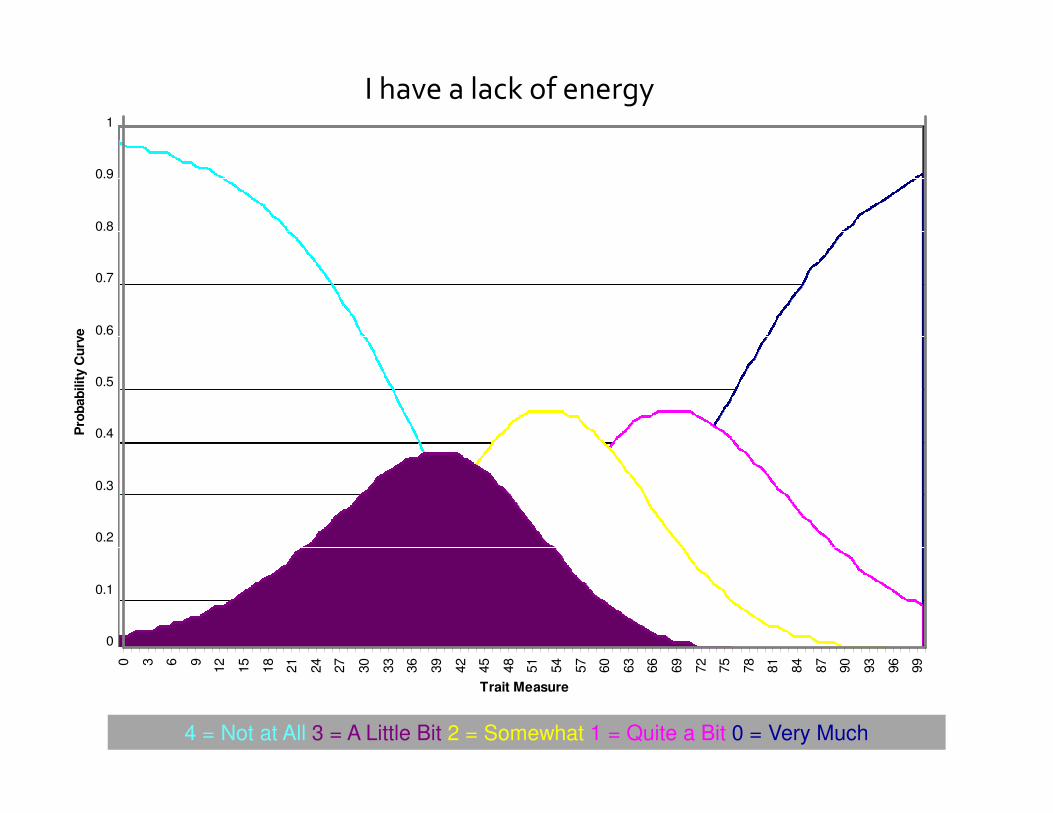
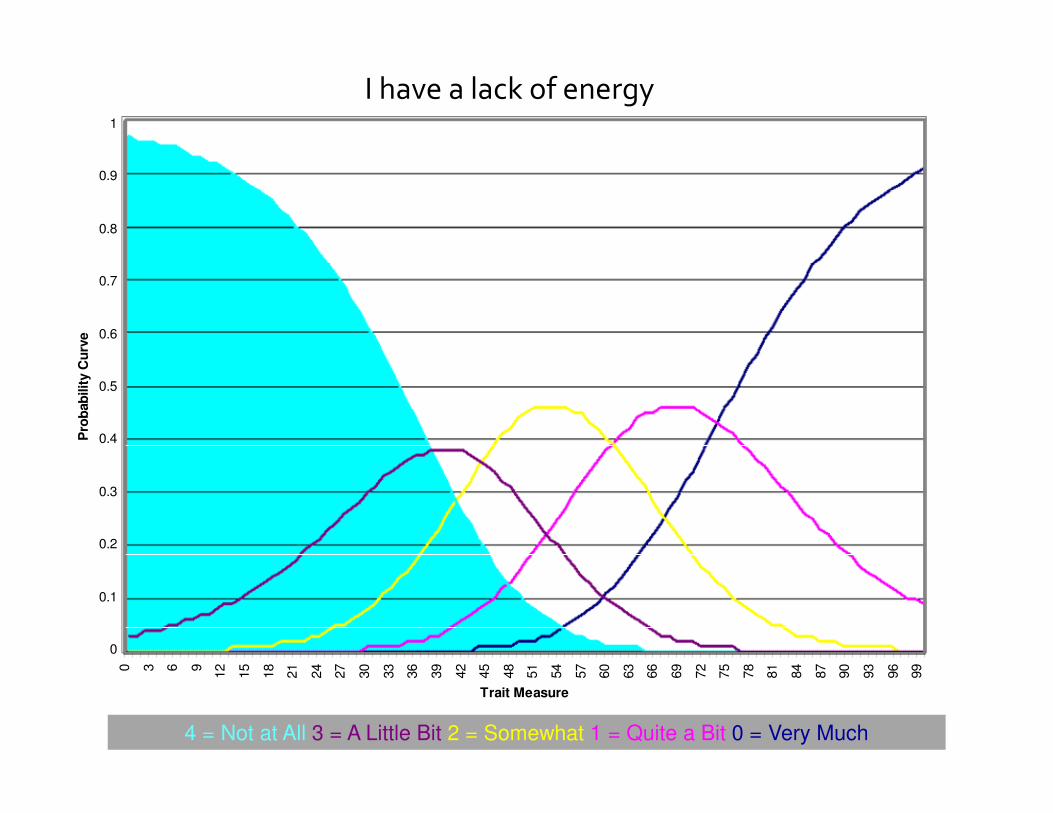
Item Response Theory
I Have a Lack of Energy
4 = Not at All 3 = A Little Bit 2 = Somewhat 1 = Quite a Bit 0 = Very Much
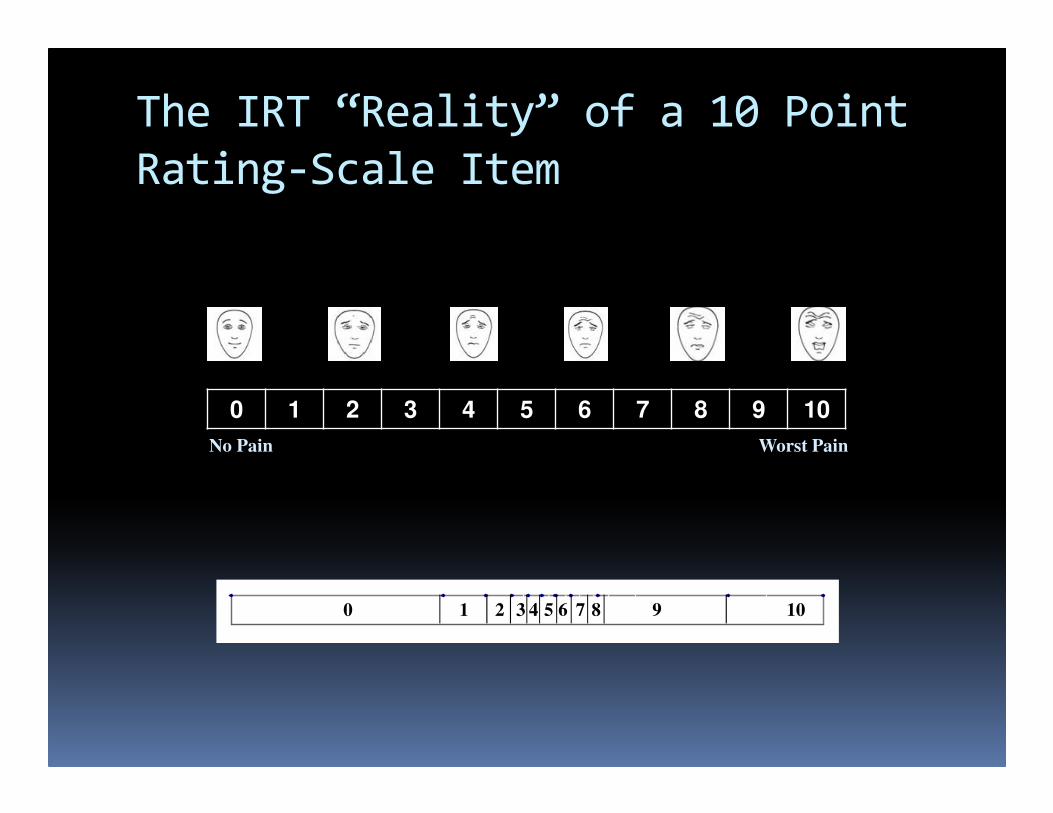
0 1 9875432 10
Worst PainNo Pain
0 1 2 3 4 5 6 7 8 9 10
6
The IRT “Reality” of a 10 Point
Rating-Scale Item
4 = Not at All 3 = A Little Bit 2 = Somewhat 1 = Quite a Bit 0 = Very Much
0 3 6 9
12
15
18
21
24
27
30
33
36
39
42
45
48
51
54
57
60
63
66
69
72
75
78
81
84
87
90
93
96
99
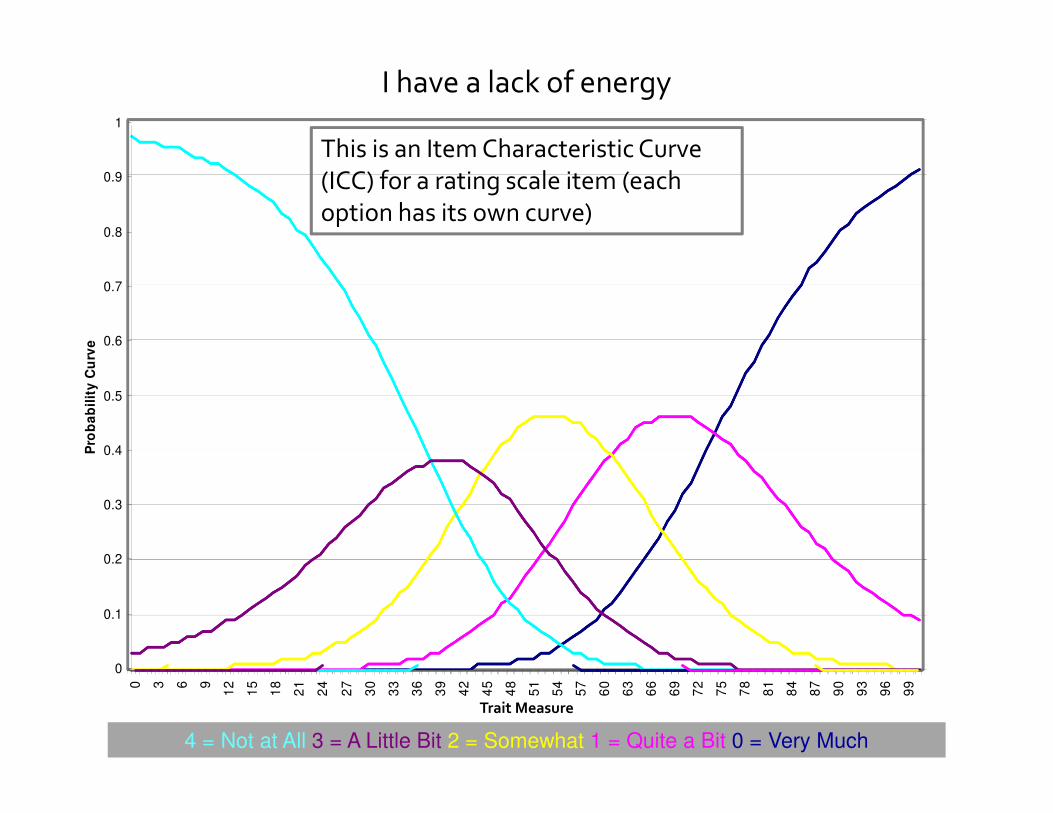
This is an Item Characteristic Curve
(ICC) for a rating scale item (each
option has its own curve)
0
0.1
0.2
0.3
0.4
0.5
0.6
0.7
0.8
0.9
1
Pro
ba
bil
ity
Cu
rve
I have a lack of energy
Trait Measure
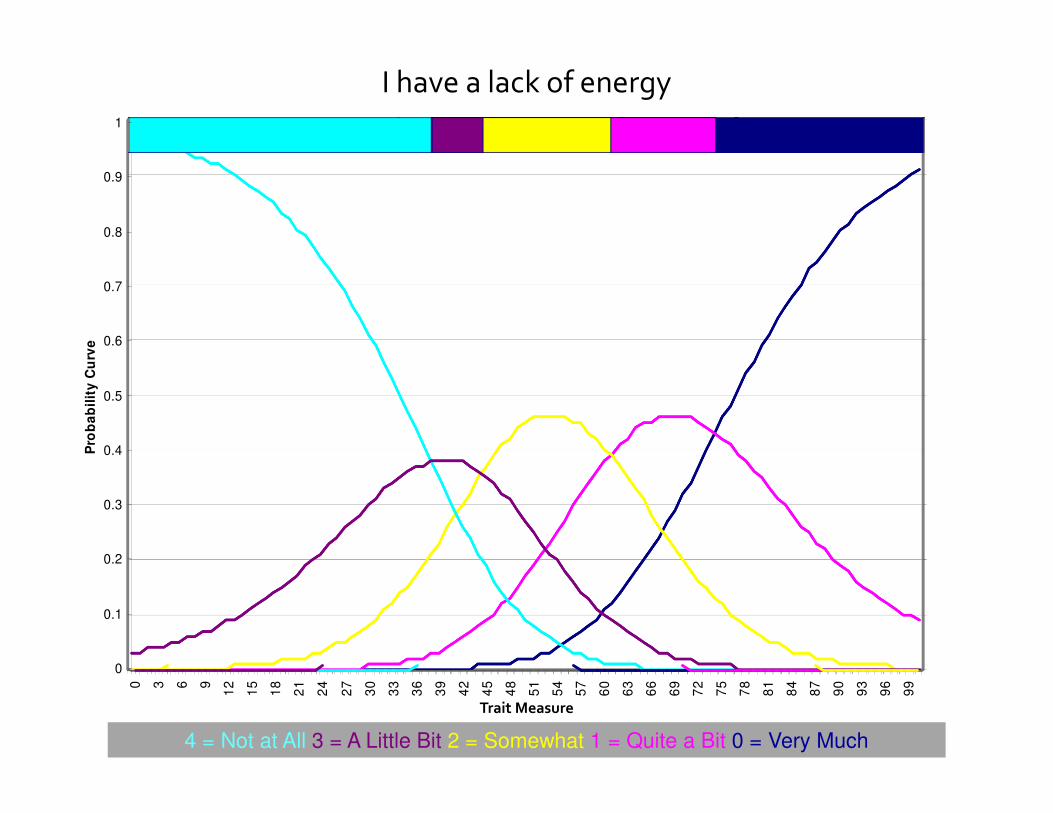
4 = Not at All 3 = A Little Bit 2 = Somewhat 1 = Quite a Bit 0 = Very Much
0 3 6 9
12
15
18
21
24
27
30
33
36
39
42
45
48
51
54
57
60
63
66
69
72
75
78
81
84
87
90
93
96
99
I have a lack of energy
Trait Measure
0
0.1
0.2
0.3
0.4
0.5
0.6
0.7
0.8
0.9
1
Pro
ba
bil
ity
Cu
rve
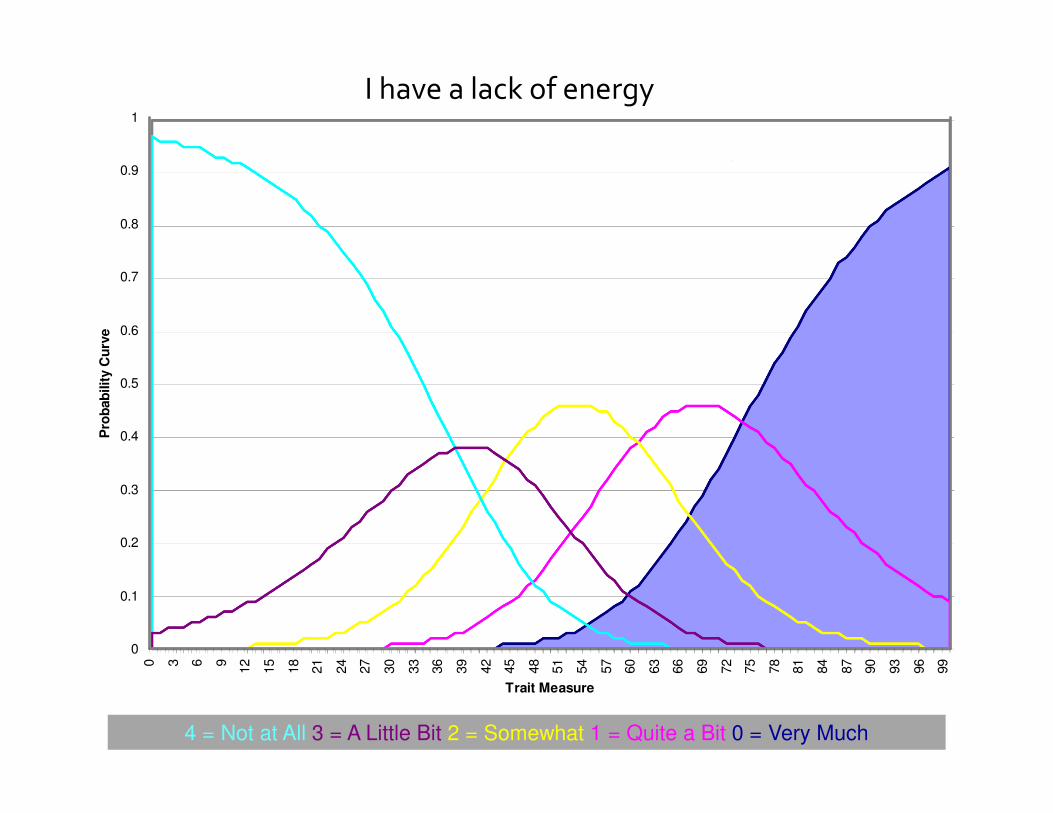
4 = Not at All 3 = A Little Bit 2 = Somewhat 1 = Quite a Bit 0 = Very Much
0
0.1
0.2
0.3
0.4
0.5
0.6
0.7
0.8
0.9
1
0
Pro
bab
ilit
y C
urv
e
0 3 6 9
12
15
18
21
24
27
30
33
36
39
42
45
48
51
54
57
60
63
66
69
72
75
78
81
84
87
90
93
96
99
Trait Measure
I have a lack of energy
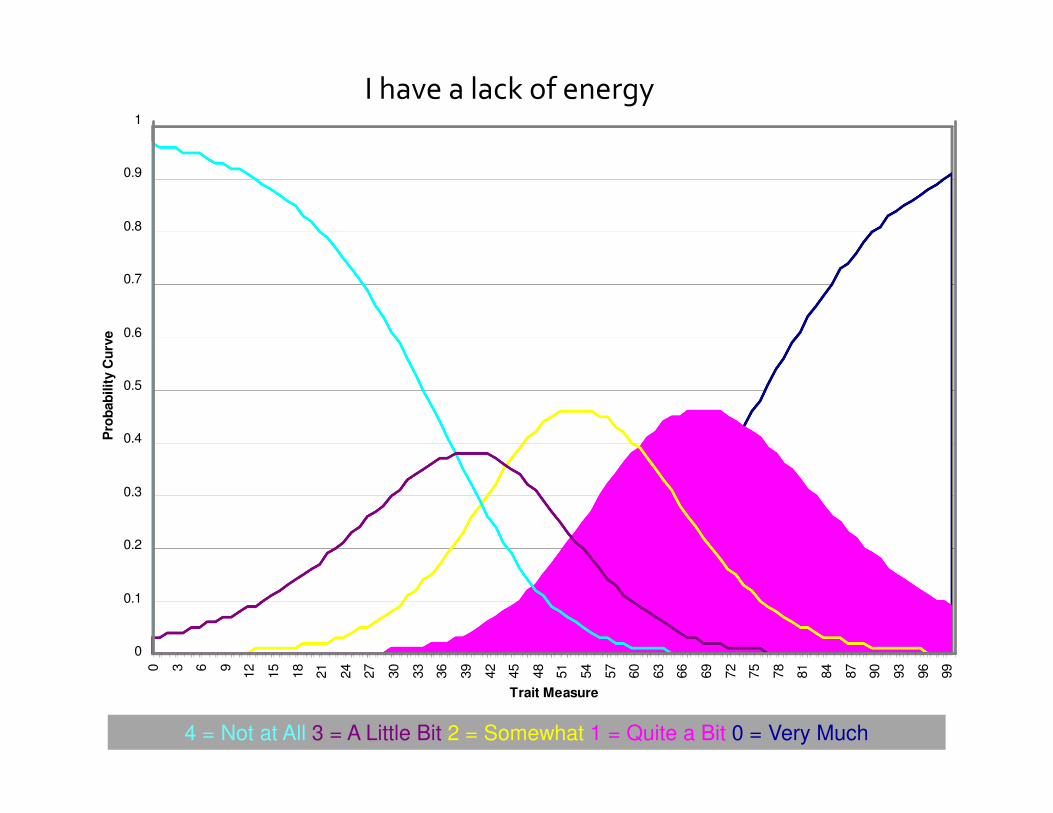
4 = Not at All 3 = A Little Bit 2 = Somewhat 1 = Quite a Bit 0 = Very Much
0 3 6 9
12
15
18
21
24
27
30
33
36
39
42
45
48
51
54
57
60
63
66
69
72
75
78
81
84
87
90
93
96
99
Trait Measure
0
0.1
0.2
0.3
0.4
0.5
0.6
0.7
0.8
0.9
1
0
Pro
bab
ilit
y C
urv
eI have a lack of energy
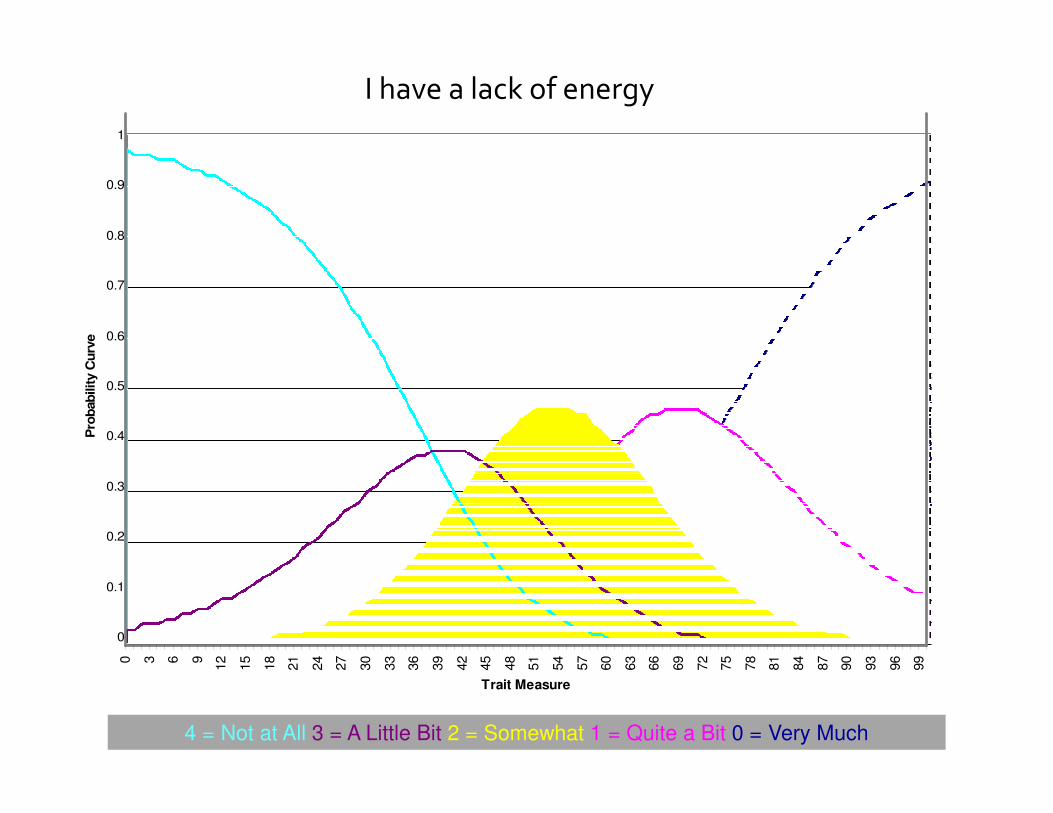
4 = Not at All 3 = A Little Bit 2 = Somewhat 1 = Quite a Bit 0 = Very Much
I have a lack of energy
0
0.1
0.2
0.3
0.4
0.5
0.6
0.7
0.8
0.9
10
Pro
bab
ilit
y C
urv
e
0 3 6 9
12
15
18
21
24
27
30
33
36
39
42
45
48
51
54
57
60
63
66
69
72
75
78
81
84
87
90
93
96
99
Trait Measure
4 = Not at All 3 = A Little Bit 2 = Somewhat 1 = Quite a Bit 0 = Very Much
0
0.1
0.2
0.3
0.4
0.5
0.6
0.7
0.8
0.9
10
Pro
bab
ilit
y C
urv
e
0 3 6 9
12
15
18
21
24
27
30
33
36
39
42
45
48
51
54
57
60
63
66
69
72
75
78
81
84
87
90
93
96
99
Trait Measure
I have a lack of energy
4 = Not at All 3 = A Little Bit 2 = Somewhat 1 = Quite a Bit 0 = Very Much
0 3 6 9
12
15
18
21
24
27
30
33
36
39
42
45
48
51
54
57
60
63
66
69
72
75
78
81
84
87
90
93
96
99
Trait Measure
I have a lack of energy
0
0.1
0.2
0.3
0.4
0.5
0.6
0.7
0.8
0.9
10
Pro
bab
ilit
y C
urv
e
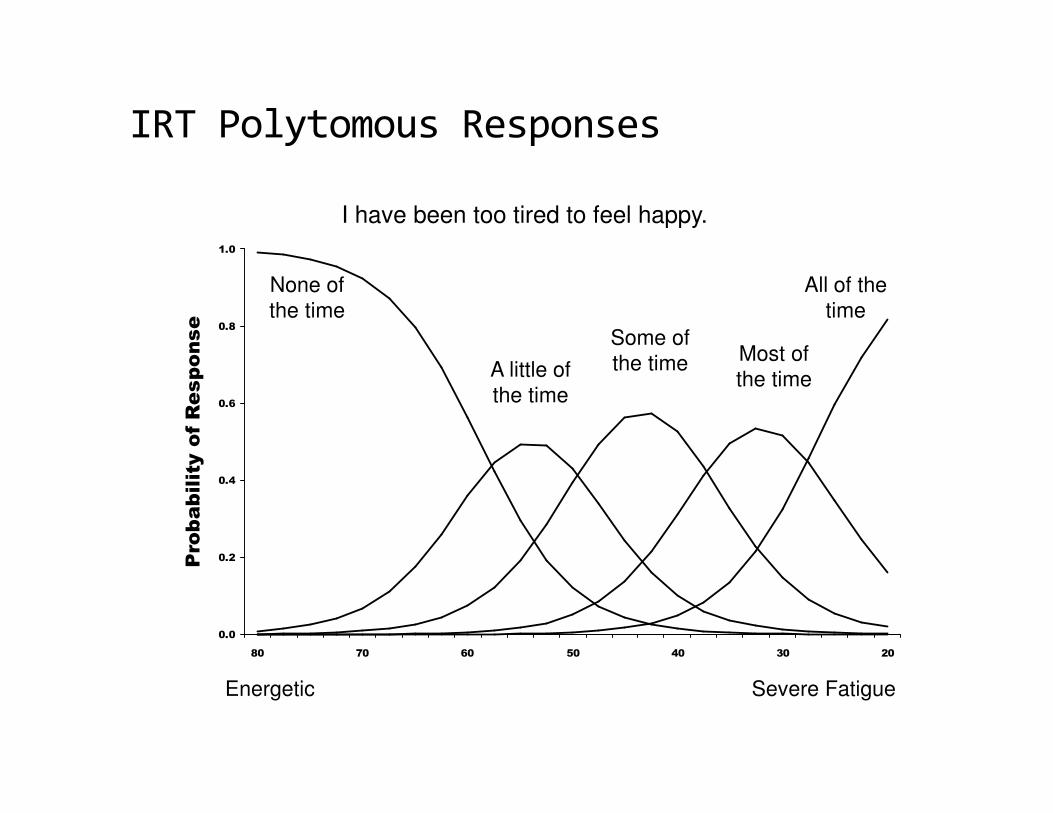
IRT Polytomous Responses
Most of
the time
Severe FatigueEnergetic
Some of
the time
All of the
time
A little of
the time
None of
the time
0.0
0.2
0.4
0.6
0.8
1.0
80 70 60 50 40 30 20
Fatigue
Pro
bab
ilit
y o
f R
espo
nse
I have been too tired to feel happy.
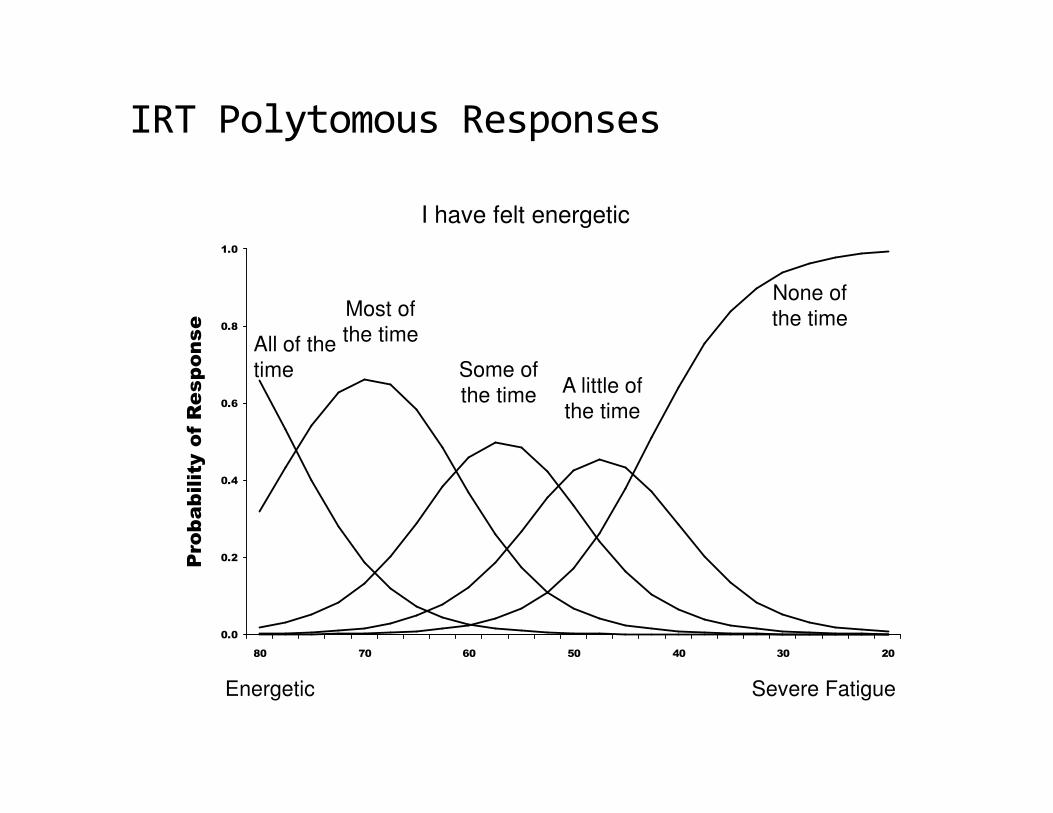
IRT Polytomous Responses
0.0
0.2
0.4
0.6
0.8
1.0
80 70 60 50 40 30 20
Fatigue
Pro
bab
ilit
y o
f R
esp
on
se
Most of
the time
Severe FatigueEnergetic
Some of
the time
All of the
timeA little of
the time
None of
the time
I have felt energetic
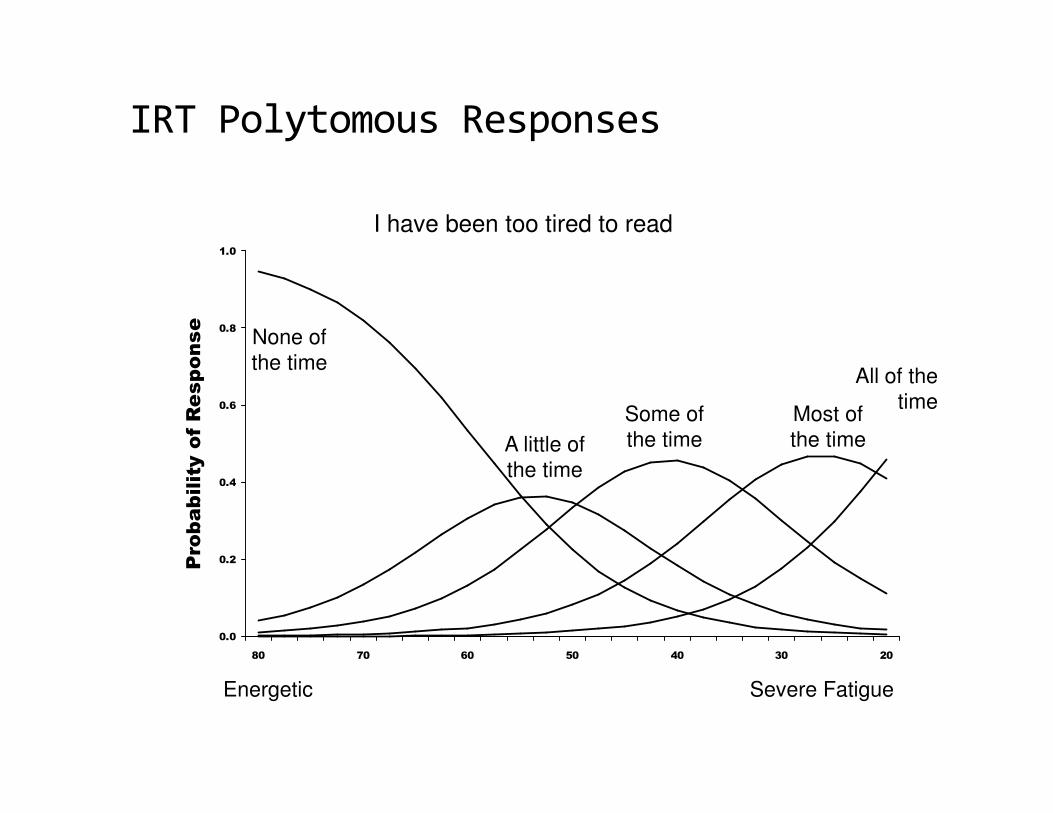
IRT Polytomous Responses
0.0
0.2
0.4
0.6
0.8
1.0
80 70 60 50 40 30 20
Pro
bab
ilit
y o
f R
esp
on
se
Most of
the time
Severe FatigueEnergetic
Some of
the time
All of the
time
A little of
the time
None of
the time
I have been too tired to read

Item Banking
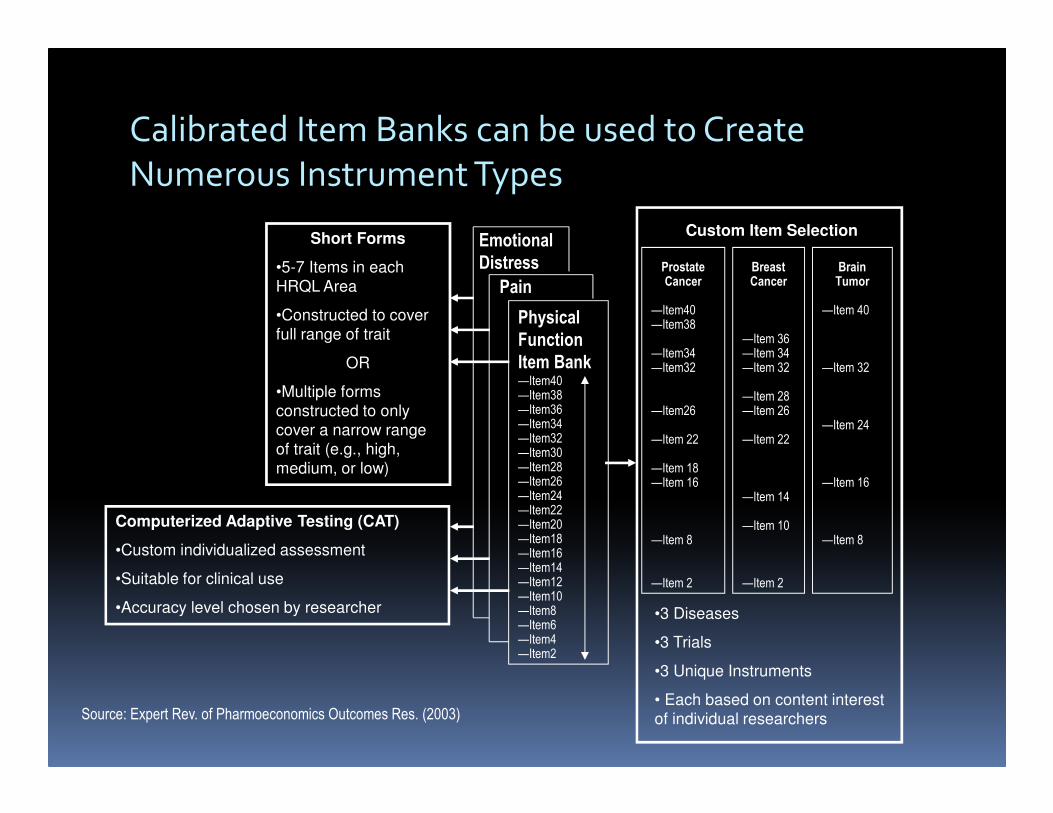
Calibrated Item Banks can be used to Create
Numerous Instrument Types
Emotional
Distress
Pain
Physical
Function
Item Bank—Item40—Item38—Item36—Item34—Item32—Item30—Item28—Item26—Item24—Item22—Item20—Item18—Item16—Item14—Item12—Item10—Item8—Item6—Item4—Item2
Short Forms
•5-7 Items in each
HRQL Area
•Constructed to cover
full range of trait
OR
•Multiple forms
constructed to only
cover a narrow range
of trait (e.g., high,
medium, or low)
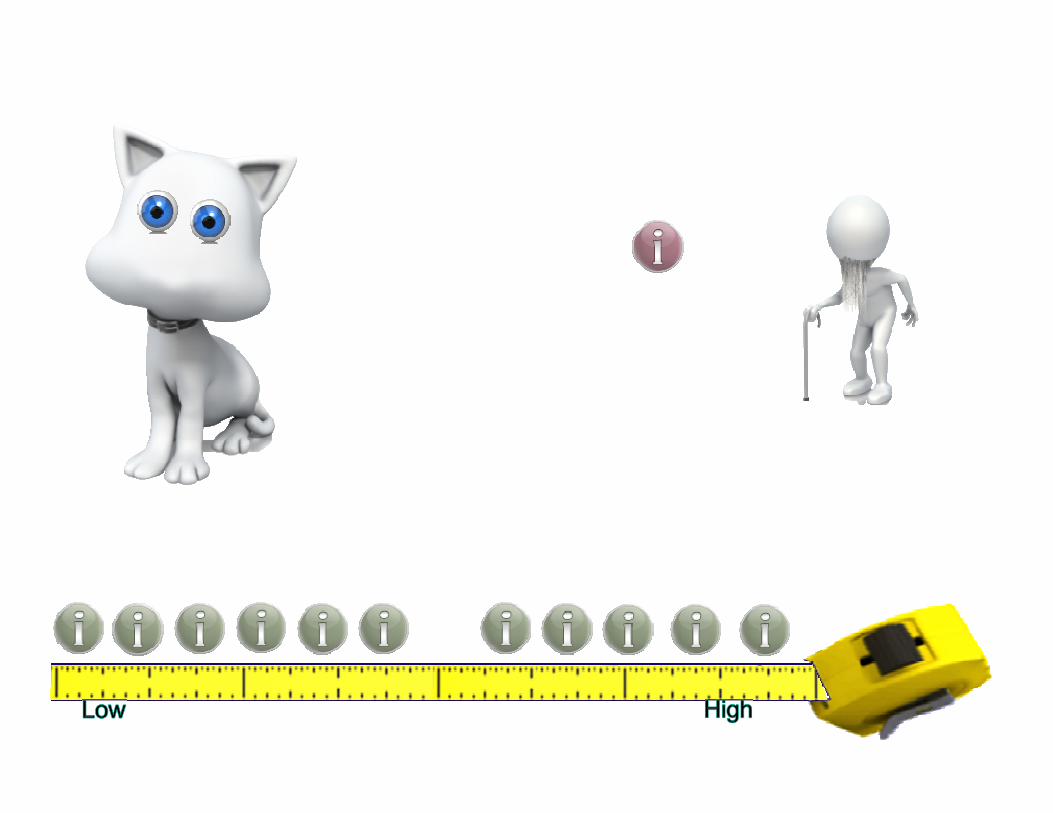
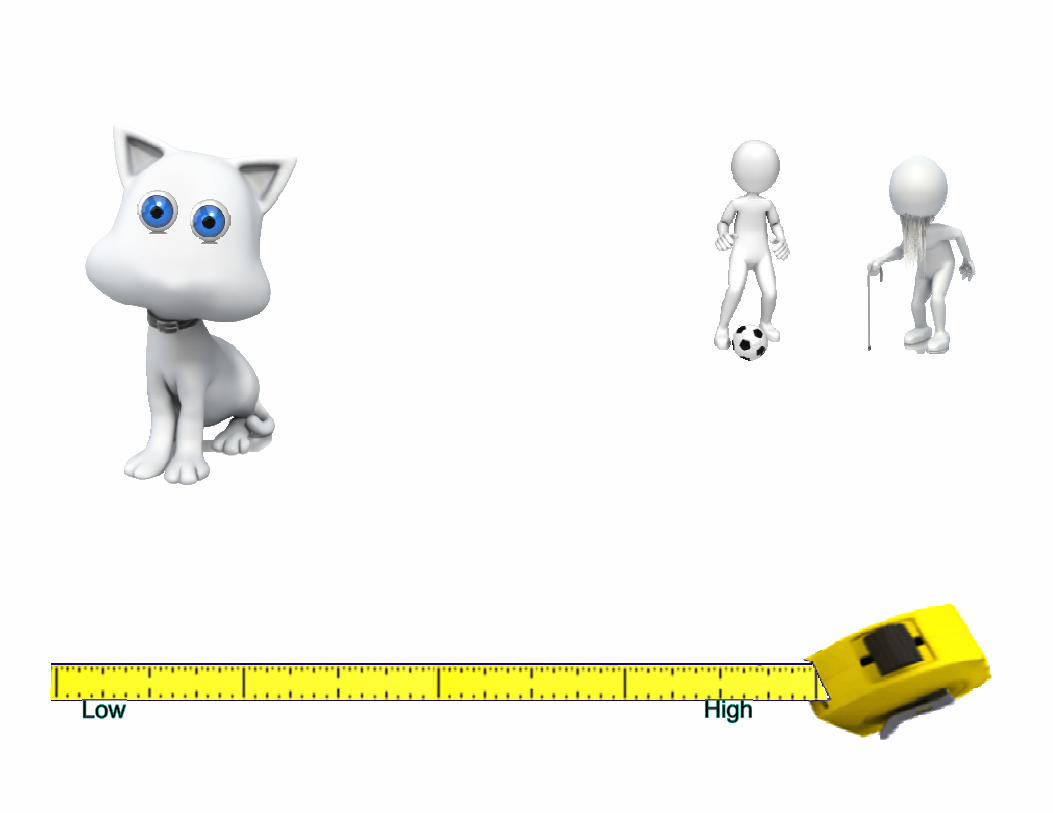
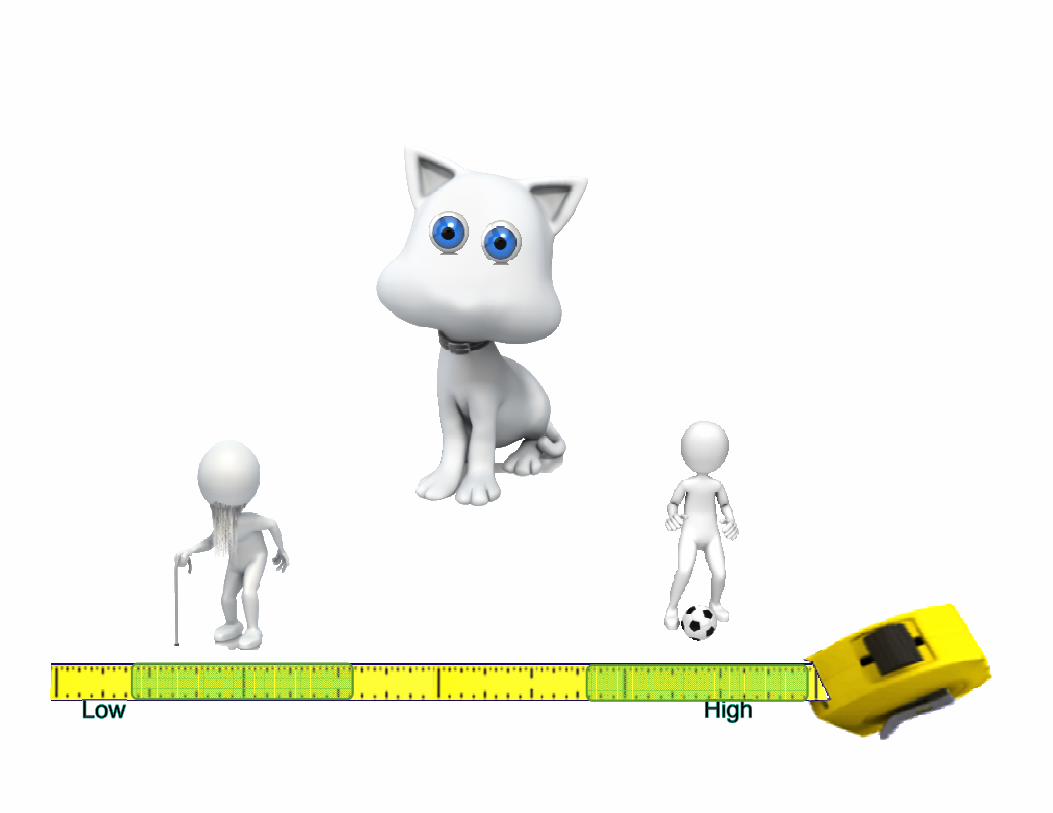
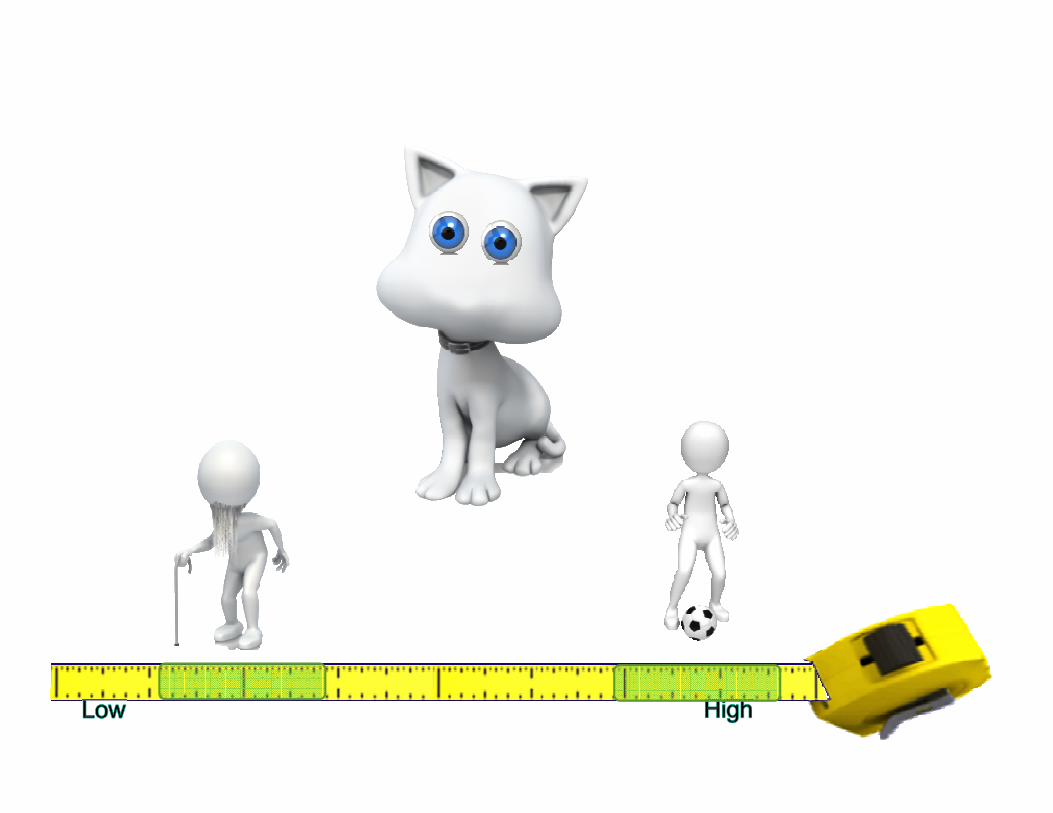
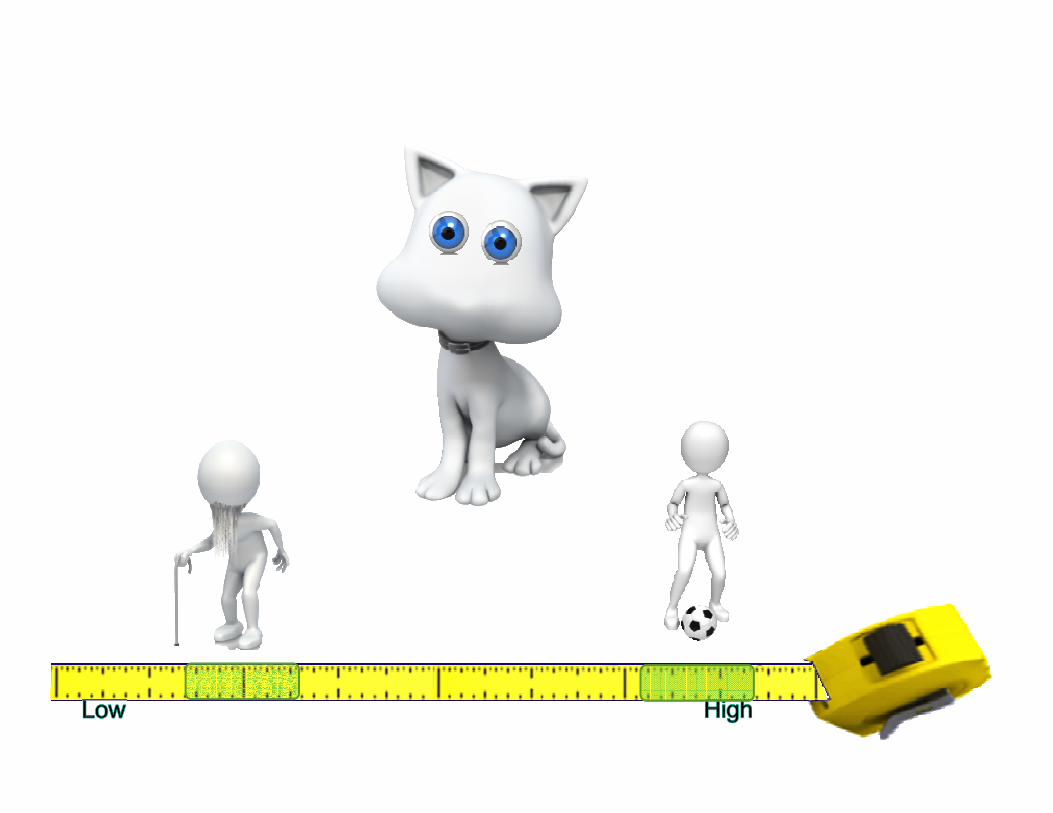
Computerized Adaptive Testing (CAT)
•Custom individualized assessment
•Suitable for clinical use
•Accuracy level chosen by researcher
ProstateCancer
—Item40—Item38
—Item34—Item32
—Item26
—Item 22
—Item 18—Item 16
—Item 8
—Item 2
BreastCancer
—Item 36—Item 34—Item 32
—Item 28—Item 26
—Item 22
—Item 14
—Item 10
—Item 2
BrainTumor
—Item 40
—Item 32
—Item 24
—Item 16
—Item 8
•3 Diseases
•3 Trials
•3 Unique Instruments
• Each based on content interest
of individual researchers
Custom Item Selection
Source: Expert Rev. of Pharmoeconomics Outcomes Res. (2003)
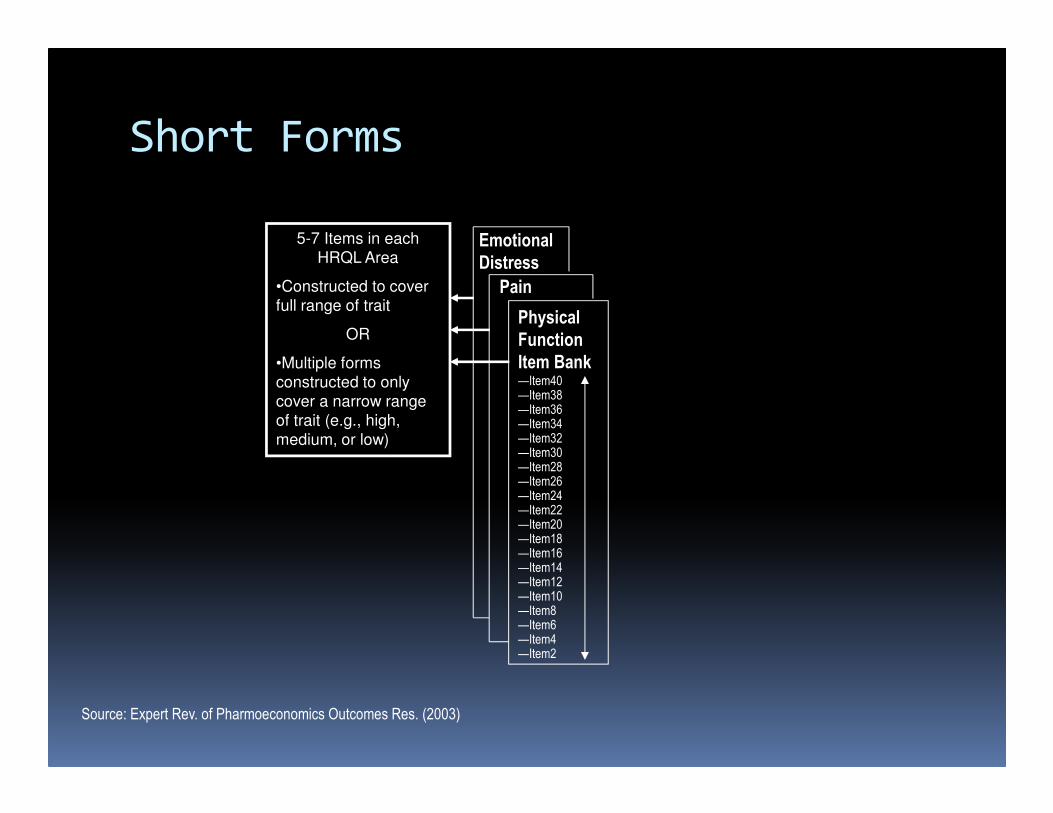
Short Forms
Emotional
Distress
Pain
Physical
Function
Item Bank—Item40—Item38—Item36—Item34—Item32—Item30—Item28—Item26—Item24—Item22—Item20—Item18—Item16—Item14—Item12—Item10—Item8—Item6—Item4—Item2
5-7 Items in each
HRQL Area
•Constructed to cover
full range of trait
OR
•Multiple forms
constructed to only
cover a narrow range
of trait (e.g., high,
medium, or low)
Source: Expert Rev. of Pharmoeconomics Outcomes Res. (2003)
Item1
Item2
Item11
Item10
Item9
Item8
Item7
Item6
Item5
Item4
Item3
Item16
Item15
Item14
Item13
Item12
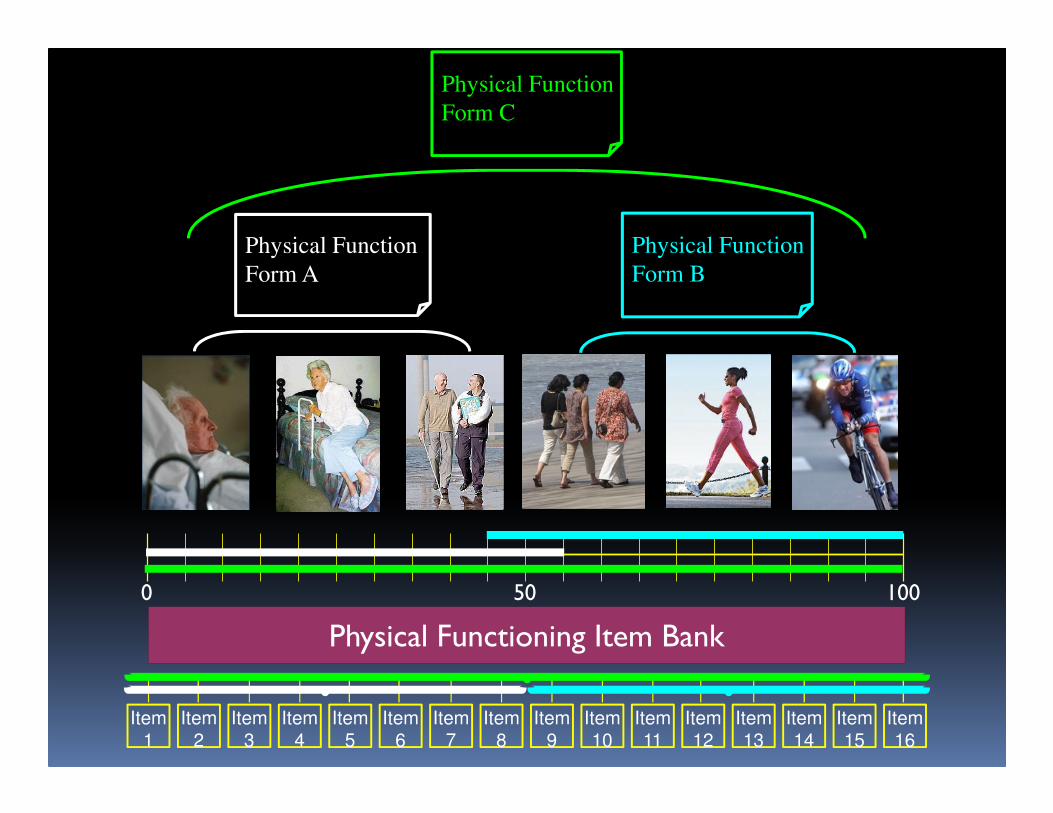
Physical Functioning Item Bank
100500
Physical Function
Form A
Physical Function
Form B
Physical Function
Form C

Computerized Adaptive Testing
(CAT)Emotional
Distress
Pain
Physical
Function
Item Bank—Item40—Item38—Item36—Item34—Item32—Item30—Item28—Item26—Item24—Item22—Item20—Item18—Item16—Item14—Item12—Item10—Item8—Item6—Item4—Item2
•Custom individualized assessment
•Suitable for clinical use
•Accuracy level chosen by researcher
Source: Expert Rev. of Pharmoeconomics Outcomes Res. (2003)
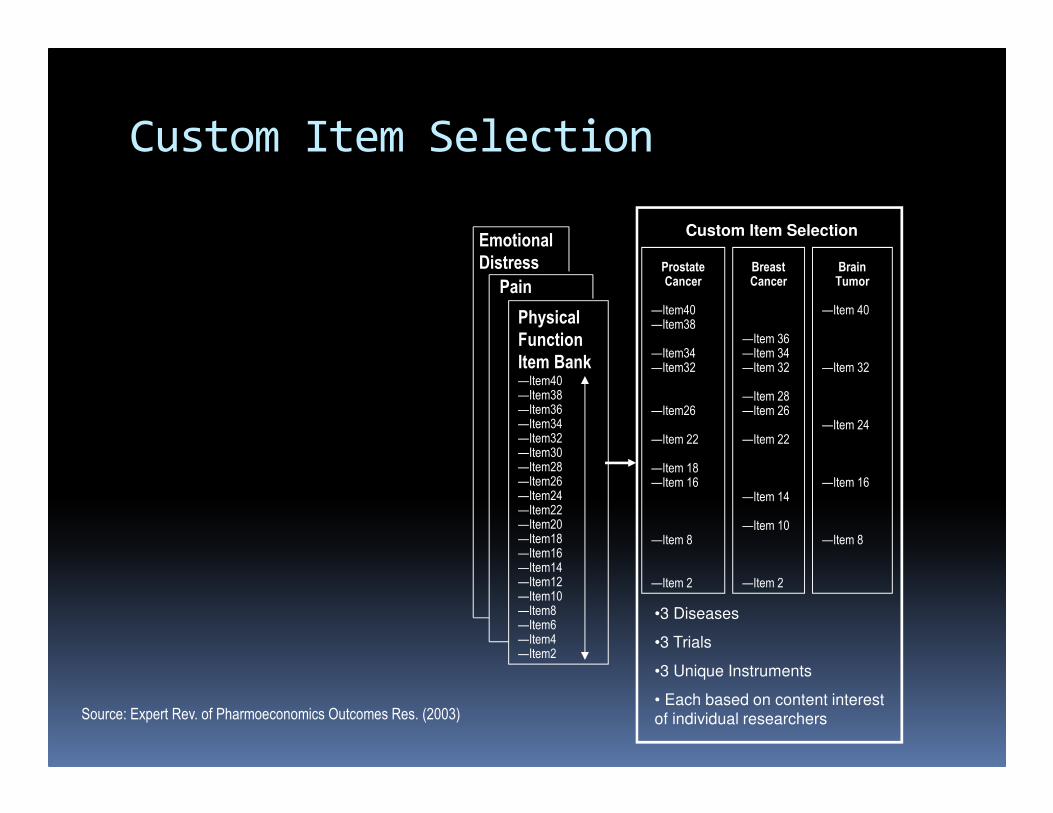
Custom Item Selection
Emotional
Distress
Pain
Physical
Function
Item Bank—Item40—Item38—Item36—Item34—Item32—Item30—Item28—Item26—Item24—Item22—Item20—Item18—Item16—Item14—Item12—Item10—Item8—Item6—Item4—Item2
ProstateCancer
—Item40—Item38
—Item34—Item32
—Item26
—Item 22
—Item 18—Item 16
—Item 8
—Item 2
BreastCancer
—Item 36—Item 34—Item 32
—Item 28—Item 26
—Item 22
—Item 14
—Item 10
—Item 2
BrainTumor
—Item 40
—Item 32
—Item 24
—Item 16
—Item 8
•3 Diseases
•3 Trials
•3 Unique Instruments
• Each based on content interest
of individual researchers
Custom Item Selection
Source: Expert Rev. of Pharmoeconomics Outcomes Res. (2003)
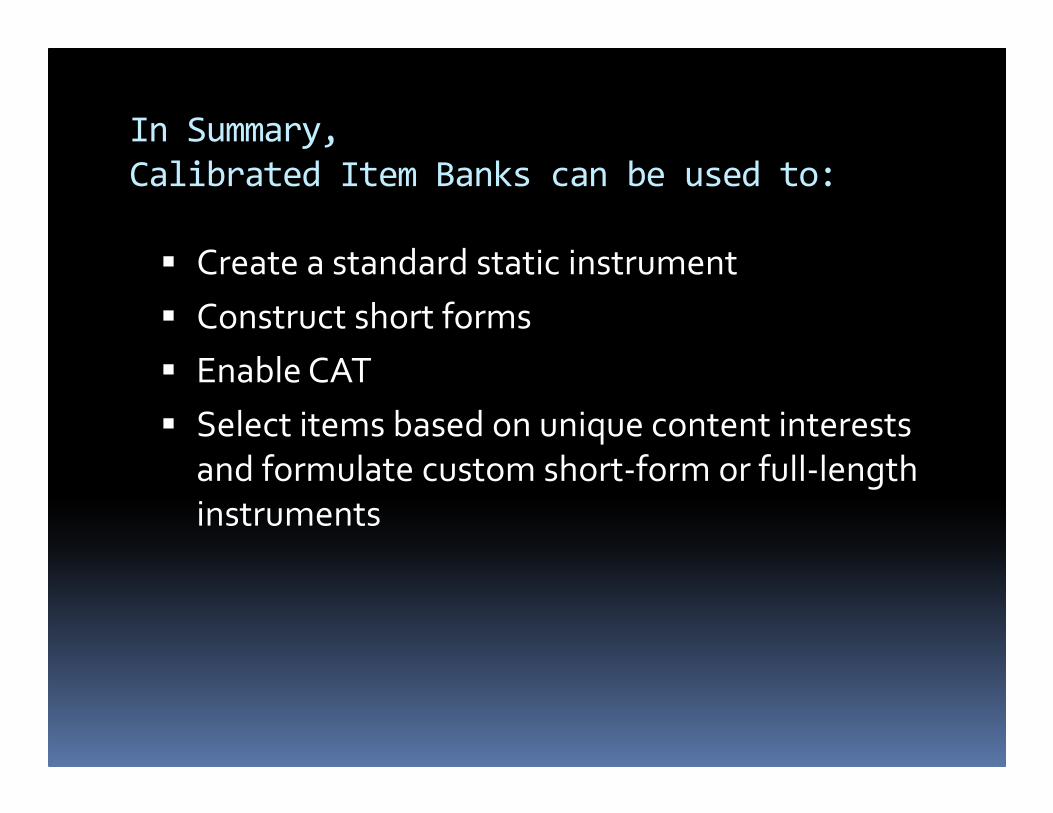
In Summary,
Calibrated Item Banks can be used to:
� Create a standard static instrument
� Construct short forms
� Enable CAT
� Select items based on unique content interests
and formulate custom short-form or full-length
instruments
In every case, using a validated,
pre-calibrated item bank allows any of these
instruments to be pre-validated and produce
standardized scores on the same scale
Computerized
Adaptive
Testing
What is Computerized Adaptive
Testing?
� Shorter
� Targeting
� Computerized Algorithm

CAT in the Military
� Armed Services Vocational Aptitude Battery
(ASVAB)

CAT for Certification

CAT for Licensure

CAT for College Entrance
ACCUPLACER OnLine

CAT for Education
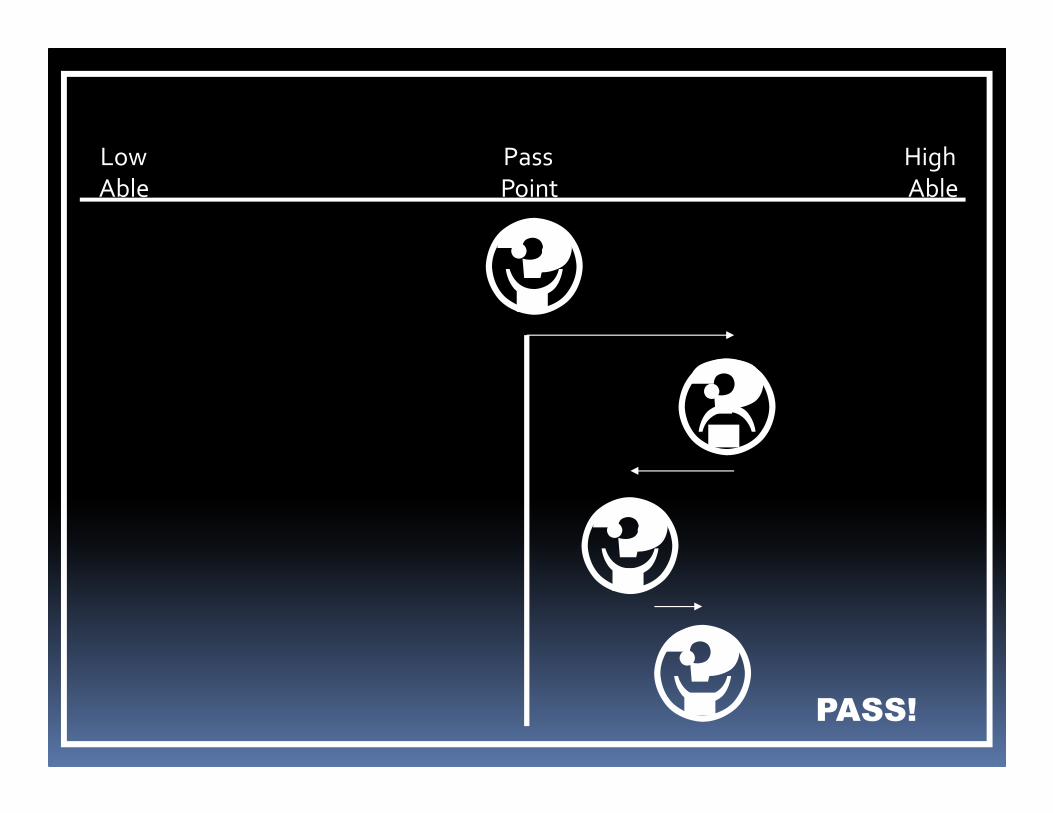
Low Pass HighAble Point Able
PASS!
�
☺
☺
☺
?
?
?
?
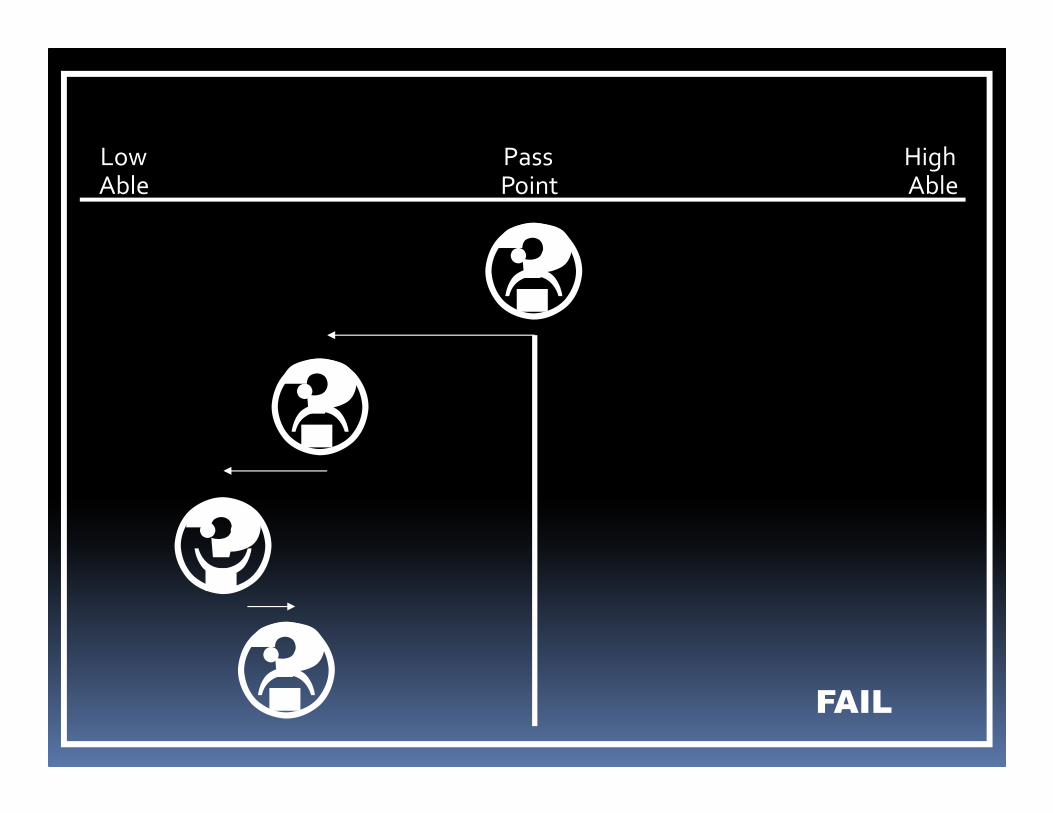
FAIL
�
☺
?
?
?
?
�
�
Low Pass HighAble Point Able

Example – Binary Search
� Binary search
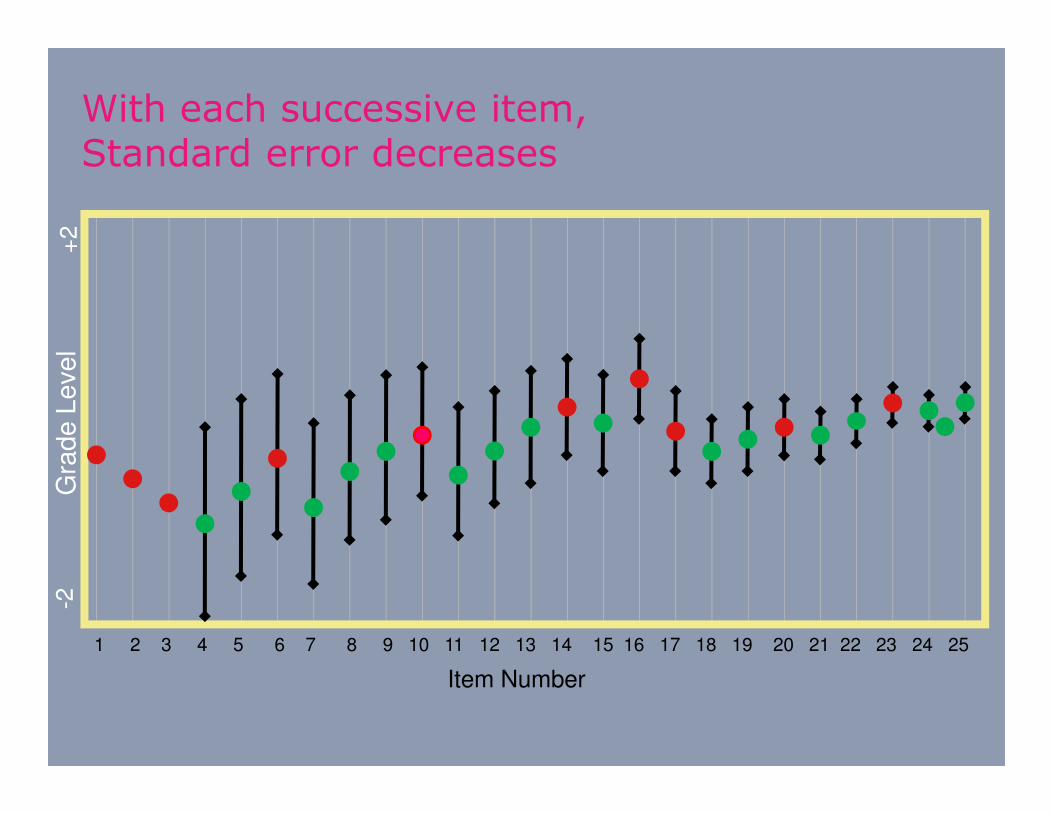
1 2 3 4 5 6 7 8 9 10 11 12 13 14 15 16 17 18 19 20 21 22 23 24 25
Item Number
Gra
de
Le
ve
l
With each successive item,
Standard error decreases
+2
-2
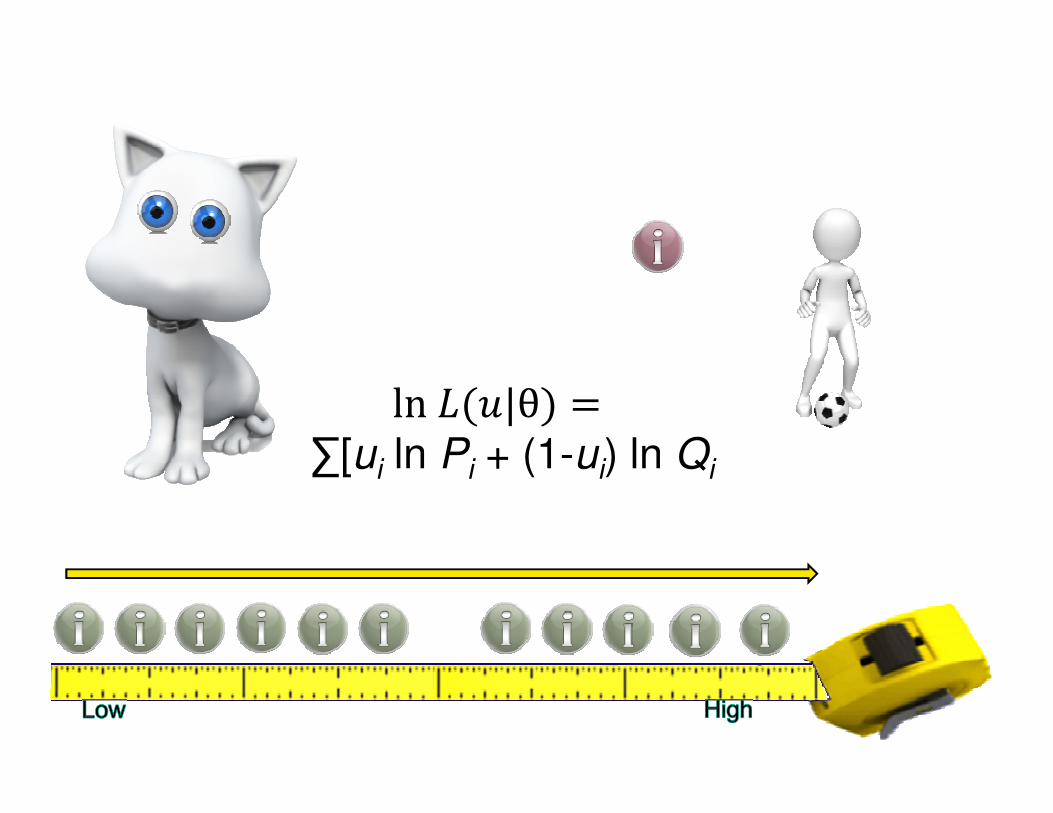
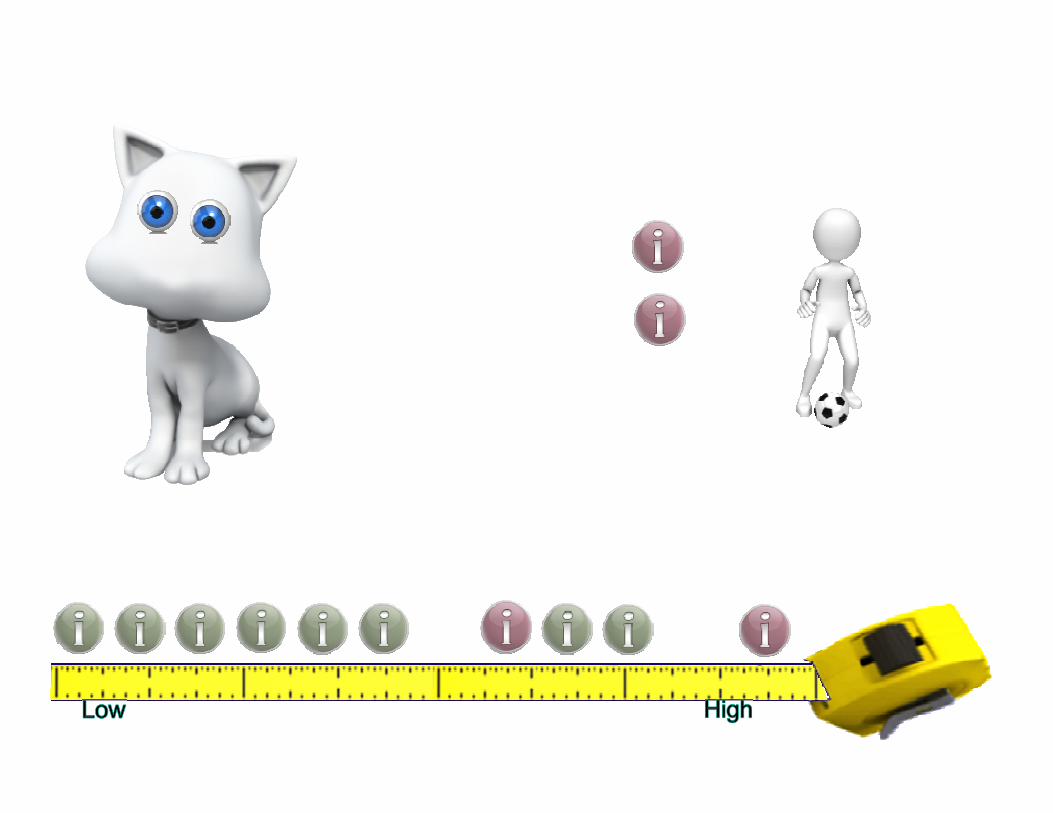
ln���|θ
∑[ui ln Pi + (1-ui) ln Qi
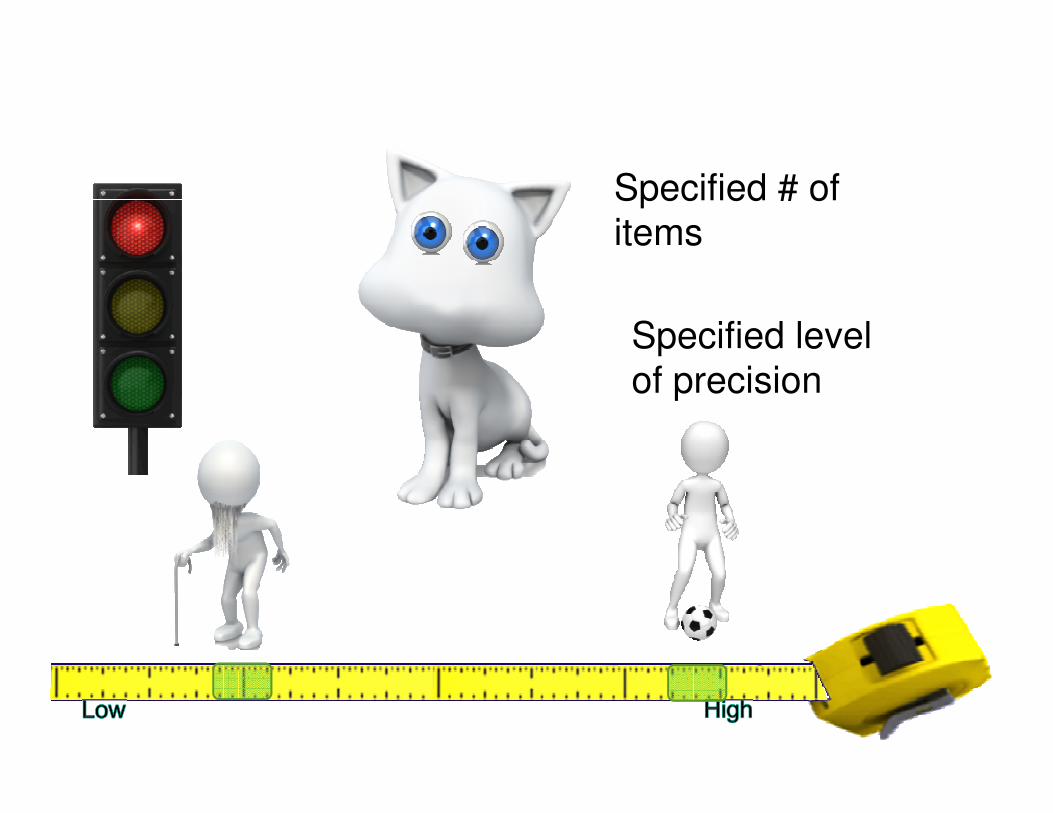
Specified # of
items
Specified level
of precision
Why bother?
Reduce burden of responding
Make room for measuring
more domains
CAT Requirements
� Calibrated item bank
� Administration software
Test Specifications
� Starting rule
� With item which provides maximum information
� At cut point
Test Specifications
� Stopping Rule
� Fixed length
� Variable length
� By Total Test/Subtest
� Calculated
� Specified precision of measure
� Specified confidence in a pass/fail decision
� Maximum item count
� Minimum item count
Adaptive Algorithm
� Person ability algorithm
� Item selection algorithm
� Test difficulty
� Maximum jump size
� Content issues
� Item exposure control
� Option to not allow same items to be used during
retesting
� Overlapping items (items that cue other items)
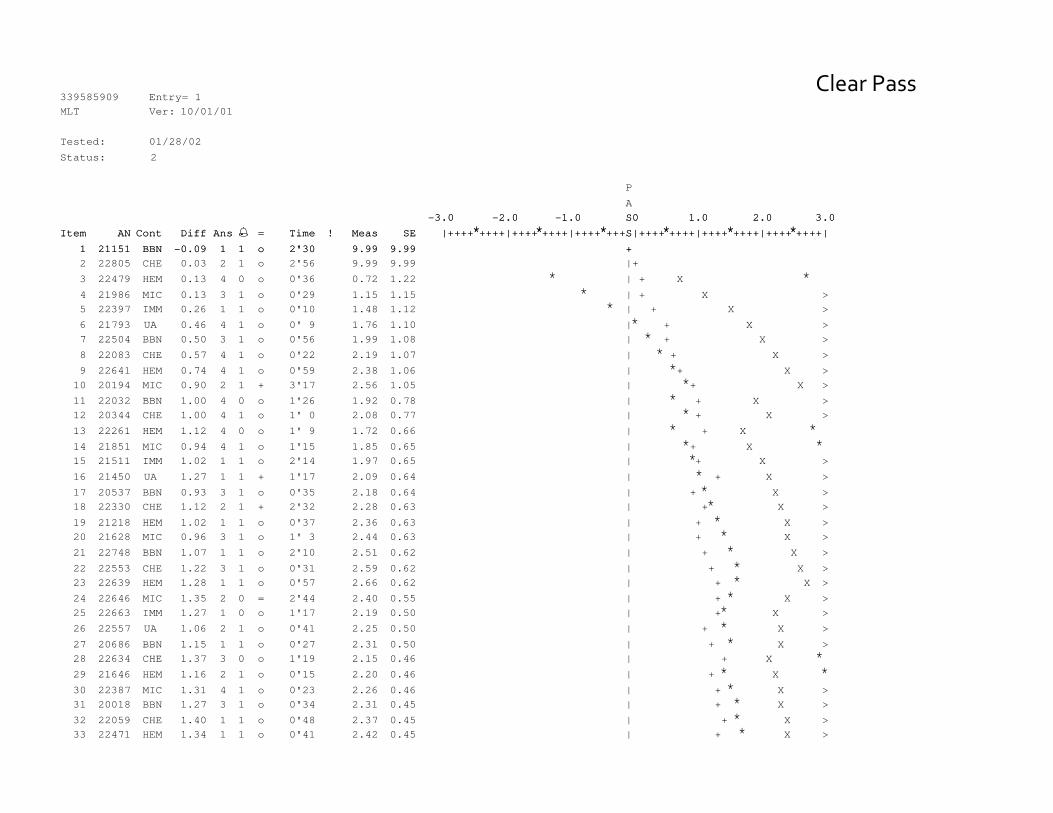
339585909 Entry= 1
MLT Ver: 10/01/01
Tested: 01/28/02
Status: 2
P
A
-3.0 -2.0 -1.0 S0 1.0 2.0 3.0
Item AN Cont Diff Ans � = Time ! Meas SE |++++*++++|++++*++++|++++*+++S|++++*++++|++++*++++|++++*++++| 1 21151 BBN -0.09 1 1 o 2'30 9.99 9.99 +
2 22805 CHE 0.03 2 1 o 2'56 9.99 9.99 |+
3 22479 HEM 0.13 4 0 o 0'36 0.72 1.22 * | + X * 4 21986 MIC 0.13 3 1 o 0'29 1.15 1.15 * | + X > 5 22397 IMM 0.26 1 1 o 0'10 1.48 1.12 * | + X > 6 21793 UA 0.46 4 1 o 0' 9 1.76 1.10 |* + X > 7 22504 BBN 0.50 3 1 o 0'56 1.99 1.08 | * + X > 8 22083 CHE 0.57 4 1 o 0'22 2.19 1.07 | * + X > 9 22641 HEM 0.74 4 1 o 0'59 2.38 1.06 | *+ X > 10 20194 MIC 0.90 2 1 + 3'17 2.56 1.05 | *+ X > 11 22032 BBN 1.00 4 0 o 1'26 1.92 0.78 | * + X > 12 20344 CHE 1.00 4 1 o 1' 0 2.08 0.77 | * + X > 13 22261 HEM 1.12 4 0 o 1' 9 1.72 0.66 | * + X * 14 21851 MIC 0.94 4 1 o 1'15 1.85 0.65 | *+ X * 15 21511 IMM 1.02 1 1 o 2'14 1.97 0.65 | *+ X > 16 21450 UA 1.27 1 1 + 1'17 2.09 0.64 | * + X > 17 20537 BBN 0.93 3 1 o 0'35 2.18 0.64 | + * X > 18 22330 CHE 1.12 2 1 + 2'32 2.28 0.63 | +* X > 19 21218 HEM 1.02 1 1 o 0'37 2.36 0.63 | + * X > 20 21628 MIC 0.96 3 1 o 1' 3 2.44 0.63 | + * X > 21 22748 BBN 1.07 1 1 o 2'10 2.51 0.62 | + * X > 22 22553 CHE 1.22 3 1 o 0'31 2.59 0.62 | + * X > 23 22639 HEM 1.28 1 1 o 0'57 2.66 0.62 | + * X > 24 22646 MIC 1.35 2 0 = 2'44 2.40 0.55 | + * X > 25 22663 IMM 1.27 1 0 o 1'17 2.19 0.50 | +* X > 26 22557 UA 1.06 2 1 o 0'41 2.25 0.50 | + * X > 27 20686 BBN 1.15 1 1 o 0'27 2.31 0.50 | + * X > 28 22634 CHE 1.37 3 0 o 1'19 2.15 0.46 | + X * 29 21646 HEM 1.16 2 1 o 0'15 2.20 0.46 | + * X * 30 22387 MIC 1.31 4 1 o 0'23 2.26 0.46 | + * X > 31 20018 BBN 1.27 3 1 o 0'34 2.31 0.45 | + * X > 32 22059 CHE 1.40 1 1 o 0'48 2.37 0.45 | + * X > 33 22471 HEM 1.34 1 1 o 0'41 2.42 0.45 | + * X >
-3.0 -2.0 -1.0 S0 1.0 2.0 3.0
Item AN Cont Diff Ans � = Time ! Meas SE |++++*++++|++++*++++|++++*+++S|++++*++++|++++*++++|++++*++++| 1 21151 BBN -0.09 1 1 o 2'30 9.99 9.99 +
Clear Pass
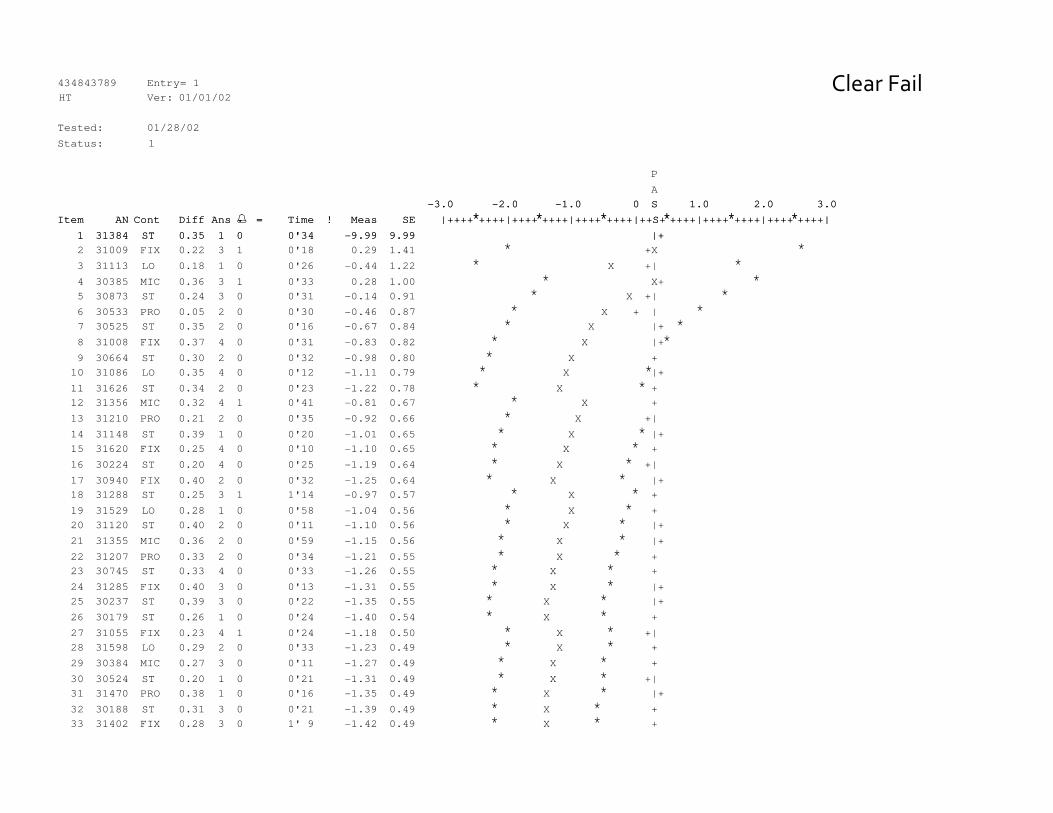
434843789 Entry= 1
HT Ver: 01/01/02
Tested: 01/28/02
Status: 1
P
A
-3.0 -2.0 -1.0 0 S 1.0 2.0 3.0
Item AN Cont Diff Ans � = Time ! Meas SE |++++*++++|++++*++++|++++*++++|++S+*++++|++++*++++|++++*++++| 1 31384 ST 0.35 1 0 0'34 -9.99 9.99 |+
2 31009 FIX 0.22 3 1 0'18 0.29 1.41 * +X * 3 31113 LO 0.18 1 0 0'26 -0.44 1.22 * X +| * 4 30385 MIC 0.36 3 1 0'33 0.28 1.00 * X+ * 5 30873 ST 0.24 3 0 0'31 -0.14 0.91 * X +| * 6 30533 PRO 0.05 2 0 0'30 -0.46 0.87 * X + | * 7 30525 ST 0.35 2 0 0'16 -0.67 0.84 * X |+ * 8 31008 FIX 0.37 4 0 0'31 -0.83 0.82 * X |+* 9 30664 ST 0.30 2 0 0'32 -0.98 0.80 * X + 10 31086 LO 0.35 4 0 0'12 -1.11 0.79 * X *|+ 11 31626 ST 0.34 2 0 0'23 -1.22 0.78 * X * + 12 31356 MIC 0.32 4 1 0'41 -0.81 0.67 * X + 13 31210 PRO 0.21 2 0 0'35 -0.92 0.66 * X +| 14 31148 ST 0.39 1 0 0'20 -1.01 0.65 * X * |+ 15 31620 FIX 0.25 4 0 0'10 -1.10 0.65 * X * + 16 30224 ST 0.20 4 0 0'25 -1.19 0.64 * X * +| 17 30940 FIX 0.40 2 0 0'32 -1.25 0.64 * X * |+ 18 31288 ST 0.25 3 1 1'14 -0.97 0.57 * X * + 19 31529 LO 0.28 1 0 0'58 -1.04 0.56 * X * + 20 31120 ST 0.40 2 0 0'11 -1.10 0.56 * X * |+ 21 31355 MIC 0.36 2 0 0'59 -1.15 0.56 * X * |+ 22 31207 PRO 0.33 2 0 0'34 -1.21 0.55 * X * + 23 30745 ST 0.33 4 0 0'33 -1.26 0.55 * X * + 24 31285 FIX 0.40 3 0 0'13 -1.31 0.55 * X * |+ 25 30237 ST 0.39 3 0 0'22 -1.35 0.55 * X * |+ 26 30179 ST 0.26 1 0 0'24 -1.40 0.54 * X * + 27 31055 FIX 0.23 4 1 0'24 -1.18 0.50 * X * +| 28 31598 LO 0.29 2 0 0'33 -1.23 0.49 * X * + 29 30384 MIC 0.27 3 0 0'11 -1.27 0.49 * X * + 30 30524 ST 0.20 1 0 0'21 -1.31 0.49 * X * +| 31 31470 PRO 0.38 1 0 0'16 -1.35 0.49 * X * |+ 32 30188 ST 0.31 3 0 0'21 -1.39 0.49 * X * + 33 31402 FIX 0.28 3 0 1' 9 -1.42 0.49 * X * +
-3.0 -2.0 -1.0 0 S 1.0 2.0 3.0
Item AN Cont Diff Ans � = Time ! Meas SE |++++*++++|++++*++++|++++*++++|++S+*++++|++++*++++|++++*++++| 1 31384 ST 0.35 1 0 0'34 -9.99 9.99 |+
Clear Fail
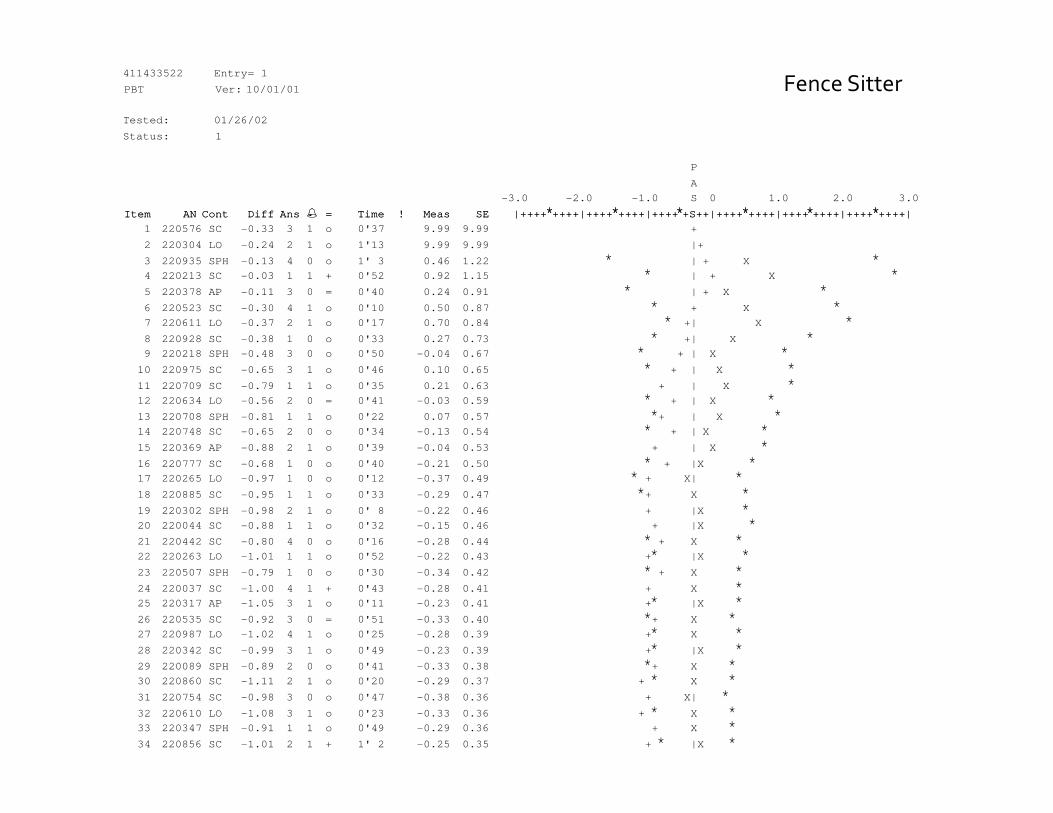
411433522 Entry= 1
PBT Ver: 10/01/01
Tested: 01/26/02
Status: 1
P
A
-3.0 -2.0 -1.0 S 0 1.0 2.0 3.0
Item AN Cont Diff Ans � = Time ! Meas SE |++++*++++|++++*++++|++++*+S++|++++*++++|++++*++++|++++*++++| 1 220576 SC -0.33 3 1 o 0'37 9.99 9.99 +
2 220304 LO -0.24 2 1 o 1'13 9.99 9.99 |+
3 220935 SPH -0.13 4 0 o 1' 3 0.46 1.22 * | + X * 4 220213 SC -0.03 1 1 + 0'52 0.92 1.15 * | + X * 5 220378 AP -0.11 3 0 = 0'40 0.24 0.91 * | + X * 6 220523 SC -0.30 4 1 o 0'10 0.50 0.87 * + X * 7 220611 LO -0.37 2 1 o 0'17 0.70 0.84 * +| X * 8 220928 SC -0.38 1 0 o 0'33 0.27 0.73 * +| X * 9 220218 SPH -0.48 3 0 o 0'50 -0.04 0.67 * + | X * 10 220975 SC -0.65 3 1 o 0'46 0.10 0.65 * + | X * 11 220709 SC -0.79 1 1 o 0'35 0.21 0.63 + | X * 12 220634 LO -0.56 2 0 = 0'41 -0.03 0.59 * + | X * 13 220708 SPH -0.81 1 1 o 0'22 0.07 0.57 *+ | X * 14 220748 SC -0.65 2 0 o 0'34 -0.13 0.54 * + | X * 15 220369 AP -0.88 2 1 o 0'39 -0.04 0.53 + | X * 16 220777 SC -0.68 1 0 o 0'40 -0.21 0.50 * + |X * 17 220265 LO -0.97 1 0 o 0'12 -0.37 0.49 * + X| * 18 220885 SC -0.95 1 1 o 0'33 -0.29 0.47 *+ X * 19 220302 SPH -0.98 2 1 o 0' 8 -0.22 0.46 + |X * 20 220044 SC -0.88 1 1 o 0'32 -0.15 0.46 + |X * 21 220442 SC -0.80 4 0 o 0'16 -0.28 0.44 * + X * 22 220263 LO -1.01 1 1 o 0'52 -0.22 0.43 +* |X * 23 220507 SPH -0.79 1 0 o 0'30 -0.34 0.42 * + X * 24 220037 SC -1.00 4 1 + 0'43 -0.28 0.41 + X * 25 220317 AP -1.05 3 1 o 0'11 -0.23 0.41 +* |X * 26 220535 SC -0.92 3 0 = 0'51 -0.33 0.40 *+ X * 27 220987 LO -1.02 4 1 o 0'25 -0.28 0.39 +* X * 28 220342 SC -0.99 3 1 o 0'49 -0.23 0.39 +* |X * 29 220089 SPH -0.89 2 0 o 0'41 -0.33 0.38 *+ X * 30 220860 SC -1.11 2 1 o 0'20 -0.29 0.37 + * X * 31 220754 SC -0.98 3 0 o 0'47 -0.38 0.36 + X| * 32 220610 LO -1.08 3 1 o 0'23 -0.33 0.36 + * X * 33 220347 SPH -0.91 1 1 o 0'49 -0.29 0.36 + X * 34 220856 SC -1.01 2 1 + 1' 2 -0.25 0.35 + * |X *
Item AN Cont Diff Ans � = Time ! Meas SE |++++*++++|++++*++++|++++*+S++|++++*++++|++++*++++|++++*++++|
Fence Sitter

Item Meas SE0 10 20 30 40 50 60 70 80 90 100
GP1 – I have a lack of energy
1
Simulate Measure = 48
0= Very Much 1= Quite a Bit 2= Somewhat 3= A Little Bit 4= Not at All
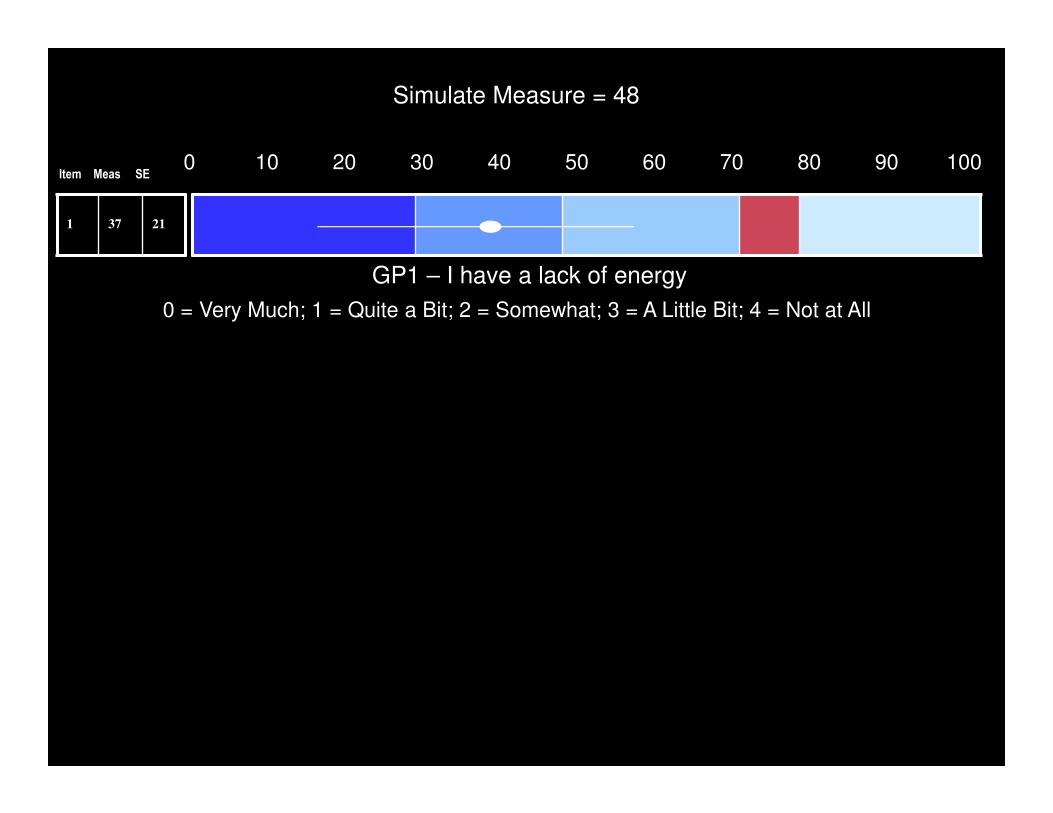
Item Meas SE0 10 20 30 40 50 60 70 80 90 100
1 37 21
Simulate Measure = 48
GP1 – I have a lack of energy
0 = Very Much; 1 = Quite a Bit; 2 = Somewhat; 3 = A Little Bit; 4 = Not at All
�
�
�
�
�
�
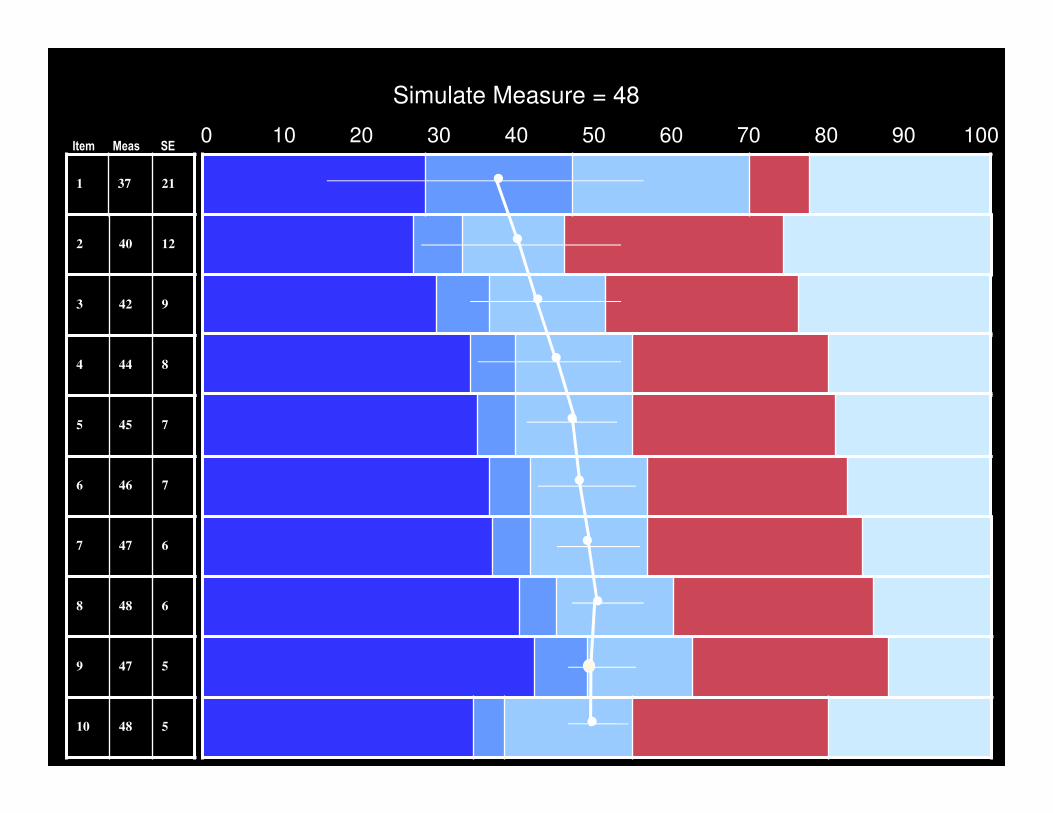
Simulate Measure = 48
�
�
�
0 10 20 30 40 50 60 70 80 90 100
1 37 21
2 40 12
3 42 9
4 44 8
5 45 7
6 46 7
7 47 6
8 48 6
9 47 5
10 48 5
Item Meas SE
�
�
�
�
�
�
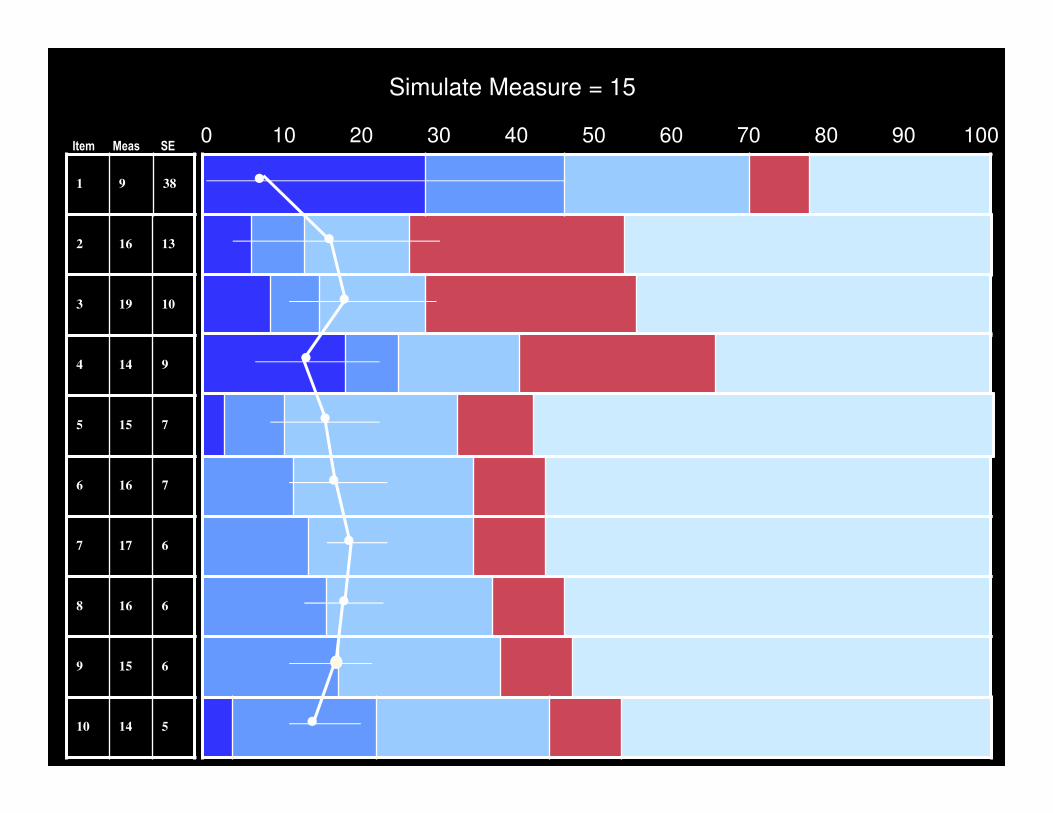
Simulate Measure = 15
�
�
�
0 10 20 30 40 50 60 70 80 90 100
1 9 38
2 16 13
3 19 10
4 14 9
5 15 7
6 16 7
7 17 6
8 16 6
9 15 6
10 14 5
Item Meas SE
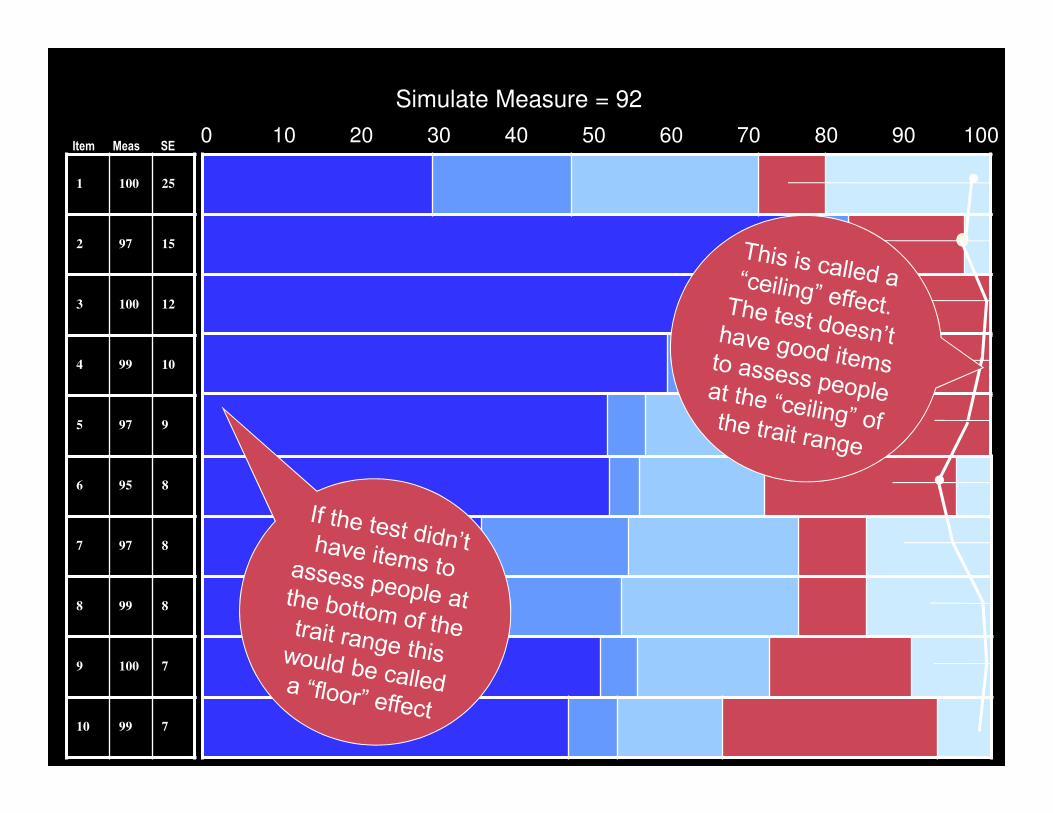
�
�
Simulate Measure = 92
0 10 20 30 40 50 60 70 80 90 100
1 100 25
2 97 15
3 100 12
4 99 10
5 97 9
6 95 8
7 97 8
8 99 8
9 100 7
10 99 7
Item Meas SE


![[IRT] Item Response Theory Reference Manual](https://img.pdfslide.us/doc/110x75/5879ee1c1a28ab82408bc4f0/irt-item-response-theory-reference-manual.jpg)


![[IRT] Item Response Theory - Survey Design](https://img.pdfslide.us/doc/110x75/6215d6629ffc9d5ad40f105b/irt-item-response-theory-survey-design.jpg)