Embed Size (px)
Citation preview
ITEM NO. 9
1
Meeting Date: February 12, 2019 Department: Finance Submitted By: Betsy Howze, Finance Director Prepared By: Betsy Howze, Finance Director Agenda Title: Accept the Fiscal Year 2017-18 Comprehensive Annual Financial
Report, Proposition 4 Article XIII-B (GANN) Limit Agreed-Upon Procedures Report for Fiscal Year 2018-19 and Authorize the Finance Director to Appropriate Certain Assigned Fund Balances
RECOMMENDED ACTION: Accept the Fiscal Year 2017-18 Comprehensive Annual Financial Report (CAFR), Proposition 4 Article XIII-B (GANN) Limit Agreed-Upon Procedures Report for FY 2018-19, and authorize the Finance Director to appropriate certain Assigned Fund Balances.
CAFR BACKGROUND: The financial records of the City of Rohnert Park are subject to an annual independent audit, which is currently performed by Macias Gini & O’Connell LLC. The audit is required to be performed in conformance with auditing standards generally accepted in the United States (GAAP), by an independent certified public accounting (CPA) firm. The audit includes a comprehensive review of the financial records and the internal control procedures in place which safeguard the City’s assets.
The Finance Department facilitated the annual audit, and requests the City Council’s acceptance of the CAFR. The CAFR includes the financial statements for the City, the Rohnert Park Foundation, and the Rohnert Park Financing Authority, a legally separate component unit for which the City Council maintains fiscal accountability.
ANALYSIS: The Independent Auditor’s Report contained in the CAFR (page F-1) indicates that the financial statements present fairly in all material respects the financial position of the City as of June 30, 2018. This opinion is considered “clean” or “unmodified,” which means that the financial records reflect appropriately the financial activity of FY 2017-18.
The Government Finance Officers Association (GFOA) is the widely-recognized “best practice” body for governmental accounting, auditing and financial reporting. Each year the CAFR is submitted to the GFOA award program for review in order to potentially receive a Certificate of Achievement for Excellence in Financial Reporting for the prior year’s financial report. The City of Rohnert Park has received this award for the last 36 years, and we anticipate the City will be successful in attaining the award for FY 2017-18.
Mission Statement “We Care for Our Residents by Working Together to Build a
Better Community for Today and Tomorrow.”
CITY OF ROHNERT PARK CITY COUNCIL AGENDA REPORT
ITEM NO. 9
2
The Introductory Section of the CAFR, while not audited, relays general information on the City’s structure and personnel as well as information useful in assessing the City’s financial condition. This is accomplished through the “Letter of Transmittal” and other documents such as Principal Officers, Boards and Commissions and an organizational chart of the City.
The Financial Section of the CAFR begins with the auditor’s report and opinion on the financial statements of the City. This is followed by the “Management Discussion and Analysis” where management introduces the basic financial statements and provides an analytical overview of the City’s financial activity. The basic financial statements include the financial schedules and notes, where descriptions of the accounting and finance-related policies, and underlying amounts presented in the basic financial statements are found. This section concludes with other required and supplementary information as necessary.
The Statistical Section of the CAFR, while not audited, provides financial trends, revenue and debt capacity information, and other economic and operating information useful for determining the overall financial health of the City.
Significant and successful efforts were made by Finance Department staff to close the books, provide information to the auditors, update statistical information, and facilitate the peer review work of the GFOA.
The City of Rohnert Park CAFR is available for review under the Finance Department on the City’s website at:
http://www.rpcity.org/cms/one.aspx?pageId=3344163 PROPOSITION 4 ARTICLE XIII-B APPROPRIATION (GANN) LIMITS AGREED-UPON PROCEEDURES: On June 12, 2018, Council by Resolution 2018-077 adopted the City’s Proposition 4, Article XIII B calculation for the FY 2018-19 Budget. In general, the article limits annual appropriations of the City to the level of appropriations for the FY 1978-79 base year, adjusted for changes in the cost of living, population, and other specified factors. The GANN budget appropriations for FY 2018-19 are limited to $53,656,270 based on Finance’s calculations using the Proposition’s parameters. The budgeted appropriations subject to the limit are $22,876,420, well within the allowable limits.
Macias Gini & O’Connell LLC, reviewed the City’s calculation using Agreed-Upon Procedures, and found no exceptions.
STRATEGIC PLAN ALIGNMENT: Goal B of our strategic plan calls for us to Achieve and Maintain Financial Stability. The annual audit is an integral part of this goal. It ensures that the City’s financial position is presented fairly and accurately.
ITEM NO. 9
3
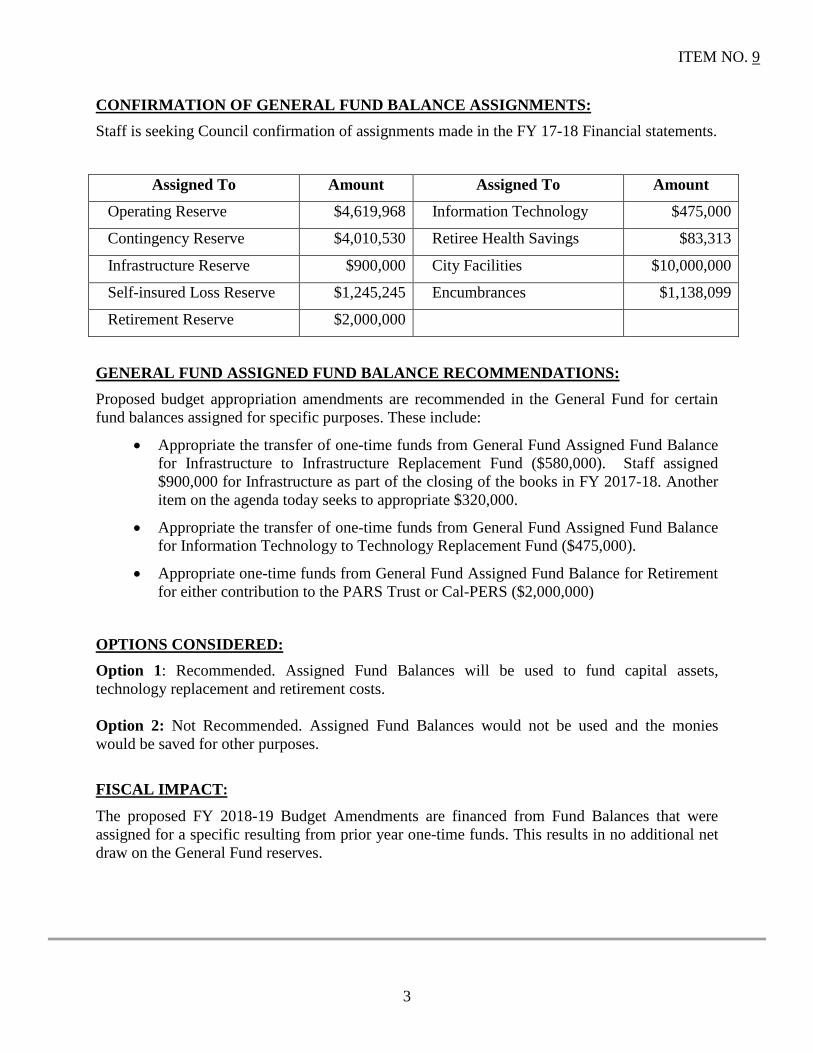
CONFIRMATION OF GENERAL FUND BALANCE ASSIGNMENTS: Staff is seeking Council confirmation of assignments made in the FY 17-18 Financial statements.
Assigned To Amount Assigned To Amount
Operating Reserve $4,619,968 Information Technology $475,000
Contingency Reserve $4,010,530 Retiree Health Savings $83,313
Infrastructure Reserve $900,000 City Facilities $10,000,000
Self-insured Loss Reserve $1,245,245 Encumbrances $1,138,099
Retirement Reserve $2,000,000
GENERAL FUND ASSIGNED FUND BALANCE RECOMMENDATIONS: Proposed budget appropriation amendments are recommended in the General Fund for certain fund balances assigned for specific purposes. These include:
• Appropriate the transfer of one-time funds from General Fund Assigned Fund Balance for Infrastructure to Infrastructure Replacement Fund ($580,000). Staff assigned $900,000 for Infrastructure as part of the closing of the books in FY 2017-18. Another item on the agenda today seeks to appropriate $320,000.
• Appropriate the transfer of one-time funds from General Fund Assigned Fund Balance for Information Technology to Technology Replacement Fund ($475,000).
• Appropriate one-time funds from General Fund Assigned Fund Balance for Retirement for either contribution to the PARS Trust or Cal-PERS ($2,000,000)
OPTIONS CONSIDERED: Option 1: Recommended. Assigned Fund Balances will be used to fund capital assets, technology replacement and retirement costs. Option 2: Not Recommended. Assigned Fund Balances would not be used and the monies would be saved for other purposes.
FISCAL IMPACT:
The proposed FY 2018-19 Budget Amendments are financed from Fund Balances that were assigned for a specific resulting from prior year one-time funds. This results in no additional net draw on the General Fund reserves.
ITEM NO. 9
4
Department Head Approval Date: 02/05/19 Finance Director Approval Date: 02/05/19 City Attorney Approval Date: N/A City Manager Approval Date: 02/05/19 Attachments (list in packet assembly order):
1. Resolution 2. FY 2017-18 CAFR 3. FY 2018-19 Proposition 4 Article XIII-B (GANN) Limit Agreed-Upon Procedures
Report
RESOLUTION NO. 2019-017
A RESOLUTION OF THE CITY COUNCIL OF THE CITY OF ROHNERT PARK AUTHORIZING AND APPROVING THE DIRECTOR OF FINANCE TO
INCREASE APPROPRIATION FOR FY 2018-19 TO TRANSFER ASSIGNED FUND BALANCES
WHEREAS, the City Council of the City of Rohnert Park adopted the FY 2018-19
Budget on June 12, 2018; and, WHEREAS, the City Council has the authority to amend the budget; and, WHEREAS, the City has made assignments of Fund Balances available at the end of FY
2017-18 for specific purposes; and WHEREAS, the City Council has concurred with those assignments and desires to
transfer the funds in accordance with the assigned purposes. NOW, THEREFORE, BE IT RESOLVED by the City Council of the City of Rohnert
Park that the foregoing recitals are true and correct and that it does hereby authorize and approve the Finance Director to increase appropriations for FY 2018-19 from Assigned Fund Balance for Infrastructure ($580,000), Information Technology ($475,000) and Retirement ($2,000,000).
BE IT FURTHER RESOLVED that the Director of Finance is authorized to make any administrative adjustments necessary to process the amendments in accordance with generally accepted accounting principles.
DULY AND REGULARLY ADOPTED this 12th day of February 2019.
CITY OF ROHNERT PARK ____________________________________ Gina Belforte, Mayor ATTEST: _____________________________ JoAnne M. Buergler, City Clerk
ADAMS: _________ MACKENZIE: _________ STAFFORD: _________ CALLINAN: _________ BELFORTE: _________ AYES: ( ) NOES: ( ) ABSENT: ( ) ABSTAIN: ( )
FOR THE FISCAL YEAR ENDED JUNE 30, 2018
City of
Rohnert ParkCOMPREHENSIVE ANNUAL
FINANCIAL REPORT
“We Care for Our Residents by Working Together to Build a Better Community
for Today and Tommorrow”
CITY OF ROHNERT PARK, CALIFORNIA
Comprehensive Annual Financial Report
Fiscal Year Ended June 30, 2018
Prepared by
Finance Department
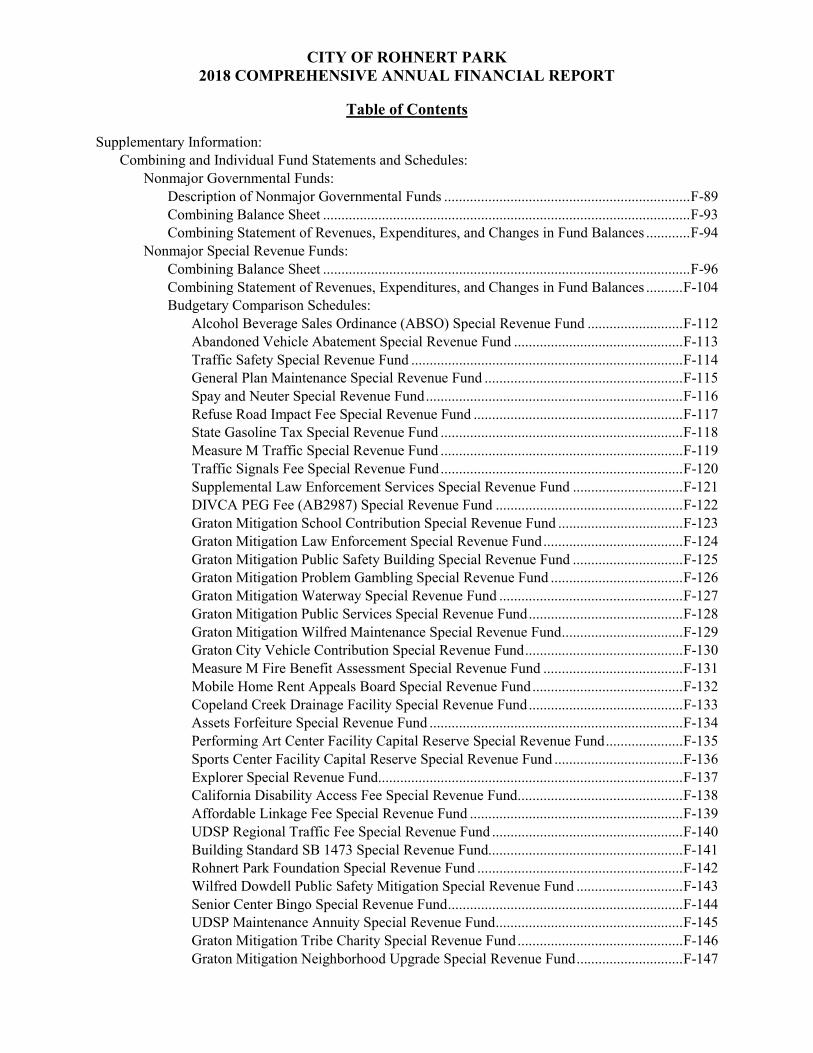
CITY OF ROHNERT PARK 2018 COMPREHENSIVE ANNUAL FINANCIAL REPORT
Table of Contents
INTRODUCTORY SECTION Letter of Transmittal ...................................................................................................................................I-1 GFOA Certificate of Achievement for Excellence in Financial Reporting ................................................I-6 List of City Officials ...................................................................................................................................I-7 Organizational Chart ...................................................................................................................................I-8 FINANCIAL SECTION Independent Auditor's Report .................................................................................................................... F-1 Management’s Discussion and Analysis (Required Supplementary Information) (unaudited) ................. F-3 Basic Financial Statements:
Government-wide Financial Statements: Statement of Net Position ........................................................................................................... F-17 Statement of Activities ................................................................................................................ F-18
Fund Financial Statements: Governmental Funds:
Balance Sheet ....................................................................................................................... F-20 Reconciliation of the Governmental Funds Balance Sheet to the Government-
Wide Statement of Net Position – Governmental Activities ......................................... F-23 Statement of the Revenues, Expenditures, and Changes in Fund Balances ......................... F-24 Reconciliation of the Statement of Revenues, Expenditures, and Changes in Fund
Balances of Governmental Funds to the Government-Wide Statement of Activities – Governmental Activities ............................................................................. F-26
Proprietary Funds: Statement of Fund Net Position ............................................................................................ F-27 Statement of Revenues, Expenses, and Changes in Fund Net Position ............................... F-28 Statement of Cash Flows ...................................................................................................... F-29
Fiduciary Funds: Statement of Fiduciary Net Position..................................................................................... F-30 Statement of Changes in Fiduciary Net Position .................................................................. F-31
Notes to the Basic Financial Statements ........................................................................................... F-33 Required Supplementary Information (unaudited):
Schedule of Changes in Net Pension Liability and Related Ratios – Miscellaneous Plan ................ F-74 Schedule of Proportionate Share of the Net Pension Liability – Safety Plans .................................. F-75 Schedule of Pension Plans Contributions .......................................................................................... F-76 Schedule of Changes in Net OPEB Liability and Related Ratios ..................................................... F-77 Schedule of OPEB Plan Contributions .............................................................................................. F-78 Budgetary Comparison Schedules:
General Fund ............................................................................................................................... F-79 Housing Projects Special Revenue Fund .................................................................................... F-82 Public Facility Finance Fee Special Revenue Fund .................................................................... F-83 Graton Mitigation Supplemental Special Revenue Fund ............................................................ F-84
Note to Required Supplementary Information .................................................................................. F-85
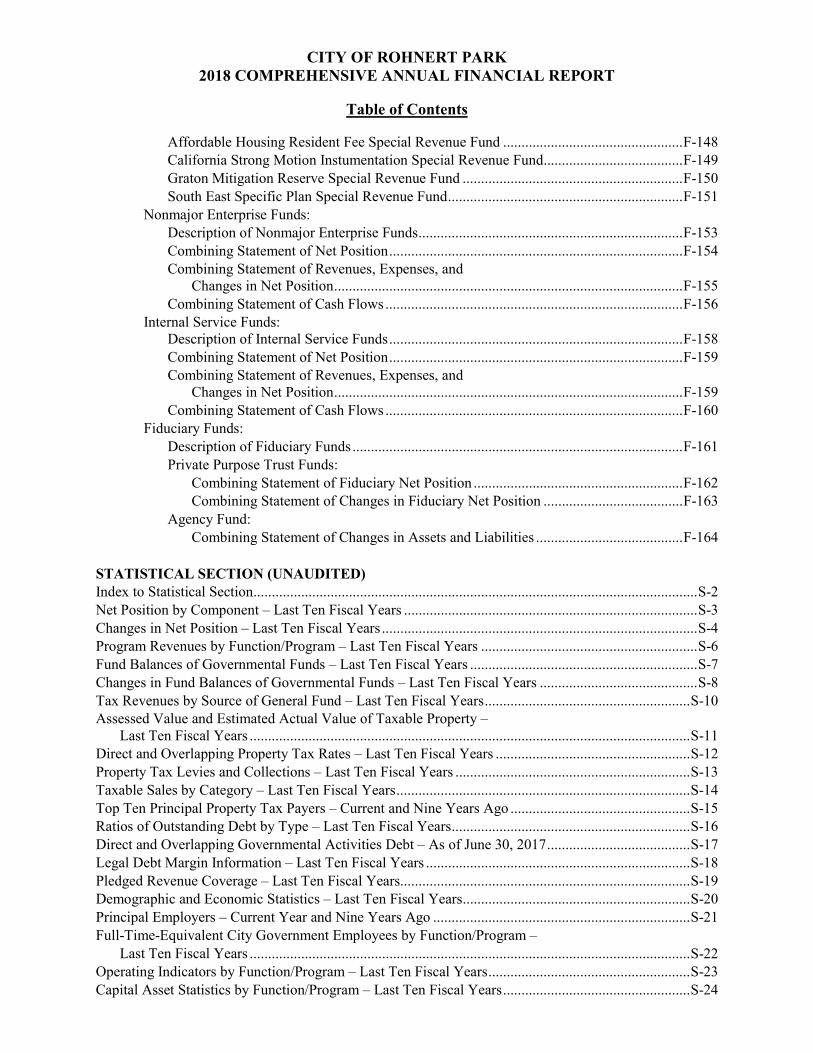
CITY OF ROHNERT PARK 2018 COMPREHENSIVE ANNUAL FINANCIAL REPORT
Table of Contents
Supplementary Information: Combining and Individual Fund Statements and Schedules:
Nonmajor Governmental Funds: Description of Nonmajor Governmental Funds ................................................................... F-89 Combining Balance Sheet .................................................................................................... F-93 Combining Statement of Revenues, Expenditures, and Changes in Fund Balances ............ F-94
Nonmajor Special Revenue Funds: Combining Balance Sheet .................................................................................................... F-96 Combining Statement of Revenues, Expenditures, and Changes in Fund Balances .......... F-104 Budgetary Comparison Schedules:
Alcohol Beverage Sales Ordinance (ABSO) Special Revenue Fund .......................... F-112 Abandoned Vehicle Abatement Special Revenue Fund .............................................. F-113 Traffic Safety Special Revenue Fund .......................................................................... F-114 General Plan Maintenance Special Revenue Fund ...................................................... F-115 Spay and Neuter Special Revenue Fund ...................................................................... F-116 Refuse Road Impact Fee Special Revenue Fund ......................................................... F-117 State Gasoline Tax Special Revenue Fund .................................................................. F-118 Measure M Traffic Special Revenue Fund .................................................................. F-119 Traffic Signals Fee Special Revenue Fund .................................................................. F-120 Supplemental Law Enforcement Services Special Revenue Fund .............................. F-121 DIVCA PEG Fee (AB2987) Special Revenue Fund ................................................... F-122 Graton Mitigation School Contribution Special Revenue Fund .................................. F-123 Graton Mitigation Law Enforcement Special Revenue Fund ...................................... F-124 Graton Mitigation Public Safety Building Special Revenue Fund .............................. F-125 Graton Mitigation Problem Gambling Special Revenue Fund .................................... F-126 Graton Mitigation Waterway Special Revenue Fund .................................................. F-127 Graton Mitigation Public Services Special Revenue Fund .......................................... F-128 Graton Mitigation Wilfred Maintenance Special Revenue Fund ................................. F-129 Graton City Vehicle Contribution Special Revenue Fund ........................................... F-130 Measure M Fire Benefit Assessment Special Revenue Fund ...................................... F-131 Mobile Home Rent Appeals Board Special Revenue Fund ......................................... F-132 Copeland Creek Drainage Facility Special Revenue Fund .......................................... F-133 Assets Forfeiture Special Revenue Fund ..................................................................... F-134 Performing Art Center Facility Capital Reserve Special Revenue Fund ..................... F-135 Sports Center Facility Capital Reserve Special Revenue Fund ................................... F-136 Explorer Special Revenue Fund ................................................................................... F-137 California Disability Access Fee Special Revenue Fund ............................................. F-138 Affordable Linkage Fee Special Revenue Fund .......................................................... F-139 UDSP Regional Traffic Fee Special Revenue Fund .................................................... F-140 Building Standard SB 1473 Special Revenue Fund..................................................... F-141 Rohnert Park Foundation Special Revenue Fund ........................................................ F-142 Wilfred Dowdell Public Safety Mitigation Special Revenue Fund ............................. F-143 Senior Center Bingo Special Revenue Fund ................................................................ F-144 UDSP Maintenance Annuity Special Revenue Fund ................................................... F-145 Graton Mitigation Tribe Charity Special Revenue Fund ............................................. F-146 Graton Mitigation Neighborhood Upgrade Special Revenue Fund ............................. F-147
CITY OF ROHNERT PARK 2018 COMPREHENSIVE ANNUAL FINANCIAL REPORT
Table of Contents
Affordable Housing Resident Fee Special Revenue Fund ................................................. F-148 California Strong Motion Instumentation Special Revenue Fund ...................................... F-149 Graton Mitigation Reserve Special Revenue Fund ............................................................ F-150 South East Specific Plan Special Revenue Fund ................................................................ F-151
Nonmajor Enterprise Funds: Description of Nonmajor Enterprise Funds ........................................................................ F-153 Combining Statement of Net Position ................................................................................ F-154 Combining Statement of Revenues, Expenses, and
Changes in Net Position ............................................................................................... F-155 Combining Statement of Cash Flows ................................................................................. F-156
Internal Service Funds: Description of Internal Service Funds ................................................................................ F-158 Combining Statement of Net Position ................................................................................ F-159 Combining Statement of Revenues, Expenses, and
Changes in Net Position ............................................................................................... F-159 Combining Statement of Cash Flows ................................................................................. F-160
Fiduciary Funds: Description of Fiduciary Funds .......................................................................................... F-161 Private Purpose Trust Funds:
Combining Statement of Fiduciary Net Position ......................................................... F-162 Combining Statement of Changes in Fiduciary Net Position ...................................... F-163
Agency Fund: Combining Statement of Changes in Assets and Liabilities ........................................ F-164
STATISTICAL SECTION (UNAUDITED) Index to Statistical Section ......................................................................................................................... S-2 Net Position by Component – Last Ten Fiscal Years ................................................................................ S-3 Changes in Net Position – Last Ten Fiscal Years ...................................................................................... S-4 Program Revenues by Function/Program – Last Ten Fiscal Years ........................................................... S-6 Fund Balances of Governmental Funds – Last Ten Fiscal Years .............................................................. S-7 Changes in Fund Balances of Governmental Funds – Last Ten Fiscal Years ........................................... S-8 Tax Revenues by Source of General Fund – Last Ten Fiscal Years ........................................................ S-10 Assessed Value and Estimated Actual Value of Taxable Property –
Last Ten Fiscal Years ........................................................................................................................ S-11 Direct and Overlapping Property Tax Rates – Last Ten Fiscal Years ..................................................... S-12 Property Tax Levies and Collections – Last Ten Fiscal Years ................................................................ S-13 Taxable Sales by Category – Last Ten Fiscal Years ................................................................................ S-14 Top Ten Principal Property Tax Payers – Current and Nine Years Ago ................................................. S-15 Ratios of Outstanding Debt by Type – Last Ten Fiscal Years ................................................................. S-16 Direct and Overlapping Governmental Activities Debt – As of June 30, 2017 ....................................... S-17 Legal Debt Margin Information – Last Ten Fiscal Years ........................................................................ S-18 Pledged Revenue Coverage – Last Ten Fiscal Years............................................................................... S-19 Demographic and Economic Statistics – Last Ten Fiscal Years .............................................................. S-20 Principal Employers – Current Year and Nine Years Ago ...................................................................... S-21 Full-Time-Equivalent City Government Employees by Function/Program – Last Ten Fiscal Years ........................................................................................................................ S-22 Operating Indicators by Function/Program – Last Ten Fiscal Years ....................................................... S-23 Capital Asset Statistics by Function/Program – Last Ten Fiscal Years ................................................... S-24

This page is left intentionally blank.
130 Avram Avenue Rohnert Park CA 94928 (707) 588-2226 Fax (707) 794-9248
www.rpcity.org
City Council
Pam Stafford Mayor
Joseph Callinan
Vice Mayor
Amy O. Ahanotu Gina Belforte
Jake Mackenzie Councilmembers
________________
Darrin Jenkins City Manager
Don Schwartz
Assistant City Manager
Michelle Marchetta Kenyon City Attorney
Karen Murphy
Assistant City Attorney
JoAnne Buergler City Clerk
Betsy Howze
Finance Director
Brian Masterson Director of Public Safety
John McArthur
Director of Public Works and Community Services
Mary Grace Pawson
Director of Development Services
Victoria Perrault
Human Resources Director
December 27, 2018 Members of the City Council, and Citizens of the City of Rohnert Park: The Comprehensive Annual Financial Report (CAFR) of the City of Rohnert Park for the fiscal year 2017-18 is hereby submitted. This report was prepared by the Finance Department, which is responsible for both the accuracy of the presented data and the completeness and fairness of the presentation, including all disclosures. To the best of our knowledge and belief the data, as presented, is accurate in all material aspects and presented in a manner designed to fairly set forth the financial position and changes in financial position of the City as measured by the financial activity of its various funds, and that all disclosures necessary to enable the reader to gain the maximum understanding of the City’s financial affairs have been included. The City has prepared the CAFR using the financial reporting requirements as prescribed by the Governmental Accounting Standards Board (GASB) Statement No. 34, Basic Financial Statements – Management’s Discussion and Analysis – for State and Local Governments. This GASB Statement requires that management provide a narrative introduction, overview and analysis to accompany the basic financial statements in the form of a Management’s Discussion and Analysis (MD&A). This letter of transmittal is designed to complement the MD&A and should be read in conjunction with it. The MD&A can be found immediately following the report of the independent auditors. THE REPORTING ENTITY The CAFR includes the funds of the primary government, which includes several enterprise activities, as well as all of its component units. Component units include legally separate entities for which the primary government is financially accountable and that have substantially the same board as the City or provide services entirely to the City. Accordingly, the Rohnert Park Financing Authority's and the City of Rohnert Park Foundation financial information is blended with the City's information in this report. The City was incorporated in August 1962. The City has a council-manager form of government. Five persons are elected by popular vote to serve four-year terms on the City Council. Elections are held every two years. The Mayor is separately elected to a one-year term by members of the City Council from among the City Council members. The Mayor acts as the presiding officer of the City Council. Policies established by the City Council are implemented through the office of the City Manager.
ECONOMIC CONDITION AND OUTLOOK
The City is located in beautiful Sonoma County, approximately forty-five miles north of San Francisco on US Highway 101. It is home to approximately 43,600 people, Sonoma State University, the Green Music Center and the award winning Foxtail Golf Course. A neighboring government, the Federated Indians of the Graton Rancheria (Tribe) opened a casino in November 2013. As one of the first planned communities, Rohnert Park enjoys the benefits of a coordinated system of bike trails and paths, schools and parks in every neighborhood.
More than 50 restaurants including all the best national chains offer diners the flavors they crave. Residents enjoy sweeping views of Sonoma and Taylor Mountains, preserved from development forever. Rohnert Park is just minutes from popular tourism venues including hundreds of local wineries, the Pacific Ocean, and giant redwoods.
Sonoma County is an attractive international destination and outdoor recreational mecca, with wine related products, specialty foods, wellness programs and spa experiences. The close proximity to major Bay Area attractions will continue to support tourist traffic.
Sonoma County’s economy continues to see positive signs of economic recovery. All of the primary sectors are expected to experience modest growth. The unemployment is 3.0 percent; sales tax revenues remain strong; hotel occupancy and room rates have increased; and property tax revenue is higher than pre-recession levels. Future growth will be attributable to Sonoma County being an attractive international destination, with close proximity to major Bay Area attractions that are a draw for many tourists.
LONG-TERM FINANCIAL PLANNING/POLICIES
Long-term financial planning is an integral part of the City’s fiscal management. For the General Fund, the City has a 10 year financial forecast model that is used to develop the City’s budget. It also is invaluable in helping the City to identify future resources and any downward trends in major revenue sources or increases in expenditures. For example the City is facing large increase in pension costs over the next several year. By using the financial model the City has successfully identified ways to mitigate these increase. The City also does 5 year financial forecasts for the Water and Sewer Enterprises, including capital projects, as part of a periodic review and monitoring service rates.
In FY17-18 the City adopted a Financial Crisis Response Plan. The plan identifies several level 1 and level 2 key economic factors with quantified triggers to provide an early warning to the City of a possible fiscal crisis. These economic factors are monitored during the year and if a fiscal crisis is imminent, the City has level 1 and level 2 responses that will be implemented.
The City has a Debt Management Policy which has guided FY 17-18 debt payoffs and refundings. The City has several General Fund reserve polices that set monies aside for operating and contingency reserves in the event of an economic down turn or disaster, such as FY 17-18 wildfires in Sonoma County. The City has also set aside monies for maintaining infrastructure, vehicle replacement and technology upgrades. More recently the City established a reserve policy for the Graton Casino Mitigation Special Revenue Funds. The City receives mitigation funds from the Graton Casino, and the City has set aside a portion of the funds to guard against cash flow interruptions due to unanticipated changes to Casino mitigation revenue.
MAJOR INITIATIVES
For the Current Year
The City utilizes an annually updated Strategic Plan for the City of Rohnert Park to guide its work plan. The strategic plan provides a comprehensive framework which includes vision, mission, values, accomplishments, best practices and a detailed Action Plan.
For the fifth consecutive year the City adopted a balanced budget where total sources exceeded total uses without spending down General Fund balance. This continues the City’s journey toward improved financial sustainability.
The Rohnert Park Department of Public Safety serves the citizens of Rohnert Park by performing both Police and Fire functions. The Officers are trained as both police officers and firefighters as an effective way to provide a quick response to either structure fires or a crime event.
The Public Works and Community Services Department is a full-service department that is responsible for the construction, operation, maintenance, and repair of most of the City’s infrastructure, facilities and community programs. In addition to performing regularly assigned duties, staff responds to over 5,000 citizen requests each year and responds to a variety of system problems and emergencies 24 hours per day, 7 days per week. The Department is organized by function into three distinct divisions: Utilities, General Services, and Community Services.
The Utilities Division consists of potable water, sewer, recycled water, and drainage systems. Most utility system functions are heavily regulated where many day-to-day functions are mandated. This division is staffed at a minimum of five days a week but is also monitored 24-7 through the City’s computer-controlled wireless network.
The General Services Division consists of streets, buildings, fleet, and parks maintenance. This division is also responsible for the implementation of components of the City’s Greenhouse Gas Action Plan and the administration of the Foxtail Golf Course lease agreement.
The Community Services Division operates several major City facilities including: Callinan Sports & Fitness Center, four community centers, Senior Center, pottery studio as well as several parks, community gardens, dog parks, athletic fields, tennis courts, and three swimming pools. Community Services staff also either run or oversee several youth and adult programs, sports leagues, classes, and community events. The Spreckels Performing Arts Center produces critically acclaimed Broadway style musical performances in a City owned theatre.
The Development Services Department manages land and building development from concept to completion; maintains and implements the City’s General Plan and Zoning Code; plans and builds Rohnert Park’s infrastructure; plans for Rohnert Park’s physical and resource needs by working with local, regional and state agencies to ensure that there is enough water supply and sewer treatment for Rohnert Park citizens and businesses now and in the future; and ensures safe structures and physically attractive neighborhoods by enforcing the California Building Standards Code. In FY 17-18, the Department’s major initiatives included launching the General Plan update to guide the community’s vision for Rohnert Park over the next 20 years; processing entitlements for the Station Avenue Planned Development, from which the long-anticipated Downtown will spring; approving permits for a new hotel and apartments at the former Stadium Lands; and reconstructing Keiser Avenue to support both new and existing development on the east side of town. Production of single-family homes continues at both the University District and the Southeast Specific Plan, adding to much-needed housing stock for the region.
For the Future
Rohnert Park is home to some of the region’s most affordable, high-quality commercial space. Economic development efforts are focused on stimulating interest in locating to Rohnert Park. Recently, several companies have moved to the former Agilent site, now known as SOMO Village.
Tourism is a key industry in Rohnert Park, contributing significantly to the tax base. The City partners with the Chamber of Commerce and the Sonoma County Tourism Bureau to promote Rohnert Park as a destination. Rohnert Park has eight hotels/motels which provide over 1,000 rooms, and plans to attract more hotels in the near future. The largest property is the Doubletree Hotel, which offers convention and meeting facilities. Oxford Inn & Suites opened in July of 2017 adding additional mid-scale rooms to Rohnert Park’s hotel inventory. The upscale Cambria Hotel, which pulled building permits in spring 2018, will further diversify our visitors’ lodging choices.
Rohnert Park offers a number of amenities for the traveler, including two 18-hole golf courses, a Performing Arts Center, and a strong base of dining experiences. The Green Music Center at Sonoma State University includes a world-class concert hall to showcase music and provides education programs year-round. The music center attracts visitors from within the region and nationwide, due to the quality of the concert experience.
The City’s implementation of the 2020 General Plan will shortly dovetail into the next 20-year planning horizon of the 2040 Rohnert Park General Plan. The 2040 General Plan considers this partial list of implications for the City’s future:
In 2000, Rohnert Park residents voted to approve Measure N, Urban Growth Boundary (UGB), whichlimits future development to within the UGB to prevent sprawl and promote efficient and orderly growthpatterns, stability and certainty in long-term planning, a well-designed mix of uses, and adequate andefficient delivery of public services and facilities. The UGB will be up for renewal in 2020.
The mix of commercial, industrial, and office uses seen along Highway 101 have been influenced bythe Industrial/Commercial Overlay and Office Overlay zoning districts in those areas. There are also alot of commercial and industrial development opportunities in these areas, in addition to the industrialdevelopment planned for the Sonoma Mountain Village Planned Development.
While there are currently few mixed-use areas in Rohnert Park, the Station Center Planned Developmentpromises to offer a centralized, mixed-use, walkable downtown on the former State Farm site.
Most of the future development capacity is within specific area plans, planned developments, and theCentral Rohnert Park Priority Development Area Plan, especially for residential development.Development capacity in the rest of the city will be through strategic infill sites, mostly to the west ofHighway 101.
FINANCIAL INFORMATION
Management of the City is responsible for establishing and maintaining internal controls designed to ensure that the assets of the City are protected from loss, theft, or misuse and to ensure that adequate accounting data are compiled timely and accurately to allow for the preparation of financial statements in conformity with accounting principles generally accepted in the United States of America. The City’s internal controls are designed to provide reasonable, but not absolute, assurance that these objectives are met. The concept of reasonable assurance recognizes that: (1) the cost of a control should not exceed the benefits likely to be derived and (2) the valuation of costs and benefits requires estimates and judgments by management.
Budgetary Controls. The objective of budgetary controls is to assure compliance with legal provisions embodied in the annual appropriated budget approved by the City Council. Activities of the General Fund, Special Revenue and Proprietary Funds are included in the annual appropriated budget. The level of budgetary control (that is, the level at which expenditures cannot exceed the appropriated amount) is established at the fund level. The City also maintains an encumbrance accounting system as one technique of accomplishing budgetary control. Except as separately authorized by the Council, all unencumbered appropriations lapse at the end of the fiscal year.
As demonstrated by the statements and schedules included in the financial section of this report, the City continues to meet its responsibility for sound financial management.
OTHER INFORMATION
Independent Audit. Management considers an annual audit by independent certified public accountants a sound and prudent business practice. The accounting firm of Macias Gini & O’Connell, LLP performed the annual audit for the City for the fiscal year ended June 30, 2018. The independent auditor's report on the basic financial statements and combining and individual fund statements and schedules is included in the financial section of this report.
Awards. The Government Finance Officers Association of the United States and Canada (GFOA) awarded a Certificate of Achievement for Excellence in Financial Reporting to the City for its comprehensive annual financial report for the fiscal year ended June 30, 2017. This was the thirty-sixth consecutive year that the City has achieved this prestigious award. In order to be awarded a Certificate of Achievement, a government must
publish an easily readable and efficiently organized comprehensive annual financial report. This report must satisfy both generally accepted accounting principles and applicable legal requirements. A Certificate of Achievement is valid for a period of one year only. We believe that our current comprehensive annual financial report continues to meet the Certificate of Achievement Program's requirements and we are submitting it to the GFOA to determine its eligibility for another certificate. Acknowledgments. The preparation of the comprehensive annual financial report was made possible by the dedicated service of the entire staff of the Finance Department. Most notably, Manuel Orozco, Supervising Accountant, and accountants Lori Newzell and Yosselyn O. Valencia worked diligently to prepare reports, reconciliations and supporting schedules to facilitate audit completion. Each member of the department has our sincere appreciation for the contributions made in the preparation of this report. Respectfully submitted,
I-6
I-7
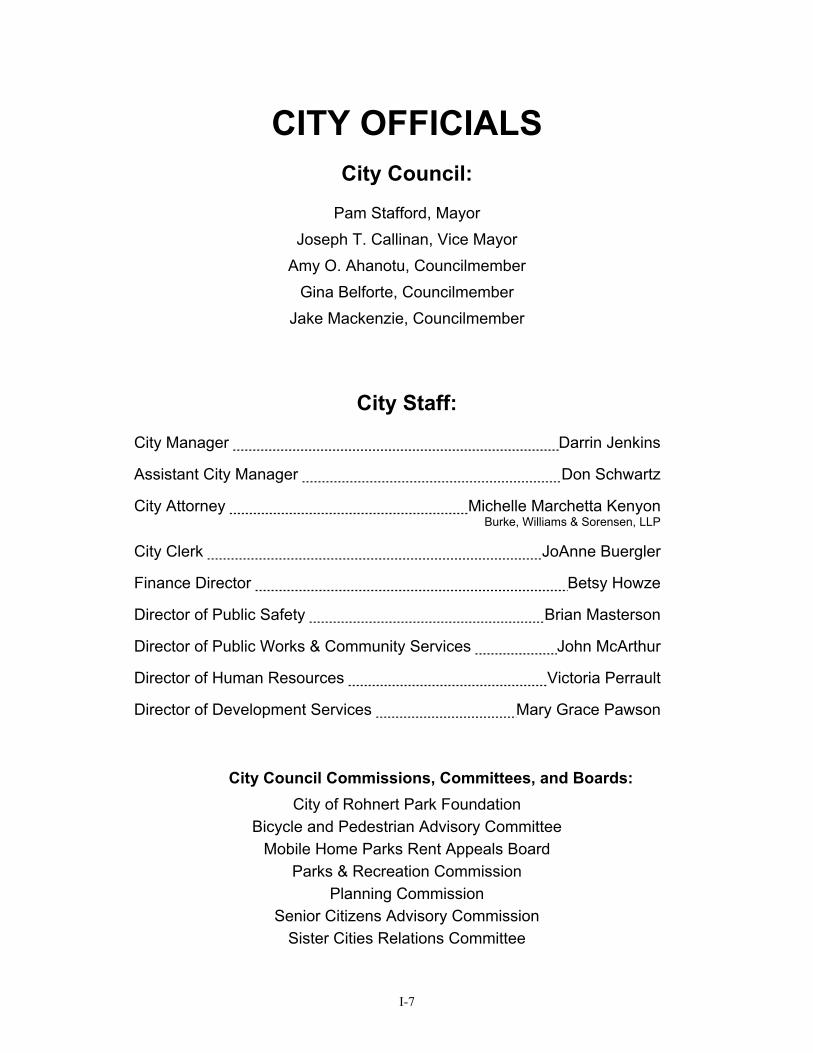
CITY OFFICIALS City Council:
Pam Stafford, Mayor
Joseph T. Callinan, Vice Mayor
Amy O. Ahanotu, Councilmember
Gina Belforte, Councilmember
Jake Mackenzie, Councilmember
City Staff:
City Manager Darrin Jenkins
Assistant City Manager Don Schwartz
City Attorney Michelle Marchetta Kenyon Burke, Williams & Sorensen, LLP
City Clerk JoAnne Buergler
Finance Director Betsy Howze
Director of Public Safety Brian Masterson
Director of Public Works & Community Services John McArthur
Director of Human Resources Victoria Perrault
Director of Development Services Mary Grace Pawson
City Council Commissions, Committees, and Boards:
City of Rohnert Park Foundation
Bicycle and Pedestrian Advisory Committee
Mobile Home Parks Rent Appeals Board
Parks & Recreation Commission
Planning Commission Senior Citizens Advisory Commission
Sister Cities Relations Committee
I-8

FINANCIAL SECTION
This page is left intentionally blank.
www.mgocpa.com Macias Gini & O’Connell LLP 2121 N. California Boulevard, Suite 750 Walnut Creek, CA 94596
F-1
Independent Auditor’s Report
Honorable Mayor and Members of the City Council City of Rohnert Park, California
Report on the Financial Statements
We have audited the accompanying financial statements of the governmental activities, the business-type activities, each major fund, and the aggregate remaining fund information of the City of Rohnert Park, California (City), as of and for the year ended June 30, 2018, and the related notes to the financial statements, which collectively comprise the City’s basic financial statements as listed in the table of contents.
Management’s Responsibility for the Financial Statements
Management is responsible for the preparation and fair presentation of these financial statements in accordance with accounting principles generally accepted in the United States of America; this includes the design, implementation, and maintenance of internal control relevant to the preparation and fair presentation of financial statements that are free from material misstatement, whether due to fraud or error.
Auditor’s Responsibility
Our responsibility is to express opinions on these financial statements based on our audit. We conducted our audit in accordance with auditing standards generally accepted in the United States of America and the standards applicable to financial audits contained in Government Auditing Standards, issued by the Comptroller General of the United States. Those standards require that we plan and perform the audit to obtain reasonable assurance about whether the financial statements are free from material misstatement.
An audit involves performing procedures to obtain audit evidence about the amounts and disclosures in the financial statements. The procedures selected depend on the auditor’s judgment, including the assessment of the risks of material misstatement of the financial statements, whether due to fraud or error. In making those risk assessments, the auditor considers internal control relevant to the entity’s preparation and fair presentation of the financial statements in order to design audit procedures that are appropriate in the circumstances, but not for the purpose of expressing an opinion on the effectiveness of the entity’s internal control. Accordingly, we express no such opinion. An audit also includes evaluating the appropriateness of accounting policies used and the reasonableness of significant accounting estimates made by management, as well as evaluating the overall presentation of the financial statements.
We believe that the audit evidence we have obtained is sufficient and appropriate to provide a basis for our audit opinions.
Opinions
In our opinion, the financial statements referred to above present fairly, in all material respects, the respective financial position of the governmental activities, the business-type activities, each major fund, and the aggregate remaining fund information of the City as of June 30, 2018, and the respective changes in financial position and, where applicable, cash flows thereof for the year then ended in accordance with accounting principles generally accepted in the United States of America.
F-2
Emphasis of Matters As discussed in Note 1(R) to the financial statements, effective as of July 1, 2017, the City adopted the provisions of Governmental Accounting Standards Board (GASB) Statement No. 75, Accounting and Financial Reporting for Postemployment Benefits Other Than Pensions. Our opinion is not modified with respect to this matter.
Other Matters
Required Supplementary Information Accounting principles generally accepted in the United States of America require that the management’s discussion and analysis, the budgetary comparison schedules, and the schedules related to the pension and postemployment health care benefits, as listed in the table of contents be presented to supplement the basic financial statements. Such information, although not a part of the basic financial statements, is required by the GASB who considers it to be an essential part of financial reporting for placing the basic financial statements in an appropriate operational, economic, or historical context. We have applied certain limited procedures to the required supplementary information in accordance with auditing standards generally accepted in the United States of America, which consisted of inquiries of management about the methods of preparing the information and comparing the information for consistency with management’s responses to our inquiries, the basic financial statements, and other knowledge we obtained during our audit of the basic financial statements. We do not express an opinion or provide any assurance on the information because the limited procedures do not provide us with sufficient evidence to express an opinion or provide any assurance.
Other Information Our audit was conducted for the purpose of forming opinions on the financial statements that collectively comprise the City’s basic financial statements. The introductory section, combining and individual fund statements and schedules, and statistical section are presented for purposes of additional analysis and are not a required part of the basic financial statements.
The combining and individual fund statements and schedules are the responsibility of management and were derived from and relate directly to the underlying accounting and other records used to prepare the basic financial statements. Such information has been subjected to the auditing procedures applied in the audit of the basic financial statements and certain additional procedures, including comparing and reconciling such information directly to the underlying accounting and other records used to prepare the basic financial statements or to the basic financial statements themselves, and other additional procedures in accordance with auditing standards generally accepted in the United States of America. In our opinion, the combining and individual fund statements and schedules are fairly stated, in all material respects, in relation to the basic financial statements as a whole.
The introductory and statistical sections have not been subjected to the auditing procedures applied in the audit of the basic financial statements, and accordingly, we do not express an opinion or provide any assurance on them.
Other Reporting Required by Government Auditing Standards
In accordance with Government Auditing Standards, we have also issued our report dated December 27, 2018 on our consideration of the City’s internal control over financial reporting and on our tests of its compliance with certain provisions of laws, regulations, contracts, and grant agreements and other matters. The purpose of that report is solely to describe the scope of our testing of internal control over financial reporting and compliance and the results of that testing, and not to provide an opinion on the effectiveness of the City’s internal control over financial reporting or on compliance. That report is an integral part of an audit performed in accordance with Government Auditing Standards in considering the City’s internal control over financial reporting and compliance.
Walnut Creek, California December 27, 2018
CITY OF ROHNERT PARK
MANAGEMENT'S DISCUSSION AND ANALYSIS FOR THE FISCAL YEAR ENDED JUNE 30, 2018 (Unaudited)
F-3
As management of the City of Rohnert Park (City), we offer readers of the City’s financial statements this narrative overview and analysis of the City’s financial activities for the fiscal year ended June 30, 2018. We encourage readers to consider the information presented here in conjunction with additional information that we have furnished in the City’s basic financial statements, which immediately follow this section.
FINANCIAL HIGHLIGHTS
Government-wide Financial Highlights
The assets and deferred outflows of resources of the City exceeded its liabilities and deferred inflows of resources by $186.6 million (net position) at June 30, 2018. Of this amount, $135.4 million represents the City’s investment in capital assets, less (1) accumulated depreciation, and (2) related outstanding debt and deferred outflows and inflows of resources used to acquire those assets; $44.0 million is available for the City’s ongoing obligations related to programs with external restrictions (restricted); and $7.2 million (unrestricted deficit) is primarily the result of the City’s unfunded pension liabilities. The City’s total net position increased by $25.6 million over the prior year:
The increase in net position was comprised of an increase in net position from operations of $31.9 million and a decrease to beginning net position of $6.3 million related to adoption of Governmental Accounting Standards Board (GASB) Statement No. 75, Accounting and Financial Reporting for Postemployment Benefits Other Than Pensions (GASB 75), effective July 1, 2017. The financial statements for the year ended June 30, 2017 have not been restated for GASB 75.
The $19.0 million increase in net investment in capital assets represents the change in capital assets net of change of related long-term debt.
The $8.5 million decrease in restricted net position represents the change in resources that are subject
to external restriction on their use. The $15.1 million increase in unrestricted net position is the change in resources available to fund City
programs and debt obligations.
Governmental Funds Highlights
The City’s Governmental Funds combined ending fund balance of $71.1 million, an increase of $6.2 million from the prior year’s ending balance of $64.9 million. Fund balances available for spending are categorized into Restricted, Assigned, and Unassigned. These categories total $67.0 million, or 94.2% of ending fund balance. Of this amount:
Fund balance restricted by law or externally imposed requirements (e.g., for capital projects, housing projects, and debt service, etc.) decreased by $8.9 million to $40.9 million.
Fund balance assigned by the City Council, City Manager or Finance Director in accordance with policy and/or budgetary directives (e.g., operating reserve and contingency reserve) increased by $7.5 million to $30.3 million.
Unassigned Fund Balance, which represents the residual of total fund balance less the aforementioned categories, decreased by $7.2 million to $(4.2) million.
The General Fund reported total fund balance of $38.1 million of which $2.3 million is nonspendable, $11.2 million is restricted, $24.5 million is assigned, and less than $0.1 million is unassigned.
CITY OF ROHNERT PARK
MANAGEMENT'S DISCUSSION AND ANALYSIS FOR THE FISCAL YEAR ENDED JUNE 30, 2018 (Unaudited)
F-4
The continuing overall increase in governmental fund balance indicates financial success for the year.
OVERVIEW OF THE FINANCIAL STATEMENTS
Management’s Discussion and Analysis introduces the City’s Basic Financial Statements. The City’s Basic Financial Statements include three components:
Government-wide Financial Statements Fund Financial Statements Notes to the Financial Statements
This report also contains required and other supplementary information in addition to the basic financial statements themselves. Government-wide Financial Statements
The Government-wide Financial Statements are designed to provide readers with a broad overview of the City’s finances, in a manner similar to a private-sector business. These financial statements provide both long-term and short-term information about the City’s overall financial status. The Statement of Net Position presents information on all of the City’s Assets and Deferred Outflows of Resources, and Liabilities and Deferred Inflows of Resources with the difference reported as Net Position. Net Position = (Assets + Deferred Outflows of Resources) - (Liabilities + Deferred Inflows of Resources) Over time, increases or decreases in net position are a useful indicator of an improving or deteriorating City financial condition. The Statement of Activities presents the most recent fiscal year changes in the City’s net position. All changes in net position are reported as soon as the underlying event giving rise to the change occurs, regardless of the timing of related cash flows. The statement reports items resulting in cash flows in future fiscal periods (e.g., uncollected taxes, and earned but unused vacation leave) as revenues and expenses. The Government-wide Financial Statements distinguish functions of the City principally supported by taxes and intergovernmental revenues (governmental activities) from other functions intended to recover all or a significant portion of their costs through user fees and charges (business-type activities). The governmental activities of the City grouped by function include General Government, Public Safety, Public Works, Parks and Recreation, Cultural Arts Center and Interest on Long-Term Debt. The business-type activities of the City include Water, Sewer, Recycled Water, Refuse Collection, and Golf Courses.
Component units are included in Government-wide Financial Statements and are legally separate entities for which the City is financially accountable. Component units have substantially the same governing board as the City, or provide services entirely to the City. The Rohnert Park Financing Authority and the City of Rohnert Park Foundation are included as blended component units of the City.
Fund Financial Statements
A fund is a grouping of related accounts used to maintain control over resources segregated for specific activities or objectives. The City, like other state and local governments, uses fund accounting to ensure and demonstrate compliance with finance-related legal requirements. The City’s funds are divided into three types: Governmental funds, Proprietary funds, and Fiduciary funds.
CITY OF ROHNERT PARK
MANAGEMENT'S DISCUSSION AND ANALYSIS FOR THE FISCAL YEAR ENDED JUNE 30, 2018 (Unaudited)
F-5
Governmental funds are used to account for essentially the same functions reported as governmental activities in the Government-wide Financial Statements. However, unlike the Government-wide Financial Statements, governmental funds financial statements focus on near-term inflows and outflows of spendable resources, as well as on balances of spendable resources available at the end of the fiscal year. (Modified Accrual Basis of Accounting) Such information may be useful in evaluating the City’s near-term financing requirements. Because the focus of governmental funds is narrower than that of the Government-wide Financial Statements, it is useful to compare the information presented for governmental funds with similar information presented for governmental activities in the Government-wide Financial Statements. Both the Governmental Funds Balance Sheet and the Governmental Funds Statement of Revenues, Expenditures, and Changes in Fund Balances provide a reconciliation to facilitate this comparison between governmental funds and governmental activities. The City maintains individual governmental funds organized according to their type (special revenue, debt service, capital projects and permanent funds). Information is presented separately in the Governmental Funds Balance Sheet and in the Governmental Funds Statement of Revenues, Expenditures and Changes in Fund Balances for the General Fund; Housing Projects Special Revenue Fund; Financing Authority Debt Service Fund; City Capital Projects Fund; Public Facility Finance Fee Special Revenue Fund; and Graton Mitigation Supplemental Special Revenue Fund, all of which are considered to be major funds. Data from the remaining governmental funds are combined into a single, aggregated presentation entitled “Other Governmental Funds.” Individual and combining fund data for each of these non-major governmental funds is provided as supplementary information in this report. The City adopts an annually appropriated budget for all of its operating funds. The budget to actual comparison schedules are provided for the General Fund and Special Revenue Funds to demonstrate performance against this budget.
Proprietary funds are generally used to account for services for which the City charges external, or internal customers with the intent to recover all or a significant portion of their costs through user fees and charges. The City maintains the following two types of proprietary funds:
Enterprise Funds report the same functions presented as business-type activities in the Government-wide Financial Statements. The City uses enterprise funds to account for Water, Sewer, Recycled Water, Refuse Collection, and Golf Courses.
Internal Service Funds are an accounting device used to accumulate and allocate costs internally
among the City’s various functions. The City’s internal service funds account for Information Technology, Vehicle Replacement, Fleet Management, and Infrastructure services. Since these services predominantly benefit governmental rather than business-type functions, they are consolidated within governmental activities in the Government-wide Financial Statements.
Proprietary funds provide the same type of information as the Government-wide Financial Statements, only in more detail. The proprietary funds financial statements provide separate information for Water, Sewer, Recycled Water, Refuse Collection, and Golf Courses activities. The four internal service funds are combined into a single, aggregated presentation in the proprietary funds financial statements. Fiduciary funds account for resources held for the benefit of parties outside the City. Fiduciary funds are not reflected in the Government-wide Financial Statements because the resources of those funds are not available to support the City’s own programs. Fiduciary fund accounting is similar to proprietary fund accounting. The City reported three fiduciary funds.
CITY OF ROHNERT PARK
MANAGEMENT'S DISCUSSION AND ANALYSIS FOR THE FISCAL YEAR ENDED JUNE 30, 2018 (Unaudited)
F-6
Notes to the Financial Statements provide additional information that is essential to a full understanding of the data provided in the government-wide and fund financial statements.
Required Supplementary Information (RSI) is presented in addition to the basic financial statements and accompanying notes. This required information includes the Schedules of Changes in Net Pension Liability and Related Ratios, Schedule of Proportionate Share of the Net Pension Liability, Schedule of Pension Plans Contributions, Schedule of Changes in Net OPEB Liability and Related Ratios, Schedule of OPEB Plan Contributions, and Budgetary Comparison Schedules for General Fund and major Special Revenue Funds.
GOVERNMENT-WIDE FINANCIAL ANALYSIS
Net Position
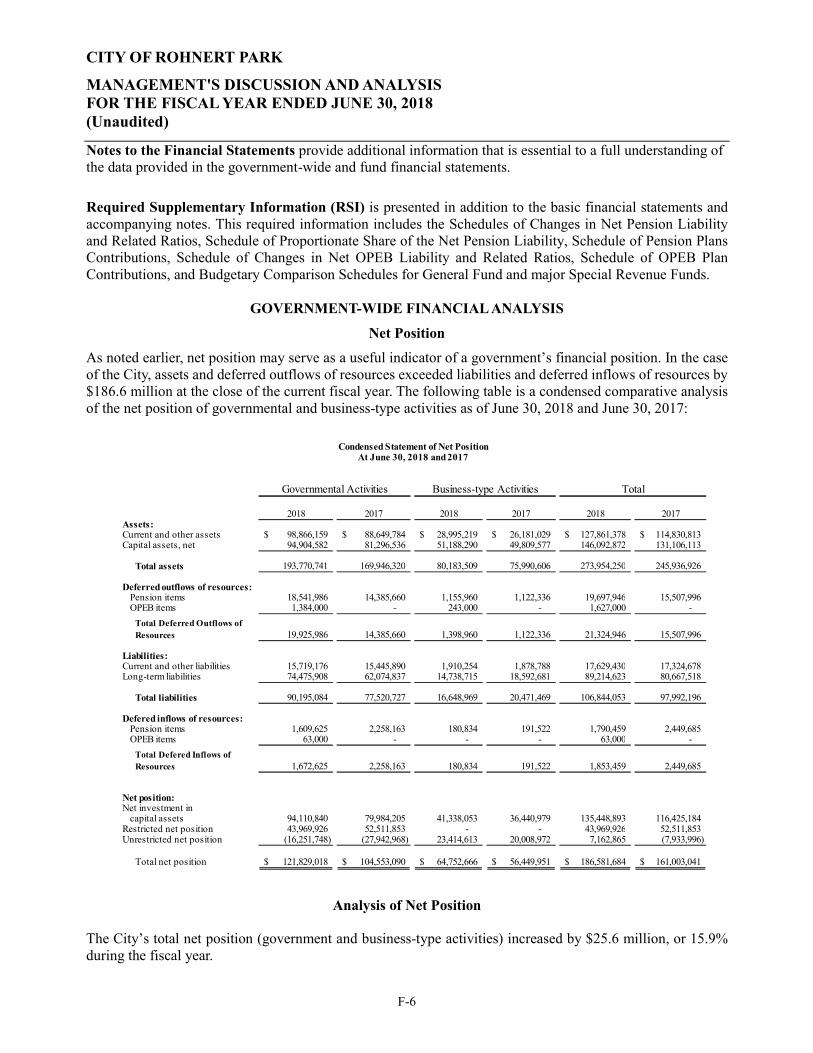
As noted earlier, net position may serve as a useful indicator of a government’s financial position. In the case of the City, assets and deferred outflows of resources exceeded liabilities and deferred inflows of resources by $186.6 million at the close of the current fiscal year. The following table is a condensed comparative analysis of the net position of governmental and business-type activities as of June 30, 2018 and June 30, 2017:
Analysis of Net Position
The City’s total net position (government and business-type activities) increased by $25.6 million, or 15.9% during the fiscal year.
Condensed Statement of Net PositionAt June 30, 2018 and 2017
2018 2017 2018 2017 2018 2017Assets:Current and other assets 98,866,159$ 88,649,784$ 28,995,219$ 26,181,029$ 127,861,378$ 114,830,813$ Capital assets, net 94,904,582 81,296,536 51,188,290 49,809,577 146,092,872 131,106,113
Total assets 193,770,741 169,946,320 80,183,509 75,990,606 273,954,250 245,936,926
Deferred outflows of resources:Pension items 18,541,986 14,385,660 1,155,960 1,122,336 19,697,946 15,507,996 OPEB items 1,384,000 - 243,000 - 1,627,000 -
Total Deferred Outflows of Resources 19,925,986 14,385,660 1,398,960 1,122,336 21,324,946 15,507,996
Liabilities:Current and other liabilities 15,719,176 15,445,890 1,910,254 1,878,788 17,629,430 17,324,678 Long-term liabilities 74,475,908 62,074,837 14,738,715 18,592,681 89,214,623 80,667,518
Total liabilities 90,195,084 77,520,727 16,648,969 20,471,469 106,844,053 97,992,196
Defered inflows of resources:Pension items 1,609,625 2,258,163 180,834 191,522 1,790,459 2,449,685 OPEB items 63,000 - - - 63,000 -
Total Defered Inflows of Resources 1,672,625 2,258,163 180,834 191,522 1,853,459 2,449,685
Net position:Net investment in
capital assets 94,110,840 79,984,205 41,338,053 36,440,979 135,448,893 116,425,184 Restricted net position 43,969,926 52,511,853 - - 43,969,926 52,511,853 Unrestricted net position (16,251,748) (27,942,968) 23,414,613 20,008,972 7,162,865 (7,933,996)
Total net position 121,829,018$ 104,553,090$ 64,752,666$ 56,449,951$ 186,581,684$ 161,003,041$
Governmental Activities Business-type Activities Total

CITY OF ROHNERT PARK
MANAGEMENT'S DISCUSSION AND ANALYSIS FOR THE FISCAL YEAR ENDED JUNE 30, 2018 (Unaudited)
F-7
Net investment in Capital Assets is the largest portion of the City’s net position. It is comprised of capital assets (i.e. land, building, roads, machinery and equipment) less the related outstanding long-term debt used to acquire those assets. The City uses these capital assets to provide services to citizens; as such, these assets are not available for future spending. Although the City’s investment in its capital asset is reported net of related debt, the resources needed to repay this debt must be provided from other sources, since the capital assets themselves cannot be used to liquidate these liabilities. The $19.0 million, or 16.3% increase in net investment in capital assets was mainly due to the increase in net capital assets by $15.0 million offset by the decrease of related long-term debt including the redemption of the outstanding 2005A Water Revenue Bonds of $3.3 million. Restricted Net Position of $44.0 million represents resources that are subject to external restrictions on their use, or by enabling legislation. Due to the unique nature of funding sources, the City has significantly more restricted net position dollars than unrestricted net position dollars. Restricted net position is mainly comprised of amounts restricted for housing development ($13.5 million or 30.8%), retirement benefits ($11.2 million or 25.5%), capital and street projects ($7.9 million or 17.9%), public safety programs ($4.7 million or 10.6%), general redevelopment capital projects ($1.9 million or 4.4%), performing arts center ($1.0 million or 2.4%), and other ($3.7 million, or 8.5%). Restricted net position decreased by $8.5 million, or 16.3%, primarily due to the usage of restricted cash and investments of $13.9 million to early repay the outstanding Rohnert Park Redevelopment Project Housing Tax Allocation Bonds, Series 2007H (2007H TABs), offset by the increase in investment held in the Public Agency Retirement Services (PARS) Trust of $4.4 million. Unrestricted Net Position in the amount of $7.2 million represents net position of the City that is not restricted for any project or purpose. The increase of $15.1 million, or 190.3% was primarily due to the proceeds received from the sale of City property of $6.9 million and increases of revenues due to the improved economy. Current Assets increased by $13.0 million, or 11.3% mainly due to the increase in unrestricted cash and investments of $24.6 million offset by the decrease in restricted cash and investments of $11.3 million. The increase in unrestricted cash and investments was primarily due to the proceeds received from the sale of City property of $6.9 million and increases of revenues due to the improved economy. The decrease in restricted cash and investments was due to the transfer of $13.9 million to early repay 2007H TABs. Current and Other Liabilities increased slightly by $0.3 million, or 1.8% primarily due to the timing difference of payments on accounts payable. Long Term Liabilities increased by $8.5 million, or 10.6% primarily due to increase in the net pension liabilities of $5.4 million, increase in Other Postemployment Benefits (OPEB) liabilities of $11.2 million due to the implementation of GASB 75, offset by the removal of the net OPEB obligations of $4.1 million, and the decrease of long-term debt by $3.9 million mainly related to the redemption of the outstanding 2005A Water Revenue Bonds of $3.3 million.
Deferred Outflows of Resources increased by $5.8 million, or 37.5% while Deferred Inflows of Resources decreased by $0.6 million, or 24.3% due to changes in pension related items and OPEB related items upon the implementation of GASB 75.
CITY OF ROHNERT PARK
MANAGEMENT'S DISCUSSION AND ANALYSIS FOR THE FISCAL YEAR ENDED JUNE 30, 2018 (Unaudited)
F-8
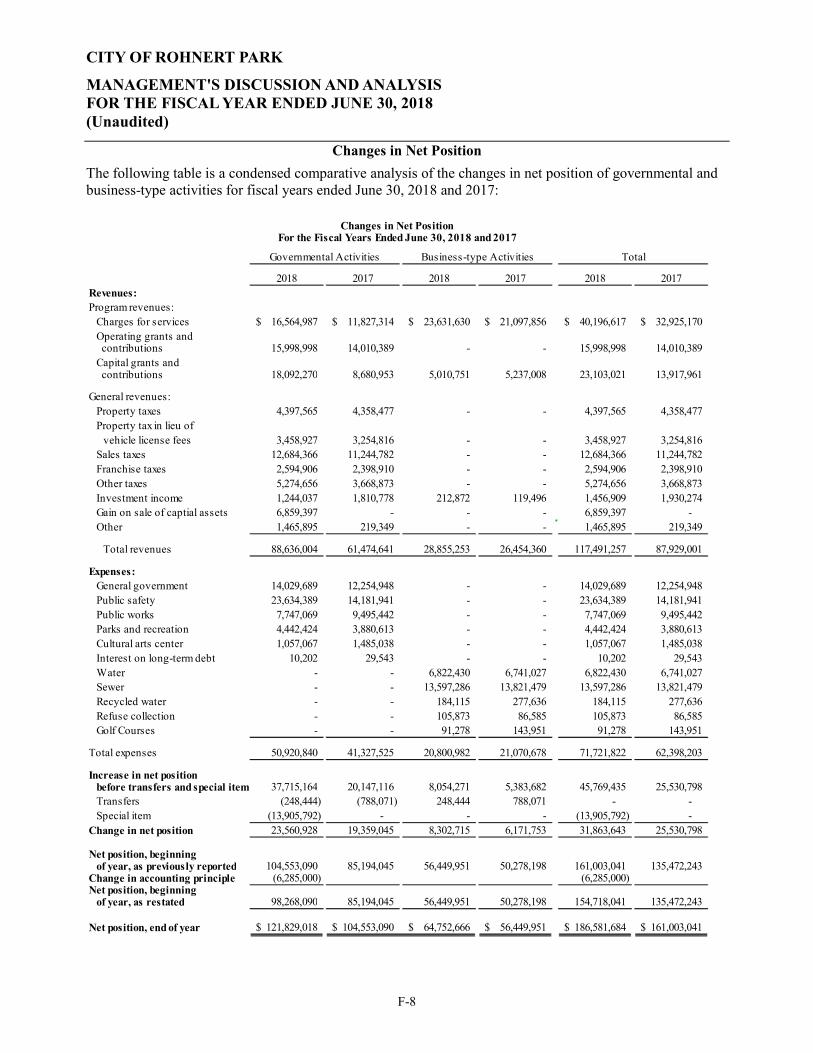
Changes in Net Position
The following table is a condensed comparative analysis of the changes in net position of governmental and business-type activities for fiscal years ended June 30, 2018 and 2017:
Changes in Net PositionFor the Fiscal Years Ended June 30, 2018 and 2017
2018 2017 2018 2017 2018 2017Revenues:Program revenues:
Charges for services 16,564,987$ 11,827,314$ 23,631,630$ 21,097,856$ 40,196,617$ 32,925,170$ Operating grants and contributions 15,998,998 14,010,389 - - 15,998,998 14,010,389 Capital grants and contributions 18,092,270 8,680,953 5,010,751 5,237,008 23,103,021 13,917,961
General revenues:Property taxes 4,397,565 4,358,477 - - 4,397,565 4,358,477 Property tax in lieu of
vehicle license fees 3,458,927 3,254,816 - - 3,458,927 3,254,816 Sales taxes 12,684,366 11,244,782 - - 12,684,366 11,244,782 Franchise taxes 2,594,906 2,398,910 - - 2,594,906 2,398,910 Other taxes 5,274,656 3,668,873 - - 5,274,656 3,668,873 Investment income 1,244,037 1,810,778 212,872 119,496 1,456,909 1,930,274 Gain on sale of captial assets 6,859,397 - - - 6,859,397 - Other 1,465,895 219,349 - - 1,465,895 219,349
Total revenues 88,636,004 61,474,641 28,855,253 26,454,360 117,491,257 87,929,001
Expenses:General government 14,029,689 12,254,948 - - 14,029,689 12,254,948 Public safety 23,634,389 14,181,941 - - 23,634,389 14,181,941 Public works 7,747,069 9,495,442 - - 7,747,069 9,495,442 Parks and recreation 4,442,424 3,880,613 - - 4,442,424 3,880,613 Cultural arts center 1,057,067 1,485,038 - - 1,057,067 1,485,038 Interest on long-term debt 10,202 29,543 - - 10,202 29,543 Water - - 6,822,430 6,741,027 6,822,430 6,741,027 Sewer - - 13,597,286 13,821,479 13,597,286 13,821,479 Recycled water - - 184,115 277,636 184,115 277,636 Refuse collection - - 105,873 86,585 105,873 86,585 Golf Courses - - 91,278 143,951 91,278 143,951
Total expenses 50,920,840 41,327,525 20,800,982 21,070,678 71,721,822 62,398,203
Increase in net position before transfers and special item 37,715,164 20,147,116 8,054,271 5,383,682 45,769,435 25,530,798 Transfers (248,444) (788,071) 248,444 788,071 - - Special item (13,905,792) - - - (13,905,792) -
Change in net position 23,560,928 19,359,045 8,302,715 6,171,753 31,863,643 25,530,798
Net position, beginning of year, as previously reported 104,553,090 85,194,045 56,449,951 50,278,198 161,003,041 135,472,243
Change in accounting principle (6,285,000) (6,285,000) Net position, beginning
of year, as restated 98,268,090 85,194,045 56,449,951 50,278,198 154,718,041 135,472,243
Net position, end of year 121,829,018$ 104,553,090$ 64,752,666$ 56,449,951$ 186,581,684$ 161,003,041$
Governmental Activities Business-type Activities Total
CITY OF ROHNERT PARK
MANAGEMENT'S DISCUSSION AND ANALYSIS FOR THE FISCAL YEAR ENDED JUNE 30, 2018 (Unaudited)
F-9
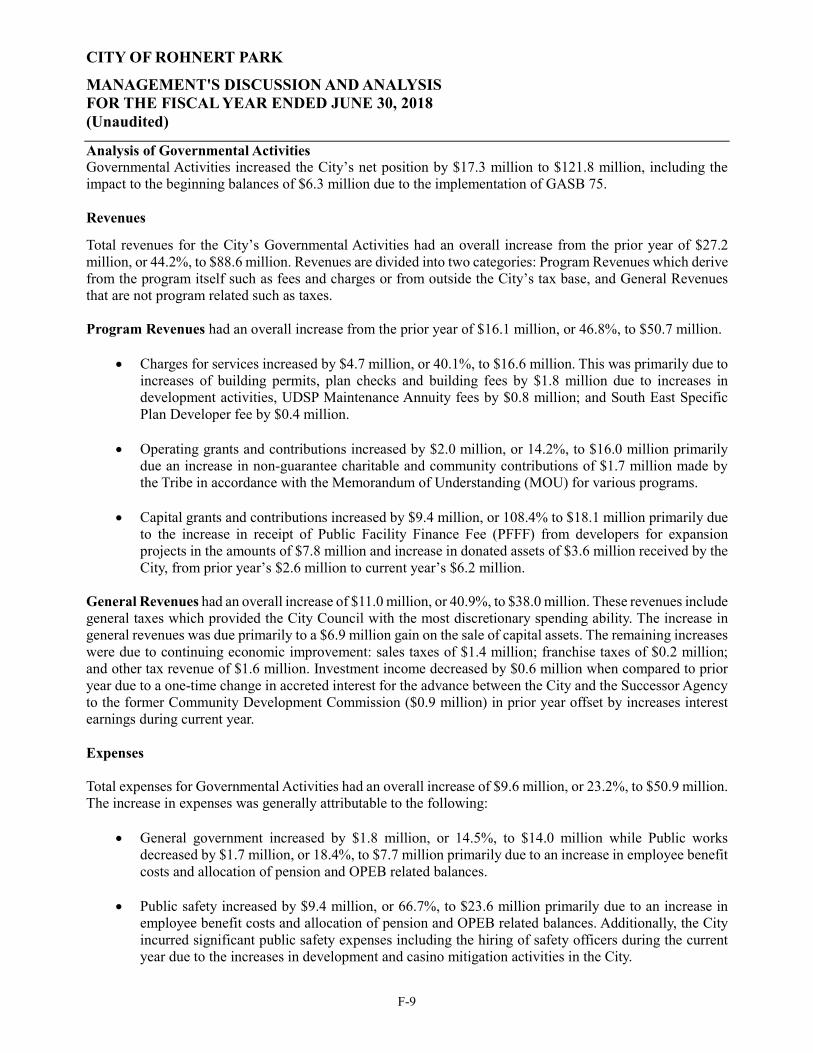
Analysis of Governmental Activities Governmental Activities increased the City’s net position by $17.3 million to $121.8 million, including the impact to the beginning balances of $6.3 million due to the implementation of GASB 75. Revenues
Total revenues for the City’s Governmental Activities had an overall increase from the prior year of $27.2 million, or 44.2%, to $88.6 million. Revenues are divided into two categories: Program Revenues which derive from the program itself such as fees and charges or from outside the City’s tax base, and General Revenues that are not program related such as taxes. Program Revenues had an overall increase from the prior year of $16.1 million, or 46.8%, to $50.7 million.
Charges for services increased by $4.7 million, or 40.1%, to $16.6 million. This was primarily due to increases of building permits, plan checks and building fees by $1.8 million due to increases in development activities, UDSP Maintenance Annuity fees by $0.8 million; and South East Specific Plan Developer fee by $0.4 million.
Operating grants and contributions increased by $2.0 million, or 14.2%, to $16.0 million primarily due an increase in non-guarantee charitable and community contributions of $1.7 million made by the Tribe in accordance with the Memorandum of Understanding (MOU) for various programs.
Capital grants and contributions increased by $9.4 million, or 108.4% to $18.1 million primarily due
to the increase in receipt of Public Facility Finance Fee (PFFF) from developers for expansion projects in the amounts of $7.8 million and increase in donated assets of $3.6 million received by the City, from prior year’s $2.6 million to current year’s $6.2 million.
General Revenues had an overall increase of $11.0 million, or 40.9%, to $38.0 million. These revenues include general taxes which provided the City Council with the most discretionary spending ability. The increase in general revenues was due primarily to a $6.9 million gain on the sale of capital assets. The remaining increases were due to continuing economic improvement: sales taxes of $1.4 million; franchise taxes of $0.2 million; and other tax revenue of $1.6 million. Investment income decreased by $0.6 million when compared to prior year due to a one-time change in accreted interest for the advance between the City and the Successor Agency to the former Community Development Commission ($0.9 million) in prior year offset by increases interest earnings during current year. Expenses Total expenses for Governmental Activities had an overall increase of $9.6 million, or 23.2%, to $50.9 million. The increase in expenses was generally attributable to the following:
General government increased by $1.8 million, or 14.5%, to $14.0 million while Public works decreased by $1.7 million, or 18.4%, to $7.7 million primarily due to an increase in employee benefit costs and allocation of pension and OPEB related balances.
Public safety increased by $9.4 million, or 66.7%, to $23.6 million primarily due to an increase in
employee benefit costs and allocation of pension and OPEB related balances. Additionally, the City incurred significant public safety expenses including the hiring of safety officers during the current year due to the increases in development and casino mitigation activities in the City.
CITY OF ROHNERT PARK
MANAGEMENT'S DISCUSSION AND ANALYSIS FOR THE FISCAL YEAR ENDED JUNE 30, 2018 (Unaudited)
F-10
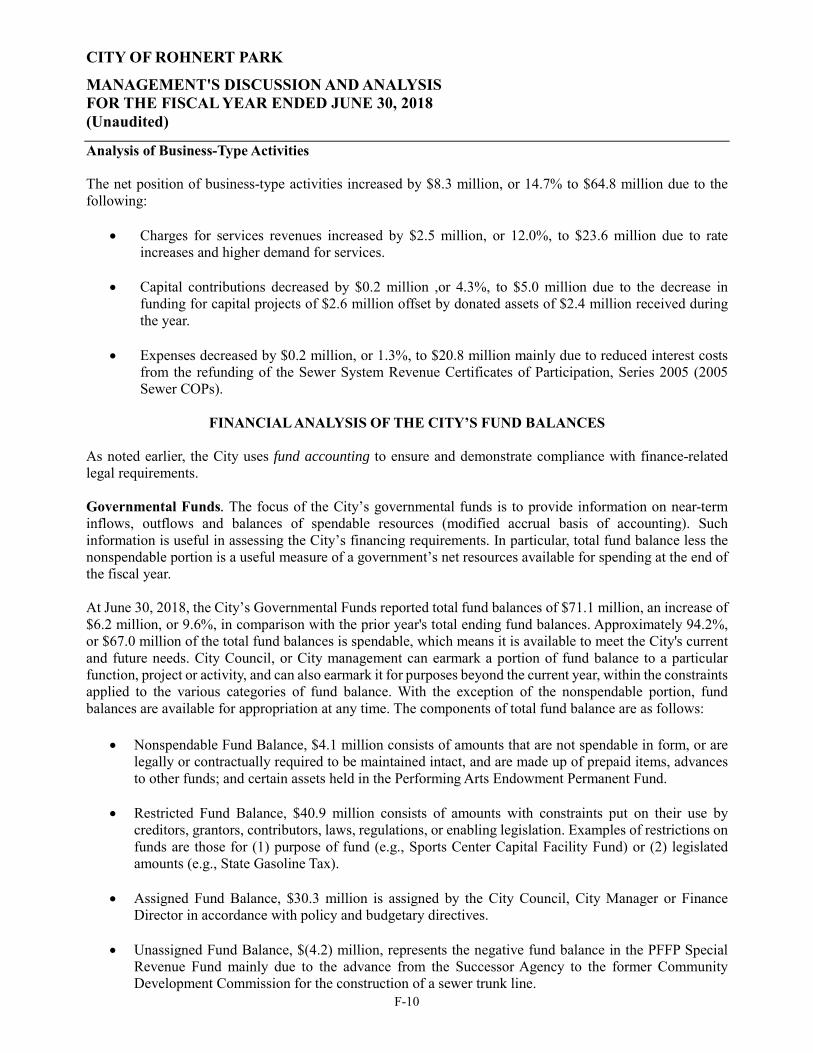
Analysis of Business-Type Activities The net position of business-type activities increased by $8.3 million, or 14.7% to $64.8 million due to the following:
Charges for services revenues increased by $2.5 million, or 12.0%, to $23.6 million due to rate
increases and higher demand for services. Capital contributions decreased by $0.2 million ,or 4.3%, to $5.0 million due to the decrease in
funding for capital projects of $2.6 million offset by donated assets of $2.4 million received during the year.
Expenses decreased by $0.2 million, or 1.3%, to $20.8 million mainly due to reduced interest costs
from the refunding of the Sewer System Revenue Certificates of Participation, Series 2005 (2005 Sewer COPs).
FINANCIAL ANALYSIS OF THE CITY’S FUND BALANCES
As noted earlier, the City uses fund accounting to ensure and demonstrate compliance with finance-related legal requirements. Governmental Funds. The focus of the City’s governmental funds is to provide information on near-term inflows, outflows and balances of spendable resources (modified accrual basis of accounting). Such information is useful in assessing the City’s financing requirements. In particular, total fund balance less the nonspendable portion is a useful measure of a government’s net resources available for spending at the end of the fiscal year. At June 30, 2018, the City’s Governmental Funds reported total fund balances of $71.1 million, an increase of $6.2 million, or 9.6%, in comparison with the prior year's total ending fund balances. Approximately 94.2%, or $67.0 million of the total fund balances is spendable, which means it is available to meet the City's current and future needs. City Council, or City management can earmark a portion of fund balance to a particular function, project or activity, and can also earmark it for purposes beyond the current year, within the constraints applied to the various categories of fund balance. With the exception of the nonspendable portion, fund balances are available for appropriation at any time. The components of total fund balance are as follows:
Nonspendable Fund Balance, $4.1 million consists of amounts that are not spendable in form, or are legally or contractually required to be maintained intact, and are made up of prepaid items, advances to other funds; and certain assets held in the Performing Arts Endowment Permanent Fund.
Restricted Fund Balance, $40.9 million consists of amounts with constraints put on their use by creditors, grantors, contributors, laws, regulations, or enabling legislation. Examples of restrictions on funds are those for (1) purpose of fund (e.g., Sports Center Capital Facility Fund) or (2) legislated amounts (e.g., State Gasoline Tax).
Assigned Fund Balance, $30.3 million is assigned by the City Council, City Manager or Finance Director in accordance with policy and budgetary directives.
Unassigned Fund Balance, $(4.2) million, represents the negative fund balance in the PFFP Special Revenue Fund mainly due to the advance from the Successor Agency to the former Community Development Commission for the construction of a sewer trunk line.
CITY OF ROHNERT PARK
MANAGEMENT'S DISCUSSION AND ANALYSIS FOR THE FISCAL YEAR ENDED JUNE 30, 2018 (Unaudited)
F-11
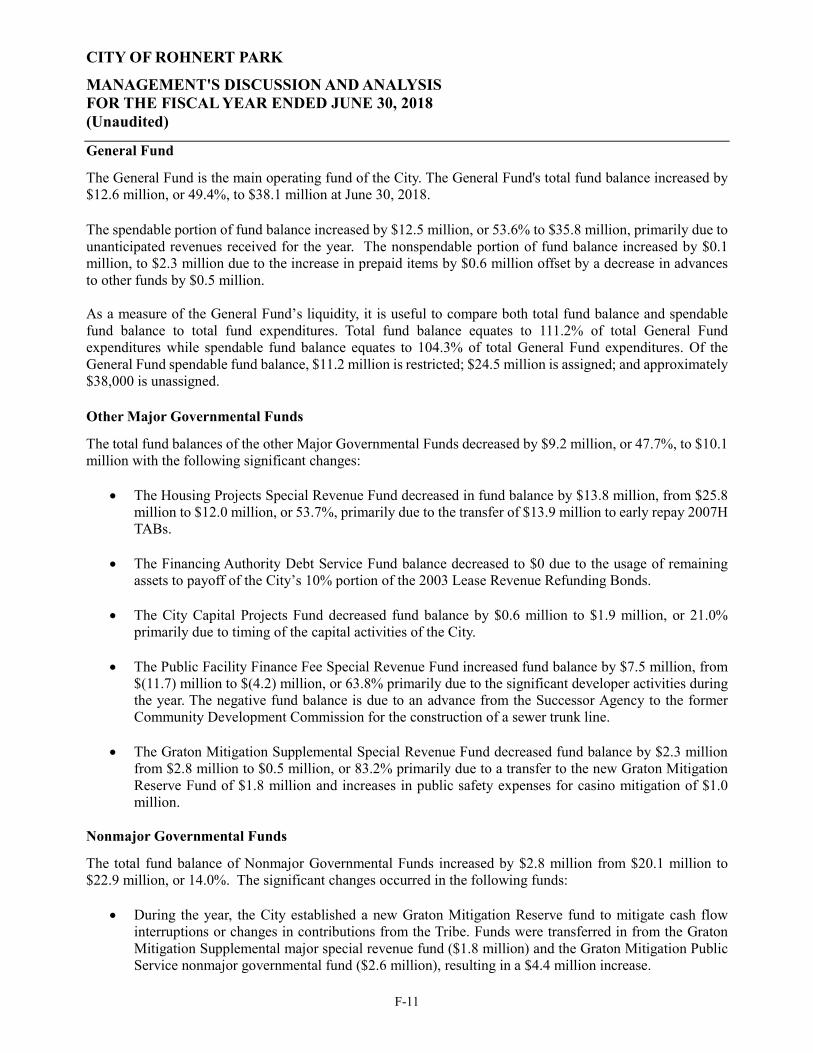
General Fund
The General Fund is the main operating fund of the City. The General Fund's total fund balance increased by $12.6 million, or 49.4%, to $38.1 million at June 30, 2018. The spendable portion of fund balance increased by $12.5 million, or 53.6% to $35.8 million, primarily due to unanticipated revenues received for the year. The nonspendable portion of fund balance increased by $0.1 million, to $2.3 million due to the increase in prepaid items by $0.6 million offset by a decrease in advances to other funds by $0.5 million. As a measure of the General Fund’s liquidity, it is useful to compare both total fund balance and spendable fund balance to total fund expenditures. Total fund balance equates to 111.2% of total General Fund expenditures while spendable fund balance equates to 104.3% of total General Fund expenditures. Of the General Fund spendable fund balance, $11.2 million is restricted; $24.5 million is assigned; and approximately $38,000 is unassigned. Other Major Governmental Funds
The total fund balances of the other Major Governmental Funds decreased by $9.2 million, or 47.7%, to $10.1 million with the following significant changes:
The Housing Projects Special Revenue Fund decreased in fund balance by $13.8 million, from $25.8 million to $12.0 million, or 53.7%, primarily due to the transfer of $13.9 million to early repay 2007H TABs.
The Financing Authority Debt Service Fund balance decreased to $0 due to the usage of remaining assets to payoff of the City’s 10% portion of the 2003 Lease Revenue Refunding Bonds.
The City Capital Projects Fund decreased fund balance by $0.6 million to $1.9 million, or 21.0% primarily due to timing of the capital activities of the City.
The Public Facility Finance Fee Special Revenue Fund increased fund balance by $7.5 million, from $(11.7) million to $(4.2) million, or 63.8% primarily due to the significant developer activities during the year. The negative fund balance is due to an advance from the Successor Agency to the former Community Development Commission for the construction of a sewer trunk line.
The Graton Mitigation Supplemental Special Revenue Fund decreased fund balance by $2.3 million from $2.8 million to $0.5 million, or 83.2% primarily due to a transfer to the new Graton Mitigation Reserve Fund of $1.8 million and increases in public safety expenses for casino mitigation of $1.0 million.
Nonmajor Governmental Funds
The total fund balance of Nonmajor Governmental Funds increased by $2.8 million from $20.1 million to $22.9 million, or 14.0%. The significant changes occurred in the following funds:
During the year, the City established a new Graton Mitigation Reserve fund to mitigate cash flow interruptions or changes in contributions from the Tribe. Funds were transferred in from the Graton Mitigation Supplemental major special revenue fund ($1.8 million) and the Graton Mitigation Public Service nonmajor governmental fund ($2.6 million), resulting in a $4.4 million increase.
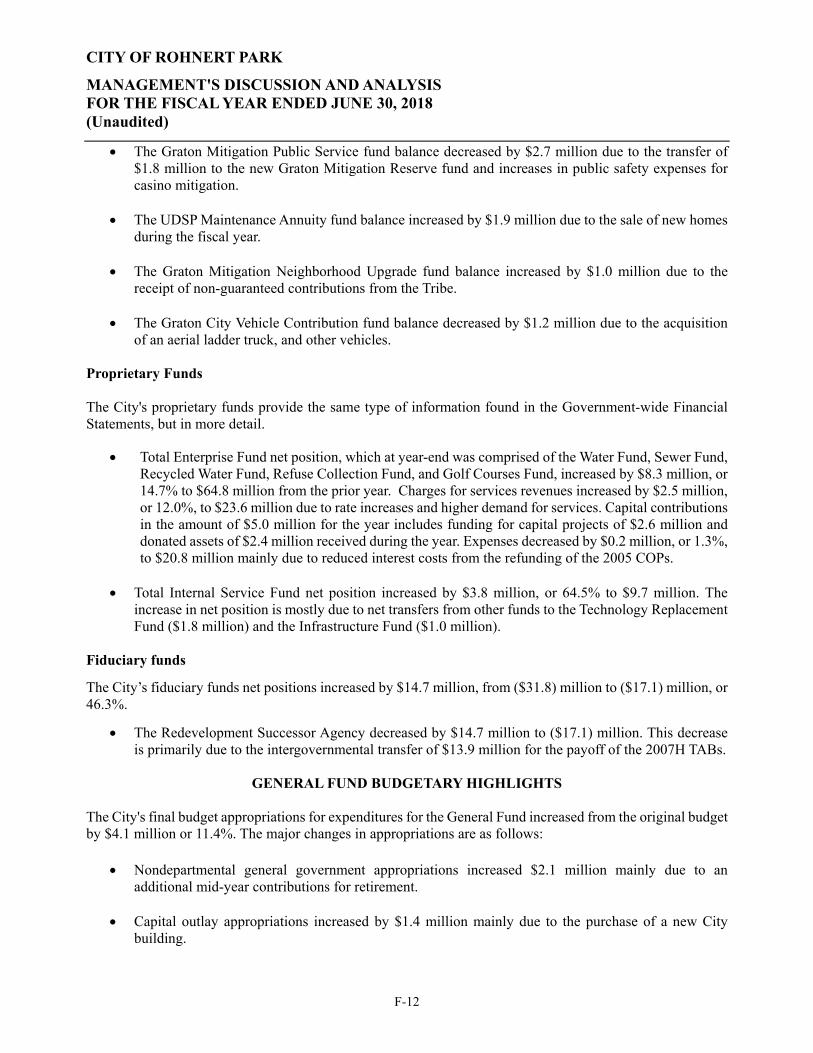
CITY OF ROHNERT PARK
MANAGEMENT'S DISCUSSION AND ANALYSIS FOR THE FISCAL YEAR ENDED JUNE 30, 2018 (Unaudited)
F-12
The Graton Mitigation Public Service fund balance decreased by $2.7 million due to the transfer of $1.8 million to the new Graton Mitigation Reserve fund and increases in public safety expenses for casino mitigation.
The UDSP Maintenance Annuity fund balance increased by $1.9 million due to the sale of new homes during the fiscal year.
The Graton Mitigation Neighborhood Upgrade fund balance increased by $1.0 million due to the receipt of non-guaranteed contributions from the Tribe.
The Graton City Vehicle Contribution fund balance decreased by $1.2 million due to the acquisition of an aerial ladder truck, and other vehicles.
Proprietary Funds The City's proprietary funds provide the same type of information found in the Government-wide Financial Statements, but in more detail.
Total Enterprise Fund net position, which at year-end was comprised of the Water Fund, Sewer Fund, Recycled Water Fund, Refuse Collection Fund, and Golf Courses Fund, increased by $8.3 million, or 14.7% to $64.8 million from the prior year. Charges for services revenues increased by $2.5 million, or 12.0%, to $23.6 million due to rate increases and higher demand for services. Capital contributions in the amount of $5.0 million for the year includes funding for capital projects of $2.6 million and donated assets of $2.4 million received during the year. Expenses decreased by $0.2 million, or 1.3%, to $20.8 million mainly due to reduced interest costs from the refunding of the 2005 COPs.
Total Internal Service Fund net position increased by $3.8 million, or 64.5% to $9.7 million. The
increase in net position is mostly due to net transfers from other funds to the Technology Replacement Fund ($1.8 million) and the Infrastructure Fund ($1.0 million).
Fiduciary funds
The City’s fiduciary funds net positions increased by $14.7 million, from ($31.8) million to ($17.1) million, or 46.3%.
The Redevelopment Successor Agency decreased by $14.7 million to ($17.1) million. This decrease is primarily due to the intergovernmental transfer of $13.9 million for the payoff of the 2007H TABs.
GENERAL FUND BUDGETARY HIGHLIGHTS The City's final budget appropriations for expenditures for the General Fund increased from the original budget by $4.1 million or 11.4%. The major changes in appropriations are as follows:
Nondepartmental general government appropriations increased $2.1 million mainly due to an additional mid-year contributions for retirement.
Capital outlay appropriations increased by $1.4 million mainly due to the purchase of a new City building.
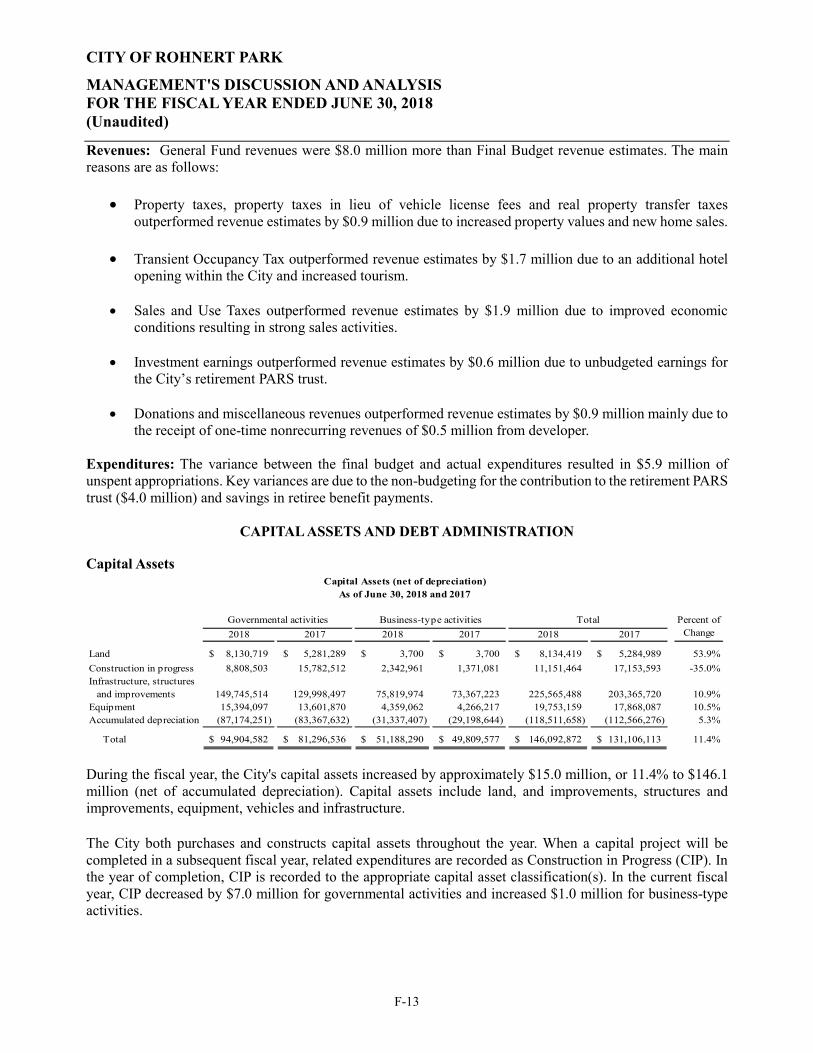
CITY OF ROHNERT PARK
MANAGEMENT'S DISCUSSION AND ANALYSIS FOR THE FISCAL YEAR ENDED JUNE 30, 2018 (Unaudited)
F-13
Revenues: General Fund revenues were $8.0 million more than Final Budget revenue estimates. The main reasons are as follows:
Property taxes, property taxes in lieu of vehicle license fees and real property transfer taxes outperformed revenue estimates by $0.9 million due to increased property values and new home sales.
Transient Occupancy Tax outperformed revenue estimates by $1.7 million due to an additional hotel opening within the City and increased tourism.
Sales and Use Taxes outperformed revenue estimates by $1.9 million due to improved economic conditions resulting in strong sales activities.
Investment earnings outperformed revenue estimates by $0.6 million due to unbudgeted earnings for the City’s retirement PARS trust.
Donations and miscellaneous revenues outperformed revenue estimates by $0.9 million mainly due to the receipt of one-time nonrecurring revenues of $0.5 million from developer.
Expenditures: The variance between the final budget and actual expenditures resulted in $5.9 million of unspent appropriations. Key variances are due to the non-budgeting for the contribution to the retirement PARS trust ($4.0 million) and savings in retiree benefit payments.
CAPITAL ASSETS AND DEBT ADMINISTRATION Capital Assets
Capital Assets (net of depreciation)As of June 30, 2018 and 2017
2018 2017 2018 2017 2018 2017
Land 8,130,719$ 5,281,289$ 3,700$ 3,700$ 8,134,419$ 5,284,989$ 53.9%
Construction in progress 8,808,503 15,782,512 2,342,961 1,371,081 11,151,464 17,153,593 -35.0%Infrastructure, structures
and improvements 149,745,514 129,998,497 75,819,974 73,367,223 225,565,488 203,365,720 10.9%Equipment 15,394,097 13,601,870 4,359,062 4,266,217 19,753,159 17,868,087 10.5%Accumulated depreciation (87,174,251) (83,367,632) (31,337,407) (29,198,644) (118,511,658) (112,566,276) 5.3%
Total 94,904,582$ 81,296,536$ 51,188,290$ 49,809,577$ 146,092,872$ 131,106,113$ 11.4%
Governmental activities Business-type activities Total Percent of Change
During the fiscal year, the City's capital assets increased by approximately $15.0 million, or 11.4% to $146.1 million (net of accumulated depreciation). Capital assets include land, and improvements, structures and improvements, equipment, vehicles and infrastructure. The City both purchases and constructs capital assets throughout the year. When a capital project will be completed in a subsequent fiscal year, related expenditures are recorded as Construction in Progress (CIP). In the year of completion, CIP is recorded to the appropriate capital asset classification(s). In the current fiscal year, CIP decreased by $7.0 million for governmental activities and increased $1.0 million for business-type activities.
CITY OF ROHNERT PARK
MANAGEMENT'S DISCUSSION AND ANALYSIS FOR THE FISCAL YEAR ENDED JUNE 30, 2018 (Unaudited)
F-14
During the year, the City completed and capitalized projects costing approximately $14.6 million. Some of the major projects completed were as follows:
General government – Snyder Lane Widening ($10.9 million); Snyder Lane Rehabilitation (Keiser Ave to Moura Ln) ($1.8 million); Various Streets maintenance including Enterprise and Seed Farm ($0.9 million); Park Restrooms Projects ($0.5 million).
The governmental activities also received donated assets of $6.2 million during the year.
During the fiscal year the Water Fund received donated assets of $2.1 million including $1.7 million for the Vast Oak Phase I water system improvements and $0.4 million for the Rohnert Park Expressway Phase 1 and 2. Additional information about the City’s capital assets can be found in Note 6 to the financial statements. Debt Administration
At June 30, 2018, the City’s governmental activities had total outstanding long-term debt of $0.8 million. Governmental activities long-term debt decreased by $0.4 million due to the payoff of the lease revenue refunding bond issued by the Rohnert Park Financing Authority (the Authority). At June 30, 2018, the City’s business-type activities had total outstanding long term debt of $8.9 million comprised of 2017 Sewer Revenue Refunding Bonds. The 2017 Sewer Revenue Bonds were used to fully refund the 2005 COPs. The 2005A Water Revenue Bonds of $3.3 million were paid off using advances from other funds. The City’s Ordinance imposes a limit on the amount of general obligation bonds the City can have outstanding at any given time. As of June 30, 2018, the City’s debt limit (15.0% of assessed valuation) was $730.5 million. At June 30, 2018, the City did not have any debt applicable to the limit outstanding. Additional information about the City’s long-term obligations can be found in Note 7 to the financial statements.
CITY OF ROHNERT PARK
MANAGEMENT'S DISCUSSION AND ANALYSIS FOR THE FISCAL YEAR ENDED JUNE 30, 2018 (Unaudited)
F-15
ECONOMIC FACTORS AND NEXT YEAR'S BUDGET ANALYSIS The following factors were considered in preparing the City's operating budget for FY 2018-19:
The budget is projecting continued moderate and sustainable growth in City revenues using conservative estimates.
In general, property taxes were projected to increase by 2.8%.
Transient Occupancy taxes were projected to increase by 9.1%.
Retail Sales tax was projected to increase 8.9% in consideration of economic forecasts prepared by our Sales Tax consultant.
The budget maintains continued focus on achieving municipal solvency.
Salaries and benefits were projected to increase approximately 3.0% based on negotiated with labor unions.
Overall, General Fund fiscal projections are expected to result in operating revenues sufficient to cover current baseline ongoing expense. For the fifth consecutive year, the City adopted a balanced budget. Although the City has made significant progress, unfunded liabilities continue to present significant challenges to long-term financial solvency and service level solvency. The City's FY 18-19 budget which includes the Five Year Capital Improvement Program budget can be found at http:// http://www.rpcity.org/city_hall/departments/finance.
REQUEST FOR INFORMATION
This financial report is designed to provide a general overview of the City's finances for all interested parties. Questions concerning any of the information provided in this report or requests for additional information should be addressed to the City of Rohnert Park Finance Director, 130 Avram Avenue, Rohnert Park, CA 94928. The City's Comprehensive Annual Financial Report can also be found on the City's website.
F-16
This page is left intentionally blank.
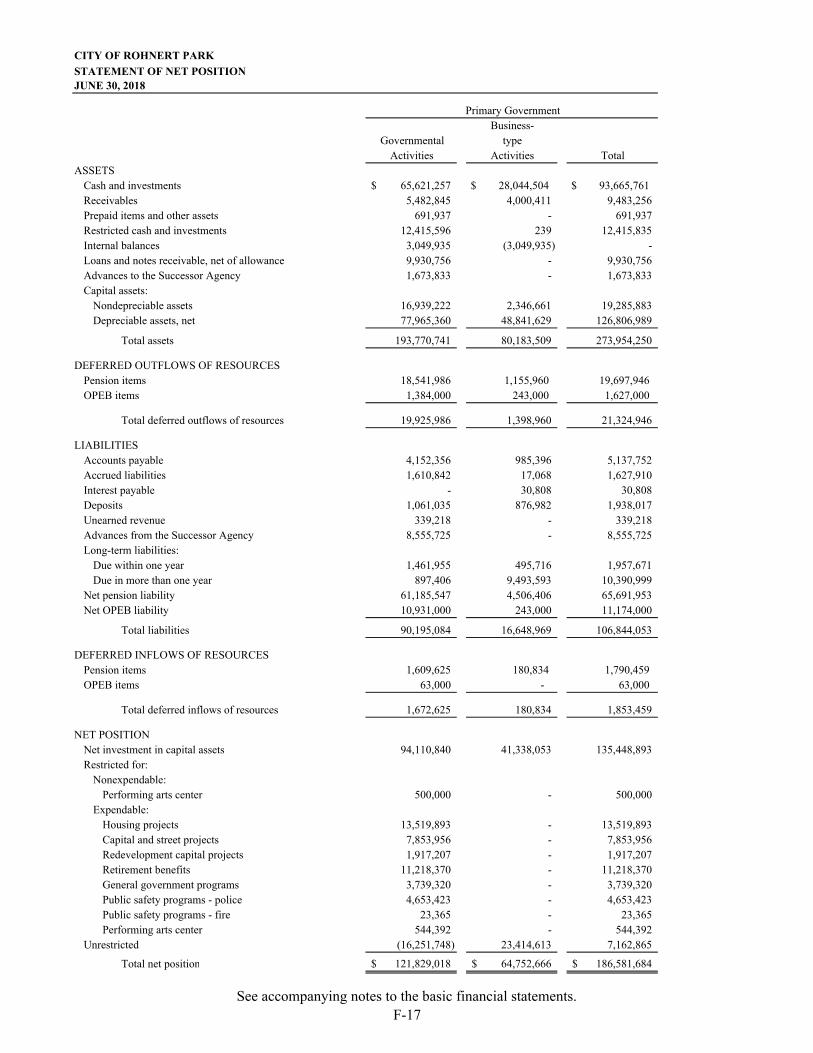
CITY OF ROHNERT PARK
STATEMENT OF NET POSITIONJUNE 30, 2018
Business-Governmental type
Activities Activities TotalASSETS
Cash and investments 65,621,257$ $ 28,044,504 $ 93,665,761 Receivables 5,482,845 4,000,411 9,483,256 Prepaid items and other assets 691,937 - 691,937 Restricted cash and investments 12,415,596 239 12,415,835 Internal balances 3,049,935 (3,049,935) - Loans and notes receivable, net of allowance 9,930,756 - 9,930,756 Advances to the Successor Agency 1,673,833 - 1,673,833 Capital assets:
Nondepreciable assets 16,939,222 2,346,661 19,285,883 Depreciable assets, net 77,965,360 48,841,629 126,806,989
Total assets 193,770,741 80,183,509 273,954,250
DEFERRED OUTFLOWS OF RESOURCESPension items 18,541,986 1,155,960 19,697,946 OPEB items 1,384,000 243,000 1,627,000
Total deferred outflows of resources 19,925,986 1,398,960 21,324,946
LIABILITIESAccounts payable 4,152,356 985,396 5,137,752 Accrued liabilities 1,610,842 17,068 1,627,910 Interest payable - 30,808 30,808 Deposits 1,061,035 876,982 1,938,017 Unearned revenue 339,218 - 339,218 Advances from the Successor Agency 8,555,725 - 8,555,725 Long-term liabilities:
Due within one year 1,461,955 495,716 1,957,671 Due in more than one year 897,406 9,493,593 10,390,999
Net pension liability 61,185,547 4,506,406 65,691,953 Net OPEB liability 10,931,000 243,000 11,174,000
Total liabilities 90,195,084 16,648,969 106,844,053
DEFERRED INFLOWS OF RESOURCESPension items 1,609,625 180,834 1,790,459 OPEB items 63,000 - 63,000
Total deferred inflows of resources 1,672,625 180,834 1,853,459
NET POSITIONNet investment in capital assets 94,110,840 41,338,053 135,448,893 Restricted for:
Nonexpendable:Performing arts center 500,000 - 500,000
Expendable:Housing projects 13,519,893 - 13,519,893 Capital and street projects 7,853,956 - 7,853,956 Redevelopment capital projects 1,917,207 - 1,917,207 Retirement benefits 11,218,370 - 11,218,370 General government programs 3,739,320 - 3,739,320 Public safety programs - police 4,653,423 - 4,653,423 Public safety programs - fire 23,365 - 23,365 Performing arts center 544,392 - 544,392
Unrestricted (16,251,748) 23,414,613 7,162,865
Total net position 121,829,018$ 64,752,666$ 186,581,684$
Primary Government
See accompanying notes to the basic financial statements.F-17
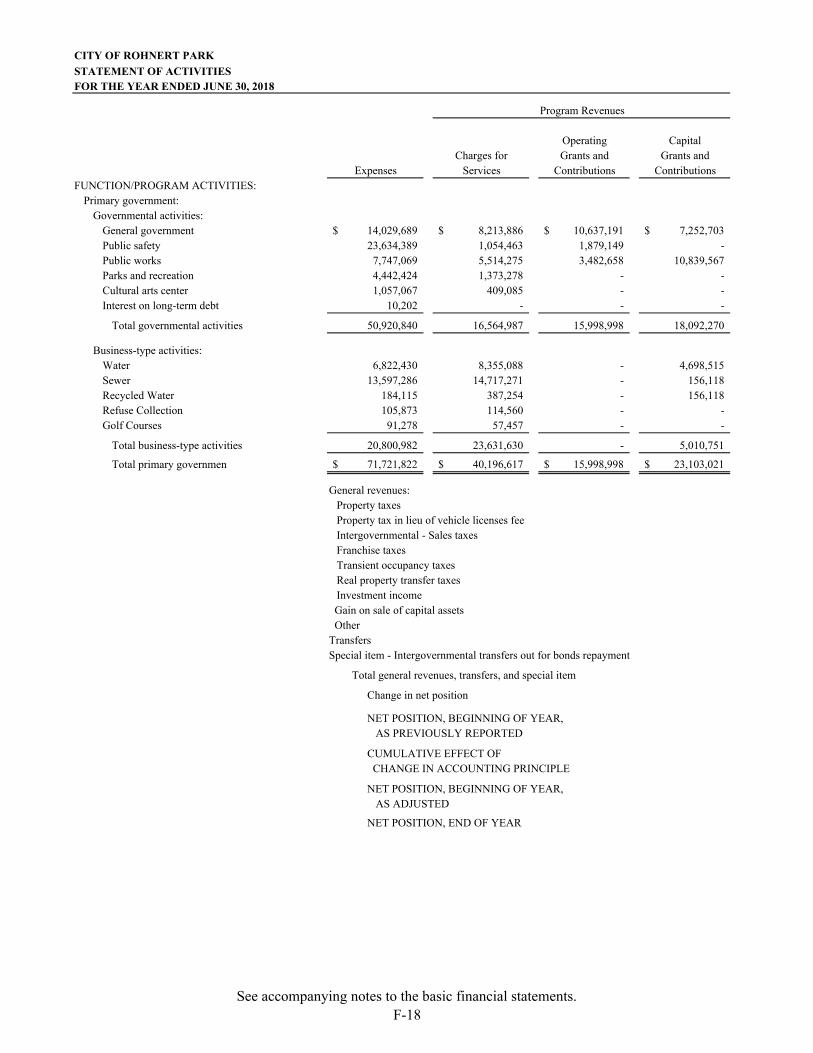
CITY OF ROHNERT PARK
STATEMENT OF ACTIVITIESFOR THE YEAR ENDED JUNE 30, 2018
Operating CapitalCharges for Grants and Grants and
Expenses Services Contributions ContributionsFUNCTION/PROGRAM ACTIVITIES:
Primary government:Governmental activities:
General government 14,029,689$ 8,213,886$ 10,637,191$ 7,252,703$ Public safety 23,634,389 1,054,463 1,879,149 - Public works 7,747,069 5,514,275 3,482,658 10,839,567 Parks and recreation 4,442,424 1,373,278 - - Cultural arts center 1,057,067 409,085 - - Interest on long-term debt 10,202 - - -
Total governmental activities 50,920,840 16,564,987 15,998,998 18,092,270
Business-type activities:Water 6,822,430 8,355,088 - 4,698,515 Sewer 13,597,286 14,717,271 - 156,118 Recycled Water 184,115 387,254 - 156,118 Refuse Collection 105,873 114,560 - - Golf Courses 91,278 57,457 - -
Total business-type activities 20,800,982 23,631,630 - 5,010,751
Total primary government 71,721,822$ 40,196,617$ 15,998,998$ 23,103,021$
General revenues:Property taxesProperty tax in lieu of vehicle licenses feeIntergovernmental - Sales taxesFranchise taxesTransient occupancy taxesReal property transfer taxesInvestment income
Gain on sale of capital assets OtherTransfersSpecial item - Intergovernmental transfers out for bonds repayment
Total general revenues, transfers, and special item
Change in net position
NET POSITION, BEGINNING OF YEAR, AS PREVIOUSLY REPORTED
CUMULATIVE EFFECT OF CHANGE IN ACCOUNTING PRINCIPLE
NET POSITION, BEGINNING OF YEAR, AS ADJUSTED
NET POSITION, END OF YEAR
Program Revenues
See accompanying notes to the basic financial statements.F-18
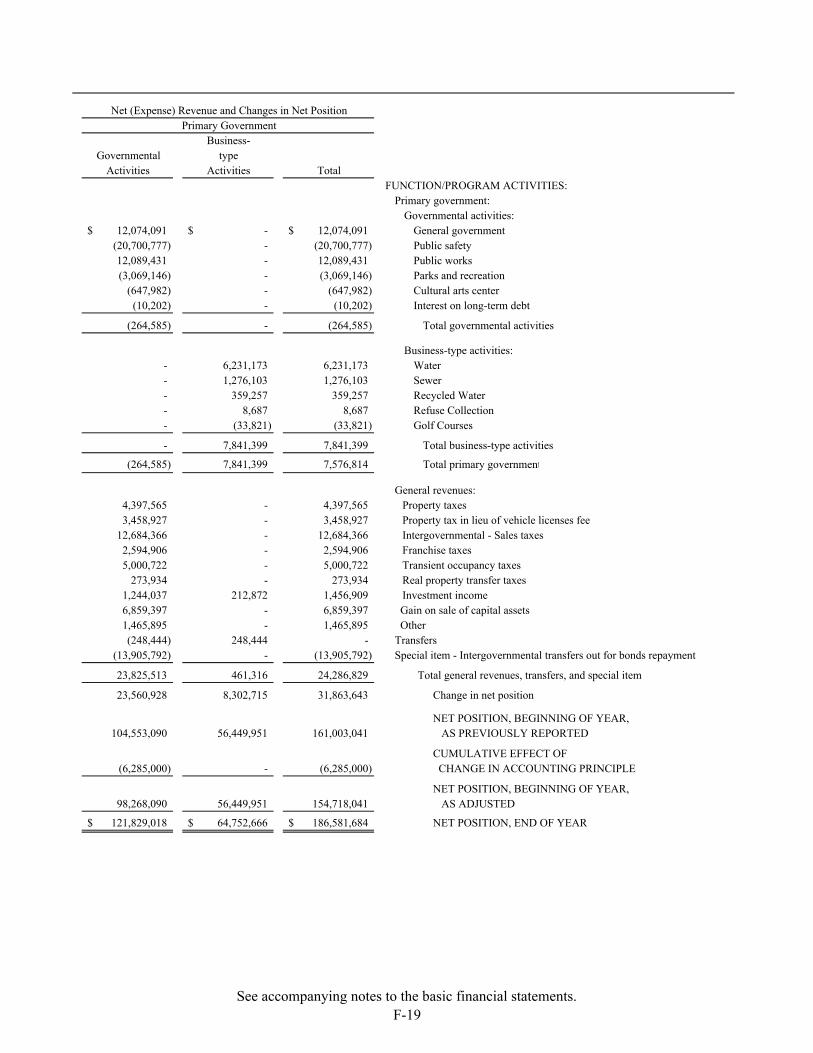
Net (Expense) Revenue and Changes in Net Position
Business-Governmental type
Activities Activities TotalFUNCTION/PROGRAM ACTIVITIES:
Primary government:Governmental activities:
12,074,091$ -$ 12,074,091$ General government(20,700,777) - (20,700,777) Public safety12,089,431 - 12,089,431 Public works(3,069,146) - (3,069,146) Parks and recreation
(647,982) - (647,982) Cultural arts center(10,202) - (10,202) Interest on long-term debt
(264,585) - (264,585) Total governmental activities
Business-type activities:- 6,231,173 6,231,173 Water- 1,276,103 1,276,103 Sewer- 359,257 359,257 Recycled Water- 8,687 8,687 Refuse Collection- (33,821) (33,821) Golf Courses
- 7,841,399 7,841,399 Total business-type activities
(264,585) 7,841,399 7,576,814 Total primary government
General revenues:4,397,565 - 4,397,565 Property taxes3,458,927 - 3,458,927 Property tax in lieu of vehicle licenses fee
12,684,366 - 12,684,366 Intergovernmental - Sales taxes2,594,906 - 2,594,906 Franchise taxes5,000,722 - 5,000,722 Transient occupancy taxes
273,934 - 273,934 Real property transfer taxes1,244,037 212,872 1,456,909 Investment income6,859,397 - 6,859,397 Gain on sale of capital assets1,465,895 - 1,465,895 Other(248,444) 248,444 - Transfers
(13,905,792) - (13,905,792) Special item - Intergovernmental transfers out for bonds repayment
23,825,513 461,316 24,286,829 Total general revenues, transfers, and special item
23,560,928 8,302,715 31,863,643 Change in net position
NET POSITION, BEGINNING OF YEAR, 104,553,090 56,449,951 161,003,041 AS PREVIOUSLY REPORTED
CUMULATIVE EFFECT OF(6,285,000) - (6,285,000) CHANGE IN ACCOUNTING PRINCIPLE
NET POSITION, BEGINNING OF YEAR, 98,268,090 56,449,951 154,718,041 AS ADJUSTED
121,829,018$ 64,752,666$ 186,581,684$ NET POSITION, END OF YEAR
Primary Government
See accompanying notes to the basic financial statements.F-19
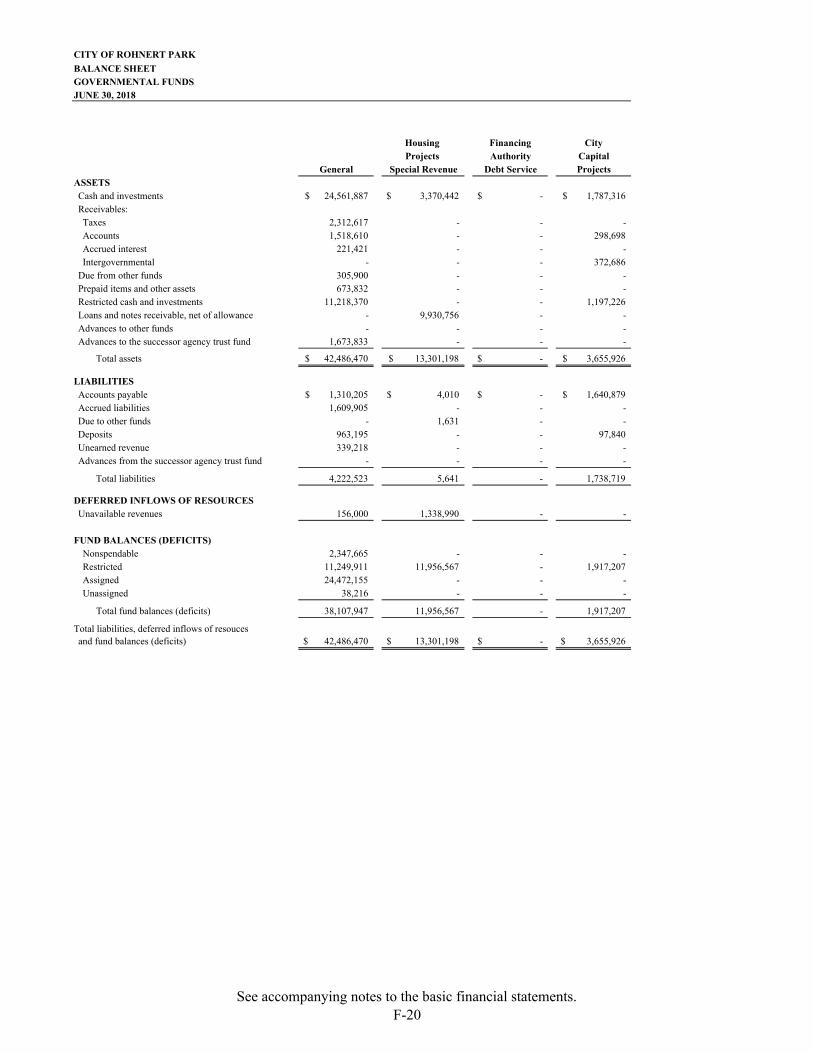
CITY OF ROHNERT PARK
BALANCE SHEETGOVERNMENTAL FUNDSJUNE 30, 2018
Housing Financing CityProjects Authority Capital
General Special Revenue Debt Service Projects
Cash and investments 24,561,887$ 3,370,442$ -$ 1,787,316$ Receivables:Taxes 2,312,617 - - - Accounts 1,518,610 - - 298,698 Accrued interest 221,421 - - - Intergovernmental - - - 372,686
Due from other funds 305,900 - - - Prepaid items and other assets 673,832 - - - Restricted cash and investments 11,218,370 - - 1,197,226 Loans and notes receivable, net of allowance - 9,930,756 - - Advances to other funds - - - - Advances to the successor agency trust fund 1,673,833 - - -
Total assets 42,486,470$ 13,301,198$ -$ 3,655,926$
Accounts payable 1,310,205$ 4,010$ -$ 1,640,879$ Accrued liabilities 1,609,905 - - - Due to other funds - 1,631 - - Deposits 963,195 - - 97,840 Unearned revenue 339,218 - - - Advances from the successor agency trust fund - - - -
Total liabilities 4,222,523 5,641 - 1,738,719
Unavailable revenues 156,000 1,338,990 - -
Nonspendable 2,347,665 - - - Restricted 11,249,911 11,956,567 - 1,917,207 Assigned 24,472,155 - - - Unassigned 38,216 - - -
Total fund balances (deficits) 38,107,947 11,956,567 - 1,917,207 Total liabilities, deferred inflows of resoucesand fund balances (deficits) 42,486,470$ 13,301,198$ -$ 3,655,926$
ASSETS
LIABILITIES
FUND BALANCES (DEFICITS)
DEFERRED INFLOWS OF RESOURCES
See accompanying notes to the basic financial statements.F-20
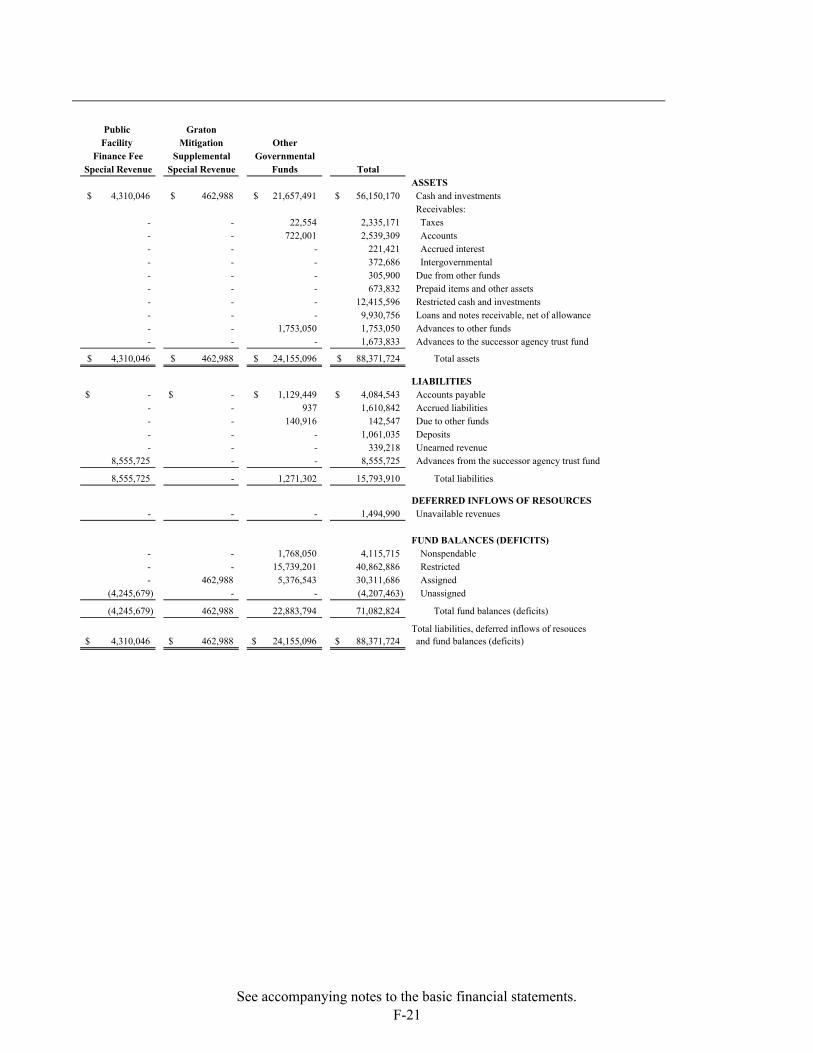
Public GratonFacility Mitigation Other
Finance Fee Supplemental GovernmentalSpecial Revenue Special Revenue Funds Total
ASSETS4,310,046$ 462,988$ 21,657,491$ 56,150,170$ Cash and investments
Receivables:- - 22,554 2,335,171 Taxes- - 722,001 2,539,309 Accounts- - - 221,421 Accrued interest- - - 372,686 Intergovernmental- - - 305,900 Due from other funds- - - 673,832 Prepaid items and other assets- - - 12,415,596 Restricted cash and investments- - - 9,930,756 Loans and notes receivable, net of allowance- - 1,753,050 1,753,050 Advances to other funds- - - 1,673,833 Advances to the successor agency trust fund
4,310,046$ 462,988$ 24,155,096$ 88,371,724$ Total assets
LIABILITIES-$ -$ 1,129,449$ 4,084,543$ Accounts payable- - 937 1,610,842 Accrued liabilities- - 140,916 142,547 Due to other funds- - - 1,061,035 Deposits- - - 339,218 Unearned revenue
8,555,725 - - 8,555,725 Advances from the successor agency trust fund
8,555,725 - 1,271,302 15,793,910 Total liabilities
DEFERRED INFLOWS OF RESOURCES- - - 1,494,990 Unavailable revenues
FUND BALANCES (DEFICITS)- - 1,768,050 4,115,715 Nonspendable- - 15,739,201 40,862,886 Restricted- 462,988 5,376,543 30,311,686 Assigned
(4,245,679) - - (4,207,463) Unassigned
(4,245,679) 462,988 22,883,794 71,082,824 Total fund balances (deficits) Total liabilities, deferred inflows of resouces
4,310,046$ 462,988$ 24,155,096$ 88,371,724$ and fund balances (deficits)
See accompanying notes to the basic financial statements.F-21

F-22
This page is left intentionally blank.
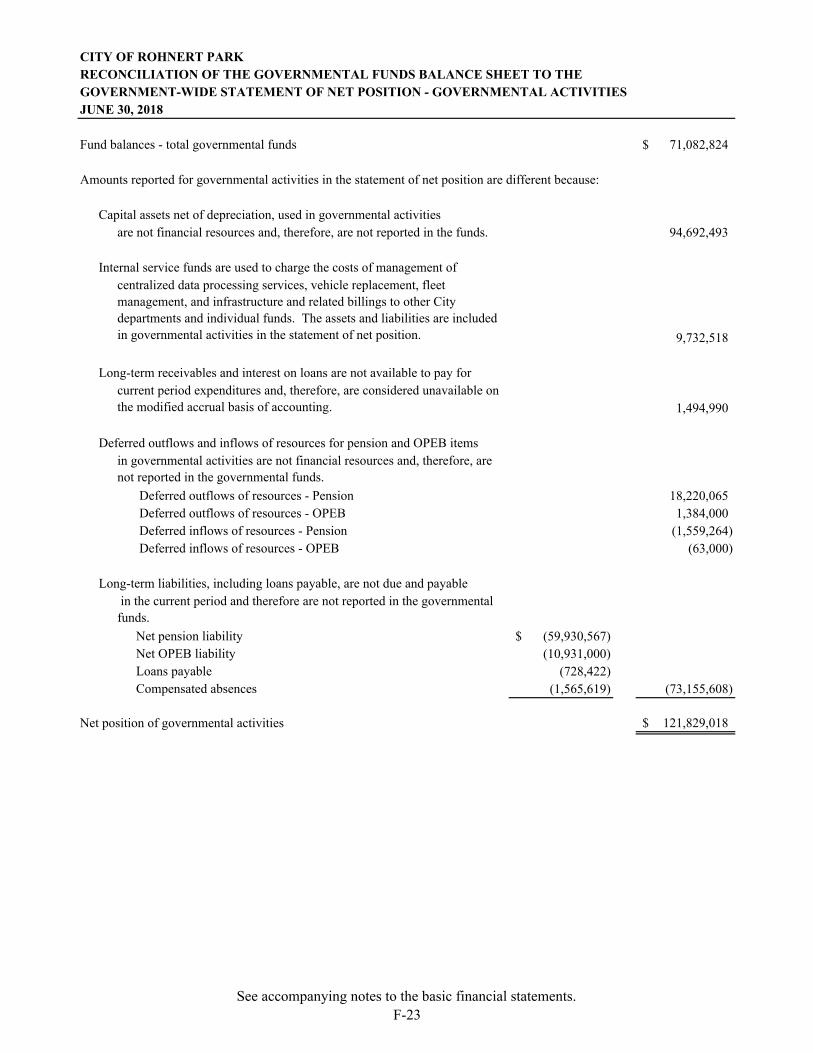
CITY OF ROHNERT PARKRECONCILIATION OF THE GOVERNMENTAL FUNDS BALANCE SHEET TO THEGOVERNMENT-WIDE STATEMENT OF NET POSITION - GOVERNMENTAL ACTIVITIESJUNE 30, 2018
Fund balances - total governmental funds 71,082,824$
Amounts reported for governmental activities in the statement of net position are different because:
Capital assets net of depreciation, used in governmental activities are not financial resources and, therefore, are not reported in the funds. 94,692,493
Internal service funds are used to charge the costs of management of
9,732,518
Long-term receivables and interest on loans are not available to pay for
1,494,990
Deferred outflows and inflows of resources for pension and OPEB items
Deferred outflows of resources - Pension 18,220,065 Deferred outflows of resources - OPEB 1,384,000 Deferred inflows of resources - Pension (1,559,264) Deferred inflows of resources - OPEB (63,000)
Long-term liabilities, including loans payable, are not due and payable
Net pension liability (59,930,567)$ Net OPEB liability (10,931,000) Loans payable (728,422) Compensated absences (1,565,619) (73,155,608)
Net position of governmental activities 121,829,018$
centralized data processing services, vehicle replacement, fleet management, and infrastructure and related billings to other City departments and individual funds. The assets and liabilities are included in governmental activities in the statement of net position.
current period expenditures and, therefore, are considered unavailable on the modified accrual basis of accounting.
in the current period and therefore are not reported in the governmental funds.
in governmental activities are not financial resources and, therefore, are not reported in the governmental funds.
See accompanying notes to the basic financial statements.F-23
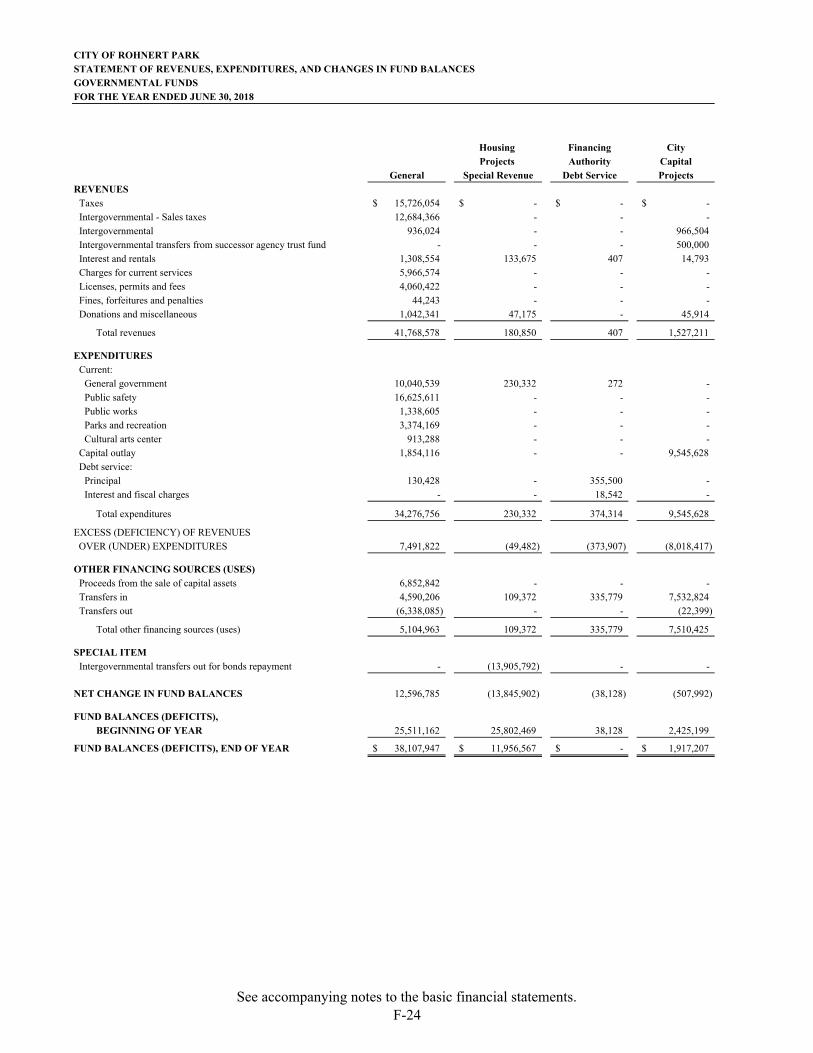
CITY OF ROHNERT PARKSTATEMENT OF REVENUES, EXPENDITURES, AND CHANGES IN FUND BALANCESGOVERNMENTAL FUNDSFOR THE YEAR ENDED JUNE 30, 2018
Housing Financing CityProjects Authority Capital
General Special Revenue Debt Service ProjectsREVENUES
Taxes 15,726,054$ -$ -$ -$ Intergovernmental - Sales taxes 12,684,366 - - - Intergovernmental 936,024 - - 966,504 Intergovernmental transfers from successor agency trust fund - - - 500,000 Interest and rentals 1,308,554 133,675 407 14,793 Charges for current services 5,966,574 - - - Licenses, permits and fees 4,060,422 - - - Fines, forfeitures and penalties 44,243 - - - Donations and miscellaneous 1,042,341 47,175 - 45,914
Total revenues 41,768,578 180,850 407 1,527,211
EXPENDITURESCurrent:
General government 10,040,539 230,332 272 - Public safety 16,625,611 - - - Public works 1,338,605 - - - Parks and recreation 3,374,169 - - - Cultural arts center 913,288 - - -
Capital outlay 1,854,116 - - 9,545,628 Debt service:
Principal 130,428 - 355,500 - Interest and fiscal charges - - 18,542 -
Total expenditures 34,276,756 230,332 374,314 9,545,628
EXCESS (DEFICIENCY) OF REVENUES OVER (UNDER) EXPENDITURES 7,491,822 (49,482) (373,907) (8,018,417)
OTHER FINANCING SOURCES (USES)Proceeds from the sale of capital assets 6,852,842 - - - Transfers in 4,590,206 109,372 335,779 7,532,824 Transfers out (6,338,085) - - (22,399)
Total other financing sources (uses) 5,104,963 109,372 335,779 7,510,425
SPECIAL ITEMIntergovernmental transfers out for bonds repayment - (13,905,792) - -
NET CHANGE IN FUND BALANCES 12,596,785 (13,845,902) (38,128) (507,992)
FUND BALANCES (DEFICITS), BEGINNING OF YEAR 25,511,162 25,802,469 38,128 2,425,199
FUND BALANCES (DEFICITS), END OF YEAR 38,107,947$ 11,956,567$ -$ 1,917,207$
See accompanying notes to the basic financial statements.F-24
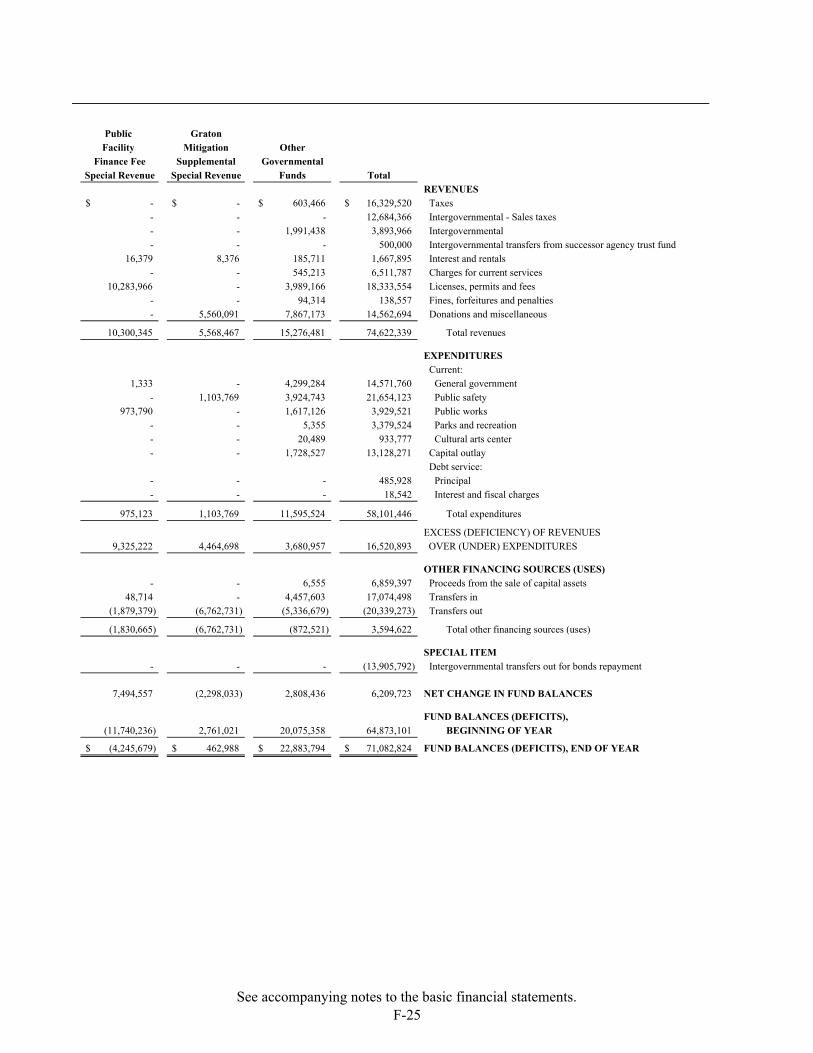
Public GratonFacility Mitigation Other
Finance Fee Supplemental GovernmentalSpecial Revenue Special Revenue Funds Total
REVENUES-$ -$ 603,466$ 16,329,520$ Taxes- - - 12,684,366 Intergovernmental - Sales taxes- - 1,991,438 3,893,966 Intergovernmental- - - 500,000 Intergovernmental transfers from successor agency trust fund
16,379 8,376 185,711 1,667,895 Interest and rentals- - 545,213 6,511,787 Charges for current services
10,283,966 - 3,989,166 18,333,554 Licenses, permits and fees- - 94,314 138,557 Fines, forfeitures and penalties- 5,560,091 7,867,173 14,562,694 Donations and miscellaneous
10,300,345 5,568,467 15,276,481 74,622,339 Total revenues
EXPENDITURESCurrent:
1,333 - 4,299,284 14,571,760 General government- 1,103,769 3,924,743 21,654,123 Public safety
973,790 - 1,617,126 3,929,521 Public works- - 5,355 3,379,524 Parks and recreation- - 20,489 933,777 Cultural arts center- - 1,728,527 13,128,271 Capital outlay
Debt service:- - - 485,928 Principal- - - 18,542 Interest and fiscal charges
975,123 1,103,769 11,595,524 58,101,446 Total expenditures
EXCESS (DEFICIENCY) OF REVENUES9,325,222 4,464,698 3,680,957 16,520,893 OVER (UNDER) EXPENDITURES
OTHER FINANCING SOURCES (USES)- - 6,555 6,859,397 Proceeds from the sale of capital assets
48,714 - 4,457,603 17,074,498 Transfers in(1,879,379) (6,762,731) (5,336,679) (20,339,273) Transfers out
(1,830,665) (6,762,731) (872,521) 3,594,622 Total other financing sources (uses)
SPECIAL ITEM- - - (13,905,792) Intergovernmental transfers out for bonds repayment
7,494,557 (2,298,033) 2,808,436 6,209,723 NET CHANGE IN FUND BALANCES
FUND BALANCES (DEFICITS), (11,740,236) 2,761,021 20,075,358 64,873,101 BEGINNING OF YEAR
(4,245,679)$ 462,988$ 22,883,794$ 71,082,824$ FUND BALANCES (DEFICITS), END OF YEAR
See accompanying notes to the basic financial statements.F-25
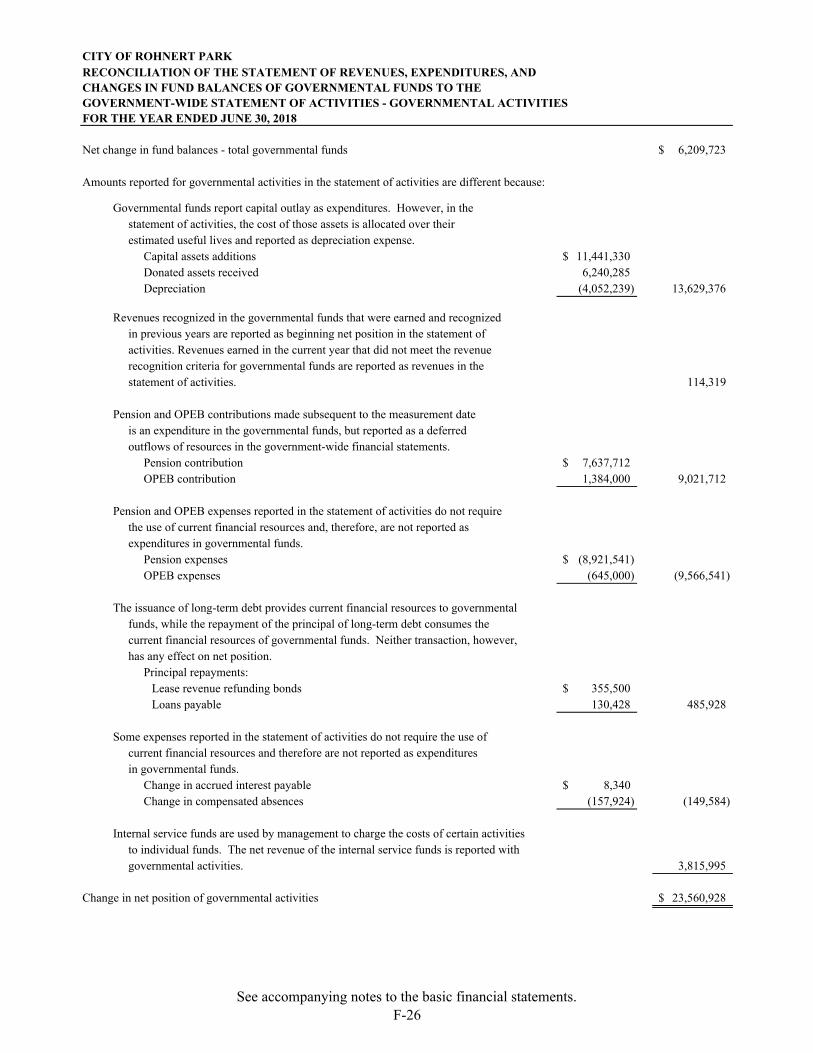
CITY OF ROHNERT PARKRECONCILIATION OF THE STATEMENT OF REVENUES, EXPENDITURES, ANDCHANGES IN FUND BALANCES OF GOVERNMENTAL FUNDS TO THEGOVERNMENT-WIDE STATEMENT OF ACTIVITIES - GOVERNMENTAL ACTIVITIESFOR THE YEAR ENDED JUNE 30, 2018
Net change in fund balances - total governmental funds 6,209,723$
Amounts reported for governmental activities in the statement of activities are different because:
Governmental funds report capital outlay as expenditures. However, in the statement of activities, the cost of those assets is allocated over theirestimated useful lives and reported as depreciation expense.
Capital assets additions 11,441,330$ Donated assets received 6,240,285 Depreciation (4,052,239) 13,629,376
Revenues recognized in the governmental funds that were earned and recognizedin previous years are reported as beginning net position in the statement of activities. Revenues earned in the current year that did not meet the revenue recognition criteria for governmental funds are reported as revenues in the statement of activities. 114,319
Pension and OPEB contributions made subsequent to the measurement date is an expenditure in the governmental funds, but reported as a deferred outflows of resources in the government-wide financial statements.
Pension contribution 7,637,712$ OPEB contribution 1,384,000 9,021,712
Pension and OPEB expenses reported in the statement of activities do not requirethe use of current financial resources and, therefore, are not reported as expenditures in governmental funds.
Pension expenses (8,921,541)$ OPEB expenses (645,000) (9,566,541)
The issuance of long-term debt provides current financial resources to governmental funds, while the repayment of the principal of long-term debt consumes the current financial resources of governmental funds. Neither transaction, however, has any effect on net position.
Principal repayments:Lease revenue refunding bonds 355,500$ Loans payable 130,428 485,928
Some expenses reported in the statement of activities do not require the use of current financial resources and therefore are not reported as expendituresin governmental funds.
Change in accrued interest payable 8,340$ Change in compensated absences (157,924) (149,584)
Internal service funds are used by management to charge the costs of certain activitiesto individual funds. The net revenue of the internal service funds is reported withgovernmental activities. 3,815,995
Change in net position of governmental activities 23,560,928$
See accompanying notes to the basic financial statements.F-26
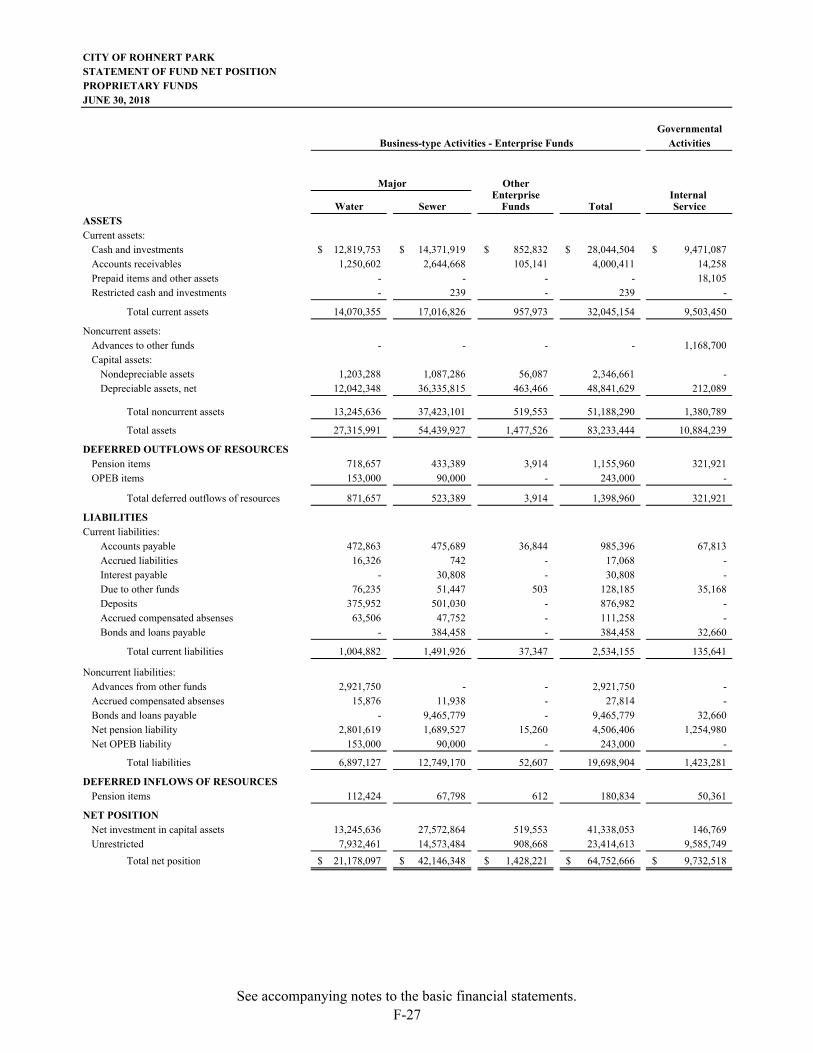
CITY OF ROHNERT PARKSTATEMENT OF FUND NET POSITIONPROPRIETARY FUNDSJUNE 30, 2018
GovernmentalActivities
OtherEnterprise Internal
Water Sewer Funds Total ServiceASSETSCurrent assets:
Cash and investments 12,819,753$ 14,371,919$ 852,832$ 28,044,504$ 9,471,087$ Accounts receivables 1,250,602 2,644,668 105,141 4,000,411 14,258 Prepaid items and other assets - - - - 18,105 Restricted cash and investments - 239 - 239 -
Total current assets 14,070,355 17,016,826 957,973 32,045,154 9,503,450
Noncurrent assets:Advances to other funds - - - - 1,168,700 Capital assets:
Nondepreciable assets 1,203,288 1,087,286 56,087 2,346,661 - Depreciable assets, net 12,042,348 36,335,815 463,466 48,841,629 212,089
Total noncurrent assets 13,245,636 37,423,101 519,553 51,188,290 1,380,789
Total assets 27,315,991 54,439,927 1,477,526 83,233,444 10,884,239
DEFERRED OUTFLOWS OF RESOURCESPension items 718,657 433,389 3,914 1,155,960 321,921 OPEB items 153,000 90,000 - 243,000 -
Total deferred outflows of resources 871,657 523,389 3,914 1,398,960 321,921
LIABILITIESCurrent liabilities:
Accounts payable 472,863 475,689 36,844 985,396 67,813 Accrued liabilities 16,326 742 - 17,068 - Interest payable - 30,808 - 30,808 - Due to other funds 76,235 51,447 503 128,185 35,168 Deposits 375,952 501,030 - 876,982 - Accrued compensated absenses 63,506 47,752 - 111,258 - Bonds and loans payable - 384,458 - 384,458 32,660
Total current liabilities 1,004,882 1,491,926 37,347 2,534,155 135,641
Noncurrent liabilities:Advances from other funds 2,921,750 - - 2,921,750 - Accrued compensated absenses 15,876 11,938 - 27,814 - Bonds and loans payable - 9,465,779 - 9,465,779 32,660 Net pension liability 2,801,619 1,689,527 15,260 4,506,406 1,254,980 Net OPEB liability 153,000 90,000 - 243,000 -
Total liabilities 6,897,127 12,749,170 52,607 19,698,904 1,423,281
DEFERRED INFLOWS OF RESOURCESPension items 112,424 67,798 612 180,834 50,361
NET POSITIONNet investment in capital assets 13,245,636 27,572,864 519,553 41,338,053 146,769 Unrestricted 7,932,461 14,573,484 908,668 23,414,613 9,585,749
Total net position 21,178,097$ 42,146,348$ 1,428,221$ 64,752,666$ 9,732,518$
Business-type Activities - Enterprise Funds
Major
See accompanying notes to the basic financial statements.F-27
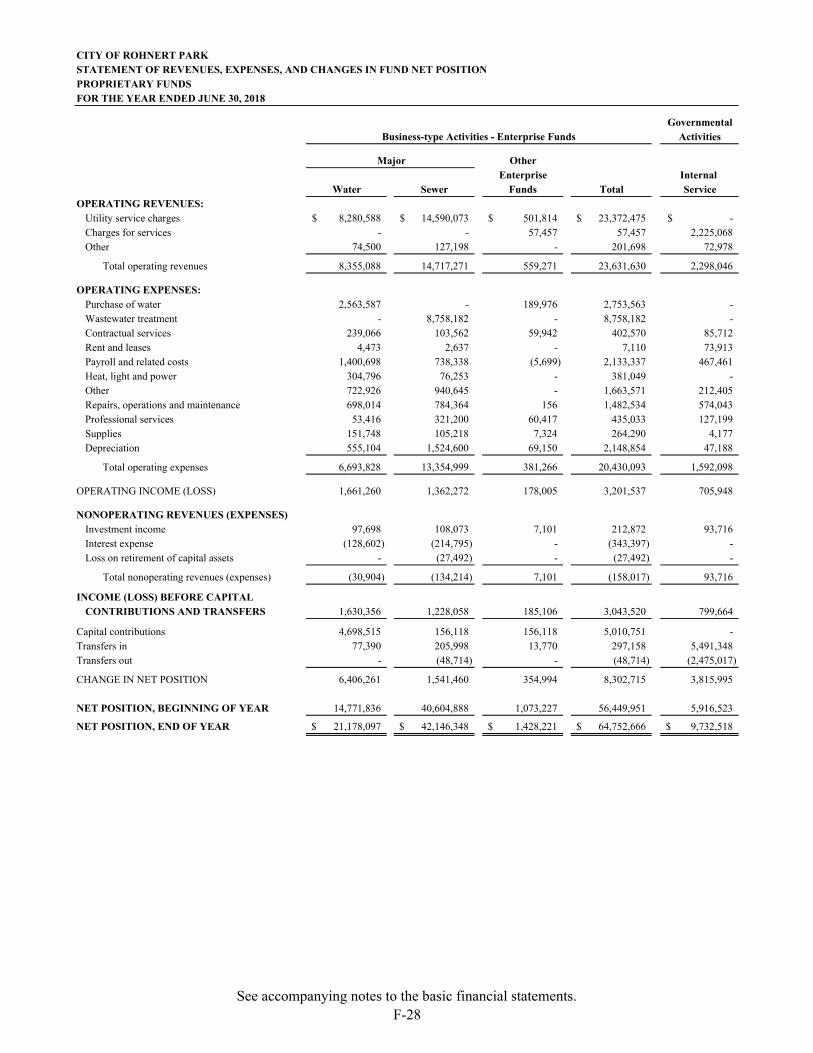
CITY OF ROHNERT PARKSTATEMENT OF REVENUES, EXPENSES, AND CHANGES IN FUND NET POSITIONPROPRIETARY FUNDSFOR THE YEAR ENDED JUNE 30, 2018
GovernmentalActivities
OtherEnterprise Internal
Water Sewer Funds Total ServiceOPERATING REVENUES:
Utility service charges 8,280,588$ 14,590,073$ 501,814$ 23,372,475$ -$ Charges for services - - 57,457 57,457 2,225,068 Other 74,500 127,198 - 201,698 72,978
Total operating revenues 8,355,088 14,717,271 559,271 23,631,630 2,298,046
OPERATING EXPENSES:Purchase of water 2,563,587 - 189,976 2,753,563 - Wastewater treatment - 8,758,182 - 8,758,182 - Contractual services 239,066 103,562 59,942 402,570 85,712 Rent and leases 4,473 2,637 - 7,110 73,913 Payroll and related costs 1,400,698 738,338 (5,699) 2,133,337 467,461 Heat, light and power 304,796 76,253 - 381,049 - Other 722,926 940,645 - 1,663,571 212,405 Repairs, operations and maintenance 698,014 784,364 156 1,482,534 574,043 Professional services 53,416 321,200 60,417 435,033 127,199 Supplies 151,748 105,218 7,324 264,290 4,177 Depreciation 555,104 1,524,600 69,150 2,148,854 47,188
Total operating expenses 6,693,828 13,354,999 381,266 20,430,093 1,592,098
OPERATING INCOME (LOSS) 1,661,260 1,362,272 178,005 3,201,537 705,948
NONOPERATING REVENUES (EXPENSES)Investment income 97,698 108,073 7,101 212,872 93,716 Interest expense (128,602) (214,795) - (343,397) - Loss on retirement of capital assets - (27,492) - (27,492) -
Total nonoperating revenues (expenses) (30,904) (134,214) 7,101 (158,017) 93,716
INCOME (LOSS) BEFORE CAPITALCONTRIBUTIONS AND TRANSFERS 1,630,356 1,228,058 185,106 3,043,520 799,664
Capital contributions 4,698,515 156,118 156,118 5,010,751 - Transfers in 77,390 205,998 13,770 297,158 5,491,348 Transfers out - (48,714) - (48,714) (2,475,017)
CHANGE IN NET POSITION 6,406,261 1,541,460 354,994 8,302,715 3,815,995
NET POSITION, BEGINNING OF YEAR 14,771,836 40,604,888 1,073,227 56,449,951 5,916,523
NET POSITION, END OF YEAR 21,178,097$ 42,146,348$ 1,428,221$ 64,752,666$ 9,732,518$
Business-type Activities - Enterprise Funds
Major
See accompanying notes to the basic financial statements.F-28
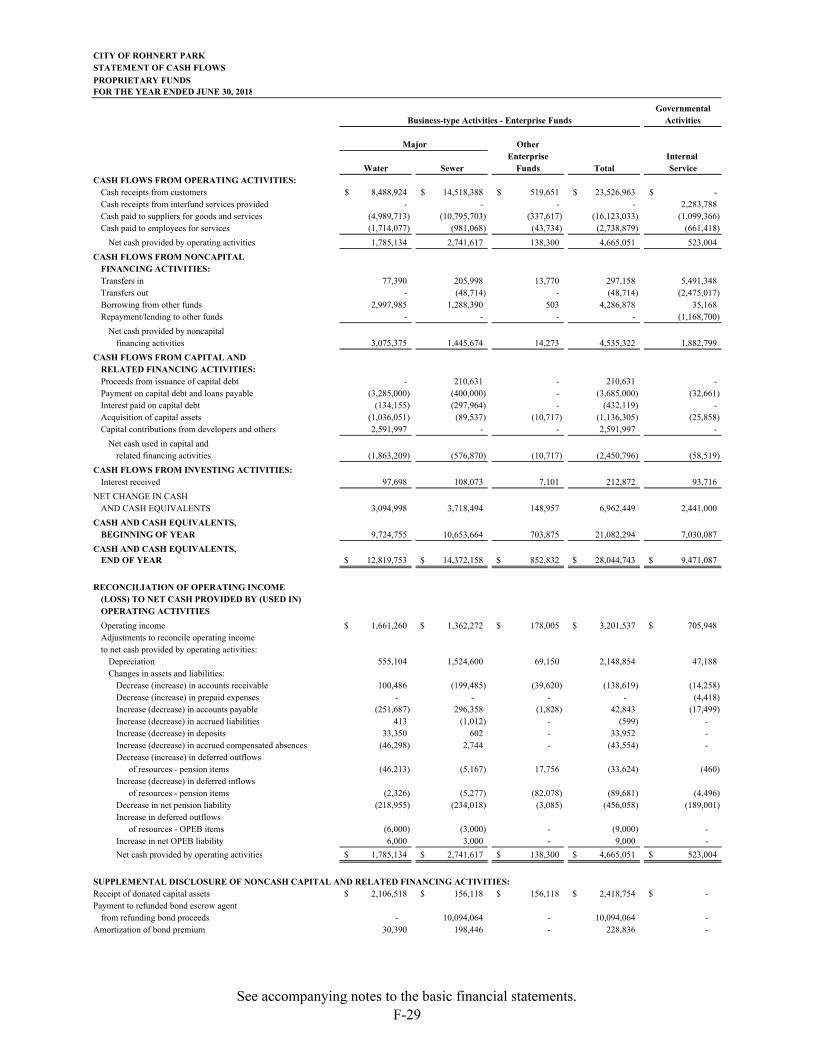
CITY OF ROHNERT PARKSTATEMENT OF CASH FLOWS
PROPRIETARY FUNDSFOR THE YEAR ENDED JUNE 30, 2018
GovernmentalActivities
OtherEnterprise Internal
Water Sewer Funds Total ServiceCASH FLOWS FROM OPERATING ACTIVITIES:
Cash receipts from customers 8,488,924$ 14,518,388$ 519,651$ 23,526,963$ -$ Cash receipts from interfund services provided - - - - 2,283,788 Cash paid to suppliers for goods and services (4,989,713) (10,795,703) (337,617) (16,123,033) (1,099,366) Cash paid to employees for services (1,714,077) (981,068) (43,734) (2,738,879) (661,418)
Net cash provided by operating activities 1,785,134 2,741,617 138,300 4,665,051 523,004
CASH FLOWS FROM NONCAPITAL FINANCING ACTIVITIES:Transfers in 77,390 205,998 13,770 297,158 5,491,348 Transfers out - (48,714) - (48,714) (2,475,017) Borrowing from other funds 2,997,985 1,288,390 503 4,286,878 35,168 Repayment/lending to other funds - - - - (1,168,700)
Net cash provided by noncapitalfinancing activities 3,075,375 1,445,674 14,273 4,535,322 1,882,799
CASH FLOWS FROM CAPITAL AND RELATED FINANCING ACTIVITIES:Proceeds from issuance of capital debt - 210,631 - 210,631 - Payment on capital debt and loans payable (3,285,000) (400,000) - (3,685,000) (32,661) Interest paid on capital debt (134,155) (297,964) - (432,119) - Acquisition of capital assets (1,036,051) (89,537) (10,717) (1,136,305) (25,858) Capital contributions from developers and others 2,591,997 - - 2,591,997 -
Net cash used in capital and related financing activities (1,863,209) (576,870) (10,717) (2,450,796) (58,519)
CASH FLOWS FROM INVESTING ACTIVITIES:Interest received 97,698 108,073 7,101 212,872 93,716
NET CHANGE IN CASH AND CASH EQUIVALENTS 3,094,998 3,718,494 148,957 6,962,449 2,441,000
CASH AND CASH EQUIVALENTS, BEGINNING OF YEAR 9,724,755 10,653,664 703,875 21,082,294 7,030,087
CASH AND CASH EQUIVALENTS, END OF YEAR 12,819,753$ 14,372,158$ 852,832$ 28,044,743$ 9,471,087$
RECONCILIATION OF OPERATING INCOME(LOSS) TO NET CASH PROVIDED BY (USED IN)OPERATING ACTIVITIES
Operating income 1,661,260$ 1,362,272$ 178,005$ 3,201,537$ 705,948$ Adjustments to reconcile operating incometo net cash provided by operating activities:
Depreciation 555,104 1,524,600 69,150 2,148,854 47,188 Changes in assets and liabilities:
Decrease (increase) in accounts receivable 100,486 (199,485) (39,620) (138,619) (14,258) Decrease (increase) in prepaid expenses - - - - (4,418) Increase (decrease) in accounts payable (251,687) 296,358 (1,828) 42,843 (17,499) Increase (decrease) in accrued liabilities 413 (1,012) - (599) - Increase (decrease) in deposits 33,350 602 - 33,952 - Increase (decrease) in accrued compensated absences (46,298) 2,744 - (43,554) - Decrease (increase) in deferred outflows
of resources - pension items (46,213) (5,167) 17,756 (33,624) (460) Increase (decrease) in deferred inflows
of resources - pension items (2,326) (5,277) (82,078) (89,681) (4,496) Decrease in net pension liability (218,955) (234,018) (3,085) (456,058) (189,001) Increase in deferred outflows
of resources - OPEB items (6,000) (3,000) - (9,000) - Increase in net OPEB liability 6,000 3,000 - 9,000 -
Net cash provided by operating activities 1,785,134$ 2,741,617$ 138,300$ 4,665,051$ 523,004$
SUPPLEMENTAL DISCLOSURE OF NONCASH CAPITAL AND RELATED FINANCING ACTIVITIES:Receipt of donated capital assets 2,106,518$ 156,118$ 156,118$ 2,418,754$ -$ Payment to refunded bond escrow agent
from refunding bond proceeds - 10,094,064 - 10,094,064 - Amortization of bond premium 30,390 198,446 - 228,836 -
Business-type Activities - Enterprise Funds
Major
See accompanying notes to the basic financial statements.F-29
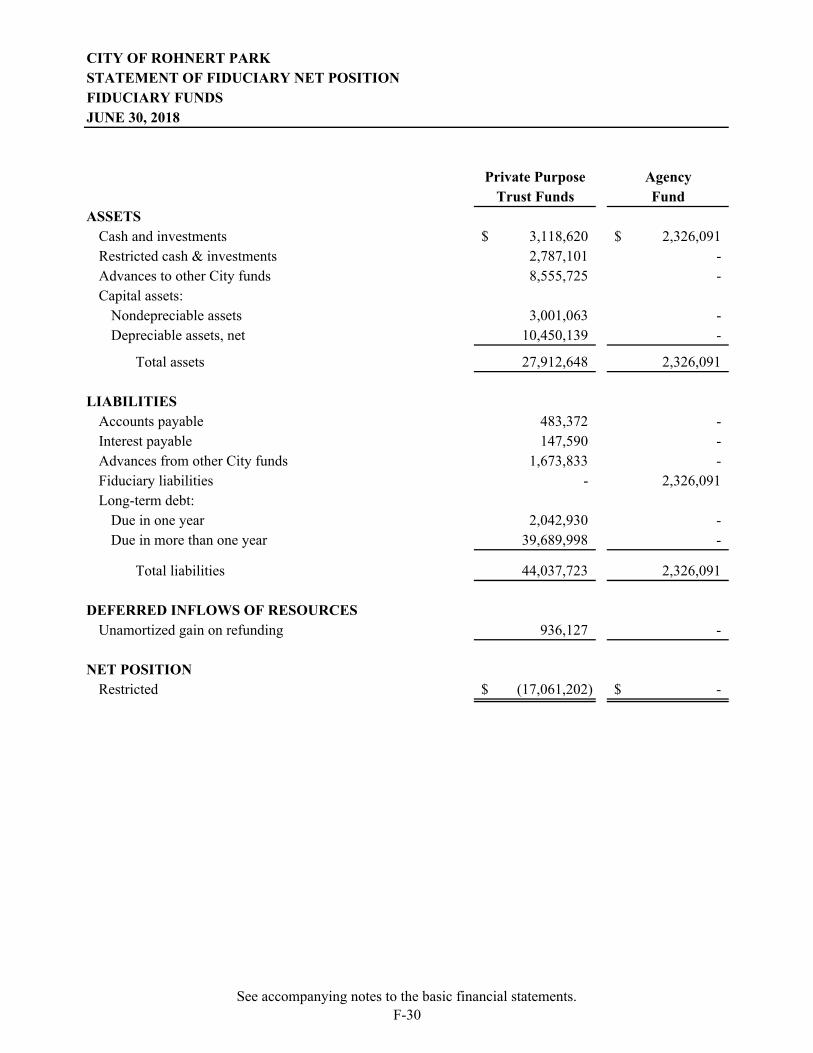
CITY OF ROHNERT PARKSTATEMENT OF FIDUCIARY NET POSITIONFIDUCIARY FUNDSJUNE 30, 2018
Private Purpose AgencyTrust Funds Fund
Cash and investments 3,118,620$ 2,326,091$ Restricted cash & investments 2,787,101 - Advances to other City funds 8,555,725 - Capital assets:
Nondepreciable assets 3,001,063 - Depreciable assets, net 10,450,139 -
Total assets 27,912,648 2,326,091
Accounts payable 483,372 - Interest payable 147,590 - Advances from other City funds 1,673,833 - Fiduciary liabilities - 2,326,091 Long-term debt:
Due in one year 2,042,930 - Due in more than one year 39,689,998 -
Total liabilities 44,037,723 2,326,091
Unamortized gain on refunding 936,127 -
Restricted (17,061,202)$ -$
ASSETS
LIABILITIES
NET POSITION
DEFERRED INFLOWS OF RESOURCES
See accompanying notes to the basic financial statements.F-30
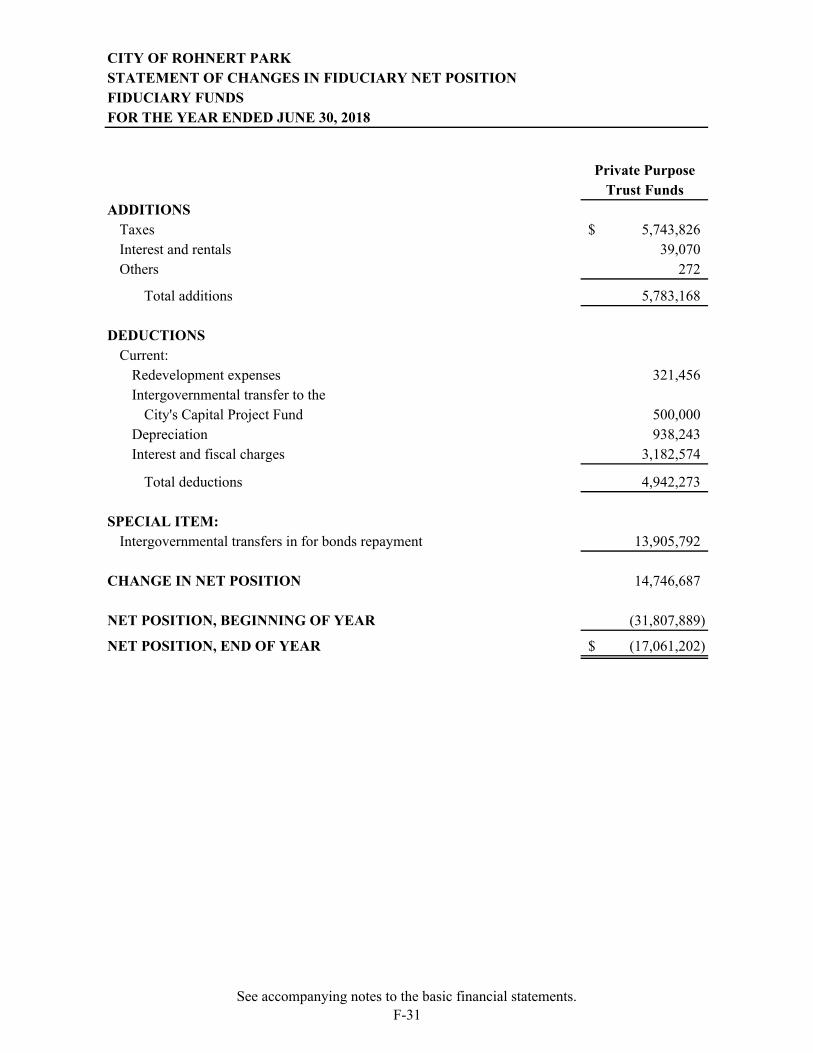
CITY OF ROHNERT PARKSTATEMENT OF CHANGES IN FIDUCIARY NET POSITIONFIDUCIARY FUNDSFOR THE YEAR ENDED JUNE 30, 2018
Private PurposeTrust Funds
ADDITIONSTaxes 5,743,826$ Interest and rentals 39,070 Others 272
Total additions 5,783,168
DEDUCTIONSCurrent:
Redevelopment expenses 321,456 Intergovernmental transfer to the
City's Capital Project Fund 500,000 Depreciation 938,243 Interest and fiscal charges 3,182,574
Total deductions 4,942,273
SPECIAL ITEM:Intergovernmental transfers in for bonds repayment 13,905,792
CHANGE IN NET POSITION 14,746,687
NET POSITION, BEGINNING OF YEAR (31,807,889)
NET POSITION, END OF YEAR (17,061,202)$
See accompanying notes to the basic financial statements.F-31

F-32
This page is left intentionally blank.
CITY OF ROHNERT PARK
NOTES TO THE BASIC FINANCIAL STATEMENTS FOR THE FISCAL YEAR ENDED JUNE 30, 2018
F-33
1. SUMMARY OF SIGNIFICANT ACCOUNTING POLICIES The basic financial statements of the City of Rohnert Park, California (City) have been prepared in conformity with generally accepted accounting principles (GAAP) as applied to governmental entities. The Governmental Accounting Standards Board (GASB) is the accepted standard setting body for establishing governmental accounting and financial reporting principles. The more significant of the City’s accounting policies are described below. A. Reporting Entity The City was incorporated on August 28, 1962. The City has a council-manager form of government and provides a wide range of municipal services. Component units are legally separate organizations for which the City is financially accountable or other organizations whose nature and significant relationship with the City are such that exclusion would cause the City’s financial statements to be misleading or incomplete. As required by GAAP, these basic financial statements present the City and its component units. The City’s component units, which are described below, are either blended or fiduciary in nature. Rohnert Park Financing Authority (Financing Authority) – The Financing Authority is a joint powers authority, organized pursuant to a joint exercise of powers agreement dated January 1, 1999 between the City and the Former Community Development Commission of the City of Rohnert Park (Commission). The Financing Authority was formed for the public purpose of assisting in financing activities for the benefit of the City and the Commission. The Financing Authority’s governing board is the same as the City Council and a financial burden relationship exist between the City and the Financing Authority as long-term liabilities outstanding are expected to be repaid with resources of the City. The Authority’s transactions are blended into the City’s basic financial statements. Successor Agency to the Community Development Commission of the City of Rohnert Park (Successor Agency) – A separate governmental entity established on February 1, 2012 for the purpose of serving as a custodian of the assets of the Commission and winding down the Commission’s activities subject to the direction of a seven-member Oversight Board. Based upon the nature of the City’s custodial role for the Successor Agency, the Successor Agency is reported as a private purpose trust fund of the City. Separate financial statements are not issued for the Successor Agency. Information of the Successor Agency can be found in the fiduciary fund financial statements. City of Rohnert Park Foundation – On November 10, 2008, Focus Rohnert Park Corporation was incorporated as a nonprofit 501(c)(3) public benefit corporation, and the name of the entity was subsequently amended to City of Rohnert Park Foundation (Foundation) on October 24, 2011. The purpose of the Foundation is to raise funds in connection with the development of civic projects in the City. The Foundation’s governing board is the same as the City Council. The Foundation provides services that benefit the City and the City’s management has operational responsibility for the Foundation. The Foundation’s transactions are blended into the City’s basic financial statements and reported in the Rohnert Park Foundation nonmajor special revenue fund. B. Basis of Presentation Government-wide Financial Statements The statement of net position and statement of activities display information about the primary government and its component units. These statements include the financial activities of the overall government, except for fiduciary activities. Eliminations have been made to minimize the double counting of internal activities, except for services provided and used. These statements distinguish between the governmental and business-type activities of the City. Governmental activities, which normally are supported by taxes and intergovernmental revenues, are reported separately from business-type activities, which rely to a significant extent on fees charged to external parties.
CITY OF ROHNERT PARK
NOTES TO THE BASIC FINANCIAL STATEMENTS FOR THE FISCAL YEAR ENDED JUNE 30, 2018
F-34
The statement of activities presents a comparison between direct expenses and program revenues for each segment of the business-type activities of the City and for each function of the City’s governmental activities. Direct expenses are those that are specifically associated with a program or function and therefore, are clearly identifiable to a particular function. Program revenues include 1) charges paid by the recipients of goods or services offered by the programs and 2) grants and contributions that are restricted to meeting the operational or capital requirements of a particular program. Revenues that are not classified as program revenues, including all taxes, are presented instead as general revenues. Fund Financial Statements The fund financial statements provide information about the City’s funds, including blended component units and fiduciary funds. Separate statements for each fund category, including governmental, proprietary and fiduciary, are presented. The operations of each fund are accounted for with a separate set of self-balancing accounts that comprise its assets, liabilities, deferred inflows of resources, deferred outflows of resources, fund equity, revenues, and expenditures or expenses, as appropriate. Government resources are allocated to and accounted for in individual funds based upon the purposes for which they are to be spent and the means by which spending activities are controlled. The emphasis of fund financial statements is on major governmental and enterprise funds, each displayed in a separate column. All remaining governmental and enterprise funds are separately aggregated and reported as nonmajor funds. The City reports the following major governmental funds:
General Fund is the City’s primary operating fund. It accounts for all financial resources of the general government, except those required to be accounted for in any other funds.
Housing Projects Special Revenue Fund accounts for the housing assets and functions related to the Low
and Moderate Income Housing Program retained by the City following the dissolution of the Commission effective February 1, 2012. It is used to account for the restricted revenue and expenditures of the City’s low and moderate income housing activities.
Financing Authority Debt Service Fund accounts for accumulation and disbursement of financial
resources that are used to make principal and interest payments on long-term debt of the City. City Capital Projects Fund accounts for resources used for the acquisition and construction of capital
facilities except for those facilities financed by enterprise funds.
Public Facility Finance Fee Special Revenue Fund accounts for the revenues and expenditures of the public facility finance fee imposed per City’s Resolution 2008-126 related to the approved Public Facilities Finance Plan (Facilities Plan). The Facilities Plan’s purpose is to manage the costs of capital facilities, maintenance, and services that are impacted by the City’s new development.
Graton Mitigation Supplemental Special Revenue Fund accounts for supplemental contributions and related activities or mitigation of potential impacts pursuant to Section 3.4.1 of the MOU between the Federated Indians of Graton Rancheria (Tribe) and the City.
The City reports the following major enterprise funds: Water Fund accounts for water services provided to the residents of the City. The activities necessary to
provide such service are accounted for in the fund, including, but not limited to, water purchase, water operations, maintenance, financing and related debt service, and billing and collection.
CITY OF ROHNERT PARK
NOTES TO THE BASIC FINANCIAL STATEMENTS FOR THE FISCAL YEAR ENDED JUNE 30, 2018
F-35
Sewer Fund accounts for sewage disposal services provided to the residents of the City. The activities necessary to provide such service are accounted for in the fund, including, but not limited to, sewer operations, maintenance, financing and related debt service, and billing and collection.
The City reports the following additional fund types:
Internal Service Funds account for the services provided to the other City departments, on a cost reimbursement basis, in the following areas: centralized data processing services (information technology), vehicle replacement, fleet management, and infrastructure.
Private Purpose Trust Funds are a fiduciary fund type used to account for resources held and administrated under trust or similar arrangement for the benefits of individuals, private organizations, or other governments. The City reports the following private purpose trust funds:
- Assets Seizure Fund accounts for Federal and State seized assets held by the City in a trustee capacity until the County of Sonoma District Attorney’s Office requests for remittance of the assets.
- Redevelopment Successor Agency Fund was created to serve as a custodian for the assets and to wind down the affairs of the Commission. This fund accounts for the receipt of property tax revenues pursuant to the Redevelopment Dissolution Act and the assets transferred from the Commission. The Successor Agency’s assets can only be used to pay enforceable obligations in existence at the date of dissolution pursuant to the Recognized Obligation Payment Schedules approved by the California Department of Finance (DOF) under the Redevelopment Dissolution Act.
Agency Funds are a fiduciary fund type used to account for resources held by the City in a custodial capacity and do not involve measurement of results of operations. The City report the following agency fund:
- SoMo Village Trust Fund accounts for assets held by the City in a custodial capacity for a developer for the construction of a soccer field.
During the year, the City has activity between funds for various purposes. Any residual balances outstanding at year-end are reported as due from/to other funds and advances to/from other funds. While these balances are reported in the fund financial statements, certain eliminations are made in the preparation of the government-wide financial statements. Balances between funds included in governmental activities (i.e., the governmental and internal service funds) are eliminated so that only the net amount is included as internal balances in the governmental activities column. Similarly, balances between the funds included in the business-type activities (i.e., the enterprise funds) are eliminated so that the net amount is included as internal balances in the business-type activities column. Similarly, activities involving the transfers of resources between funds are reported as transfers in/out. Interfund activities, with the exception of activities between the governmental and business-type activities, are eliminated in the government-wide financial statements. Transfers between funds are eliminated so that only the net amount is included as transfers in the governmental and business-type activities columns. C. Measurement Focus and Basis of Accounting The government-wide financial statements are presented on an economic resources measurement focus and the accrual basis of accounting. Revenues are recognized when earned and expenses are recorded when a liability is incurred, regardless of the timing of related cash flows. Property taxes are recognized as revenues in the year for which they are levied. Grants and similar items are recognized as revenue as soon as all eligibility requirements have been met.
CITY OF ROHNERT PARK
NOTES TO THE BASIC FINANCIAL STATEMENTS FOR THE FISCAL YEAR ENDED JUNE 30, 2018
F-36
The governmental funds financial statements are presented on a current financial resources measurement focus and the modified accrual basis of accounting. Revenues are recognized as soon as they are both measurable and available. Revenues are considered to be available when they are collectible within the current period or soon enough thereafter to pay liabilities of the current period. Property tax revenues are recognized in the current year if they are collected within 60 days of year-end. All other revenues are recorded when received in cash, except that revenues subject to accrual (generally received within 60 days after year-end) are recognized when due. The primary revenue sources that have been treated as susceptible to accrual by the City are taxes, licenses, intergovernmental, interest and rental, donations, and certain charges for services. All other revenues are not susceptible to accrual because they are usually not measurable until received in cash. Expenditures are recorded when the related fund liability is incurred, except for principal and interest on long-term debt, certain compensated absences and claims and judgements are recognized when payments are due. Proprietary funds and private purpose trust funds are presented on an economic resources measurement focus and the accrual basis of accounting. Revenues are recognized when earned and expenses are recorded when a liability is incurred, regardless of the timing of related cash flows. Proprietary funds distinguish operating revenues and expenses from nonoperating items. Operating revenues and expenses generally result from providing services in connection with the proprietary fund’s principal ongoing operations. The principal operating revenues of the City’s enterprise funds are charges for customer services for water, sewer, recycled water, and refuse collection. The principal operating revenues of the City’s internal service funds are charges to other funds for the information technology, vehicle replacement, fleet management support services, and infrastructure. Operating expenses for enterprise funds and internal service funds include the cost of sales of services, administrative expenses, and depreciation on capital assets. All revenues and expenses not meeting this definition are reported as nonoperating revenues and expenses. D. Cash, Cash Equivalents, and Investments The City pools cash resources from all funds in order to facilitate and maximize the management of cash. The balance in the pooled cash account is available to meet current operating requirements. Cash in excess of current requirements is invested in various interest-bearing accounts and other fixed income investments with varying terms. Interest earned on investments is allocated to all funds based on average cash and investment balances. For purposes of the statement of cash flows, the City considers all highly liquid investments with maturity of three months or less when purchased to be cash equivalents. The proprietary funds’ "deposits" in the City cash and investments pool are, in substance, demand deposits and are therefore considered cash equivalents. Investments are presented at fair value except as noted below. Fair value is the amount at which a financial instrument could be exchanged in a current transaction between willing parties, other than in a forced or liquidation sale. Money market investments (such as short–term, highly liquid debt instruments including bankers’ acceptances) and securities (notes, bills, and obligations of the U.S. government and its agencies), and participating interest-earning investment contracts (such as negotiable certificates of deposit and repurchase agreements) that have a remaining maturity at the time of purchase of one year or less, are reported at amortized cost, which approximates fair value. Certain restricted cash and investments are held by a fiscal agent or the City for the redemption of bonded debt and for acquisition and construction of certain capital projects. E. Prepaid Items Certain payments to vendors reflect costs applicable to future accounting periods and are recorded as prepaid items in both the government-wide and fund financial statements. Expenses/expenditures are incurred during the period benefited by the prepayment (consumption method).
CITY OF ROHNERT PARK
NOTES TO THE BASIC FINANCIAL STATEMENTS FOR THE FISCAL YEAR ENDED JUNE 30, 2018
F-37
F. Capital Assets Capital assets are stated at historical cost or estimated historical cost if actual cost is not available. Donated capital assets, donated works of art and similar items, and capital assets received in a service concession arrangement are reported at their acquisition value. The City defines capital assets as assets with an estimated useful life in excess of one year and an individual cost of $5,000 or more. Capital assets are depreciated or amortized (assets under capital leases) using the straight-line method over the lesser of their estimated useful lives or the capital lease period in the government-wide and proprietary fund financial statements. The estimated useful lives are as follows:
Infrastructure and buildings 30 years Equipment purchased with FEMA funds 10 years Furniture & fixtures 7 years Vehicles 7 years Equipment 5 years Communication equipment 3 years
G. Claims Payable The City records a liability to reflect an actuarial estimate of ultimate uninsured losses for both general liability claims and workers’ compensation claims. The estimated liability for general liability claims and workers’ compensation claims includes incurred but not reported (IBNR) claims and related loss adjustment expenses. H. Compensated Absences In accordance with negotiated labor agreements, employees accumulate earned but unused paid time off (PTO) and other compensated leave. There is no liability for unpaid accumulated sick leave because the City does not pay any amounts when employees separate from service with the City. All PTO and other compensated leave is accrued when incurred in the government-wide and proprietary fund financial statements. A liability for these amounts is reported in governmental funds when due and payable only if it is expected to be settled with current financial resources. I. Long-Term Debt and Other Long-Term Obligations In the government-wide, proprietary fund, and fiduciary fund financial statements, long-term debt and other long-term obligations are reported as liabilities. Bond premiums and discounts are amortized over the life of the bonds. Bonds payable are reported net of the applicable bond premium or discount. Deferred amounts on refunding are reported as deferred inflows/outflows of resources and amortized over the life of the bonds. In the governmental fund financial statements, bond premiums, discounts and costs of issuance are recognized during the period the bonds are issued. The par value of debt issued is reported as other financing sources. Premiums received on debt issuance are reported as other financing sources, while discounts on debt issuance are reported as other financing uses. Issuance costs, whether or not withheld from the actual debt proceeds received, are reported as debt service expenditures. J. Unearned Revenue Unearned revenues arise when the City receives resources before it has a legal claim to them, as when grant monies are received prior to incurring qualifying expenditures or when monies are received before the related services are performed. In subsequent periods, when both revenue recognition criteria are met or when the City has a legal claim to the resources, the liability for unearned revenue is removed from the balance sheet and revenue is recognized.
CITY OF ROHNERT PARK
NOTES TO THE BASIC FINANCIAL STATEMENTS FOR THE FISCAL YEAR ENDED JUNE 30, 2018
F-38
K. Deferred Outflows and Inflows of Resources In addition to assets, the statement of net position will sometimes report a separate section for deferred outflows of resources. This separate financial statement element, deferred outflows of resources, represents a consumption of net position that applies to a future period(s) and so will not be recognized as an outflow of resources (expense) until the future period. In addition to liabilities, the statement of financial position and balance sheet will sometimes report a separate section for deferred inflows of resources. This separate financial statement element, deferred inflows of resources, represents an acquisition of net position that applies to a future period(s) and so will not be recognized as an inflow of resources (revenue) until the future period. L. Net Position and Fund Balance Net Position Classifications In the government-wide financial statements, net position is classified in three categories: Net Investment in Capital Assets – This category groups all capital assets, including infrastructure, into one component of net position. Accumulated depreciation, outstanding balances of debt and any debt-related deferred outflows and inflows of resources that are attributable to the acquisition, construction, or improvement of these assets reduce the balance of this category. Restricted Net Position – This category consists of restricted assets reduced by liabilities and deferred inflows of resources related to those assets. Enabling legislation authorizes the City to assess, levy, charge, or otherwise mandate payment of resources and includes a legally enforceable requirement that those resources be used only for the specific purposes stipulated in the legislation. The City’s restricted net position for the Performing Arts Center Endowment is nonexpendable, and the remaining restricted net positon is expendable. Unrestricted Net Position – The category represents net position of the City that is not restricted for any project or purpose. Fund Balances Classifications Governmental funds report fund balance in classifications based primarily on the extent to which the City is bound to honor constraints on how specific amounts in the funds can be spent. Fund balance is classified in five categories: Nonspendable Fund Balance – amounts that cannot be spent because they are either (a) not in spendable form; or (b) legally or contractually required to be maintained intact. Restricted Fund Balance – amounts with constraints placed on their use that are either (a) externally imposed by creditors, grantors, contributors, or laws or regulations of other governments; or (b) imposed by law through constitutional provisions or enabling legislation. Restrictions may effectively be changed or lifted only with the consent of resource providers. Committed Fund Balance –amounts that can only be used for the specific purposes determined by a formal action of the City’s highest level of decision-making authority. The City Council is the highest level of decision-making authority for the City that can, by adoption of an ordinance, commit fund balances. Commitments may be changed or lifted only by the City Council taking the same formal actions that imposed the original constraint occurring no later than the close of the reporting period.
CITY OF ROHNERT PARK
NOTES TO THE BASIC FINANCIAL STATEMENTS FOR THE FISCAL YEAR ENDED JUNE 30, 2018
F-39
Assigned Fund Balance – amounts intended to be used by the City for specific purposes through budgetary actions or delegation of authority by the City Council. Intent is expressed by the City Council or an official to whom the City Council has delegated the authority (generally, the City Manager) to assign amounts to be used for specific purposes. This is also the classification for residual funds in the governmental funds other than General Fund. Unassigned Fund Balance – amounts that have not been restricted, committed, or assigned. This includes the residual fund balance of General Fund and residual fund deficits of other governmental funds. M. Use of Restricted/Unrestricted Net Position and Fund Balances When an expense is incurred for purposes for which both restricted and unrestricted net position are available, the City’s policy is to apply restricted net position first. With respect to fund balance, the City considers restricted amounts to have been spent first when an expenditure is incurred for purposes for which both restricted and unrestricted fund balance are available. Additionally, the City considers committed amounts to have been spent first, assigned amounts to have been spent second, and unassigned amounts to have been spent last when an expenditure is incurred for purposes for which committed, assigned, and unassigned fund balance is available. N. Program Revenues The types of transactions reported as program revenues for the City are reported in three categories: (1) charges for services, (2) operating grants and contributions, and (3) capital grants and contributions. All taxes, including those dedicated for specific purposes, and other internally dedicated resources are reported as general revenues rather than as program revenues. O. Interfund Transactions During the normal course of operations, the City has numerous transactions among funds. The significant interfund transactions that occurred during the year can be classified into two types:
Transfers – Transactions to allocate resources or the occurrence of specific capital or debt service
expenditures to the receiving fund. These transactions are recorded as transfers in and out in the year in which they are approved.
Loans Between Funds – Transactions to loan resources from one fund to another. Short-term loans are recorded as “due from other funds” in the disbursing fund and “due to other funds” in the receiving fund. Long-term loans are recorded as “advance to other funds” in the disbursing fund and “advance from other funds” in the receiving fund.
P. Property Tax Under California law, property taxes are assessed and collected by the counties at a rate of up to 1% of assessed value, plus other increases approved by the voters. Property taxes go into a pool and are then allocated to cities based on complex formulas. Property taxes are collected by the Auditor-Controller-Treasurer-Tax Collector of the County of Sonoma (County) and are remitted upon collection to the various taxing entities, including the City. Accordingly, the City accrues only those taxes that are received from the County within sixty days after year-end for governmental funds.
For assessment and collection purposes, property is classified as either “secured” or “unsecured” and is listed accordingly on separate parts of the assessment roll. The “secured roll” is that part of the assessment roll containing State-assessed property and real property having a tax lien that is sufficient, in the opinion of the County Assessor, to secure payment of the taxes. Unsecured property comprises all taxable property not attached to land, such as personal property or business property. Every tax levied by a county that becomes a lien on secured
CITY OF ROHNERT PARK
NOTES TO THE BASIC FINANCIAL STATEMENTS FOR THE FISCAL YEAR ENDED JUNE 30, 2018
F-40
property has priority over all present and future private liens arising pursuant to State law on the secured property, regardless of the time of the creation of the other liens. A tax levied on unsecured property does not become a lien against the taxed unsecured property, but may become a lien on other property owned by the taxpayer. Valuation of secured property and establishment of a statutory tax lien occur as of January 1 prior to the tax year (the tax year is the July 1 – June 30 fiscal year of the State) of the related tax levy, and the secured and unsecured tax rolls are certified on or before July 31 of the tax year by the County Assessor. The County assesses property values, levies bills, and collects taxes as follows:
Secured Unsecured Lien Dates January 1 January 1 Levy Dates January 1 January 1 Due Dates 50% on November 1 July 1 50% on February 1 Delinquent after December 10 (for November) August 31
April 10 (for February) The City does not have the ability to control the levy rate or the amount of property taxes remitted by the County because these are governed by State law. Q. Pension and Other Postemployment Benefits (OPEB) Plans For purposes of measuring the net pension liability and net OPEB liability, deferred outflows/inflows of resources related to pension and OPEB, and pension and OPEB expenses, information about the fiduciary net position if the County’s pension and OPEB plans and additions to/deductions from the plans’ fiduciary net positions have been determined on the same basis as they are reported by the California Public Employees’ Retirement System (CalPERS). For this purpose, benefit payments (including refunds of employee contributions) are recognized when due and payable in accordance with the benefit terms. CalPERS plan member contributions are recognized in the period in which the contributions are due. Investments are reported at fair value. R. Effects of New Pronouncements The City implemented the following GASB Statements during the year: In June 2015, GASB issued Statement No. 75, Accounting and Financial Reporting for Postemployment Benefits Other Than Pensions. This statement addresses reporting by governments that provide OPEB to their employees and for governments that finance OPEB for employees of other governments. As of July 1, 2017, the City restated its net position to record a net OPEB liability, record deferred outflows of resources related to OPEB contributions made after the measurement date, and remove the net OPEB obligation recorded in accordance with GASB Statement No. 45 as follows:
Net OPEB Deferred Outflow Net OPEBAs Previously Liability of Resources Obligation
Reported Impact Impact (GASB 45) Impact As Restated
Primary Government:Governmental Activities 104,553,090$ (14,243,000)$ 3,894,000$ 4,064,000$ 98,268,090$ Business-type Activities 56,499,951 (234,000) 234,000 - 56,499,951
Total Primary Government 161,053,041 (14,477,000) 4,128,000 4,064,000 154,768,041
Water Enterprise Fund 14,771,836 (147,000) 147,000 - 14,771,836
Sewer Enterprise Fund 40,604,888 (87,000) 87,000 - 40,604,888
Net Position, Beginning of Year
CITY OF ROHNERT PARK
NOTES TO THE BASIC FINANCIAL STATEMENTS FOR THE FISCAL YEAR ENDED JUNE 30, 2018
F-41
In March 2016, the GASB issued Statement No. 81, Irrevocable Split-Interest Agreements. The statement provides recognition and measurement guidance for situations in which a government is a beneficiary of these agreements. Implementation of this statement did not have a significant impact on the City’s financial statements for the fiscal year ended June 30, 2018. In March 2017, the GASB issued Statement No. 85, Omnibus 2017. The objective of the statement is to address practice issues that have been identified during implementation and application of certain GASB Statements. The statement addresses a variety of topics including issues related to blending component units, goodwill, fair value measurement and application, and postemployment benefits (pensions and other postemployment benefits). Implementation of this statement did not have a significant impact on the City’s financial statements for the fiscal year ended June 30, 2018.
In May 2017, the GASB issued Statement No. 86, Certain Debt Extinguishment Issues. The primary objective of the statement is to improve consistency in accounting and financial reporting for in-substance defeasance of debt by providing guidance for transactions in which cash and other monetary assets acquired with only existing resources - resources other than the proceeds of refunding debt - are placed in an irrevocable trust for the sole purpose of extinguishing debt. Implementation of this statement did not have a significant impact on the City’s financial statements for the fiscal year ended June 30, 2018. The City is currently analyzing its accounting practices to determine the potential impact on the financial statements for the following GASB Statements: In November 2016, the GASB issued Statement No. 83, Certain Asset Retirement Obligations. The statement addresses accounting and financial reporting for certain asset retirement obligations (AROs). An ARO is a legally enforceable liability associated with the retirement of a tangible capital asset. A government that has legal obligations to perform future asset retirement activities related to its tangible capital assets should recognize a liability based on the guidance in this statement. The requirements of this statement are effective for the City’s fiscal year ending June 30, 2019.
In January 2017, the GASB issued Statement No. 84, Fiduciary Activities. The statement establishes criteria for identifying fiduciary activities of all state and local governments. The focus of the criteria generally is on (1) whether a government is controlling the assets of the fiduciary activity and (2) the beneficiaries with whom a fiduciary relationship exists. Separate criteria are included to identify fiduciary component units and postemployment benefit arrangements that are fiduciary activities. The requirements of this statement are effective for the City’s fiscal year ending June 30, 2020.
In June 2017, the GASB issued Statement No. 87, Leases. The objective of this statement is to better meet the information needs of financial statement users by improving accounting and financial reporting for leases by governments. This Statement increases the usefulness of governments’ financial statements by requiring recognition of certain lease assets and liabilities for leases that previously were classified as operating leases and recognized as inflows of resources or outflows of resources based on the payment provisions of the contract. It establishes a single model for lease accounting based on the foundational principle that leases are financings of the right to use an underlying asset. Under this Statement, a lessee is required to recognize a lease liability and an intangible right-to-use lease asset, and a lessor is required to recognize a lease receivable and a deferred inflow of resources, thereby enhancing the relevance and consistency of information about governments’ leasing activities. The requirements of this statement are effective for the City’s fiscal year ending June 30, 2021.
CITY OF ROHNERT PARK
NOTES TO THE BASIC FINANCIAL STATEMENTS FOR THE FISCAL YEAR ENDED JUNE 30, 2018
F-42
In March 2018, the GASB issued Statement No. 88, Certain Disclosures Related to Debt, including Direct Borrowings and Direct Placements. The objective of this statement is to improve the information that is disclosed in notes to government financial statements related to debt, including direct borrowings and direct placements. It also clarifies which liabilities governments should include when disclosing information related to debt. The requirements of this statement are effective for the City’s fiscal year ending June 30, 2019.
In June 2018, the GASB issued Statement No. 89, Accounting for Interest Cost Incurred before the End of a Construction Period. The objectives of this statement are 1) to enhance the relevance and comparability of information about capital assets and the cost of borrowing for a reporting period, and 2) to simplify accounting for interest cost incurred before the end of a construction period. The requirements of this statement are effective for the City’s fiscal year ending June 30, 2021.
In August 2018, the GASB issued Statement No. 90, Majority Equity Interests, an amendment of GASB Statements No.14 and No.61. The objectives of this statement are to improve the consistency and comparability of reporting a government’s majority equity interest in a legally separate organization and to improve the relevance of financial statement information for certain component units. The requirements of this statement are effective for the City’s fiscal year ending June 30, 2020.
S. Special Items Special items are transactions or events that are within the control of the Successor Agency and are either unusual in nature or infrequent in occurrence.
T. Use of Estimates The preparation of the basic financial statements in conformity with generally accepted accounting principles requires management to make estimates and assumptions. These estimates and assumptions affect the reported amounts of assets and liabilities and the disclosure of contingent assets and liabilities. In addition, estimates affect the reported amount of revenues and expenses. Actual results could differ from these estimates and assumptions. 2. STEWARDSHIP, COMPLIANCE AND ACCOUNTABILITY Deficit Fund Balances and Net Position At June 30, 2018, the following City major fund had a deficit fund balance: The Public Facility Finance Fee Special Revenue Fund had a deficit fund balance of $4,245,679. The deficit is due to the timing difference of receipt of revenues to fund its capital expenditures related to the Facilities Plan. The deficit is expected to be funded by future public facility finance fees. At June 30, 2018, the following City other funds had deficit net positions: The Fleet Management internal service fund had deficit net position of $193,788. The deficit is due to the impact from the recording of pension items. The deficit is expected to be funded by future internal service charges to other City funds. The Redevelopment Successor Agency private purpose trust fund had a deficit net position of $17,079,993. The deficit is due to the nature of the redevelopment financing in which long-term debt were incurred for redevelopment activities. The deficit is expected to be eliminated with future redevelopment property tax revenues distributed from the Redevelopment Property Tax Trust Fund (RPTTF) administered by the County.
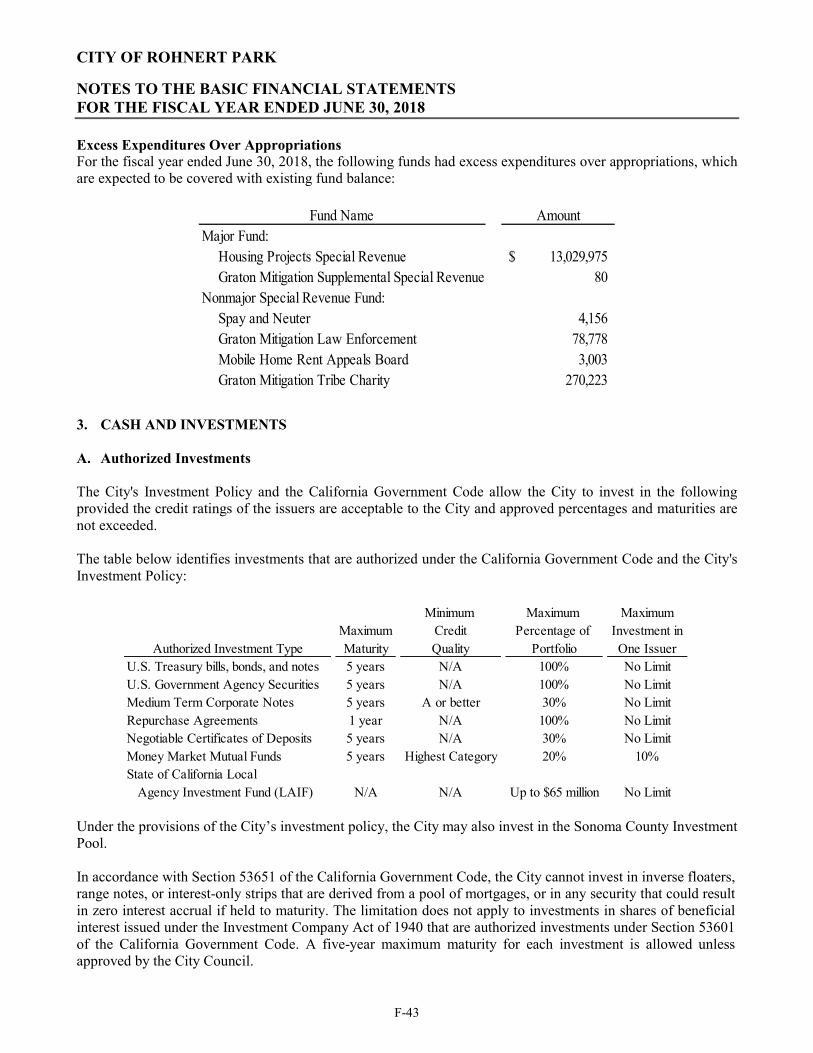
CITY OF ROHNERT PARK
NOTES TO THE BASIC FINANCIAL STATEMENTS FOR THE FISCAL YEAR ENDED JUNE 30, 2018
F-43
Excess Expenditures Over Appropriations For the fiscal year ended June 30, 2018, the following funds had excess expenditures over appropriations, which are expected to be covered with existing fund balance:
AmountMajor Fund:
Housing Projects Special Revenue 13,029,975$ Graton Mitigation Supplemental Special Revenue 80
Nonmajor Special Revenue Fund:Spay and Neuter 4,156 Graton Mitigation Law Enforcement 78,778 Mobile Home Rent Appeals Board 3,003 Graton Mitigation Tribe Charity 270,223
Fund Name
3. CASH AND INVESTMENTS A. Authorized Investments The City's Investment Policy and the California Government Code allow the City to invest in the following provided the credit ratings of the issuers are acceptable to the City and approved percentages and maturities are not exceeded. The table below identifies investments that are authorized under the California Government Code and the City's Investment Policy:
Minimum Maximum MaximumMaximum Credit Percentage of Investment in
Authorized Investment Type Maturity Quality Portfolio One IssuerU.S. Treasury bills, bonds, and notes 5 years N/A 100% No LimitU.S. Government Agency Securities 5 years N/A 100% No LimitMedium Term Corporate Notes 5 years A or better 30% No LimitRepurchase Agreements 1 year N/A 100% No LimitNegotiable Certificates of Deposits 5 years N/A 30% No LimitMoney Market Mutual Funds 5 years Highest Category 20% 10%State of California Local Agency Investment Fund (LAIF) N/A N/A Up to $65 million No Limit
Under the provisions of the City’s investment policy, the City may also invest in the Sonoma County Investment Pool. In accordance with Section 53651 of the California Government Code, the City cannot invest in inverse floaters, range notes, or interest-only strips that are derived from a pool of mortgages, or in any security that could result in zero interest accrual if held to maturity. The limitation does not apply to investments in shares of beneficial interest issued under the Investment Company Act of 1940 that are authorized investments under Section 53601 of the California Government Code. A five-year maximum maturity for each investment is allowed unless approved by the City Council.
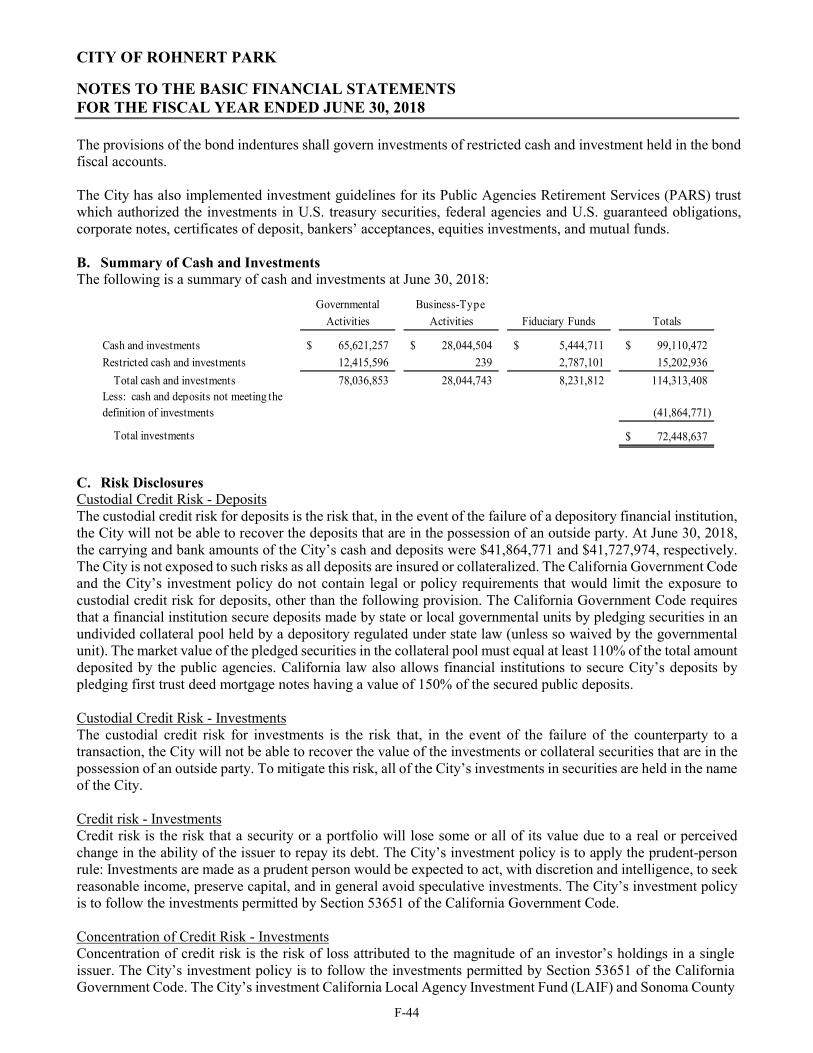
CITY OF ROHNERT PARK
NOTES TO THE BASIC FINANCIAL STATEMENTS FOR THE FISCAL YEAR ENDED JUNE 30, 2018
F-44
The provisions of the bond indentures shall govern investments of restricted cash and investment held in the bond fiscal accounts. The City has also implemented investment guidelines for its Public Agencies Retirement Services (PARS) trust which authorized the investments in U.S. treasury securities, federal agencies and U.S. guaranteed obligations, corporate notes, certificates of deposit, bankers’ acceptances, equities investments, and mutual funds. B. Summary of Cash and Investments The following is a summary of cash and investments at June 30, 2018:
Governmental Business-Type
Activities Activities Fiduciary Funds Totals
Cash and investments 65,621,257$ 28,044,504$ 5,444,711$ 99,110,472$
Restricted cash and investments 12,415,596 239 2,787,101 15,202,936
Total cash and investments 78,036,853 28,044,743 8,231,812 114,313,408 Less: cash and deposits not meeting the definition of investments (41,864,771)
Total investments 72,448,637$
C. Risk Disclosures Custodial Credit Risk - Deposits The custodial credit risk for deposits is the risk that, in the event of the failure of a depository financial institution, the City will not be able to recover the deposits that are in the possession of an outside party. At June 30, 2018, the carrying and bank amounts of the City’s cash and deposits were $41,864,771 and $41,727,974, respectively. The City is not exposed to such risks as all deposits are insured or collateralized. The California Government Code and the City’s investment policy do not contain legal or policy requirements that would limit the exposure to custodial credit risk for deposits, other than the following provision. The California Government Code requires that a financial institution secure deposits made by state or local governmental units by pledging securities in an undivided collateral pool held by a depository regulated under state law (unless so waived by the governmental unit). The market value of the pledged securities in the collateral pool must equal at least 110% of the total amount deposited by the public agencies. California law also allows financial institutions to secure City’s deposits by pledging first trust deed mortgage notes having a value of 150% of the secured public deposits. Custodial Credit Risk - Investments The custodial credit risk for investments is the risk that, in the event of the failure of the counterparty to a transaction, the City will not be able to recover the value of the investments or collateral securities that are in the possession of an outside party. To mitigate this risk, all of the City’s investments in securities are held in the name of the City. Credit risk - Investments Credit risk is the risk that a security or a portfolio will lose some or all of its value due to a real or perceived change in the ability of the issuer to repay its debt. The City’s investment policy is to apply the prudent-person rule: Investments are made as a prudent person would be expected to act, with discretion and intelligence, to seek reasonable income, preserve capital, and in general avoid speculative investments. The City’s investment policy is to follow the investments permitted by Section 53651 of the California Government Code. Concentration of Credit Risk - Investments Concentration of credit risk is the risk of loss attributed to the magnitude of an investor’s holdings in a single issuer. The City’s investment policy is to follow the investments permitted by Section 53651 of the California Government Code. The City’s investment California Local Agency Investment Fund (LAIF) and Sonoma County
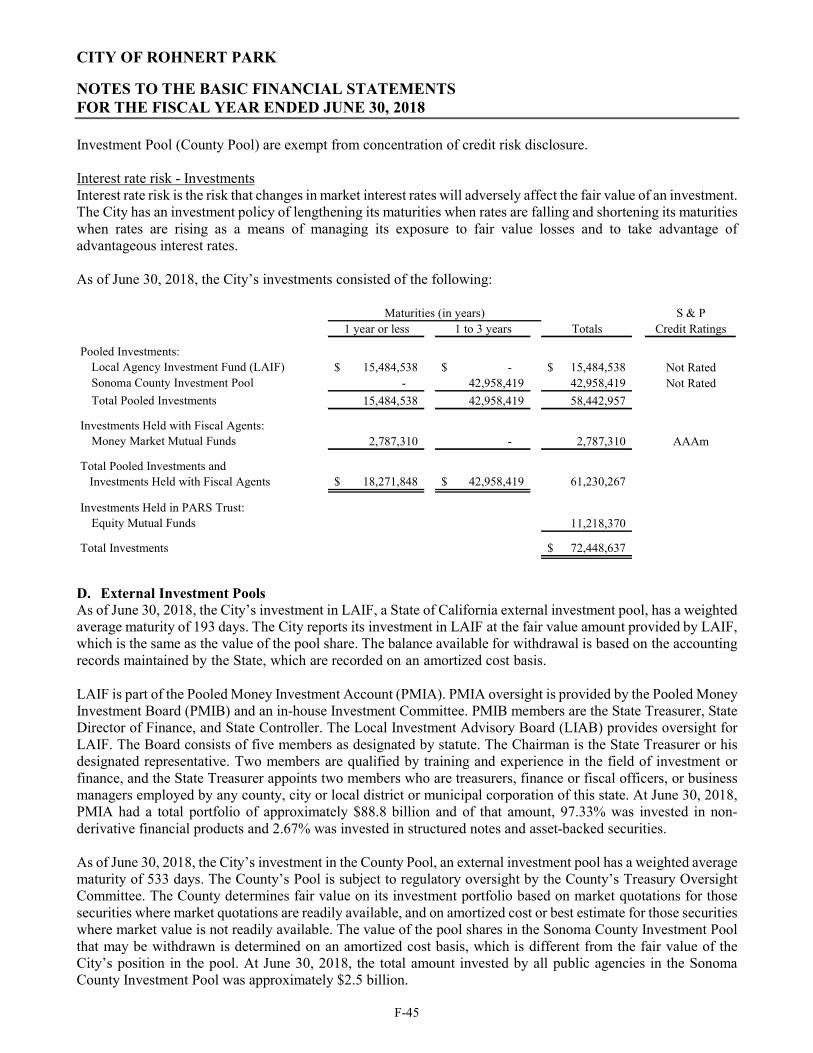
CITY OF ROHNERT PARK
NOTES TO THE BASIC FINANCIAL STATEMENTS FOR THE FISCAL YEAR ENDED JUNE 30, 2018
F-45
Investment Pool (County Pool) are exempt from concentration of credit risk disclosure. Interest rate risk - Investments Interest rate risk is the risk that changes in market interest rates will adversely affect the fair value of an investment. The City has an investment policy of lengthening its maturities when rates are falling and shortening its maturities when rates are rising as a means of managing its exposure to fair value losses and to take advantage of advantageous interest rates. As of June 30, 2018, the City’s investments consisted of the following:
S & P1 year or less 1 to 3 years Totals Credit Ratings
Pooled Investments:Local Agency Investment Fund (LAIF) 15,484,538$ -$ 15,484,538$ Not RatedSonoma County Investment Pool - 42,958,419 42,958,419 Not Rated
Total Pooled Investments 15,484,538 42,958,419 58,442,957
Investments Held with Fiscal Agents:Money Market Mutual Funds 2,787,310 - 2,787,310 AAAm
Total Pooled Investments and Investments Held with Fiscal Agents 18,271,848$ 42,958,419$ 61,230,267
Investments Held in PARS Trust:Equity Mutual Funds 11,218,370
Total Investments 72,448,637$
Maturities (in years)
D. External Investment Pools As of June 30, 2018, the City’s investment in LAIF, a State of California external investment pool, has a weighted average maturity of 193 days. The City reports its investment in LAIF at the fair value amount provided by LAIF, which is the same as the value of the pool share. The balance available for withdrawal is based on the accounting records maintained by the State, which are recorded on an amortized cost basis. LAIF is part of the Pooled Money Investment Account (PMIA). PMIA oversight is provided by the Pooled Money Investment Board (PMIB) and an in-house Investment Committee. PMIB members are the State Treasurer, State Director of Finance, and State Controller. The Local Investment Advisory Board (LIAB) provides oversight for LAIF. The Board consists of five members as designated by statute. The Chairman is the State Treasurer or his designated representative. Two members are qualified by training and experience in the field of investment or finance, and the State Treasurer appoints two members who are treasurers, finance or fiscal officers, or business managers employed by any county, city or local district or municipal corporation of this state. At June 30, 2018, PMIA had a total portfolio of approximately $88.8 billion and of that amount, 97.33% was invested in non-derivative financial products and 2.67% was invested in structured notes and asset-backed securities. As of June 30, 2018, the City’s investment in the County Pool, an external investment pool has a weighted average maturity of 533 days. The County’s Pool is subject to regulatory oversight by the County’s Treasury Oversight Committee. The County determines fair value on its investment portfolio based on market quotations for those securities where market quotations are readily available, and on amortized cost or best estimate for those securities where market value is not readily available. The value of the pool shares in the Sonoma County Investment Pool that may be withdrawn is determined on an amortized cost basis, which is different from the fair value of the City’s position in the pool. At June 30, 2018, the total amount invested by all public agencies in the Sonoma County Investment Pool was approximately $2.5 billion.
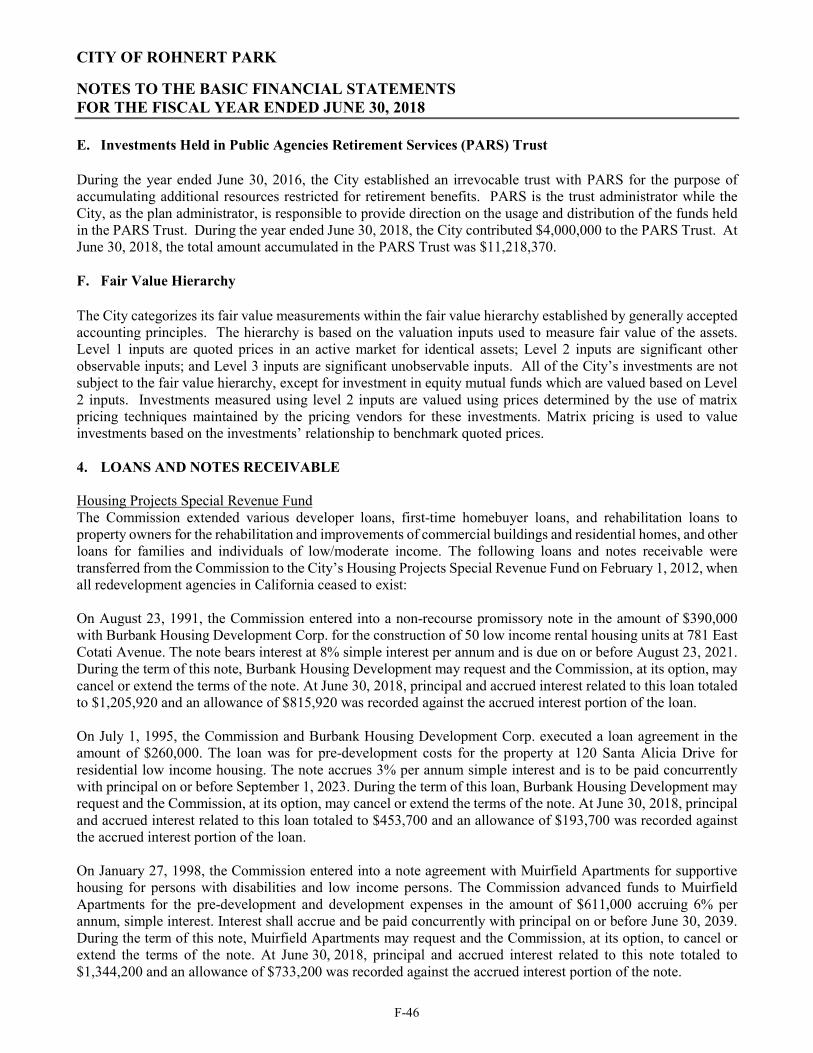
CITY OF ROHNERT PARK
NOTES TO THE BASIC FINANCIAL STATEMENTS FOR THE FISCAL YEAR ENDED JUNE 30, 2018
F-46
E. Investments Held in Public Agencies Retirement Services (PARS) Trust
During the year ended June 30, 2016, the City established an irrevocable trust with PARS for the purpose of accumulating additional resources restricted for retirement benefits. PARS is the trust administrator while the City, as the plan administrator, is responsible to provide direction on the usage and distribution of the funds held in the PARS Trust. During the year ended June 30, 2018, the City contributed $4,000,000 to the PARS Trust. At June 30, 2018, the total amount accumulated in the PARS Trust was $11,218,370. F. Fair Value Hierarchy
The City categorizes its fair value measurements within the fair value hierarchy established by generally accepted accounting principles. The hierarchy is based on the valuation inputs used to measure fair value of the assets. Level 1 inputs are quoted prices in an active market for identical assets; Level 2 inputs are significant other observable inputs; and Level 3 inputs are significant unobservable inputs. All of the City’s investments are not subject to the fair value hierarchy, except for investment in equity mutual funds which are valued based on Level 2 inputs. Investments measured using level 2 inputs are valued using prices determined by the use of matrix pricing techniques maintained by the pricing vendors for these investments. Matrix pricing is used to value investments based on the investments’ relationship to benchmark quoted prices. 4. LOANS AND NOTES RECEIVABLE Housing Projects Special Revenue Fund The Commission extended various developer loans, first-time homebuyer loans, and rehabilitation loans to property owners for the rehabilitation and improvements of commercial buildings and residential homes, and other loans for families and individuals of low/moderate income. The following loans and notes receivable were transferred from the Commission to the City’s Housing Projects Special Revenue Fund on February 1, 2012, when all redevelopment agencies in California ceased to exist:
On August 23, 1991, the Commission entered into a non-recourse promissory note in the amount of $390,000 with Burbank Housing Development Corp. for the construction of 50 low income rental housing units at 781 East Cotati Avenue. The note bears interest at 8% simple interest per annum and is due on or before August 23, 2021. During the term of this note, Burbank Housing Development may request and the Commission, at its option, may cancel or extend the terms of the note. At June 30, 2018, principal and accrued interest related to this loan totaled to $1,205,920 and an allowance of $815,920 was recorded against the accrued interest portion of the loan. On July 1, 1995, the Commission and Burbank Housing Development Corp. executed a loan agreement in the amount of $260,000. The loan was for pre-development costs for the property at 120 Santa Alicia Drive for residential low income housing. The note accrues 3% per annum simple interest and is to be paid concurrently with principal on or before September 1, 2023. During the term of this loan, Burbank Housing Development may request and the Commission, at its option, may cancel or extend the terms of the note. At June 30, 2018, principal and accrued interest related to this loan totaled to $453,700 and an allowance of $193,700 was recorded against the accrued interest portion of the loan. On January 27, 1998, the Commission entered into a note agreement with Muirfield Apartments for supportive housing for persons with disabilities and low income persons. The Commission advanced funds to Muirfield Apartments for the pre-development and development expenses in the amount of $611,000 accruing 6% per annum, simple interest. Interest shall accrue and be paid concurrently with principal on or before June 30, 2039. During the term of this note, Muirfield Apartments may request and the Commission, at its option, to cancel or extend the terms of the note. At June 30, 2018, principal and accrued interest related to this note totaled to $1,344,200 and an allowance of $733,200 was recorded against the accrued interest portion of the note.
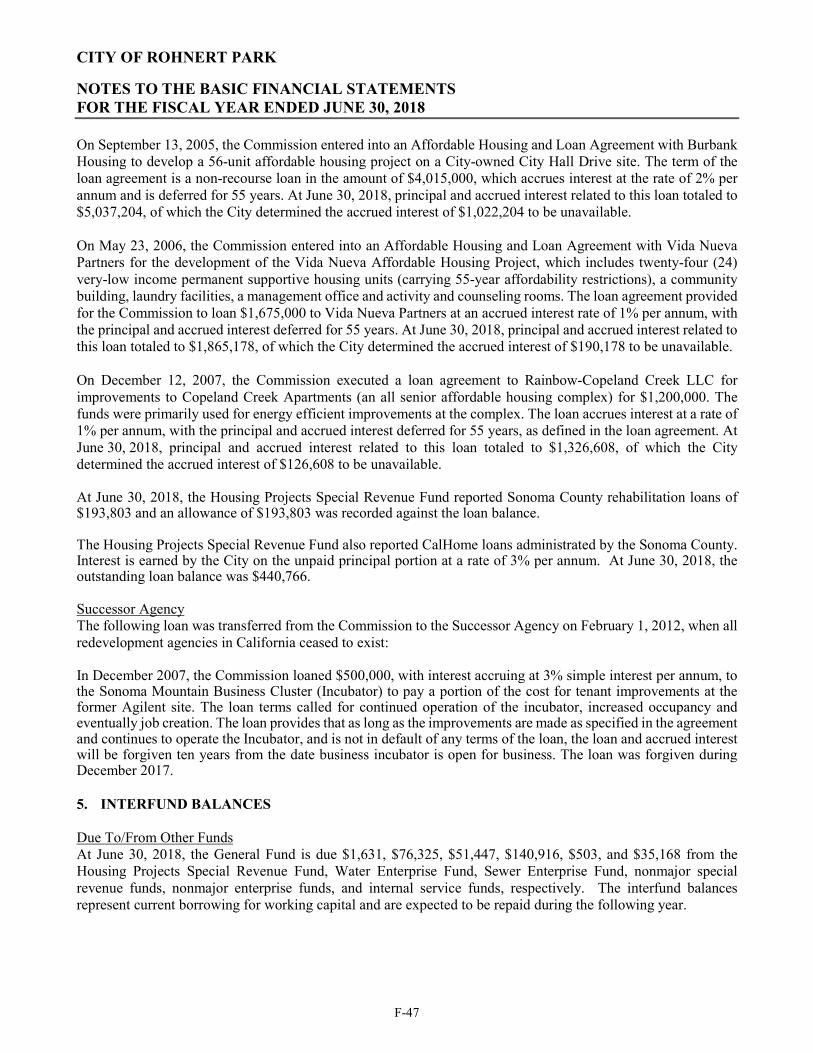
CITY OF ROHNERT PARK
NOTES TO THE BASIC FINANCIAL STATEMENTS FOR THE FISCAL YEAR ENDED JUNE 30, 2018
F-47
On September 13, 2005, the Commission entered into an Affordable Housing and Loan Agreement with Burbank Housing to develop a 56-unit affordable housing project on a City-owned City Hall Drive site. The term of the loan agreement is a non-recourse loan in the amount of $4,015,000, which accrues interest at the rate of 2% per annum and is deferred for 55 years. At June 30, 2018, principal and accrued interest related to this loan totaled to $5,037,204, of which the City determined the accrued interest of $1,022,204 to be unavailable. On May 23, 2006, the Commission entered into an Affordable Housing and Loan Agreement with Vida Nueva Partners for the development of the Vida Nueva Affordable Housing Project, which includes twenty-four (24) very-low income permanent supportive housing units (carrying 55-year affordability restrictions), a community building, laundry facilities, a management office and activity and counseling rooms. The loan agreement provided for the Commission to loan $1,675,000 to Vida Nueva Partners at an accrued interest rate of 1% per annum, with the principal and accrued interest deferred for 55 years. At June 30, 2018, principal and accrued interest related to this loan totaled to $1,865,178, of which the City determined the accrued interest of $190,178 to be unavailable. On December 12, 2007, the Commission executed a loan agreement to Rainbow-Copeland Creek LLC for improvements to Copeland Creek Apartments (an all senior affordable housing complex) for $1,200,000. The funds were primarily used for energy efficient improvements at the complex. The loan accrues interest at a rate of 1% per annum, with the principal and accrued interest deferred for 55 years, as defined in the loan agreement. At June 30, 2018, principal and accrued interest related to this loan totaled to $1,326,608, of which the City determined the accrued interest of $126,608 to be unavailable. At June 30, 2018, the Housing Projects Special Revenue Fund reported Sonoma County rehabilitation loans of $193,803 and an allowance of $193,803 was recorded against the loan balance. The Housing Projects Special Revenue Fund also reported CalHome loans administrated by the Sonoma County. Interest is earned by the City on the unpaid principal portion at a rate of 3% per annum. At June 30, 2018, the outstanding loan balance was $440,766. Successor Agency The following loan was transferred from the Commission to the Successor Agency on February 1, 2012, when all redevelopment agencies in California ceased to exist: In December 2007, the Commission loaned $500,000, with interest accruing at 3% simple interest per annum, to the Sonoma Mountain Business Cluster (Incubator) to pay a portion of the cost for tenant improvements at the former Agilent site. The loan terms called for continued operation of the incubator, increased occupancy and eventually job creation. The loan provides that as long as the improvements are made as specified in the agreement and continues to operate the Incubator, and is not in default of any terms of the loan, the loan and accrued interest will be forgiven ten years from the date business incubator is open for business. The loan was forgiven during December 2017. 5. INTERFUND BALANCES Due To/From Other Funds At June 30, 2018, the General Fund is due $1,631, $76,325, $51,447, $140,916, $503, and $35,168 from the Housing Projects Special Revenue Fund, Water Enterprise Fund, Sewer Enterprise Fund, nonmajor special revenue funds, nonmajor enterprise funds, and internal service funds, respectively. The interfund balances represent current borrowing for working capital and are expected to be repaid during the following year.
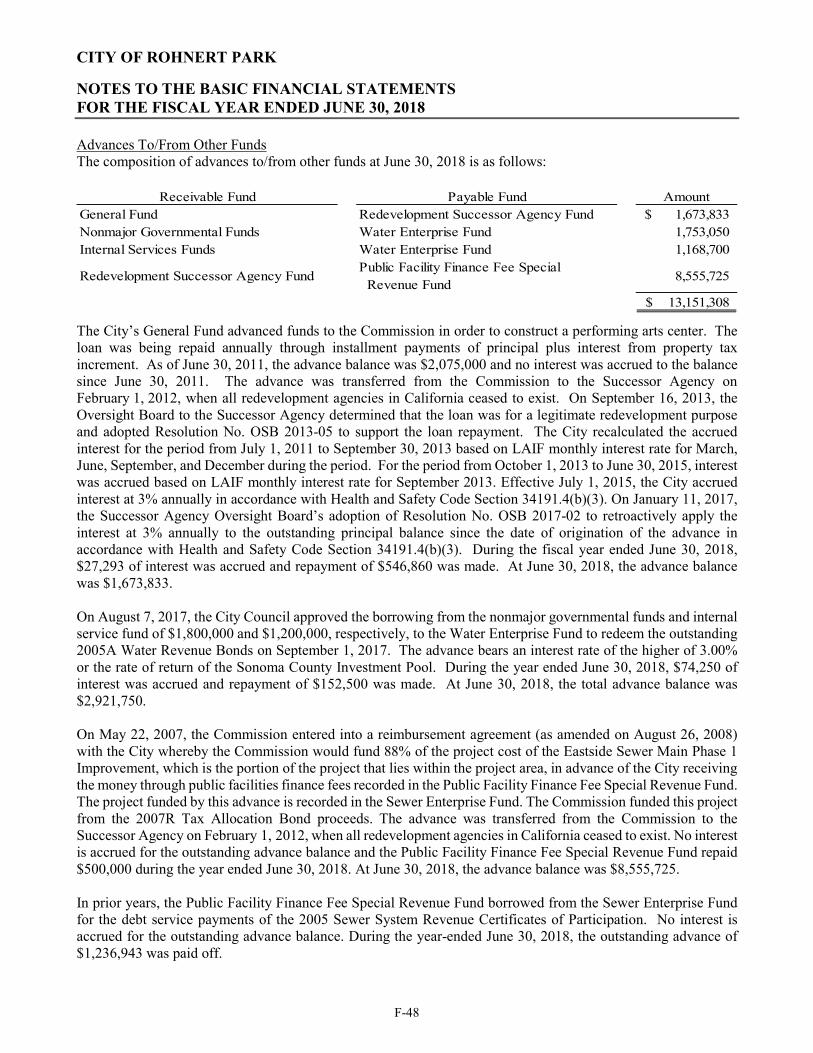
CITY OF ROHNERT PARK
NOTES TO THE BASIC FINANCIAL STATEMENTS FOR THE FISCAL YEAR ENDED JUNE 30, 2018
F-48
Advances To/From Other Funds The composition of advances to/from other funds at June 30, 2018 is as follows:
Receivable Fund Payable Fund AmountGeneral Fund Redevelopment Successor Agency Fund 1,673,833$ Nonmajor Governmental Funds Water Enterprise Fund 1,753,050 Internal Services Funds Water Enterprise Fund 1,168,700
Redevelopment Successor Agency FundPublic Facility Finance Fee Special Revenue Fund
8,555,725
13,151,308$
The City’s General Fund advanced funds to the Commission in order to construct a performing arts center. The loan was being repaid annually through installment payments of principal plus interest from property tax increment. As of June 30, 2011, the advance balance was $2,075,000 and no interest was accrued to the balance since June 30, 2011. The advance was transferred from the Commission to the Successor Agency on February 1, 2012, when all redevelopment agencies in California ceased to exist. On September 16, 2013, the Oversight Board to the Successor Agency determined that the loan was for a legitimate redevelopment purpose and adopted Resolution No. OSB 2013-05 to support the loan repayment. The City recalculated the accrued interest for the period from July 1, 2011 to September 30, 2013 based on LAIF monthly interest rate for March, June, September, and December during the period. For the period from October 1, 2013 to June 30, 2015, interest was accrued based on LAIF monthly interest rate for September 2013. Effective July 1, 2015, the City accrued interest at 3% annually in accordance with Health and Safety Code Section 34191.4(b)(3). On January 11, 2017, the Successor Agency Oversight Board’s adoption of Resolution No. OSB 2017-02 to retroactively apply the interest at 3% annually to the outstanding principal balance since the date of origination of the advance in accordance with Health and Safety Code Section 34191.4(b)(3). During the fiscal year ended June 30, 2018, $27,293 of interest was accrued and repayment of $546,860 was made. At June 30, 2018, the advance balance was $1,673,833. On August 7, 2017, the City Council approved the borrowing from the nonmajor governmental funds and internal service fund of $1,800,000 and $1,200,000, respectively, to the Water Enterprise Fund to redeem the outstanding 2005A Water Revenue Bonds on September 1, 2017. The advance bears an interest rate of the higher of 3.00% or the rate of return of the Sonoma County Investment Pool. During the year ended June 30, 2018, $74,250 of interest was accrued and repayment of $152,500 was made. At June 30, 2018, the total advance balance was $2,921,750. On May 22, 2007, the Commission entered into a reimbursement agreement (as amended on August 26, 2008) with the City whereby the Commission would fund 88% of the project cost of the Eastside Sewer Main Phase 1 Improvement, which is the portion of the project that lies within the project area, in advance of the City receiving the money through public facilities finance fees recorded in the Public Facility Finance Fee Special Revenue Fund. The project funded by this advance is recorded in the Sewer Enterprise Fund. The Commission funded this project from the 2007R Tax Allocation Bond proceeds. The advance was transferred from the Commission to the Successor Agency on February 1, 2012, when all redevelopment agencies in California ceased to exist. No interest is accrued for the outstanding advance balance and the Public Facility Finance Fee Special Revenue Fund repaid $500,000 during the year ended June 30, 2018. At June 30, 2018, the advance balance was $8,555,725. In prior years, the Public Facility Finance Fee Special Revenue Fund borrowed from the Sewer Enterprise Fund for the debt service payments of the 2005 Sewer System Revenue Certificates of Participation. No interest is accrued for the outstanding advance balance. During the year-ended June 30, 2018, the outstanding advance of $1,236,943 was paid off.
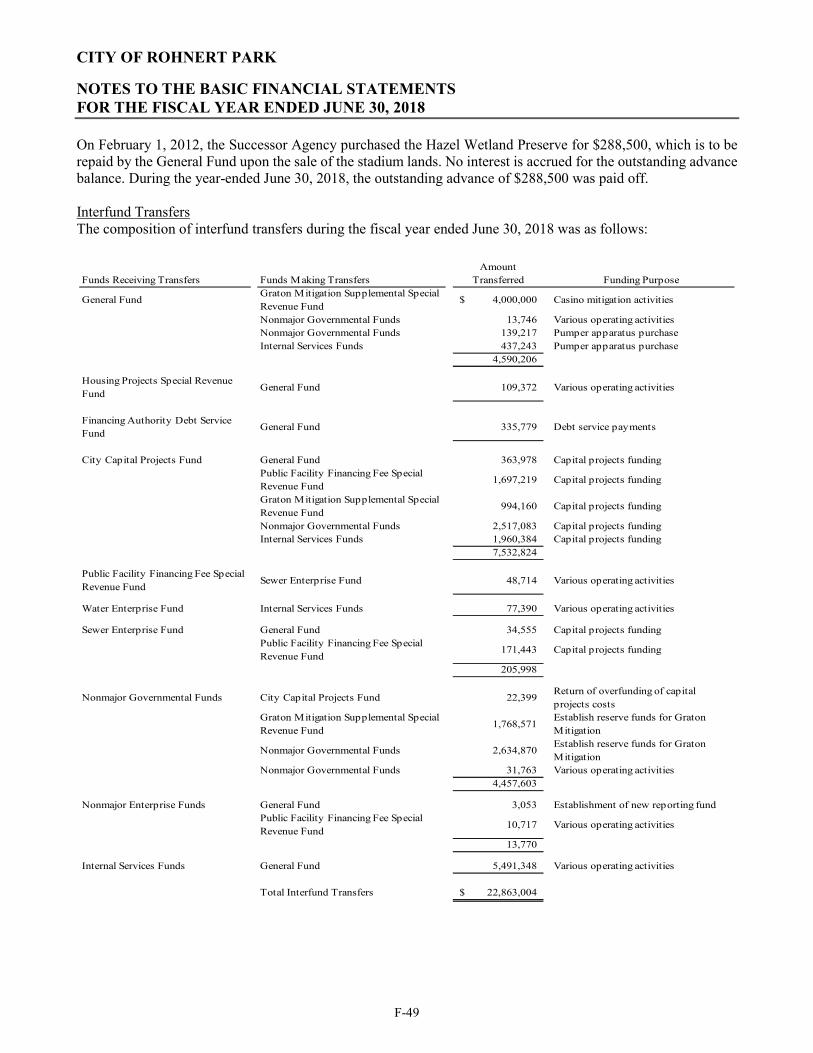
CITY OF ROHNERT PARK
NOTES TO THE BASIC FINANCIAL STATEMENTS FOR THE FISCAL YEAR ENDED JUNE 30, 2018
F-49
On February 1, 2012, the Successor Agency purchased the Hazel Wetland Preserve for $288,500, which is to be repaid by the General Fund upon the sale of the stadium lands. No interest is accrued for the outstanding advance balance. During the year-ended June 30, 2018, the outstanding advance of $288,500 was paid off. Interfund Transfers The composition of interfund transfers during the fiscal year ended June 30, 2018 was as follows:
Funds Receiving Transfers Funds Making TransfersAmount
Transferred Funding Purpose
General FundGraton Mitigation Supplemental Special Revenue Fund
4,000,000$ Casino mitigation activities
Nonmajor Governmental Funds 13,746 Various operating activitiesNonmajor Governmental Funds 139,217 Pumper apparatus purchaseInternal Services Funds 437,243 Pumper apparatus purchase
4,590,206
Housing Projects Special Revenue Fund
General Fund 109,372 Various operating activities
Financing Authority Debt Service Fund
General Fund 335,779 Debt service payments
City Capital Projects Fund General Fund 363,978 Capital projects fundingPublic Facility Financing Fee Special Revenue Fund
1,697,219 Capital projects funding
Graton Mitigation Supplemental Special Revenue Fund
994,160 Capital projects funding
Nonmajor Governmental Funds 2,517,083 Capital projects fundingInternal Services Funds 1,960,384 Capital projects funding
7,532,824
Public Facility Financing Fee Special Revenue Fund
Sewer Enterprise Fund 48,714 Various operating activities
Water Enterprise Fund Internal Services Funds 77,390 Various operating activities
Sewer Enterprise Fund General Fund 34,555 Capital projects fundingPublic Facility Financing Fee Special Revenue Fund
171,443 Capital projects funding
205,998
Nonmajor Governmental Funds City Capital Projects Fund 22,399 Return of overfunding of capital projects costs
Graton Mitigation Supplemental Special Revenue Fund
1,768,571 Establish reserve funds for Graton Mitigation
Nonmajor Governmental Funds 2,634,870 Establish reserve funds for Graton Mitigation
Nonmajor Governmental Funds 31,763 Various operating activities4,457,603
Nonmajor Enterprise Funds General Fund 3,053 Establishment of new reporting fundPublic Facility Financing Fee Special Revenue Fund
10,717 Various operating activities
13,770
Internal Services Funds General Fund 5,491,348 Various operating activities
Total Interfund Transfers 22,863,004$
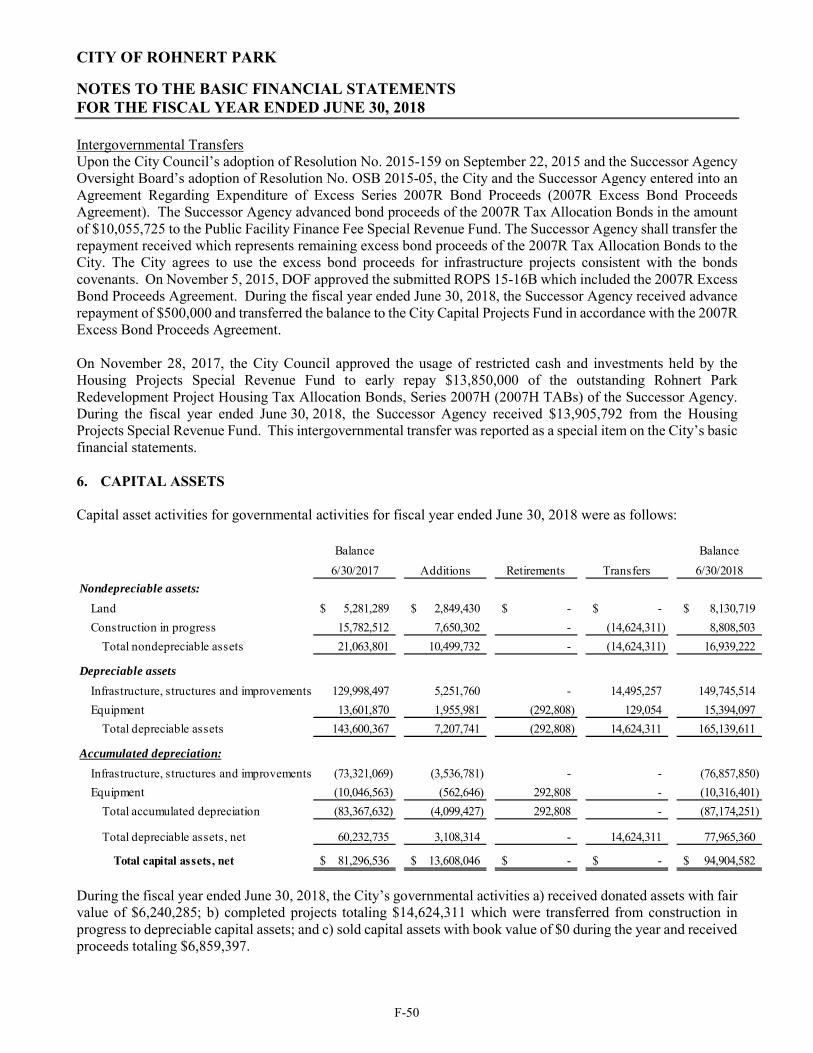
CITY OF ROHNERT PARK
NOTES TO THE BASIC FINANCIAL STATEMENTS FOR THE FISCAL YEAR ENDED JUNE 30, 2018
F-50
Intergovernmental Transfers Upon the City Council’s adoption of Resolution No. 2015-159 on September 22, 2015 and the Successor Agency Oversight Board’s adoption of Resolution No. OSB 2015-05, the City and the Successor Agency entered into an Agreement Regarding Expenditure of Excess Series 2007R Bond Proceeds (2007R Excess Bond Proceeds Agreement). The Successor Agency advanced bond proceeds of the 2007R Tax Allocation Bonds in the amount of $10,055,725 to the Public Facility Finance Fee Special Revenue Fund. The Successor Agency shall transfer the repayment received which represents remaining excess bond proceeds of the 2007R Tax Allocation Bonds to the City. The City agrees to use the excess bond proceeds for infrastructure projects consistent with the bonds covenants. On November 5, 2015, DOF approved the submitted ROPS 15-16B which included the 2007R Excess Bond Proceeds Agreement. During the fiscal year ended June 30, 2018, the Successor Agency received advance repayment of $500,000 and transferred the balance to the City Capital Projects Fund in accordance with the 2007R Excess Bond Proceeds Agreement. On November 28, 2017, the City Council approved the usage of restricted cash and investments held by the Housing Projects Special Revenue Fund to early repay $13,850,000 of the outstanding Rohnert Park Redevelopment Project Housing Tax Allocation Bonds, Series 2007H (2007H TABs) of the Successor Agency. During the fiscal year ended June 30, 2018, the Successor Agency received $13,905,792 from the Housing Projects Special Revenue Fund. This intergovernmental transfer was reported as a special item on the City’s basic financial statements. 6. CAPITAL ASSETS Capital asset activities for governmental activities for fiscal year ended June 30, 2018 were as follows:
Balance Balance
6/30/2017 Additions Retirements Transfers 6/30/2018
Nondepreciable assets:
Land 5,281,289$ 2,849,430$ -$ -$ 8,130,719$
Construction in progress 15,782,512 7,650,302 - (14,624,311) 8,808,503
Total nondepreciable assets 21,063,801 10,499,732 - (14,624,311) 16,939,222
Depreciable assets
Infrastructure, structures and improvements 129,998,497 5,251,760 - 14,495,257 149,745,514
Equipment 13,601,870 1,955,981 (292,808) 129,054 15,394,097
Total depreciable assets 143,600,367 7,207,741 (292,808) 14,624,311 165,139,611
Accumulated depreciation:
Infrastructure, structures and improvements (73,321,069) (3,536,781) - - (76,857,850)
Equipment (10,046,563) (562,646) 292,808 - (10,316,401)
Total accumulated depreciation (83,367,632) (4,099,427) 292,808 - (87,174,251)
Total depreciable assets, net 60,232,735 3,108,314 - 14,624,311 77,965,360
Total capital assets, net 81,296,536$ 13,608,046$ -$ -$ 94,904,582$
During the fiscal year ended June 30, 2018, the City’s governmental activities a) received donated assets with fair value of $6,240,285; b) completed projects totaling $14,624,311 which were transferred from construction in progress to depreciable capital assets; and c) sold capital assets with book value of $0 during the year and received proceeds totaling $6,859,397.
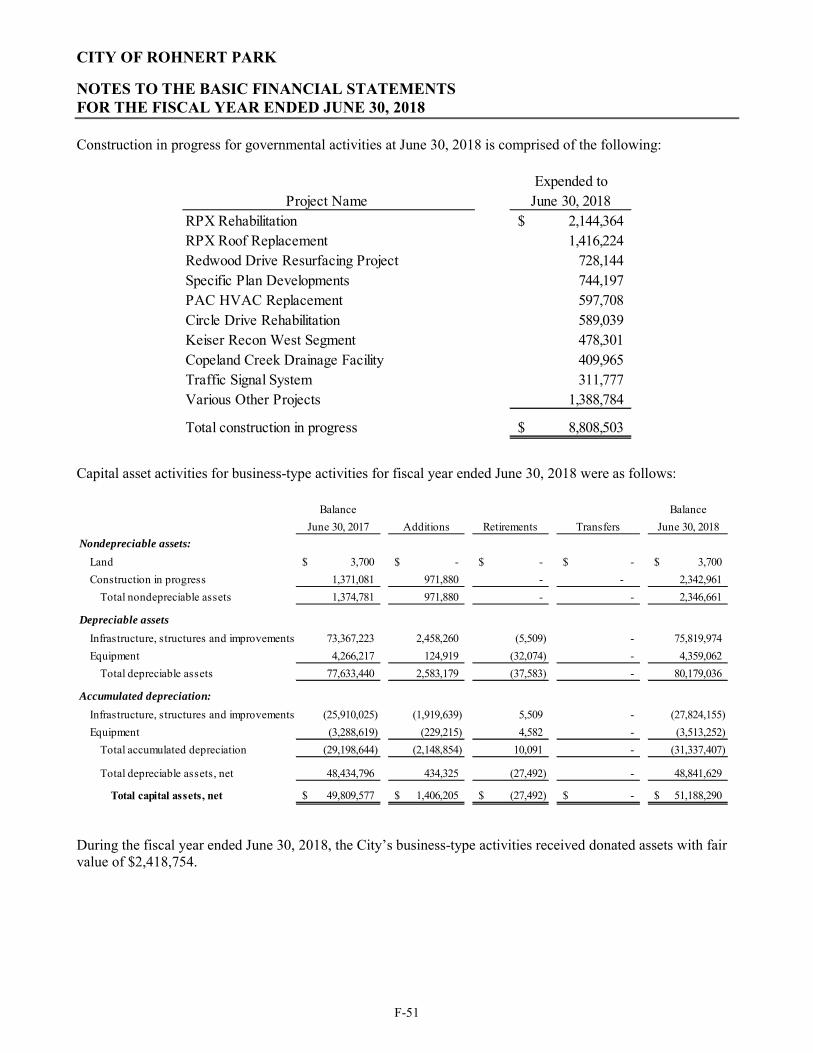
CITY OF ROHNERT PARK
NOTES TO THE BASIC FINANCIAL STATEMENTS FOR THE FISCAL YEAR ENDED JUNE 30, 2018
F-51
Construction in progress for governmental activities at June 30, 2018 is comprised of the following:
Expended toProject Name June 30, 2018
RPX Rehabilitation 2,144,364$ RPX Roof Replacement 1,416,224 Redwood Drive Resurfacing Project 728,144 Specific Plan Developments 744,197 PAC HVAC Replacement 597,708 Circle Drive Rehabilitation 589,039 Keiser Recon West Segment 478,301 Copeland Creek Drainage Facility 409,965 Traffic Signal System 311,777 Various Other Projects 1,388,784
Total construction in progress 8,808,503$
Capital asset activities for business-type activities for fiscal year ended June 30, 2018 were as follows:
Balance Balance
June 30, 2017 Additions Retirements Transfers June 30, 2018
Nondepreciable assets:
Land 3,700$ -$ -$ -$ 3,700$
Construction in progress 1,371,081 971,880 - - 2,342,961
Total nondepreciable assets 1,374,781 971,880 - - 2,346,661
Depreciable assets
Infrastructure, structures and improvements 73,367,223 2,458,260 (5,509) - 75,819,974
Equipment 4,266,217 124,919 (32,074) - 4,359,062
Total depreciable assets 77,633,440 2,583,179 (37,583) - 80,179,036
Accumulated depreciation:
Infrastructure, structures and improvements (25,910,025) (1,919,639) 5,509 - (27,824,155)
Equipment (3,288,619) (229,215) 4,582 - (3,513,252)
Total accumulated depreciation (29,198,644) (2,148,854) 10,091 - (31,337,407)
Total depreciable assets, net 48,434,796 434,325 (27,492) - 48,841,629
Total capital assets, net 49,809,577$ 1,406,205$ (27,492)$ -$ 51,188,290$
During the fiscal year ended June 30, 2018, the City’s business-type activities received donated assets with fair value of $2,418,754.
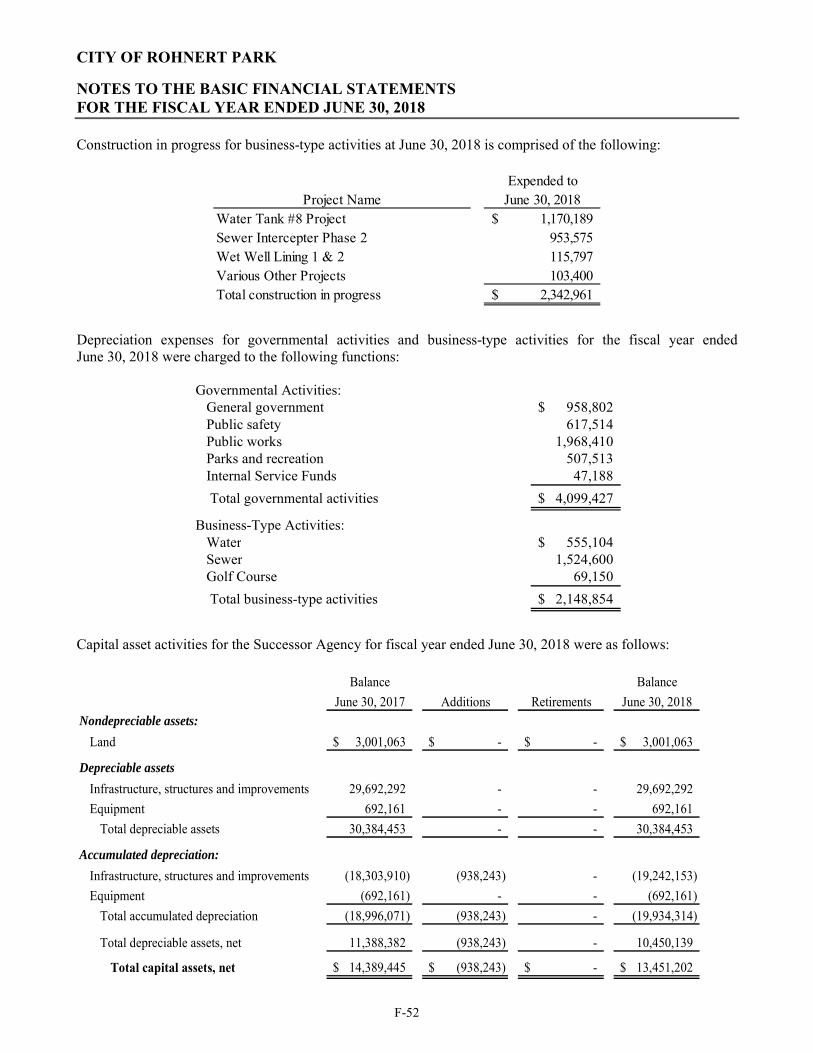
CITY OF ROHNERT PARK
NOTES TO THE BASIC FINANCIAL STATEMENTS FOR THE FISCAL YEAR ENDED JUNE 30, 2018
F-52
Construction in progress for business-type activities at June 30, 2018 is comprised of the following:
Expended toProject Name June 30, 2018
Water Tank #8 Project 1,170,189$ Sewer Intercepter Phase 2 953,575 Wet Well Lining 1 & 2 115,797 Various Other Projects 103,400 Total construction in progress 2,342,961$
Depreciation expenses for governmental activities and business-type activities for the fiscal year ended June 30, 2018 were charged to the following functions:
Governmental Activities:General government 958,802$ Public safety 617,514 Public works 1,968,410 Parks and recreation 507,513 Internal Service Funds 47,188
Total governmental activities 4,099,427$
Business-Type Activities:Water 555,104$ Sewer 1,524,600 Golf Course 69,150
Total business-type activities 2,148,854$
Capital asset activities for the Successor Agency for fiscal year ended June 30, 2018 were as follows:
Balance Balance
June 30, 2017 Additions Retirements June 30, 2018
Nondepreciable assets:
Land 3,001,063$ -$ -$ 3,001,063$
Depreciable assets
Infrastructure, structures and improvements 29,692,292 - - 29,692,292
Equipment 692,161 - - 692,161
Total depreciable assets 30,384,453 - - 30,384,453
Accumulated depreciation:
Infrastructure, structures and improvements (18,303,910) (938,243) - (19,242,153)
Equipment (692,161) - - (692,161)
Total accumulated depreciation (18,996,071) (938,243) - (19,934,314)
Total depreciable assets, net 11,388,382 (938,243) - 10,450,139
Total capital assets, net 14,389,445$ (938,243)$ -$ 13,451,202$
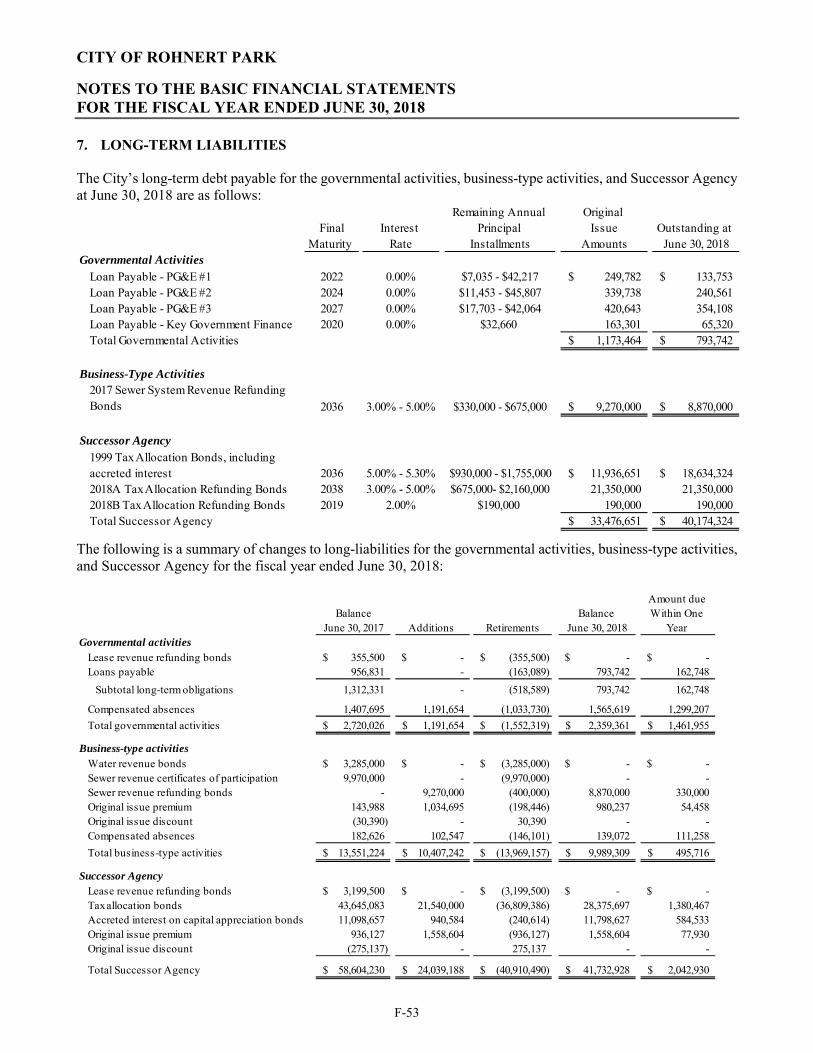
CITY OF ROHNERT PARK
NOTES TO THE BASIC FINANCIAL STATEMENTS FOR THE FISCAL YEAR ENDED JUNE 30, 2018
F-53
7. LONG-TERM LIABILITIES The City’s long-term debt payable for the governmental activities, business-type activities, and Successor Agency at June 30, 2018 are as follows:
Remaining Annual Original Final Interest Principal Issue Outstanding at
Maturity Rate Installments Amounts June 30, 2018Governmental Activities
Loan Payable - PG&E #1 2022 0.00% $7,035 - $42,217 249,782$ 133,753$ Loan Payable - PG&E #2 2024 0.00% $11,453 - $45,807 339,738 240,561 Loan Payable - PG&E #3 2027 0.00% $17,703 - $42,064 420,643 354,108 Loan Payable - Key Government Finance 2020 0.00% $32,660 163,301 65,320 Total Governmental Activities 1,173,464$ 793,742$
Business-Type Activities2017 Sewer System Revenue Refunding Bonds 2036 3.00% - 5.00% $330,000 - $675,000 9,270,000$ 8,870,000$
Successor Agency1999 Tax Allocation Bonds, including accreted interest 2036 5.00% - 5.30% $930,000 - $1,755,000 11,936,651$ 18,634,324$ 2018A Tax Allocation Refunding Bonds 2038 3.00% - 5.00% $675,000- $2,160,000 21,350,000 21,350,000 2018B Tax Allocation Refunding Bonds 2019 2.00% $190,000 190,000 190,000 Total Successor Agency 33,476,651$ 40,174,324$
The following is a summary of changes to long-liabilities for the governmental activities, business-type activities, and Successor Agency for the fiscal year ended June 30, 2018:
Amount due Balance Balance Within One
June 30, 2017 Additions Retirements June 30, 2018 Year Governmental activities
Lease revenue refunding bonds 355,500$ -$ (355,500)$ -$ -$ Loans payable 956,831 - (163,089) 793,742 162,748
Subtotal long-term obligations 1,312,331 - (518,589) 793,742 162,748
Compensated absences 1,407,695 1,191,654 (1,033,730) 1,565,619 1,299,207
Total governmental activities 2,720,026$ 1,191,654$ (1,552,319)$ 2,359,361$ 1,461,955$
Business-type activitiesWater revenue bonds 3,285,000$ -$ (3,285,000)$ -$ -$ Sewer revenue certificates of participation 9,970,000 - (9,970,000) - - Sewer revenue refunding bonds - 9,270,000 (400,000) 8,870,000 330,000 Original issue premium 143,988 1,034,695 (198,446) 980,237 54,458 Original issue discount (30,390) - 30,390 - - Compensated absences 182,626 102,547 (146,101) 139,072 111,258
Total business-type activities 13,551,224$ 10,407,242$ (13,969,157)$ 9,989,309$ 495,716$
Successor AgencyLease revenue refunding bonds 3,199,500$ -$ (3,199,500)$ -$ -$ Tax allocation bonds 43,645,083 21,540,000 (36,809,386) 28,375,697 1,380,467 Accreted interest on capital appreciation bonds 11,098,657 940,584 (240,614) 11,798,627 584,533 Original issue premium 936,127 1,558,604 (936,127) 1,558,604 77,930 Original issue discount (275,137) - 275,137 - -
Total Successor Agency 58,604,230$ 24,039,188$ (40,910,490)$ 41,732,928$ 2,042,930$
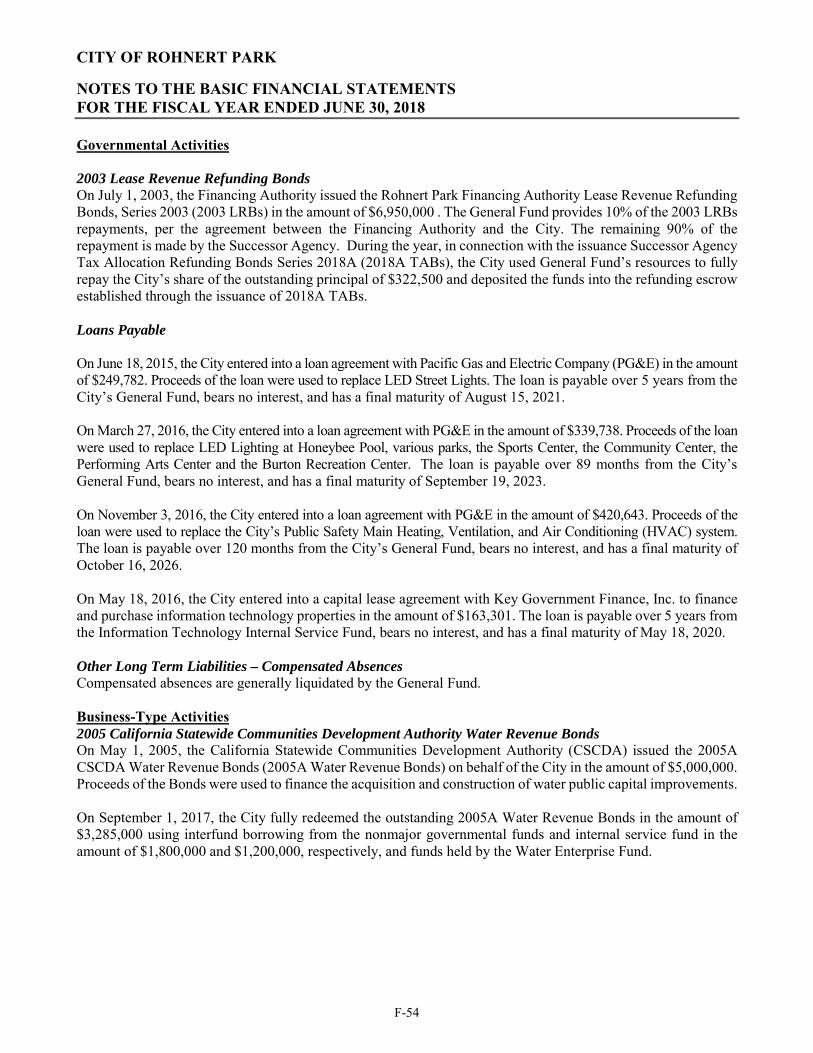
CITY OF ROHNERT PARK
NOTES TO THE BASIC FINANCIAL STATEMENTS FOR THE FISCAL YEAR ENDED JUNE 30, 2018
F-54
Governmental Activities 2003 Lease Revenue Refunding Bonds On July 1, 2003, the Financing Authority issued the Rohnert Park Financing Authority Lease Revenue Refunding Bonds, Series 2003 (2003 LRBs) in the amount of $6,950,000 . The General Fund provides 10% of the 2003 LRBs repayments, per the agreement between the Financing Authority and the City. The remaining 90% of the repayment is made by the Successor Agency. During the year, in connection with the issuance Successor Agency Tax Allocation Refunding Bonds Series 2018A (2018A TABs), the City used General Fund’s resources to fully repay the City’s share of the outstanding principal of $322,500 and deposited the funds into the refunding escrow established through the issuance of 2018A TABs. Loans Payable On June 18, 2015, the City entered into a loan agreement with Pacific Gas and Electric Company (PG&E) in the amount of $249,782. Proceeds of the loan were used to replace LED Street Lights. The loan is payable over 5 years from the City’s General Fund, bears no interest, and has a final maturity of August 15, 2021. On March 27, 2016, the City entered into a loan agreement with PG&E in the amount of $339,738. Proceeds of the loan were used to replace LED Lighting at Honeybee Pool, various parks, the Sports Center, the Community Center, the Performing Arts Center and the Burton Recreation Center. The loan is payable over 89 months from the City’s General Fund, bears no interest, and has a final maturity of September 19, 2023. On November 3, 2016, the City entered into a loan agreement with PG&E in the amount of $420,643. Proceeds of the loan were used to replace the City’s Public Safety Main Heating, Ventilation, and Air Conditioning (HVAC) system. The loan is payable over 120 months from the City’s General Fund, bears no interest, and has a final maturity of October 16, 2026. On May 18, 2016, the City entered into a capital lease agreement with Key Government Finance, Inc. to finance and purchase information technology properties in the amount of $163,301. The loan is payable over 5 years from the Information Technology Internal Service Fund, bears no interest, and has a final maturity of May 18, 2020. Other Long Term Liabilities – Compensated Absences Compensated absences are generally liquidated by the General Fund. Business-Type Activities 2005 California Statewide Communities Development Authority Water Revenue Bonds On May 1, 2005, the California Statewide Communities Development Authority (CSCDA) issued the 2005A CSCDA Water Revenue Bonds (2005A Water Revenue Bonds) on behalf of the City in the amount of $5,000,000. Proceeds of the Bonds were used to finance the acquisition and construction of water public capital improvements. On September 1, 2017, the City fully redeemed the outstanding 2005A Water Revenue Bonds in the amount of $3,285,000 using interfund borrowing from the nonmajor governmental funds and internal service fund in the amount of $1,800,000 and $1,200,000, respectively, and funds held by the Water Enterprise Fund.
CITY OF ROHNERT PARK
NOTES TO THE BASIC FINANCIAL STATEMENTS FOR THE FISCAL YEAR ENDED JUNE 30, 2018
F-55
2005 Sewer System Revenue Certificates of Participation On May 27, 2005, the City entered into an installment purchase agreement with the Financing Authority for the issuances of Sewer System Revenue Certificates of Participation, Series 2005 (2005 Sewer COPs) in the amount of $13,000,000. Proceeds of the 2005 Sewer COPs are being used for financing certain improvements, betterments, renovations and expansions of facilities within the Sewer System of the City. Pursuant to the Installment Purchase Agreement, all Net Revenues and all amounts on deposit in the Revenue Fund (other than amounts on deposit therein required to pay Operations and Maintenance Costs) are irrevocably pledged to the payment of the Installment Payments as provided therein. In addition, the Public Facility Finance Fee Special Revenue Fund is required to repay its portion of the Installment Payments that represent improvements constructed with these bond proceeds that were used to expand facility capacity. During the year ended June 30, 2018, the 2005 Sewer COPs were fully refunded through the issuance of the Sewer System Revenue Refunding Bonds, Series 2017 (2017 Sewer Refunding Bonds). 2017 Sewer System Revenue Refunding Bonds On August 3, 2017, the City issued 2017 Sewer Refunding Bonds with principal amount of $9,270,000. The bond proceeds, including part of the bond premium of $1,034,695, totaled to $10,094,064, were deposited into the refunding escrow to current refund the 2005 Sewer COPS with outstanding principal of $9,970,000. The refunding achieved $1,737,386 in net present value savings. The 2017 Sewer Refunding Bonds bear fixed interest rates ranging from 2.00% to 5.00% with a final maturity date of June 1, 2036. Sewer Net Revenues have been pledged until the fiscal year ended June 30, 2036, the final maturity of the 2017 Sewer Refunding Bonds. The total principal and interest remaining on the 2017 Sewer Refunding Bonds is $12,567,600. The Sewer Net Revenues for the fiscal year ended June 30, 2018 was $2.9 million and total public facilities finance fee was $10.3 million while the total debt service payment was $697,964. Successor Agency Long term obligations were transferred from the Commission to the Successor Agency on February 1, 2012, when all redevelopment agencies in California ceased to exist: 1999 Tax Allocation Bonds On January 15, 1999, the Commission issued Capital Appreciation Tax Allocation Bonds, Series 1999 (1999 TABs) in the amount of $11,936,651. The 1999 TABs were issued for the purpose of funding certain capital improvements, to fund a reserve fund and to pay the costs of issuing the Series 1999 Bonds. The 1999 TABs are scheduled to mature during the fiscal year ending June 30, 2036, are limited obligations of the Successor Agency payable and secured by tax revenues to be derived from the project area.
CITY OF ROHNERT PARK
NOTES TO THE BASIC FINANCIAL STATEMENTS FOR THE FISCAL YEAR ENDED JUNE 30, 2018
F-56
2001 Tax Allocation Bonds On September 25, 2001, the Commission issued the Rohnert Park Redevelopment Project Tax Allocation Refunding Bonds, Series 2001 (2001 TABs) in the amount of $8,200,000 for the purpose of refunding a portion of the Commission’s outstanding Series 1991 Bonds, funding certain capital improvements, funding a reserve fund and paying the issuance costs. The 2001 TABs are scheduled to mature during the fiscal year ending June 30, 2021, are limited obligations of the Successor Agency payable and secured by tax revenues to be derived from the project area. During the year ended June 30, 2018, the 1999 TABs were fully refunded through the issuance of the 2018A TABs. At June 30, 2018, the outstanding defeased 2001 TABs were $2,225,000. 2003 Lease Revenue Refunding Bonds As discussed in the governmental activities section, 2003 LRBs were issued to refinance the 1994 COPs and 1999 COPs. The General Fund provides 10% of the 2003 LRBs repayments, per the agreement between the Financing Authority and the City. The remaining 90% of the repayment is made by the Successor Agency. The 2003 LRBs are scheduled to mature during the fiscal year ending June 30, 2026. During the year ended June 30, 2018, the 2003 LRBs were fully refunded through the issuance of the 2018A TABs. 2007R and 2007H Tax Allocation Bonds On March 28, 2007 the Commission issued the Rohnert Park Redevelopment Project Tax Allocation Bonds, Series 2007R (2007R TABs) in the amount of $34,680,000, and the 2007H TABs in the amount of $26,760,000, for the purpose of financing certain public improvements, including certain housing projects, purchasing municipal bond debt service reserve fund policies in order to satisfy the reserve requirements for the respective reserve accounts, and paying the costs of issuing the bonds. The 2007R and 2007H TABs, which are scheduled to mature during the fiscal year ended June 30, 2038, are limited obligations of the Successor Agency payable and secured by tax revenues to be derived from the project area. During the year ended June 30, 2018, the 2007R TABs were fully refunded through the issuance of the 2018A TABs while $13,850,000 of the outstanding principal of 2007H TABs are repaid using funds received from the Housing Projects Special Revenue Fund and the remaining outstanding principal of $200,000 are refunded through the issuance of Successor Agency Tax Allocation Refunding Bonds Series 2018B (2018B TABs). 2018A Tax Allocation Bonds On May 3, 2018, the Successor Agency issued the 2018A TABs in the amount of $21,350,000. The bond proceeds, including part of the bond premium of $1,558,604, and funds held by the Successor Agency of $1,420,257, totaled to $23,842,210, were deposited into the refunding escrows to current refund the 2003 TABs with outstanding principal of $3,225,000 ($322,500 and $2,902,500 for governmental activities and Successor Agency, respectively), current refund the 2007R TABs with outstanding principal of $18,070,000, and advance refund the 2001 TABs with outstanding principal of $2,225,000. The refunding achieved $3,012,291 in net present value savings. The 2018A TABs bear fixed interest rates ranging from 3.00% to 5.00% with a final maturity date of August 1, 2037. 2018B Tax Allocation Bonds On May 3, 2018, the Successor Agency issued the 2018B TABs in the amount of $190,000. The bond proceeds, and part of funds held by the Successor Agency of $14,756, totaled to $202,045, were deposited into the refunding escrows to current refund the 2007H TABs with outstanding principal of $200,000. The refunding achieved $2,328 in net present value losses. The 2018B TABs bear fixed interest rate of 2.00% with a final maturity date of August 1, 2018. The Successor Agency receives payments from the RPTTF to fund the debt services of the bonds. The total principal and interest remaining on the 1999, 2018A, and 2018B TABs is $59,183,430. The total RPTTF revenue for the fiscal year ended June 30, 2018 was $5.7 million while the total debt service payment was $6.2 million.
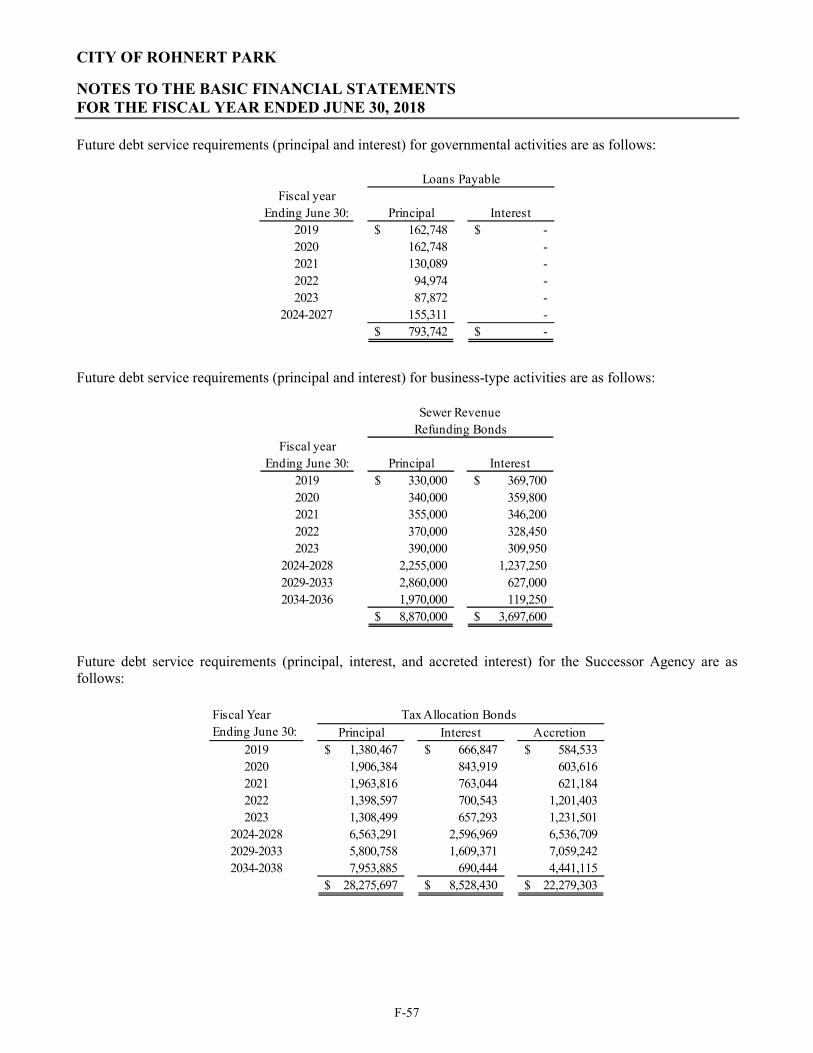
CITY OF ROHNERT PARK
NOTES TO THE BASIC FINANCIAL STATEMENTS FOR THE FISCAL YEAR ENDED JUNE 30, 2018
F-57
Future debt service requirements (principal and interest) for governmental activities are as follows:
Fiscal year Ending June 30: Principal Interest
2019 162,748$ -$ 2020 162,748 - 2021 130,089 - 2022 94,974 - 2023 87,872 -
2024-2027 155,311 - 793,742$ -$
Loans Payable
Future debt service requirements (principal and interest) for business-type activities are as follows:
Fiscal year Ending June 30: Principal Interest
2019 330,000$ 369,700$ 2020 340,000 359,800 2021 355,000 346,200 2022 370,000 328,450 2023 390,000 309,950
2024-2028 2,255,000 1,237,250 2029-2033 2,860,000 627,000 2034-2036 1,970,000 119,250
8,870,000$ 3,697,600$
Refunding BondsSewer Revenue
Future debt service requirements (principal, interest, and accreted interest) for the Successor Agency are as follows:
Principal Interest Accretion 2019 1,380,467$ 666,847$ 584,533$ 2020 1,906,384 843,919 603,616 2021 1,963,816 763,044 621,184 2022 1,398,597 700,543 1,201,403 2023 1,308,499 657,293 1,231,501
2024-2028 6,563,291 2,596,969 6,536,709 2029-2033 5,800,758 1,609,371 7,059,242 2034-2038 7,953,885 690,444 4,441,115
28,275,697$ 8,528,430$ 22,279,303$
Tax Allocation Bonds Fiscal Year Ending June 30:
CITY OF ROHNERT PARK
NOTES TO THE BASIC FINANCIAL STATEMENTS FOR THE FISCAL YEAR ENDED JUNE 30, 2018
F-58
Legal Debt Limit As of June 30, 2018, the City’s legal debt limit (15% of valuation subject to taxation) was $730.5 million and the City has no debt subject to the legal debt limit. Arbitrage Liability The Tax Reform Act of 1986 instituted certain arbitrage restrictions with respect to the issuance of tax-exempt bonds after August 31, 1986. Arbitrage regulations deal with the investment of all tax-exempt bond proceeds at an interest yield greater than the interest yield paid to bondholders. Generally, all interest paid to bondholders can be retroactively rendered taxable if applicable rebates are not reported and paid to the Internal Revenue Service at least every five years. At June 30, 2018, the City has no arbitrage liability. 8. EMPLOYEES' RETIREMENT PLAN Plan Description All qualified permanent and probationary employees are eligible to participate in the City’s CalPERS plans. The City participates in five plans with CalPERS as follows:
CalPERS Plan Type of Plan Participants
Miscellaneous Plan Agent multi-employer plan City non-safety members
Safety Tier 1 Plan Cost sharing planSafety members hired or join CalPERS before 7/1/2008
Safety Tier 2 Plan Cost sharing planSafety members hired or join CalPERS from 7/1/2008 to 6/17/2012
Safety Tier 3 Plan Cost sharing planSafety members hired or join CalPERS from 6/18/2012 and 12/31/2012
Safety PEPRA Plan Cost sharing planSafety members hired or join CalPERS since 1/1/2013
CalPERS acts as a common investment and administrative agent for various local and state governmental agencies within the State of California. Benefit provisions and other requirements are established by State statute, employer contract with CalPERS and by City resolution. CalPERS issues publicly available reports that include a full description of the pension plans regarding benefit provisions, assumptions and membership information that can be found on the CalPERS website at www.calpers.ca.gov. Benefits Provided CalPERS provides service retirement and disability benefits, annual cost of living adjustments and death benefits to plan members, who must be public employees and beneficiaries. Benefits are based on a final average compensation period of 12 months or 36 months. The cost of living adjustments for the CalPERS plans are applied as specified by the Public Employees’ Retirement Law. The California Public Employees’ Pension Reform Act (PEPRA), which took effect in January 2013, changes the way CalPERS retirement and health benefits are applied, and places compensation limits on members. As such members who established CalPERS membership on or after January 1, 2013 are known as “PEPRA” members.
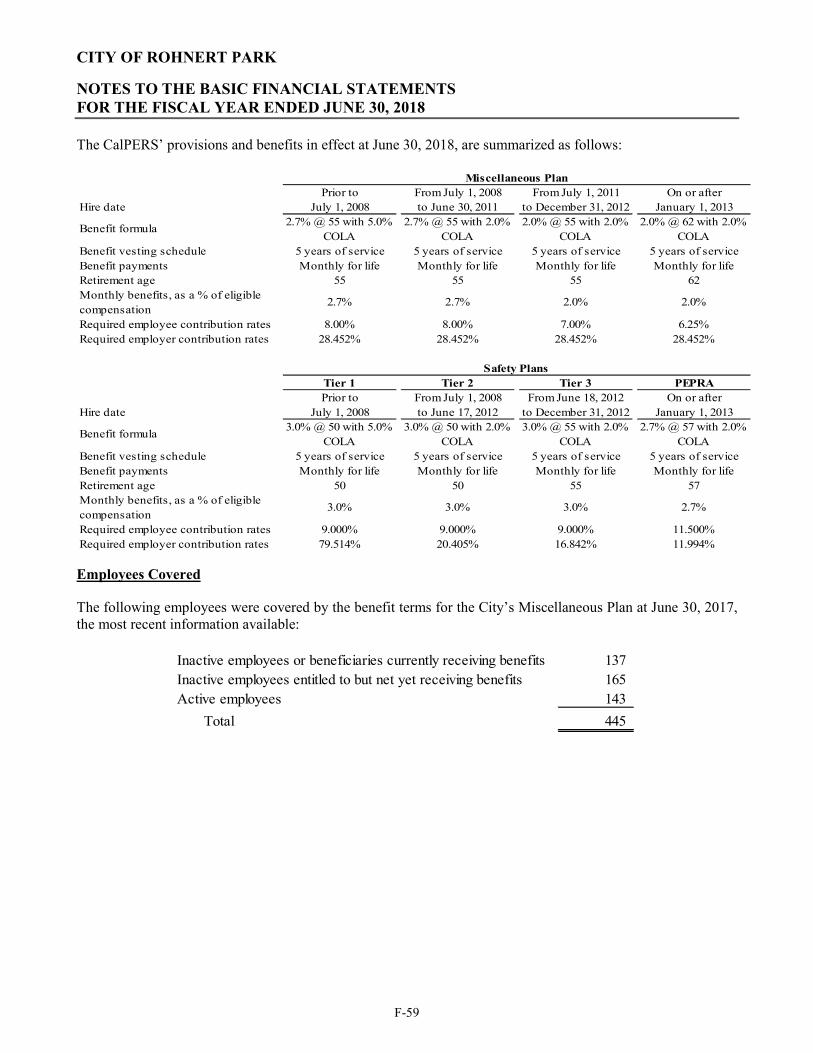
CITY OF ROHNERT PARK
NOTES TO THE BASIC FINANCIAL STATEMENTS FOR THE FISCAL YEAR ENDED JUNE 30, 2018
F-59
The CalPERS’ provisions and benefits in effect at June 30, 2018, are summarized as follows:
Prior to From July 1, 2008 From July 1, 2011 On or afterJuly 1, 2008 to June 30, 2011 to December 31, 2012 January 1, 2013
Benefit formula2.7% @ 55 with 5.0%
COLA2.7% @ 55 with 2.0%
COLA2.0% @ 55 with 2.0%
COLA2.0% @ 62 with 2.0%
COLABenefit vesting schedule 5 years of service 5 years of service 5 years of service 5 years of serviceBenefit payments Monthly for life Monthly for life Monthly for life Monthly for lifeRetirement age 55 55 55 62Monthly benefits, as a % of eligible compensation
2.7% 2.7% 2.0% 2.0%
Required employee contribution rates 8.00% 8.00% 7.00% 6.25%Required employer contribution rates 28.452% 28.452% 28.452% 28.452%
Tier 1 Tier 2 Tier 3 PEPRAPrior to From July 1, 2008 From June 18, 2012 On or after
July 1, 2008 to June 17, 2012 to December 31, 2012 January 1, 2013
Benefit formula3.0% @ 50 with 5.0%
COLA3.0% @ 50 with 2.0%
COLA3.0% @ 55 with 2.0%
COLA2.7% @ 57 with 2.0%
COLABenefit vesting schedule 5 years of service 5 years of service 5 years of service 5 years of serviceBenefit payments Monthly for life Monthly for life Monthly for life Monthly for lifeRetirement age 50 50 55 57Monthly benefits, as a % of eligible compensation
3.0% 3.0% 3.0% 2.7%
Required employee contribution rates 9.000% 9.000% 9.000% 11.500%Required employer contribution rates 79.514% 20.405% 16.842% 11.994%
Hire date
Hire date
Miscellaneous Plan
Safety Plans
Employees Covered The following employees were covered by the benefit terms for the City’s Miscellaneous Plan at June 30, 2017, the most recent information available:
Inactive employees or beneficiaries currently receiving benefits 137 Inactive employees entitled to but net yet receiving benefits 165 Active employees 143
Total 445
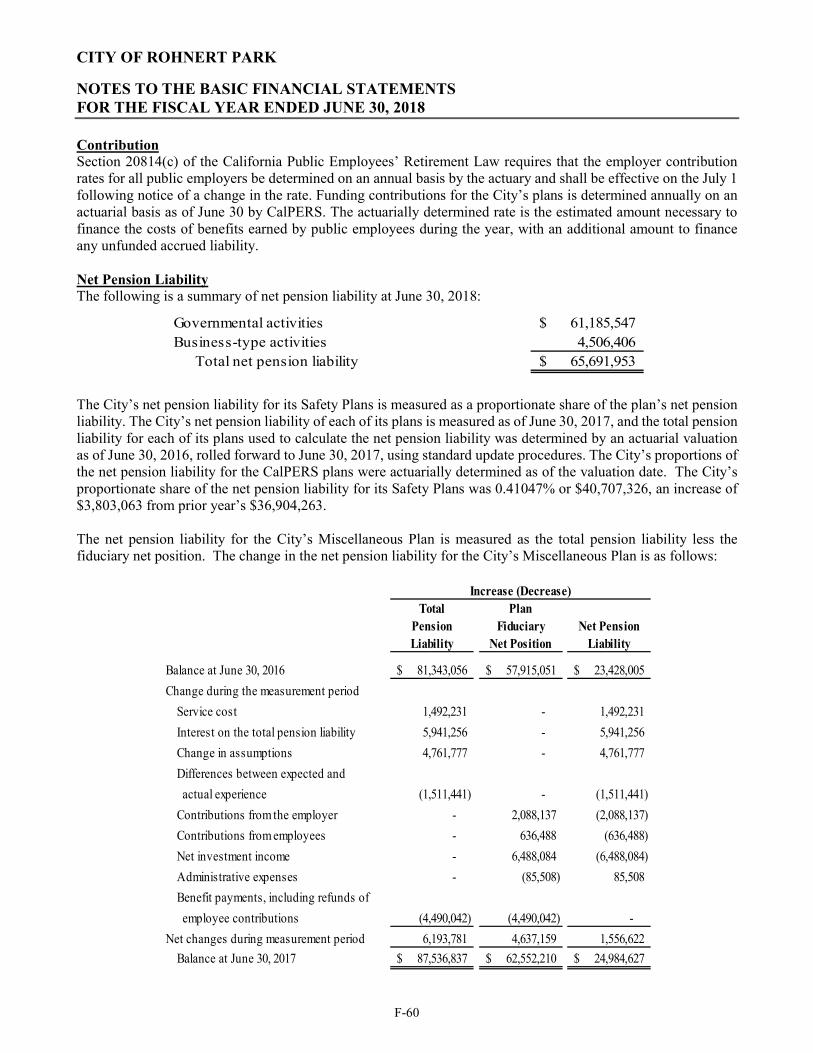
CITY OF ROHNERT PARK
NOTES TO THE BASIC FINANCIAL STATEMENTS FOR THE FISCAL YEAR ENDED JUNE 30, 2018
F-60
Contribution Section 20814(c) of the California Public Employees’ Retirement Law requires that the employer contribution rates for all public employers be determined on an annual basis by the actuary and shall be effective on the July 1 following notice of a change in the rate. Funding contributions for the City’s plans is determined annually on an actuarial basis as of June 30 by CalPERS. The actuarially determined rate is the estimated amount necessary to finance the costs of benefits earned by public employees during the year, with an additional amount to finance any unfunded accrued liability. Net Pension Liability The following is a summary of net pension liability at June 30, 2018:
Governmental activities 61,185,547$ Business-type activities 4,506,406
Total net pension liability 65,691,953$
The City’s net pension liability for its Safety Plans is measured as a proportionate share of the plan’s net pension liability. The City’s net pension liability of each of its plans is measured as of June 30, 2017, and the total pension liability for each of its plans used to calculate the net pension liability was determined by an actuarial valuation as of June 30, 2016, rolled forward to June 30, 2017, using standard update procedures. The City’s proportions of the net pension liability for the CalPERS plans were actuarially determined as of the valuation date. The City’s proportionate share of the net pension liability for its Safety Plans was 0.41047% or $40,707,326, an increase of $3,803,063 from prior year’s $36,904,263. The net pension liability for the City’s Miscellaneous Plan is measured as the total pension liability less the fiduciary net position. The change in the net pension liability for the City’s Miscellaneous Plan is as follows:
Total Pension Liability
Plan Fiduciary
Net PositionNet Pension
Liability
Balance at June 30, 2016 81,343,056$ 57,915,051$ 23,428,005$
Change during the measurement period
Service cost 1,492,231 - 1,492,231
Interest on the total pension liability 5,941,256 - 5,941,256
Change in assumptions 4,761,777 - 4,761,777
Differences between expected and
actual experience (1,511,441) - (1,511,441)
Contributions from the employer - 2,088,137 (2,088,137)
Contributions from employees - 636,488 (636,488)
Net investment income - 6,488,084 (6,488,084)
Administrative expenses - (85,508) 85,508
Benefit payments, including refunds of
employee contributions (4,490,042) (4,490,042) -
Net changes during measurement period 6,193,781 4,637,159 1,556,622
Balance at June 30, 2017 87,536,837$ 62,552,210$ 24,984,627$
Increase (Decrease)
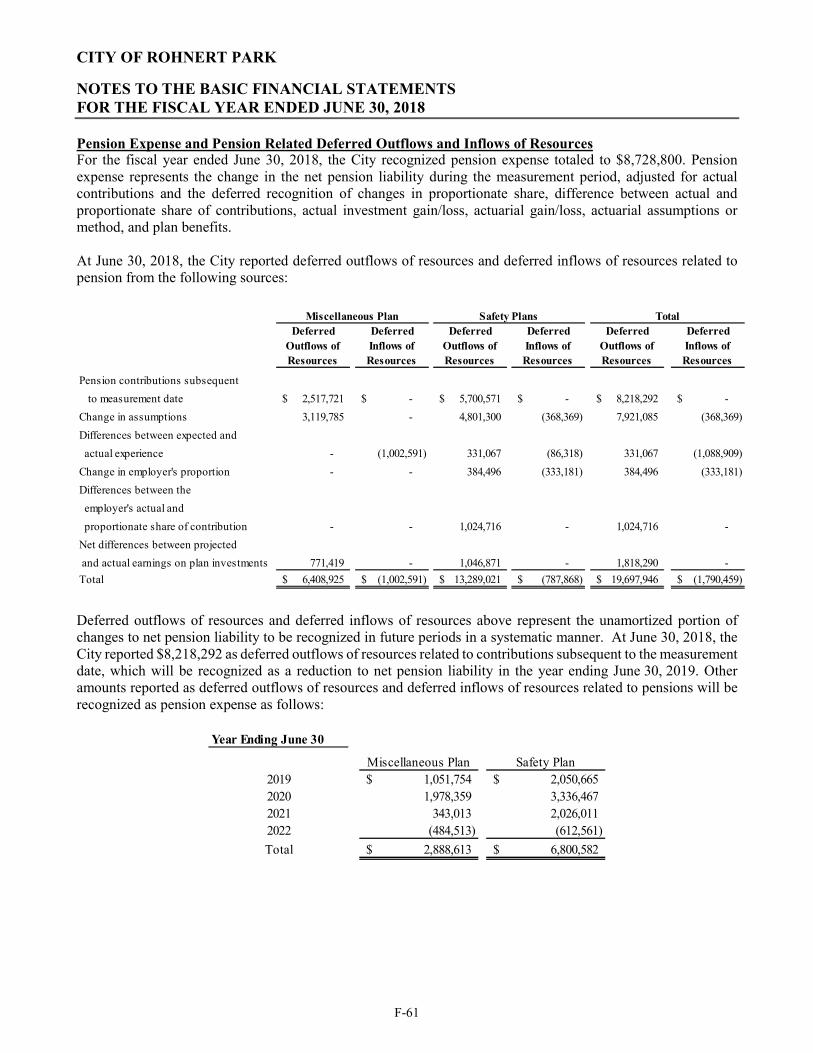
CITY OF ROHNERT PARK
NOTES TO THE BASIC FINANCIAL STATEMENTS FOR THE FISCAL YEAR ENDED JUNE 30, 2018
F-61
Pension Expense and Pension Related Deferred Outflows and Inflows of Resources For the fiscal year ended June 30, 2018, the City recognized pension expense totaled to $8,728,800. Pension expense represents the change in the net pension liability during the measurement period, adjusted for actual contributions and the deferred recognition of changes in proportionate share, difference between actual and proportionate share of contributions, actual investment gain/loss, actuarial gain/loss, actuarial assumptions or method, and plan benefits. At June 30, 2018, the City reported deferred outflows of resources and deferred inflows of resources related to pension from the following sources:
Deferred Outflows of Resources
Deferred Inflows of Resources
Deferred Outflows of Resources
Deferred Inflows of Resources
Deferred Outflows of Resources
Deferred Inflows of Resources
Pension contributions subsequent
to measurement date 2,517,721$ -$ 5,700,571$ -$ 8,218,292$ -$
Change in assumptions 3,119,785 - 4,801,300 (368,369) 7,921,085 (368,369)
Differences between expected and
actual experience - (1,002,591) 331,067 (86,318) 331,067 (1,088,909)
Change in employer's proportion - - 384,496 (333,181) 384,496 (333,181)
Differences between the
employer's actual and
proportionate share of contribution - - 1,024,716 - 1,024,716 -
Net differences between projected
and actual earnings on plan investments 771,419 - 1,046,871 - 1,818,290 -
Total 6,408,925$ (1,002,591)$ 13,289,021$ (787,868)$ 19,697,946$ (1,790,459)$
TotalMiscellaneous Plan Safety Plans
Deferred outflows of resources and deferred inflows of resources above represent the unamortized portion of changes to net pension liability to be recognized in future periods in a systematic manner. At June 30, 2018, the City reported $8,218,292 as deferred outflows of resources related to contributions subsequent to the measurement date, which will be recognized as a reduction to net pension liability in the year ending June 30, 2019. Other amounts reported as deferred outflows of resources and deferred inflows of resources related to pensions will be recognized as pension expense as follows:
Year Ending June 30
Miscellaneous Plan Safety Plan2019 1,051,754$ 2,050,665$ 2020 1,978,359 3,336,467 2021 343,013 2,026,011 2022 (484,513) (612,561)
Total 2,888,613$ 6,800,582$
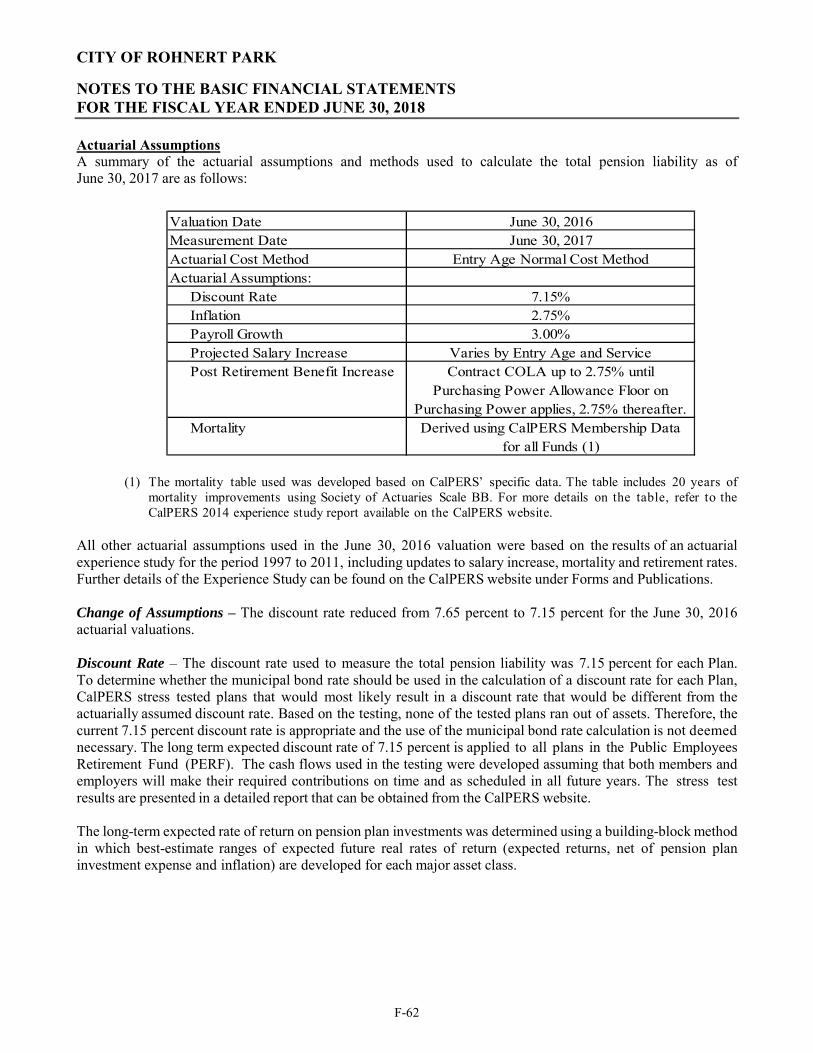
CITY OF ROHNERT PARK
NOTES TO THE BASIC FINANCIAL STATEMENTS FOR THE FISCAL YEAR ENDED JUNE 30, 2018
F-62
Actuarial Assumptions A summary of the actuarial assumptions and methods used to calculate the total pension liability as of June 30, 2017 are as follows:
Valuation Date June 30, 2016Measurement Date June 30, 2017Actuarial Cost Method Entry Age Normal Cost MethodActuarial Assumptions: Discount Rate 7.15% Inflation 2.75% Payroll Growth 3.00% Projected Salary Increase Varies by Entry Age and Service Post Retirement Benefit Increase Contract COLA up to 2.75% until
Purchasing Power Allowance Floor on Purchasing Power applies, 2.75% thereafter.
Mortality Derived using CalPERS Membership Datafor all Funds (1)
(1) The mortality table used was developed based on CalPERS’ specific data. The table includes 20 years of
mortality improvements using Society of Actuaries Scale BB. For more details on the table, refer to the CalPERS 2014 experience study report available on the CalPERS website.
All other actuarial assumptions used in the June 30, 2016 valuation were based on the results of an actuarial experience study for the period 1997 to 2011, including updates to salary increase, mortality and retirement rates. Further details of the Experience Study can be found on the CalPERS website under Forms and Publications. Change of Assumptions – The discount rate reduced from 7.65 percent to 7.15 percent for the June 30, 2016 actuarial valuations. Discount Rate – The discount rate used to measure the total pension liability was 7.15 percent for each Plan. To determine whether the municipal bond rate should be used in the calculation of a discount rate for each Plan, CalPERS stress tested plans that would most likely result in a discount rate that would be different from the actuarially assumed discount rate. Based on the testing, none of the tested plans ran out of assets. Therefore, the current 7.15 percent discount rate is appropriate and the use of the municipal bond rate calculation is not deemed necessary. The long term expected discount rate of 7.15 percent is applied to all plans in the Public Employees Retirement Fund (PERF). The cash flows used in the testing were developed assuming that both members and employers will make their required contributions on time and as scheduled in all future years. The stress test results are presented in a detailed report that can be obtained from the CalPERS website. The long-term expected rate of return on pension plan investments was determined using a building-block method in which best-estimate ranges of expected future real rates of return (expected returns, net of pension plan investment expense and inflation) are developed for each major asset class.
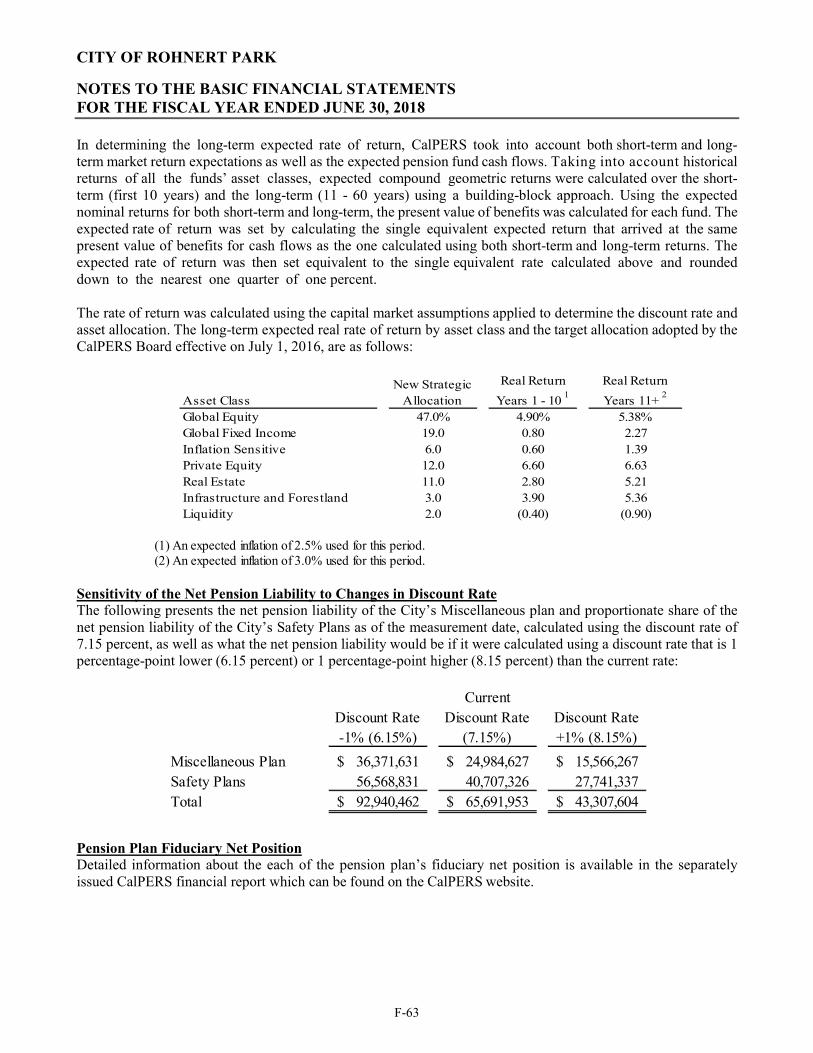
CITY OF ROHNERT PARK
NOTES TO THE BASIC FINANCIAL STATEMENTS FOR THE FISCAL YEAR ENDED JUNE 30, 2018
F-63
In determining the long-term expected rate of return, CalPERS took into account both short-term and long-term market return expectations as well as the expected pension fund cash flows. Taking into account historical returns of all the funds’ asset classes, expected compound geometric returns were calculated over the short-term (first 10 years) and the long-term (11 - 60 years) using a building-block approach. Using the expected nominal returns for both short-term and long-term, the present value of benefits was calculated for each fund. The expected rate of return was set by calculating the single equivalent expected return that arrived at the same present value of benefits for cash flows as the one calculated using both short-term and long-term returns. The expected rate of return was then set equivalent to the single equivalent rate calculated above and rounded down to the nearest one quarter of one percent. The rate of return was calculated using the capital market assumptions applied to determine the discount rate and asset allocation. The long-term expected real rate of return by asset class and the target allocation adopted by the CalPERS Board effective on July 1, 2016, are as follows:
Asset ClassNew Strategic
Allocation
Real Return
Years 1 - 10 1
Real Return
Years 11+ 2
Global Equity 47.0% 4.90% 5.38%Global Fixed Income 19.0 0.80 2.27Inflation Sensitive 6.0 0.60 1.39Private Equity 12.0 6.60 6.63Real Estate 11.0 2.80 5.21Infrastructure and Forestland 3.0 3.90 5.36Liquidity 2.0 (0.40) (0.90)
(1) An expected inflation of 2.5% used for this period. (2) An expected inflation of 3.0% used for this period.
Sensitivity of the Net Pension Liability to Changes in Discount Rate The following presents the net pension liability of the City’s Miscellaneous plan and proportionate share of the net pension liability of the City’s Safety Plans as of the measurement date, calculated using the discount rate of 7.15 percent, as well as what the net pension liability would be if it were calculated using a discount rate that is 1 percentage-point lower (6.15 percent) or 1 percentage-point higher (8.15 percent) than the current rate:
Discount Rate -1% (6.15%)
Current Discount Rate
(7.15%)Discount Rate +1% (8.15%)
Miscellaneous Plan 36,371,631$ 24,984,627$ 15,566,267$ Safety Plans 56,568,831 40,707,326 27,741,337 Total 92,940,462$ 65,691,953$ 43,307,604$
Pension Plan Fiduciary Net Position Detailed information about the each of the pension plan’s fiduciary net position is available in the separately issued CalPERS financial report which can be found on the CalPERS website.
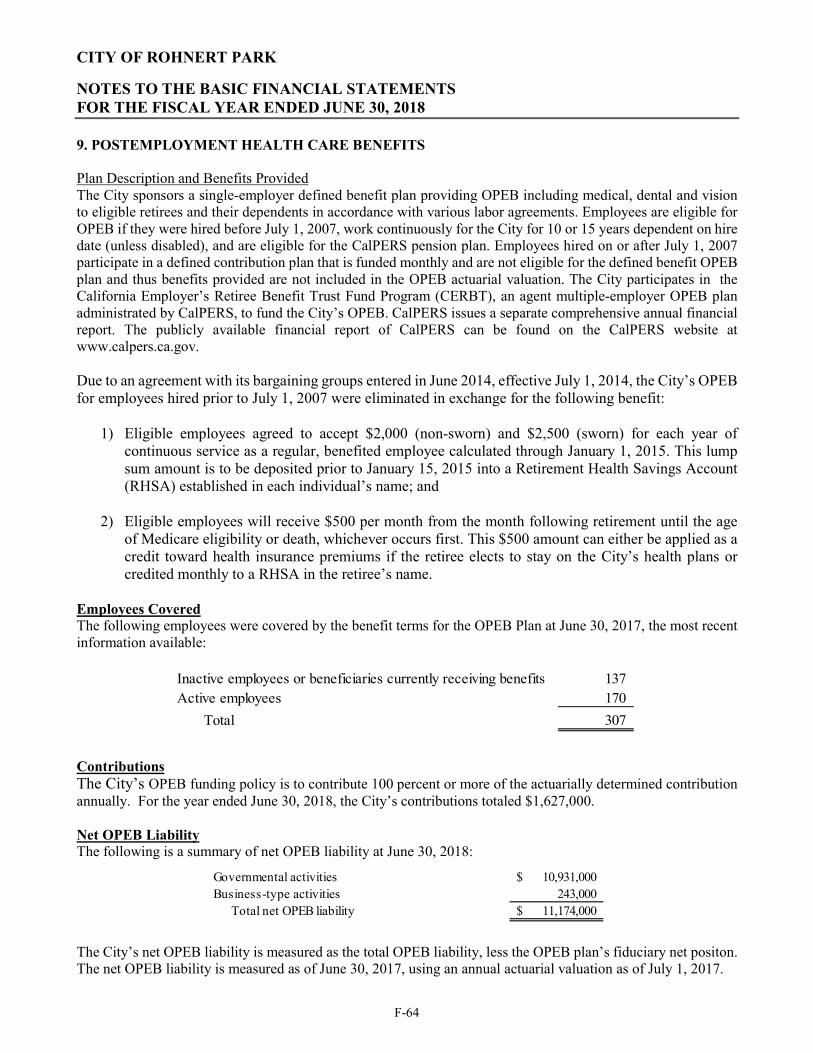
CITY OF ROHNERT PARK
NOTES TO THE BASIC FINANCIAL STATEMENTS FOR THE FISCAL YEAR ENDED JUNE 30, 2018
F-64
9. POSTEMPLOYMENT HEALTH CARE BENEFITS Plan Description and Benefits Provided The City sponsors a single-employer defined benefit plan providing OPEB including medical, dental and vision to eligible retirees and their dependents in accordance with various labor agreements. Employees are eligible for OPEB if they were hired before July 1, 2007, work continuously for the City for 10 or 15 years dependent on hire date (unless disabled), and are eligible for the CalPERS pension plan. Employees hired on or after July 1, 2007 participate in a defined contribution plan that is funded monthly and are not eligible for the defined benefit OPEB plan and thus benefits provided are not included in the OPEB actuarial valuation. The City participates in the California Employer’s Retiree Benefit Trust Fund Program (CERBT), an agent multiple-employer OPEB plan administrated by CalPERS, to fund the City’s OPEB. CalPERS issues a separate comprehensive annual financial report. The publicly available financial report of CalPERS can be found on the CalPERS website at www.calpers.ca.gov. Due to an agreement with its bargaining groups entered in June 2014, effective July 1, 2014, the City’s OPEB for employees hired prior to July 1, 2007 were eliminated in exchange for the following benefit:
1) Eligible employees agreed to accept $2,000 (non-sworn) and $2,500 (sworn) for each year of continuous service as a regular, benefited employee calculated through January 1, 2015. This lump sum amount is to be deposited prior to January 15, 2015 into a Retirement Health Savings Account (RHSA) established in each individual’s name; and
2) Eligible employees will receive $500 per month from the month following retirement until the age of Medicare eligibility or death, whichever occurs first. This $500 amount can either be applied as a credit toward health insurance premiums if the retiree elects to stay on the City’s health plans or credited monthly to a RHSA in the retiree’s name.
Employees Covered The following employees were covered by the benefit terms for the OPEB Plan at June 30, 2017, the most recent information available:
Inactive employees or beneficiaries currently receiving benefits 137 Active employees 170
Total 307
Contributions The City’s OPEB funding policy is to contribute 100 percent or more of the actuarially determined contribution annually. For the year ended June 30, 2018, the City’s contributions totaled $1,627,000. Net OPEB Liability The following is a summary of net OPEB liability at June 30, 2018:
Governmental activities 10,931,000$ Business-type activities 243,000
Total net OPEB liability 11,174,000$
The City’s net OPEB liability is measured as the total OPEB liability, less the OPEB plan’s fiduciary net positon. The net OPEB liability is measured as of June 30, 2017, using an annual actuarial valuation as of July 1, 2017.
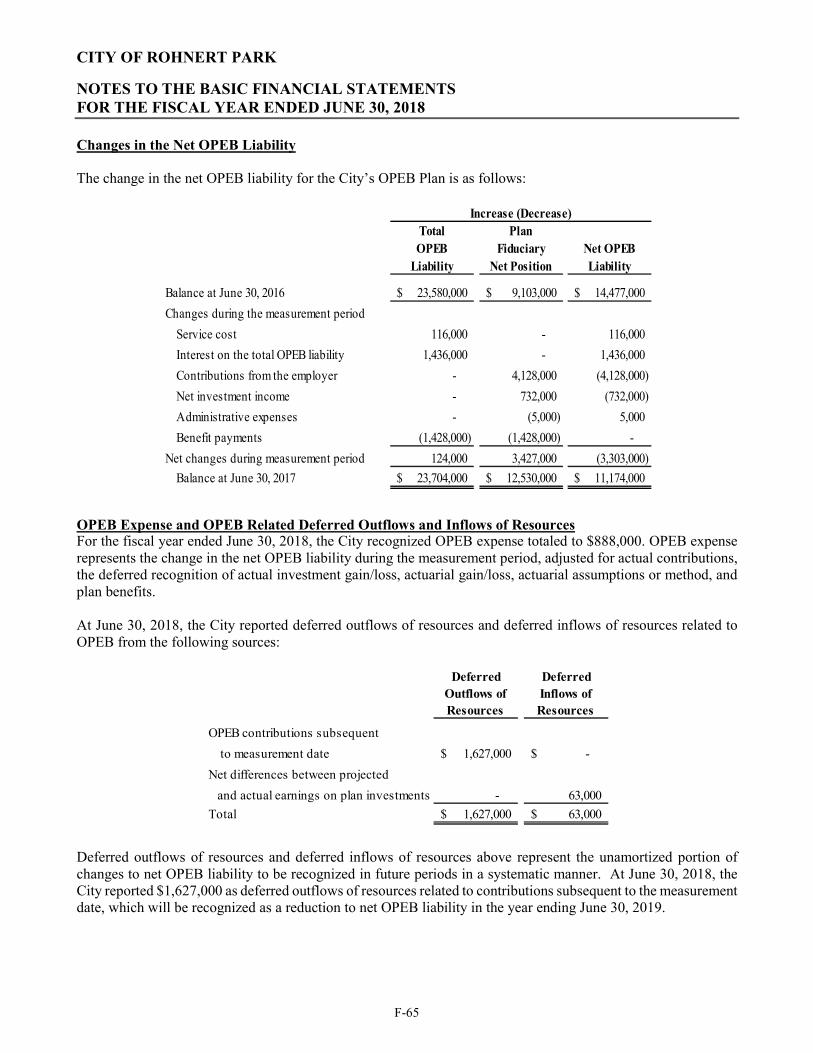
CITY OF ROHNERT PARK
NOTES TO THE BASIC FINANCIAL STATEMENTS FOR THE FISCAL YEAR ENDED JUNE 30, 2018
F-65
Changes in the Net OPEB Liability The change in the net OPEB liability for the City’s OPEB Plan is as follows:
Total OPEB
Liability
Plan Fiduciary
Net PositionNet OPEBLiability
Balance at June 30, 2016 23,580,000$ 9,103,000$ 14,477,000$
Changes during the measurement period
Service cost 116,000 - 116,000
Interest on the total OPEB liability 1,436,000 - 1,436,000
Contributions from the employer - 4,128,000 (4,128,000)
Net investment income - 732,000 (732,000)
Administrative expenses - (5,000) 5,000
Benefit payments (1,428,000) (1,428,000) -
Net changes during measurement period 124,000 3,427,000 (3,303,000)
Balance at June 30, 2017 23,704,000$ 12,530,000$ 11,174,000$
Increase (Decrease)
OPEB Expense and OPEB Related Deferred Outflows and Inflows of Resources For the fiscal year ended June 30, 2018, the City recognized OPEB expense totaled to $888,000. OPEB expense represents the change in the net OPEB liability during the measurement period, adjusted for actual contributions, the deferred recognition of actual investment gain/loss, actuarial gain/loss, actuarial assumptions or method, and plan benefits. At June 30, 2018, the City reported deferred outflows of resources and deferred inflows of resources related to OPEB from the following sources:
Deferred Outflows of Resources
Deferred Inflows of Resources
OPEB contributions subsequent
to measurement date 1,627,000$ -$
Net differences between projected
and actual earnings on plan investments - 63,000
Total 1,627,000$ 63,000$
Deferred outflows of resources and deferred inflows of resources above represent the unamortized portion of changes to net OPEB liability to be recognized in future periods in a systematic manner. At June 30, 2018, the City reported $1,627,000 as deferred outflows of resources related to contributions subsequent to the measurement date, which will be recognized as a reduction to net OPEB liability in the year ending June 30, 2019.
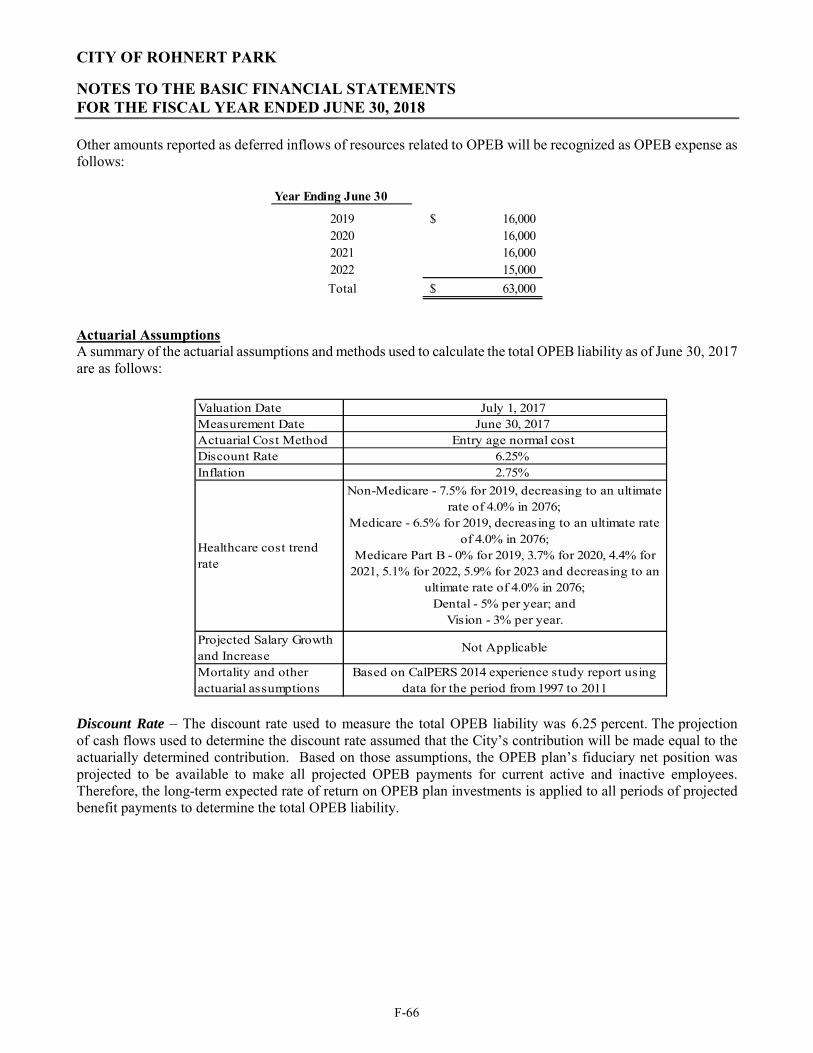
CITY OF ROHNERT PARK
NOTES TO THE BASIC FINANCIAL STATEMENTS FOR THE FISCAL YEAR ENDED JUNE 30, 2018
F-66
Other amounts reported as deferred inflows of resources related to OPEB will be recognized as OPEB expense as follows:
Year Ending June 30
2019 16,000$ 2020 16,000 2021 16,000 2022 15,000
Total 63,000$
Actuarial Assumptions A summary of the actuarial assumptions and methods used to calculate the total OPEB liability as of June 30, 2017 are as follows:
Valuation Date July 1, 2017Measurement Date June 30, 2017Actuarial Cost Method Entry age normal costDiscount Rate 6.25%Inflation 2.75%
Healthcare cost trend rate
Projected Salary Growth and IncreaseMortality and other actuarial assumptions
Non-Medicare - 7.5% for 2019, decreasing to an ultimate rate of 4.0% in 2076;
Medicare - 6.5% for 2019, decreasing to an ultimate rate of 4.0% in 2076;
Medicare Part B - 0% for 2019, 3.7% for 2020, 4.4% for 2021, 5.1% for 2022, 5.9% for 2023 and decreasing to an
ultimate rate of 4.0% in 2076; Dental - 5% per year; and
Vision - 3% per year.
Based on CalPERS 2014 experience study report using data for the period from 1997 to 2011
Not Applicable
Discount Rate – The discount rate used to measure the total OPEB liability was 6.25 percent. The projection of cash flows used to determine the discount rate assumed that the City’s contribution will be made equal to the actuarially determined contribution. Based on those assumptions, the OPEB plan’s fiduciary net position was projected to be available to make all projected OPEB payments for current active and inactive employees. Therefore, the long-term expected rate of return on OPEB plan investments is applied to all periods of projected benefit payments to determine the total OPEB liability.
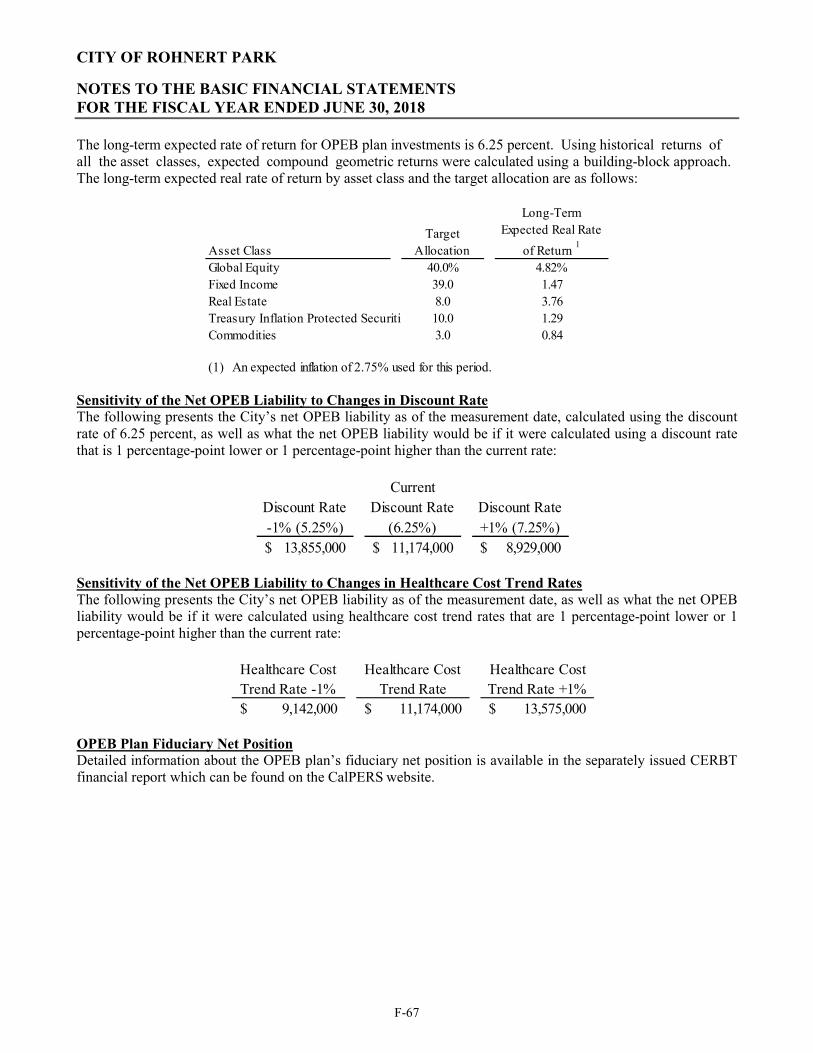
CITY OF ROHNERT PARK
NOTES TO THE BASIC FINANCIAL STATEMENTS FOR THE FISCAL YEAR ENDED JUNE 30, 2018
F-67
The long-term expected rate of return for OPEB plan investments is 6.25 percent. Using historical returns of all the asset classes, expected compound geometric returns were calculated using a building-block approach. The long-term expected real rate of return by asset class and the target allocation are as follows:
Asset ClassTarget
Allocation
Long-Term Expected Real Rate
of Return 1
Global Equity 40.0% 4.82%Fixed Income 39.0 1.47Real Estate 8.0 3.76Treasury Inflation Protected Securitie 10.0 1.29Commodities 3.0 0.84
(1) An expected inflation of 2.75% used for this period.
Sensitivity of the Net OPEB Liability to Changes in Discount Rate The following presents the City’s net OPEB liability as of the measurement date, calculated using the discount rate of 6.25 percent, as well as what the net OPEB liability would be if it were calculated using a discount rate that is 1 percentage-point lower or 1 percentage-point higher than the current rate:
Discount Rate -1% (5.25%)
Current Discount Rate
(6.25%)Discount Rate +1% (7.25%)
13,855,000$ 11,174,000$ 8,929,000$ Sensitivity of the Net OPEB Liability to Changes in Healthcare Cost Trend Rates The following presents the City’s net OPEB liability as of the measurement date, as well as what the net OPEB liability would be if it were calculated using healthcare cost trend rates that are 1 percentage-point lower or 1 percentage-point higher than the current rate:
Healthcare Cost Trend Rate -1%
Healthcare Cost Trend Rate
Healthcare Cost Trend Rate +1%
9,142,000$ 11,174,000$ 13,575,000$ OPEB Plan Fiduciary Net Position Detailed information about the OPEB plan’s fiduciary net position is available in the separately issued CERBT financial report which can be found on the CalPERS website.
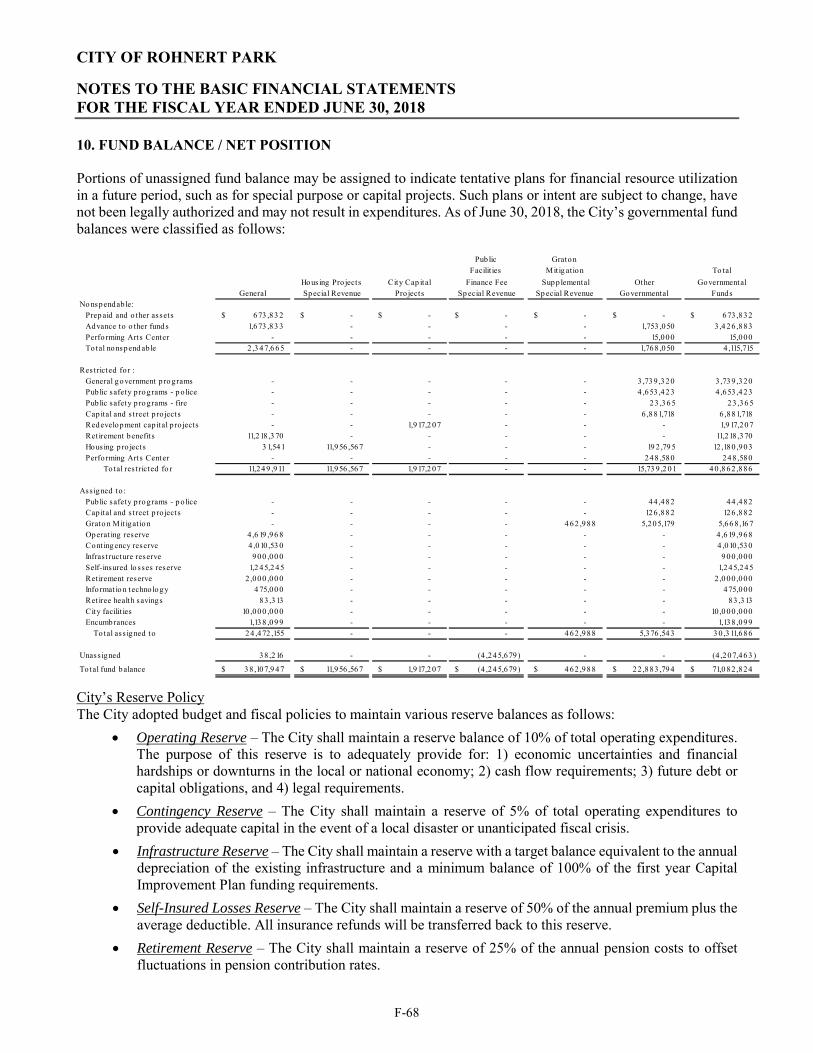
CITY OF ROHNERT PARK
NOTES TO THE BASIC FINANCIAL STATEMENTS FOR THE FISCAL YEAR ENDED JUNE 30, 2018
F-68
10. FUND BALANCE / NET POSITION Portions of unassigned fund balance may be assigned to indicate tentative plans for financial resource utilization in a future period, such as for special purpose or capital projects. Such plans or intent are subject to change, have not been legally authorized and may not result in expenditures. As of June 30, 2018, the City’s governmental fund balances were classified as follows:
Pub lic Graton Facilit ies Mit ig ation To tal
Hous ing Pro jects City Cap ital Finance Fee Supp lemental Other GovernmentalGeneral Special Revenue Pro jects Sp ecial Revenue Sp ecial Revenue Governmental Funds
No nspendab le:Prep aid and o ther assets 673 ,83 2$ -$ -$ -$ -$ -$ 673 ,832$ Advance to o ther fund s 1,673 ,83 3 - - - - 1,753 ,050 3 ,4 26 ,883 Perfo rming Arts Center - - - - - 15,000 15,000 To tal nonspend ab le 2 ,3 47,6 65 - - - - 1,768 ,050 4 ,115,715
Res tricted fo r :General government p rograms - - - - - 3 ,739 ,320 3 ,739 ,320 Pub lic safety p rograms - p o lice - - - - - 4 ,653 ,423 4 ,653 ,423 Pub lic safety p rograms - fire - - - - - 23 ,36 5 23 ,36 5 Cap ital and s t reet p ro jects - - - - - 6 ,881,718 6 ,881,718 Redevelopment cap ital p ro jects - - 1,917,2 07 - - - 1,9 17,207 Ret irement benefits 11,218 ,3 70 - - - - - 11,218 ,370 Hous ing p ro jects 3 1,541 11,956 ,567 - - - 19 2 ,79 5 12 ,180 ,903 Perfo rming Arts Center - - - - - 248 ,580 248 ,580
To tal res t ricted fo r 11,249 ,911 11,956 ,567 1,917,2 07 - - 15,73 9 ,2 01 4 0 ,8 62 ,886
Ass igned to : Pub lic safety p rograms - p o lice - - - - - 44 ,482 44 ,482 Cap ital and s t reet p ro jects - - - - - 126 ,882 126 ,882 Grato n Mit igat ion - - - - 4 62 ,988 5,205,179 5,66 8 ,167 Operat ing reserve 4 ,6 19 ,96 8 - - - - - 4 ,619 ,968 Cont ing ency reserve 4 ,010 ,53 0 - - - - - 4 ,010 ,530 Infras t ructure reserve 900 ,00 0 - - - - - 9 00 ,000 Self-insured lo sses reserve 1,2 45,2 45 - - - - - 1,245,245 Ret irement reserve 2 ,000 ,00 0 - - - - - 2 ,0 00 ,000 Info rmat io n techno logy 4 75,00 0 - - - - - 475,000 Ret iree health savings 83 ,313 - - - - - 83 ,313 City facilit ies 10 ,000 ,00 0 - - - - - 10 ,0 00 ,000 Encumbrances 1,138 ,09 9 - - - - - 1,138 ,099 To tal ass ig ned to 24 ,472 ,155 - - - 4 62 ,988 5,376 ,543 3 0 ,3 11,686
Unass igned 38 ,216 - - (4 ,245,679) - - (4 ,207,463 )
To tal fund balance 38 ,107,9 47$ 11,956 ,567$ 1,917,2 07$ (4 ,245,679)$ 4 62 ,988$ 22 ,883 ,794$ 71,0 82 ,824$
City’s Reserve Policy The City adopted budget and fiscal policies to maintain various reserve balances as follows:
Operating Reserve – The City shall maintain a reserve balance of 10% of total operating expenditures. The purpose of this reserve is to adequately provide for: 1) economic uncertainties and financial hardships or downturns in the local or national economy; 2) cash flow requirements; 3) future debt or capital obligations, and 4) legal requirements.
Contingency Reserve – The City shall maintain a reserve of 5% of total operating expenditures to provide adequate capital in the event of a local disaster or unanticipated fiscal crisis.
Infrastructure Reserve – The City shall maintain a reserve with a target balance equivalent to the annual depreciation of the existing infrastructure and a minimum balance of 100% of the first year Capital Improvement Plan funding requirements.
Self-Insured Losses Reserve – The City shall maintain a reserve of 50% of the annual premium plus the average deductible. All insurance refunds will be transferred back to this reserve.
Retirement Reserve – The City shall maintain a reserve of 25% of the annual pension costs to offset fluctuations in pension contribution rates.
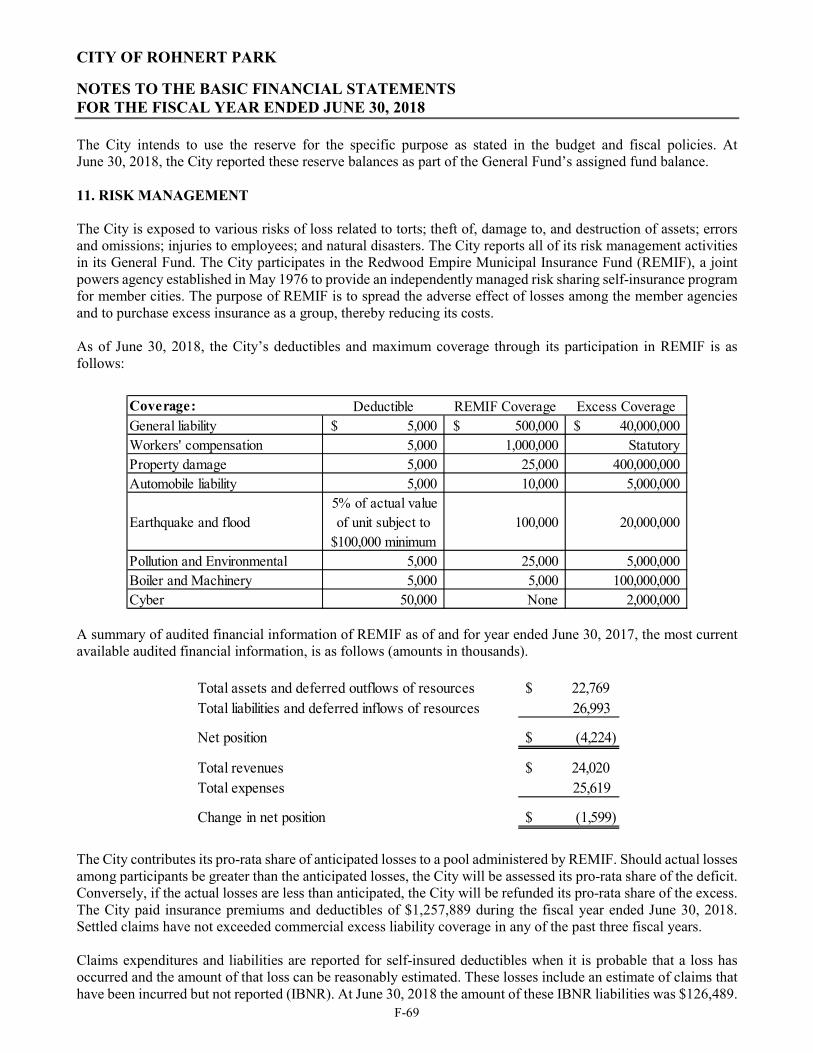
CITY OF ROHNERT PARK
NOTES TO THE BASIC FINANCIAL STATEMENTS FOR THE FISCAL YEAR ENDED JUNE 30, 2018
F-69
The City intends to use the reserve for the specific purpose as stated in the budget and fiscal policies. At June 30, 2018, the City reported these reserve balances as part of the General Fund’s assigned fund balance. 11. RISK MANAGEMENT The City is exposed to various risks of loss related to torts; theft of, damage to, and destruction of assets; errors and omissions; injuries to employees; and natural disasters. The City reports all of its risk management activities in its General Fund. The City participates in the Redwood Empire Municipal Insurance Fund (REMIF), a joint powers agency established in May 1976 to provide an independently managed risk sharing self-insurance program for member cities. The purpose of REMIF is to spread the adverse effect of losses among the member agencies and to purchase excess insurance as a group, thereby reducing its costs. As of June 30, 2018, the City’s deductibles and maximum coverage through its participation in REMIF is as follows:
Coverage: Deductible REMIF Coverage Excess CoverageGeneral liability 5,000$ 500,000$ 40,000,000$ Workers' compensation 5,000 1,000,000 StatutoryProperty damage 5,000 25,000 400,000,000 Automobile liability 5,000 10,000 5,000,000
Earthquake and flood 5% of actual value
of unit subject to $100,000 minimum
100,000 20,000,000
Pollution and Environmental 5,000 25,000 5,000,000 Boiler and Machinery 5,000 5,000 100,000,000 Cyber 50,000 None 2,000,000
A summary of audited financial information of REMIF as of and for year ended June 30, 2017, the most current available audited financial information, is as follows (amounts in thousands).
Total assets and deferred outflows of resources $ 22,769 Total liabilities and deferred inflows of resources 26,993
Net position $ (4,224)
Total revenues $ 24,020 Total expenses 25,619
Change in net position $ (1,599)
The City contributes its pro-rata share of anticipated losses to a pool administered by REMIF. Should actual losses among participants be greater than the anticipated losses, the City will be assessed its pro-rata share of the deficit. Conversely, if the actual losses are less than anticipated, the City will be refunded its pro-rata share of the excess. The City paid insurance premiums and deductibles of $1,257,889 during the fiscal year ended June 30, 2018. Settled claims have not exceeded commercial excess liability coverage in any of the past three fiscal years. Claims expenditures and liabilities are reported for self-insured deductibles when it is probable that a loss has occurred and the amount of that loss can be reasonably estimated. These losses include an estimate of claims that have been incurred but not reported (IBNR). At June 30, 2018 the amount of these IBNR liabilities was $126,489.
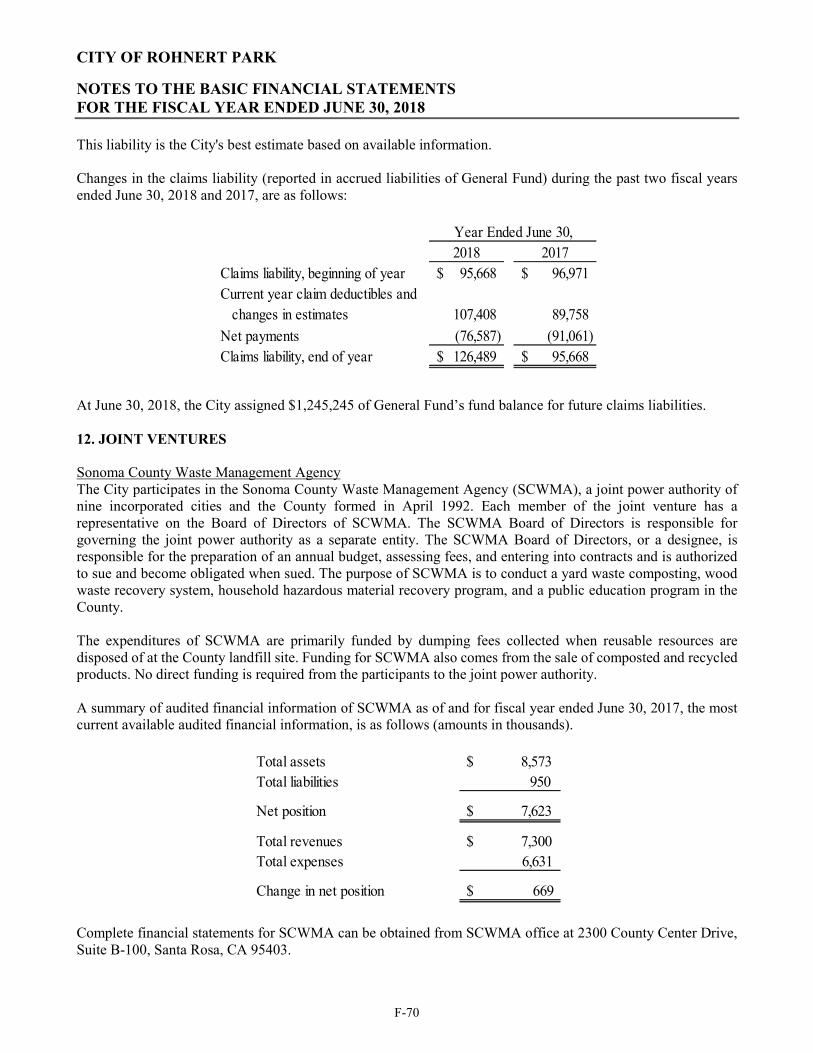
CITY OF ROHNERT PARK
NOTES TO THE BASIC FINANCIAL STATEMENTS FOR THE FISCAL YEAR ENDED JUNE 30, 2018
F-70
This liability is the City's best estimate based on available information. Changes in the claims liability (reported in accrued liabilities of General Fund) during the past two fiscal years ended June 30, 2018 and 2017, are as follows:
2018 2017Claims liability, beginning of year 95,668$ 96,971$ Current year claim deductibles and changes in estimates 107,408 89,758
Net payments (76,587) (91,061) Claims liability, end of year 126,489$ 95,668$
Year Ended June 30,
At June 30, 2018, the City assigned $1,245,245 of General Fund’s fund balance for future claims liabilities. 12. JOINT VENTURES Sonoma County Waste Management Agency The City participates in the Sonoma County Waste Management Agency (SCWMA), a joint power authority of nine incorporated cities and the County formed in April 1992. Each member of the joint venture has a representative on the Board of Directors of SCWMA. The SCWMA Board of Directors is responsible for governing the joint power authority as a separate entity. The SCWMA Board of Directors, or a designee, is responsible for the preparation of an annual budget, assessing fees, and entering into contracts and is authorized to sue and become obligated when sued. The purpose of SCWMA is to conduct a yard waste composting, wood waste recovery system, household hazardous material recovery program, and a public education program in the County. The expenditures of SCWMA are primarily funded by dumping fees collected when reusable resources are disposed of at the County landfill site. Funding for SCWMA also comes from the sale of composted and recycled products. No direct funding is required from the participants to the joint power authority. A summary of audited financial information of SCWMA as of and for fiscal year ended June 30, 2017, the most current available audited financial information, is as follows (amounts in thousands).
Total assets $ 8,573 Total liabilities 950
Net position $ 7,623
Total revenues $ 7,300 Total expenses 6,631
Change in net position $ 669
Complete financial statements for SCWMA can be obtained from SCWMA office at 2300 County Center Drive, Suite B-100, Santa Rosa, CA 95403.
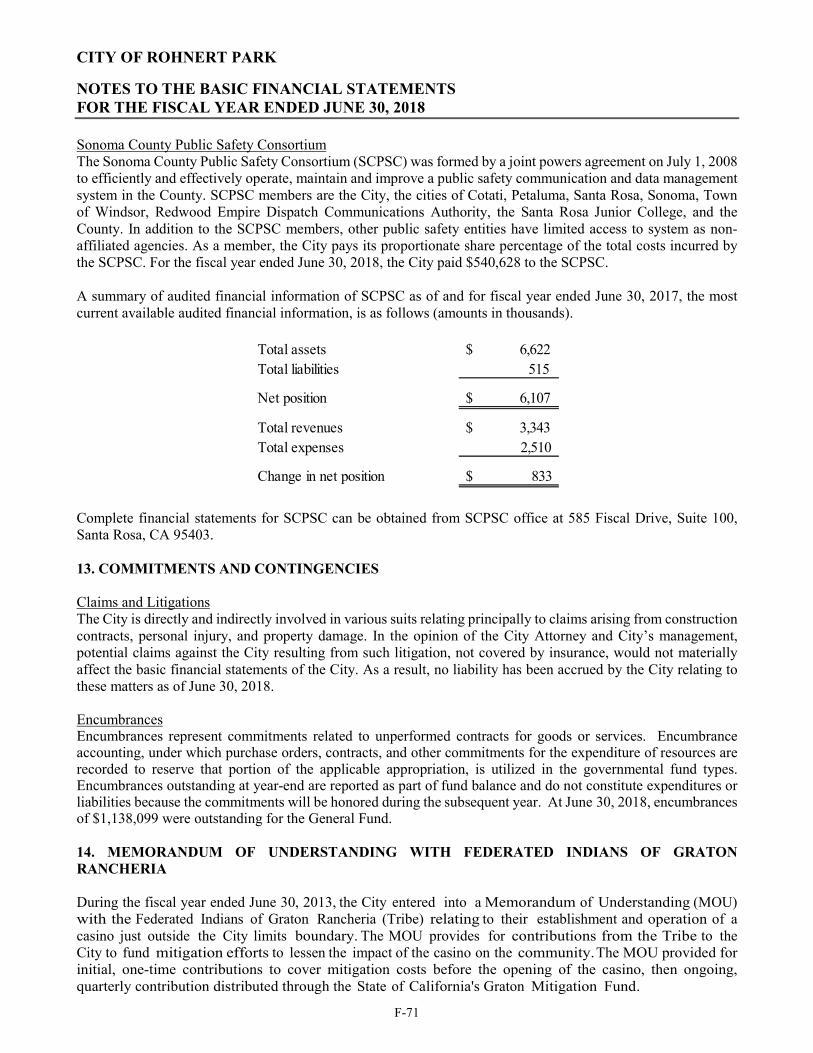
CITY OF ROHNERT PARK
NOTES TO THE BASIC FINANCIAL STATEMENTS FOR THE FISCAL YEAR ENDED JUNE 30, 2018
F-71
Sonoma County Public Safety Consortium The Sonoma County Public Safety Consortium (SCPSC) was formed by a joint powers agreement on July 1, 2008 to efficiently and effectively operate, maintain and improve a public safety communication and data management system in the County. SCPSC members are the City, the cities of Cotati, Petaluma, Santa Rosa, Sonoma, Town of Windsor, Redwood Empire Dispatch Communications Authority, the Santa Rosa Junior College, and the County. In addition to the SCPSC members, other public safety entities have limited access to system as non-affiliated agencies. As a member, the City pays its proportionate share percentage of the total costs incurred by the SCPSC. For the fiscal year ended June 30, 2018, the City paid $540,628 to the SCPSC.
A summary of audited financial information of SCPSC as of and for fiscal year ended June 30, 2017, the most current available audited financial information, is as follows (amounts in thousands).
Total assets $ 6,622 Total liabilities 515
Net position $ 6,107
Total revenues $ 3,343 Total expenses 2,510
Change in net position $ 833
Complete financial statements for SCPSC can be obtained from SCPSC office at 585 Fiscal Drive, Suite 100, Santa Rosa, CA 95403. 13. COMMITMENTS AND CONTINGENCIES Claims and Litigations The City is directly and indirectly involved in various suits relating principally to claims arising from construction contracts, personal injury, and property damage. In the opinion of the City Attorney and City’s management, potential claims against the City resulting from such litigation, not covered by insurance, would not materially affect the basic financial statements of the City. As a result, no liability has been accrued by the City relating to these matters as of June 30, 2018. Encumbrances Encumbrances represent commitments related to unperformed contracts for goods or services. Encumbrance accounting, under which purchase orders, contracts, and other commitments for the expenditure of resources are recorded to reserve that portion of the applicable appropriation, is utilized in the governmental fund types. Encumbrances outstanding at year-end are reported as part of fund balance and do not constitute expenditures or liabilities because the commitments will be honored during the subsequent year. At June 30, 2018, encumbrances of $1,138,099 were outstanding for the General Fund. 14. MEMORANDUM OF UNDERSTANDING WITH FEDERATED INDIANS OF GRATON RANCHERIA During the fiscal year ended June 30, 2013, the City entered into a Memorandum of Understanding (MOU) with the Federated Indians of Graton Rancheria (Tribe) relating to their establishment and operation of a casino just outside the City limits boundary. The MOU provides for contributions from the Tribe to the City to fund mitigation efforts to lessen the impact of the casino on the community. The MOU provided for initial, one-time contributions to cover mitigation costs before the opening of the casino, then ongoing, quarterly contribution distributed through the State of California's Graton Mitigation Fund.
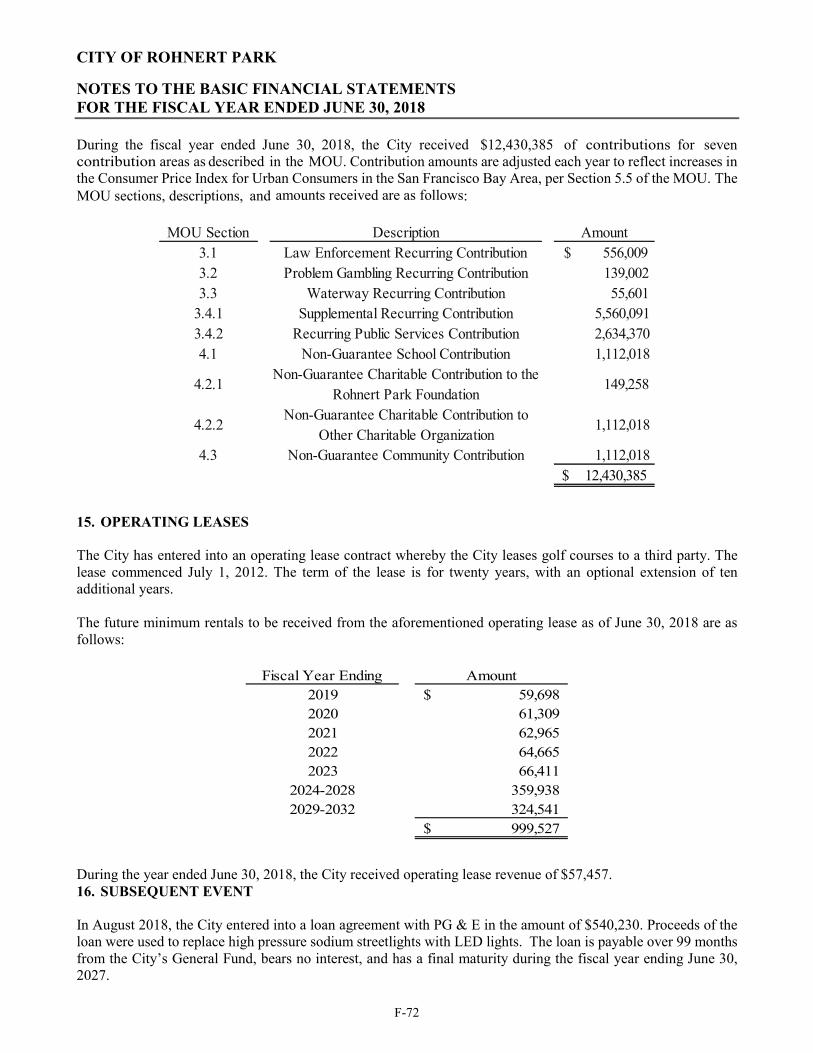
CITY OF ROHNERT PARK
NOTES TO THE BASIC FINANCIAL STATEMENTS FOR THE FISCAL YEAR ENDED JUNE 30, 2018
F-72
During the fiscal year ended June 30, 2018, the City received $12,430,385 of contributions for seven contribution areas as described in the MOU. Contribution amounts are adjusted each year to reflect increases in the Consumer Price Index for Urban Consumers in the San Francisco Bay Area, per Section 5.5 of the MOU. The MOU sections, descriptions, and amounts received are as follows:
MOU Section Description Amount3.1 Law Enforcement Recurring Contribution $ 556,009 3.2 Problem Gambling Recurring Contribution 139,002 3.3 Waterway Recurring Contribution 55,601
3.4.1 Supplemental Recurring Contribution 5,560,091 3.4.2 Recurring Public Services Contribution 2,634,370 4.1 Non-Guarantee School Contribution 1,112,018
4.2.1Non-Guarantee Charitable Contribution to the
Rohnert Park Foundation 149,258
4.2.2Non-Guarantee Charitable Contribution to
Other Charitable Organization 1,112,018
4.3 Non-Guarantee Community Contribution 1,112,018 12,430,385$
15. OPERATING LEASES The City has entered into an operating lease contract whereby the City leases golf courses to a third party. The lease commenced July 1, 2012. The term of the lease is for twenty years, with an optional extension of ten additional years. The future minimum rentals to be received from the aforementioned operating lease as of June 30, 2018 are as follows:
Fiscal Year Ending Amount2019 59,698$ 2020 61,309 2021 62,965 2022 64,665 2023 66,411
2024-2028 359,938 2029-2032 324,541
999,527$
During the year ended June 30, 2018, the City received operating lease revenue of $57,457. 16. SUBSEQUENT EVENT In August 2018, the City entered into a loan agreement with PG & E in the amount of $540,230. Proceeds of the loan were used to replace high pressure sodium streetlights with LED lights. The loan is payable over 99 months from the City’s General Fund, bears no interest, and has a final maturity during the fiscal year ending June 30, 2027.
F-73
REQUIRED SUPPLEMENTARY INFORMATION
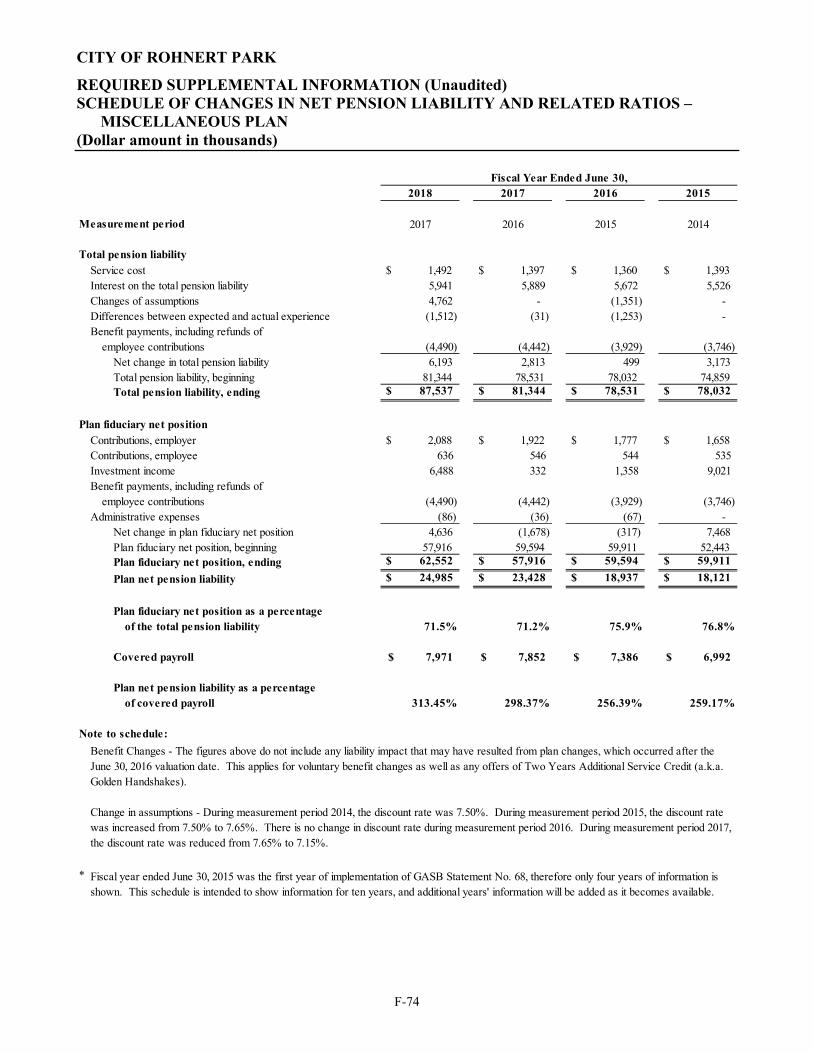
CITY OF ROHNERT PARK
REQUIRED SUPPLEMENTAL INFORMATION (Unaudited) SCHEDULE OF CHANGES IN NET PENSION LIABILITY AND RELATED RATIOS –
MISCELLANEOUS PLAN (Dollar amount in thousands)
F-74
2018 2017 2016 2015
Measurement period 2017 2016 2015 2014
Total pension liabilityService cost $ 1,492 $ 1,397 $ 1,360 $ 1,393 Interest on the total pension liability 5,941 5,889 5,672 5,526 Changes of assumptions 4,762 - (1,351) - Differences between expected and actual experience (1,512) (31) (1,253) - Benefit payments, including refunds of
employee contributions (4,490) (4,442) (3,929) (3,746)Net change in total pension liability 6,193 2,813 499 3,173 Total pension liability, beginning 81,344 78,531 78,032 74,859 Total pension liability, ending $ 87,537 $ 81,344 $ 78,531 $ 78,032
Plan fiduciary net positionContributions, employer $ 2,088 $ 1,922 $ 1,777 $ 1,658 Contributions, employee 636 546 544 535 Investment income 6,488 332 1,358 9,021 Benefit payments, including refunds of
employee contributions (4,490) (4,442) (3,929) (3,746)Administrative expenses (86) (36) (67) -
Net change in plan fiduciary net position 4,636 (1,678) (317) 7,468 Plan fiduciary net position, beginning 57,916 59,594 59,911 52,443 Plan fiduciary net position, ending $ 62,552 $ 57,916 $ 59,594 $ 59,911
Plan net pension liability $ 24,985 $ 23,428 $ 18,937 $ 18,121
Plan fiduciary net position as a percentageof the total pension liability 71.5% 71.2% 75.9% 76.8%
Covered payroll 7,971$ 7,852$ 7,386$ 6,992$
Plan net pension liability as a percentageof covered payroll 313.45% 298.37% 256.39% 259.17%
Note to schedule:
* Fiscal year ended June 30, 2015 was the first year of implementation of GASB Statement No. 68, therefore only four years of information is shown. This schedule is intended to show information for ten years, and additional years' information will be added as it becomes available.
Benefit Changes - The figures above do not include any liability impact that may have resulted from plan changes, which occurred after the June 30, 2016 valuation date. This applies for voluntary benefit changes as well as any offers of Two Years Additional Service Credit (a.k.a. Golden Handshakes).
Change in assumptions - During measurement period 2014, the discount rate was 7.50%. During measurement period 2015, the discount rate was increased from 7.50% to 7.65%. There is no change in discount rate during measurement period 2016. During measurement period 2017, the discount rate was reduced from 7.65% to 7.15%.
Fiscal Year Ended June 30,
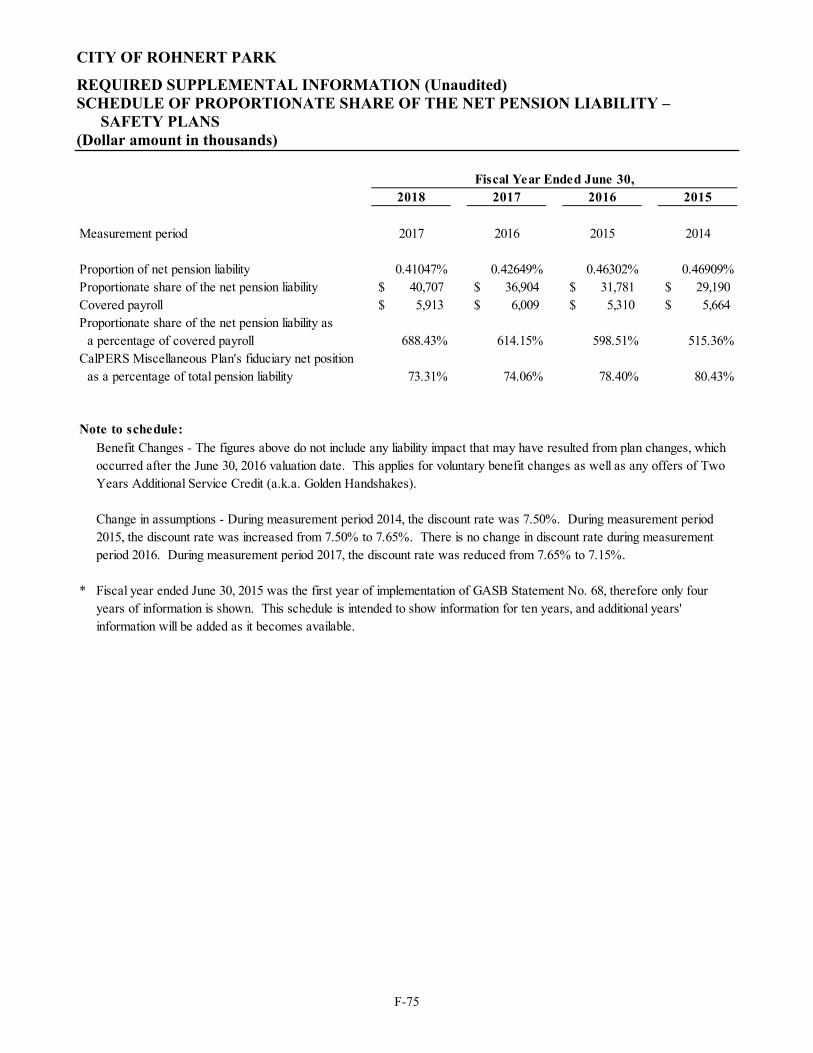
CITY OF ROHNERT PARK
REQUIRED SUPPLEMENTAL INFORMATION (Unaudited) SCHEDULE OF PROPORTIONATE SHARE OF THE NET PENSION LIABILITY –
SAFETY PLANS (Dollar amount in thousands)
F-75
2018 2017 2016 2015
Measurement period 2017 2016 2015 2014
Proportion of net pension liability 0.41047% 0.42649% 0.46302% 0.46909%Proportionate share of the net pension liability 40,707$ 36,904$ 31,781$ 29,190$ Covered payroll 5,913$ 6,009$ 5,310$ 5,664$ Proportionate share of the net pension liability as
a percentage of covered payroll 688.43% 614.15% 598.51% 515.36%CalPERS Miscellaneous Plan's fiduciary net position
as a percentage of total pension liability 73.31% 74.06% 78.40% 80.43%
Note to schedule:
* Fiscal year ended June 30, 2015 was the first year of implementation of GASB Statement No. 68, therefore only four years of information is shown. This schedule is intended to show information for ten years, and additional years' information will be added as it becomes available.
Benefit Changes - The figures above do not include any liability impact that may have resulted from plan changes, which occurred after the June 30, 2016 valuation date. This applies for voluntary benefit changes as well as any offers of Two Years Additional Service Credit (a.k.a. Golden Handshakes).
Change in assumptions - During measurement period 2014, the discount rate was 7.50%. During measurement period 2015, the discount rate was increased from 7.50% to 7.65%. There is no change in discount rate during measurement period 2016. During measurement period 2017, the discount rate was reduced from 7.65% to 7.15%.
Fiscal Year Ended June 30,
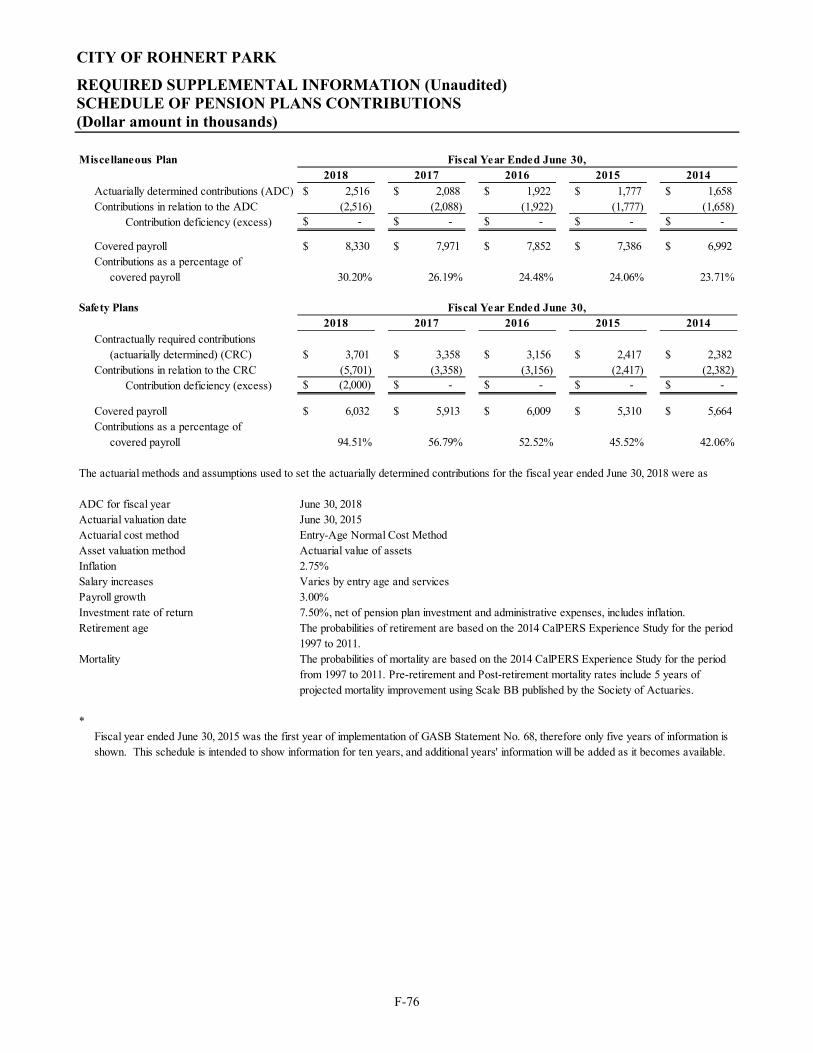
CITY OF ROHNERT PARK
REQUIRED SUPPLEMENTAL INFORMATION (Unaudited) SCHEDULE OF PENSION PLANS CONTRIBUTIONS (Dollar amount in thousands)
F-76
Miscellaneous Plan2018 2017 2016 2015 2014
Actuarially determined contributions (ADC) $ 2,516 $ 2,088 $ 1,922 $ 1,777 $ 1,658 Contributions in relation to the ADC (2,516) (2,088) (1,922) (1,777) (1,658)
Contribution deficiency (excess) $ - $ - $ - $ - $ -
Covered payroll $ 8,330 $ 7,971 $ 7,852 $ 7,386 $ 6,992 Contributions as a percentage of
covered payroll 30.20% 26.19% 24.48% 24.06% 23.71%
Safety Plans2018 2017 2016 2015 2014
Contractually required contributions(actuarially determined) (CRC) $ 3,701 $ 3,358 $ 3,156 $ 2,417 $ 2,382
Contributions in relation to the CRC (5,701) (3,358) (3,156) (2,417) (2,382)Contribution deficiency (excess) $ (2,000) $ - $ - $ - $ -
Covered payroll $ 6,032 $ 5,913 $ 6,009 $ 5,310 $ 5,664 Contributions as a percentage of
covered payroll 94.51% 56.79% 52.52% 45.52% 42.06%
ADC for fiscal year June 30, 2018Actuarial valuation date June 30, 2015Actuarial cost method Entry-Age Normal Cost MethodAsset valuation method Actuarial value of assetsInflation 2.75%Salary increases Varies by entry age and servicesPayroll growth 3.00%Investment rate of return Retirement age
Mortality
* Fiscal year ended June 30, 2015 was the first year of implementation of GASB Statement No. 68, therefore only five years of information is shown. This schedule is intended to show information for ten years, and additional years' information will be added as it becomes available.
Fiscal Year Ended June 30,
Fiscal Year Ended June 30,
7.50%, net of pension plan investment and administrative expenses, includes inflation.The probabilities of retirement are based on the 2014 CalPERS Experience Study for the period 1997 to 2011.
The actuarial methods and assumptions used to set the actuarially determined contributions for the fiscal year ended June 30, 2018 were as
The probabilities of mortality are based on the 2014 CalPERS Experience Study for the period from 1997 to 2011. Pre-retirement and Post-retirement mortality rates include 5 years of projected mortality improvement using Scale BB published by the Society of Actuaries.
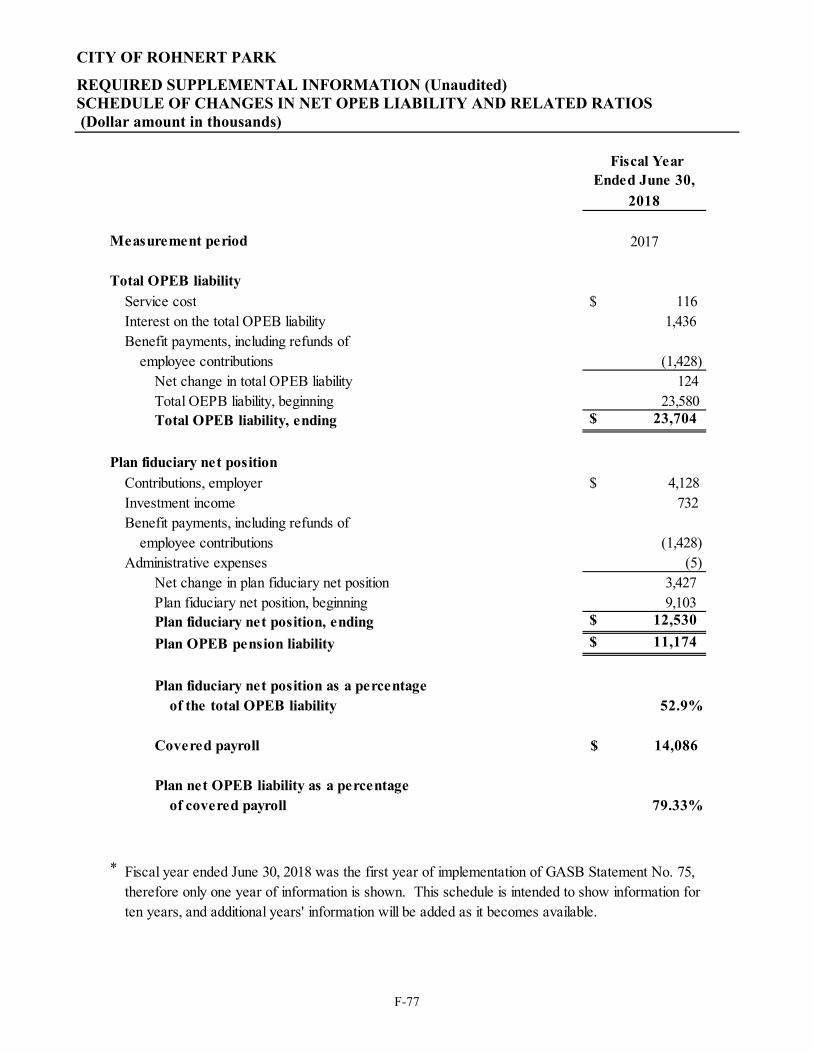
CITY OF ROHNERT PARK
REQUIRED SUPPLEMENTAL INFORMATION (Unaudited) SCHEDULE OF CHANGES IN NET OPEB LIABILITY AND RELATED RATIOS (Dollar amount in thousands)
F-77
Fiscal Year Ended June 30,
2018
Measurement period 2017
Total OPEB liabilityService cost $ 116 Interest on the total OPEB liability 1,436 Benefit payments, including refunds of
employee contributions (1,428)Net change in total OPEB liability 124 Total OEPB liability, beginning 23,580 Total OPEB liability, ending $ 23,704
Plan fiduciary net positionContributions, employer $ 4,128 Investment income 732 Benefit payments, including refunds of
employee contributions (1,428)Administrative expenses (5)
Net change in plan fiduciary net position 3,427 Plan fiduciary net position, beginning 9,103 Plan fiduciary net position, ending $ 12,530
Plan OPEB pension liability $ 11,174
Plan fiduciary net position as a percentageof the total OPEB liability 52.9%
Covered payroll 14,086$
Plan net OPEB liability as a percentageof covered payroll 79.33%
* Fiscal year ended June 30, 2018 was the first year of implementation of GASB Statement No. 75, therefore only one year of information is shown. This schedule is intended to show information for ten years, and additional years' information will be added as it becomes available.
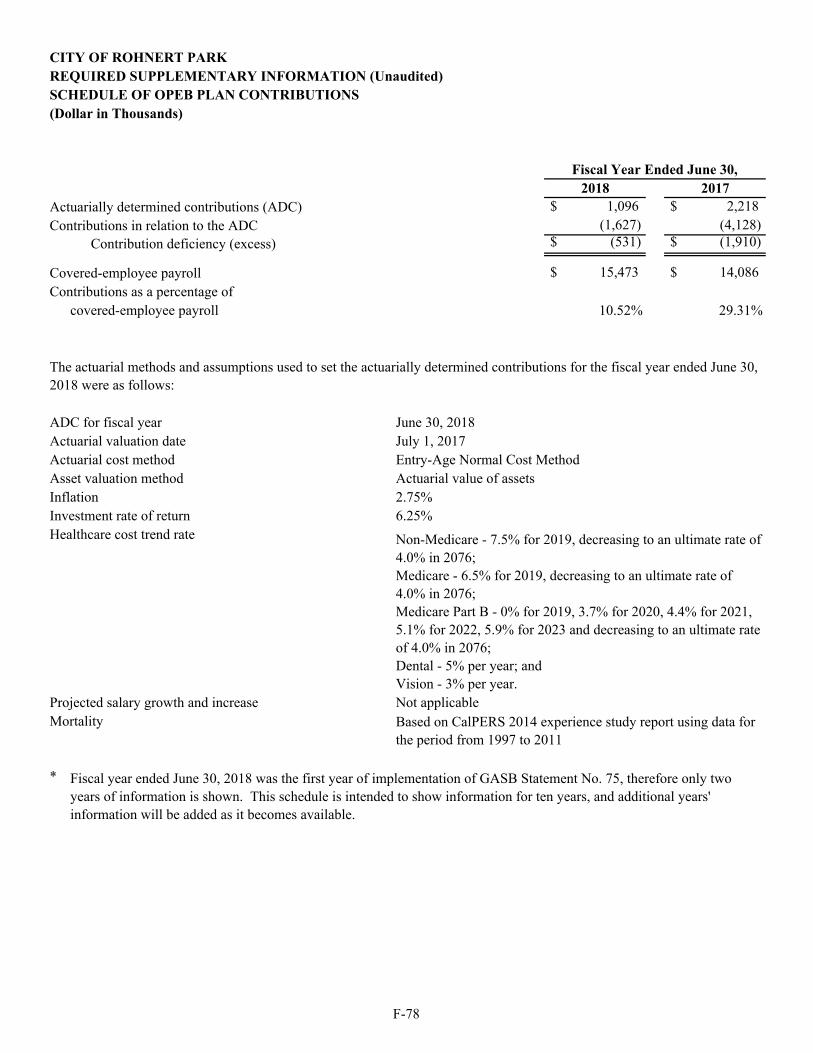
2018 2017Actuarially determined contributions (ADC) $ 1,096 $ 2,218 Contributions in relation to the ADC (1,627) (4,128)
Contribution deficiency (excess) $ (531) $ (1,910)
Covered-employee payroll $ 15,473 $ 14,086 Contributions as a percentage of
covered-employee payroll 10.52% 29.31%
ADC for fiscal year June 30, 2018Actuarial valuation date July 1, 2017Actuarial cost method Entry-Age Normal Cost MethodAsset valuation method Actuarial value of assetsInflationInvestment rate of returnHealthcare cost trend rate
Projected salary growth and increaseMortality
*
6.25%2.75%
Not applicable
Fiscal year ended June 30, 2018 was the first year of implementation of GASB Statement No. 75, therefore only two years of information is shown. This schedule is intended to show information for ten years, and additional years' information will be added as it becomes available.
The actuarial methods and assumptions used to set the actuarially determined contributions for the fiscal year ended June 30, 2018 were as follows:
Based on CalPERS 2014 experience study report using data for the period from 1997 to 2011
Non-Medicare - 7.5% for 2019, decreasing to an ultimate rate of 4.0% in 2076; Medicare - 6.5% for 2019, decreasing to an ultimate rate of 4.0% in 2076;Medicare Part B - 0% for 2019, 3.7% for 2020, 4.4% for 2021, 5.1% for 2022, 5.9% for 2023 and decreasing to an ultimate rate of 4.0% in 2076; Dental - 5% per year; andVision - 3% per year.
Fiscal Year Ended June 30,
CITY OF ROHNERT PARKREQUIRED SUPPLEMENTARY INFORMATION (Unaudited) SCHEDULE OF OPEB PLAN CONTRIBUTIONS(Dollar in Thousands)
F-78
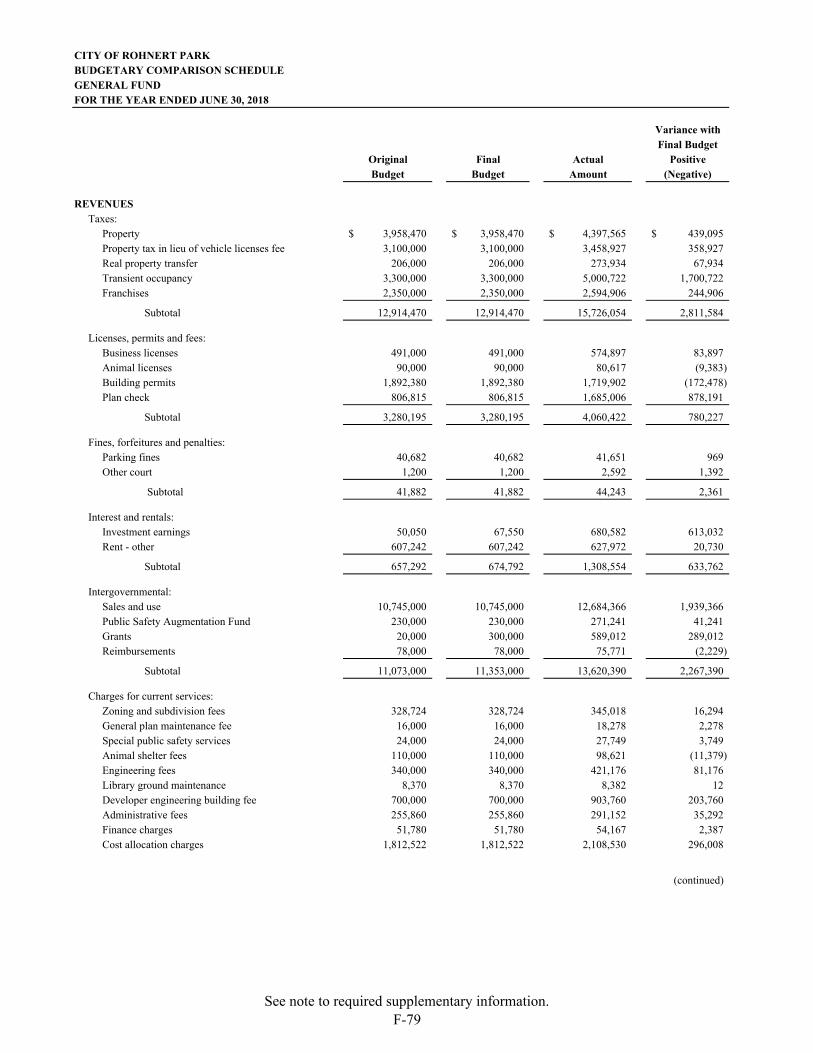
CITY OF ROHNERT PARKBUDGETARY COMPARISON SCHEDULEGENERAL FUNDFOR THE YEAR ENDED JUNE 30, 2018
Variance with Final Budget
Original Final Actual PositiveBudget Budget Amount (Negative)
REVENUES Taxes:
Property 3,958,470$ 3,958,470$ 4,397,565$ 439,095$ Property tax in lieu of vehicle licenses fee 3,100,000 3,100,000 3,458,927 358,927 Real property transfer 206,000 206,000 273,934 67,934 Transient occupancy 3,300,000 3,300,000 5,000,722 1,700,722 Franchises 2,350,000 2,350,000 2,594,906 244,906
Subtotal 12,914,470 12,914,470 15,726,054 2,811,584
Licenses, permits and fees:Business licenses 491,000 491,000 574,897 83,897 Animal licenses 90,000 90,000 80,617 (9,383) Building permits 1,892,380 1,892,380 1,719,902 (172,478) Plan check 806,815 806,815 1,685,006 878,191
Subtotal 3,280,195 3,280,195 4,060,422 780,227
Fines, forfeitures and penalties:Parking fines 40,682 40,682 41,651 969 Other court 1,200 1,200 2,592 1,392
Subtotal 41,882 41,882 44,243 2,361
Interest and rentals:Investment earnings 50,050 67,550 680,582 613,032 Rent - other 607,242 607,242 627,972 20,730
Subtotal 657,292 674,792 1,308,554 633,762
Intergovernmental:Sales and use 10,745,000 10,745,000 12,684,366 1,939,366 Public Safety Augmentation Fund 230,000 230,000 271,241 41,241 Grants 20,000 300,000 589,012 289,012 Reimbursements 78,000 78,000 75,771 (2,229)
Subtotal 11,073,000 11,353,000 13,620,390 2,267,390
Charges for current services:Zoning and subdivision fees 328,724 328,724 345,018 16,294 General plan maintenance fee 16,000 16,000 18,278 2,278 Special public safety services 24,000 24,000 27,749 3,749 Animal shelter fees 110,000 110,000 98,621 (11,379) Engineering fees 340,000 340,000 421,176 81,176 Library ground maintenance 8,370 8,370 8,382 12 Developer engineering building fee 700,000 700,000 903,760 203,760 Administrative fees 255,860 255,860 291,152 35,292 Finance charges 51,780 51,780 54,167 2,387 Cost allocation charges 1,812,522 1,812,522 2,108,530 296,008
(continued)
See note to required supplementary information.F-79
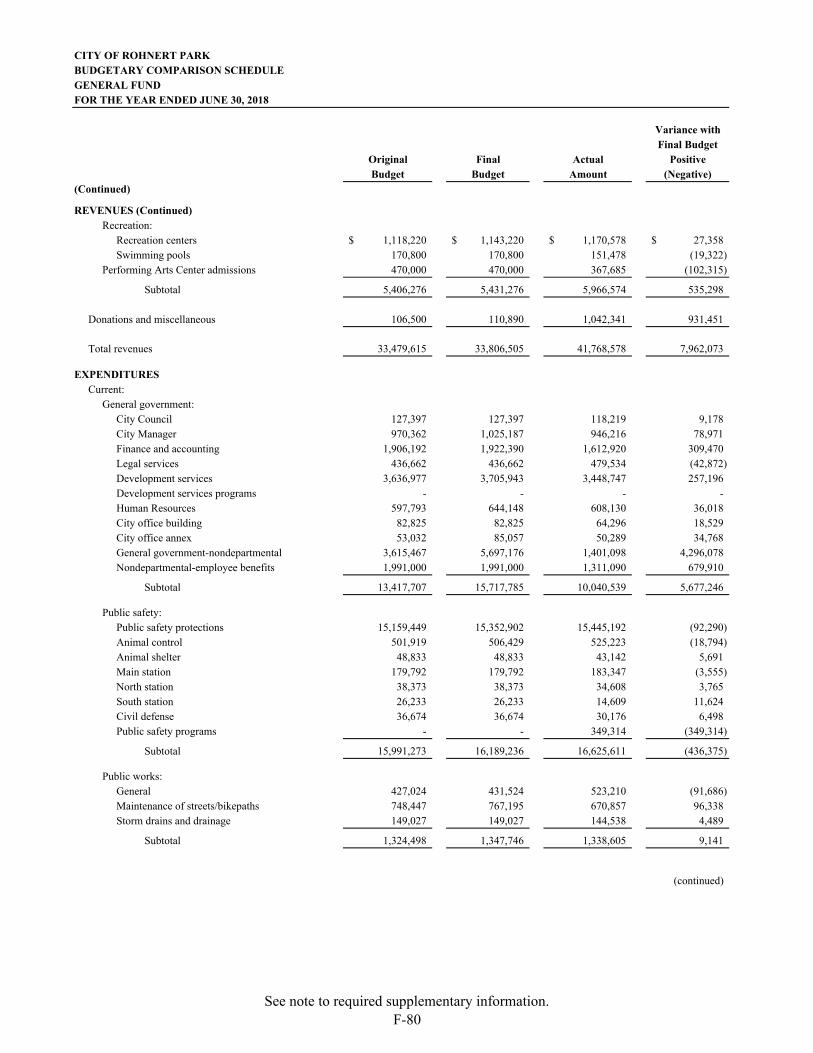
CITY OF ROHNERT PARKBUDGETARY COMPARISON SCHEDULEGENERAL FUNDFOR THE YEAR ENDED JUNE 30, 2018
Variance with Final Budget
Original Final Actual PositiveBudget Budget Amount (Negative)
(Continued)
REVENUES (Continued) Recreation:
Recreation centers 1,118,220$ 1,143,220$ 1,170,578$ 27,358$ Swimming pools 170,800 170,800 151,478 (19,322)
Performing Arts Center admissions 470,000 470,000 367,685 (102,315)
Subtotal 5,406,276 5,431,276 5,966,574 535,298
Donations and miscellaneous 106,500 110,890 1,042,341 931,451
Total revenues 33,479,615 33,806,505 41,768,578 7,962,073
EXPENDITURES Current:
General government:City Council 127,397 127,397 118,219 9,178 City Manager 970,362 1,025,187 946,216 78,971 Finance and accounting 1,906,192 1,922,390 1,612,920 309,470 Legal services 436,662 436,662 479,534 (42,872) Development services 3,636,977 3,705,943 3,448,747 257,196 Development services programs - - - - Human Resources 597,793 644,148 608,130 36,018 City office building 82,825 82,825 64,296 18,529 City office annex 53,032 85,057 50,289 34,768 General government-nondepartmental 3,615,467 5,697,176 1,401,098 4,296,078 Nondepartmental-employee benefits 1,991,000 1,991,000 1,311,090 679,910
Subtotal 13,417,707 15,717,785 10,040,539 5,677,246
Public safety:Public safety protections 15,159,449 15,352,902 15,445,192 (92,290) Animal control 501,919 506,429 525,223 (18,794) Animal shelter 48,833 48,833 43,142 5,691 Main station 179,792 179,792 183,347 (3,555) North station 38,373 38,373 34,608 3,765 South station 26,233 26,233 14,609 11,624 Civil defense 36,674 36,674 30,176 6,498 Public safety programs - - 349,314 (349,314)
Subtotal 15,991,273 16,189,236 16,625,611 (436,375)
Public works:General 427,024 431,524 523,210 (91,686) Maintenance of streets/bikepaths 748,447 767,195 670,857 96,338 Storm drains and drainage 149,027 149,027 144,538 4,489
Subtotal 1,324,498 1,347,746 1,338,605 9,141
(continued)
See note to required supplementary information.F-80
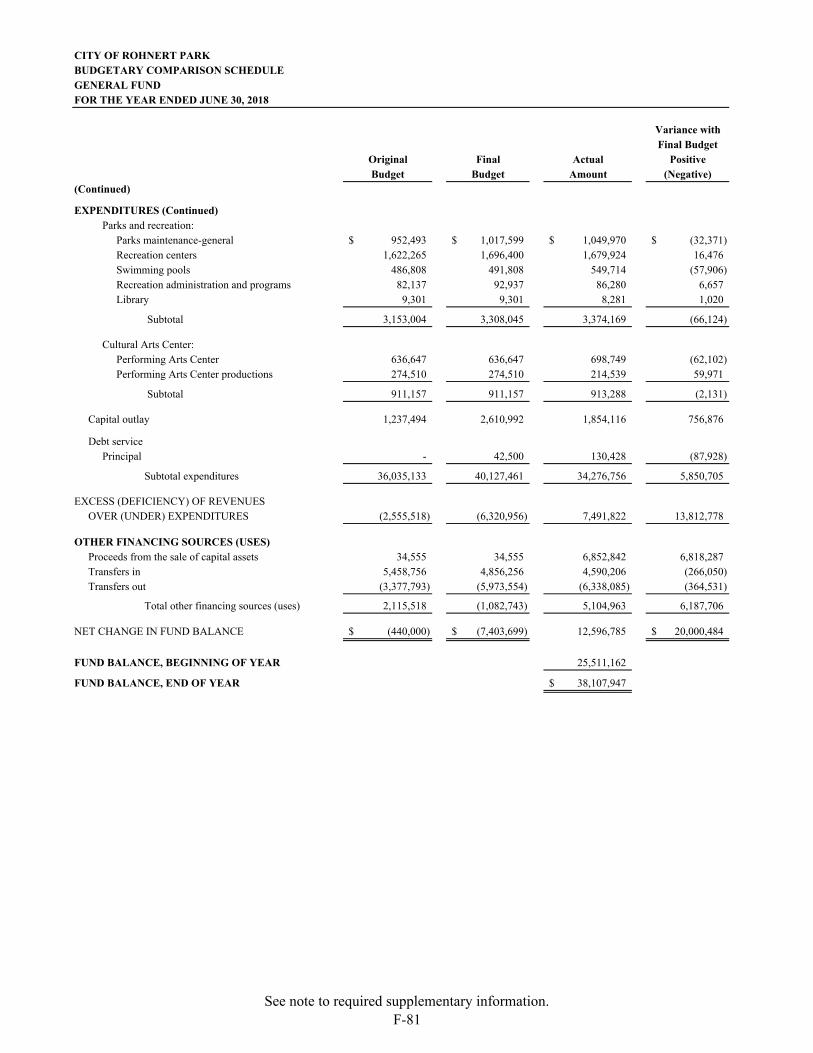
CITY OF ROHNERT PARKBUDGETARY COMPARISON SCHEDULEGENERAL FUNDFOR THE YEAR ENDED JUNE 30, 2018
Variance with Final Budget
Original Final Actual PositiveBudget Budget Amount (Negative)
(Continued)
EXPENDITURES (Continued) Parks and recreation:
Parks maintenance-general 952,493$ 1,017,599$ 1,049,970$ (32,371)$ Recreation centers 1,622,265 1,696,400 1,679,924 16,476 Swimming pools 486,808 491,808 549,714 (57,906) Recreation administration and programs 82,137 92,937 86,280 6,657 Library 9,301 9,301 8,281 1,020
Subtotal 3,153,004 3,308,045 3,374,169 (66,124)
Cultural Arts Center:Performing Arts Center 636,647 636,647 698,749 (62,102) Performing Arts Center productions 274,510 274,510 214,539 59,971
Subtotal 911,157 911,157 913,288 (2,131)
Capital outlay 1,237,494 2,610,992 1,854,116 756,876
Debt servicePrincipal - 42,500 130,428 (87,928)
Subtotal expenditures 36,035,133 40,127,461 34,276,756 5,850,705
EXCESS (DEFICIENCY) OF REVENUES OVER (UNDER) EXPENDITURES (2,555,518) (6,320,956) 7,491,822 13,812,778
OTHER FINANCING SOURCES (USES)Proceeds from the sale of capital assets 34,555 34,555 6,852,842 6,818,287 Transfers in 5,458,756 4,856,256 4,590,206 (266,050) Transfers out (3,377,793) (5,973,554) (6,338,085) (364,531)
Total other financing sources (uses) 2,115,518 (1,082,743) 5,104,963 6,187,706
NET CHANGE IN FUND BALANCE (440,000)$ (7,403,699)$ 12,596,785 20,000,484$
FUND BALANCE, BEGINNING OF YEAR 25,511,162
FUND BALANCE, END OF YEAR 38,107,947$
See note to required supplementary information.F-81
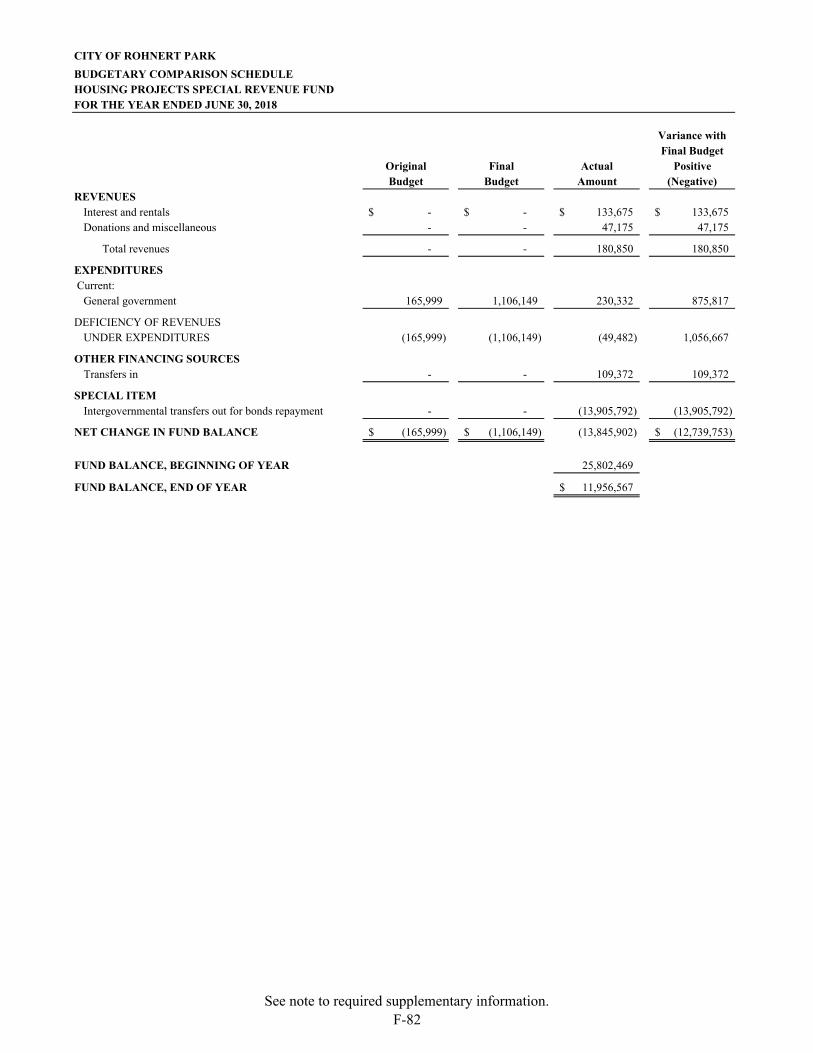
CITY OF ROHNERT PARK
BUDGETARY COMPARISON SCHEDULEHOUSING PROJECTS SPECIAL REVENUE FUNDFOR THE YEAR ENDED JUNE 30, 2018
Variance withFinal Budget
Original Final Actual PositiveBudget Budget Amount (Negative)
REVENUESInterest and rentals -$ -$ 133,675$ 133,675$ Donations and miscellaneous - - 47,175 47,175
Total revenues - - 180,850 180,850
EXPENDITURES Current:
General government 165,999 1,106,149 230,332 875,817
DEFICIENCY OF REVENUESUNDER EXPENDITURES (165,999) (1,106,149) (49,482) 1,056,667
OTHER FINANCING SOURCESTransfers in - - 109,372 109,372
SPECIAL ITEMIntergovernmental transfers out for bonds repayment - - (13,905,792) (13,905,792)
NET CHANGE IN FUND BALANCE (165,999)$ (1,106,149)$ (13,845,902) (12,739,753)$
FUND BALANCE, BEGINNING OF YEAR 25,802,469
FUND BALANCE, END OF YEAR 11,956,567$
See note to required supplementary information.F-82
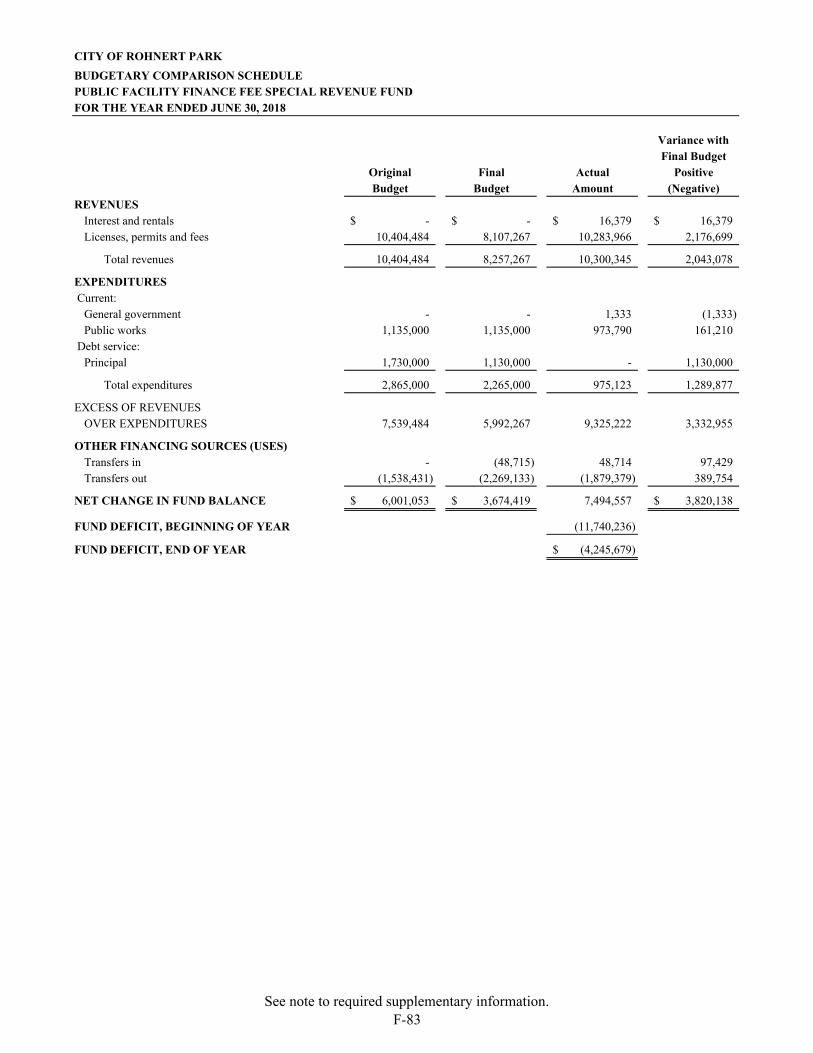
CITY OF ROHNERT PARK
BUDGETARY COMPARISON SCHEDULEPUBLIC FACILITY FINANCE FEE SPECIAL REVENUE FUNDFOR THE YEAR ENDED JUNE 30, 2018
Variance withFinal Budget
Original Final Actual PositiveBudget Budget Amount (Negative)
REVENUESInterest and rentals -$ -$ 16,379$ 16,379$ Licenses, permits and fees 10,404,484 8,107,267 10,283,966 2,176,699
Total revenues 10,404,484 8,257,267 10,300,345 2,043,078
EXPENDITURES Current:
General government - - 1,333 (1,333) Public works 1,135,000 1,135,000 973,790 161,210
Debt service: Principal 1,730,000 1,130,000 - 1,130,000
Total expenditures 2,865,000 2,265,000 975,123 1,289,877
EXCESS OF REVENUESOVER EXPENDITURES 7,539,484 5,992,267 9,325,222 3,332,955
OTHER FINANCING SOURCES (USES)Transfers in - (48,715) 48,714 97,429 Transfers out (1,538,431) (2,269,133) (1,879,379) 389,754
NET CHANGE IN FUND BALANCE 6,001,053$ 3,674,419$ 7,494,557 3,820,138$
FUND DEFICIT, BEGINNING OF YEAR (11,740,236)
FUND DEFICIT, END OF YEAR (4,245,679)$
See note to required supplementary information.F-83
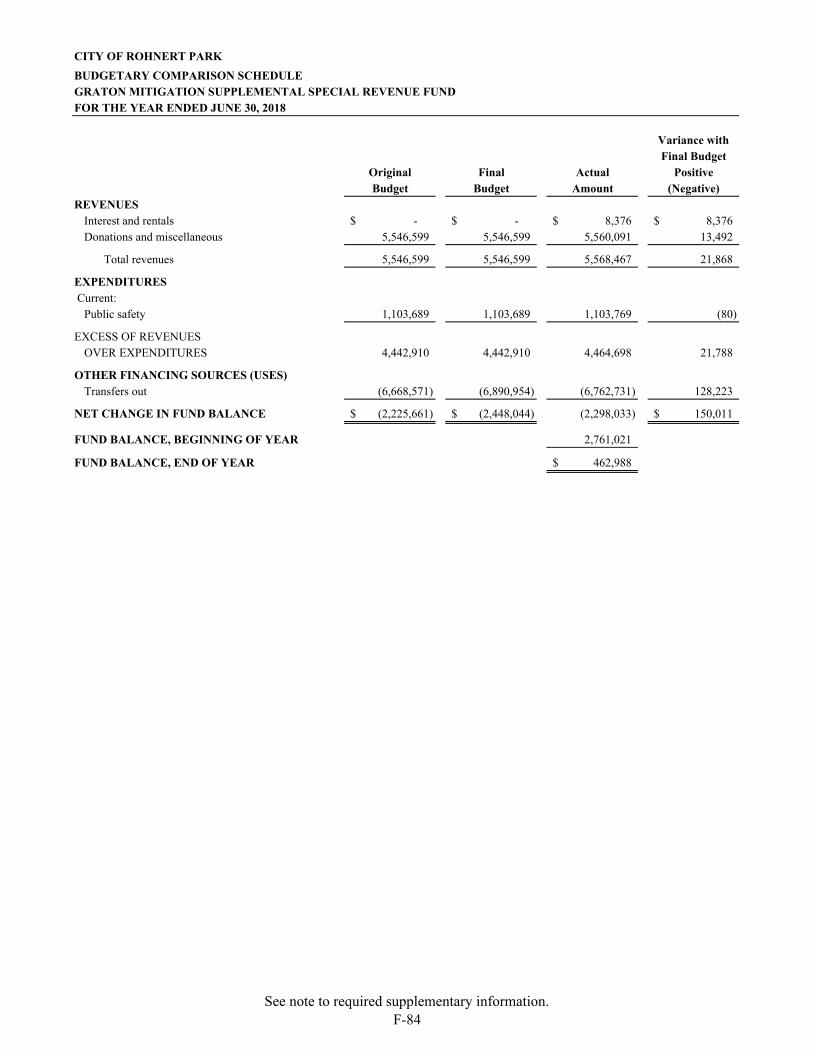
CITY OF ROHNERT PARK
BUDGETARY COMPARISON SCHEDULEGRATON MITIGATION SUPPLEMENTAL SPECIAL REVENUE FUNDFOR THE YEAR ENDED JUNE 30, 2018
Variance withFinal Budget
Original Final Actual PositiveBudget Budget Amount (Negative)
REVENUESInterest and rentals -$ -$ 8,376$ 8,376$ Donations and miscellaneous 5,546,599 5,546,599 5,560,091 13,492
Total revenues 5,546,599 5,546,599 5,568,467 21,868
EXPENDITURES Current:
Public safety 1,103,689 1,103,689 1,103,769 (80)
EXCESS OF REVENUESOVER EXPENDITURES 4,442,910 4,442,910 4,464,698 21,788
OTHER FINANCING SOURCES (USES)Transfers out (6,668,571) (6,890,954) (6,762,731) 128,223
NET CHANGE IN FUND BALANCE (2,225,661)$ (2,448,044)$ (2,298,033) 150,011$
FUND BALANCE, BEGINNING OF YEAR 2,761,021
FUND BALANCE, END OF YEAR 462,988$
See note to required supplementary information.F-84
CITY OF ROHNERT PARK
NOTE TO REQUIRED SUPPLEMENTARY INFORMATION FOR THE FISCAL YEAR ENDED JUNE 30, 2018
F-85
Budgets and Budgetary Accounting The City operates under the general laws of the State of California and annually adopts a budget for its General Fund to be effective July 1 for the ensuing fiscal year. From the effective date of the budget, which is adopted and controlled at the department level, the amounts stated therein as proposed expenditures become appropriations to the various City departments. The City Council may amend the budget by resolution during the fiscal year. The legal level of budgetary control is the fund level. The City Manager may authorize transfers from one account to another within the same department. All unencumbered appropriations lapse at year-end. Annual budgets for all of the City’s major funds and nonmajor special revenue funds are adopted on a basis consistent with accounting principles generally accepted in the United States of America, with the exception of proceeds from the sale of capital assets, which are treated as revenues on the budgetary basis. The City prefers to leave its original budget unaltered during the year, unless there are substantial changes to budget forecasts, so that the effectiveness of individual departments in meeting budget objectives can be evaluated and the adequacy of the budget itself can be judged. Expenditures in excess of budgeted amounts are allowed by law but must be approved individually by the City Manager and are required to be disclosed per GAAP. Encumbrance accounting, under which purchase orders, contracts, and other commitments of expenditures are recorded in order to reserve that portion of the applicable appropriation, is employed as an extension of the budgetary process. At June 30, 2018, encumbrances of $1,138,099 were outstanding for the General Fund.
F-86
This page is left intentionally blank.
F-87
OTHER SUPPLEMENTARY INFORMATION
F-88
This page is left intentionally blank.
CITY OF ROHNERT PARK
OTHER SUPPLEMENTAL INFORMATION DESCRIPTION OF NONMAJOR GOVERNMENTAL FUNDS FOR THE FISCAL YEAR ENDED JUNE 30, 2018
F-89
SPECIAL REVENUE FUNDS
Special Revenue Funds are used to account for and report the proceeds of specific revenue sources that are restricted or committed to expenditure for specified purposes other than debt service or capital projects. The following summarizes the City’s Special Revenue Funds:
Alcoholic Beverage Sales Ordinance (ABSO) Fund - Annual permit fee that is received from all businesses that sell alcohol in the City pursuant to City’s Ordinance No. 780. The permit from the ordinance requires the business owner to comply with operational standards and training requirements and creates conditions and requirements upon the local alcohol sales licenses for the purpose of law enforcement compliance checks, police services necessary to monitor and enforce operational stands established with the license.
Abandoned Vehicle Abatement Fund - Revenues received from the Sonoma County Abandoned Vehicle Abatement Program, pursuant to the terms of an agreement with the Service Authority authorized by City Council Resolution No. 95-16, providing for the abatement of abandoned vehicles in the City.
Traffic Safety Fund - Revenues received pursuant to Vehicle Code Section 42200 for the purpose of maintenance of traffic control devices and traffic law enforcement and traffic accident prevention.
General Plan Maintenance Fund - Revenues received from a surcharge pursuant to City’s Resolution No. 2008-03 on certain building permits and based on a percentage of project valuation, for the purpose of updating and maintaining the Rohnert Park General Plan.
Spay and Neuter Fund – Revenues received from $2 of each animal license, pursuant to City’s Resolution 2008-03, for the purpose of supplementing the costs of spay and neuter activities.
Refuse Road Impact Fee Fund - Revenues received from Rohnert Park Disposal pursuant to the Second Amended and Restated Agreement between the City and Rohnert Park Disposal, Inc. for expenses incurred by the City for repairing and maintaining the City’s public streets cause by normal and ongoing use of Rohnert Park Disposal’s collection vehicles.
State Gasoline Tax Fund - Revenues received pursuant to Street and Highway Code Sections 2105, 2106, 2107, 2107.5, 2031, and Senate Bill 1-Road Repair and Accountability Act of 2017, and other funds for the purpose of maintenance and construction of the City streets.
Measure M Traffic Fund - Revenues received from County of Sonoma on one quarter cent sales tax for street improvements.
Traffic Signals Fee Fund - Revenues received from fees imposed on developers for the purpose of constructing traffic signals.
Supplemental Law Enforcement Services Fund - Revenues received from the State of California pursuant to AB 3229 for the purpose of ensuring public safety.
DIVCA PEG Fee (AB 2987) Fund – Revenues received pursuant to Assembly Bill 2987 for activities related to public, educational and governmental access channels.
Graton Mitigation School Contribution Fund – Accounts for contributions pass-through to the Cotati-Rohnert Park Unified School District pursuant to Section 4.1 of the memorandum of understanding (MOU) between the Federated Indians of the Graton Rancheria (Tribe) and the City.
Graton Mitigation Law Enforcement Fund - Accounts for contributions and related activities for special law enforcement pursuant to Section 3.1 of the MOU between the Tribe and the City.
CITY OF ROHNERT PARK
OTHER SUPPLEMENTAL INFORMATION DESCRIPTION OF NONMAJOR GOVERNMENTAL FUNDS FOR THE FISCAL YEAR ENDED JUNE 30, 2018
F-90
Graton Mitigation Public Safety Building Fund - Accounts for contributions and related activities for the construction of a new public safety building pursuant to Section 2.3.1 of the MOU between the Tribe and the City.
Graton Mitigation Problem Gambling Fund - Accounts for contributions and related activities for mitigation of social impacts pursuant to Section 3.2 of the MOU between the Tribe and the City. The City shall grant such payment to an organization dedicated to the treatment and prevention of problem gambling or pathological gambling disorders.
Graton Mitigation Waterway Fund - Accounts for contributions and related activities for storm water drainage pursuant to Section 3.3 of the MOU between the Tribe and the City.
Graton Mitigation Public Services Fund - Accounts for contributions and related activities for public services pursuant to Section 3.4.2 of the MOU between the Tribe and the City.
Graton Mitigation Wilfred Maintenance Fund - Accounts for contributions and related activities for the maintenance of the Wilfred Avenue pursuant to Section 6.6 of the Joint Exercise of Powers Agreement for implementation of mitigation measure for widening Wilfred Avenue between the Tribe and the City.
Graton City Vehicle Contribution Fund - Accounts for contributions and related activities for the purchase of public safety and/or other City vehicles pursuant to Section 2.3.3 of the MOU between the Tribe and the City.
Measure M Fire Benefit Assessment Fund - Revenues received pursuant to the voter approved fire benefit assessment district. Purpose is to finance enhancements of fire suppression activities.
Mobile Home Rent Appeals Board Fund - Revenues received pursuant to City of Rohnert Park Ordinance 494 authorizing the collection of registration fees from mobile home parks. Purpose is to fund the Mobile Home Rent Appeals Board.
Copeland Creek Drainage Facility Fund - Revenues received from fees imposed on developers in a specific area serviced by the Copeland Creek drainage improvements. Purpose is to repay the costs of the Copeland Creek drainage improvements.
Asset Forfeiture Fund - Revenues received from assets seizures returned after Federal and State seized asset court cases have been adjudicated and finalized.
Performing Arts Center Facility Capital Reserve Fund - Revenues received from the assessment of two dollars per ticket sold which is set aside for improvements at the Preforming Arts Center.
Sports Center Facility Capital Reserve Fund - Revenues received from the assessment of between two to five dollars per sports center memberships which is set aside for improvements at the Sports Center.
Explorer Fund– Revenues received from Public Safety Explorer Scouts’ fundraising activities that can only be used for Explorer Scouts program goods and services.
California Disability Access Fee Fund - Revenues received on each business licenses pursuant to SB1186 for costs associated with hiring a Certified Access Specialists and other related costs.
Affordable Linkage Fee Fund – Revenues received pursuant to Ordinance 771 which established fees to be imposed upon nonresidential development to be used for land acquisition, construction, rehabilitation, subsidization, assistance to other governments, private organizations or individuals to expand affordable housing opportunities to low and moderate income households.
UDSP Regional Traffic Fee Fund - Revenues received pursuant to a developer agreement in the University District Specific Plan area for the purpose of mitigating the regional traffic impacts of the development.
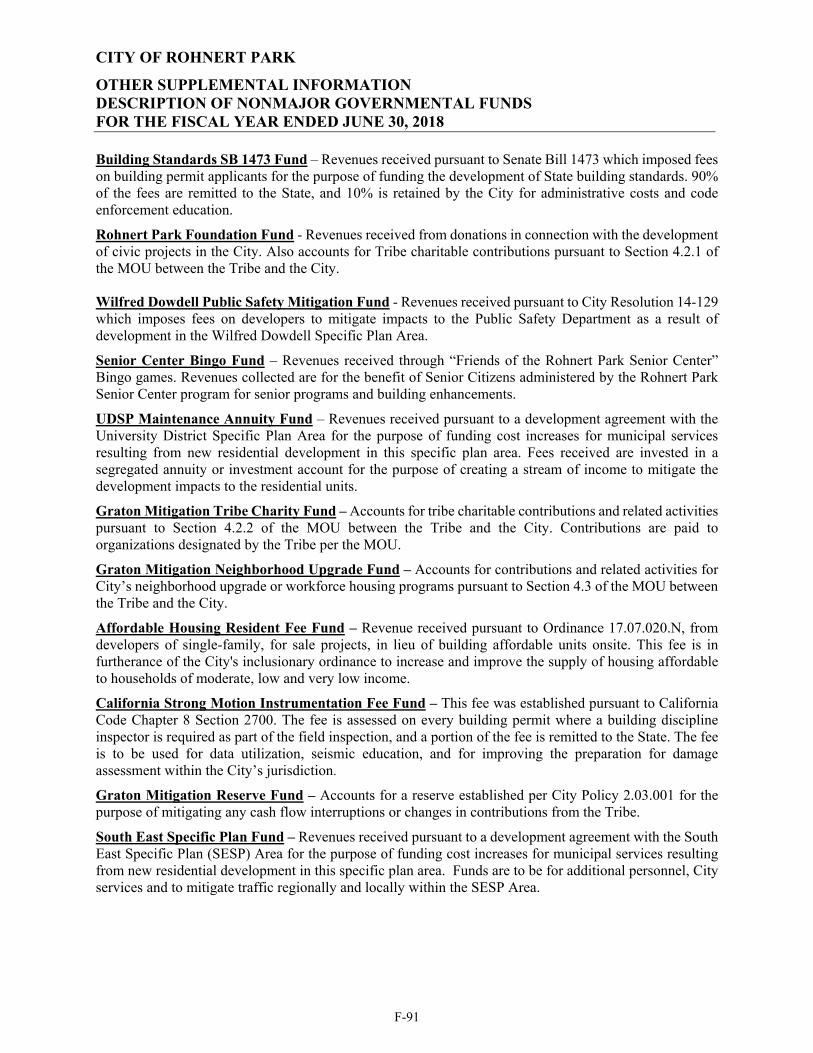
CITY OF ROHNERT PARK
OTHER SUPPLEMENTAL INFORMATION DESCRIPTION OF NONMAJOR GOVERNMENTAL FUNDS FOR THE FISCAL YEAR ENDED JUNE 30, 2018
F-91
Building Standards SB 1473 Fund – Revenues received pursuant to Senate Bill 1473 which imposed fees on building permit applicants for the purpose of funding the development of State building standards. 90% of the fees are remitted to the State, and 10% is retained by the City for administrative costs and code enforcement education.
Rohnert Park Foundation Fund - Revenues received from donations in connection with the development of civic projects in the City. Also accounts for Tribe charitable contributions pursuant to Section 4.2.1 of the MOU between the Tribe and the City. Wilfred Dowdell Public Safety Mitigation Fund - Revenues received pursuant to City Resolution 14-129 which imposes fees on developers to mitigate impacts to the Public Safety Department as a result of development in the Wilfred Dowdell Specific Plan Area.
Senior Center Bingo Fund – Revenues received through “Friends of the Rohnert Park Senior Center” Bingo games. Revenues collected are for the benefit of Senior Citizens administered by the Rohnert Park Senior Center program for senior programs and building enhancements.
UDSP Maintenance Annuity Fund – Revenues received pursuant to a development agreement with the University District Specific Plan Area for the purpose of funding cost increases for municipal services resulting from new residential development in this specific plan area. Fees received are invested in a segregated annuity or investment account for the purpose of creating a stream of income to mitigate the development impacts to the residential units.
Graton Mitigation Tribe Charity Fund – Accounts for tribe charitable contributions and related activities pursuant to Section 4.2.2 of the MOU between the Tribe and the City. Contributions are paid to organizations designated by the Tribe per the MOU.
Graton Mitigation Neighborhood Upgrade Fund – Accounts for contributions and related activities for City’s neighborhood upgrade or workforce housing programs pursuant to Section 4.3 of the MOU between the Tribe and the City.
Affordable Housing Resident Fee Fund – Revenue received pursuant to Ordinance 17.07.020.N, from developers of single-family, for sale projects, in lieu of building affordable units onsite. This fee is in furtherance of the City's inclusionary ordinance to increase and improve the supply of housing affordable to households of moderate, low and very low income.
California Strong Motion Instrumentation Fee Fund – This fee was established pursuant to California Code Chapter 8 Section 2700. The fee is assessed on every building permit where a building discipline inspector is required as part of the field inspection, and a portion of the fee is remitted to the State. The fee is to be used for data utilization, seismic education, and for improving the preparation for damage assessment within the City’s jurisdiction.
Graton Mitigation Reserve Fund – Accounts for a reserve established per City Policy 2.03.001 for the purpose of mitigating any cash flow interruptions or changes in contributions from the Tribe.
South East Specific Plan Fund – Revenues received pursuant to a development agreement with the South East Specific Plan (SESP) Area for the purpose of funding cost increases for municipal services resulting from new residential development in this specific plan area. Funds are to be for additional personnel, City services and to mitigate traffic regionally and locally within the SESP Area.
CITY OF ROHNERT PARK
OTHER SUPPLEMENTAL INFORMATION DESCRIPTION OF NONMAJOR GOVERNMENTAL FUNDS FOR THE FISCAL YEAR ENDED JUNE 30, 2018
F-92
PERMANENT FUND
Permanent Funds are used to account for resources that are legally restricted to the extent that only earnings, and not principal, may be used for purposes that support the City’s programs. The following summarizes the City’s Permanent Fund:
Performing Arts Center Endowment Permanent Fund - Capital donated to support the City’s Dorothy Rohnert Spreckels Performing Arts Center. The interest earnings generated from the corpus is used for operating and capital costs at the Performing Arts Center.
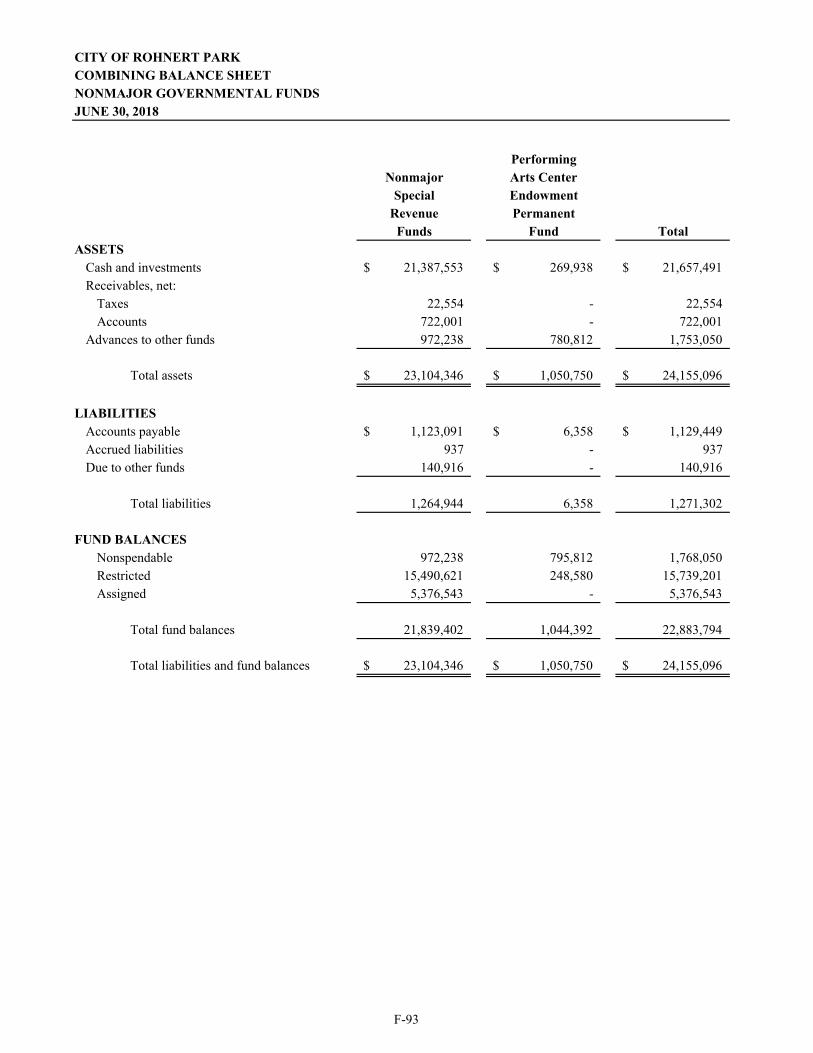
CITY OF ROHNERT PARKCOMBINING BALANCE SHEETNONMAJOR GOVERNMENTAL FUNDSJUNE 30, 2018
PerformingNonmajor Arts Center
Special EndowmentRevenue Permanent
Funds Fund Total
Cash and investments 21,387,553$ 269,938$ 21,657,491$ Receivables, net:
Taxes 22,554 - 22,554 Accounts 722,001 - 722,001
Advances to other funds 972,238 780,812 1,753,050
Total assets 23,104,346$ 1,050,750$ 24,155,096$
Accounts payable 1,123,091$ 6,358$ 1,129,449$ Accrued liabilities 937 - 937 Due to other funds 140,916 - 140,916
Total liabilities 1,264,944 6,358 1,271,302
Nonspendable 972,238 795,812 1,768,050 Restricted 15,490,621 248,580 15,739,201 Assigned 5,376,543 - 5,376,543
Total fund balances 21,839,402 1,044,392 22,883,794
Total liabilities and fund balances 23,104,346$ 1,050,750$ 24,155,096$
ASSETS
LIABILITIES
FUND BALANCES
F-93
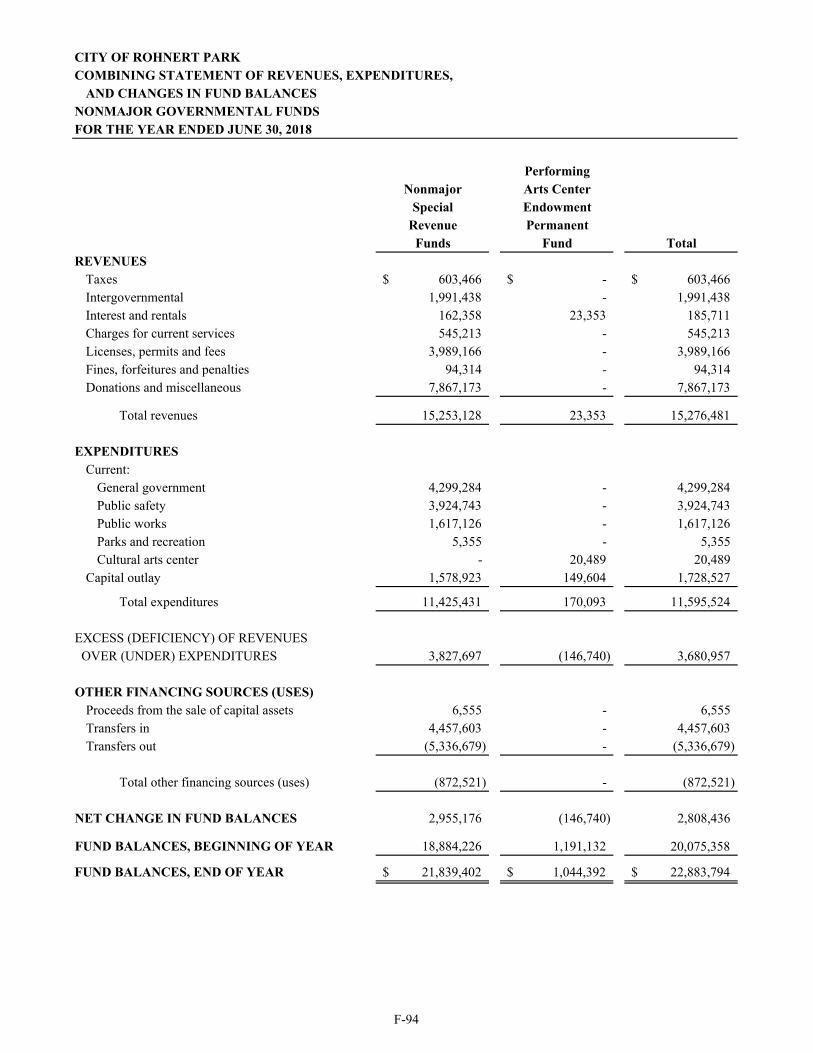
CITY OF ROHNERT PARKCOMBINING STATEMENT OF REVENUES, EXPENDITURES,
AND CHANGES IN FUND BALANCESNONMAJOR GOVERNMENTAL FUNDSFOR THE YEAR ENDED JUNE 30, 2018
PerformingNonmajor Arts Center
Special EndowmentRevenue Permanent
Funds Fund TotalREVENUES
Taxes 603,466$ -$ 603,466$ Intergovernmental 1,991,438 - 1,991,438 Interest and rentals 162,358 23,353 185,711 Charges for current services 545,213 - 545,213 Licenses, permits and fees 3,989,166 - 3,989,166 Fines, forfeitures and penalties 94,314 - 94,314 Donations and miscellaneous 7,867,173 - 7,867,173
Total revenues 15,253,128 23,353 15,276,481
EXPENDITURESCurrent:
General government 4,299,284 - 4,299,284 Public safety 3,924,743 - 3,924,743 Public works 1,617,126 - 1,617,126 Parks and recreation 5,355 - 5,355 Cultural arts center - 20,489 20,489
Capital outlay 1,578,923 149,604 1,728,527
Total expenditures 11,425,431 170,093 11,595,524
EXCESS (DEFICIENCY) OF REVENUES OVER (UNDER) EXPENDITURES 3,827,697 (146,740) 3,680,957
OTHER FINANCING SOURCES (USES)Proceeds from the sale of capital assets 6,555 - 6,555 Transfers in 4,457,603 - 4,457,603 Transfers out (5,336,679) - (5,336,679)
Total other financing sources (uses) (872,521) - (872,521)
NET CHANGE IN FUND BALANCES 2,955,176 (146,740) 2,808,436
FUND BALANCES, BEGINNING OF YEAR 18,884,226 1,191,132 20,075,358
FUND BALANCES, END OF YEAR 21,839,402$ 1,044,392$ 22,883,794$
F-94

F-95
This page is left intentionally blank.
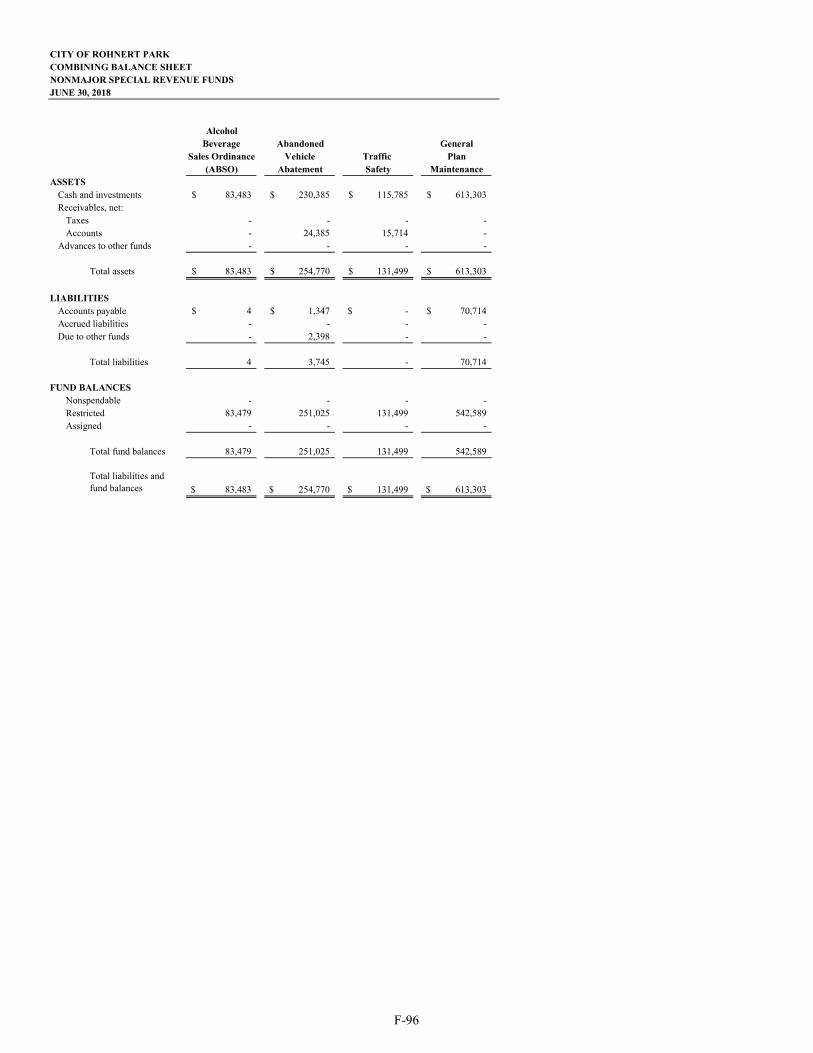
CITY OF ROHNERT PARKCOMBINING BALANCE SHEETNONMAJOR SPECIAL REVENUE FUNDSJUNE 30, 2018
AlcoholBeverage Abandoned General
Sales Ordinance Vehicle Traffic Plan(ABSO) Abatement Safety Maintenance
ASSETSCash and investments 83,483$ 230,385$ 115,785$ 613,303$ Receivables, net:
Taxes - - - - Accounts - 24,385 15,714 -
Advances to other funds - - - -
Total assets 83,483$ 254,770$ 131,499$ 613,303$
LIABILITIESAccounts payable 4$ 1,347$ -$ 70,714$ Accrued liabilities - - - - Due to other funds - 2,398 - -
Total liabilities 4 3,745 - 70,714
FUND BALANCESNonspendable - - - - Restricted 83,479 251,025 131,499 542,589 Assigned - - - -
Total fund balances 83,479 251,025 131,499 542,589
Total liabilities and fund balances 83,483$ 254,770$ 131,499$ 613,303$
F-96
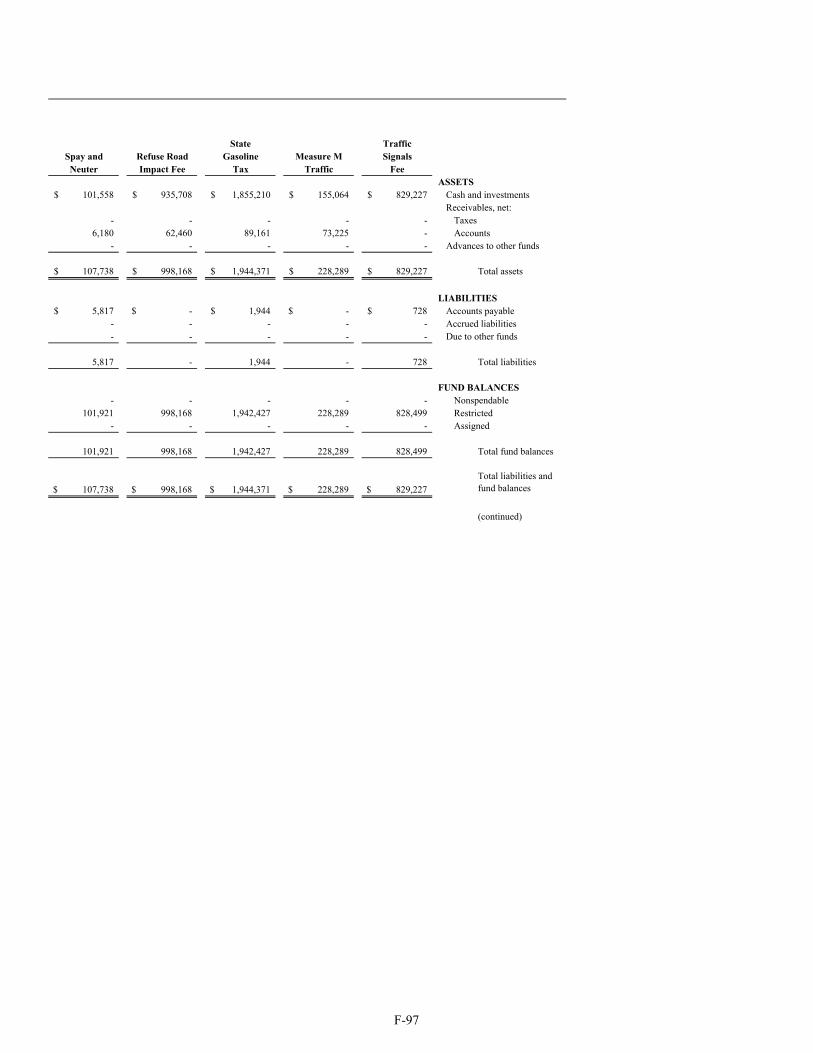
State TrafficSpay and Refuse Road Gasoline Measure M SignalsNeuter Impact Fee Tax Traffic Fee
ASSETS101,558$ 935,708$ 1,855,210$ 155,064$ 829,227$ Cash and investments
Receivables, net:- - - - - Taxes
6,180 62,460 89,161 73,225 - Accounts- - - - - Advances to other funds
107,738$ 998,168$ 1,944,371$ 228,289$ 829,227$ Total assets
LIABILITIES5,817$ -$ 1,944$ -$ 728$ Accounts payable
- - - - - Accrued liabilities- - - - - Due to other funds
5,817 - 1,944 - 728 Total liabilities
FUND BALANCES- - - - - Nonspendable
101,921 998,168 1,942,427 228,289 828,499 Restricted- - - - - Assigned
101,921 998,168 1,942,427 228,289 828,499 Total fund balances
107,738$ 998,168$ 1,944,371$ 228,289$ 829,227$
Total liabilities and fund balances
(continued)
F-97
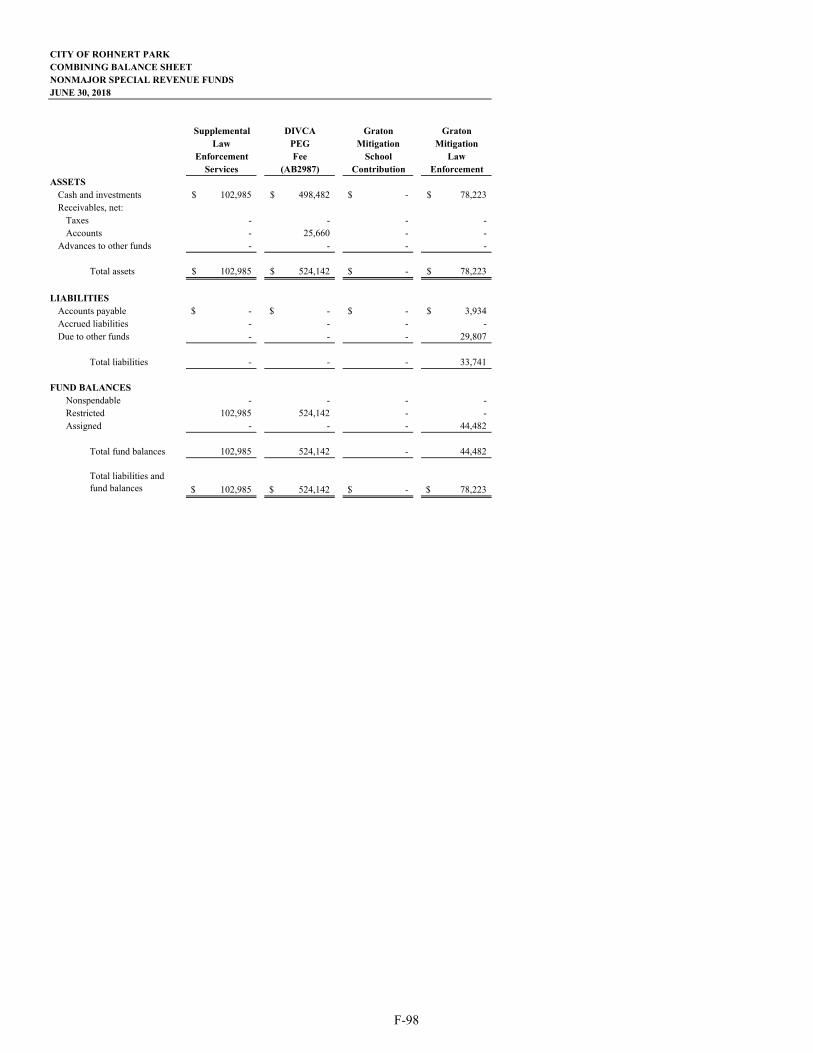
CITY OF ROHNERT PARKCOMBINING BALANCE SHEETNONMAJOR SPECIAL REVENUE FUNDSJUNE 30, 2018
Supplemental DIVCA Graton GratonLaw PEG Mitigation Mitigation
Enforcement Fee School LawServices (AB2987) Contribution Enforcement
ASSETSCash and investments 102,985$ 498,482$ -$ 78,223$ Receivables, net:
Taxes - - - - Accounts - 25,660 - -
Advances to other funds - - - -
Total assets 102,985$ 524,142$ -$ 78,223$
LIABILITIESAccounts payable -$ -$ -$ 3,934$ Accrued liabilities - - - - Due to other funds - - - 29,807
Total liabilities - - - 33,741
FUND BALANCESNonspendable - - - - Restricted 102,985 524,142 - - Assigned - - - 44,482
Total fund balances 102,985 524,142 - 44,482
Total liabilities and fund balances 102,985$ 524,142$ -$ 78,223$
F-98
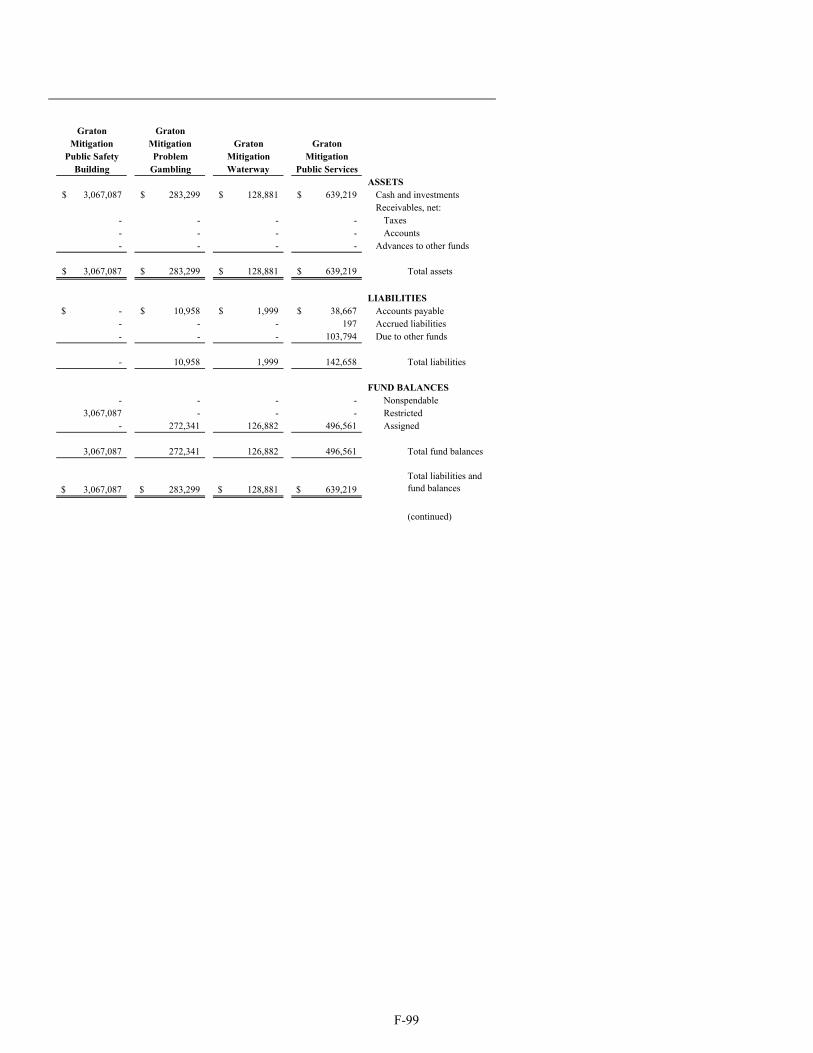
Graton GratonMitigation Mitigation Graton Graton
Public Safety Problem Mitigation MitigationBuilding Gambling Waterway Public Services
ASSETS3,067,087$ 283,299$ 128,881$ 639,219$ Cash and investments
Receivables, net:- - - - Taxes- - - - Accounts- - - - Advances to other funds
3,067,087$ 283,299$ 128,881$ 639,219$ Total assets
LIABILITIES-$ 10,958$ 1,999$ 38,667$ Accounts payable- - - 197 Accrued liabilities- - - 103,794 Due to other funds
- 10,958 1,999 142,658 Total liabilities
FUND BALANCES- - - - Nonspendable
3,067,087 - - - Restricted- 272,341 126,882 496,561 Assigned
3,067,087 272,341 126,882 496,561 Total fund balances
3,067,087$ 283,299$ 128,881$ 639,219$
Total liabilities and fund balances
(continued)
F-99
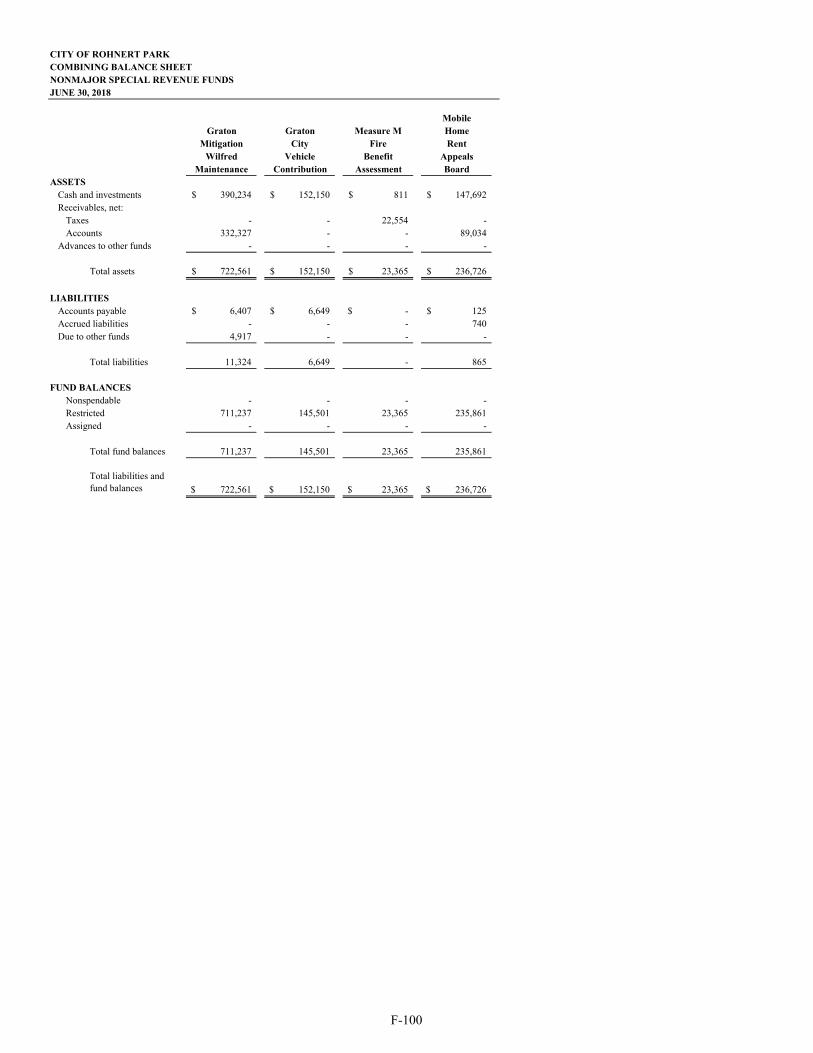
CITY OF ROHNERT PARKCOMBINING BALANCE SHEETNONMAJOR SPECIAL REVENUE FUNDSJUNE 30, 2018
MobileGraton Graton Measure M Home
Mitigation City Fire RentWilfred Vehicle Benefit Appeals
Maintenance Contribution Assessment BoardASSETS
Cash and investments 390,234$ 152,150$ 811$ 147,692$ Receivables, net:
Taxes - - 22,554 - Accounts 332,327 - - 89,034
Advances to other funds - - - -
Total assets 722,561$ 152,150$ 23,365$ 236,726$
LIABILITIESAccounts payable 6,407$ 6,649$ -$ 125$ Accrued liabilities - - - 740 Due to other funds 4,917 - - -
Total liabilities 11,324 6,649 - 865
FUND BALANCESNonspendable - - - - Restricted 711,237 145,501 23,365 235,861 Assigned - - - -
Total fund balances 711,237 145,501 23,365 235,861
Total liabilities and fund balances 722,561$ 152,150$ 23,365$ 236,726$
F-100
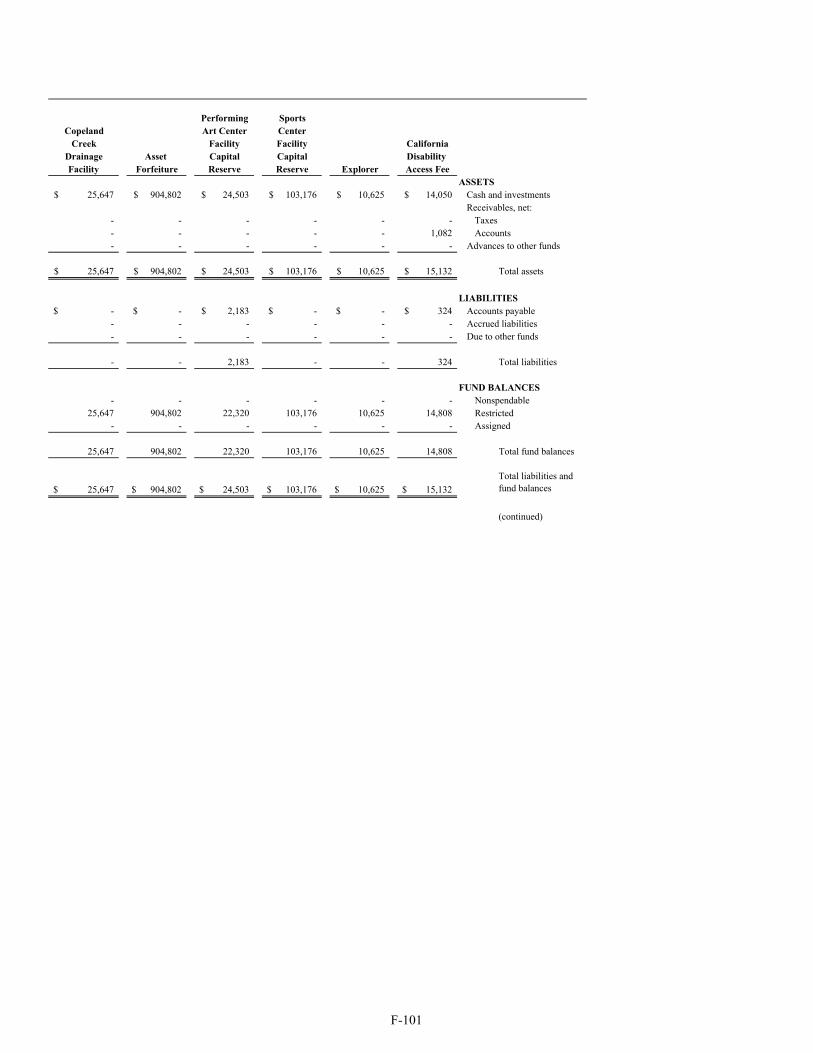
Performing SportsCopeland Art Center Center
Creek Facility Facility CaliforniaDrainage Asset Capital Capital Disability Facility Forfeiture Reserve Reserve Explorer Access Fee
ASSETS25,647$ 904,802$ 24,503$ 103,176$ 10,625$ 14,050$ Cash and investments
Receivables, net:- - - - - - Taxes- - - - - 1,082 Accounts- - - - - - Advances to other funds
25,647$ 904,802$ 24,503$ 103,176$ 10,625$ 15,132$ Total assets
LIABILITIES-$ -$ 2,183$ -$ -$ 324$ Accounts payable- - - - - - Accrued liabilities- - - - - - Due to other funds
- - 2,183 - - 324 Total liabilities
FUND BALANCES- - - - - - Nonspendable
25,647 904,802 22,320 103,176 10,625 14,808 Restricted- - - - - - Assigned
25,647 904,802 22,320 103,176 10,625 14,808 Total fund balances
25,647$ 904,802$ 24,503$ 103,176$ 10,625$ 15,132$
Total liabilities and fund balances
(continued)
F-101
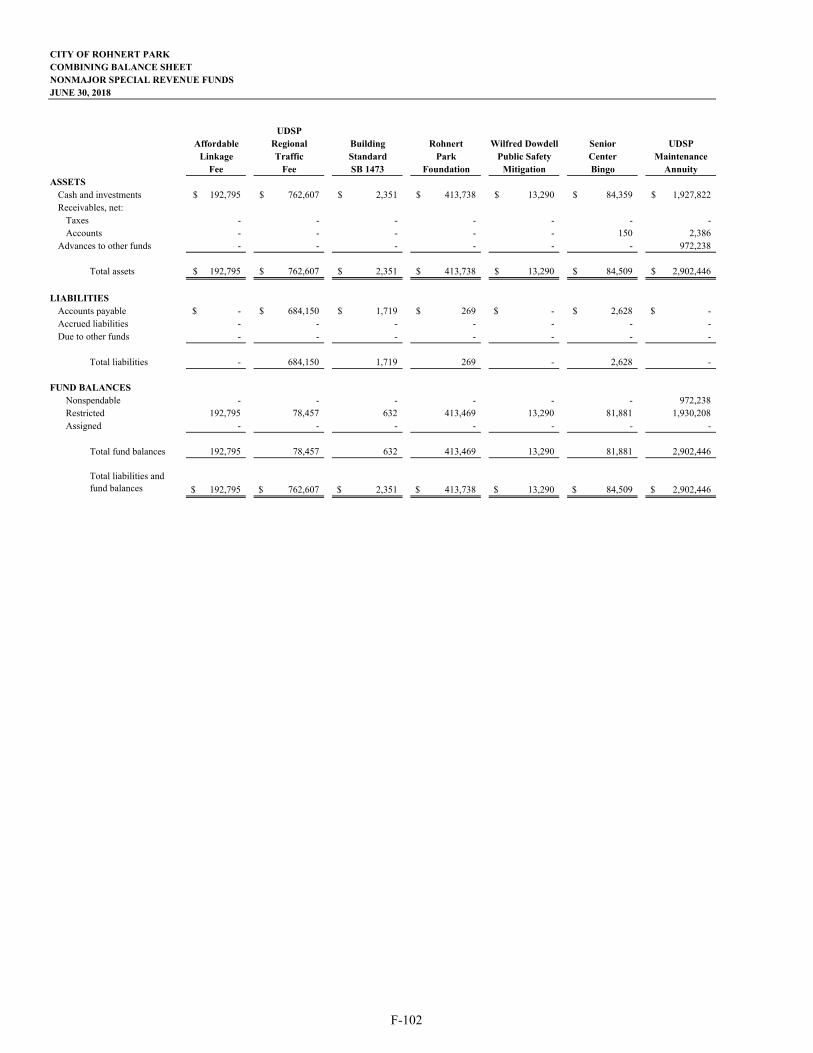
CITY OF ROHNERT PARKCOMBINING BALANCE SHEETNONMAJOR SPECIAL REVENUE FUNDSJUNE 30, 2018
UDSPAffordable Regional Building Rohnert Wilfred Dowdell Senior UDSP
Linkage Traffic Standard Park Public Safety Center MaintenanceFee Fee SB 1473 Foundation Mitigation Bingo Annuity
ASSETSCash and investments 192,795$ 762,607$ 2,351$ 413,738$ 13,290$ 84,359$ 1,927,822$ Receivables, net:
Taxes - - - - - - - Accounts - - - - - 150 2,386
Advances to other funds - - - - - - 972,238
Total assets 192,795$ 762,607$ 2,351$ 413,738$ 13,290$ 84,509$ 2,902,446$
LIABILITIESAccounts payable -$ 684,150$ 1,719$ 269$ -$ 2,628$ -$ Accrued liabilities - - - - - - - Due to other funds - - - - - - -
Total liabilities - 684,150 1,719 269 - 2,628 -
FUND BALANCESNonspendable - - - - - - 972,238 Restricted 192,795 78,457 632 413,469 13,290 81,881 1,930,208 Assigned - - - - - - -
Total fund balances 192,795 78,457 632 413,469 13,290 81,881 2,902,446
Total liabilities and fund balances 192,795$ 762,607$ 2,351$ 413,738$ 13,290$ 84,509$ 2,902,446$
F-102

Graton Graton Affordable CaliforniaMitigation Mitigation Housing Strong Graton South East
Tribe Neighborhood Resident Motion Mitigation SpecificCharity Upgrade Fee Instrumentation Reserve Plan Total
ASSETS280,565$ 1,313,142$ 50,054$ 3,588$ 4,436,277$ 415,376$ 21,387,553$ Cash and investments
Receivables, net:- - - - - - 22,554 Taxes- - - 237 - - 722,001 Accounts- - - - - - 972,238 Advances to other funds
280,565$ 1,313,142$ 50,054$ 3,825$ 4,436,277$ 415,376$ 23,104,346$ Total assets
LIABILITIES280,565$ 1,960$ -$ -$ -$ -$ 1,123,091$ Accounts payable
- - - - - - 937 Accrued liabilities- - - - - - 140,916 Due to other funds
280,565 1,960 - - - - 1,264,944 Total liabilities
FUND BALANCES- - - - - - 972,238 Nonspendable- 1,311,182 50,054 3,825 - 415,376 15,490,621 Restricted- - - - 4,436,277 - 5,376,543 Assigned
- 1,311,182 50,054 3,825 4,436,277 415,376 21,839,402 Total fund balances
280,565$ 1,313,142$ 50,054$ 3,825$ 4,436,277$ 415,376$ 23,104,346$
Total liabilities and fund balances
F-103
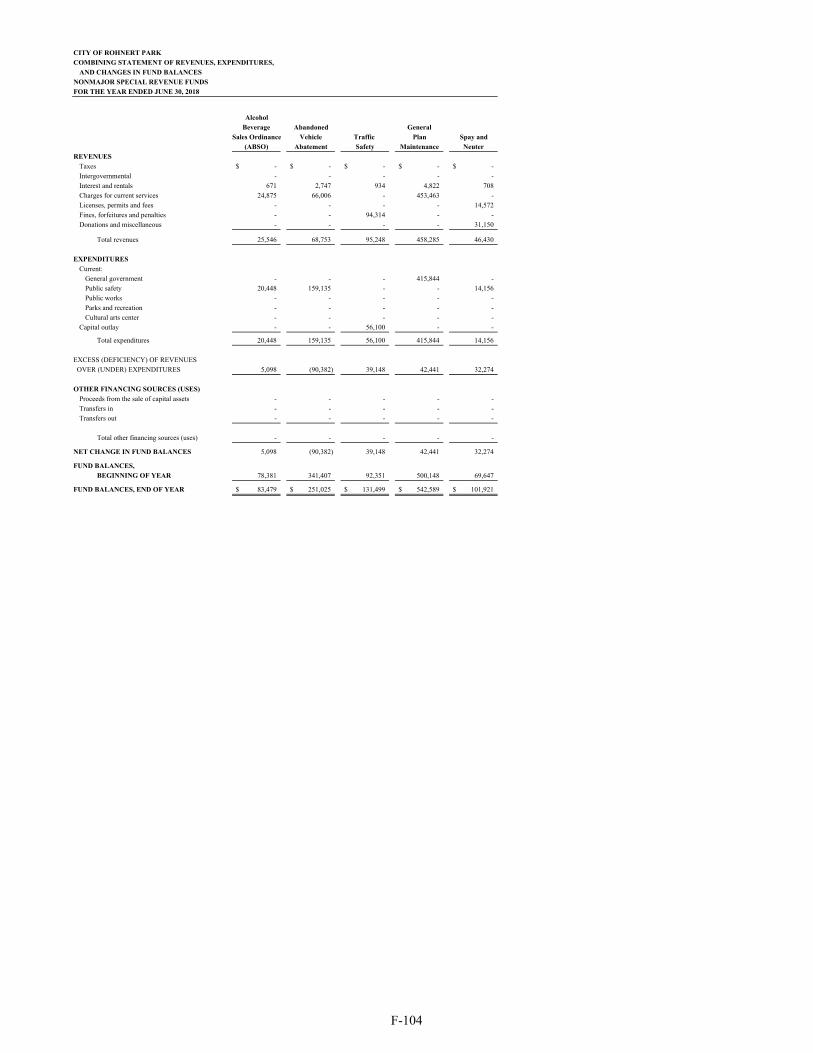
CITY OF ROHNERT PARK
COMBINING STATEMENT OF REVENUES, EXPENDITURES,
AND CHANGES IN FUND BALANCES
NONMAJOR SPECIAL REVENUE FUNDS
FOR THE YEAR ENDED JUNE 30, 2018
Alcohol
Beverage Abandoned General
Sales Ordinance Vehicle Traffic Plan Spay and
(ABSO) Abatement Safety Maintenance Neuter
REVENUES
Taxes -$ -$ -$ -$ -$
Intergovernmental - - - - -
Interest and rentals 671 2,747 934 4,822 708
Charges for current services 24,875 66,006 - 453,463 -
Licenses, permits and fees - - - - 14,572
Fines, forfeitures and penalties - - 94,314 - -
Donations and miscellaneous - - - - 31,150
Total revenues 25,546 68,753 95,248 458,285 46,430
EXPENDITURES
Current:
General government - - - 415,844 -
Public safety 20,448 159,135 - - 14,156
Public works - - - - -
Parks and recreation - - - - -
Cultural arts center - - - - -
Capital outlay - - 56,100 - -
Total expenditures 20,448 159,135 56,100 415,844 14,156
EXCESS (DEFICIENCY) OF REVENUES
OVER (UNDER) EXPENDITURES 5,098 (90,382) 39,148 42,441 32,274
OTHER FINANCING SOURCES (USES)
Proceeds from the sale of capital assets - - - - -
Transfers in - - - - -
Transfers out - - - - -
Total other financing sources (uses) - - - - -
NET CHANGE IN FUND BALANCES 5,098 (90,382) 39,148 42,441 32,274
FUND BALANCES,
BEGINNING OF YEAR 78,381 341,407 92,351 500,148 69,647
FUND BALANCES, END OF YEAR 83,479$ 251,025$ 131,499$ 542,589$ 101,921$
F-104
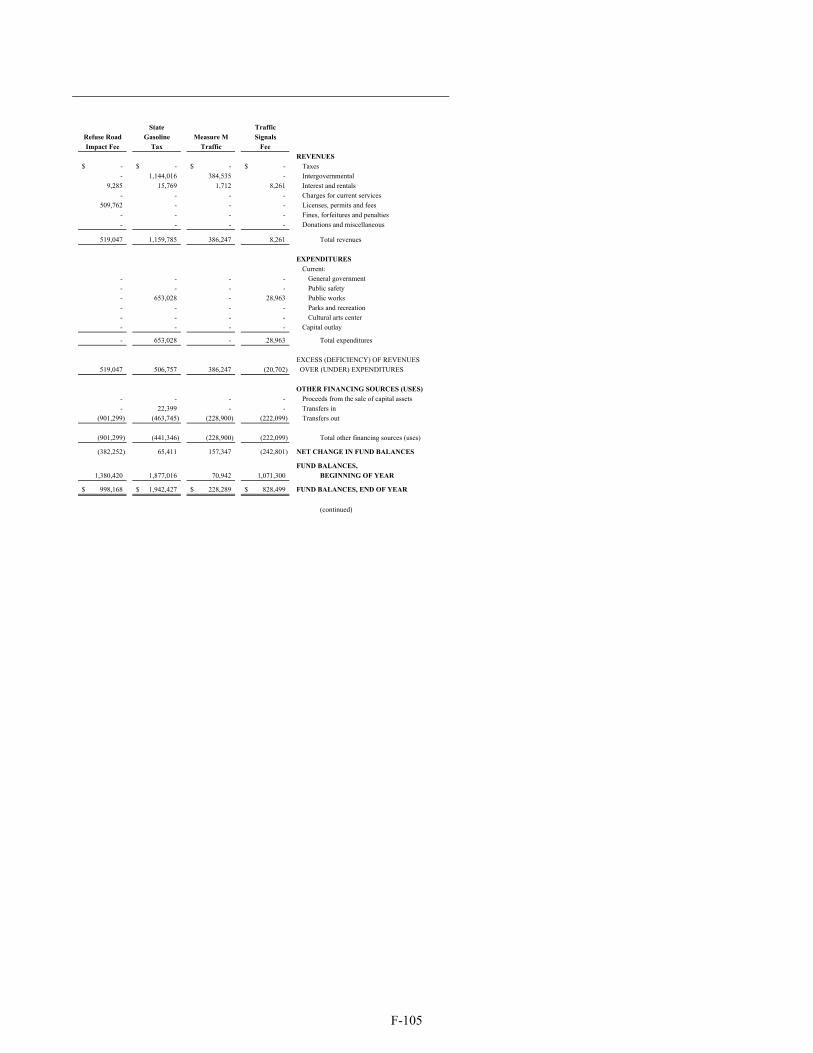
State Traffic
Refuse Road Gasoline Measure M Signals
Impact Fee Tax Traffic Fee
REVENUES
-$ -$ -$ -$ Taxes
- 1,144,016 384,535 - Intergovernmental
9,285 15,769 1,712 8,261 Interest and rentals
- - - - Charges for current services
509,762 - - - Licenses, permits and fees
- - - - Fines, forfeitures and penalties
- - - - Donations and miscellaneous
519,047 1,159,785 386,247 8,261 Total revenues
EXPENDITURES
Current:
- - - - General government
- - - - Public safety
- 653,028 - 28,963 Public works
- - - - Parks and recreation
- - - - Cultural arts center
- - - - Capital outlay
- 653,028 - 28,963 Total expenditures
EXCESS (DEFICIENCY) OF REVENUES
519,047 506,757 386,247 (20,702) OVER (UNDER) EXPENDITURES
OTHER FINANCING SOURCES (USES)
- - - - Proceeds from the sale of capital assets
- 22,399 - - Transfers in
(901,299) (463,745) (228,900) (222,099) Transfers out
(901,299) (441,346) (228,900) (222,099) Total other financing sources (uses)
(382,252) 65,411 157,347 (242,801) NET CHANGE IN FUND BALANCES
FUND BALANCES,
1,380,420 1,877,016 70,942 1,071,300 BEGINNING OF YEAR
998,168$ 1,942,427$ 228,289$ 828,499$ FUND BALANCES, END OF YEAR
(continued)
F-105
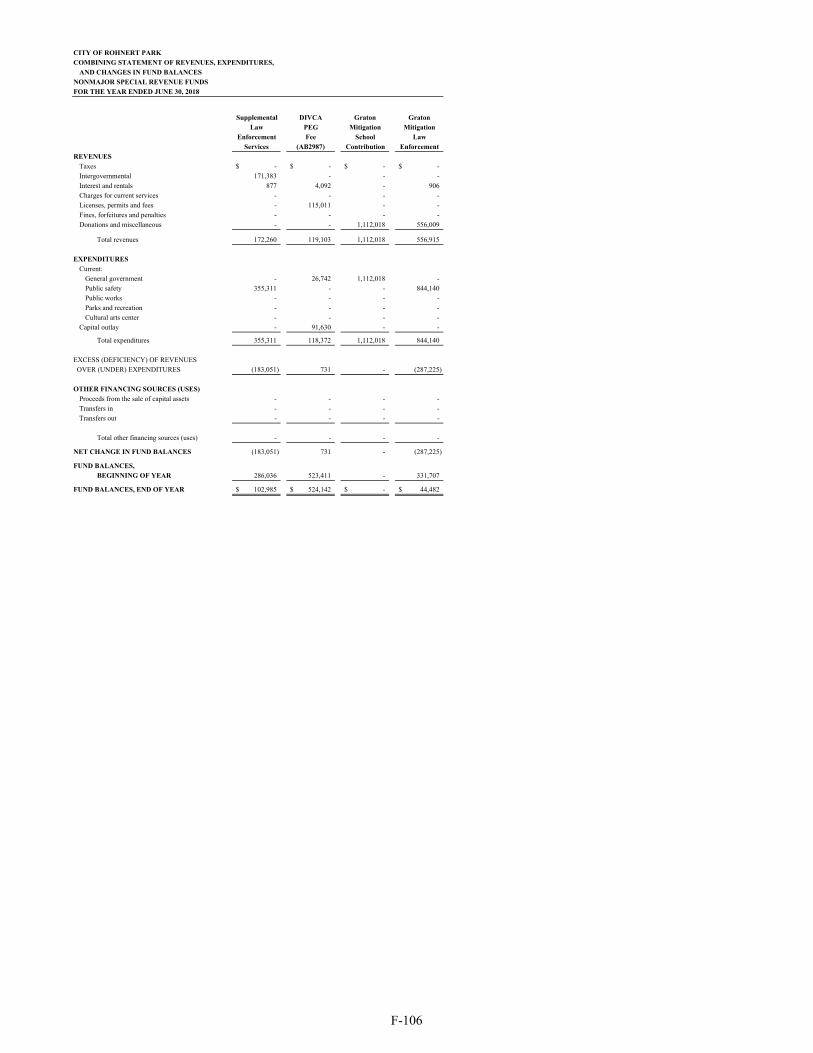
CITY OF ROHNERT PARK
COMBINING STATEMENT OF REVENUES, EXPENDITURES,
AND CHANGES IN FUND BALANCES
NONMAJOR SPECIAL REVENUE FUNDS
FOR THE YEAR ENDED JUNE 30, 2018
Supplemental DIVCA Graton Graton
Law PEG Mitigation Mitigation
Enforcement Fee School Law
Services (AB2987) Contribution Enforcement
REVENUES
Taxes -$ -$ -$ -$
Intergovernmental 171,383 - - -
Interest and rentals 877 4,092 - 906
Charges for current services - - - -
Licenses, permits and fees - 115,011 - -
Fines, forfeitures and penalties - - - -
Donations and miscellaneous - - 1,112,018 556,009
Total revenues 172,260 119,103 1,112,018 556,915
EXPENDITURES
Current:
General government - 26,742 1,112,018 -
Public safety 355,311 - - 844,140
Public works - - - -
Parks and recreation - - - -
Cultural arts center - - - -
Capital outlay - 91,630 - -
Total expenditures 355,311 118,372 1,112,018 844,140
EXCESS (DEFICIENCY) OF REVENUES
OVER (UNDER) EXPENDITURES (183,051) 731 - (287,225)
OTHER FINANCING SOURCES (USES)
Proceeds from the sale of capital assets - - - -
Transfers in - - - -
Transfers out - - - -
Total other financing sources (uses) - - - -
NET CHANGE IN FUND BALANCES (183,051) 731 - (287,225)
FUND BALANCES,
BEGINNING OF YEAR 286,036 523,411 - 331,707
FUND BALANCES, END OF YEAR 102,985$ 524,142$ -$ 44,482$
F-106
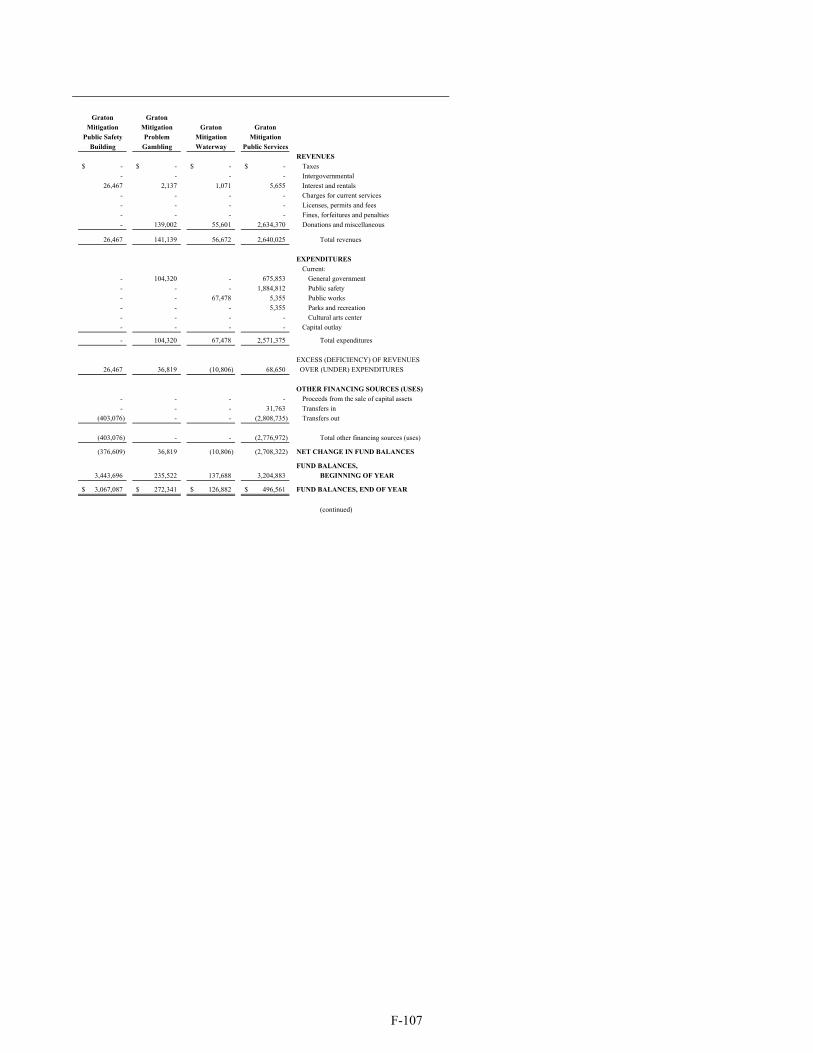
Graton Graton
Mitigation Mitigation Graton Graton
Public Safety Problem Mitigation Mitigation
Building Gambling Waterway Public Services
REVENUES
-$ -$ -$ -$ Taxes
- - - - Intergovernmental
26,467 2,137 1,071 5,655 Interest and rentals
- - - - Charges for current services
- - - - Licenses, permits and fees
- - - - Fines, forfeitures and penalties
- 139,002 55,601 2,634,370 Donations and miscellaneous
26,467 141,139 56,672 2,640,025 Total revenues
EXPENDITURES
Current:
- 104,320 - 675,853 General government
- - - 1,884,812 Public safety
- - 67,478 5,355 Public works
- - - 5,355 Parks and recreation
- - - - Cultural arts center
- - - - Capital outlay
- 104,320 67,478 2,571,375 Total expenditures
EXCESS (DEFICIENCY) OF REVENUES
26,467 36,819 (10,806) 68,650 OVER (UNDER) EXPENDITURES
OTHER FINANCING SOURCES (USES)
- - - - Proceeds from the sale of capital assets
- - - 31,763 Transfers in
(403,076) - - (2,808,735) Transfers out
(403,076) - - (2,776,972) Total other financing sources (uses)
(376,609) 36,819 (10,806) (2,708,322) NET CHANGE IN FUND BALANCES
FUND BALANCES,
3,443,696 235,522 137,688 3,204,883 BEGINNING OF YEAR
3,067,087$ 272,341$ 126,882$ 496,561$ FUND BALANCES, END OF YEAR
(continued)
F-107
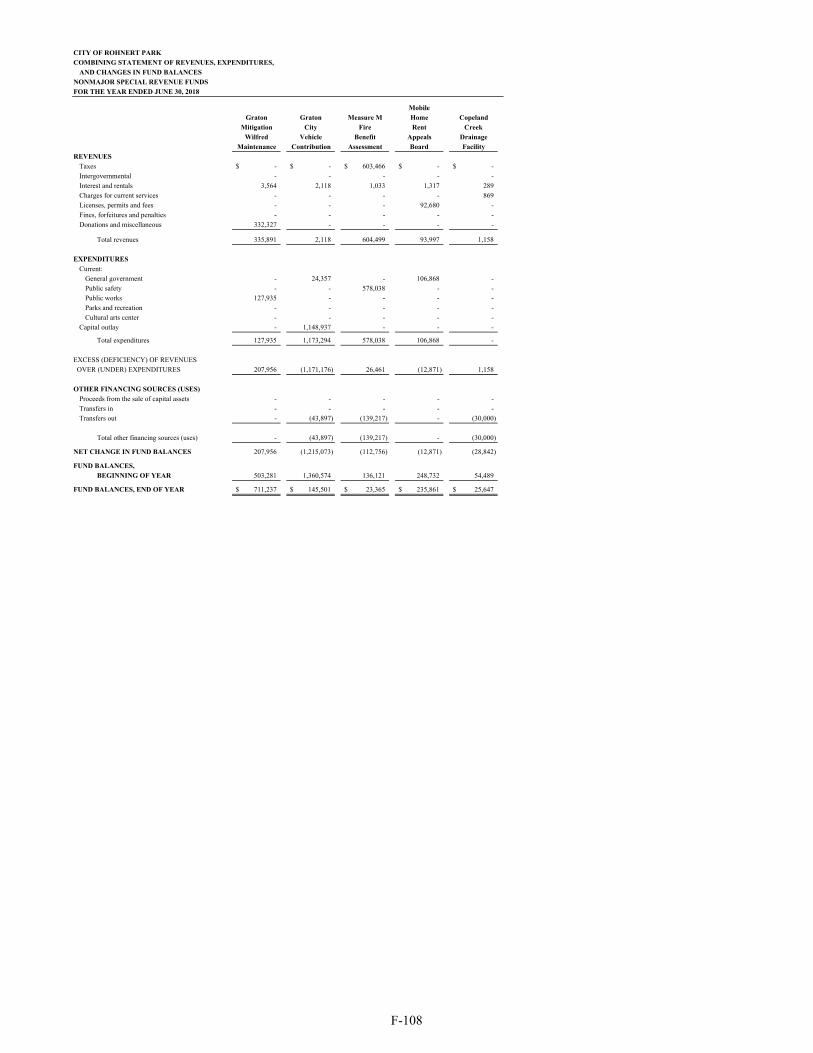
CITY OF ROHNERT PARK
COMBINING STATEMENT OF REVENUES, EXPENDITURES,
AND CHANGES IN FUND BALANCES
NONMAJOR SPECIAL REVENUE FUNDS
FOR THE YEAR ENDED JUNE 30, 2018
Mobile
Graton Graton Measure M Home Copeland
Mitigation City Fire Rent Creek
Wilfred Vehicle Benefit Appeals Drainage
Maintenance Contribution Assessment Board Facility
REVENUES
Taxes -$ -$ 603,466$ -$ -$
Intergovernmental - - - - -
Interest and rentals 3,564 2,118 1,033 1,317 289
Charges for current services - - - - 869
Licenses, permits and fees - - - 92,680 -
Fines, forfeitures and penalties - - - - -
Donations and miscellaneous 332,327 - - - -
Total revenues 335,891 2,118 604,499 93,997 1,158
EXPENDITURES
Current:
General government - 24,357 - 106,868 -
Public safety - - 578,038 - -
Public works 127,935 - - - -
Parks and recreation - - - - -
Cultural arts center - - - - -
Capital outlay - 1,148,937 - - -
Total expenditures 127,935 1,173,294 578,038 106,868 -
EXCESS (DEFICIENCY) OF REVENUES
OVER (UNDER) EXPENDITURES 207,956 (1,171,176) 26,461 (12,871) 1,158
OTHER FINANCING SOURCES (USES)
Proceeds from the sale of capital assets - - - - -
Transfers in - - - - -
Transfers out - (43,897) (139,217) - (30,000)
Total other financing sources (uses) - (43,897) (139,217) - (30,000)
NET CHANGE IN FUND BALANCES 207,956 (1,215,073) (112,756) (12,871) (28,842)
FUND BALANCES,
BEGINNING OF YEAR 503,281 1,360,574 136,121 248,732 54,489
FUND BALANCES, END OF YEAR 711,237$ 145,501$ 23,365$ 235,861$ 25,647$
F-108
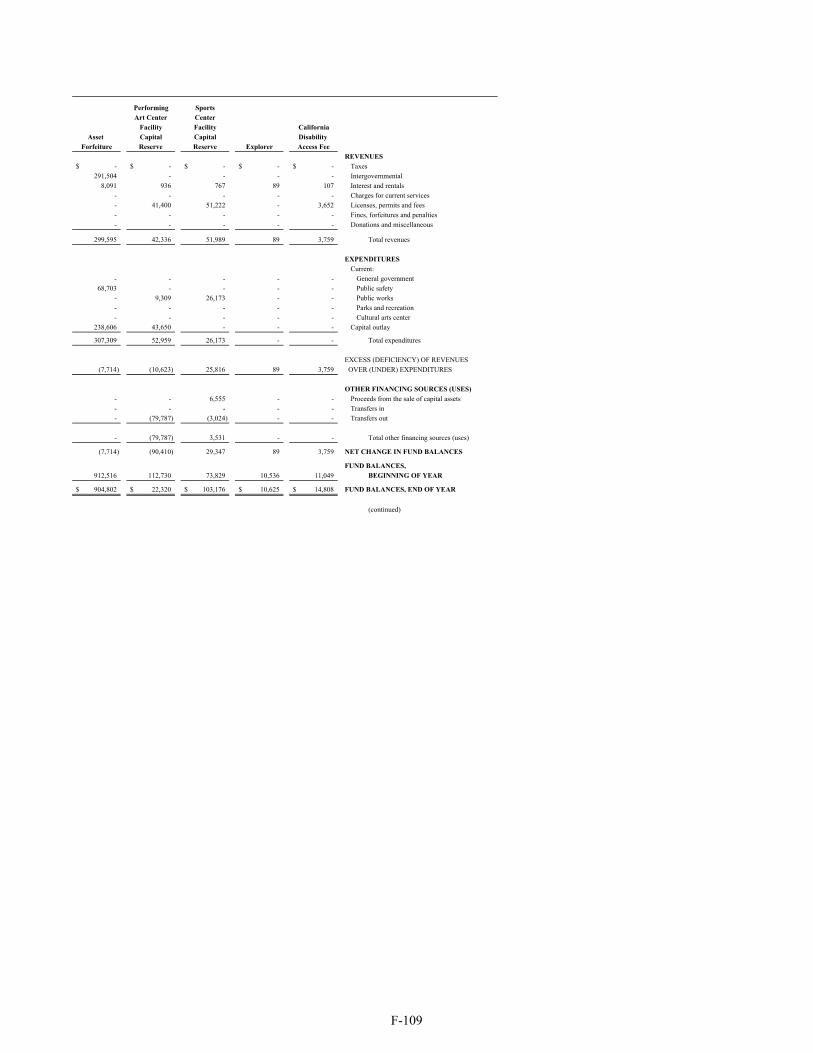
Performing Sports
Art Center Center
Facility Facility California
Asset Capital Capital Disability
Forfeiture Reserve Reserve Explorer Access Fee
REVENUES
-$ -$ -$ -$ -$ Taxes
291,504 - - - - Intergovernmental
8,091 936 767 89 107 Interest and rentals
- - - - - Charges for current services
- 41,400 51,222 - 3,652 Licenses, permits and fees
- - - - - Fines, forfeitures and penalties
- - - - - Donations and miscellaneous
299,595 42,336 51,989 89 3,759 Total revenues
EXPENDITURES
Current:
- - - - - General government
68,703 - - - - Public safety
- 9,309 26,173 - - Public works
- - - - - Parks and recreation
- - - - - Cultural arts center
238,606 43,650 - - - Capital outlay
307,309 52,959 26,173 - - Total expenditures
EXCESS (DEFICIENCY) OF REVENUES
(7,714) (10,623) 25,816 89 3,759 OVER (UNDER) EXPENDITURES
OTHER FINANCING SOURCES (USES)
- - 6,555 - - Proceeds from the sale of capital assets
- - - - - Transfers in
- (79,787) (3,024) - - Transfers out
- (79,787) 3,531 - - Total other financing sources (uses)
(7,714) (90,410) 29,347 89 3,759 NET CHANGE IN FUND BALANCES
FUND BALANCES,
912,516 112,730 73,829 10,536 11,049 BEGINNING OF YEAR
904,802$ 22,320$ 103,176$ 10,625$ 14,808$ FUND BALANCES, END OF YEAR
(continued)
F-109
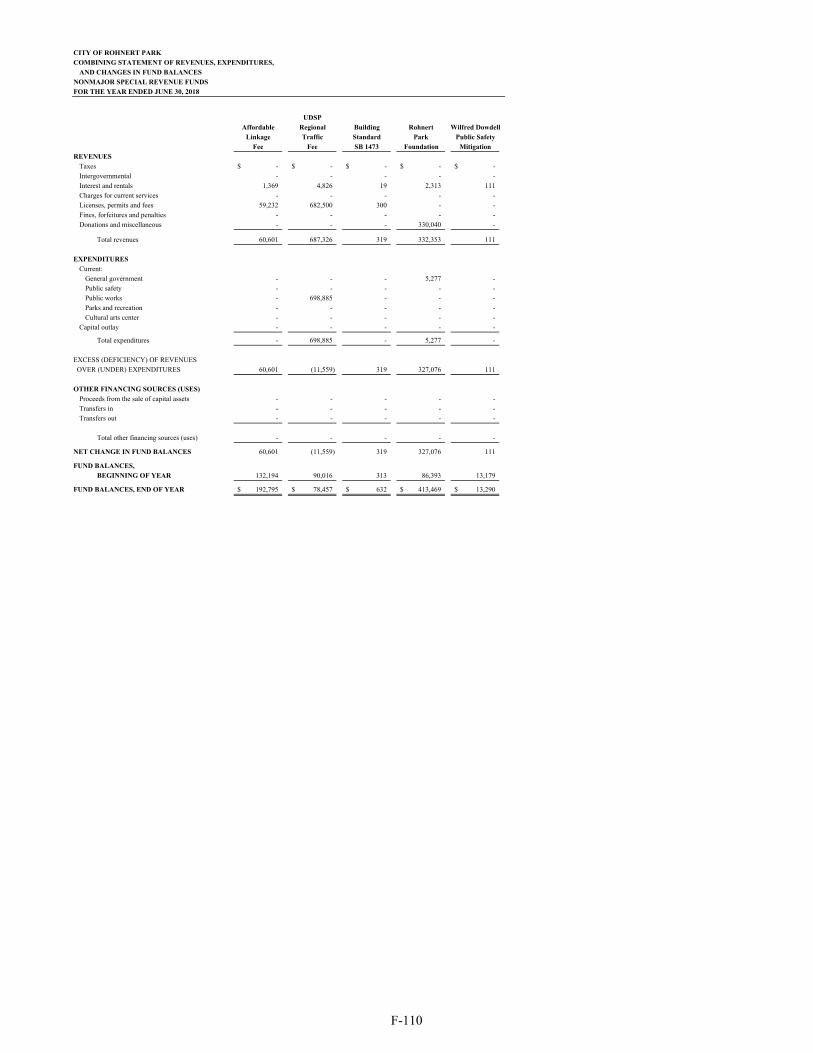
CITY OF ROHNERT PARK
COMBINING STATEMENT OF REVENUES, EXPENDITURES,
AND CHANGES IN FUND BALANCES
NONMAJOR SPECIAL REVENUE FUNDS
FOR THE YEAR ENDED JUNE 30, 2018
UDSP
Affordable Regional Building Rohnert Wilfred Dowdell
Linkage Traffic Standard Park Public Safety
Fee Fee SB 1473 Foundation Mitigation
REVENUES
Taxes -$ -$ -$ -$ -$
Intergovernmental - - - - -
Interest and rentals 1,369 4,826 19 2,313 111
Charges for current services - - - - -
Licenses, permits and fees 59,232 682,500 300 - -
Fines, forfeitures and penalties - - - - -
Donations and miscellaneous - - - 330,040 -
Total revenues 60,601 687,326 319 332,353 111
EXPENDITURES
Current:
General government - - - 5,277 -
Public safety - - - - -
Public works - 698,885 - - -
Parks and recreation - - - - -
Cultural arts center - - - - -
Capital outlay - - - - -
Total expenditures - 698,885 - 5,277 -
EXCESS (DEFICIENCY) OF REVENUES
OVER (UNDER) EXPENDITURES 60,601 (11,559) 319 327,076 111
OTHER FINANCING SOURCES (USES)
Proceeds from the sale of capital assets - - - - -
Transfers in - - - - -
Transfers out - - - - -
Total other financing sources (uses) - - - - -
NET CHANGE IN FUND BALANCES 60,601 (11,559) 319 327,076 111
FUND BALANCES,
BEGINNING OF YEAR 132,194 90,016 313 86,393 13,179
FUND BALANCES, END OF YEAR 192,795$ 78,457$ 632$ 413,469$ 13,290$
F-110
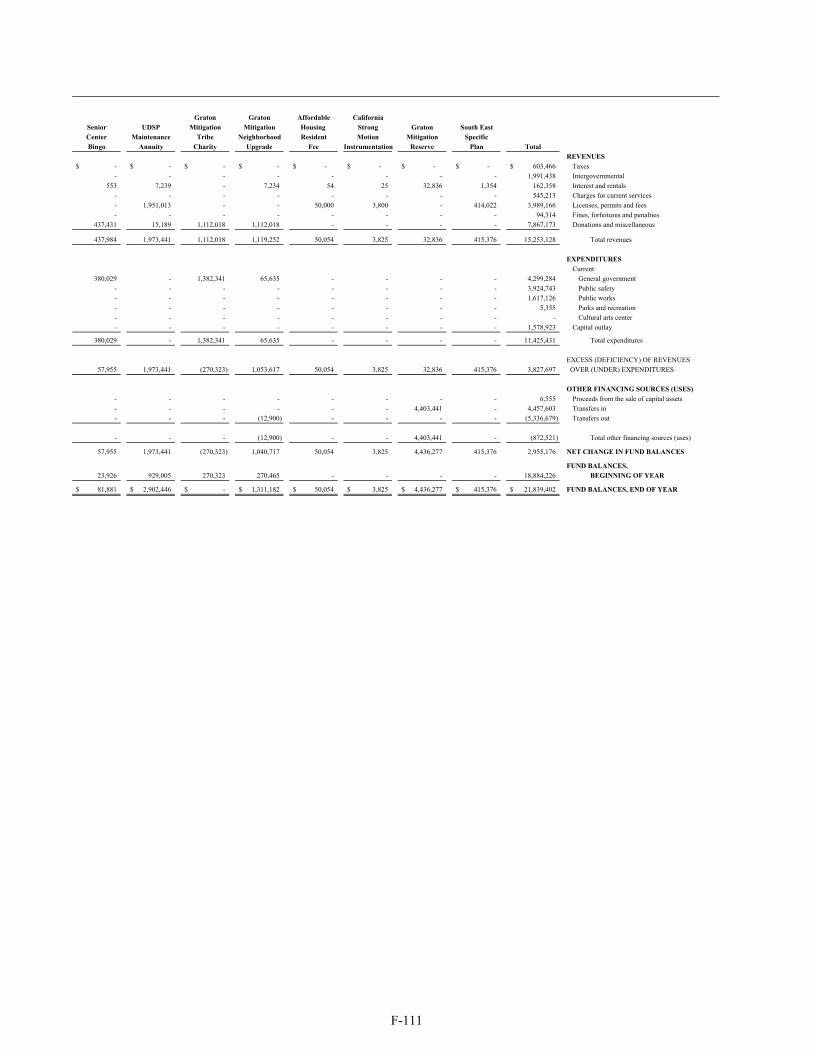
Graton Graton Affordable California
Senior UDSP Mitigation Mitigation Housing Strong Graton South East
Center Maintenance Tribe Neighborhood Resident Motion Mitigation Specific
Bingo Annuity Charity Upgrade Fee Instrumentation Reserve Plan Total
REVENUES
-$ -$ -$ -$ -$ -$ -$ -$ 603,466$ Taxes
- - - - - - - - 1,991,438 Intergovernmental
553 7,239 - 7,234 54 25 32,836 1,354 162,358 Interest and rentals
- - - - - - - - 545,213 Charges for current services
- 1,951,013 - - 50,000 3,800 - 414,022 3,989,166 Licenses, permits and fees
- - - - - - - - 94,314 Fines, forfeitures and penalties
437,431 15,189 1,112,018 1,112,018 - - - - 7,867,173 Donations and miscellaneous
437,984 1,973,441 1,112,018 1,119,252 50,054 3,825 32,836 415,376 15,253,128 Total revenues
EXPENDITURES
Current:
380,029 - 1,382,341 65,635 - - - - 4,299,284 General government
- - - - - - - - 3,924,743 Public safety
- - - - - - - - 1,617,126 Public works
- - - - - - - - 5,355 Parks and recreation
- - - - - - - - - Cultural arts center
- - - - - - - - 1,578,923 Capital outlay
380,029 - 1,382,341 65,635 - - - - 11,425,431 Total expenditures
EXCESS (DEFICIENCY) OF REVENUES
57,955 1,973,441 (270,323) 1,053,617 50,054 3,825 32,836 415,376 3,827,697 OVER (UNDER) EXPENDITURES
OTHER FINANCING SOURCES (USES)
- - - - - - - - 6,555 Proceeds from the sale of capital assets
- - - - - - 4,403,441 - 4,457,603 Transfers in
- - - (12,900) - - - - (5,336,679) Transfers out
- - - (12,900) - - 4,403,441 - (872,521) Total other financing sources (uses)
57,955 1,973,441 (270,323) 1,040,717 50,054 3,825 4,436,277 415,376 2,955,176 NET CHANGE IN FUND BALANCES
FUND BALANCES,
23,926 929,005 270,323 270,465 - - - - 18,884,226 BEGINNING OF YEAR
81,881$ 2,902,446$ -$ 1,311,182$ 50,054$ 3,825$ 4,436,277$ 415,376$ 21,839,402$ FUND BALANCES, END OF YEAR
F-111

CITY OF ROHNERT PARK
BUDGETARY COMPARISON SCHEDULEALCOHOL BEVERAGE SALES ORDINANCE (ABSO) SPECIAL REVENUE FUNDFOR THE YEAR ENDED JUNE 30, 2018
Variance withFinal Budget
Original Final Actual PositiveBudget Budget Amount (Negative)
REVENUESInterest and rentals -$ -$ 671$ 671$ Charges for current services 25,000 25,000 24,875 (125)
Total revenues 25,000 25,000 25,546 546
EXPENDITURESCurrent:
Public safety 41,787 41,787 20,448 21,339
NET CHANGE IN FUND BALANCE (16,787)$ (16,787)$ 5,098 21,885$
FUND BALANCE, BEGINNING OF YEAR 78,381
FUND BALANCE, END OF YEAR 83,479$
F-112
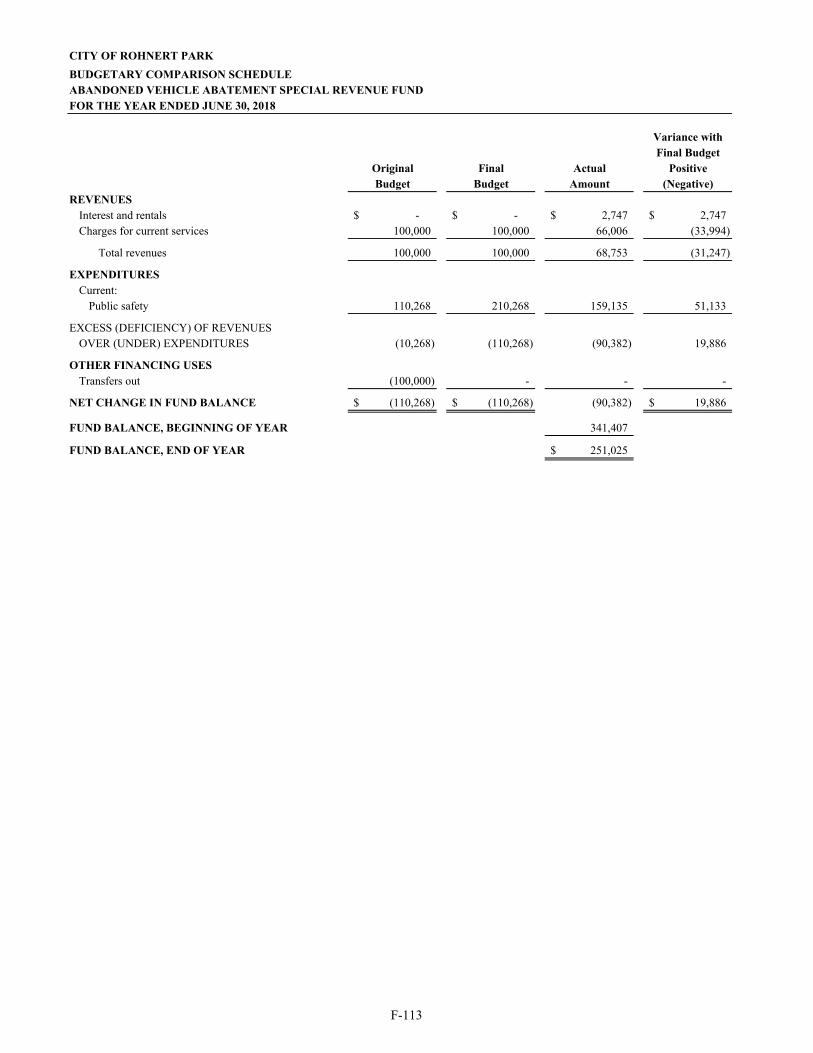
CITY OF ROHNERT PARK
BUDGETARY COMPARISON SCHEDULEABANDONED VEHICLE ABATEMENT SPECIAL REVENUE FUNDFOR THE YEAR ENDED JUNE 30, 2018
Variance withFinal Budget
Original Final Actual PositiveBudget Budget Amount (Negative)
REVENUESInterest and rentals -$ -$ 2,747$ 2,747$ Charges for current services 100,000 100,000 66,006 (33,994)
Total revenues 100,000 100,000 68,753 (31,247)
EXPENDITURESCurrent:
Public safety 110,268 210,268 159,135 51,133
EXCESS (DEFICIENCY) OF REVENUESOVER (UNDER) EXPENDITURES (10,268) (110,268) (90,382) 19,886
OTHER FINANCING USESTransfers out (100,000) - - -
NET CHANGE IN FUND BALANCE (110,268)$ (110,268)$ (90,382) 19,886$
FUND BALANCE, BEGINNING OF YEAR 341,407
FUND BALANCE, END OF YEAR 251,025$
F-113
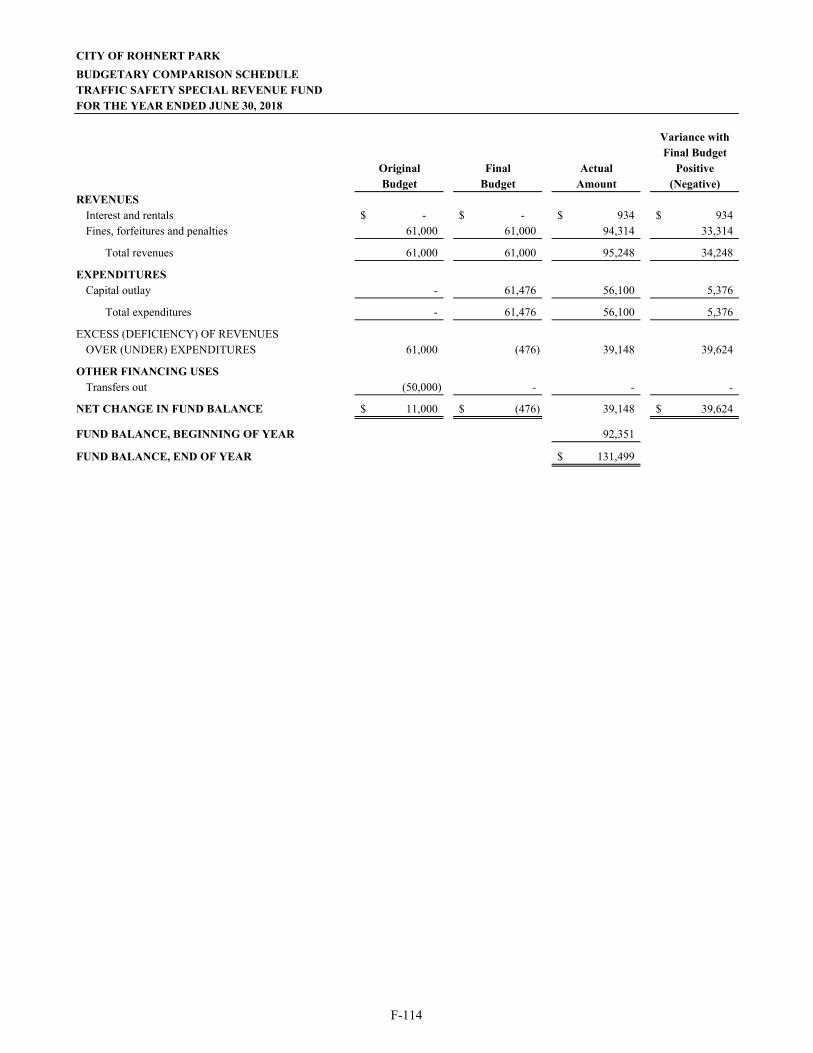
CITY OF ROHNERT PARK
BUDGETARY COMPARISON SCHEDULETRAFFIC SAFETY SPECIAL REVENUE FUNDFOR THE YEAR ENDED JUNE 30, 2018
Variance withFinal Budget
Original Final Actual PositiveBudget Budget Amount (Negative)
REVENUESInterest and rentals -$ -$ 934$ 934$ Fines, forfeitures and penalties 61,000 61,000 94,314 33,314
Total revenues 61,000 61,000 95,248 34,248
EXPENDITURESCapital outlay - 61,476 56,100 5,376
Total expenditures - 61,476 56,100 5,376
EXCESS (DEFICIENCY) OF REVENUESOVER (UNDER) EXPENDITURES 61,000 (476) 39,148 39,624
OTHER FINANCING USESTransfers out (50,000) - - -
NET CHANGE IN FUND BALANCE 11,000$ (476)$ 39,148 39,624$
FUND BALANCE, BEGINNING OF YEAR 92,351
FUND BALANCE, END OF YEAR 131,499$
F-114

CITY OF ROHNERT PARK
BUDGETARY COMPARISON SCHEDULEGENERAL PLAN MAINTENANCE SPECIAL REVENUE FUNDFOR THE YEAR ENDED JUNE 30, 2018
Variance withFinal Budget
Original Final Actual PositiveBudget Budget Amount (Negative)
REVENUESInterest and rentals -$ -$ 4,822$ 4,822$ Charges for current services 489,273 489,273 453,463 (35,810)
Total revenues 489,273 489,273 458,285 (30,988)
EXPENDITURESCurrent:
General government 1,000,000 1,000,000 415,844 584,156 NET CHANGE IN FUND BALANCE (510,727)$ (510,727)$ 42,441 553,168$
FUND BALANCE, BEGINNING OF YEAR 500,148
FUND BALANCE, END OF YEAR 542,589$
F-115
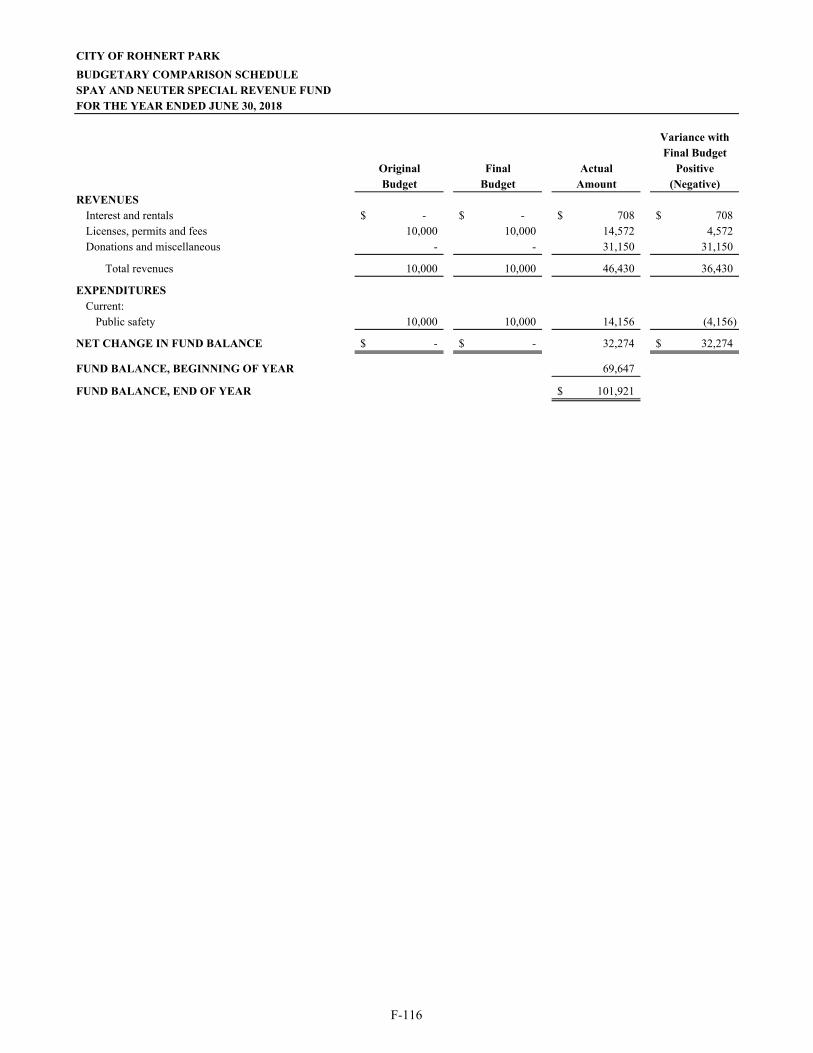
CITY OF ROHNERT PARK
BUDGETARY COMPARISON SCHEDULESPAY AND NEUTER SPECIAL REVENUE FUNDFOR THE YEAR ENDED JUNE 30, 2018
Variance withFinal Budget
Original Final Actual PositiveBudget Budget Amount (Negative)
REVENUESInterest and rentals -$ -$ 708$ 708$ Licenses, permits and fees 10,000 10,000 14,572 4,572 Donations and miscellaneous - - 31,150 31,150
Total revenues 10,000 10,000 46,430 36,430
EXPENDITURESCurrent:
Public safety 10,000 10,000 14,156 (4,156) NET CHANGE IN FUND BALANCE -$ -$ 32,274 32,274$
FUND BALANCE, BEGINNING OF YEAR 69,647
FUND BALANCE, END OF YEAR 101,921$
F-116
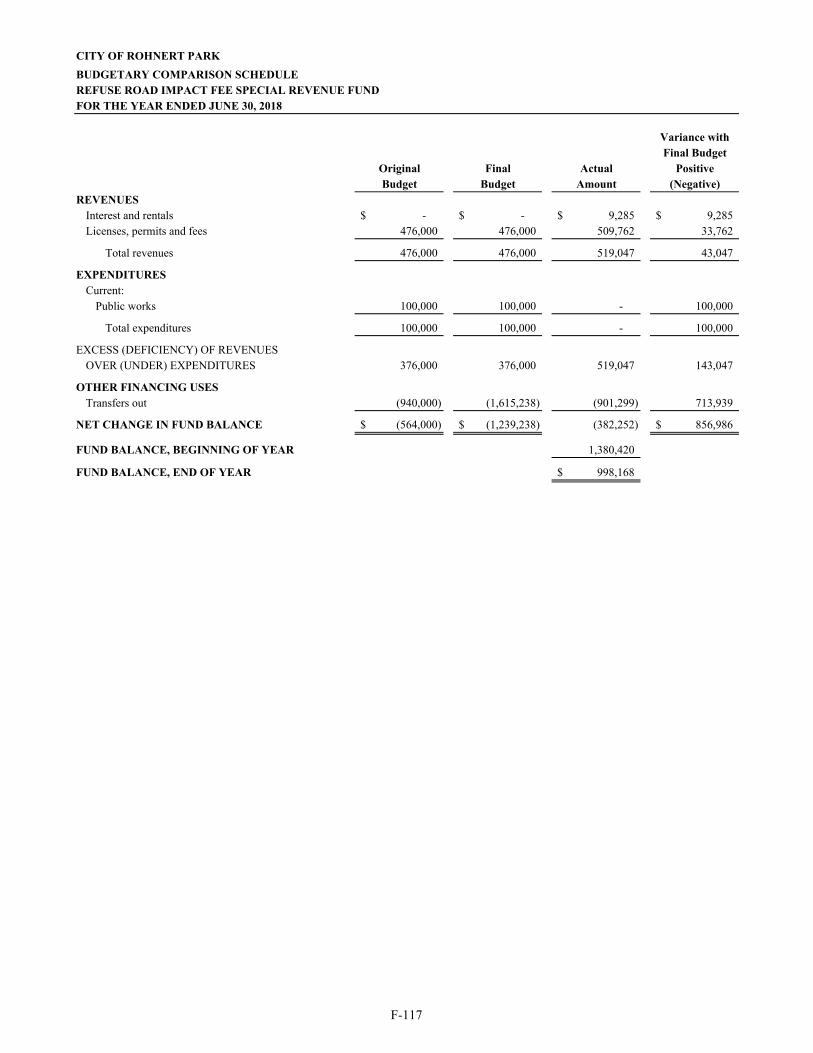
CITY OF ROHNERT PARK
BUDGETARY COMPARISON SCHEDULEREFUSE ROAD IMPACT FEE SPECIAL REVENUE FUNDFOR THE YEAR ENDED JUNE 30, 2018
Variance withFinal Budget
Original Final Actual PositiveBudget Budget Amount (Negative)
REVENUESInterest and rentals -$ -$ 9,285$ 9,285$ Licenses, permits and fees 476,000 476,000 509,762 33,762
Total revenues 476,000 476,000 519,047 43,047
EXPENDITURESCurrent:
Public works 100,000 100,000 - 100,000
Total expenditures 100,000 100,000 - 100,000
EXCESS (DEFICIENCY) OF REVENUESOVER (UNDER) EXPENDITURES 376,000 376,000 519,047 143,047
OTHER FINANCING USESTransfers out (940,000) (1,615,238) (901,299) 713,939
NET CHANGE IN FUND BALANCE (564,000)$ (1,239,238)$ (382,252) 856,986$
FUND BALANCE, BEGINNING OF YEAR 1,380,420
FUND BALANCE, END OF YEAR 998,168$
F-117
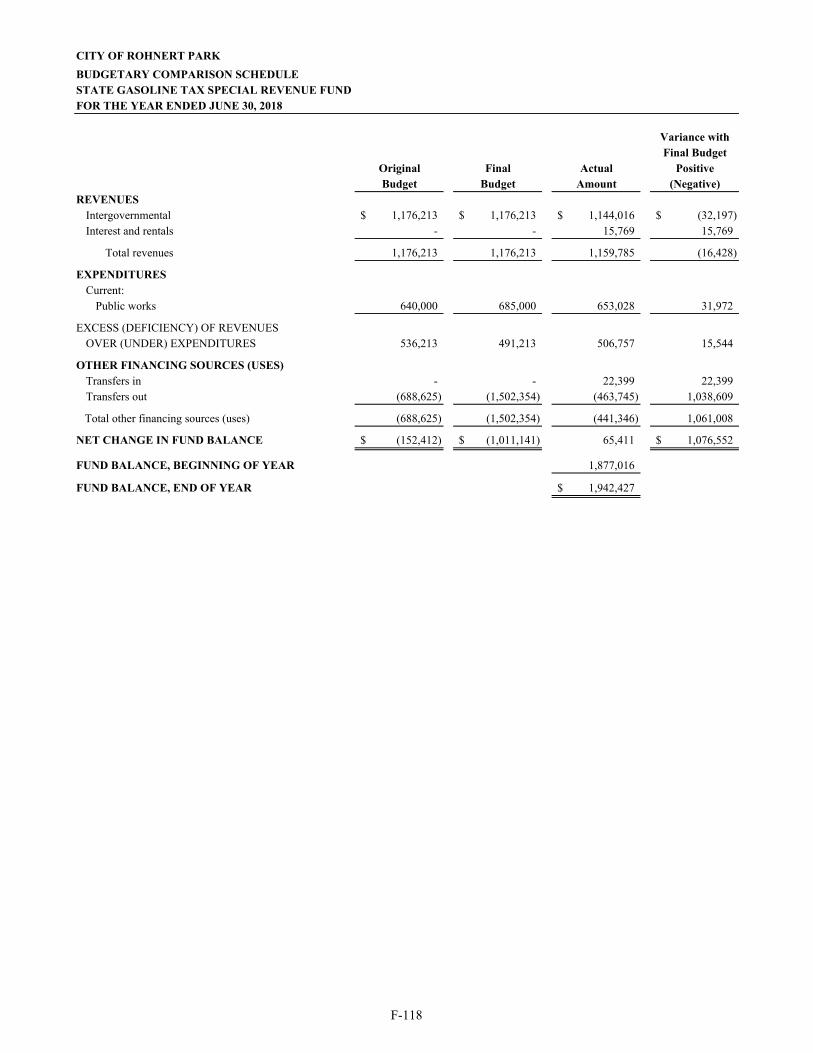
CITY OF ROHNERT PARK
BUDGETARY COMPARISON SCHEDULESTATE GASOLINE TAX SPECIAL REVENUE FUNDFOR THE YEAR ENDED JUNE 30, 2018
Variance withFinal Budget
Original Final Actual PositiveBudget Budget Amount (Negative)
REVENUESIntergovernmental 1,176,213$ 1,176,213$ 1,144,016$ (32,197)$ Interest and rentals - - 15,769 15,769
Total revenues 1,176,213 1,176,213 1,159,785 (16,428)
EXPENDITURESCurrent:
Public works 640,000 685,000 653,028 31,972
EXCESS (DEFICIENCY) OF REVENUESOVER (UNDER) EXPENDITURES 536,213 491,213 506,757 15,544
OTHER FINANCING SOURCES (USES)Transfers in - - 22,399 22,399 Transfers out (688,625) (1,502,354) (463,745) 1,038,609
Total other financing sources (uses) (688,625) (1,502,354) (441,346) 1,061,008
NET CHANGE IN FUND BALANCE (152,412)$ (1,011,141)$ 65,411 1,076,552$
FUND BALANCE, BEGINNING OF YEAR 1,877,016
FUND BALANCE, END OF YEAR 1,942,427$
F-118
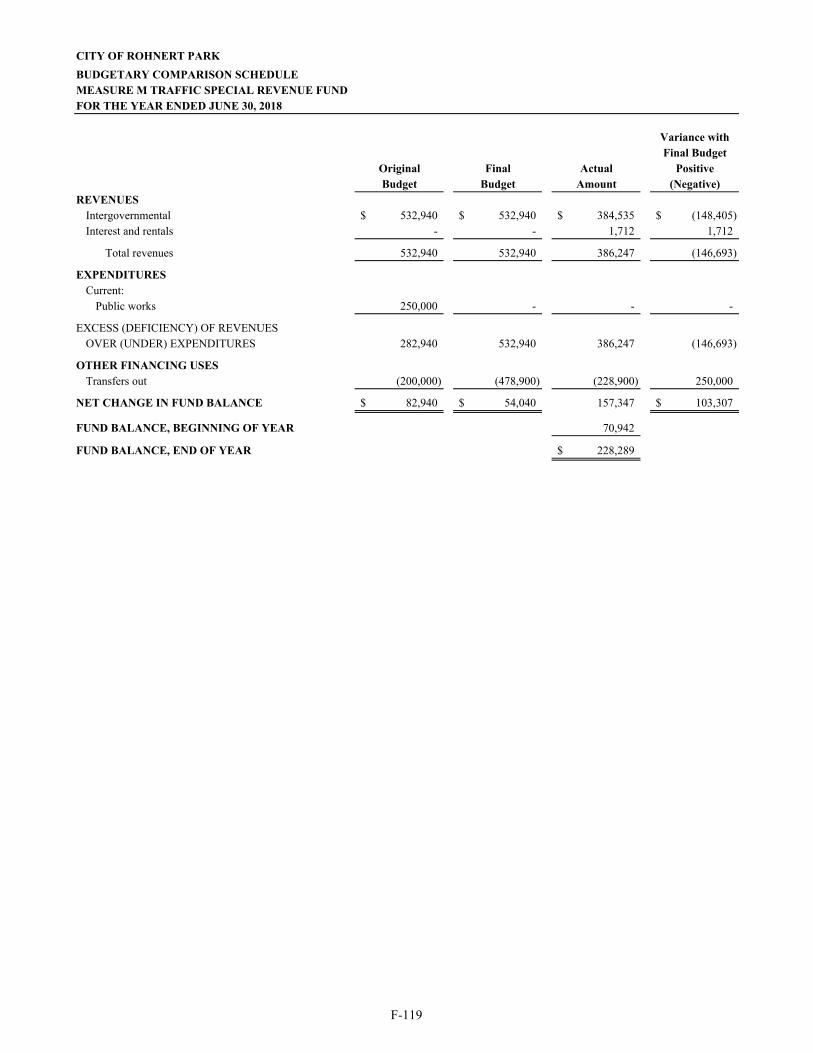
CITY OF ROHNERT PARK
BUDGETARY COMPARISON SCHEDULEMEASURE M TRAFFIC SPECIAL REVENUE FUNDFOR THE YEAR ENDED JUNE 30, 2018
Variance withFinal Budget
Original Final Actual PositiveBudget Budget Amount (Negative)
REVENUESIntergovernmental 532,940$ 532,940$ 384,535$ (148,405)$ Interest and rentals - - 1,712 1,712
Total revenues 532,940 532,940 386,247 (146,693)
EXPENDITURESCurrent:
Public works 250,000 - - -
EXCESS (DEFICIENCY) OF REVENUESOVER (UNDER) EXPENDITURES 282,940 532,940 386,247 (146,693)
OTHER FINANCING USESTransfers out (200,000) (478,900) (228,900) 250,000
NET CHANGE IN FUND BALANCE 82,940$ 54,040$ 157,347 103,307$
FUND BALANCE, BEGINNING OF YEAR 70,942
FUND BALANCE, END OF YEAR 228,289$
F-119
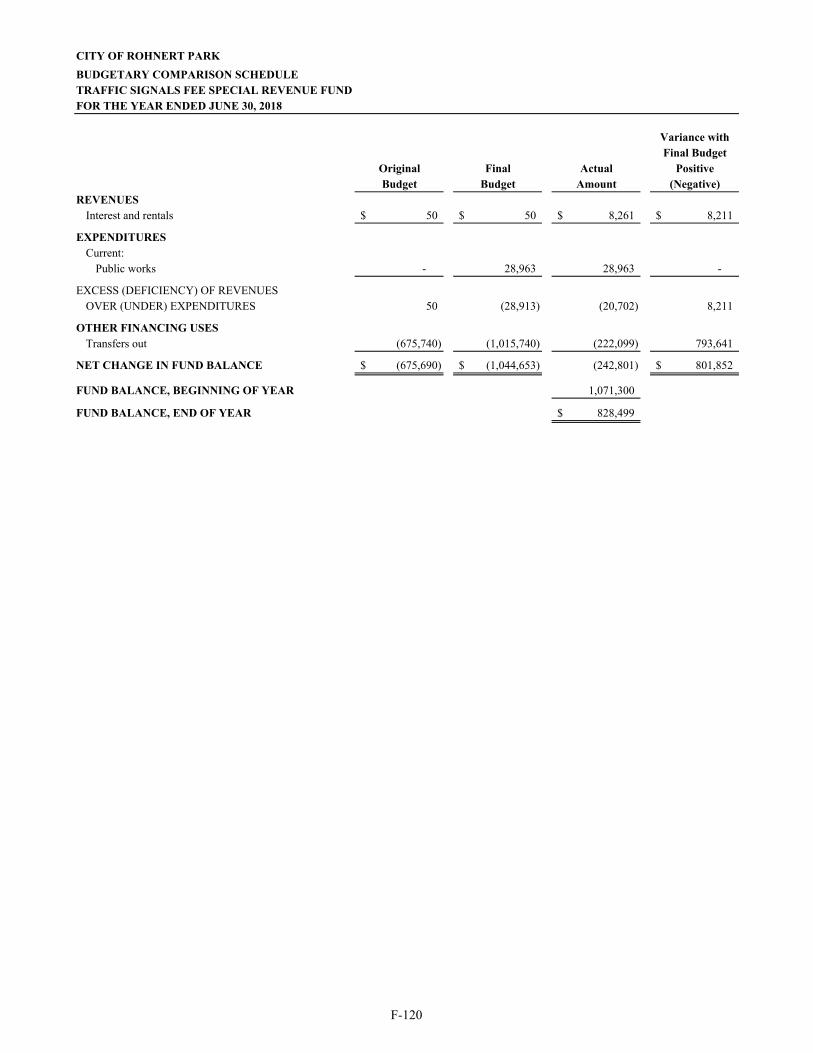
CITY OF ROHNERT PARK
BUDGETARY COMPARISON SCHEDULETRAFFIC SIGNALS FEE SPECIAL REVENUE FUNDFOR THE YEAR ENDED JUNE 30, 2018
Variance withFinal Budget
Original Final Actual PositiveBudget Budget Amount (Negative)
REVENUESInterest and rentals 50$ 50$ 8,261$ 8,211$
EXPENDITURESCurrent:
Public works - 28,963 28,963 -
EXCESS (DEFICIENCY) OF REVENUESOVER (UNDER) EXPENDITURES 50 (28,913) (20,702) 8,211
OTHER FINANCING USESTransfers out (675,740) (1,015,740) (222,099) 793,641
NET CHANGE IN FUND BALANCE (675,690)$ (1,044,653)$ (242,801) 801,852$
FUND BALANCE, BEGINNING OF YEAR 1,071,300
FUND BALANCE, END OF YEAR 828,499$
F-120
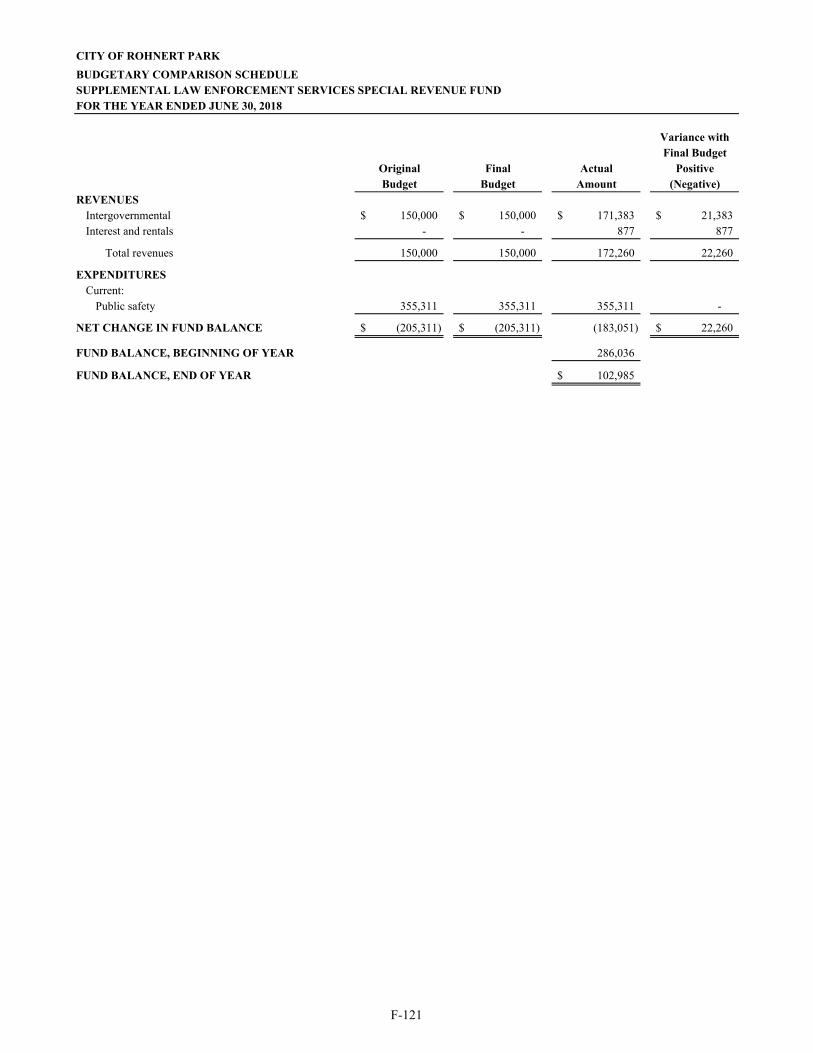
CITY OF ROHNERT PARK
BUDGETARY COMPARISON SCHEDULESUPPLEMENTAL LAW ENFORCEMENT SERVICES SPECIAL REVENUE FUNDFOR THE YEAR ENDED JUNE 30, 2018
Variance withFinal Budget
Original Final Actual PositiveBudget Budget Amount (Negative)
REVENUESIntergovernmental 150,000$ 150,000$ 171,383$ 21,383$ Interest and rentals - - 877 877
Total revenues 150,000 150,000 172,260 22,260
EXPENDITURESCurrent:
Public safety 355,311 355,311 355,311 - NET CHANGE IN FUND BALANCE (205,311)$ (205,311)$ (183,051) 22,260$
FUND BALANCE, BEGINNING OF YEAR 286,036
FUND BALANCE, END OF YEAR 102,985$
F-121
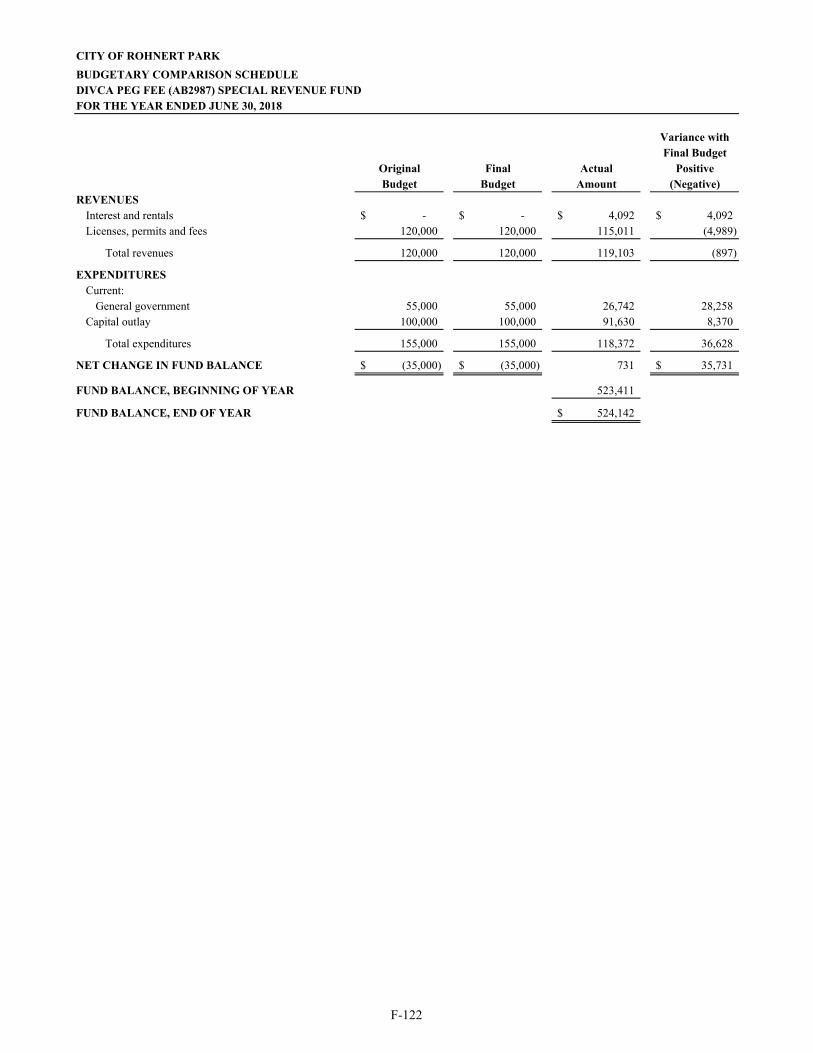
CITY OF ROHNERT PARK
BUDGETARY COMPARISON SCHEDULEDIVCA PEG FEE (AB2987) SPECIAL REVENUE FUNDFOR THE YEAR ENDED JUNE 30, 2018
Variance withFinal Budget
Original Final Actual PositiveBudget Budget Amount (Negative)
REVENUESInterest and rentals -$ -$ 4,092$ 4,092$ Licenses, permits and fees 120,000 120,000 115,011 (4,989)
Total revenues 120,000 120,000 119,103 (897)
EXPENDITURESCurrent:
General government 55,000 55,000 26,742 28,258 Capital outlay 100,000 100,000 91,630 8,370
Total expenditures 155,000 155,000 118,372 36,628
NET CHANGE IN FUND BALANCE (35,000)$ (35,000)$ 731 35,731$
FUND BALANCE, BEGINNING OF YEAR 523,411
FUND BALANCE, END OF YEAR 524,142$
F-122

CITY OF ROHNERT PARK
BUDGETARY COMPARISON SCHEDULEGRATON MITIGATION SCHOOL CONTRIBUTION SPECIAL REVENUE FUNDFOR THE YEAR ENDED JUNE 30, 2018
Variance withFinal Budget
Original Final Actual PositiveBudget Budget Amount (Negative)
REVENUESDonations and miscellaneous 1,112,118$ 1,112,118$ 1,112,018$ (100)$
EXPENDITURESCurrent:
General government 1,112,118 1,112,118 1,112,018 100 NET CHANGE IN FUND BALANCE -$ -$ - -$
FUND BALANCE, BEGINNING OF YEAR -
FUND BALANCE, END OF YEAR -$
F-123

CITY OF ROHNERT PARK
BUDGETARY COMPARISON SCHEDULEGRATON MITIGATION LAW ENFORCEMENT SPECIAL REVENUE FUNDFOR THE YEAR ENDED JUNE 30, 2018
Variance withFinal Budget
Original Final Actual PositiveBudget Budget Amount (Negative)
REVENUESInterest and rentals -$ -$ 906$ 906$ Donations and miscellaneous 551,952 551,952 556,009 4,057
Total revenues 551,952 551,952 556,915 4,963
EXPENDITURESCurrent:
Public safety 754,536 765,362 844,140 (78,778)
EXCESS (DEFICIENCY) OF REVENUESOVER (UNDER) EXPENDITURES (202,584) (213,410) (287,225) (73,815)
OTHER FINANCING USESTransfers out (10,826) - - -
NET CHANGE IN FUND BALANCE (213,410)$ (213,410)$ (287,225) (73,815)$
FUND BALANCE, BEGINNING OF YEAR 331,707
FUND BALANCE, END OF YEAR 44,482$
F-124
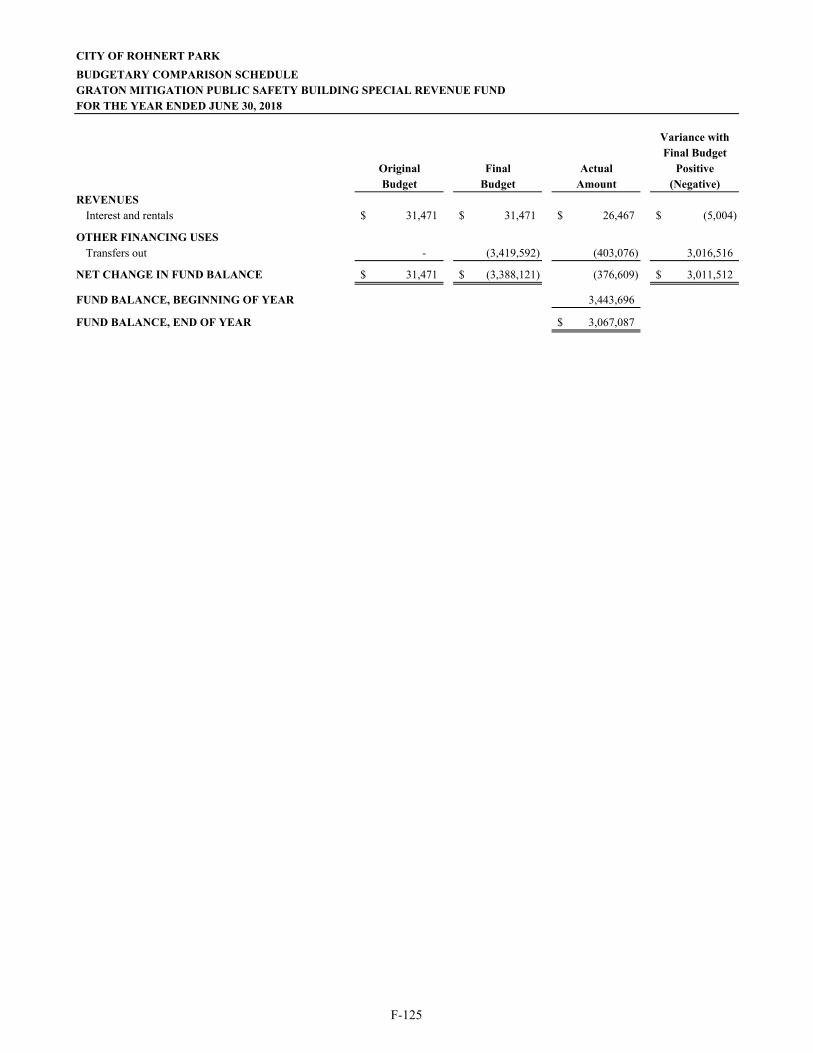
CITY OF ROHNERT PARK
BUDGETARY COMPARISON SCHEDULEGRATON MITIGATION PUBLIC SAFETY BUILDING SPECIAL REVENUE FUNDFOR THE YEAR ENDED JUNE 30, 2018
Variance withFinal Budget
Original Final Actual PositiveBudget Budget Amount (Negative)
REVENUESInterest and rentals 31,471$ 31,471$ 26,467$ (5,004)$
OTHER FINANCING USESTransfers out - (3,419,592) (403,076) 3,016,516
NET CHANGE IN FUND BALANCE 31,471$ (3,388,121)$ (376,609) 3,011,512$
FUND BALANCE, BEGINNING OF YEAR 3,443,696
FUND BALANCE, END OF YEAR 3,067,087$
F-125
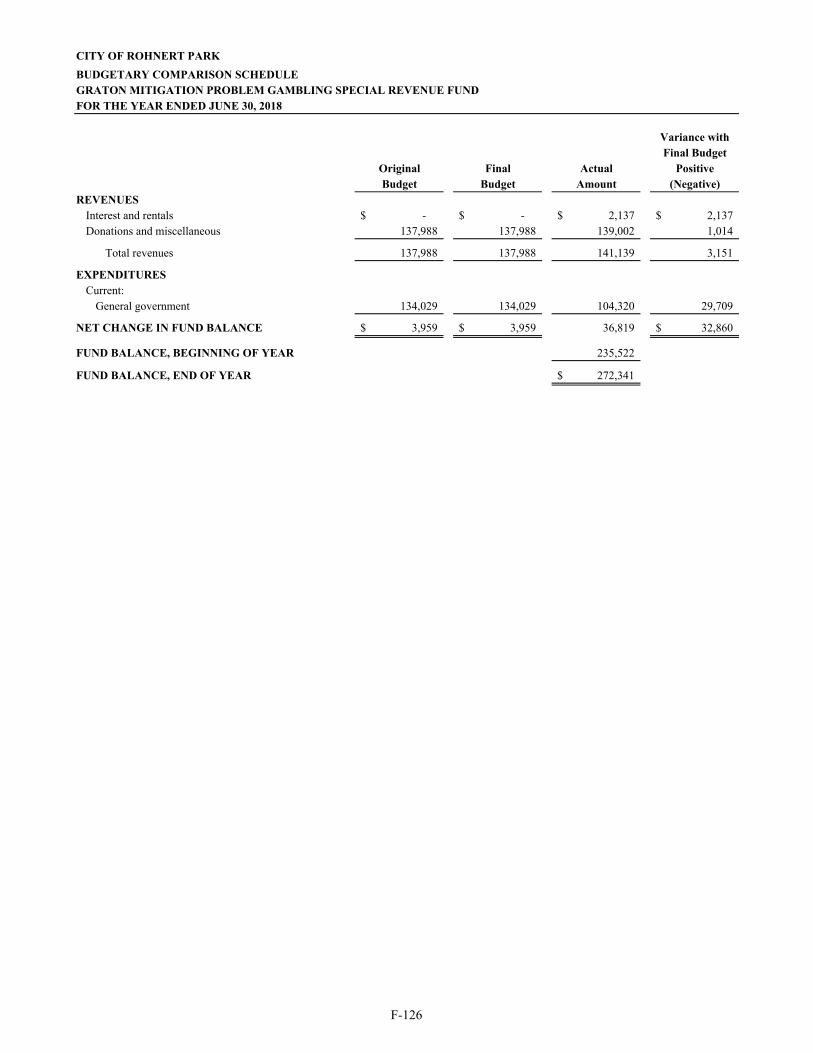
CITY OF ROHNERT PARK
BUDGETARY COMPARISON SCHEDULEGRATON MITIGATION PROBLEM GAMBLING SPECIAL REVENUE FUNDFOR THE YEAR ENDED JUNE 30, 2018
Variance withFinal Budget
Original Final Actual PositiveBudget Budget Amount (Negative)
REVENUESInterest and rentals -$ -$ 2,137$ 2,137$ Donations and miscellaneous 137,988 137,988 139,002 1,014
Total revenues 137,988 137,988 141,139 3,151
EXPENDITURESCurrent:
General government 134,029 134,029 104,320 29,709 NET CHANGE IN FUND BALANCE 3,959$ 3,959$ 36,819 32,860$
FUND BALANCE, BEGINNING OF YEAR 235,522
FUND BALANCE, END OF YEAR 272,341$
F-126
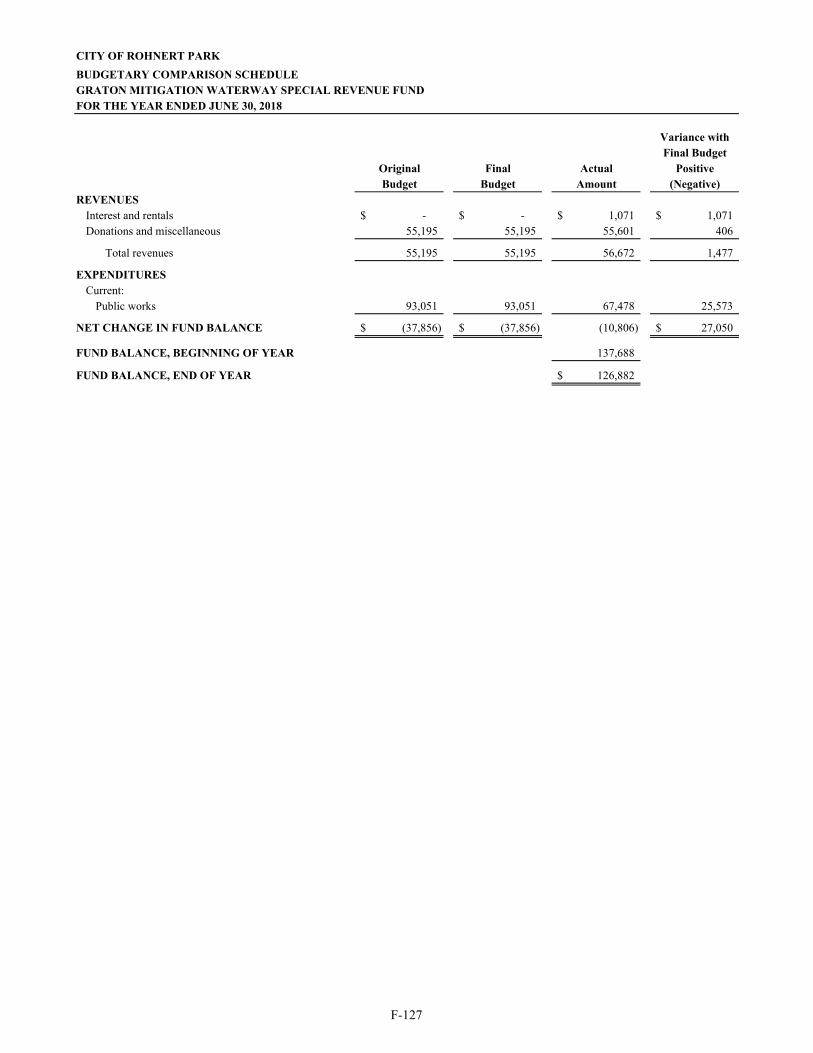
CITY OF ROHNERT PARK
BUDGETARY COMPARISON SCHEDULEGRATON MITIGATION WATERWAY SPECIAL REVENUE FUNDFOR THE YEAR ENDED JUNE 30, 2018
Variance withFinal Budget
Original Final Actual PositiveBudget Budget Amount (Negative)
REVENUESInterest and rentals -$ -$ 1,071$ 1,071$ Donations and miscellaneous 55,195 55,195 55,601 406
Total revenues 55,195 55,195 56,672 1,477
EXPENDITURESCurrent:
Public works 93,051 93,051 67,478 25,573 NET CHANGE IN FUND BALANCE (37,856)$ (37,856)$ (10,806) 27,050$
FUND BALANCE, BEGINNING OF YEAR 137,688
FUND BALANCE, END OF YEAR 126,882$
F-127
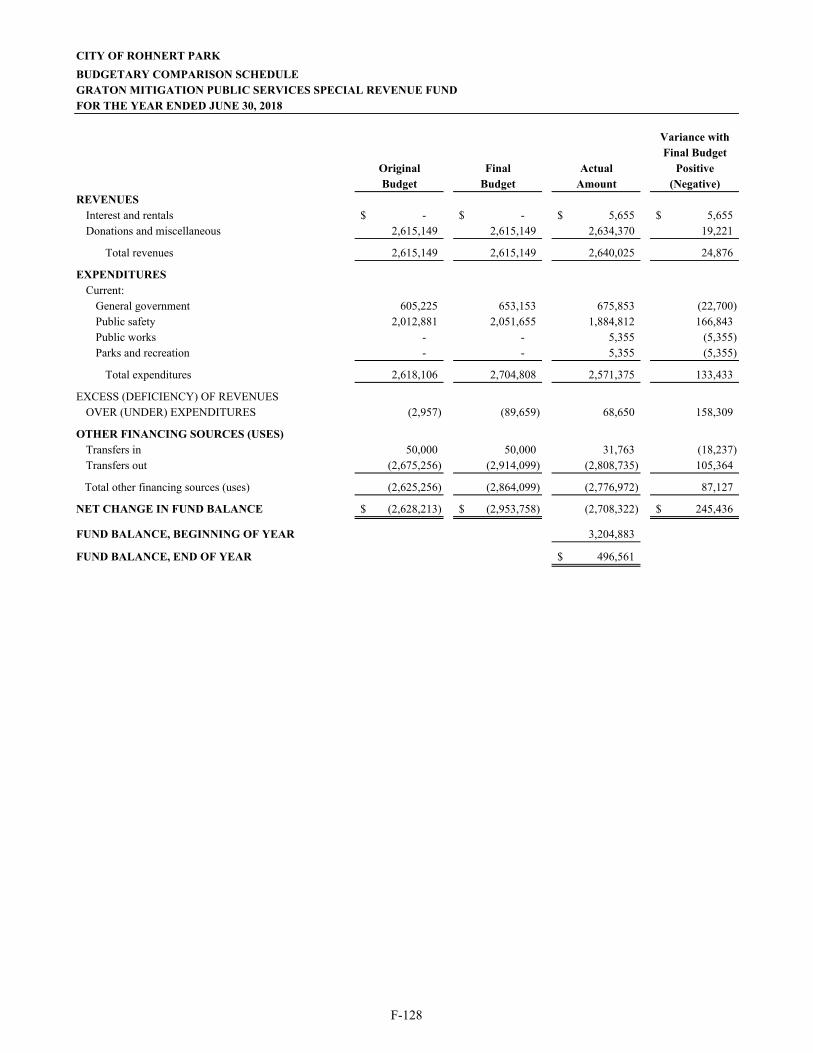
CITY OF ROHNERT PARK
BUDGETARY COMPARISON SCHEDULEGRATON MITIGATION PUBLIC SERVICES SPECIAL REVENUE FUNDFOR THE YEAR ENDED JUNE 30, 2018
Variance withFinal Budget
Original Final Actual PositiveBudget Budget Amount (Negative)
REVENUESInterest and rentals -$ -$ 5,655$ 5,655$ Donations and miscellaneous 2,615,149 2,615,149 2,634,370 19,221
Total revenues 2,615,149 2,615,149 2,640,025 24,876
EXPENDITURESCurrent:
General government 605,225 653,153 675,853 (22,700) Public safety 2,012,881 2,051,655 1,884,812 166,843 Public works - - 5,355 (5,355) Parks and recreation - - 5,355 (5,355)
Total expenditures 2,618,106 2,704,808 2,571,375 133,433
EXCESS (DEFICIENCY) OF REVENUESOVER (UNDER) EXPENDITURES (2,957) (89,659) 68,650 158,309
OTHER FINANCING SOURCES (USES)Transfers in 50,000 50,000 31,763 (18,237) Transfers out (2,675,256) (2,914,099) (2,808,735) 105,364
Total other financing sources (uses) (2,625,256) (2,864,099) (2,776,972) 87,127
NET CHANGE IN FUND BALANCE (2,628,213)$ (2,953,758)$ (2,708,322) 245,436$
FUND BALANCE, BEGINNING OF YEAR 3,204,883
FUND BALANCE, END OF YEAR 496,561$
F-128
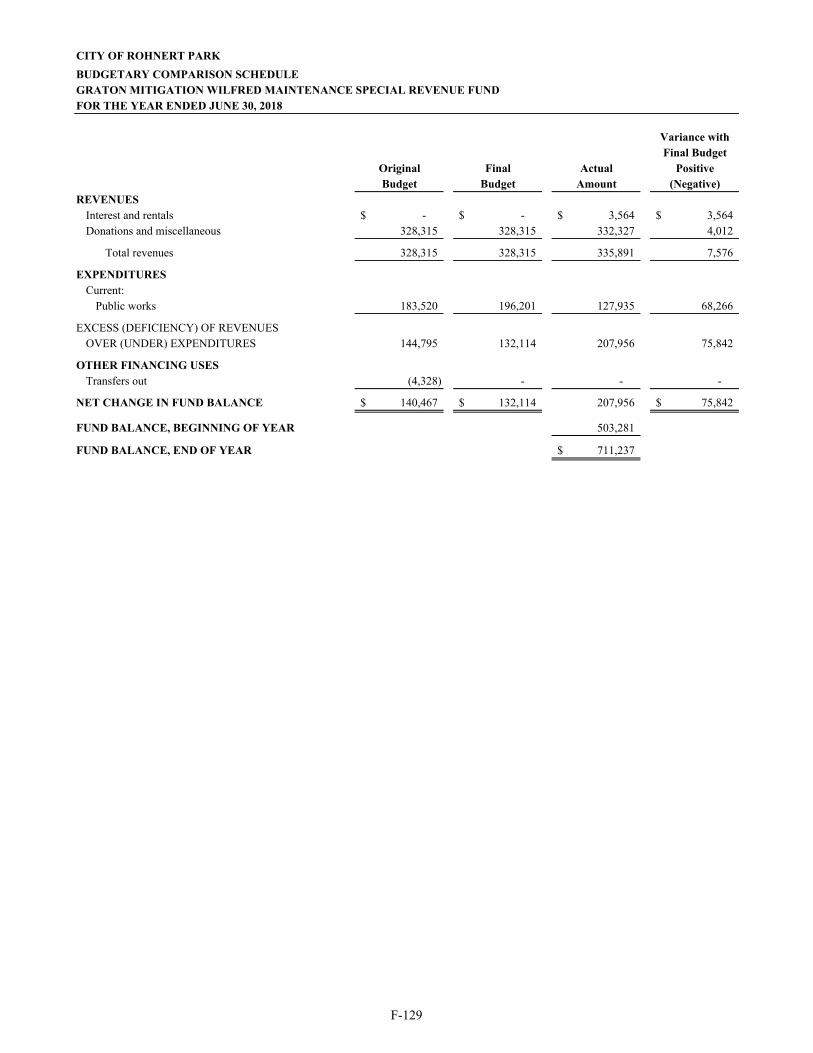
CITY OF ROHNERT PARK
BUDGETARY COMPARISON SCHEDULEGRATON MITIGATION WILFRED MAINTENANCE SPECIAL REVENUE FUNDFOR THE YEAR ENDED JUNE 30, 2018
Variance withFinal Budget
Original Final Actual PositiveBudget Budget Amount (Negative)
REVENUESInterest and rentals -$ -$ 3,564$ 3,564$ Donations and miscellaneous 328,315 328,315 332,327 4,012
Total revenues 328,315 328,315 335,891 7,576
EXPENDITURESCurrent:
Public works 183,520 196,201 127,935 68,266
EXCESS (DEFICIENCY) OF REVENUESOVER (UNDER) EXPENDITURES 144,795 132,114 207,956 75,842
OTHER FINANCING USESTransfers out (4,328) - - -
NET CHANGE IN FUND BALANCE 140,467$ 132,114$ 207,956 75,842$
FUND BALANCE, BEGINNING OF YEAR 503,281
FUND BALANCE, END OF YEAR 711,237$
F-129
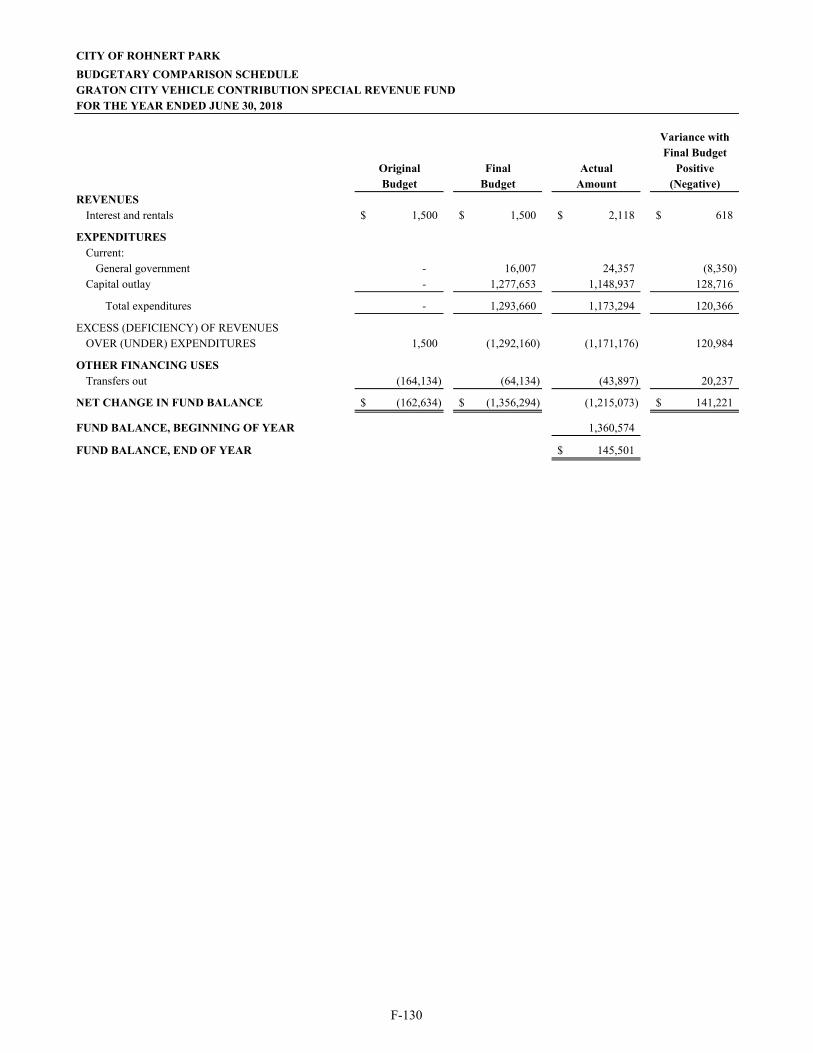
CITY OF ROHNERT PARK
BUDGETARY COMPARISON SCHEDULEGRATON CITY VEHICLE CONTRIBUTION SPECIAL REVENUE FUNDFOR THE YEAR ENDED JUNE 30, 2018
Variance withFinal Budget
Original Final Actual PositiveBudget Budget Amount (Negative)
REVENUESInterest and rentals 1,500$ 1,500$ 2,118$ 618$
EXPENDITURESCurrent:
General government - 16,007 24,357 (8,350) Capital outlay - 1,277,653 1,148,937 128,716
Total expenditures - 1,293,660 1,173,294 120,366
EXCESS (DEFICIENCY) OF REVENUESOVER (UNDER) EXPENDITURES 1,500 (1,292,160) (1,171,176) 120,984
OTHER FINANCING USESTransfers out (164,134) (64,134) (43,897) 20,237
NET CHANGE IN FUND BALANCE (162,634)$ (1,356,294)$ (1,215,073) 141,221$
FUND BALANCE, BEGINNING OF YEAR 1,360,574
FUND BALANCE, END OF YEAR 145,501$
F-130
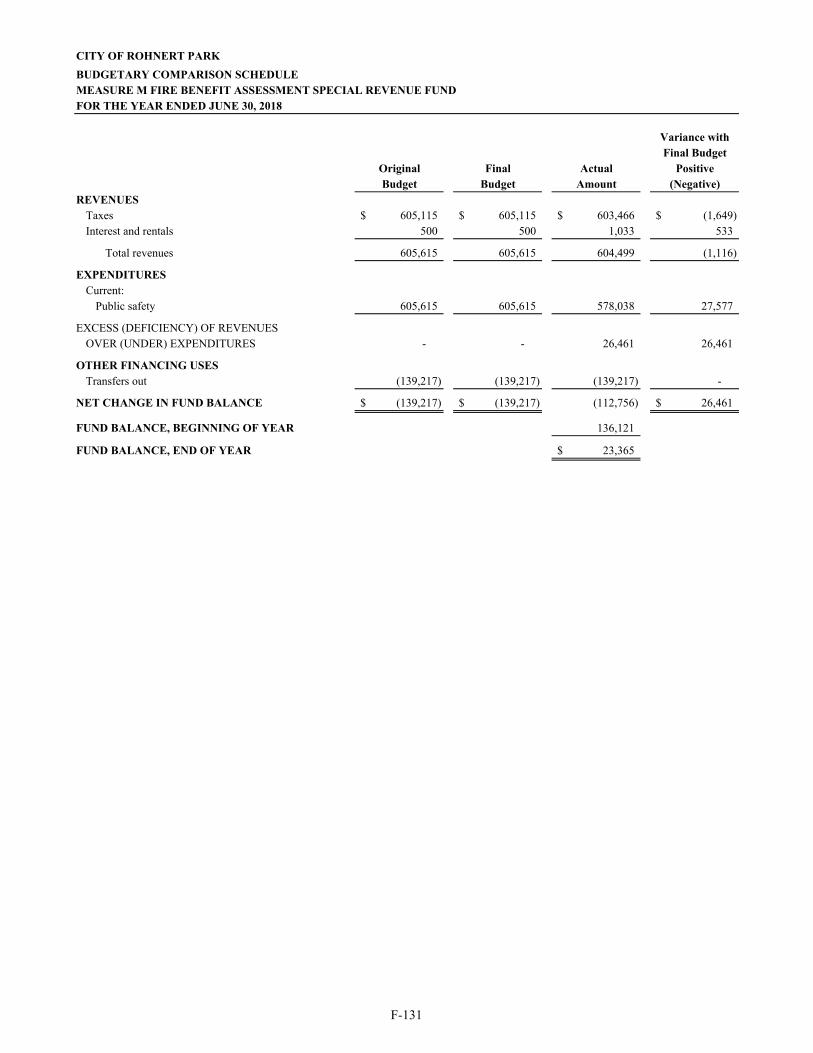
CITY OF ROHNERT PARK
BUDGETARY COMPARISON SCHEDULEMEASURE M FIRE BENEFIT ASSESSMENT SPECIAL REVENUE FUNDFOR THE YEAR ENDED JUNE 30, 2018
Variance withFinal Budget
Original Final Actual PositiveBudget Budget Amount (Negative)
REVENUESTaxes 605,115$ 605,115$ 603,466$ (1,649)$ Interest and rentals 500 500 1,033 533
Total revenues 605,615 605,615 604,499 (1,116)
EXPENDITURESCurrent:
Public safety 605,615 605,615 578,038 27,577
EXCESS (DEFICIENCY) OF REVENUESOVER (UNDER) EXPENDITURES - - 26,461 26,461
OTHER FINANCING USESTransfers out (139,217) (139,217) (139,217) -
NET CHANGE IN FUND BALANCE (139,217)$ (139,217)$ (112,756) 26,461$
FUND BALANCE, BEGINNING OF YEAR 136,121
FUND BALANCE, END OF YEAR 23,365$
F-131

CITY OF ROHNERT PARK
BUDGETARY COMPARISON SCHEDULEMOBILE HOME RENT APPEALS BOARD SPECIAL REVENUE FUNDFOR THE YEAR ENDED JUNE 30, 2018
Variance withFinal Budget
Original Final Actual PositiveBudget Budget Amount (Negative)
REVENUESInterest and rentals -$ -$ 1,317$ 1,317$ Licenses, permits and fees 99,100 99,100 92,680 (6,420)
Total revenues 99,100 99,100 93,997 (5,103)
EXPENDITURESCurrent:
General government 42,865 103,865 106,868 (3,003) NET CHANGE IN FUND BALANCE 56,235$ (4,765)$ (12,871) (8,106)$
FUND BALANCE, BEGINNING OF YEAR 248,732
FUND BALANCE, END OF YEAR 235,861$
F-132
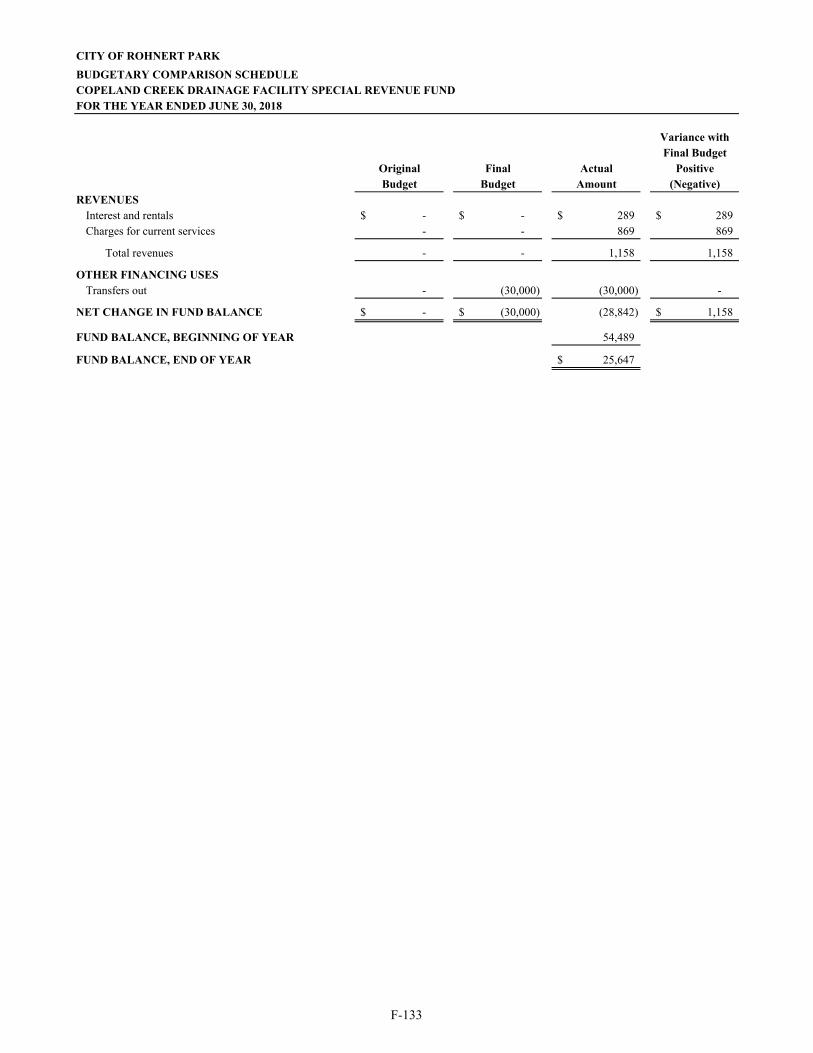
CITY OF ROHNERT PARK
BUDGETARY COMPARISON SCHEDULECOPELAND CREEK DRAINAGE FACILITY SPECIAL REVENUE FUNDFOR THE YEAR ENDED JUNE 30, 2018
Variance withFinal Budget
Original Final Actual PositiveBudget Budget Amount (Negative)
REVENUESInterest and rentals -$ -$ 289$ 289$ Charges for current services - - 869 869
Total revenues - - 1,158 1,158
OTHER FINANCING USESTransfers out - (30,000) (30,000) -
NET CHANGE IN FUND BALANCE -$ (30,000)$ (28,842) 1,158$
FUND BALANCE, BEGINNING OF YEAR 54,489
FUND BALANCE, END OF YEAR 25,647$
F-133
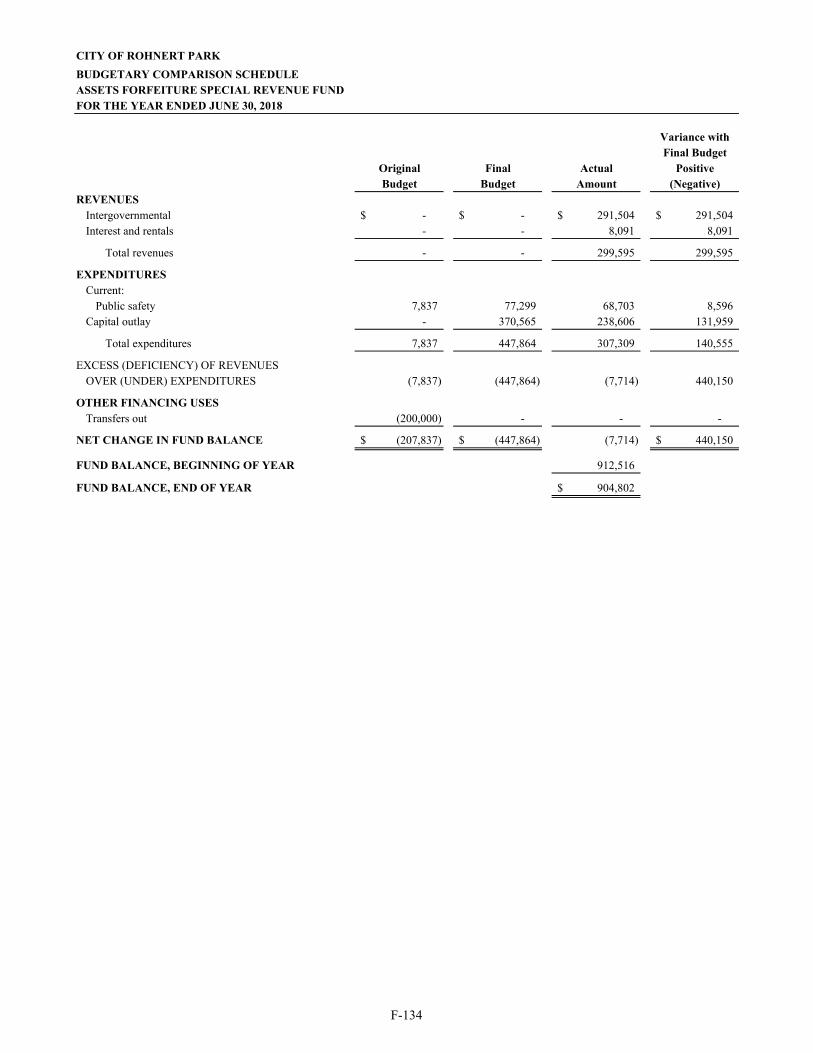
CITY OF ROHNERT PARK
BUDGETARY COMPARISON SCHEDULEASSETS FORFEITURE SPECIAL REVENUE FUNDFOR THE YEAR ENDED JUNE 30, 2018
Variance withFinal Budget
Original Final Actual PositiveBudget Budget Amount (Negative)
REVENUESIntergovernmental -$ -$ 291,504$ 291,504$ Interest and rentals - - 8,091 8,091
Total revenues - - 299,595 299,595
EXPENDITURESCurrent:
Public safety 7,837 77,299 68,703 8,596 Capital outlay - 370,565 238,606 131,959
Total expenditures 7,837 447,864 307,309 140,555
EXCESS (DEFICIENCY) OF REVENUESOVER (UNDER) EXPENDITURES (7,837) (447,864) (7,714) 440,150
OTHER FINANCING USESTransfers out (200,000) - - -
NET CHANGE IN FUND BALANCE (207,837)$ (447,864)$ (7,714) 440,150$
FUND BALANCE, BEGINNING OF YEAR 912,516
FUND BALANCE, END OF YEAR 904,802$
F-134
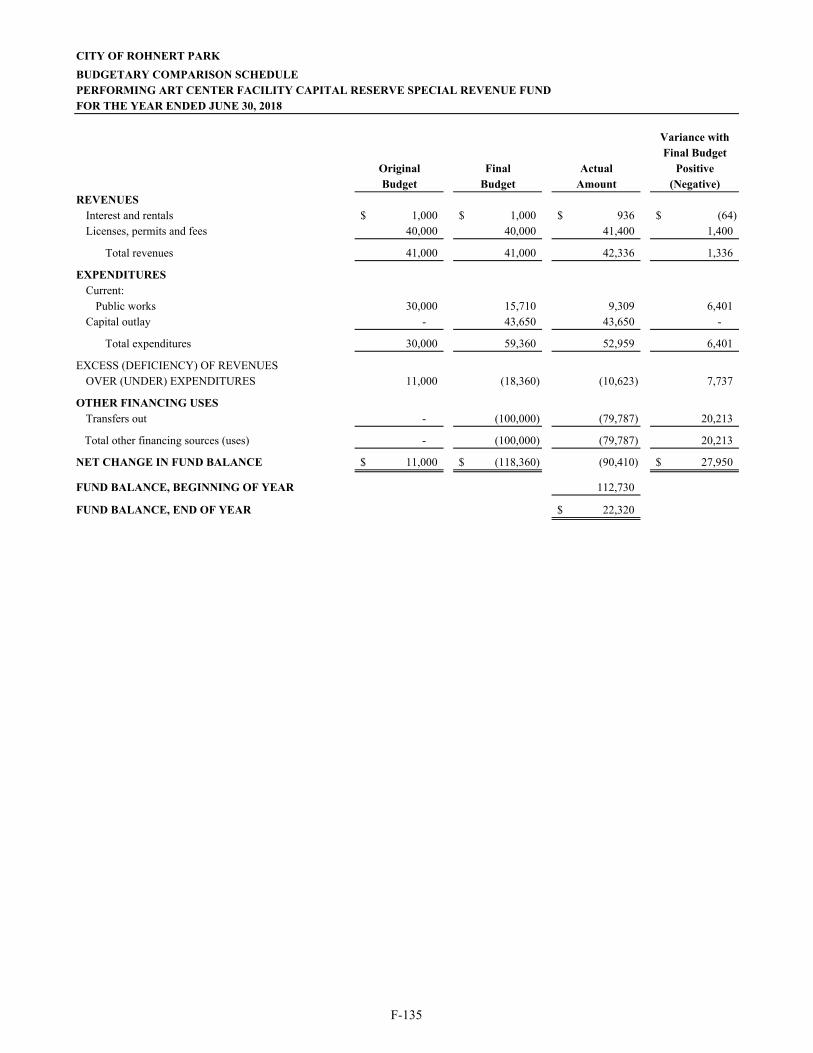
CITY OF ROHNERT PARK
BUDGETARY COMPARISON SCHEDULEPERFORMING ART CENTER FACILITY CAPITAL RESERVE SPECIAL REVENUE FUNDFOR THE YEAR ENDED JUNE 30, 2018
Variance withFinal Budget
Original Final Actual PositiveBudget Budget Amount (Negative)
REVENUESInterest and rentals 1,000$ 1,000$ 936$ (64)$ Licenses, permits and fees 40,000 40,000 41,400 1,400
Total revenues 41,000 41,000 42,336 1,336
EXPENDITURESCurrent:
Public works 30,000 15,710 9,309 6,401 Capital outlay - 43,650 43,650 -
Total expenditures 30,000 59,360 52,959 6,401
EXCESS (DEFICIENCY) OF REVENUESOVER (UNDER) EXPENDITURES 11,000 (18,360) (10,623) 7,737
OTHER FINANCING USESTransfers out - (100,000) (79,787) 20,213
Total other financing sources (uses) - (100,000) (79,787) 20,213 NET CHANGE IN FUND BALANCE 11,000$ (118,360)$ (90,410) 27,950$
FUND BALANCE, BEGINNING OF YEAR 112,730
FUND BALANCE, END OF YEAR 22,320$
F-135
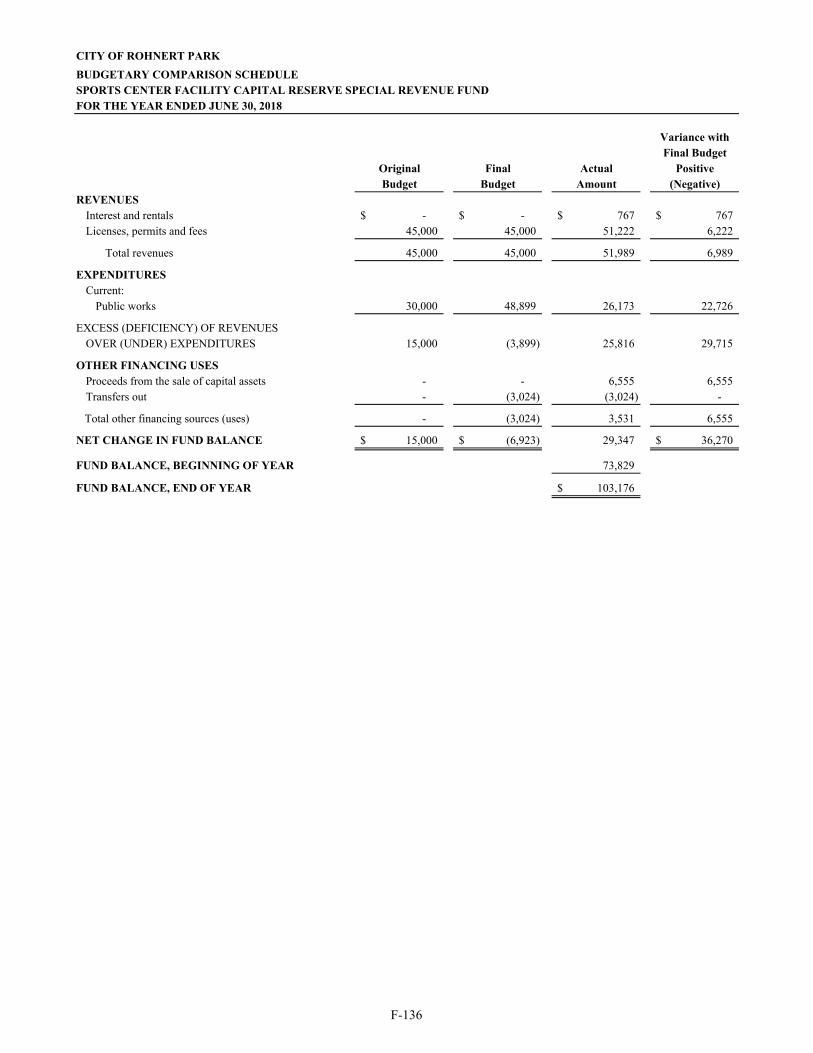
CITY OF ROHNERT PARK
BUDGETARY COMPARISON SCHEDULESPORTS CENTER FACILITY CAPITAL RESERVE SPECIAL REVENUE FUNDFOR THE YEAR ENDED JUNE 30, 2018
Variance withFinal Budget
Original Final Actual PositiveBudget Budget Amount (Negative)
REVENUESInterest and rentals -$ -$ 767$ 767$ Licenses, permits and fees 45,000 45,000 51,222 6,222
Total revenues 45,000 45,000 51,989 6,989
EXPENDITURESCurrent:
Public works 30,000 48,899 26,173 22,726
EXCESS (DEFICIENCY) OF REVENUESOVER (UNDER) EXPENDITURES 15,000 (3,899) 25,816 29,715
OTHER FINANCING USESProceeds from the sale of capital assets - - 6,555 6,555 Transfers out - (3,024) (3,024) -
Total other financing sources (uses) - (3,024) 3,531 6,555 NET CHANGE IN FUND BALANCE 15,000$ (6,923)$ 29,347 36,270$
FUND BALANCE, BEGINNING OF YEAR 73,829
FUND BALANCE, END OF YEAR 103,176$
F-136
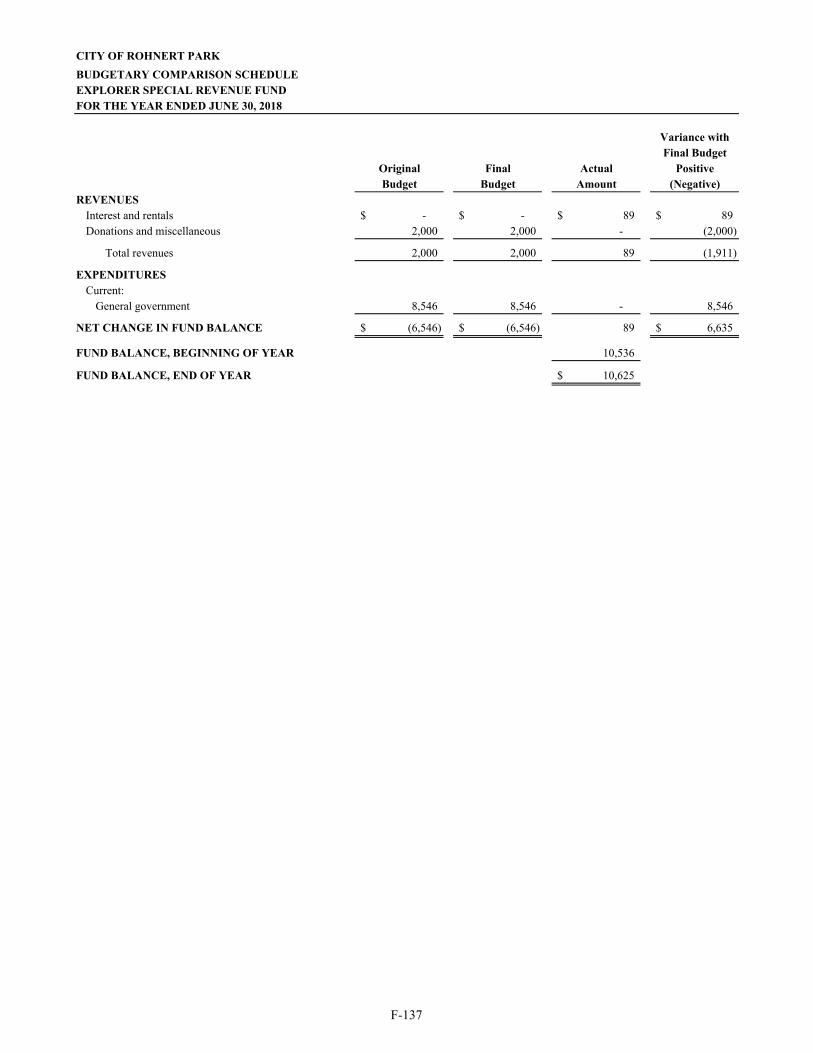
CITY OF ROHNERT PARK
BUDGETARY COMPARISON SCHEDULEEXPLORER SPECIAL REVENUE FUNDFOR THE YEAR ENDED JUNE 30, 2018
Variance withFinal Budget
Original Final Actual PositiveBudget Budget Amount (Negative)
REVENUESInterest and rentals -$ -$ 89$ 89$ Donations and miscellaneous 2,000 2,000 - (2,000)
Total revenues 2,000 2,000 89 (1,911)
EXPENDITURESCurrent:
General government 8,546 8,546 - 8,546 NET CHANGE IN FUND BALANCE (6,546)$ (6,546)$ 89 6,635$
FUND BALANCE, BEGINNING OF YEAR 10,536
FUND BALANCE, END OF YEAR 10,625$
F-137
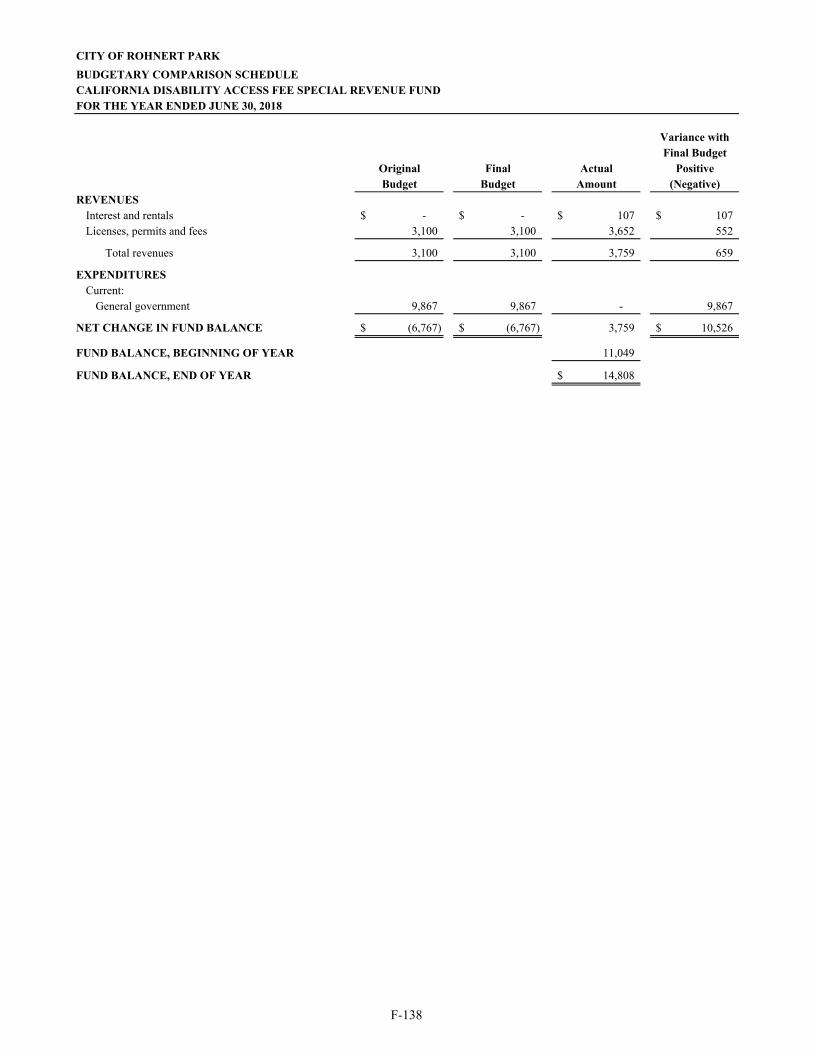
CITY OF ROHNERT PARK
BUDGETARY COMPARISON SCHEDULECALIFORNIA DISABILITY ACCESS FEE SPECIAL REVENUE FUNDFOR THE YEAR ENDED JUNE 30, 2018
Variance withFinal Budget
Original Final Actual PositiveBudget Budget Amount (Negative)
REVENUESInterest and rentals -$ -$ 107$ 107$ Licenses, permits and fees 3,100 3,100 3,652 552
Total revenues 3,100 3,100 3,759 659
EXPENDITURESCurrent:
General government 9,867 9,867 - 9,867 NET CHANGE IN FUND BALANCE (6,767)$ (6,767)$ 3,759 10,526$
FUND BALANCE, BEGINNING OF YEAR 11,049
FUND BALANCE, END OF YEAR 14,808$
F-138

CITY OF ROHNERT PARK
BUDGETARY COMPARISON SCHEDULEAFFORDABLE LINKAGE FEE SPECIAL REVENUE FUNDFOR THE YEAR ENDED JUNE 30, 2018
Variance withFinal Budget
Original Final Actual PositiveBudget Budget Amount (Negative)
REVENUESInterest and rentals -$ -$ 1,369$ 1,369$ Licenses, permits and fees 56,820 56,820 59,232 2,412
Total revenues 56,820 56,820 60,601 3,781
EXPENDITURESCurrent:
General government 15,000 15,000 - 15,000 NET CHANGE IN FUND BALANCE 41,820$ 41,820$ 60,601 18,781$
FUND BALANCE, BEGINNING OF YEAR 132,194
FUND BALANCE, END OF YEAR 192,795$
F-139

CITY OF ROHNERT PARK
BUDGETARY COMPARISON SCHEDULEUDSP REGIONAL TRAFFIC FEE SPECIAL REVENUE FUNDFOR THE YEAR ENDED JUNE 30, 2018
Variance withFinal Budget
Original Final Actual PositiveBudget Budget Amount (Negative)
REVENUESInterest and rentals -$ -$ 4,826$ 4,826$ Licenses, permits and fees 710,500 710,500 682,500 (28,000)
Total revenues 710,500 710,500 687,326 (23,174)
EXPENDITURESCurrent:
Public works 710,500 771,389 698,885 72,504
NET CHANGE IN FUND BALANCE -$ (60,889)$ (11,559) 49,330$
FUND BALANCE, BEGINNING OF YEAR 90,016
FUND BALANCE, END OF YEAR 78,457$
F-140
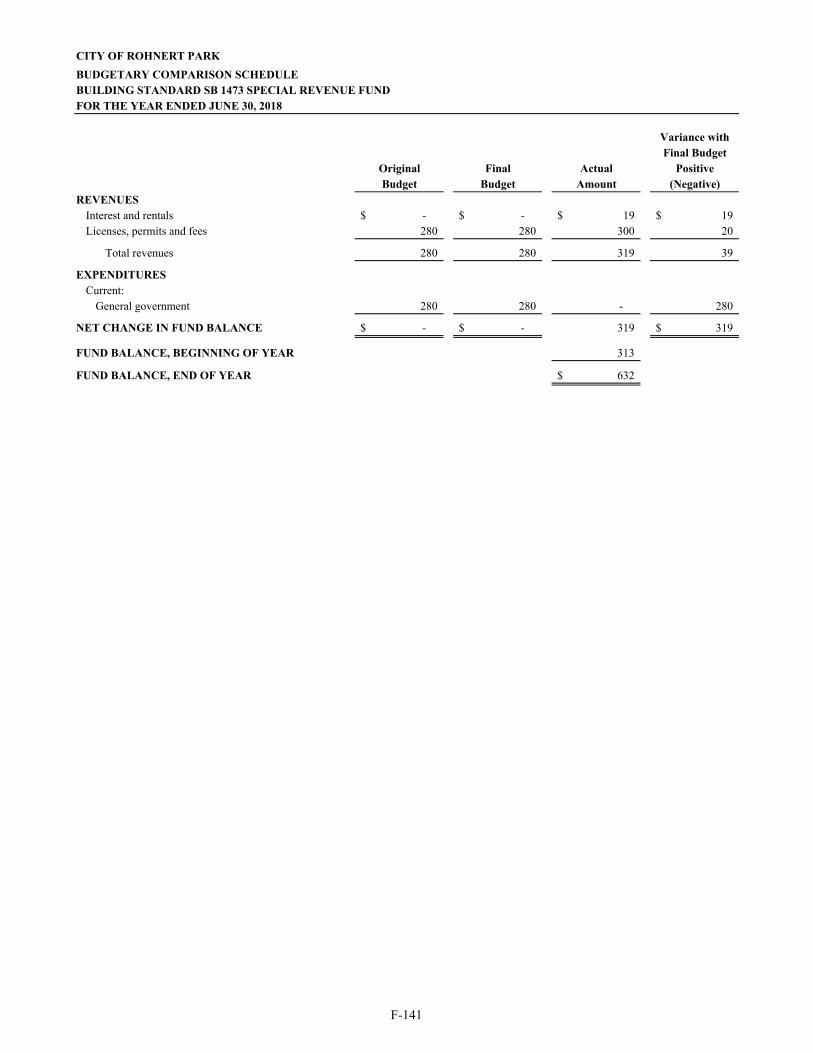
CITY OF ROHNERT PARK
BUDGETARY COMPARISON SCHEDULEBUILDING STANDARD SB 1473 SPECIAL REVENUE FUNDFOR THE YEAR ENDED JUNE 30, 2018
Variance withFinal Budget
Original Final Actual PositiveBudget Budget Amount (Negative)
REVENUESInterest and rentals -$ -$ 19$ 19$ Licenses, permits and fees 280 280 300 20
Total revenues 280 280 319 39
EXPENDITURESCurrent:
General government 280 280 - 280 NET CHANGE IN FUND BALANCE -$ -$ 319 319$
FUND BALANCE, BEGINNING OF YEAR 313
FUND BALANCE, END OF YEAR 632$
F-141

CITY OF ROHNERT PARK
BUDGETARY COMPARISON SCHEDULEROHNERT PARK FOUNDATION SPECIAL REVENUE FUNDFOR THE YEAR ENDED JUNE 30, 2018
Variance withFinal Budget
Original Final Actual PositiveBudget Budget Amount (Negative)
REVENUESInterest and rentals -$ -$ 2,313$ 2,313$ Donations and miscellaneous 228,792 228,792 330,040 101,248
Total revenues 228,792 228,792 332,353 103,561
EXPENDITURESCurrent:
General government 20,000 20,000 5,277 14,723 NET CHANGE IN FUND BALANCE 208,792$ 208,792$ 327,076 118,284$
FUND BALANCE, BEGINNING OF YEAR 86,393
FUND BALANCE, END OF YEAR 413,469$
F-142
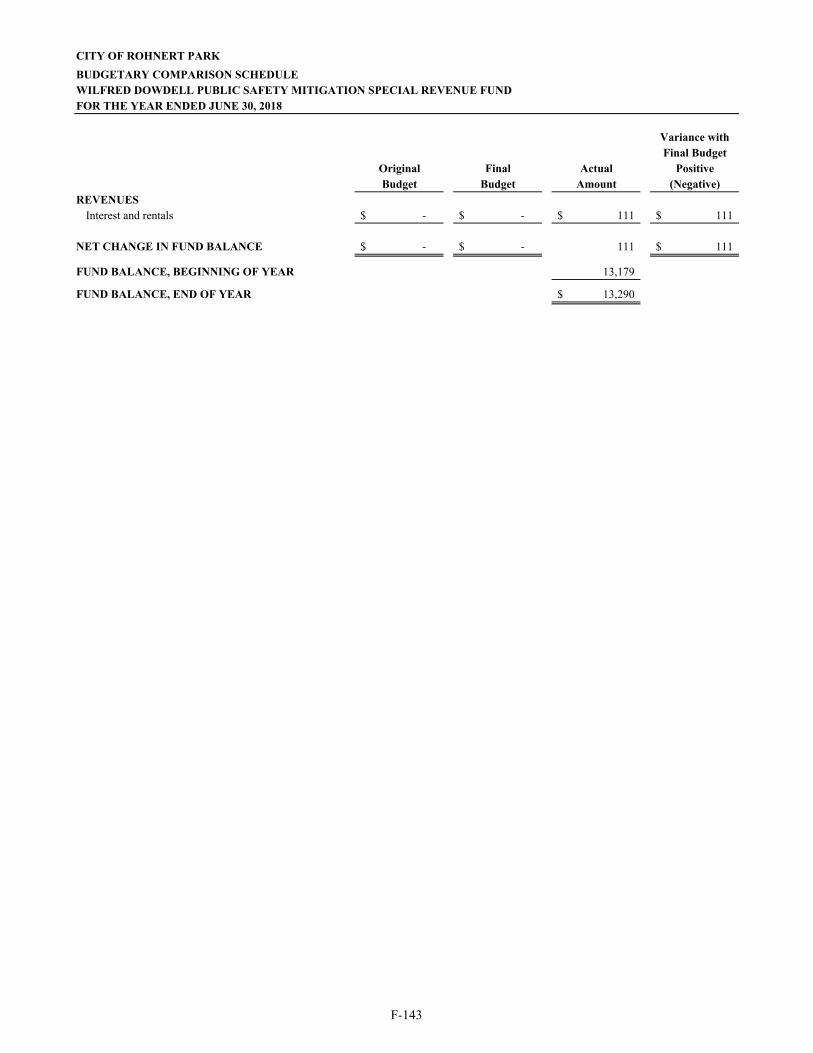
CITY OF ROHNERT PARK
BUDGETARY COMPARISON SCHEDULEWILFRED DOWDELL PUBLIC SAFETY MITIGATION SPECIAL REVENUE FUNDFOR THE YEAR ENDED JUNE 30, 2018
Variance withFinal Budget
Original Final Actual PositiveBudget Budget Amount (Negative)
REVENUESInterest and rentals -$ -$ 111$ 111$
NET CHANGE IN FUND BALANCE -$ -$ 111 111$
FUND BALANCE, BEGINNING OF YEAR 13,179
FUND BALANCE, END OF YEAR 13,290$
F-143
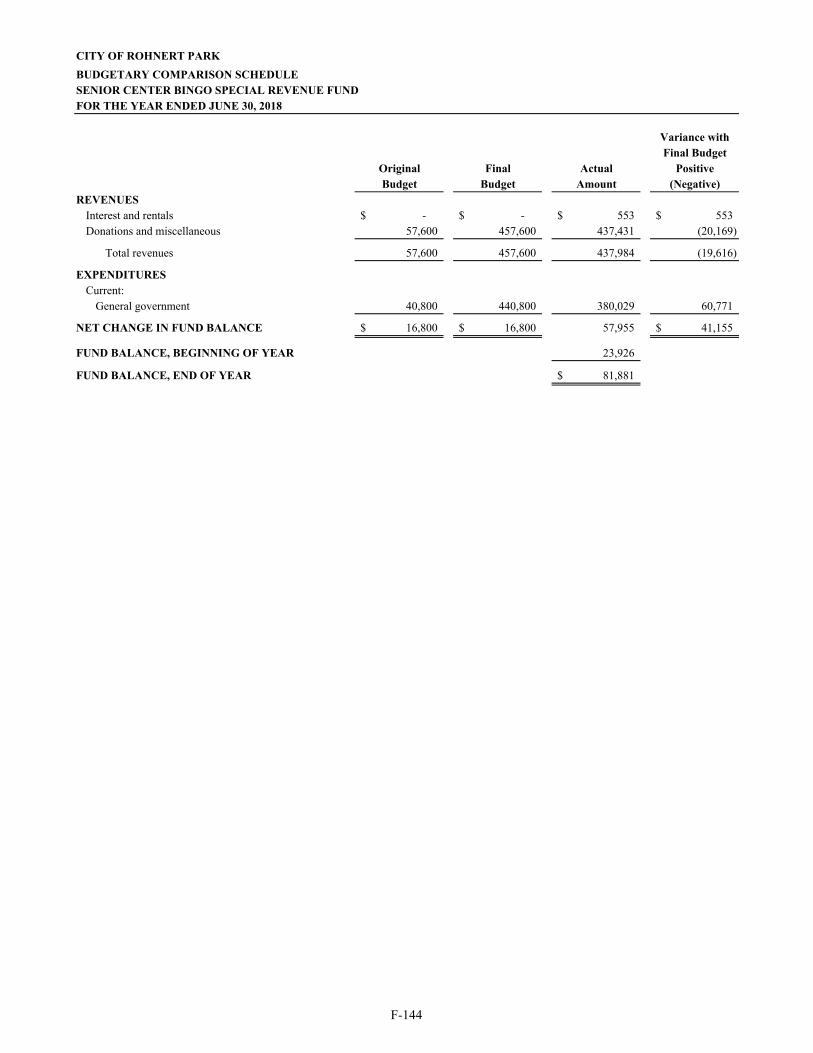
CITY OF ROHNERT PARK
BUDGETARY COMPARISON SCHEDULESENIOR CENTER BINGO SPECIAL REVENUE FUNDFOR THE YEAR ENDED JUNE 30, 2018
Variance withFinal Budget
Original Final Actual PositiveBudget Budget Amount (Negative)
REVENUESInterest and rentals -$ -$ 553$ 553$ Donations and miscellaneous 57,600 457,600 437,431 (20,169)
Total revenues 57,600 457,600 437,984 (19,616)
EXPENDITURESCurrent:
General government 40,800 440,800 380,029 60,771
NET CHANGE IN FUND BALANCE 16,800$ 16,800$ 57,955 41,155$
FUND BALANCE, BEGINNING OF YEAR 23,926
FUND BALANCE, END OF YEAR 81,881$
F-144
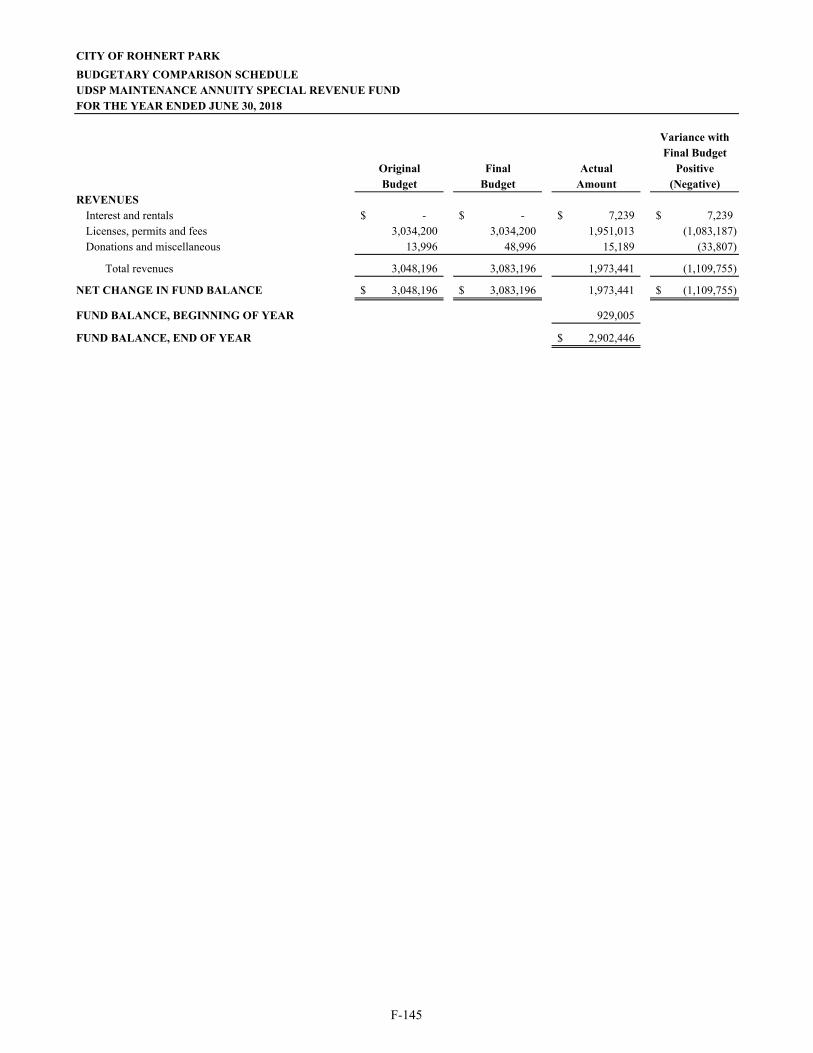
CITY OF ROHNERT PARK
BUDGETARY COMPARISON SCHEDULEUDSP MAINTENANCE ANNUITY SPECIAL REVENUE FUNDFOR THE YEAR ENDED JUNE 30, 2018
Variance withFinal Budget
Original Final Actual PositiveBudget Budget Amount (Negative)
REVENUESInterest and rentals -$ -$ 7,239$ 7,239$ Licenses, permits and fees 3,034,200 3,034,200 1,951,013 (1,083,187) Donations and miscellaneous 13,996 48,996 15,189 (33,807)
Total revenues 3,048,196 3,083,196 1,973,441 (1,109,755)
NET CHANGE IN FUND BALANCE 3,048,196$ 3,083,196$ 1,973,441 (1,109,755)$
FUND BALANCE, BEGINNING OF YEAR 929,005
FUND BALANCE, END OF YEAR 2,902,446$
F-145
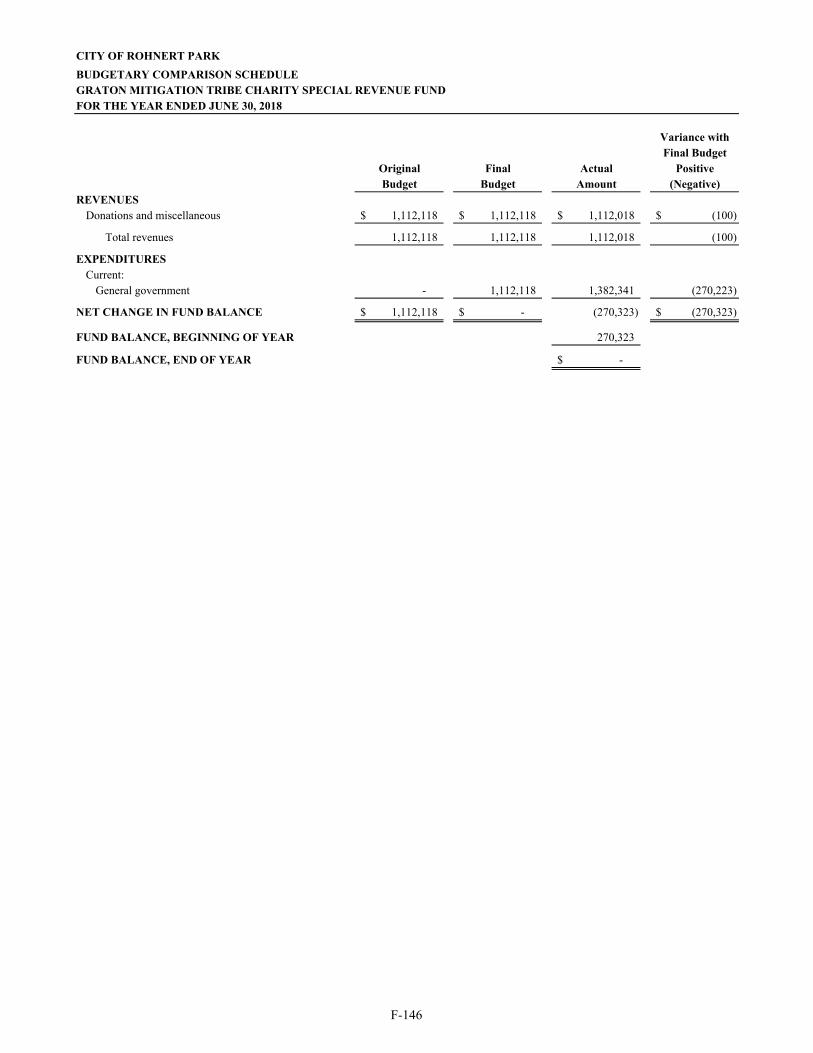
CITY OF ROHNERT PARK
BUDGETARY COMPARISON SCHEDULEGRATON MITIGATION TRIBE CHARITY SPECIAL REVENUE FUNDFOR THE YEAR ENDED JUNE 30, 2018
Variance withFinal Budget
Original Final Actual PositiveBudget Budget Amount (Negative)
REVENUESDonations and miscellaneous 1,112,118$ 1,112,118$ 1,112,018$ (100)$
Total revenues 1,112,118 1,112,118 1,112,018 (100)
EXPENDITURESCurrent:
General government - 1,112,118 1,382,341 (270,223)
NET CHANGE IN FUND BALANCE 1,112,118$ -$ (270,323) (270,323)$
FUND BALANCE, BEGINNING OF YEAR 270,323
FUND BALANCE, END OF YEAR -$
F-146
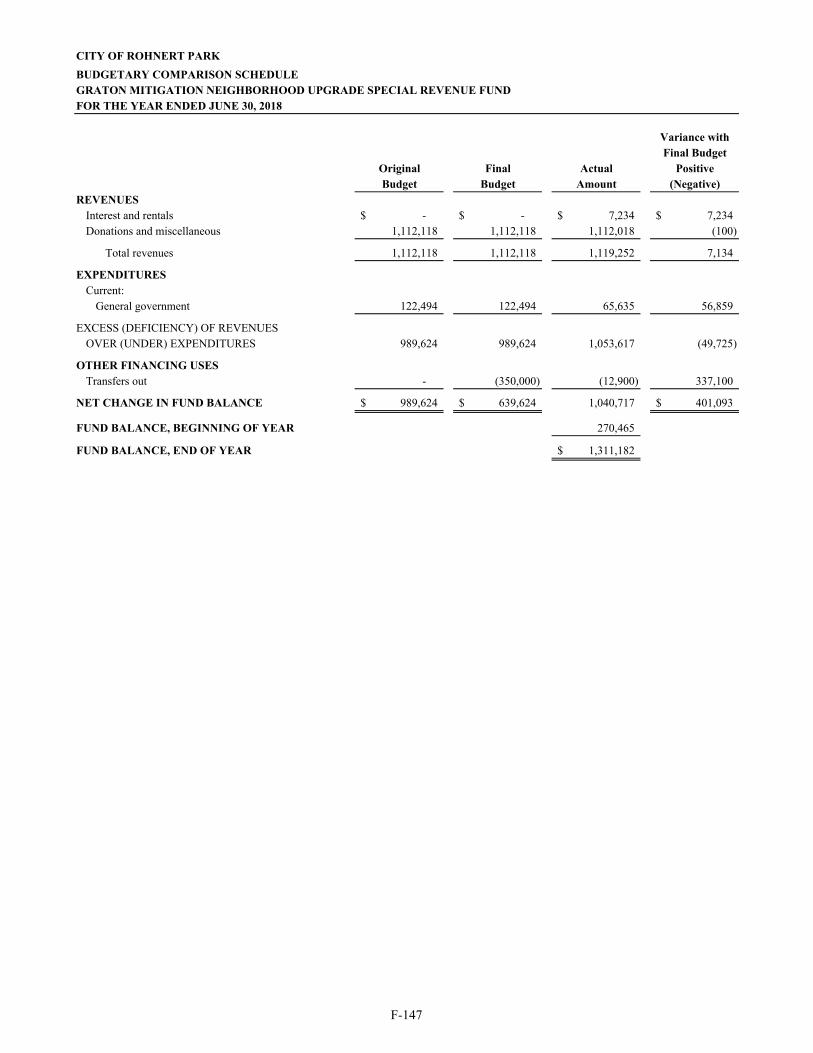
CITY OF ROHNERT PARK
BUDGETARY COMPARISON SCHEDULEGRATON MITIGATION NEIGHBORHOOD UPGRADE SPECIAL REVENUE FUNDFOR THE YEAR ENDED JUNE 30, 2018
Variance withFinal Budget
Original Final Actual PositiveBudget Budget Amount (Negative)
REVENUESInterest and rentals -$ -$ 7,234$ 7,234$ Donations and miscellaneous 1,112,118 1,112,118 1,112,018 (100)
Total revenues 1,112,118 1,112,118 1,119,252 7,134
EXPENDITURESCurrent:
General government 122,494 122,494 65,635 56,859
EXCESS (DEFICIENCY) OF REVENUESOVER (UNDER) EXPENDITURES 989,624 989,624 1,053,617 (49,725)
OTHER FINANCING USESTransfers out - (350,000) (12,900) 337,100
NET CHANGE IN FUND BALANCE 989,624$ 639,624$ 1,040,717 401,093$
FUND BALANCE, BEGINNING OF YEAR 270,465
FUND BALANCE, END OF YEAR 1,311,182$
F-147
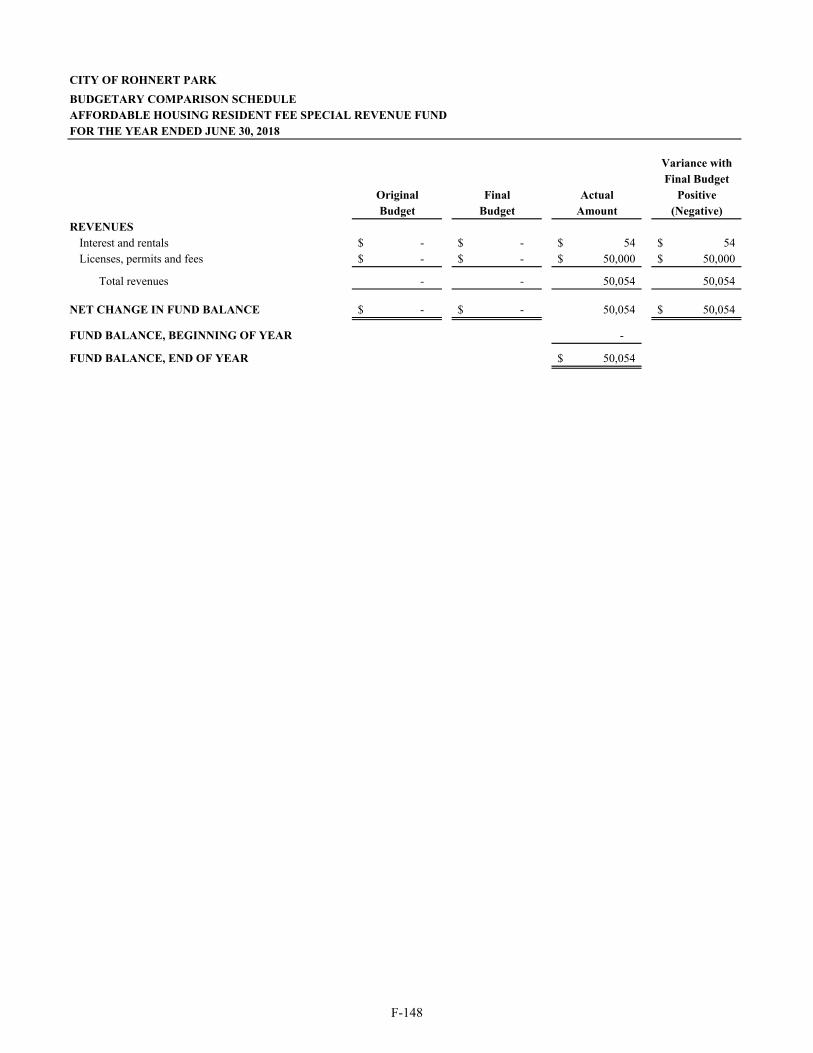
CITY OF ROHNERT PARK
BUDGETARY COMPARISON SCHEDULEAFFORDABLE HOUSING RESIDENT FEE SPECIAL REVENUE FUNDFOR THE YEAR ENDED JUNE 30, 2018
Variance withFinal Budget
Original Final Actual PositiveBudget Budget Amount (Negative)
REVENUESInterest and rentals -$ -$ 54$ 54$ Licenses, permits and fees -$ -$ 50,000$ 50,000$
Total revenues - - 50,054 50,054
NET CHANGE IN FUND BALANCE -$ -$ 50,054 50,054$
FUND BALANCE, BEGINNING OF YEAR -
FUND BALANCE, END OF YEAR 50,054$
F-148
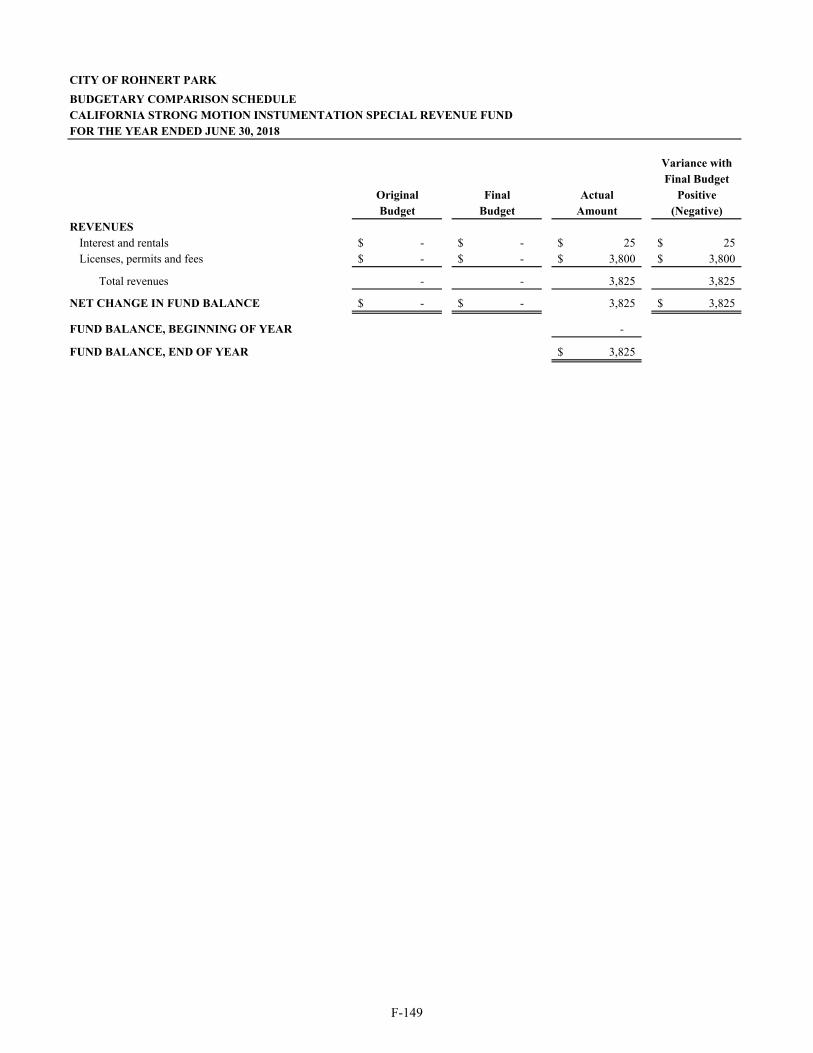
CITY OF ROHNERT PARK
BUDGETARY COMPARISON SCHEDULECALIFORNIA STRONG MOTION INSTUMENTATION SPECIAL REVENUE FUNDFOR THE YEAR ENDED JUNE 30, 2018
Variance withFinal Budget
Original Final Actual PositiveBudget Budget Amount (Negative)
REVENUESInterest and rentals -$ -$ 25$ 25$ Licenses, permits and fees -$ -$ 3,800$ 3,800$
Total revenues - - 3,825 3,825
NET CHANGE IN FUND BALANCE -$ -$ 3,825 3,825$
FUND BALANCE, BEGINNING OF YEAR -
FUND BALANCE, END OF YEAR 3,825$
F-149
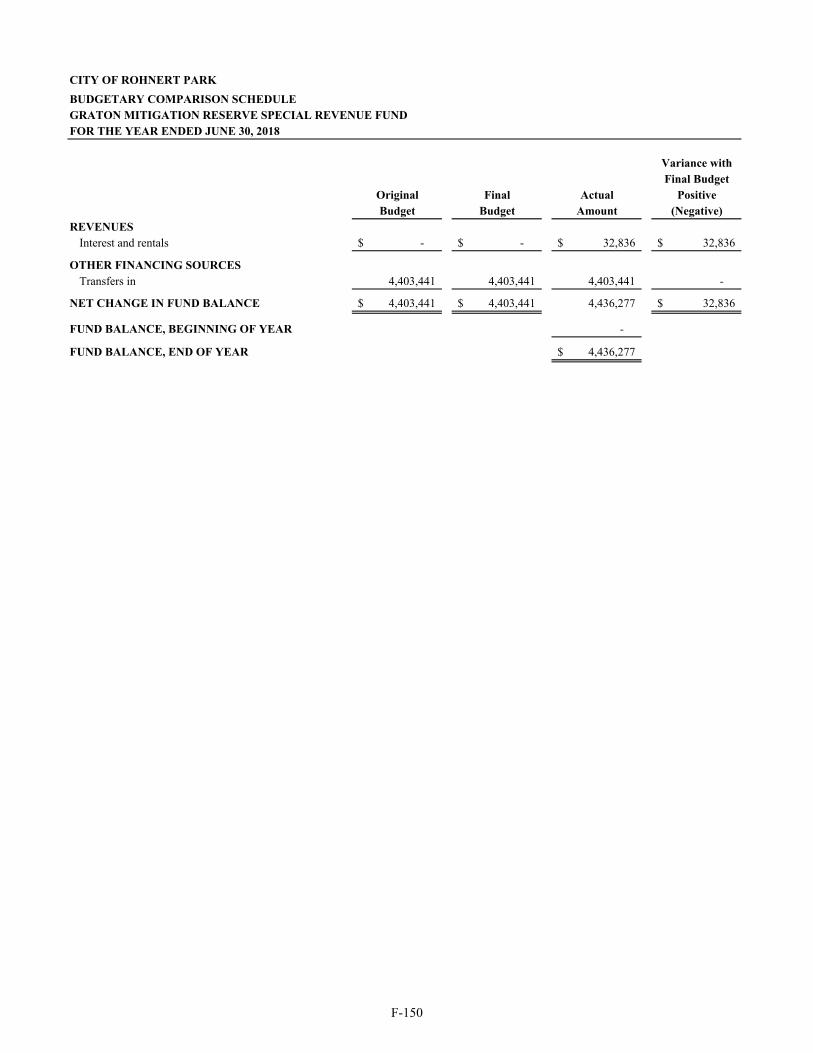
CITY OF ROHNERT PARK
BUDGETARY COMPARISON SCHEDULEGRATON MITIGATION RESERVE SPECIAL REVENUE FUNDFOR THE YEAR ENDED JUNE 30, 2018
Variance withFinal Budget
Original Final Actual PositiveBudget Budget Amount (Negative)
REVENUESInterest and rentals -$ -$ 32,836$ 32,836$
OTHER FINANCING SOURCESTransfers in 4,403,441 4,403,441 4,403,441 -
NET CHANGE IN FUND BALANCE 4,403,441$ 4,403,441$ 4,436,277 32,836$
FUND BALANCE, BEGINNING OF YEAR -
FUND BALANCE, END OF YEAR 4,436,277$
F-150
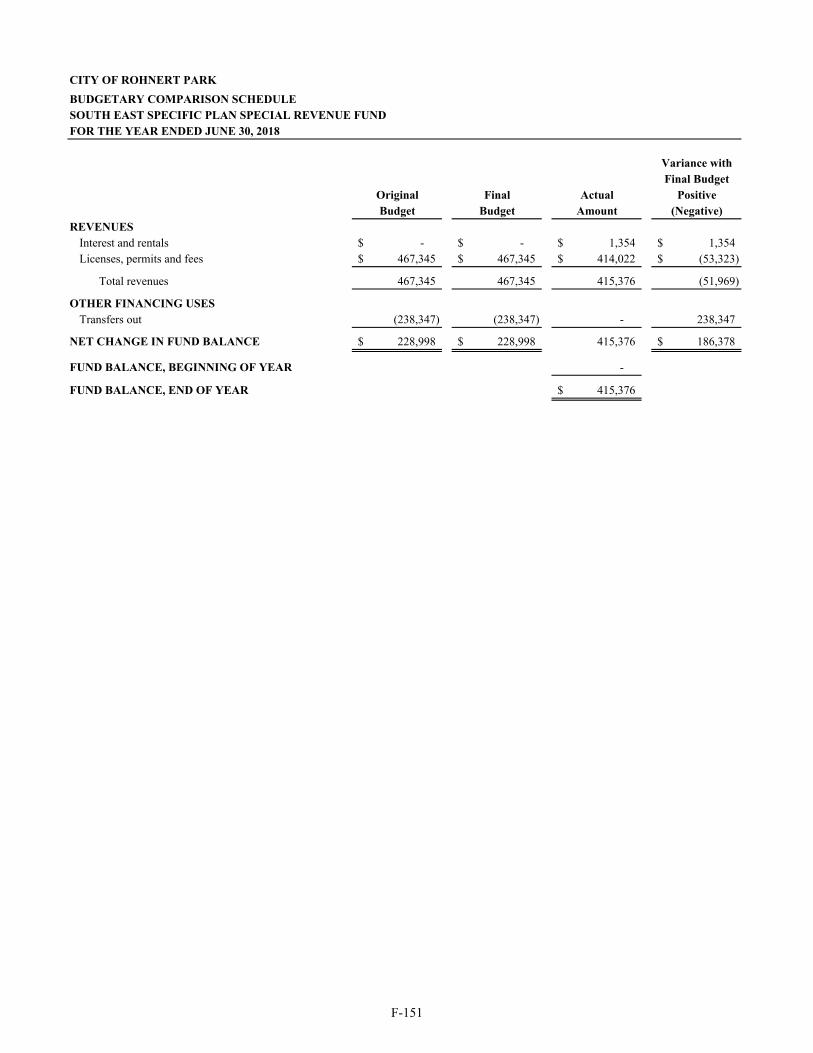
CITY OF ROHNERT PARK
BUDGETARY COMPARISON SCHEDULESOUTH EAST SPECIFIC PLAN SPECIAL REVENUE FUNDFOR THE YEAR ENDED JUNE 30, 2018
Variance withFinal Budget
Original Final Actual PositiveBudget Budget Amount (Negative)
REVENUESInterest and rentals -$ -$ 1,354$ 1,354$ Licenses, permits and fees 467,345$ 467,345$ 414,022$ (53,323)$
Total revenues 467,345 467,345 415,376 (51,969)
OTHER FINANCING USESTransfers out (238,347) (238,347) - 238,347
NET CHANGE IN FUND BALANCE 228,998$ 228,998$ 415,376 186,378$
FUND BALANCE, BEGINNING OF YEAR -
FUND BALANCE, END OF YEAR 415,376$
F-151

F-152
This page is left intentionally blank.
CITY OF ROHNERT PARK
OTHER SUPPLEMENTAL INFORMATION DESCRIPTION OF NONMAJOR ENTERPRISE FUNDS FOR THE FISCAL YEAR ENDED JUNE 30, 2018
F-153
Enterprise Funds account for operations that operate in a manner similar to private business enterprises where the intent of the governing body is that the costs of providing goods and services to the general public on a continuing basis be financed primarily through user charges. The following summarizes the City’s nonmajor Enterprise Funds:
Recycled Water Fund – Accounts for the activities of recycled water operations provided to recycled water customers based on user agreement. The activities include but not limited to, recycled water operations, maintenance, billing and collection. Refuse Collection Fund – Accounts for the remaining assets held in the Refuse Collection Fund. Ordinance No. 851 adopted by the City Council on November 27, 2012 transferred refuse billing and rate setting responsibilities from the City to an independent contractor in accordance with the Second Amended and Restated Agreement. Golf Courses Fund – Accounts for the activities of the City’s golf courses which are under the operational management of Rohnert Park Golf LP doing business as Foxtail Golf Course. The City has implemented a master lease agreement with Rohnert Park Golf LP, a California Limited Partnership to facilitate the improvement, operation, and maintenance of the City’s two golf courses.
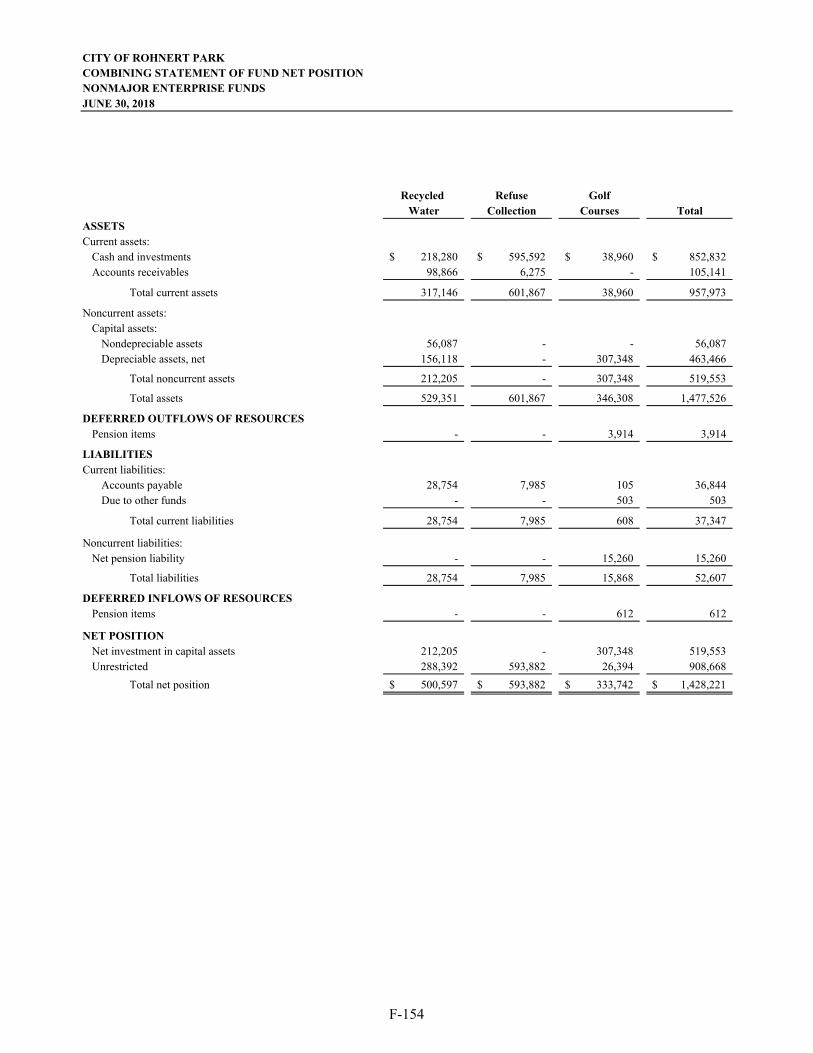
CITY OF ROHNERT PARKCOMBINING STATEMENT OF FUND NET POSITIONNONMAJOR ENTERPRISE FUNDSJUNE 30, 2018
Recycled Refuse GolfWater Collection Courses Total
Current assets:Cash and investments 218,280$ 595,592$ 38,960$ 852,832$ Accounts receivables 98,866 6,275 - 105,141
Total current assets 317,146 601,867 38,960 957,973
Noncurrent assets:Capital assets:
Nondepreciable assets 56,087 - - 56,087 Depreciable assets, net 156,118 - 307,348 463,466
Total noncurrent assets 212,205 - 307,348 519,553
Total assets 529,351 601,867 346,308 1,477,526
Pension items - - 3,914 3,914
Current liabilities:Accounts payable 28,754 7,985 105 36,844 Due to other funds - - 503 503
Total current liabilities 28,754 7,985 608 37,347
Noncurrent liabilities:Net pension liability - - 15,260 15,260
Total liabilities 28,754 7,985 15,868 52,607
Pension items - - 612 612
Net investment in capital assets 212,205 - 307,348 519,553 Unrestricted 288,392 593,882 26,394 908,668
Total net position 500,597$ 593,882$ 333,742$ 1,428,221$
DEFERRED INFLOWS OF RESOURCES
NET POSITION
ASSETS
DEFERRED OUTFLOWS OF RESOURCES
LIABILITIES
F-154
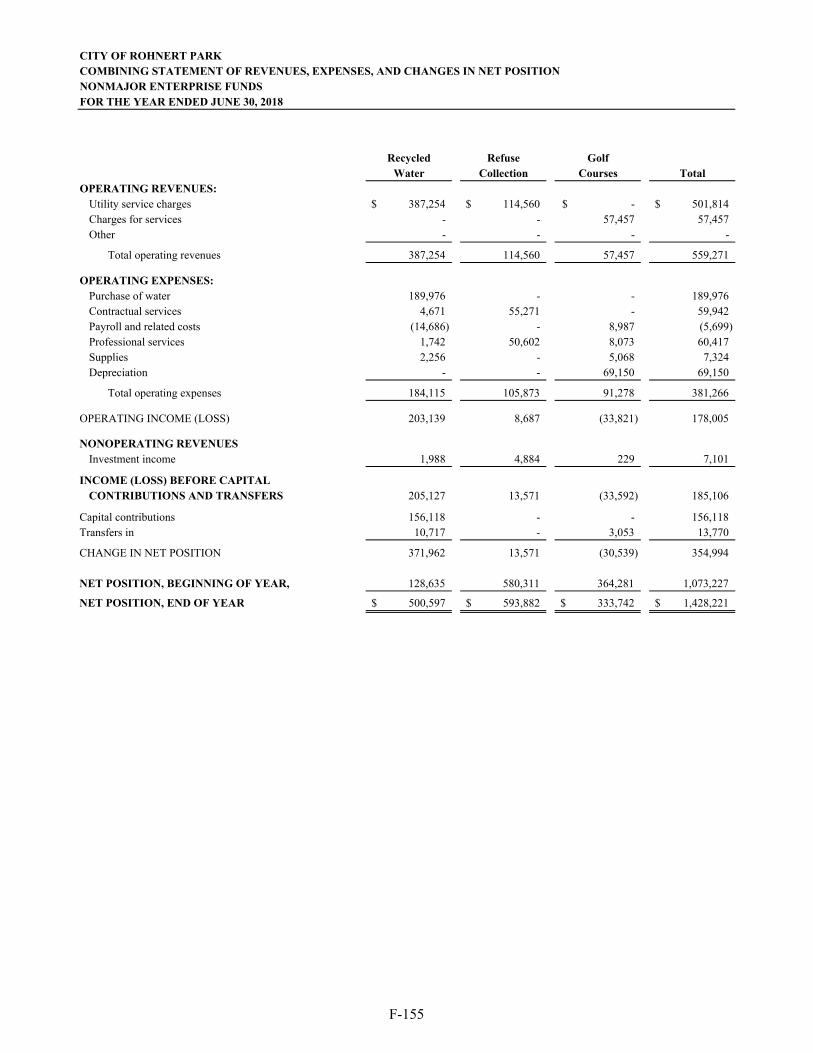
CITY OF ROHNERT PARKCOMBINING STATEMENT OF REVENUES, EXPENSES, AND CHANGES IN NET POSITIONNONMAJOR ENTERPRISE FUNDSFOR THE YEAR ENDED JUNE 30, 2018
Recycled Refuse GolfWater Collection Courses Total
OPERATING REVENUES:Utility service charges 387,254$ 114,560$ -$ 501,814$ Charges for services - - 57,457 57,457 Other - - - -
Total operating revenues 387,254 114,560 57,457 559,271
OPERATING EXPENSES:Purchase of water 189,976 - - 189,976 Contractual services 4,671 55,271 - 59,942 Payroll and related costs (14,686) - 8,987 (5,699) Professional services 1,742 50,602 8,073 60,417 Supplies 2,256 - 5,068 7,324 Depreciation - - 69,150 69,150
Total operating expenses 184,115 105,873 91,278 381,266
OPERATING INCOME (LOSS) 203,139 8,687 (33,821) 178,005
NONOPERATING REVENUESInvestment income 1,988 4,884 229 7,101
INCOME (LOSS) BEFORE CAPITALCONTRIBUTIONS AND TRANSFERS 205,127 13,571 (33,592) 185,106
Capital contributions 156,118 - - 156,118 Transfers in 10,717 - 3,053 13,770
CHANGE IN NET POSITION 371,962 13,571 (30,539) 354,994
NET POSITION, BEGINNING OF YEAR, 128,635 580,311 364,281 1,073,227
NET POSITION, END OF YEAR 500,597$ 593,882$ 333,742$ 1,428,221$
F-155
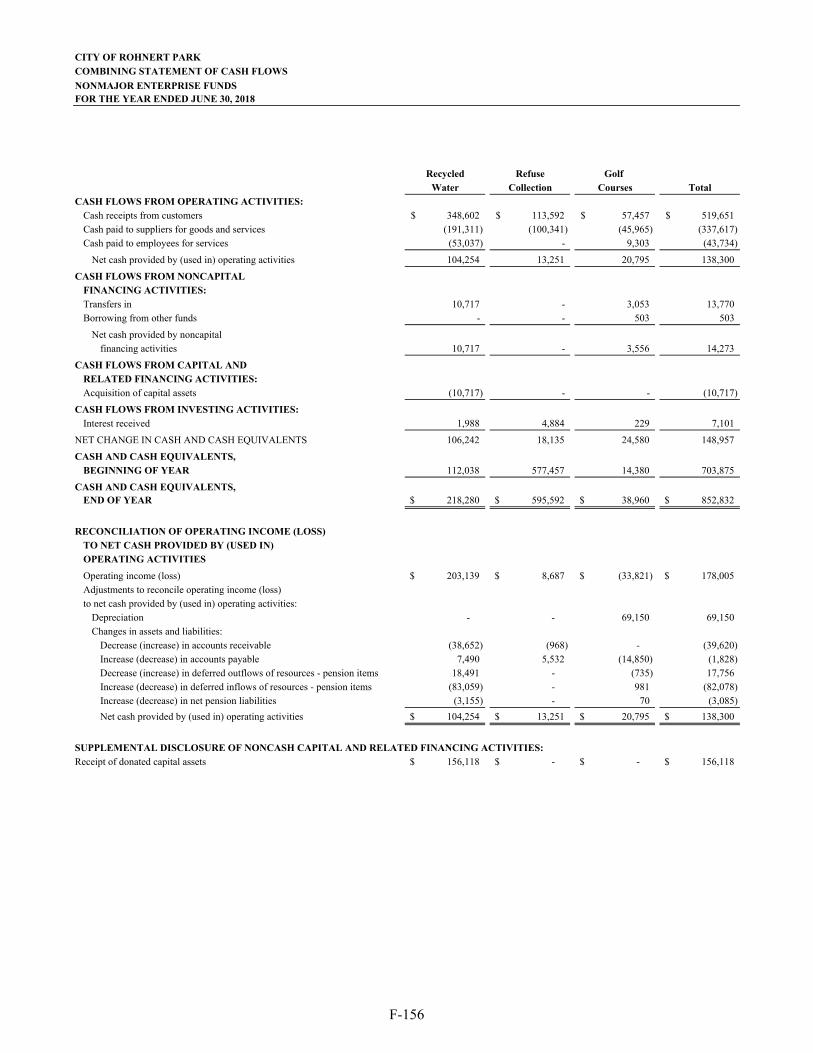
CITY OF ROHNERT PARK
COMBINING STATEMENT OF CASH FLOWS
NONMAJOR ENTERPRISE FUNDSFOR THE YEAR ENDED JUNE 30, 2018
Recycled Refuse Golf Water Collection Courses Total
CASH FLOWS FROM OPERATING ACTIVITIES:Cash receipts from customers 348,602$ 113,592$ 57,457$ 519,651$ Cash paid to suppliers for goods and services (191,311) (100,341) (45,965) (337,617) Cash paid to employees for services (53,037) - 9,303 (43,734)
Net cash provided by (used in) operating activities 104,254 13,251 20,795 138,300
CASH FLOWS FROM NONCAPITAL FINANCING ACTIVITIES:Transfers in 10,717 - 3,053 13,770 Borrowing from other funds - - 503 503
Net cash provided by noncapitalfinancing activities 10,717 - 3,556 14,273
CASH FLOWS FROM CAPITAL AND RELATED FINANCING ACTIVITIES:Acquisition of capital assets (10,717) - - (10,717)
CASH FLOWS FROM INVESTING ACTIVITIES:Interest received 1,988 4,884 229 7,101
NET CHANGE IN CASH AND CASH EQUIVALENTS 106,242 18,135 24,580 148,957
CASH AND CASH EQUIVALENTS, BEGINNING OF YEAR 112,038 577,457 14,380 703,875
CASH AND CASH EQUIVALENTS, END OF YEAR 218,280$ 595,592$ 38,960$ 852,832$
RECONCILIATION OF OPERATING INCOME (LOSS)TO NET CASH PROVIDED BY (USED IN)OPERATING ACTIVITIES
Operating income (loss) 203,139$ 8,687$ (33,821)$ 178,005$ Adjustments to reconcile operating income (loss)to net cash provided by (used in) operating activities:
Depreciation - - 69,150 69,150 Changes in assets and liabilities:
Decrease (increase) in accounts receivable (38,652) (968) - (39,620) Increase (decrease) in accounts payable 7,490 5,532 (14,850) (1,828) Decrease (increase) in deferred outflows of resources - pension items 18,491 - (735) 17,756 Increase (decrease) in deferred inflows of resources - pension items (83,059) - 981 (82,078) Increase (decrease) in net pension liabilities (3,155) - 70 (3,085)
Net cash provided by (used in) operating activities 104,254$ 13,251$ 20,795$ 138,300$
SUPPLEMENTAL DISCLOSURE OF NONCASH CAPITAL AND RELATED FINANCING ACTIVITIES:Receipt of donated capital assets 156,118$ -$ -$ 156,118$
F-156
CITY OF ROHNERT PARK
OTHER SUPPLEMENTAL INFORMATION DESCRIPTION OF INTERNAL SERVICE FUNDS FOR THE FISCAL YEAR ENDED JUNE 30, 2018
F-157
Internal Service Funds are used to account for the accumulation of resources and the allocation and reimbursement of costs for service provided between City departments and functions. The following summarizes the City’s Internal Service Funds:
Information Technology Fund - Accounts for the cost of providing information technology services to City departments including: purchasing, operating and maintaining the City’s voice, data, computer systems and its infrastructure.
Vehicle Replacement Fund - Accounts for the accumulation of resources, and related expenses incurred for future replacement of major equipment and vehicles in the City.
Fleet Management Fund – Accounts for the cost of providing fleet management services to City departments with services including: vehicle repairs, preventative maintenance and quality control inspections.
Infrastructure Fund – Accounts for the accumulation of resources, and related expense incurred for future replacement of City infrastructure.
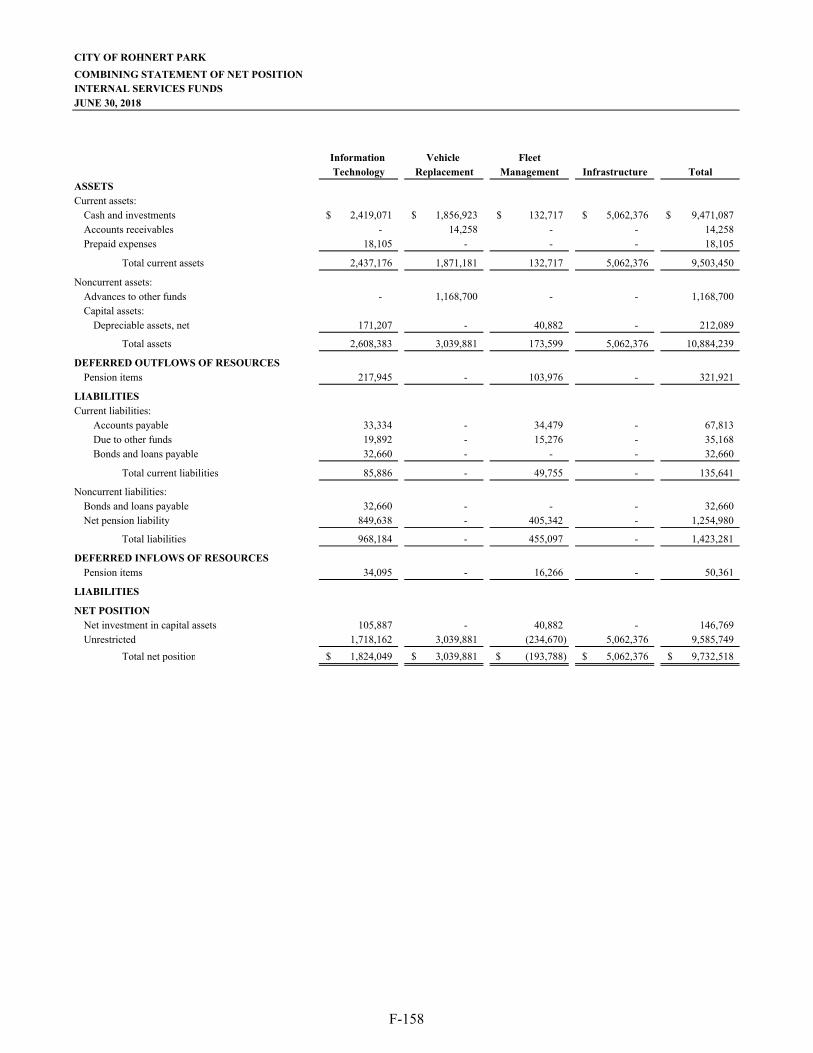
CITY OF ROHNERT PARK
COMBINING STATEMENT OF NET POSITIONINTERNAL SERVICES FUNDSJUNE 30, 2018
Information Vehicle FleetTechnology Replacement Management Infrastructure Total
Current assets:Cash and investments 2,419,071$ 1,856,923$ 132,717$ 5,062,376$ 9,471,087$ Accounts receivables - 14,258 - - 14,258 Prepaid expenses 18,105 - - - 18,105
Total current assets 2,437,176 1,871,181 132,717 5,062,376 9,503,450
Noncurrent assets:Advances to other funds - 1,168,700 - - 1,168,700 Capital assets:
Depreciable assets, net 171,207 - 40,882 - 212,089
Total assets 2,608,383 3,039,881 173,599 5,062,376 10,884,239
Pension items 217,945 - 103,976 - 321,921
Current liabilities:Accounts payable 33,334 - 34,479 - 67,813 Due to other funds 19,892 - 15,276 - 35,168 Bonds and loans payable 32,660 - - - 32,660
Total current liabilities 85,886 - 49,755 - 135,641
Noncurrent liabilities:Bonds and loans payable 32,660 - - - 32,660 Net pension liability 849,638 - 405,342 - 1,254,980
Total liabilities 968,184 - 455,097 - 1,423,281
Pension items 34,095 - 16,266 - 50,361
Net investment in capital assets 105,887 - 40,882 - 146,769 Unrestricted 1,718,162 3,039,881 (234,670) 5,062,376 9,585,749
Total net position 1,824,049$ 3,039,881$ (193,788)$ 5,062,376$ 9,732,518$
ASSETS
LIABILITIES
NET POSITION
DEFERRED OUTFLOWS OF RESOURCES
DEFERRED INFLOWS OF RESOURCES
LIABILITIES
F-158
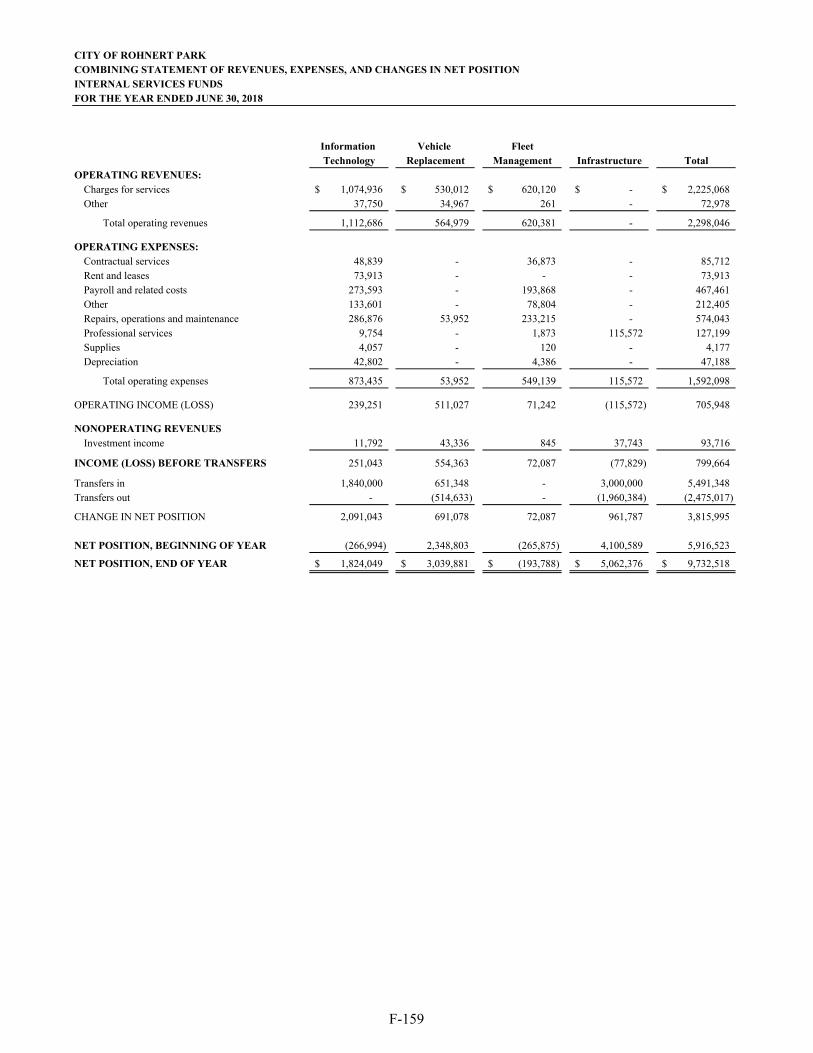
CITY OF ROHNERT PARKCOMBINING STATEMENT OF REVENUES, EXPENSES, AND CHANGES IN NET POSITIONINTERNAL SERVICES FUNDSFOR THE YEAR ENDED JUNE 30, 2018
Information Vehicle FleetTechnology Replacement Management Infrastructure Total
OPERATING REVENUES:Charges for services 1,074,936$ 530,012$ 620,120$ -$ 2,225,068$ Other 37,750 34,967 261 - 72,978
Total operating revenues 1,112,686 564,979 620,381 - 2,298,046
OPERATING EXPENSES:Contractual services 48,839 - 36,873 - 85,712 Rent and leases 73,913 - - - 73,913 Payroll and related costs 273,593 - 193,868 - 467,461 Other 133,601 - 78,804 - 212,405 Repairs, operations and maintenance 286,876 53,952 233,215 - 574,043 Professional services 9,754 - 1,873 115,572 127,199 Supplies 4,057 - 120 - 4,177 Depreciation 42,802 - 4,386 - 47,188
Total operating expenses 873,435 53,952 549,139 115,572 1,592,098
OPERATING INCOME (LOSS) 239,251 511,027 71,242 (115,572) 705,948
NONOPERATING REVENUESInvestment income 11,792 43,336 845 37,743 93,716
INCOME (LOSS) BEFORE TRANSFERS 251,043 554,363 72,087 (77,829) 799,664
Transfers in 1,840,000 651,348 - 3,000,000 5,491,348 Transfers out - (514,633) - (1,960,384) (2,475,017)
CHANGE IN NET POSITION 2,091,043 691,078 72,087 961,787 3,815,995
NET POSITION, BEGINNING OF YEAR (266,994) 2,348,803 (265,875) 4,100,589 5,916,523
NET POSITION, END OF YEAR 1,824,049$ 3,039,881$ (193,788)$ 5,062,376$ 9,732,518$
F-159
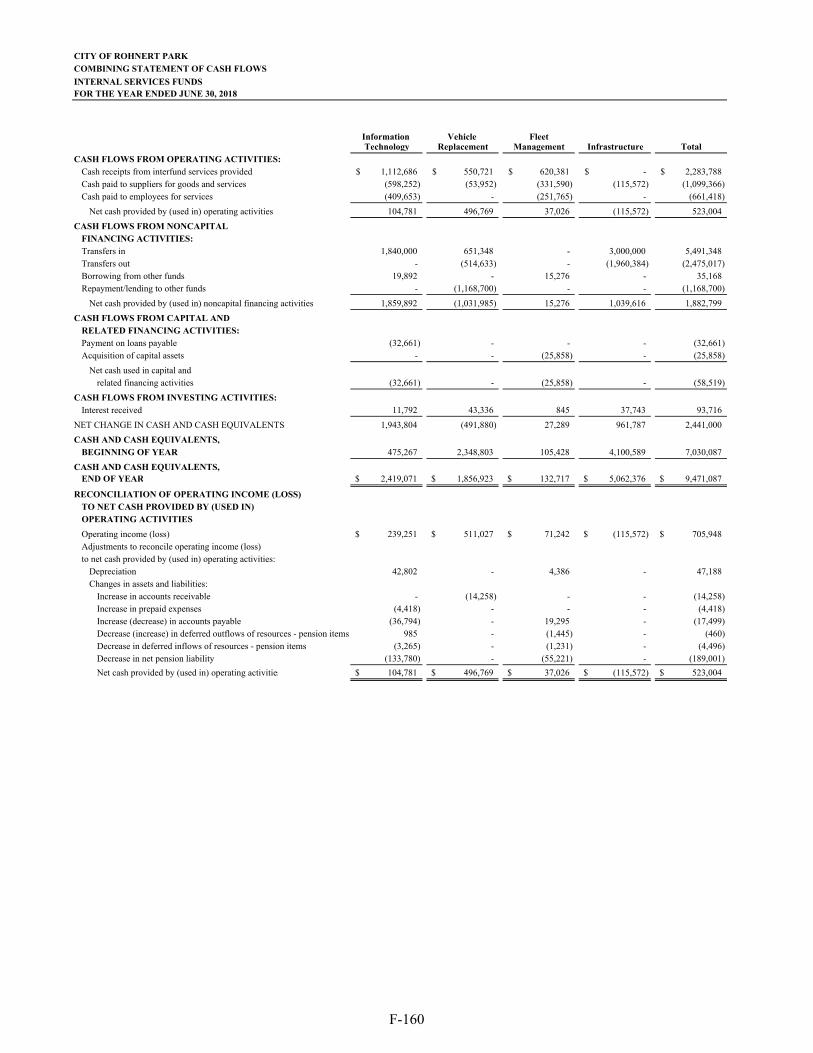
CITY OF ROHNERT PARK
COMBINING STATEMENT OF CASH FLOWS
INTERNAL SERVICES FUNDSFOR THE YEAR ENDED JUNE 30, 2018
Information Vehicle FleetTechnology Replacement Management Infrastructure Total
CASH FLOWS FROM OPERATING ACTIVITIES:Cash receipts from interfund services provided 1,112,686$ 550,721$ 620,381$ -$ 2,283,788$ Cash paid to suppliers for goods and services (598,252) (53,952) (331,590) (115,572) (1,099,366) Cash paid to employees for services (409,653) - (251,765) - (661,418)
Net cash provided by (used in) operating activities 104,781 496,769 37,026 (115,572) 523,004
CASH FLOWS FROM NONCAPITAL FINANCING ACTIVITIES:Transfers in 1,840,000 651,348 - 3,000,000 5,491,348 Transfers out - (514,633) - (1,960,384) (2,475,017) Borrowing from other funds 19,892 - 15,276 - 35,168 Repayment/lending to other funds - (1,168,700) - - (1,168,700)
Net cash provided by (used in) noncapital financing activities 1,859,892 (1,031,985) 15,276 1,039,616 1,882,799
CASH FLOWS FROM CAPITAL AND RELATED FINANCING ACTIVITIES:Payment on loans payable (32,661) - - - (32,661) Acquisition of capital assets - - (25,858) - (25,858)
Net cash used in capital and related financing activities (32,661) - (25,858) - (58,519)
CASH FLOWS FROM INVESTING ACTIVITIES:Interest received 11,792 43,336 845 37,743 93,716
NET CHANGE IN CASH AND CASH EQUIVALENTS 1,943,804 (491,880) 27,289 961,787 2,441,000
CASH AND CASH EQUIVALENTS, BEGINNING OF YEAR 475,267 2,348,803 105,428 4,100,589 7,030,087
CASH AND CASH EQUIVALENTS, END OF YEAR 2,419,071$ 1,856,923$ 132,717$ 5,062,376$ 9,471,087$
RECONCILIATION OF OPERATING INCOME (LOSS)TO NET CASH PROVIDED BY (USED IN)OPERATING ACTIVITIES
Operating income (loss) 239,251$ 511,027$ 71,242$ (115,572)$ 705,948$ Adjustments to reconcile operating income (loss)to net cash provided by (used in) operating activities:
Depreciation 42,802 - 4,386 - 47,188 Changes in assets and liabilities:
Increase in accounts receivable - (14,258) - - (14,258) Increase in prepaid expenses (4,418) - - - (4,418) Increase (decrease) in accounts payable (36,794) - 19,295 - (17,499) Decrease (increase) in deferred outflows of resources - pension items 985 - (1,445) - (460) Decrease in deferred inflows of resources - pension items (3,265) - (1,231) - (4,496) Decrease in net pension liability (133,780) - (55,221) - (189,001)
Net cash provided by (used in) operating activities 104,781$ 496,769$ 37,026$ (115,572)$ 523,004$
F-160
CITY OF ROHNERT PARK
OTHER SUPPLEMENTAL INFORMATION DESCRIPTION OF FIDUCIARY FUNDS FOR THE FISCAL YEAR ENDED JUNE 30, 2018
F-161
PRIVATE PURPOSE TRUST FUNDS
Private Purpose Trust Fund is a fiduciary fund type used to account for resources held and administrated under trust or similar arrangement for the benefits of individuals, private organizations, or other governments. The City reports the following private purpose trust funds: Assets Seizure Fund - Accounts for Federal and State seized assets held by the City in a trustee capacity until the County of Sonoma District Attorney’s Office requests for remittance of the assets. Redevelopment Successor Agency Fund – Accounts for the assets and activities to wind down the affairs of the former Community Development Commission (Commission). This fund accounts for the receipt of property tax revenues pursuant to the Redevelopment Dissolution Act and the assets transferred from the Commission. The Successor Agency’s assets can only be used to pay enforceable obligations in existence at the date of dissolution pursuant to the Recognized Obligation Payment Schedules approved by the California Department of Finance under the Redevelopment Dissolution Act. AGENCY FUNDS
Agency fund is a fiduciary fund type used to account for resources held by the City in a custodial capacity and do not involve measurement of results of operations. The City report the following agency fund: SoMo Village Trust - Accounts for assets held by the City in a custodial capacity for a developer for the construction of a soccer field.
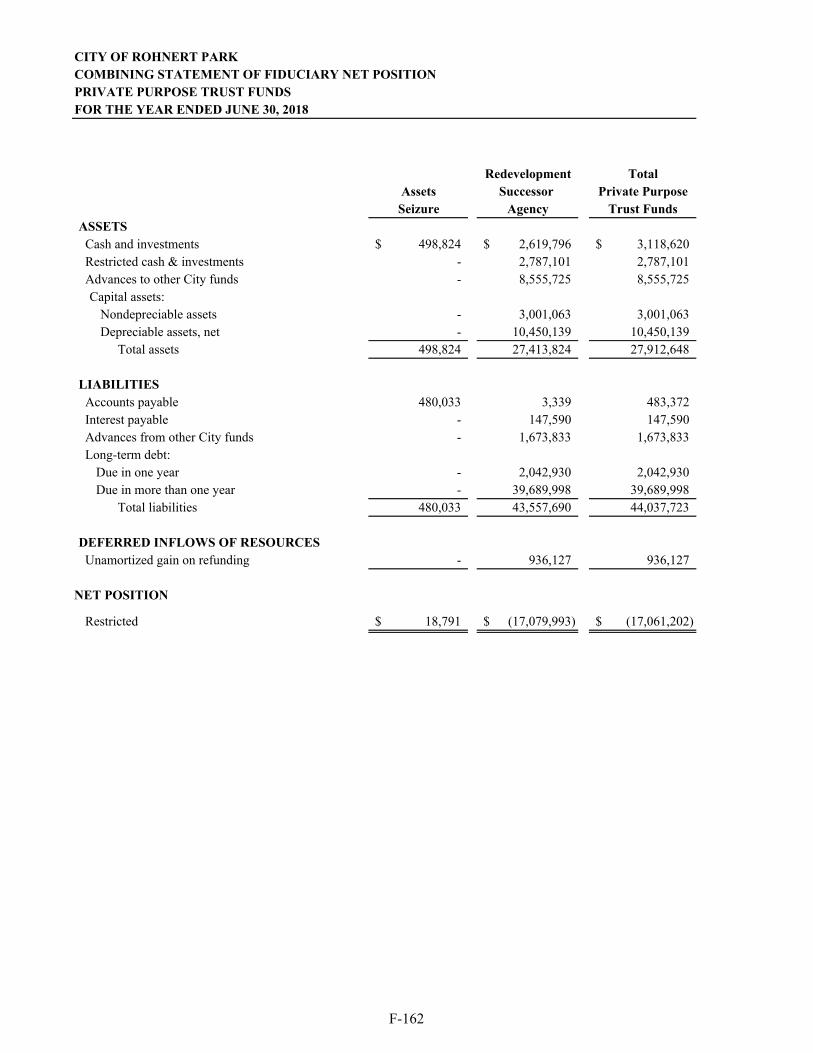
CITY OF ROHNERT PARKCOMBINING STATEMENT OF FIDUCIARY NET POSITIONPRIVATE PURPOSE TRUST FUNDSFOR THE YEAR ENDED JUNE 30, 2018
Redevelopment TotalAssets Successor Private PurposeSeizure Agency Trust Funds
Cash and investments 498,824$ 2,619,796$ 3,118,620$ Restricted cash & investments - 2,787,101 2,787,101 Advances to other City funds - 8,555,725 8,555,725 Capital assets:
Nondepreciable assets - 3,001,063 3,001,063 Depreciable assets, net - 10,450,139 10,450,139
Total assets 498,824 27,413,824 27,912,648
Accounts payable 480,033 3,339 483,372 Interest payable - 147,590 147,590 Advances from other City funds - 1,673,833 1,673,833 Long-term debt:
Due in one year - 2,042,930 2,042,930 Due in more than one year - 39,689,998 39,689,998
Total liabilities 480,033 43,557,690 44,037,723
Unamortized gain on refunding - 936,127 936,127
Restricted 18,791$ (17,079,993)$ (17,061,202)$
ASSETS
LIABILITIES
NET POSITION
DEFERRED INFLOWS OF RESOURCES
F-162
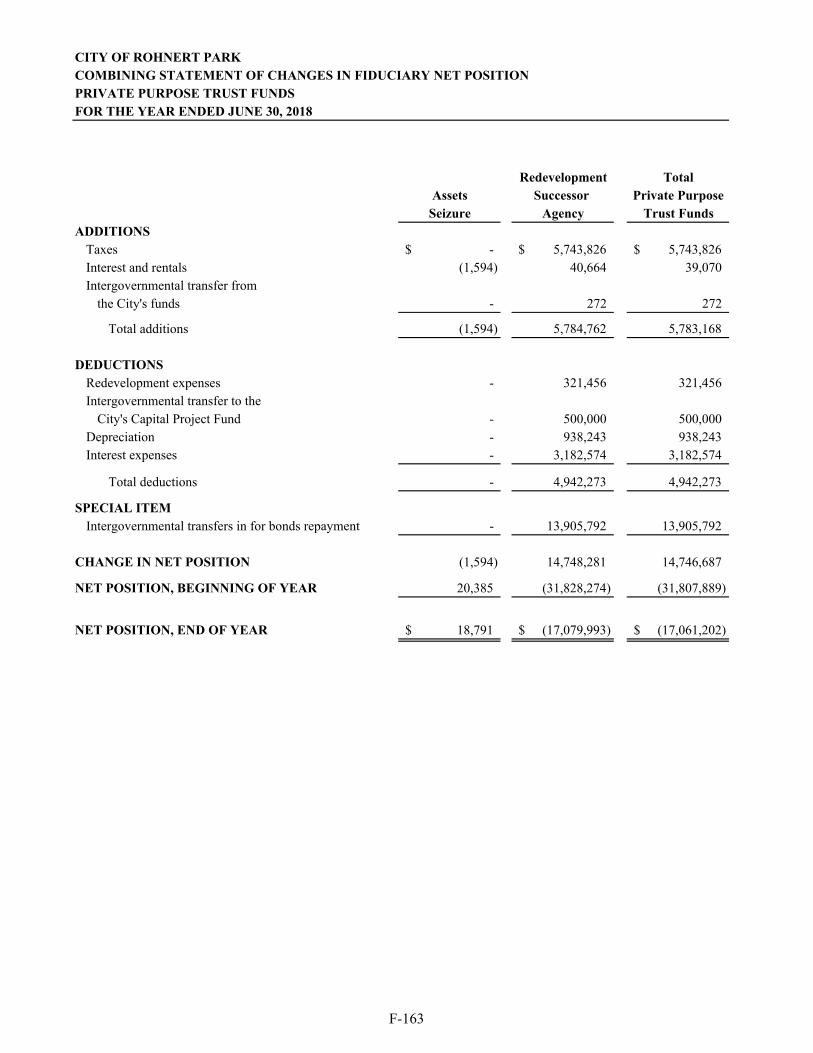
CITY OF ROHNERT PARKCOMBINING STATEMENT OF CHANGES IN FIDUCIARY NET POSITION PRIVATE PURPOSE TRUST FUNDSFOR THE YEAR ENDED JUNE 30, 2018
Redevelopment TotalAssets Successor Private Purpose
Seizure Agency Trust FundsADDITIONS
Taxes -$ 5,743,826$ 5,743,826$ Interest and rentals (1,594) 40,664 39,070 Intergovernmental transfer from
the City's funds - 272 272
Total additions (1,594) 5,784,762 5,783,168
DEDUCTIONSRedevelopment expenses - 321,456 321,456 Intergovernmental transfer to the
City's Capital Project Fund - 500,000 500,000 Depreciation - 938,243 938,243 Interest expenses - 3,182,574 3,182,574
Total deductions - 4,942,273 4,942,273
SPECIAL ITEMIntergovernmental transfers in for bonds repayment - 13,905,792 13,905,792
CHANGE IN NET POSITION (1,594) 14,748,281 14,746,687
NET POSITION, BEGINNING OF YEAR 20,385 (31,828,274) (31,807,889)
NET POSITION, END OF YEAR 18,791$ (17,079,993)$ (17,061,202)$
F-163
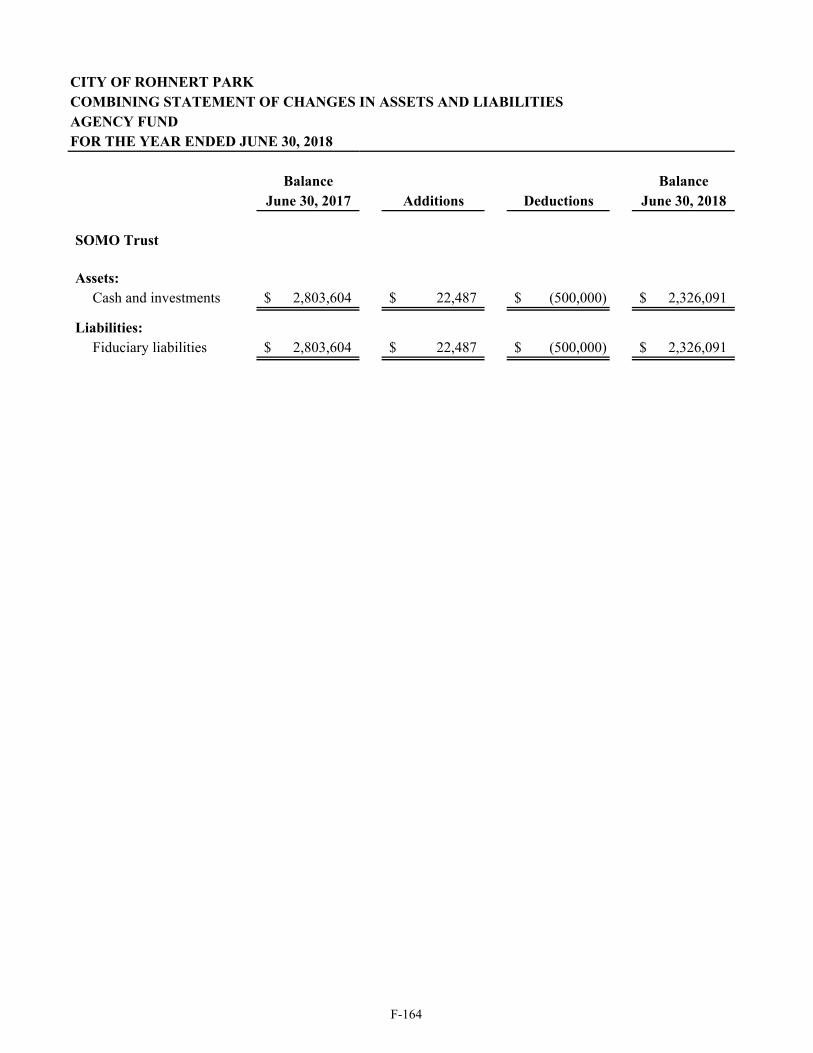
CITY OF ROHNERT PARKCOMBINING STATEMENT OF CHANGES IN ASSETS AND LIABILITIESAGENCY FUNDFOR THE YEAR ENDED JUNE 30, 2018
Balance BalanceJune 30, 2017 Additions Deductions June 30, 2018
SOMO Trust
Assets:Cash and investments 2,803,604$ 22,487$ (500,000)$ 2,326,091$
Fiduciary liabilities 2,803,604$ 22,487$ (500,000)$ 2,326,091$ Liabilities:
F-164
S-1
STATISTICAL SECTION
Index to Statistical Section
Contents Page
Financial Trends S-3
These schedules contain trend information to help the reader understand how the City's financial performance and well-being have changed over time.
Revenue Capacity S-10These schedules contain information to help the reader assess the factors affecting the City's ability to generate its property and sales taxes.
Debt Capacity S-16
These schedules present information to help the reader assess the affordability of the City'scurrent levels of outstanding debt and the City's ability to issue additional debt in the future.
Demographic and Economic Information S-20These schedules offer demographic and economic indicators to help the reader understand the environment within which the City's financial activities take place and to help make comparisons over time and with other governments.
Operating Information S-22
These schedules contain information about the City's operations and resources to help the reader understand how the City's financial information relates to the services the City provides and the activities it performs.
This part of the City's comprehensive annual financial report presents detailed information asa context for understanding what the information in the financial statements, notedisclosures, and required supplementary information says about the City's overall financialhealth.
S-2
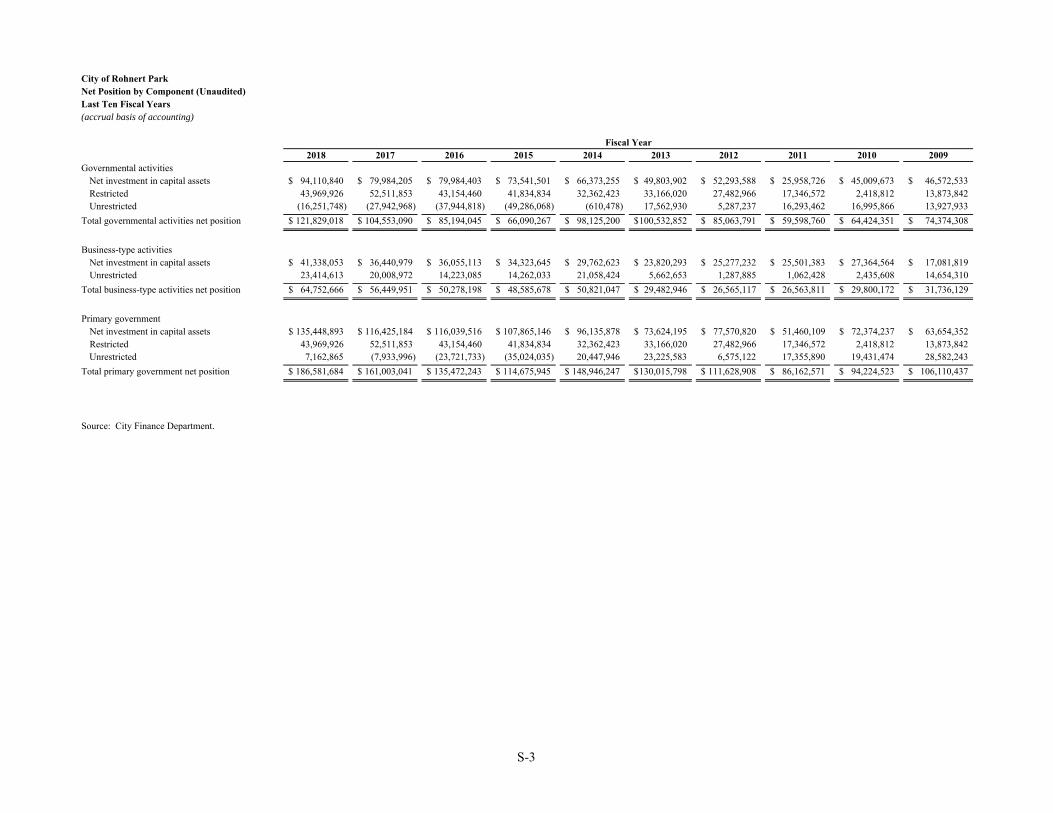
City of Rohnert ParkNet Position by Component (Unaudited)Last Ten Fiscal Years(accrual basis of accounting)
2018 2017 2016 2015 2014 2013 2012 2011 2010 2009Governmental activities
Net investment in capital assets 94,110,840$ 79,984,205$ 79,984,403$ 73,541,501$ 66,373,255$ 49,803,902$ 52,293,588$ 25,958,726$ 45,009,673$ 46,572,533$ Restricted 43,969,926 52,511,853 43,154,460 41,834,834 32,362,423 33,166,020 27,482,966 17,346,572 2,418,812 13,873,842 Unrestricted (16,251,748) (27,942,968) (37,944,818) (49,286,068) (610,478) 17,562,930 5,287,237 16,293,462 16,995,866 13,927,933
Total governmental activities net position 121,829,018$ 104,553,090$ 85,194,045$ 66,090,267$ 98,125,200$ 100,532,852$ 85,063,791$ 59,598,760$ 64,424,351$ 74,374,308$
Business-type activitiesNet investment in capital assets 41,338,053$ 36,440,979$ 36,055,113$ 34,323,645$ 29,762,623$ 23,820,293$ 25,277,232$ 25,501,383$ 27,364,564$ 17,081,819$ Unrestricted 23,414,613 20,008,972 14,223,085 14,262,033 21,058,424 5,662,653 1,287,885 1,062,428 2,435,608 14,654,310
Total business-type activities net position 64,752,666$ 56,449,951$ 50,278,198$ 48,585,678$ 50,821,047$ 29,482,946$ 26,565,117$ 26,563,811$ 29,800,172$ 31,736,129$
Primary governmentNet investment in capital assets 135,448,893$ 116,425,184$ 116,039,516$ 107,865,146$ 96,135,878$ 73,624,195$ 77,570,820$ 51,460,109$ 72,374,237$ 63,654,352$ Restricted 43,969,926 52,511,853 43,154,460 41,834,834 32,362,423 33,166,020 27,482,966 17,346,572 2,418,812 13,873,842 Unrestricted 7,162,865 (7,933,996) (23,721,733) (35,024,035) 20,447,946 23,225,583 6,575,122 17,355,890 19,431,474 28,582,243
Total primary government net position 186,581,684$ 161,003,041$ 135,472,243$ 114,675,945$ 148,946,247$ 130,015,798$ 111,628,908$ 86,162,571$ 94,224,523$ 106,110,437$
Source: City Finance Department.
Fiscal Year
S-3
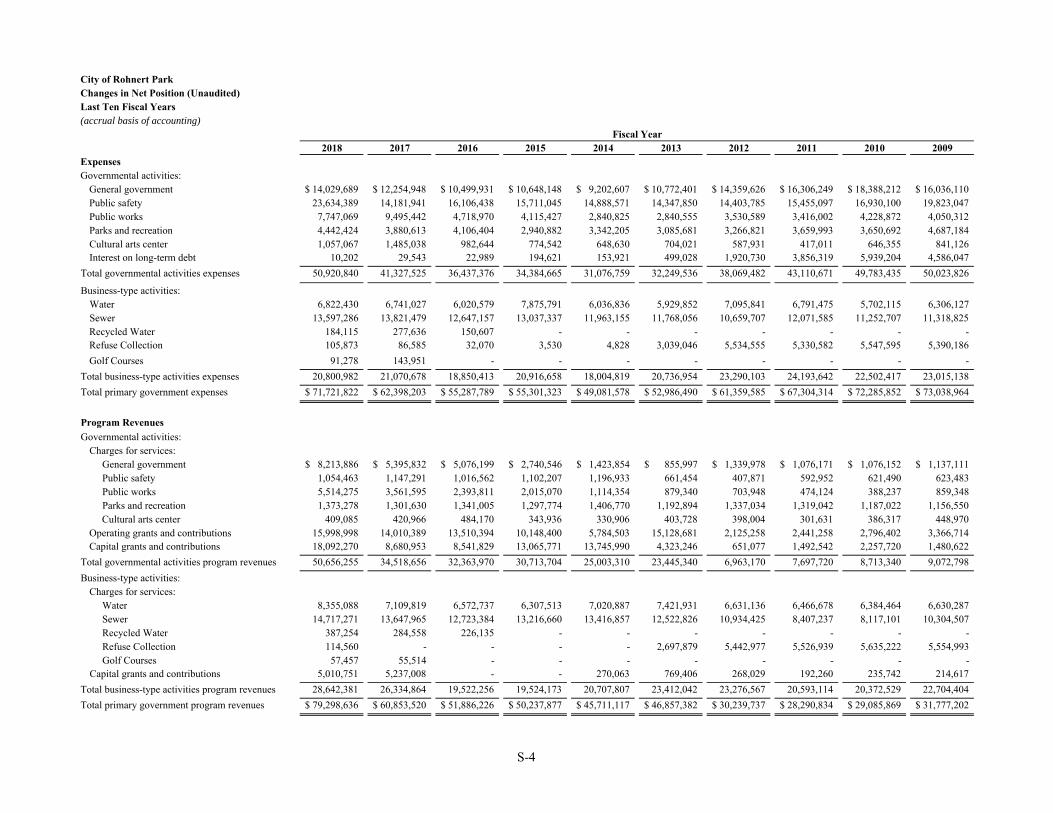
City of Rohnert ParkChanges in Net Position (Unaudited)Last Ten Fiscal Years(accrual basis of accounting)
2018 2017 2016 2015 2014 2013 2012 2011 2010 2009ExpensesGovernmental activities:
General government 14,029,689$ 12,254,948$ 10,499,931$ 10,648,148$ 9,202,607$ 10,772,401$ 14,359,626$ 16,306,249$ 18,388,212$ 16,036,110$ Public safety 23,634,389 14,181,941 16,106,438 15,711,045 14,888,571 14,347,850 14,403,785 15,455,097 16,930,100 19,823,047 Public works 7,747,069 9,495,442 4,718,970 4,115,427 2,840,825 2,840,555 3,530,589 3,416,002 4,228,872 4,050,312 Parks and recreation 4,442,424 3,880,613 4,106,404 2,940,882 3,342,205 3,085,681 3,266,821 3,659,993 3,650,692 4,687,184 Cultural arts center 1,057,067 1,485,038 982,644 774,542 648,630 704,021 587,931 417,011 646,355 841,126 Interest on long-term debt 10,202 29,543 22,989 194,621 153,921 499,028 1,920,730 3,856,319 5,939,204 4,586,047
Total governmental activities expenses 50,920,840 41,327,525 36,437,376 34,384,665 31,076,759 32,249,536 38,069,482 43,110,671 49,783,435 50,023,826
Business-type activities:Water 6,822,430 6,741,027 6,020,579 7,875,791 6,036,836 5,929,852 7,095,841 6,791,475 5,702,115 6,306,127 Sewer 13,597,286 13,821,479 12,647,157 13,037,337 11,963,155 11,768,056 10,659,707 12,071,585 11,252,707 11,318,825 Recycled Water 184,115 277,636 150,607 - - - - - - - Refuse Collection 105,873 86,585 32,070 3,530 4,828 3,039,046 5,534,555 5,330,582 5,547,595 5,390,186
Golf Courses 91,278 143,951 - - - - - - - -
Total business-type activities expenses 20,800,982 21,070,678 18,850,413 20,916,658 18,004,819 20,736,954 23,290,103 24,193,642 22,502,417 23,015,138
Total primary government expenses 71,721,822$ 62,398,203$ 55,287,789$ 55,301,323$ 49,081,578$ 52,986,490$ 61,359,585$ 67,304,314$ 72,285,852$ 73,038,964$
Program Revenues
Governmental activities:Charges for services: General government 8,213,886$ 5,395,832$ 5,076,199$ 2,740,546$ 1,423,854$ 855,997$ 1,339,978$ 1,076,171$ 1,076,152$ 1,137,111$ Public safety 1,054,463 1,147,291 1,016,562 1,102,207 1,196,933 661,454 407,871 592,952 621,490 623,483 Public works 5,514,275 3,561,595 2,393,811 2,015,070 1,114,354 879,340 703,948 474,124 388,237 859,348 Parks and recreation 1,373,278 1,301,630 1,341,005 1,297,774 1,406,770 1,192,894 1,337,034 1,319,042 1,187,022 1,156,550 Cultural arts center 409,085 420,966 484,170 343,936 330,906 403,728 398,004 301,631 386,317 448,970 Operating grants and contributions 15,998,998 14,010,389 13,510,394 10,148,400 5,784,503 15,128,681 2,125,258 2,441,258 2,796,402 3,366,714 Capital grants and contributions 18,092,270 8,680,953 8,541,829 13,065,771 13,745,990 4,323,246 651,077 1,492,542 2,257,720 1,480,622
Total governmental activities program revenues 50,656,255 34,518,656 32,363,970 30,713,704 25,003,310 23,445,340 6,963,170 7,697,720 8,713,340 9,072,798
Business-type activities:Charges for services: Water 8,355,088 7,109,819 6,572,737 6,307,513 7,020,887 7,421,931 6,631,136 6,466,678 6,384,464 6,630,287 Sewer 14,717,271 13,647,965 12,723,384 13,216,660 13,416,857 12,522,826 10,934,425 8,407,237 8,117,101 10,304,507 Recycled Water 387,254 284,558 226,135 - - - - - - - Refuse Collection 114,560 - - - - 2,697,879 5,442,977 5,526,939 5,635,222 5,554,993 Golf Courses 57,457 55,514 - - - - - - - - Capital grants and contributions 5,010,751 5,237,008 - - 270,063 769,406 268,029 192,260 235,742 214,617
Total business-type activities program revenues 28,642,381 26,334,864 19,522,256 19,524,173 20,707,807 23,412,042 23,276,567 20,593,114 20,372,529 22,704,404
Total primary government program revenues 79,298,636$ 60,853,520$ 51,886,226$ 50,237,877$ 45,711,117$ 46,857,382$ 30,239,737$ 28,290,834$ 29,085,869$ 31,777,202$
Fiscal Year
S-4
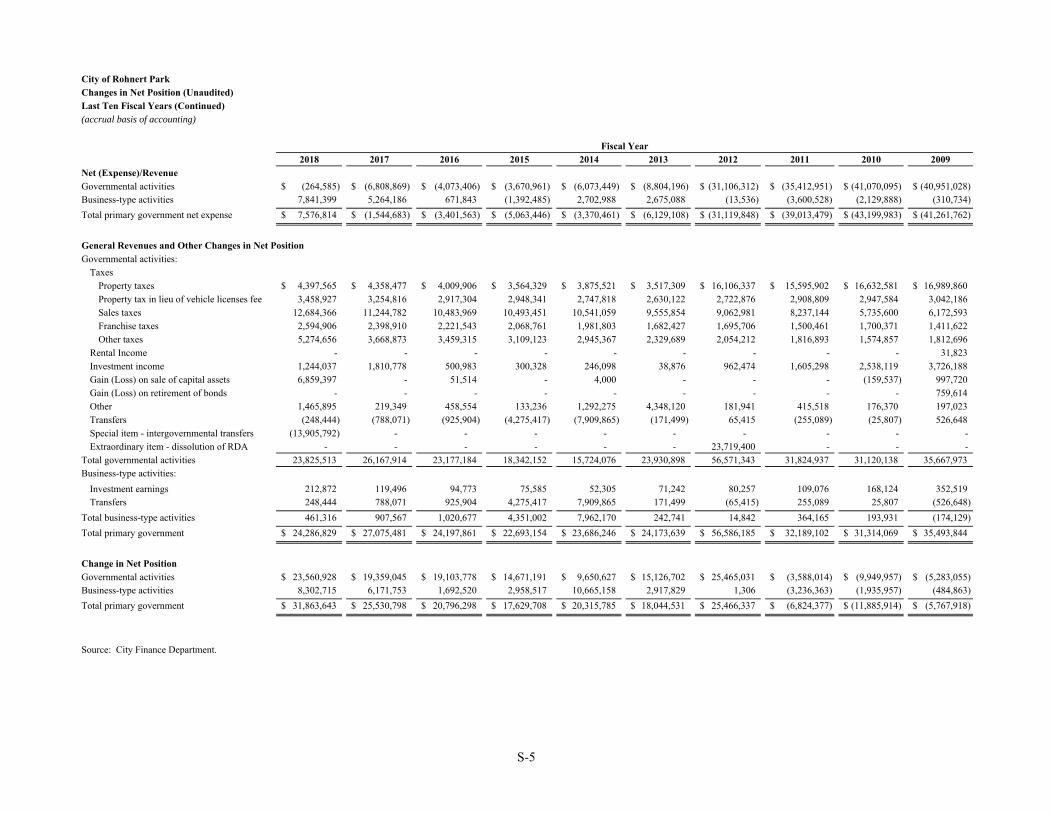
City of Rohnert ParkChanges in Net Position (Unaudited)Last Ten Fiscal Years (Continued)(accrual basis of accounting)
2018 2017 2016 2015 2014 2013 2012 2011 2010 2009Net (Expense)/RevenueGovernmental activities (264,585)$ (6,808,869)$ (4,073,406)$ (3,670,961)$ (6,073,449)$ (8,804,196)$ (31,106,312)$ (35,412,951)$ (41,070,095)$ (40,951,028)$ Business-type activities 7,841,399 5,264,186 671,843 (1,392,485) 2,702,988 2,675,088 (13,536) (3,600,528) (2,129,888) (310,734)
Total primary government net expense 7,576,814$ (1,544,683)$ (3,401,563)$ (5,063,446)$ (3,370,461)$ (6,129,108)$ (31,119,848)$ (39,013,479)$ (43,199,983)$ (41,261,762)$
General Revenues and Other Changes in Net PositionGovernmental activities:
TaxesProperty taxes 4,397,565$ 4,358,477$ 4,009,906$ 3,564,329$ 3,875,521$ 3,517,309$ 16,106,337$ 15,595,902$ 16,632,581$ 16,989,860$ Property tax in lieu of vehicle licenses fee 3,458,927 3,254,816 2,917,304 2,948,341 2,747,818 2,630,122 2,722,876 2,908,809 2,947,584 3,042,186 Sales taxes 12,684,366 11,244,782 10,483,969 10,493,451 10,541,059 9,555,854 9,062,981 8,237,144 5,735,600 6,172,593 Franchise taxes 2,594,906 2,398,910 2,221,543 2,068,761 1,981,803 1,682,427 1,695,706 1,500,461 1,700,371 1,411,622 Other taxes 5,274,656 3,668,873 3,459,315 3,109,123 2,945,367 2,329,689 2,054,212 1,816,893 1,574,857 1,812,696
Rental Income - - - - - - - - - 31,823 Investment income 1,244,037 1,810,778 500,983 300,328 246,098 38,876 962,474 1,605,298 2,538,119 3,726,188 Gain (Loss) on sale of capital assets 6,859,397 - 51,514 - 4,000 - - - (159,537) 997,720 Gain (Loss) on retirement of bonds - - - - - - - - - 759,614 Other 1,465,895 219,349 458,554 133,236 1,292,275 4,348,120 181,941 415,518 176,370 197,023 Transfers (248,444) (788,071) (925,904) (4,275,417) (7,909,865) (171,499) 65,415 (255,089) (25,807) 526,648 Special item - intergovernmental transfers (13,905,792) - - - - - - - - - Extraordinary item - dissolution of RDA - - - - - - 23,719,400 - - -
Total governmental activities 23,825,513 26,167,914 23,177,184 18,342,152 15,724,076 23,930,898 56,571,343 31,824,937 31,120,138 35,667,973 Business-type activities:
Investment earnings 212,872 119,496 94,773 75,585 52,305 71,242 80,257 109,076 168,124 352,519 Transfers 248,444 788,071 925,904 4,275,417 7,909,865 171,499 (65,415) 255,089 25,807 (526,648)
Total business-type activities 461,316 907,567 1,020,677 4,351,002 7,962,170 242,741 14,842 364,165 193,931 (174,129)
Total primary government 24,286,829$ 27,075,481$ 24,197,861$ 22,693,154$ 23,686,246$ 24,173,639$ 56,586,185$ 32,189,102$ 31,314,069$ 35,493,844$
Change in Net PositionGovernmental activities 23,560,928$ 19,359,045$ 19,103,778$ 14,671,191$ 9,650,627$ 15,126,702$ 25,465,031$ (3,588,014)$ (9,949,957)$ (5,283,055)$ Business-type activities 8,302,715 6,171,753 1,692,520 2,958,517 10,665,158 2,917,829 1,306 (3,236,363) (1,935,957) (484,863)
Total primary government 31,863,643$ 25,530,798$ 20,796,298$ 17,629,708$ 20,315,785$ 18,044,531$ 25,466,337$ (6,824,377)$ (11,885,914)$ (5,767,918)$
Source: City Finance Department.
Fiscal Year
S-5
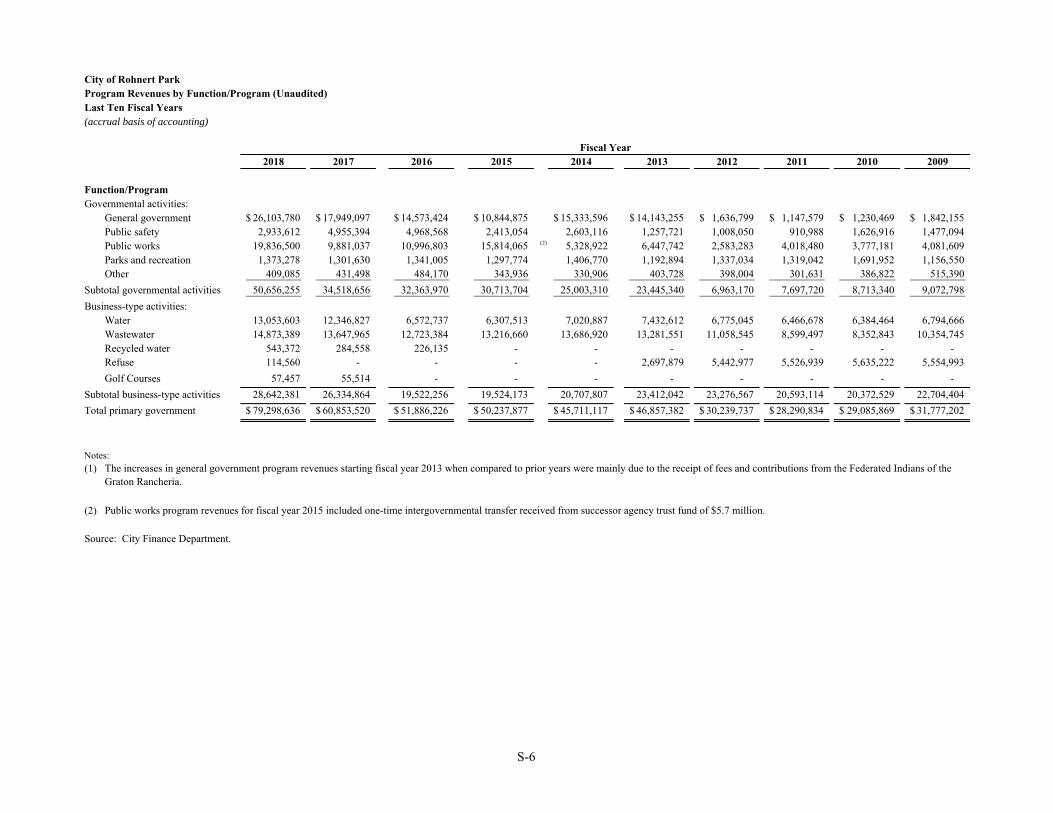
City of Rohnert ParkProgram Revenues by Function/Program (Unaudited)Last Ten Fiscal Years(accrual basis of accounting)
2018 2017 2016 2015 2014 2013 2012 2011 2010 2009
Function/ProgramGovernmental activities:
General government 26,103,780$ 17,949,097$ 14,573,424$ 10,844,875$ 15,333,596$ 14,143,255$ 1,636,799$ 1,147,579$ 1,230,469$ 1,842,155$ Public safety 2,933,612 4,955,394 4,968,568 2,413,054 2,603,116 1,257,721 1,008,050 910,988 1,626,916 1,477,094 Public works 19,836,500 9,881,037 10,996,803 15,814,065 (2) 5,328,922 6,447,742 2,583,283 4,018,480 3,777,181 4,081,609 Parks and recreation 1,373,278 1,301,630 1,341,005 1,297,774 1,406,770 1,192,894 1,337,034 1,319,042 1,691,952 1,156,550 Other 409,085 431,498 484,170 343,936 330,906 403,728 398,004 301,631 386,822 515,390
Subtotal governmental activities 50,656,255 34,518,656 32,363,970 30,713,704 25,003,310 23,445,340 6,963,170 7,697,720 8,713,340 9,072,798
Business-type activities:Water 13,053,603 12,346,827 6,572,737 6,307,513 7,020,887 7,432,612 6,775,045 6,466,678 6,384,464 6,794,666 Wastewater 14,873,389 13,647,965 12,723,384 13,216,660 13,686,920 13,281,551 11,058,545 8,599,497 8,352,843 10,354,745 Recycled water 543,372 284,558 226,135 - - - - - - - Refuse 114,560 - - - - 2,697,879 5,442,977 5,526,939 5,635,222 5,554,993
Golf Courses 57,457 55,514 - - - - - - - -
Subtotal business-type activities 28,642,381 26,334,864 19,522,256 19,524,173 20,707,807 23,412,042 23,276,567 20,593,114 20,372,529 22,704,404
Total primary government 79,298,636$ 60,853,520$ 51,886,226$ 50,237,877$ 45,711,117$ 46,857,382$ 30,239,737$ 28,290,834$ 29,085,869$ 31,777,202$
Notes:(1)
(2)
Source: City Finance Department.
Fiscal Year
The increases in general government program revenues starting fiscal year 2013 when compared to prior years were mainly due to the receipt of fees and contributions from the Federated Indians of the Graton Rancheria.
Public works program revenues for fiscal year 2015 included one-time intergovernmental transfer received from successor agency trust fund of $5.7 million.
S-6
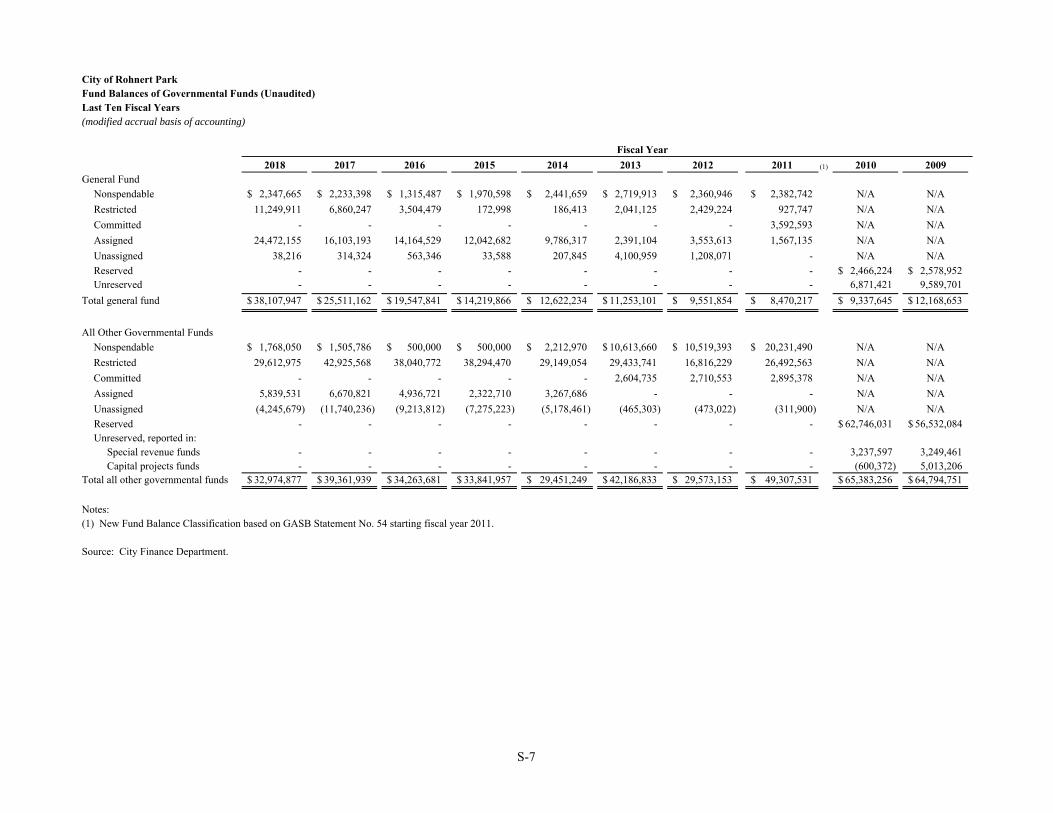
City of Rohnert ParkFund Balances of Governmental Funds (Unaudited)Last Ten Fiscal Years(modified accrual basis of accounting)
2018 2017 2016 2015 2014 2013 2012 2011 (1) 2010 2009General Fund
Nonspendable 2,347,665$ 2,233,398$ 1,315,487$ 1,970,598$ 2,441,659$ 2,719,913$ 2,360,946$ 2,382,742$ N/A N/A
Restricted 11,249,911 6,860,247 3,504,479 172,998 186,413 2,041,125 2,429,224 927,747 N/A N/A
Committed - - - - - - - 3,592,593 N/A N/A
Assigned 24,472,155 16,103,193 14,164,529 12,042,682 9,786,317 2,391,104 3,553,613 1,567,135 N/A N/A
Unassigned 38,216 314,324 563,346 33,588 207,845 4,100,959 1,208,071 - N/A N/A
Reserved - - - - - - - - 2,466,224$ 2,578,952$ Unreserved - - - - - - - - 6,871,421 9,589,701
Total general fund 38,107,947$ 25,511,162$ 19,547,841$ 14,219,866$ 12,622,234$ 11,253,101$ 9,551,854$ 8,470,217$ 9,337,645$ 12,168,653$
All Other Governmental Funds
Nonspendable 1,768,050$ 1,505,786$ 500,000$ 500,000$ 2,212,970$ 10,613,660$ 10,519,393$ 20,231,490$ N/A N/A
Restricted 29,612,975 42,925,568 38,040,772 38,294,470 29,149,054 29,433,741 16,816,229 26,492,563 N/A N/A
Committed - - - - - 2,604,735 2,710,553 2,895,378 N/A N/A
Assigned 5,839,531 6,670,821 4,936,721 2,322,710 3,267,686 - - - N/A N/A
Unassigned (4,245,679) (11,740,236) (9,213,812) (7,275,223) (5,178,461) (465,303) (473,022) (311,900) N/A N/A
Reserved - - - - - - - - 62,746,031$ 56,532,084$ Unreserved, reported in: Special revenue funds - - - - - - - - 3,237,597 3,249,461 Capital projects funds - - - - - - - - (600,372) 5,013,206
Total all other governmental funds 32,974,877$ 39,361,939$ 34,263,681$ 33,841,957$ 29,451,249$ 42,186,833$ 29,573,153$ 49,307,531$ 65,383,256$ 64,794,751$
Notes:(1) New Fund Balance Classification based on GASB Statement No. 54 starting fiscal year 2011.
Source: City Finance Department.
Fiscal Year
S-7
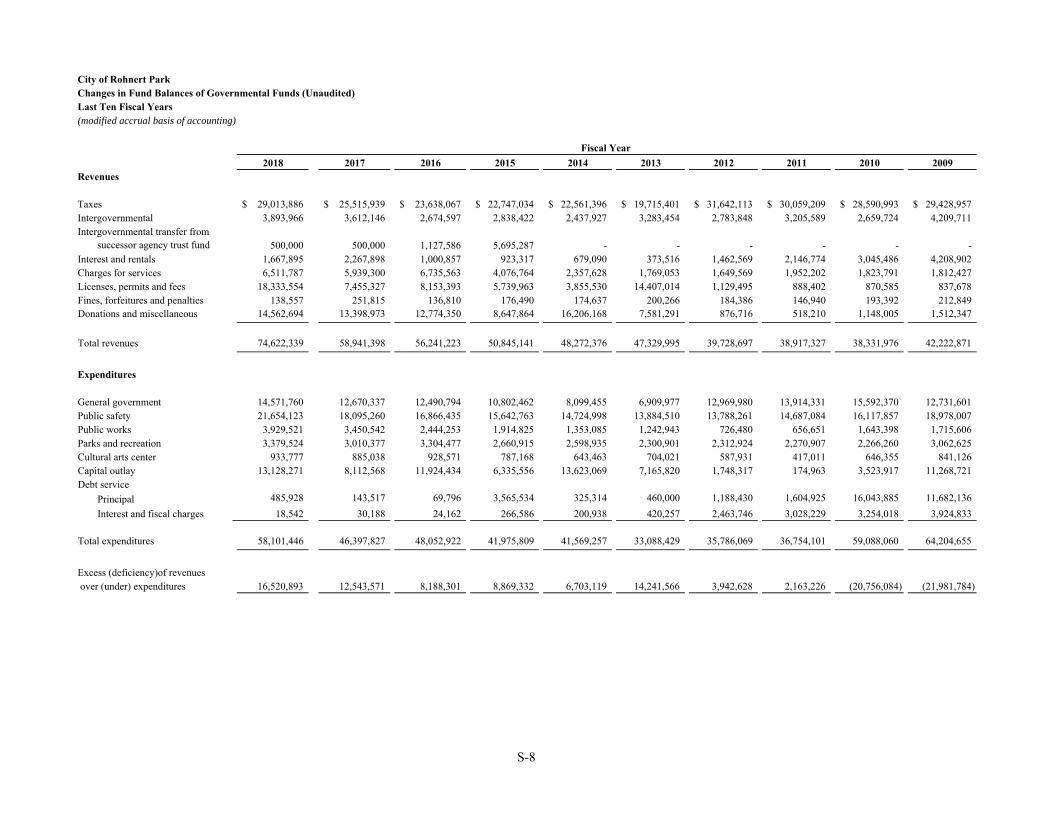
City of Rohnert ParkChanges in Fund Balances of Governmental Funds (Unaudited)Last Ten Fiscal Years(modified accrual basis of accounting)
2018 2017 2016 2015 2014 2013 2012 2011 2010 2009Revenues
Taxes 29,013,886$ 25,515,939$ 23,638,067$ 22,747,034$ 22,561,396$ 19,715,401$ 31,642,113$ 30,059,209$ 28,590,993$ 29,428,957$ Intergovernmental 3,893,966 3,612,146 2,674,597 2,838,422 2,437,927 3,283,454 2,783,848 3,205,589 2,659,724 4,209,711
successor agency trust fund 500,000 500,000 1,127,586 5,695,287 - - - - - -Interest and rentals 1,667,895 2,267,898 1,000,857 923,317 679,090 373,516 1,462,569 2,146,774 3,045,486 4,208,902 Charges for services 6,511,787 5,939,300 6,735,563 4,076,764 2,357,628 1,769,053 1,649,569 1,952,202 1,823,791 1,812,427 Licenses, permits and fees 18,333,554 7,455,327 8,153,393 5,739,963 3,855,530 14,407,014 1,129,495 888,402 870,585 837,678 Fines, forfeitures and penalties 138,557 251,815 136,810 176,490 174,637 200,266 184,386 146,940 193,392 212,849 Donations and miscellaneous 14,562,694 13,398,973 12,774,350 8,647,864 16,206,168 7,581,291 876,716 518,210 1,148,005 1,512,347
Total revenues 74,622,339 58,941,398 56,241,223 50,845,141 48,272,376 47,329,995 39,728,697 38,917,327 38,331,976 42,222,871
Expenditures
General government 14,571,760 12,670,337 12,490,794 10,802,462 8,099,455 6,909,977 12,969,980 13,914,331 15,592,370 12,731,601 Public safety 21,654,123 18,095,260 16,866,435 15,642,763 14,724,998 13,884,510 13,788,261 14,687,084 16,117,857 18,978,007 Public works 3,929,521 3,450,542 2,444,253 1,914,825 1,353,085 1,242,943 726,480 656,651 1,643,398 1,715,606 Parks and recreation 3,379,524 3,010,377 3,304,477 2,660,915 2,598,935 2,300,901 2,312,924 2,270,907 2,266,260 3,062,625 Cultural arts center 933,777 885,038 928,571 787,168 643,463 704,021 587,931 417,011 646,355 841,126 Capital outlay 13,128,271 8,112,568 11,924,434 6,335,556 13,623,069 7,165,820 1,748,317 174,963 3,523,917 11,268,721 Debt service
Principal 485,928 143,517 69,796 3,565,534 325,314 460,000 1,188,430 1,604,925 16,043,885 11,682,136
Interest and fiscal charges 18,542 30,188 24,162 266,586 200,938 420,257 2,463,746 3,028,229 3,254,018 3,924,833
Total expenditures 58,101,446 46,397,827 48,052,922 41,975,809 41,569,257 33,088,429 35,786,069 36,754,101 59,088,060 64,204,655
Excess (deficiency)of revenues over (under) expenditures 16,520,893 12,543,571 8,188,301 8,869,332 6,703,119 14,241,566 3,942,628 2,163,226 (20,756,084) (21,981,784)
Intergovernmental transfer from
Fiscal Year
S-8
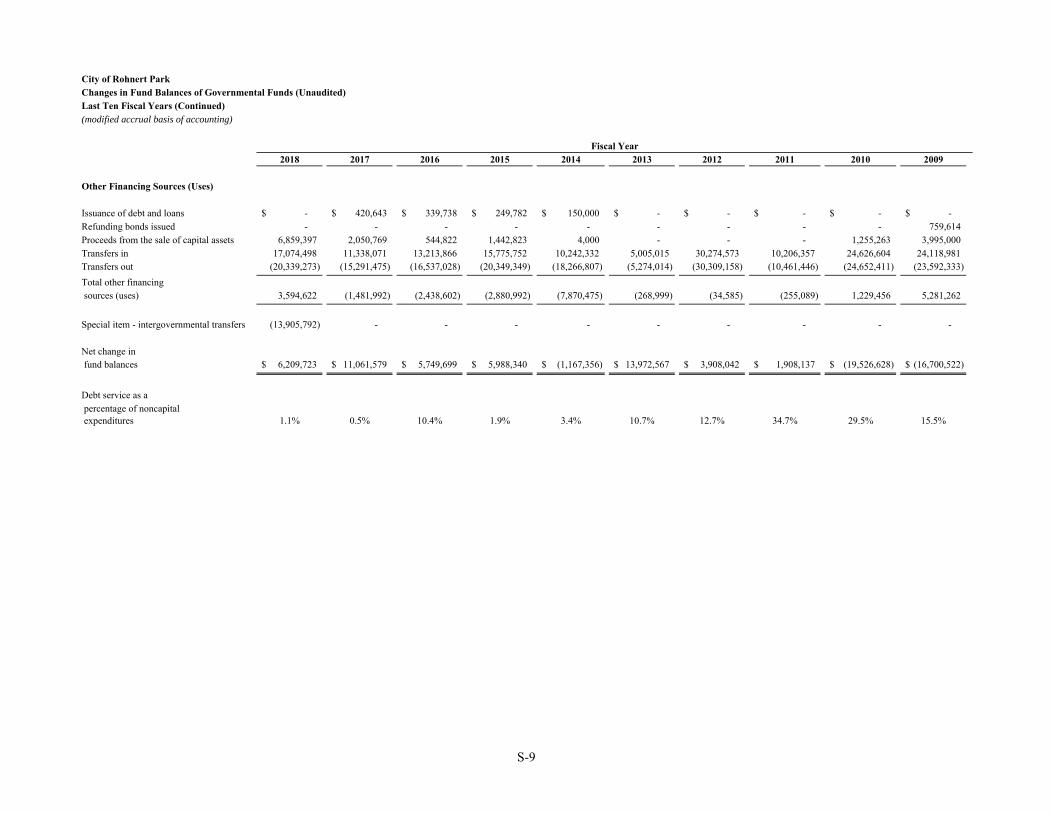
City of Rohnert ParkChanges in Fund Balances of Governmental Funds (Unaudited)Last Ten Fiscal Years (Continued)(modified accrual basis of accounting)
2018 2017 2016 2015 2014 2013 2012 2011 2010 2009
Other Financing Sources (Uses)
Issuance of debt and loans -$ 420,643$ 339,738$ 249,782$ 150,000$ -$ -$ -$ -$ -$ Refunding bonds issued - - - - - - - - - 759,614 Proceeds from the sale of capital assets 6,859,397 2,050,769 544,822 1,442,823 4,000 - - - 1,255,263 3,995,000 Transfers in 17,074,498 11,338,071 13,213,866 15,775,752 10,242,332 5,005,015 30,274,573 10,206,357 24,626,604 24,118,981 Transfers out (20,339,273) (15,291,475) (16,537,028) (20,349,349) (18,266,807) (5,274,014) (30,309,158) (10,461,446) (24,652,411) (23,592,333)
Total other financing sources (uses) 3,594,622 (1,481,992) (2,438,602) (2,880,992) (7,870,475) (268,999) (34,585) (255,089) 1,229,456 5,281,262
Special item - intergovernmental transfers (13,905,792) - - - - - - - - -
Net change in fund balances 6,209,723$ 11,061,579$ 5,749,699$ 5,988,340$ (1,167,356)$ 13,972,567$ 3,908,042$ 1,908,137$ (19,526,628)$ (16,700,522)$
Debt service as a percentage of noncapital expenditures 1.1% 0.5% 10.4% 1.9% 3.4% 10.7% 12.7% 34.7% 29.5% 15.5%
Fiscal Year
S-9
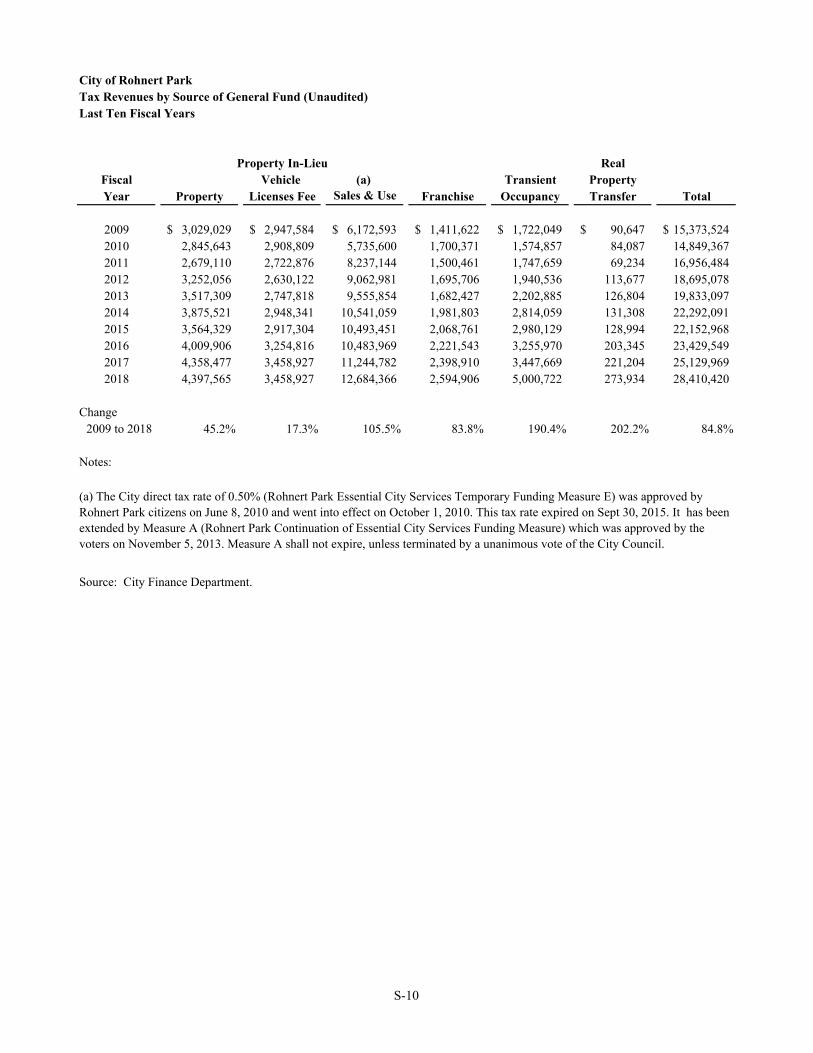
City of Rohnert ParkTax Revenues by Source of General Fund (Unaudited)Last Ten Fiscal Years
Property In-Lieu Real
Fiscal Vehicle (a) Transient PropertyYear Property Licenses Fee Sales & Use Franchise Occupancy Transfer Total
2009 3,029,029$ 2,947,584$ 6,172,593$ 1,411,622$ 1,722,049$ 90,647$ 15,373,524$ 2010 2,845,643 2,908,809 5,735,600 1,700,371 1,574,857 84,087 14,849,367 2011 2,679,110 2,722,876 8,237,144 1,500,461 1,747,659 69,234 16,956,484 2012 3,252,056 2,630,122 9,062,981 1,695,706 1,940,536 113,677 18,695,078 2013 3,517,309 2,747,818 9,555,854 1,682,427 2,202,885 126,804 19,833,097 2014 3,875,521 2,948,341 10,541,059 1,981,803 2,814,059 131,308 22,292,091 2015 3,564,329 2,917,304 10,493,451 2,068,761 2,980,129 128,994 22,152,968 2016 4,009,906 3,254,816 10,483,969 2,221,543 3,255,970 203,345 23,429,549 2017 4,358,477 3,458,927 11,244,782 2,398,910 3,447,669 221,204 25,129,969 2018 4,397,565 3,458,927 12,684,366 2,594,906 5,000,722 273,934 28,410,420
Change45.2% 17.3% 105.5% 83.8% 190.4% 202.2% 84.8%
Notes:
Source: City Finance Department.
(a) The City direct tax rate of 0.50% (Rohnert Park Essential City Services Temporary Funding Measure E) was approved by Rohnert Park citizens on June 8, 2010 and went into effect on October 1, 2010. This tax rate expired on Sept 30, 2015. It has been extended by Measure A (Rohnert Park Continuation of Essential City Services Funding Measure) which was approved by the voters on November 5, 2013. Measure A shall not expire, unless terminated by a unanimous vote of the City Council.
2009 to 2018
S-10
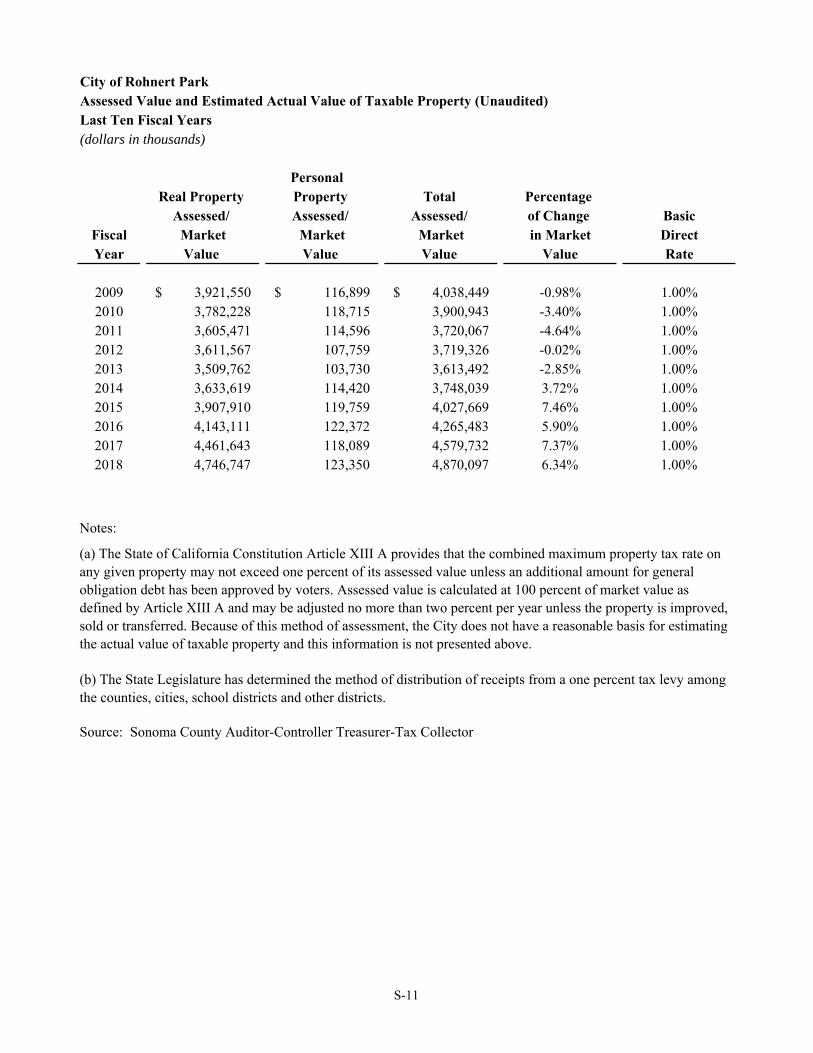
City of Rohnert ParkAssessed Value and Estimated Actual Value of Taxable Property (Unaudited)Last Ten Fiscal Years(dollars in thousands)
Personal Real Property Property Total Percentage
Assessed/ Assessed/ Assessed/ of Change BasicFiscal Market Market Market in Market DirectYear Value Value Value Value Rate
2009 3,921,550$ 116,899$ 4,038,449$ -0.98% 1.00%2010 3,782,228 118,715 3,900,943 -3.40% 1.00%2011 3,605,471 114,596 3,720,067 -4.64% 1.00%2012 3,611,567 107,759 3,719,326 -0.02% 1.00%2013 3,509,762 103,730 3,613,492 -2.85% 1.00%2014 3,633,619 114,420 3,748,039 3.72% 1.00%2015 3,907,910 119,759 4,027,669 7.46% 1.00%2016 4,143,111 122,372 4,265,483 5.90% 1.00%2017 4,461,643 118,089 4,579,732 7.37% 1.00%2018 4,746,747 123,350 4,870,097 6.34% 1.00%
Source: Sonoma County Auditor-Controller Treasurer-Tax Collector
Notes:
(a) The State of California Constitution Article XIII A provides that the combined maximum property tax rate on any given property may not exceed one percent of its assessed value unless an additional amount for general obligation debt has been approved by voters. Assessed value is calculated at 100 percent of market value as defined by Article XIII A and may be adjusted no more than two percent per year unless the property is improved, sold or transferred. Because of this method of assessment, the City does not have a reasonable basis for estimating the actual value of taxable property and this information is not presented above.
(b) The State Legislature has determined the method of distribution of receipts from a one percent tax levy among the counties, cities, school districts and other districts.
S-11
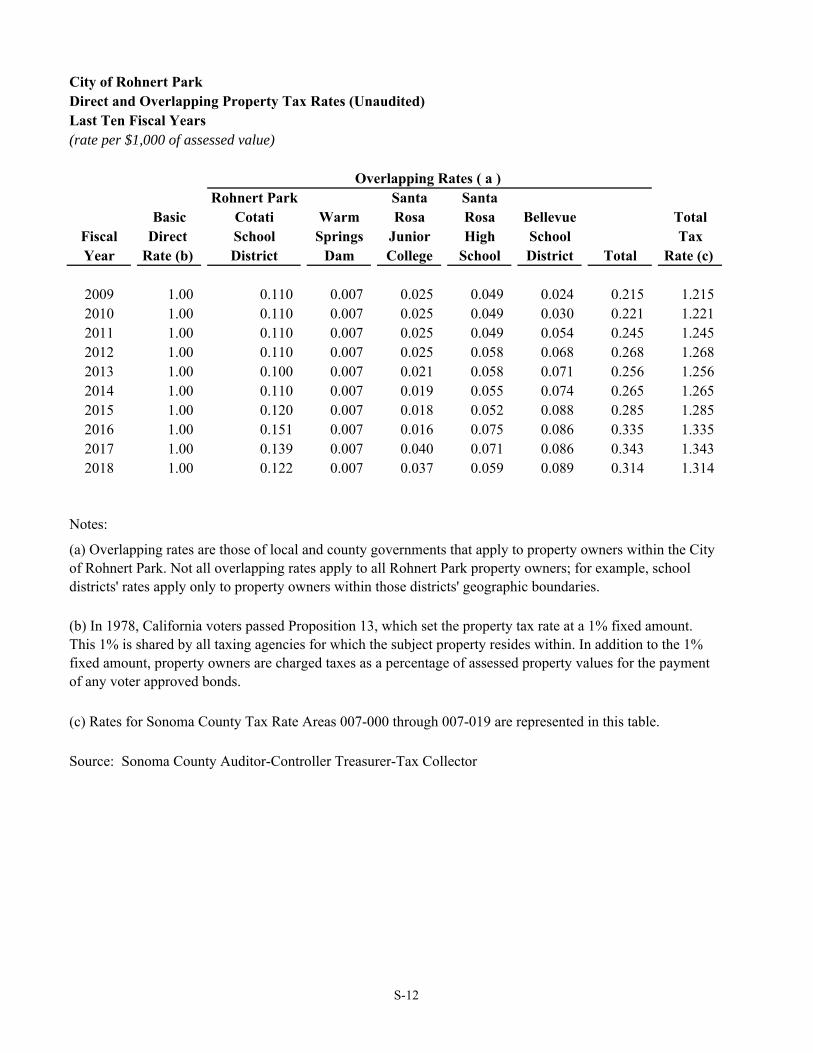
City of Rohnert ParkDirect and Overlapping Property Tax Rates (Unaudited)Last Ten Fiscal Years(rate per $1,000 of assessed value)
Rohnert Park Santa SantaBasic Cotati Warm Rosa Rosa Bellevue Total
Fiscal Direct School Springs Junior High School TaxYear Rate (b) District Dam College School District Total Rate (c)
2009 1.00 0.110 0.007 0.025 0.049 0.024 0.215 1.215 2010 1.00 0.110 0.007 0.025 0.049 0.030 0.221 1.221 2011 1.00 0.110 0.007 0.025 0.049 0.054 0.245 1.245 2012 1.00 0.110 0.007 0.025 0.058 0.068 0.268 1.268 2013 1.00 0.100 0.007 0.021 0.058 0.071 0.256 1.256 2014 1.00 0.110 0.007 0.019 0.055 0.074 0.265 1.265 2015 1.00 0.120 0.007 0.018 0.052 0.088 0.285 1.285 2016 1.00 0.151 0.007 0.016 0.075 0.086 0.335 1.335 2017 1.00 0.139 0.007 0.040 0.071 0.086 0.343 1.343 2018 1.00 0.122 0.007 0.037 0.059 0.089 0.314 1.314
(c) Rates for Sonoma County Tax Rate Areas 007-000 through 007-019 are represented in this table.
Source: Sonoma County Auditor-Controller Treasurer-Tax Collector
(b) In 1978, California voters passed Proposition 13, which set the property tax rate at a 1% fixed amount. This 1% is shared by all taxing agencies for which the subject property resides within. In addition to the 1% fixed amount, property owners are charged taxes as a percentage of assessed property values for the payment of any voter approved bonds.
Notes:
Overlapping Rates ( a )
(a) Overlapping rates are those of local and county governments that apply to property owners within the City of Rohnert Park. Not all overlapping rates apply to all Rohnert Park property owners; for example, school districts' rates apply only to property owners within those districts' geographic boundaries.
S-12
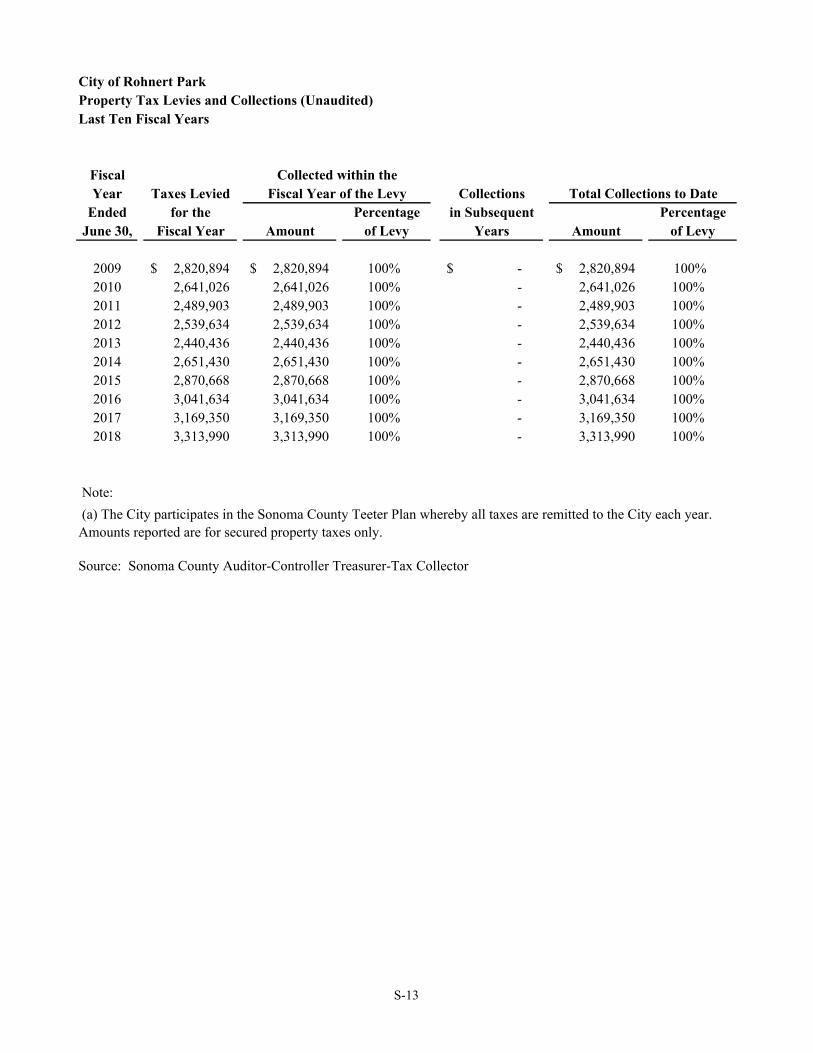
City of Rohnert ParkProperty Tax Levies and Collections (Unaudited)Last Ten Fiscal Years
FiscalYear Taxes Levied Collections
Ended for the in SubsequentJune 30, Fiscal Year Amount Years Amount
2009 2,820,894$ 2,820,894$ 100% -$ 2,820,894$ 100%2010 2,641,026 2,641,026 100% - 2,641,026 100%2011 2,489,903 2,489,903 100% - 2,489,903 100%2012 2,539,634 2,539,634 100% - 2,539,634 100%2013 2,440,436 2,440,436 100% - 2,440,436 100%2014 2,651,430 2,651,430 100% - 2,651,430 100%2015 2,870,668 2,870,668 100% - 2,870,668 100%2016 3,041,634 3,041,634 100% - 3,041,634 100%2017 3,169,350 3,169,350 100% - 3,169,350 100%2018 3,313,990 3,313,990 100% - 3,313,990 100%
Source: Sonoma County Auditor-Controller Treasurer-Tax Collector
(a) The City participates in the Sonoma County Teeter Plan whereby all taxes are remitted to the City each year.Amounts reported are for secured property taxes only.
Note:
Collected within the
of LevyPercentage
Total Collections to Date
of LevyPercentage
Fiscal Year of the Levy
S-13
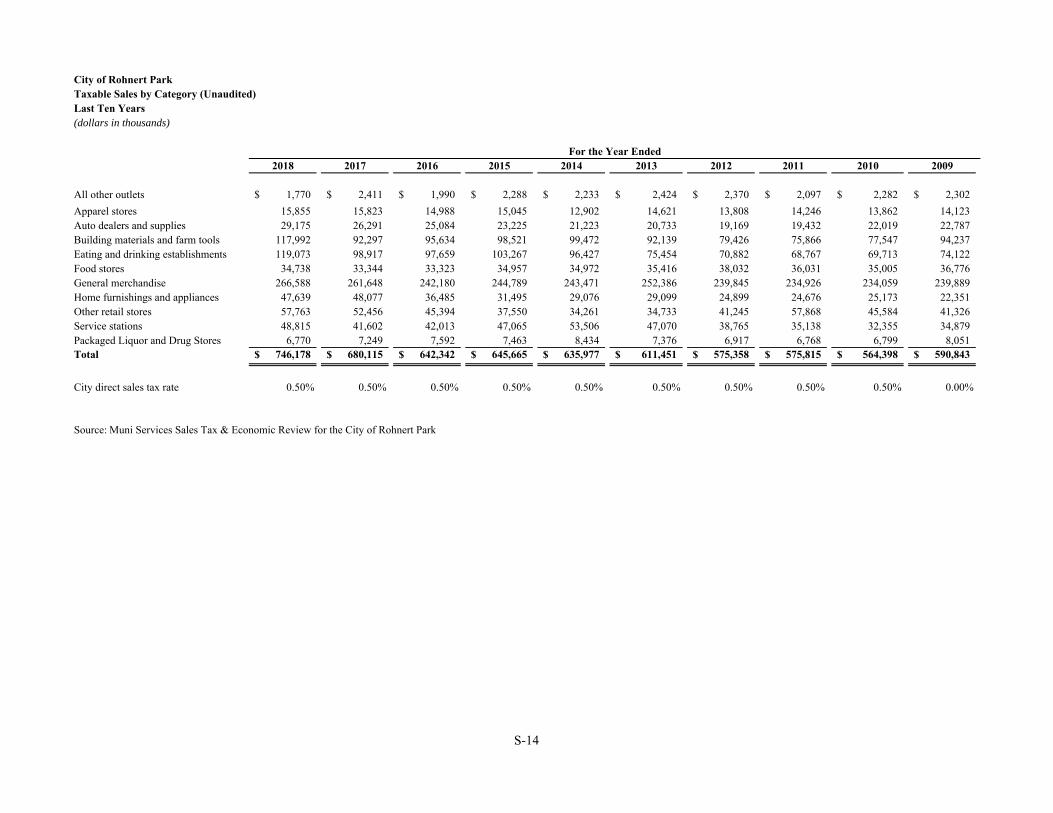
City of Rohnert ParkTaxable Sales by Category (Unaudited)Last Ten Years(dollars in thousands)
2018 2017 2016 2015 2014 2013 2012 2011 2010 2009
All other outlets 1,770$ 2,411$ 1,990$ 2,288$ 2,233$ 2,424$ 2,370$ 2,097$ 2,282$ 2,302$
Apparel stores 15,855 15,823 14,988 15,045 12,902 14,621 13,808 14,246 13,862 14,123 Auto dealers and supplies 29,175 26,291 25,084 23,225 21,223 20,733 19,169 19,432 22,019 22,787 Building materials and farm tools 117,992 92,297 95,634 98,521 99,472 92,139 79,426 75,866 77,547 94,237 Eating and drinking establishments 119,073 98,917 97,659 103,267 96,427 75,454 70,882 68,767 69,713 74,122 Food stores 34,738 33,344 33,323 34,957 34,972 35,416 38,032 36,031 35,005 36,776 General merchandise 266,588 261,648 242,180 244,789 243,471 252,386 239,845 234,926 234,059 239,889 Home furnishings and appliances 47,639 48,077 36,485 31,495 29,076 29,099 24,899 24,676 25,173 22,351 Other retail stores 57,763 52,456 45,394 37,550 34,261 34,733 41,245 57,868 45,584 41,326 Service stations 48,815 41,602 42,013 47,065 53,506 47,070 38,765 35,138 32,355 34,879 Packaged Liquor and Drug Stores 6,770 7,249 7,592 7,463 8,434 7,376 6,917 6,768 6,799 8,051 Total 746,178$ 680,115$ 642,342$ 645,665$ 635,977$ 611,451$ 575,358$ 575,815$ 564,398$ 590,843$
City direct sales tax rate 0.50% 0.50% 0.50% 0.50% 0.50% 0.50% 0.50% 0.50% 0.50% 0.00%
Source: Muni Services Sales Tax & Economic Review for the City of Rohnert Park
For the Year Ended
S-14
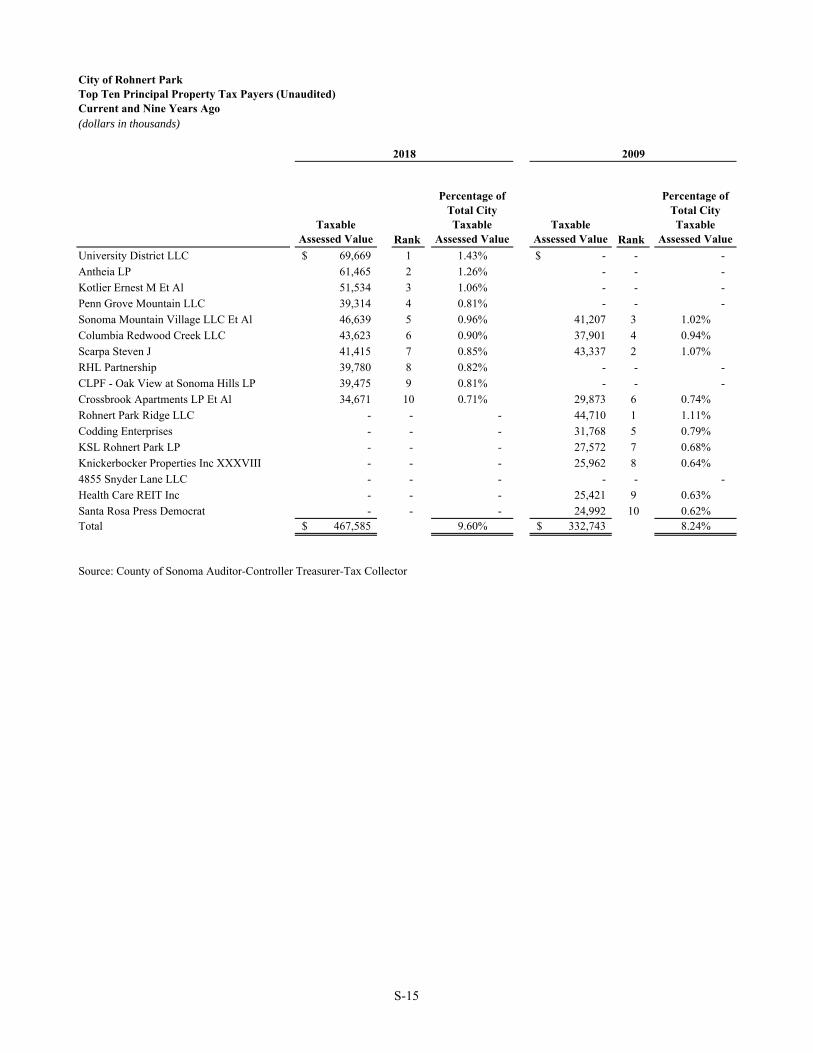
City of Rohnert ParkTop Ten Principal Property Tax Payers (Unaudited) Current and Nine Years Ago(dollars in thousands)
Taxable Assessed Value Rank
Percentage of Total City Taxable
Assessed ValueTaxable
Assessed Value Rank
Percentage of Total City Taxable
Assessed Value
University District LLC 69,669$ 1 1.43% -$ - -
Antheia LP 61,465 2 1.26% - - -
Kotlier Ernest M Et Al 51,534 3 1.06% - - -
Penn Grove Mountain LLC 39,314 4 0.81% - - -
Sonoma Mountain Village LLC Et Al 46,639 5 0.96% 41,207 3 1.02%
Columbia Redwood Creek LLC 43,623 6 0.90% 37,901 4 0.94%
Scarpa Steven J 41,415 7 0.85% 43,337 2 1.07%
RHL Partnership 39,780 8 0.82% - - -
CLPF - Oak View at Sonoma Hills LP 39,475 9 0.81% - - -
Crossbrook Apartments LP Et Al 34,671 10 0.71% 29,873 6 0.74%
Rohnert Park Ridge LLC - - - 44,710 1 1.11%
Codding Enterprises - - - 31,768 5 0.79%
KSL Rohnert Park LP - - - 27,572 7 0.68%
Knickerbocker Properties Inc XXXVIII - - - 25,962 8 0.64%
4855 Snyder Lane LLC - - - - - -
Health Care REIT Inc - - - 25,421 9 0.63%
Santa Rosa Press Democrat - - - 24,992 10 0.62%Total 467,585$ 9.60% 332,743$ 8.24%
Source: County of Sonoma Auditor-Controller Treasurer-Tax Collector
20092018
S-15
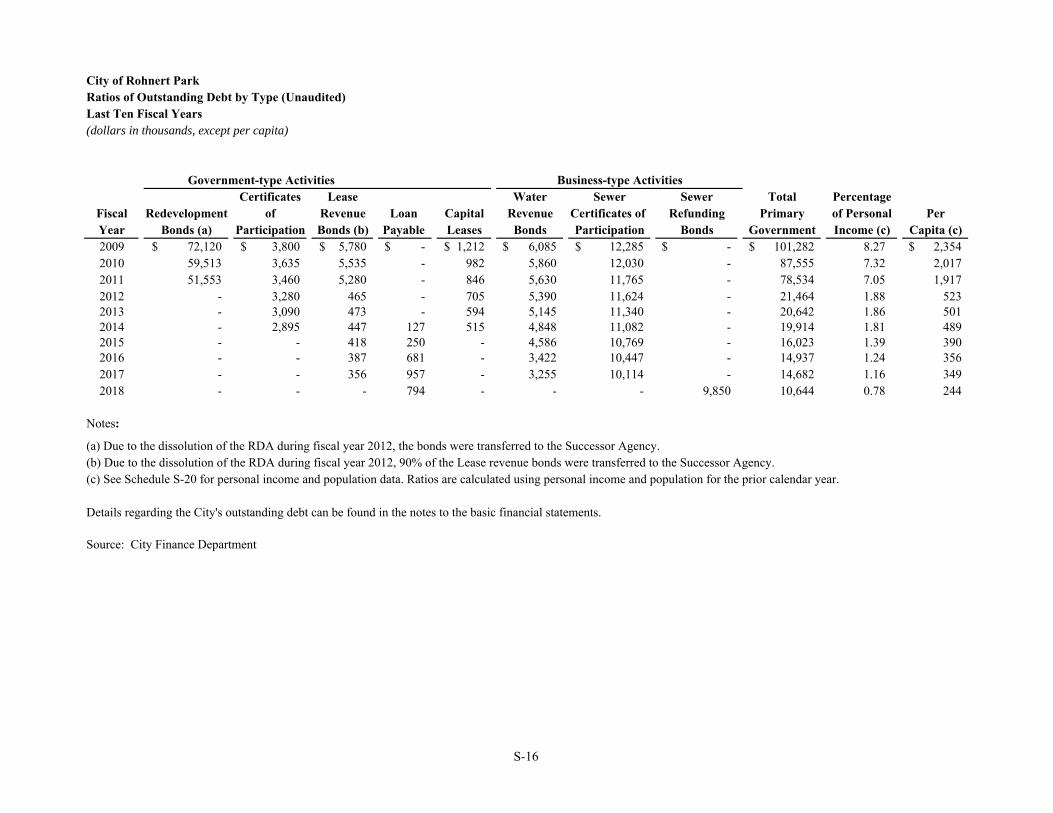
City of Rohnert ParkRatios of Outstanding Debt by Type (Unaudited)Last Ten Fiscal Years(dollars in thousands, except per capita)
Certificates Lease Water Sewer Sewer TotalFiscal Redevelopment of Revenue Loan Capital Revenue Certificates of Refunding Primary PerYear Bonds (a) Participation Bonds (b) Payable Leases Bonds Participation Bonds Government Capita (c)2009 72,120$ 3,800$ 5,780$ -$ 1,212$ 6,085$ 12,285$ -$ 101,282$ 8.27 2,354$ 2010 59,513 3,635 5,535 - 982 5,860 12,030 - 87,555 7.32 2,017 2011 51,553 3,460 5,280 - 846 5,630 11,765 - 78,534 7.05 1,917 2012 - 3,280 465 - 705 5,390 11,624 - 21,464 1.88 523 2013 - 3,090 473 - 594 5,145 11,340 - 20,642 1.86 501 2014 - 2,895 447 127 515 4,848 11,082 - 19,914 1.81 489 2015 - - 418 250 - 4,586 10,769 - 16,023 1.39 390 2016 - - 387 681 - 3,422 10,447 - 14,937 1.24 356 2017 - - 356 957 - 3,255 10,114 - 14,682 1.16 349 2018 - - - 794 - - - 9,850 10,644 0.78 244
Notes:
(a) Due to the dissolution of the RDA during fiscal year 2012, the bonds were transferred to the Successor Agency. (b) Due to the dissolution of the RDA during fiscal year 2012, 90% of the Lease revenue bonds were transferred to the Successor Agency.
Details regarding the City's outstanding debt can be found in the notes to the basic financial statements.
Source: City Finance Department
(c) See Schedule S-20 for personal income and population data. Ratios are calculated using personal income and population for the prior calendar year.
Government-type Activities Business-type ActivitiesPercentageof PersonalIncome (c)
S-16
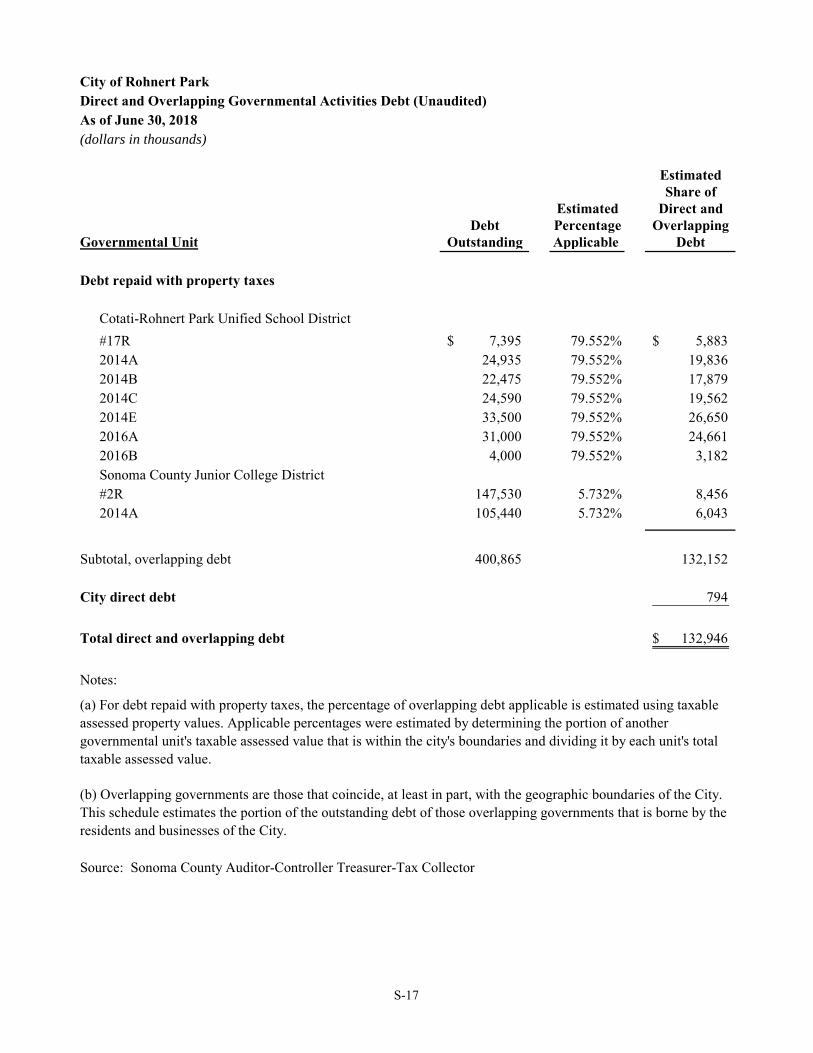
City of Rohnert ParkDirect and Overlapping Governmental Activities Debt (Unaudited)As of June 30, 2018(dollars in thousands)
EstimatedShare of
Estimated Direct andDebt Percentage Overlapping
Governmental Unit Outstanding Applicable Debt
Debt repaid with property taxes
Cotati-Rohnert Park Unified School District
#17R 7,395$ 79.552% 5,883$ 2014A 24,935 79.552% 19,836 2014B 22,475 79.552% 17,879 2014C 24,590 79.552% 19,562 2014E 33,500 79.552% 26,650 2016A 31,000 79.552% 24,661 2016B 4,000 79.552% 3,182 Sonoma County Junior College District #2R 147,530 5.732% 8,456 2014A 105,440 5.732% 6,043
Subtotal, overlapping debt 400,865 132,152
City direct debt 794
Total direct and overlapping debt 132,946$
Notes:
Source: Sonoma County Auditor-Controller Treasurer-Tax Collector
(a) For debt repaid with property taxes, the percentage of overlapping debt applicable is estimated using taxable assessed property values. Applicable percentages were estimated by determining the portion of another governmental unit's taxable assessed value that is within the city's boundaries and dividing it by each unit's total taxable assessed value.
(b) Overlapping governments are those that coincide, at least in part, with the geographic boundaries of the City. This schedule estimates the portion of the outstanding debt of those overlapping governments that is borne by the residents and businesses of the City.
S-17
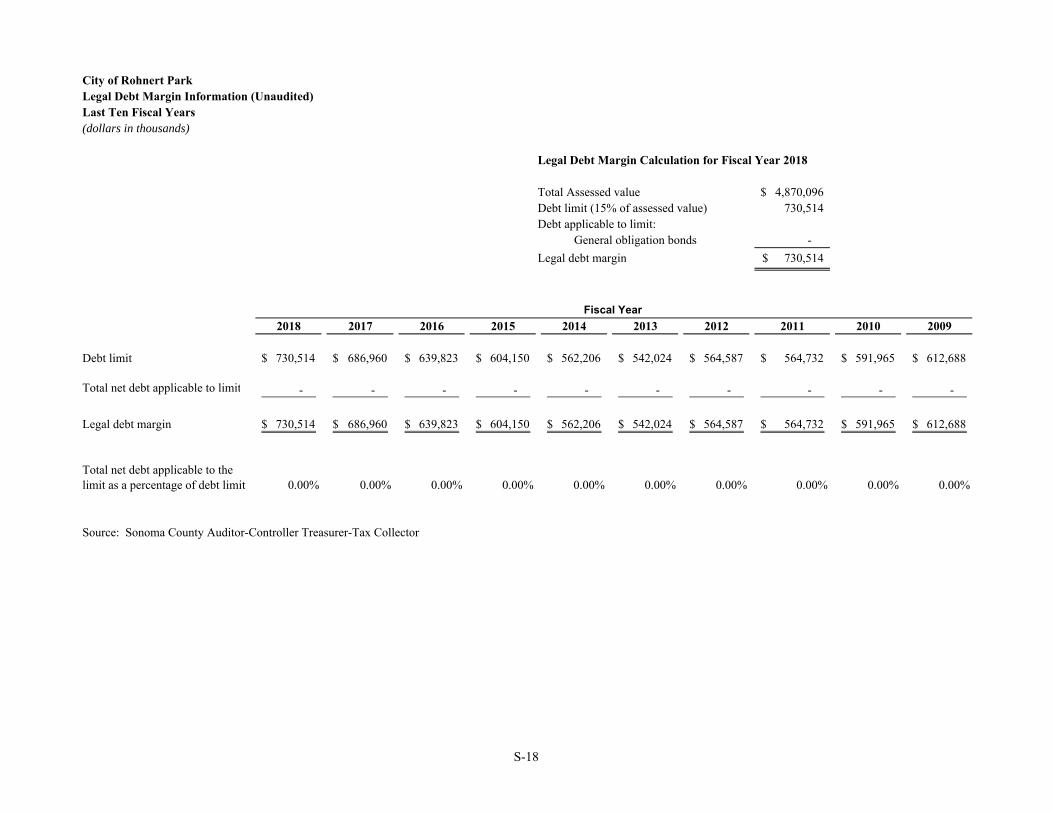
City of Rohnert ParkLegal Debt Margin Information (Unaudited)Last Ten Fiscal Years(dollars in thousands)
Legal Debt Margin Calculation for Fiscal Year 2018
Total Assessed value 4,870,096$ Debt limit (15% of assessed value) 730,514 Debt applicable to limit: General obligation bonds -
Legal debt margin 730,514$
2018 2017 2016 2015 2014 2013 2012 2011 2010 2009
Debt limit 730,514$ 686,960$ 639,823$ 604,150$ 562,206$ 542,024$ 564,587$ 564,732$ 591,965$ 612,688$
- - - - - - - - - -
Legal debt margin 730,514$ 686,960$ 639,823$ 604,150$ 562,206$ 542,024$ 564,587$ 564,732$ 591,965$ 612,688$
0.00% 0.00% 0.00% 0.00% 0.00% 0.00% 0.00% 0.00% 0.00% 0.00%
Source: Sonoma County Auditor-Controller Treasurer-Tax Collector
Total net debt applicable to limit
Total net debt applicable to the limit as a percentage of debt limit
Fiscal Year
S-18
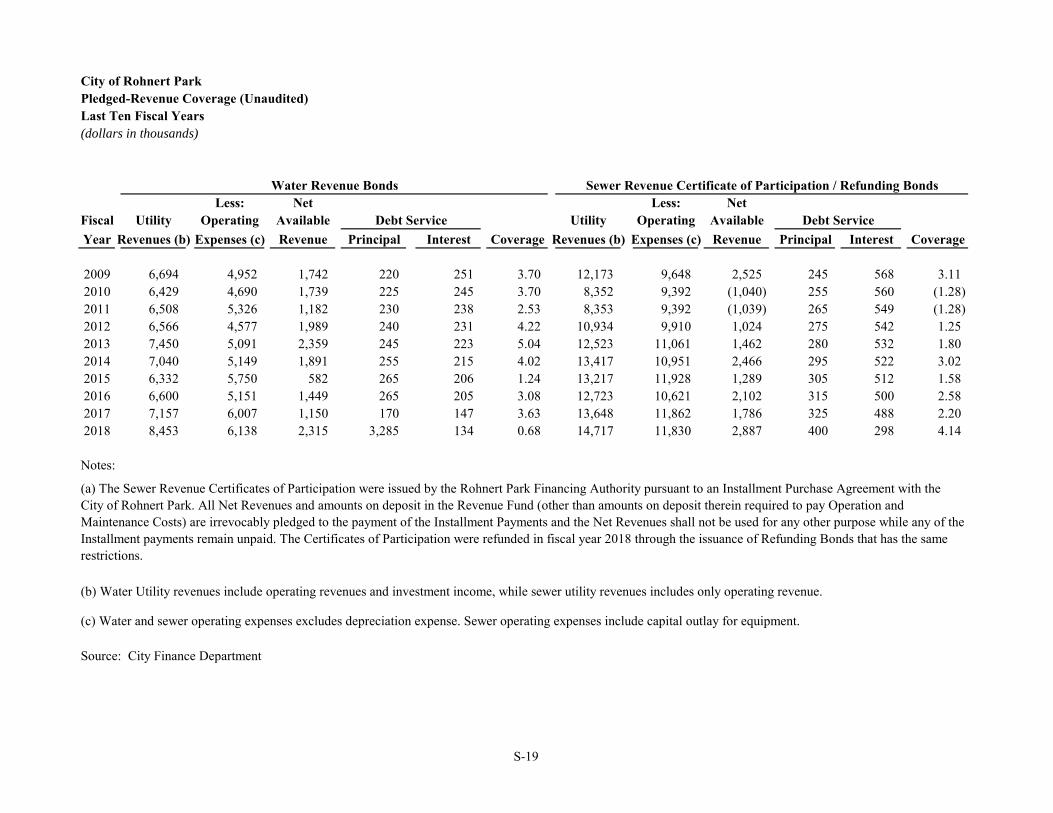
City of Rohnert ParkPledged-Revenue Coverage (Unaudited)Last Ten Fiscal Years(dollars in thousands)
Less: Net Less: NetFiscal Utility Operating Available Utility Operating Available
Year Revenues (b) Expenses (c) Revenue Principal Interest Coverage Revenues (b) Expenses (c) Revenue Principal Interest Coverage
2009 6,694 4,952 1,742 220 251 3.70 12,173 9,648 2,525 245 568 3.11 2010 6,429 4,690 1,739 225 245 3.70 8,352 9,392 (1,040) 255 560 (1.28) 2011 6,508 5,326 1,182 230 238 2.53 8,353 9,392 (1,039) 265 549 (1.28) 2012 6,566 4,577 1,989 240 231 4.22 10,934 9,910 1,024 275 542 1.25 2013 7,450 5,091 2,359 245 223 5.04 12,523 11,061 1,462 280 532 1.80 2014 7,040 5,149 1,891 255 215 4.02 13,417 10,951 2,466 295 522 3.02 2015 6,332 5,750 582 265 206 1.24 13,217 11,928 1,289 305 512 1.58 2016 6,600 5,151 1,449 265 205 3.08 12,723 10,621 2,102 315 500 2.58 2017 7,157 6,007 1,150 170 147 3.63 13,648 11,862 1,786 325 488 2.20 2018 8,453 6,138 2,315 3,285 134 0.68 14,717 11,830 2,887 400 298 4.14
Notes:
Source: City Finance Department
(b) Water Utility revenues include operating revenues and investment income, while sewer utility revenues includes only operating revenue.
(a) The Sewer Revenue Certificates of Participation were issued by the Rohnert Park Financing Authority pursuant to an Installment Purchase Agreement with the City of Rohnert Park. All Net Revenues and amounts on deposit in the Revenue Fund (other than amounts on deposit therein required to pay Operation and Maintenance Costs) are irrevocably pledged to the payment of the Installment Payments and the Net Revenues shall not be used for any other purpose while any of the Installment payments remain unpaid. The Certificates of Participation were refunded in fiscal year 2018 through the issuance of Refunding Bonds that has the same restrictions.
(c) Water and sewer operating expenses excludes depreciation expense. Sewer operating expenses include capital outlay for equipment.
Debt Service
Water Revenue Bonds Sewer Revenue Certificate of Participation / Refunding Bonds
Debt Service
S-19
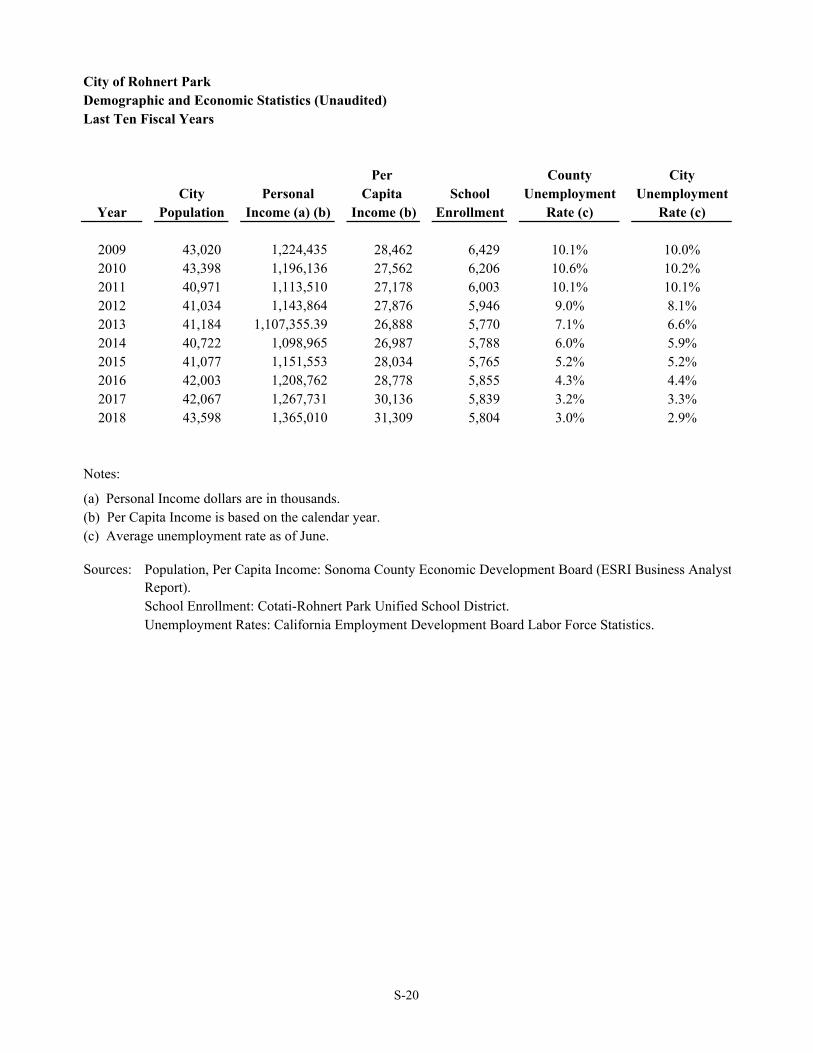
City of Rohnert ParkDemographic and Economic Statistics (Unaudited)Last Ten Fiscal Years
Per County City City Personal Capita School Unemployment Unemployment
Year Population Income (a) (b) Income (b) Enrollment Rate (c) Rate (c)
2009 43,020 1,224,435 28,462 6,429 10.1% 10.0%2010 43,398 1,196,136 27,562 6,206 10.6% 10.2%2011 40,971 1,113,510 27,178 6,003 10.1% 10.1%2012 41,034 1,143,864 27,876 5,946 9.0% 8.1%2013 41,184 1,107,355.39 26,888 5,770 7.1% 6.6%2014 40,722 1,098,965 26,987 5,788 6.0% 5.9%2015 41,077 1,151,553 28,034 5,765 5.2% 5.2%2016 42,003 1,208,762 28,778 5,855 4.3% 4.4%2017 42,067 1,267,731 30,136 5,839 3.2% 3.3%2018 43,598 1,365,010 31,309 5,804 3.0% 2.9%
Notes:
(a) Personal Income dollars are in thousands.(b) Per Capita Income is based on the calendar year.(c) Average unemployment rate as of June.
Sources:
School Enrollment: Cotati-Rohnert Park Unified School District.Unemployment Rates: California Employment Development Board Labor Force Statistics.
Population, Per Capita Income: Sonoma County Economic Development Board (ESRI Business AnalystReport).
S-20
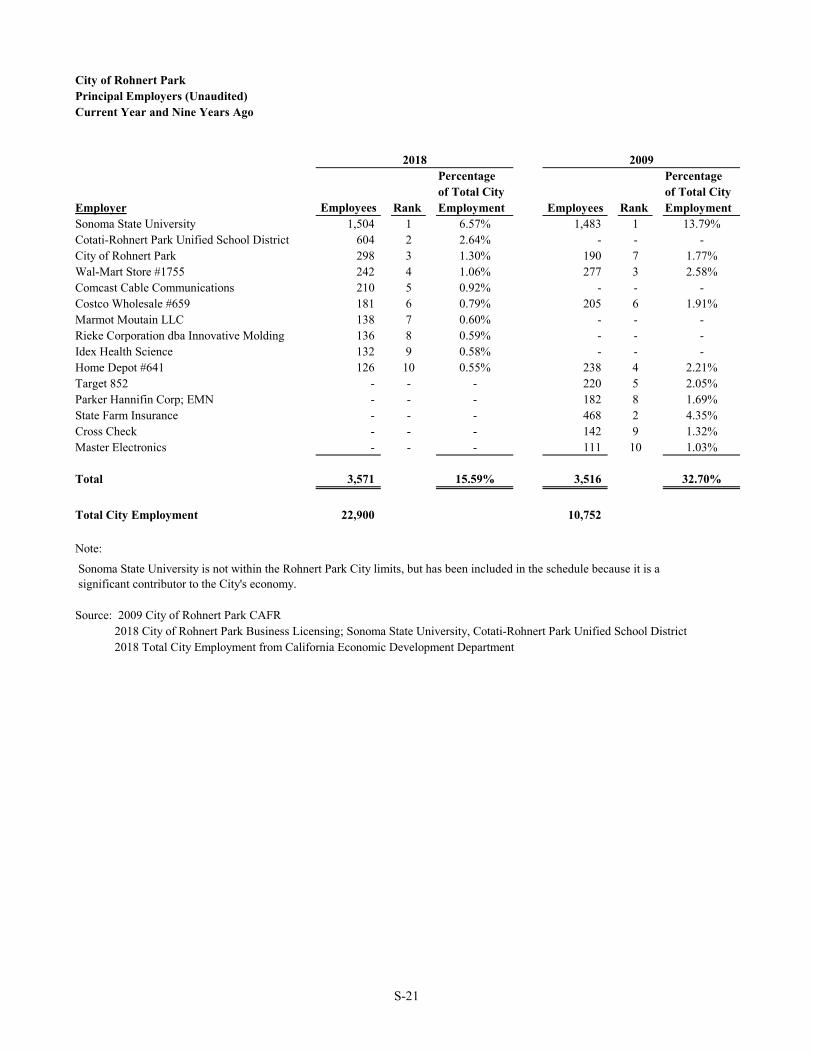
City of Rohnert ParkPrincipal Employers (Unaudited)Current Year and Nine Years Ago
Percentageof Total City
Employer Employees Rank Employment Employees RankSonoma State University 1,504 1 6.57% 1,483 1 13.79%Cotati-Rohnert Park Unified School District 604 2 2.64% - - -City of Rohnert Park 298 3 1.30% 190 7 1.77%Wal-Mart Store #1755 242 4 1.06% 277 3 2.58%Comcast Cable Communications 210 5 0.92% - - -Costco Wholesale #659 181 6 0.79% 205 6 1.91%Marmot Moutain LLC 138 7 0.60% - - -Rieke Corporation dba Innovative Molding 136 8 0.59% - - -Idex Health Science 132 9 0.58% - - -Home Depot #641 126 10 0.55% 238 4 2.21%Target 852 - - - 220 5 2.05%Parker Hannifin Corp; EMN - - - 182 8 1.69%State Farm Insurance - - - 468 2 4.35%Cross Check - - - 142 9 1.32%Master Electronics - - - 111 10 1.03%
Total 3,571 15.59% 3,516 32.70%
Total City Employment 22,900 10,752
Note:
Sonoma State University is not within the Rohnert Park City limits, but has been included in the schedule because it is a significant contributor to the City's economy.
Source: 2009 City of Rohnert Park CAFR 2018 City of Rohnert Park Business Licensing; Sonoma State University, Cotati-Rohnert Park Unified School District 2018 Total City Employment from California Economic Development Department
2018 2009Percentage
Employmentof Total City
S-21
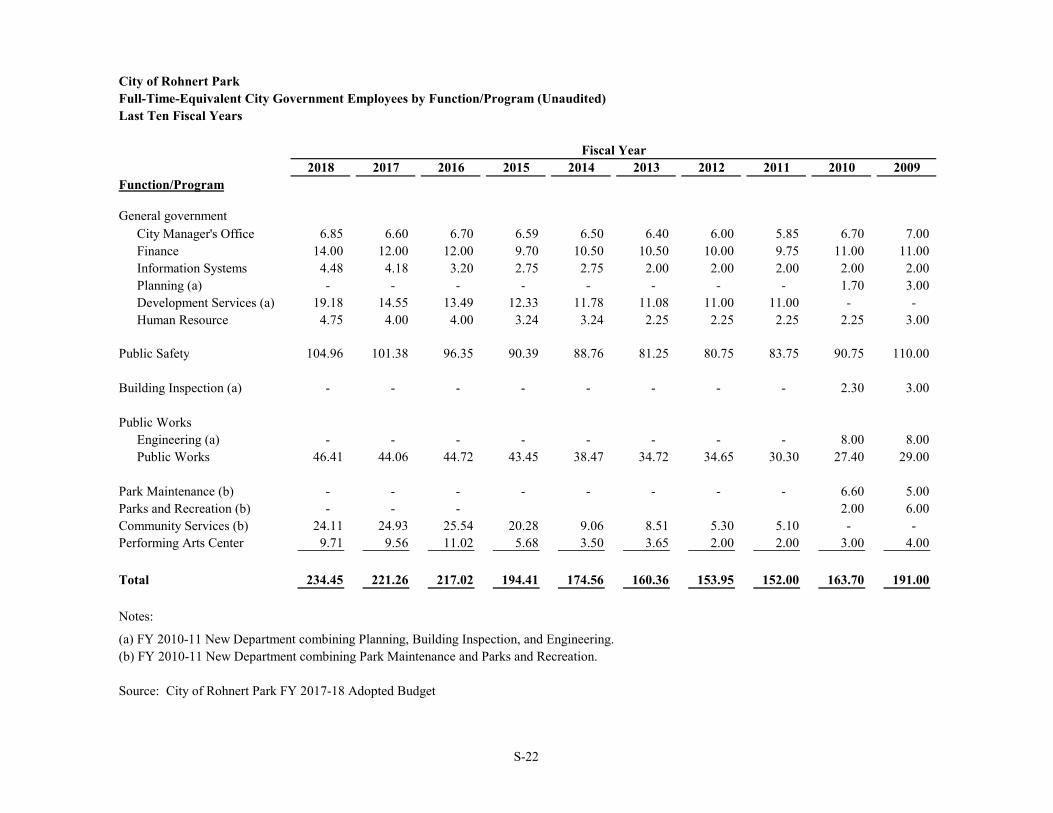
City of Rohnert ParkFull-Time-Equivalent City Government Employees by Function/Program (Unaudited)Last Ten Fiscal Years
2018 2017 2016 2015 2014 2013 2012 2011 2010 2009Function/Program
General governmentCity Manager's Office 6.85 6.60 6.70 6.59 6.50 6.40 6.00 5.85 6.70 7.00 Finance 14.00 12.00 12.00 9.70 10.50 10.50 10.00 9.75 11.00 11.00 Information Systems 4.48 4.18 3.20 2.75 2.75 2.00 2.00 2.00 2.00 2.00 Planning (a) - - - - - - - - 1.70 3.00 Development Services (a) 19.18 14.55 13.49 12.33 11.78 11.08 11.00 11.00 - - Human Resource 4.75 4.00 4.00 3.24 3.24 2.25 2.25 2.25 2.25 3.00
Public Safety 104.96 101.38 96.35 90.39 88.76 81.25 80.75 83.75 90.75 110.00
Building Inspection (a) - - - - - - - - 2.30 3.00
Public WorksEngineering (a) - - - - - - - - 8.00 8.00 Public Works 46.41 44.06 44.72 43.45 38.47 34.72 34.65 30.30 27.40 29.00
Park Maintenance (b) - - - - - - - - 6.60 5.00 Parks and Recreation (b) - - - 2.00 6.00 Community Services (b) 24.11 24.93 25.54 20.28 9.06 8.51 5.30 5.10 - - Performing Arts Center 9.71 9.56 11.02 5.68 3.50 3.65 2.00 2.00 3.00 4.00
Total 234.45 221.26 217.02 194.41 174.56 160.36 153.95 152.00 163.70 191.00
Notes:
(a) FY 2010-11 New Department combining Planning, Building Inspection, and Engineering.(b) FY 2010-11 New Department combining Park Maintenance and Parks and Recreation.
Source: City of Rohnert Park FY 2017-18 Adopted Budget
Fiscal Year
S-22
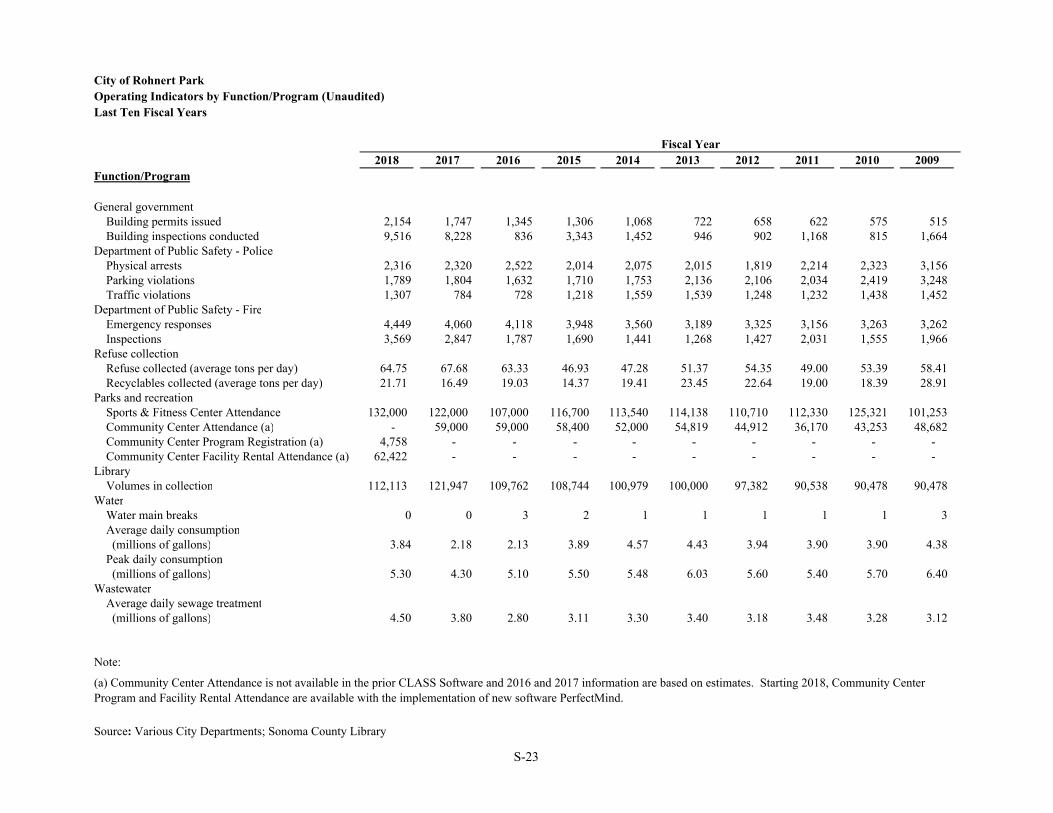
City of Rohnert ParkOperating Indicators by Function/Program (Unaudited)Last Ten Fiscal Years
2018 2017 2016 2015 2014 2013 2012 2011 2010 2009Function/Program
General governmentBuilding permits issued 2,154 1,747 1,345 1,306 1,068 722 658 622 575 515 Building inspections conducted 9,516 8,228 836 3,343 1,452 946 902 1,168 815 1,664
Department of Public Safety - PolicePhysical arrests 2,316 2,320 2,522 2,014 2,075 2,015 1,819 2,214 2,323 3,156 Parking violations 1,789 1,804 1,632 1,710 1,753 2,136 2,106 2,034 2,419 3,248 Traffic violations 1,307 784 728 1,218 1,559 1,539 1,248 1,232 1,438 1,452
Department of Public Safety - FireEmergency responses 4,449 4,060 4,118 3,948 3,560 3,189 3,325 3,156 3,263 3,262 Inspections 3,569 2,847 1,787 1,690 1,441 1,268 1,427 2,031 1,555 1,966
Refuse collectionRefuse collected (average tons per day) 64.75 67.68 63.33 46.93 47.28 51.37 54.35 49.00 53.39 58.41 Recyclables collected (average tons per day) 21.71 16.49 19.03 14.37 19.41 23.45 22.64 19.00 18.39 28.91
Parks and recreationSports & Fitness Center Attendance 132,000 122,000 107,000 116,700 113,540 114,138 110,710 112,330 125,321 101,253 Community Center Attendance (a) - 59,000 59,000 58,400 52,000 54,819 44,912 36,170 43,253 48,682 Community Center Program Registration (a) 4,758 - - - - - - - - - Community Center Facility Rental Attendance (a) 62,422 - - - - - - - - -
LibraryVolumes in collection 112,113 121,947 109,762 108,744 100,979 100,000 97,382 90,538 90,478 90,478
WaterWater main breaks 0 0 3 2 1 1 1 1 1 3 Average daily consumption (millions of gallons) 3.84 2.18 2.13 3.89 4.57 4.43 3.94 3.90 3.90 4.38 Peak daily consumption (millions of gallons) 5.30 4.30 5.10 5.50 5.48 6.03 5.60 5.40 5.70 6.40
WastewaterAverage daily sewage treatment (millions of gallons) 4.50 3.80 2.80 3.11 3.30 3.40 3.18 3.48 3.28 3.12
Note:
Source: Various City Departments; Sonoma County Library
Fiscal Year
(a) Community Center Attendance is not available in the prior CLASS Software and 2016 and 2017 information are based on estimates. Starting 2018, Community Center Program and Facility Rental Attendance are available with the implementation of new software PerfectMind.
S-23
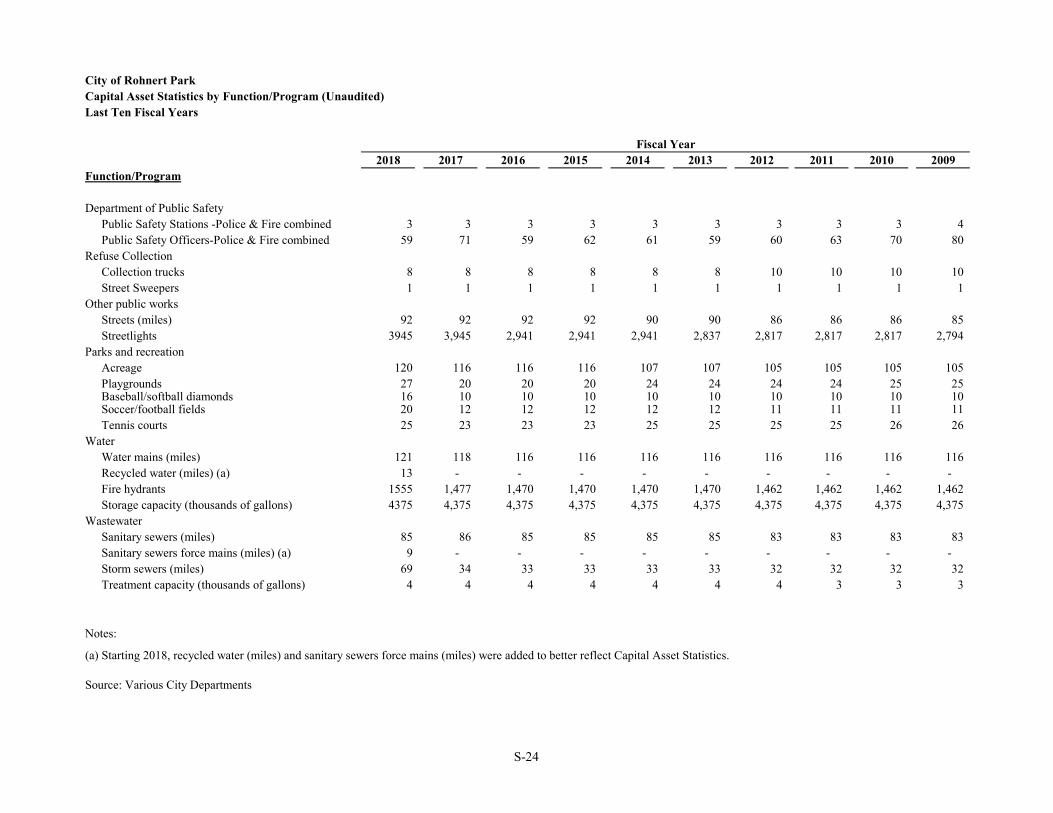
City of Rohnert ParkCapital Asset Statistics by Function/Program (Unaudited)Last Ten Fiscal Years
2018 2017 2016 2015 2014 2013 2012 2011 2010 2009Function/Program
Department of Public Safety Public Safety Stations -Police & Fire combined 3 3 3 3 3 3 3 3 3 4 Public Safety Officers-Police & Fire combined 59 71 59 62 61 59 60 63 70 80
Refuse CollectionCollection trucks 8 8 8 8 8 8 10 10 10 10 Street Sweepers 1 1 1 1 1 1 1 1 1 1
Other public worksStreets (miles) 92 92 92 92 90 90 86 86 86 85 Streetlights 3945 3,945 2,941 2,941 2,941 2,837 2,817 2,817 2,817 2,794
Parks and recreationAcreage 120 116 116 116 107 107 105 105 105 105 Playgrounds 27 20 20 20 24 24 24 24 25 25 Baseball/softball diamonds 16 10 10 10 10 10 10 10 10 10 Soccer/football fields 20 12 12 12 12 12 11 11 11 11 Tennis courts 25 23 23 23 25 25 25 25 26 26
WaterWater mains (miles) 121 118 116 116 116 116 116 116 116 116 Recycled water (miles) (a) 13 - - - - - - - - - Fire hydrants 1555 1,477 1,470 1,470 1,470 1,470 1,462 1,462 1,462 1,462 Storage capacity (thousands of gallons) 4375 4,375 4,375 4,375 4,375 4,375 4,375 4,375 4,375 4,375
WastewaterSanitary sewers (miles) 85 86 85 85 85 85 83 83 83 83 Sanitary sewers force mains (miles) (a) 9 - - - - - - - - - Storm sewers (miles) 69 34 33 33 33 33 32 32 32 32 Treatment capacity (thousands of gallons) 4 4 4 4 4 4 4 3 3 3
Notes:
Source: Various City Departments
Fiscal Year
(a) Starting 2018, recycled water (miles) and sanitary sewers force mains (miles) were added to better reflect Capital Asset Statistics.
S-24
CITY OF ROHNERT PARK, CALIFORNIA
Independent Accountant’s Report on Applying Agreed-Upon Procedures Related to
the Article XIII-B Appropriations Limit
For the Year Ending June 30, 2019
www.mgocpa.com Macias Gini & O’Connell LLP 2121 N. California Boulevard, Suite 750 Walnut Creek, CA 94596
1
Independent Accountant’s Report on
Applying Agreed-Upon Procedures Related to the Article XIII-B Appropriations Limit
The Honorable Mayor and Members of the City Council Rohnert Park, California
We have performed the procedures enumerated below to the accompanying Appropriations Limit Worksheet of the City of Rohnert Park, California (City), for the year ending June 30, 2019. These procedures, which were agreed to by the City and recommended by the California Committee on Municipal Accounting (CCMA) (as presented in the CCMA White Paper titled Agreed-upon Procedures Applied to the Appropriations Limitation Prescribed by Article XIII-B of the California Constitution), were performed on the City’s calculation of the appropriations limit in accordance with Section 1.5 of Article XIII-B of the California Constitution. The City’s management is responsible for the Appropriations Limit Worksheet. The sufficiency of these procedures is solely the responsibility of the City’s management. Consequently, we make no representation regarding the sufficiency of the procedures described below either for the purpose for which this report has been requested or for any other purpose. The procedures performed and our findings were as follows: 1. We obtained the completed worksheets setting forth the calculations necessary to establish the
City’s appropriations limit and compared the limit and annual adjustment factors included in those worksheets to the limit and annual adjustment factors that were adopted by resolution of the City Council. We also compared the population and inflation options included in the aforementioned worksheets to those that were selected by a recorded vote of the City Council.
Finding: No exceptions were noted as a result of our procedures.
2. For the accompanying Appropriations Limit Worksheet, we added the prior year appropriations
limit to the total adjustments and compared the resulting amount to the current year appropriations limit.
Finding: No exceptions were noted as a result of our procedures.
3. We agreed the current year information presented in the accompanying Appropriations Limit Worksheet to the appropriate supporting worksheets described in No. 1 above.
Finding: No exceptions were noted as a result of our procedures.
4. We agreed the prior year appropriations limit presented in the accompanying Appropriations Limit Worksheet to the prior year appropriations limit adopted by the City Council. Finding: No exceptions were noted as a result of our procedures.
2
This agreed-upon procedures engagement was conducted in accordance with attestation standards established by the American Institute of Certified Public Accountants. We were not engaged to and did not conduct an examination or review, the objective of which would be the expression of an opinion or conclusion, respectively, on the Appropriations Limit Worksheet. Accordingly, we do not express such an opinion or conclusion. Had we performed additional procedures, other matters might have come to our attention that would have been reported to you. No procedures have been performed with respect to the determination of the appropriations limit for the base year, as defined by Article XIII-B of the California Constitution. This report is intended solely for the information and use of the Mayor, City Council, and City’s management and is not intended to be and should not be used by anyone other than these specified parties.
Walnut Creek, California January 18, 2019
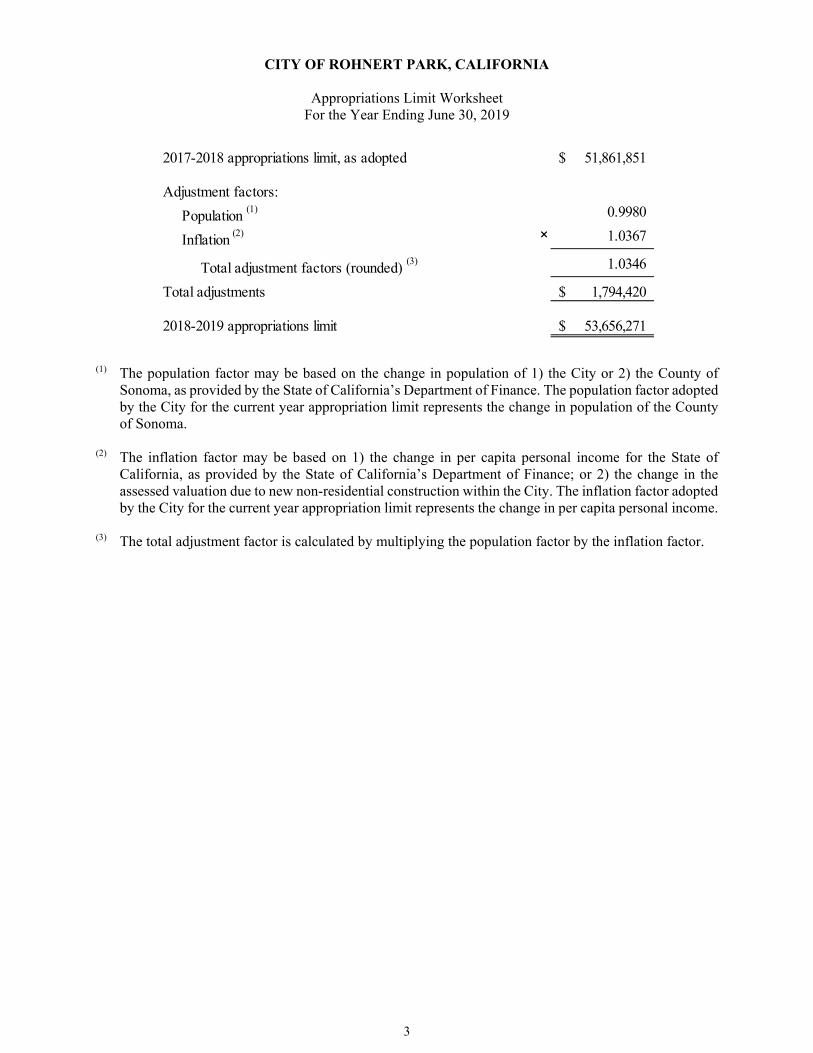
CITY OF ROHNERT PARK, CALIFORNIA
Appropriations Limit Worksheet For the Year Ending June 30, 2019
3
2017-2018 appropriations limit, as adopted 51,861,851$
Adjustment factors:
Population (1) 0.9980
Inflation (2) × 1.0367
Total adjustment factors (rounded) (3) 1.0346
Total adjustments 1,794,420$
2018-2019 appropriations limit 53,656,271$
(1) The population factor may be based on the change in population of 1) the City or 2) the County of Sonoma, as provided by the State of California’s Department of Finance. The population factor adopted by the City for the current year appropriation limit represents the change in population of the County of Sonoma.
(2) The inflation factor may be based on 1) the change in per capita personal income for the State of
California, as provided by the State of California’s Department of Finance; or 2) the change in the assessed valuation due to new non-residential construction within the City. The inflation factor adopted by the City for the current year appropriation limit represents the change in per capita personal income.
(3) The total adjustment factor is calculated by multiplying the population factor by the inflation factor.