Embed Size (px)
Citation preview
UNITED STATES SECURITIES AND EXCHANGE COMMISSION
Washington, D.C. 20549
Form 8-K
CURRENT REPORT Pursuant to Section 13 or 15(d) of the Securities Exchange Act of 1934
Date of Report (Date of earliest event reported): August 24, 2017
SIGNET JEWELERS LIMITED (Exact name of registrant as specified in its charter)
Commission File Number: 1-32349
Bermuda(State or other jurisdiction of
incorporation)(IRS Employer
Identification No.)
Clarendon House 2 Church Street
Hamilton HM11
Bermuda (Address of principal executive offices, including zip code)
441 296 5872 (Registrant's telephone number, including area code)
(Former name or former address, if changed since last report)
Check the appropriate box below if the Form 8-K filing is intended to simultaneously satisfy the filing obligation of the registrant under any of the following provisions:
⃞ Written communications pursuant to Rule 425 under the Securities Act (17 CFR 230.425)
⃞ Soliciting material pursuant to Rule 14a-12 under the Exchange Act (17 CFR 240.14a-12)
⃞ Pre-commencement communications pursuant to Rule 14d-2(b) under the Exchange Act (17 CFR 240.14d-2(b))
⃞ Pre-commencement communications pursuant to Rule 13e-4(c) under the Exchange Act (17 CFR 240.13e-4(c))
Indicate by check mark whether the registrant is an emerging growth company as defined in as defined in Rule 405 of the Securities Act of 1933 (§230.405 of this chapter) orRule 12b-2 of the Securities Exchange Act of 1934 (§240.12b-2 of this chapter).
Emerging growth company ⃞
If an emerging growth company, indicate by check mark if the registrant has elected not to use the extended transition period for complying with any new or revisedfinancial accounting standards provided pursuant to Section 13(a) of the Exchange Act. ⃞

Item 2.02. Results of Operations and Financial Condition
On August 24, 2017, the Registrant issued a press release announcing its unaudited earnings and results of operations for the second quarter ended July 29, 2017. A copy of thepress release is attached hereto as Exhibit 99.1 to this Form 8-K.
The information in this Current Report on Form 8-K is being furnished pursuant to Item 2.02 Results of Operations and Financial Condition. In accordance with GeneralInstruction B.2 of Form 8-K, the information in this report shall not be deemed "filed" for the purposes of Section 18 of the Securities Exchange Act of 1934, as amended (the"Exchange Act"), or otherwise subject to the liabilities of that section, nor shall it be deemed incorporated by reference in any filing under the Securities Act of 1933, as amended, orthe Exchange Act, except as expressly stated by specific reference in such filing.
SIGNATURES
Pursuant to the requirements of the Securities Exchange Act of 1934, the registrant has duly caused this report to be signed on its behalf by the undersigned hereunto dulyauthorized.
SIGNET JEWELERS LIMITED
Date: August 24, 2017 By: /s/ Michele SantanaMichele SantanaChief Financial Officer

EXHIBIT INDEX
Exhibit No. DescriptionEX-99.1 Press Release – August 24, 2017EX-99.2 Presentation - Second Quarter Fiscal 2018 Results
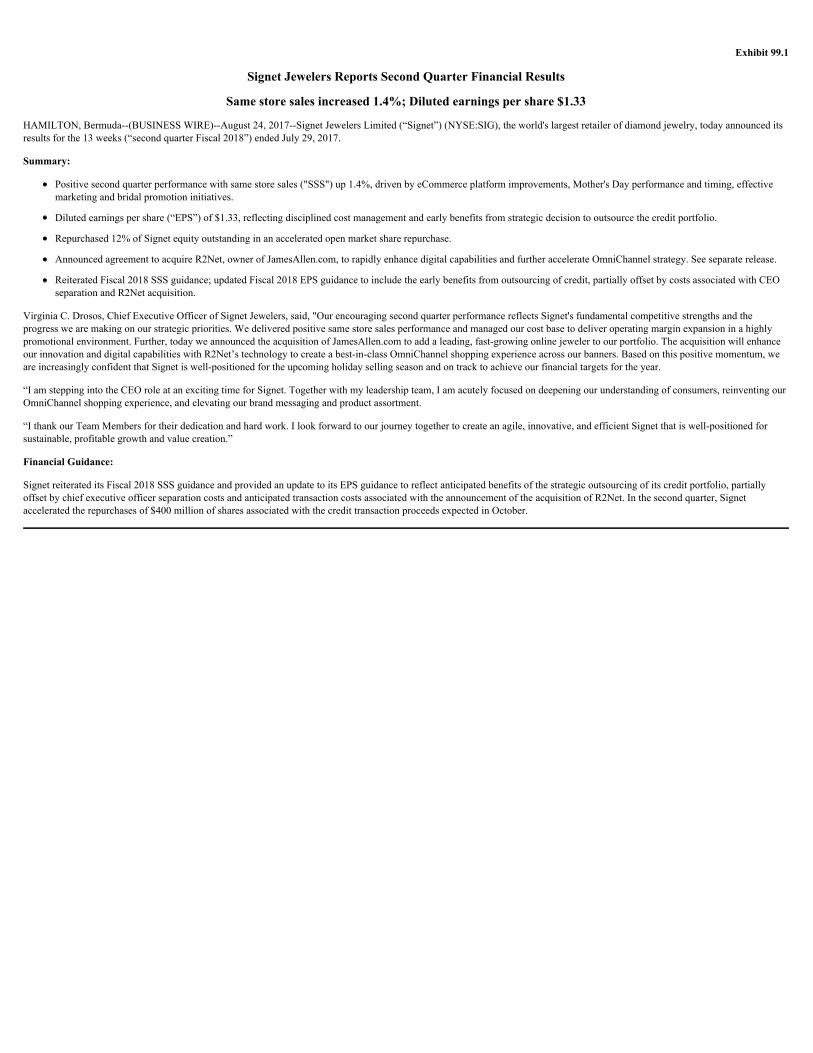
Exhibit 99.1
Signet Jewelers Reports Second Quarter Financial Results
Same store sales increased 1.4%; Diluted earnings per share $1.33
HAMILTON, Bermuda--(BUSINESS WIRE)--August 24, 2017--Signet Jewelers Limited (“Signet”) (NYSE:SIG), the world's largest retailer of diamond jewelry, today announced itsresults for the 13 weeks (“second quarter Fiscal 2018”) ended July 29, 2017.
Summary:
Positive second quarter performance with same store sales ("SSS") up 1.4%, driven by eCommerce platform improvements, Mother's Day performance and timing, effectivemarketing and bridal promotion initiatives.
Diluted earnings per share (“EPS”) of $1.33, reflecting disciplined cost management and early benefits from strategic decision to outsource the credit portfolio.
Repurchased 12% of Signet equity outstanding in an accelerated open market share repurchase.
Announced agreement to acquire R2Net, owner of JamesAllen.com, to rapidly enhance digital capabilities and further accelerate OmniChannel strategy. See separate release.
Reiterated Fiscal 2018 SSS guidance; updated Fiscal 2018 EPS guidance to include the early benefits from outsourcing of credit, partially offset by costs associated with CEOseparation and R2Net acquisition.
Virginia C. Drosos, Chief Executive Officer of Signet Jewelers, said, "Our encouraging second quarter performance reflects Signet's fundamental competitive strengths and theprogress we are making on our strategic priorities. We delivered positive same store sales performance and managed our cost base to deliver operating margin expansion in a highlypromotional environment. Further, today we announced the acquisition of JamesAllen.com to add a leading, fast-growing online jeweler to our portfolio. The acquisition will enhanceour innovation and digital capabilities with R2Net’s technology to create a best-in-class OmniChannel shopping experience across our banners. Based on this positive momentum, weare increasingly confident that Signet is well-positioned for the upcoming holiday selling season and on track to achieve our financial targets for the year.
“I am stepping into the CEO role at an exciting time for Signet. Together with my leadership team, I am acutely focused on deepening our understanding of consumers, reinventing ourOmniChannel shopping experience, and elevating our brand messaging and product assortment.
“I thank our Team Members for their dedication and hard work. I look forward to our journey together to create an agile, innovative, and efficient Signet that is well-positioned forsustainable, profitable growth and value creation.”
Financial Guidance:
Signet reiterated its Fiscal 2018 SSS guidance and provided an update to its EPS guidance to reflect anticipated benefits of the strategic outsourcing of its credit portfolio, partiallyoffset by chief executive officer separation costs and anticipated transaction costs associated with the announcement of the acquisition of R2Net. In the second quarter, Signetaccelerated the repurchases of $400 million of shares associated with the credit transaction proceeds expected in October.
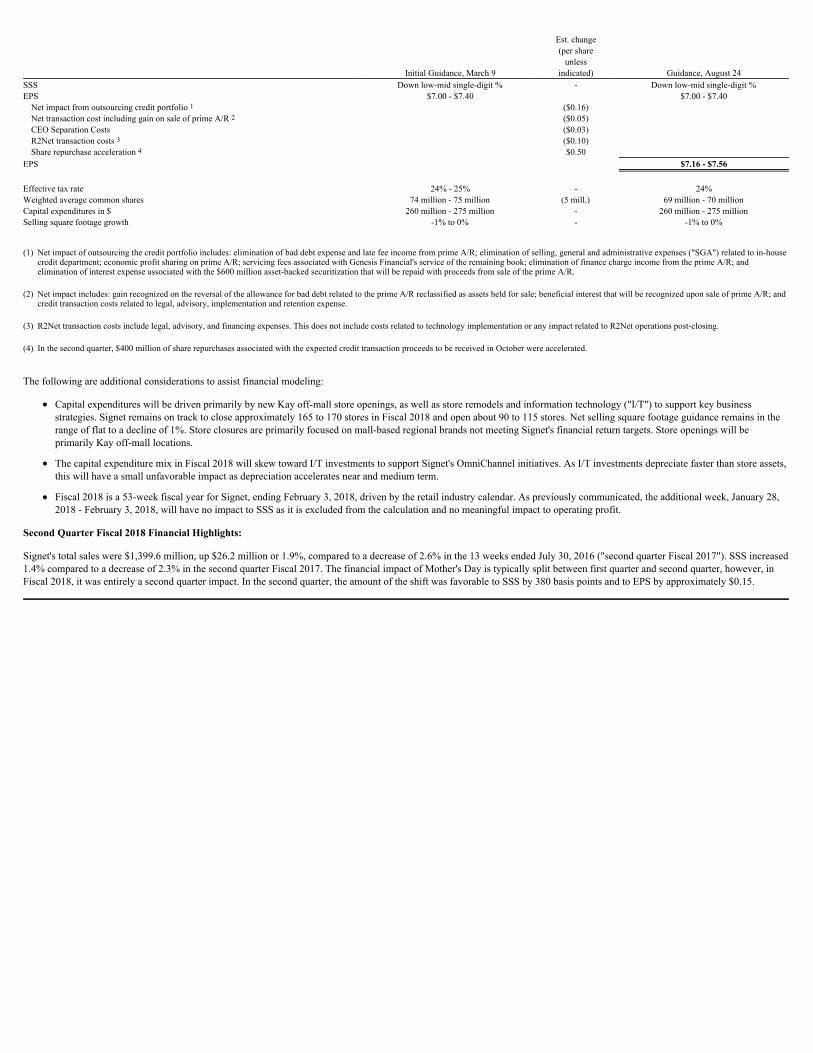
Est. change (per shareunless
Initial Guidance, March 9 indicated) Guidance, August 24SSS Down low-mid single-digit % - Down low-mid single-digit %EPS $7.00 - $7.40 $7.00 - $7.40Net impact from outsourcing credit portfolio 1 ($0.16)Net transaction cost including gain on sale of prime A/R 2 ($0.05)CEO Separation Costs ($0.03)R2Net transaction costs 3 ($0.10)Share repurchase acceleration 4 $0.50
EPS $7.16 - $7.56
Effective tax rate 24% - 25% - 24%Weighted average common shares 74 million - 75 million (5 mill.) 69 million - 70 millionCapital expenditures in $ 260 million - 275 million - 260 million - 275 millionSelling square footage growth -1% to 0% - -1% to 0%
(1) Net impact of outsourcing the credit portfolio includes: elimination of bad debt expense and late fee income from prime A/R; elimination of selling, general and administrative expenses ("SGA") related to in-house
credit department; economic profit sharing on prime A/R; servicing fees associated with Genesis Financial's service of the remaining book; elimination of finance charge income from the prime A/R; andelimination of interest expense associated with the $600 million asset-backed securitization that will be repaid with proceeds from sale of the prime A/R.
(2) Net impact includes: gain recognized on the reversal of the allowance for bad debt related to the prime A/R reclassified as assets held for sale; beneficial interest that will be recognized upon sale of prime A/R; andcredit transaction costs related to legal, advisory, implementation and retention expense.
(3) R2Net transaction costs include legal, advisory, and financing expenses. This does not include costs related to technology implementation or any impact related to R2Net operations post-closing.
(4) In the second quarter, $400 million of share repurchases associated with the expected credit transaction proceeds to be received in October were accelerated.
The following are additional considerations to assist financial modeling:
Capital expenditures will be driven primarily by new Kay off-mall store openings, as well as store remodels and information technology ("I/T") to support key businessstrategies. Signet remains on track to close approximately 165 to 170 stores in Fiscal 2018 and open about 90 to 115 stores. Net selling square footage guidance remains in therange of flat to a decline of 1%. Store closures are primarily focused on mall-based regional brands not meeting Signet's financial return targets. Store openings will beprimarily Kay off-mall locations.
The capital expenditure mix in Fiscal 2018 will skew toward I/T investments to support Signet's OmniChannel initiatives. As I/T investments depreciate faster than store assets,this will have a small unfavorable impact as depreciation accelerates near and medium term.
Fiscal 2018 is a 53-week fiscal year for Signet, ending February 3, 2018, driven by the retail industry calendar. As previously communicated, the additional week, January 28,2018 - February 3, 2018, will have no impact to SSS as it is excluded from the calculation and no meaningful impact to operating profit.
Second Quarter Fiscal 2018 Financial Highlights:
Signet's total sales were $1,399.6 million, up $26.2 million or 1.9%, compared to a decrease of 2.6% in the 13 weeks ended July 30, 2016 ("second quarter Fiscal 2017"). SSS increased1.4% compared to a decrease of 2.3% in the second quarter Fiscal 2017. The financial impact of Mother's Day is typically split between first quarter and second quarter, however, inFiscal 2018, it was entirely a second quarter impact. In the second quarter, the amount of the shift was favorable to SSS by 380 basis points and to EPS by approximately $0.15.
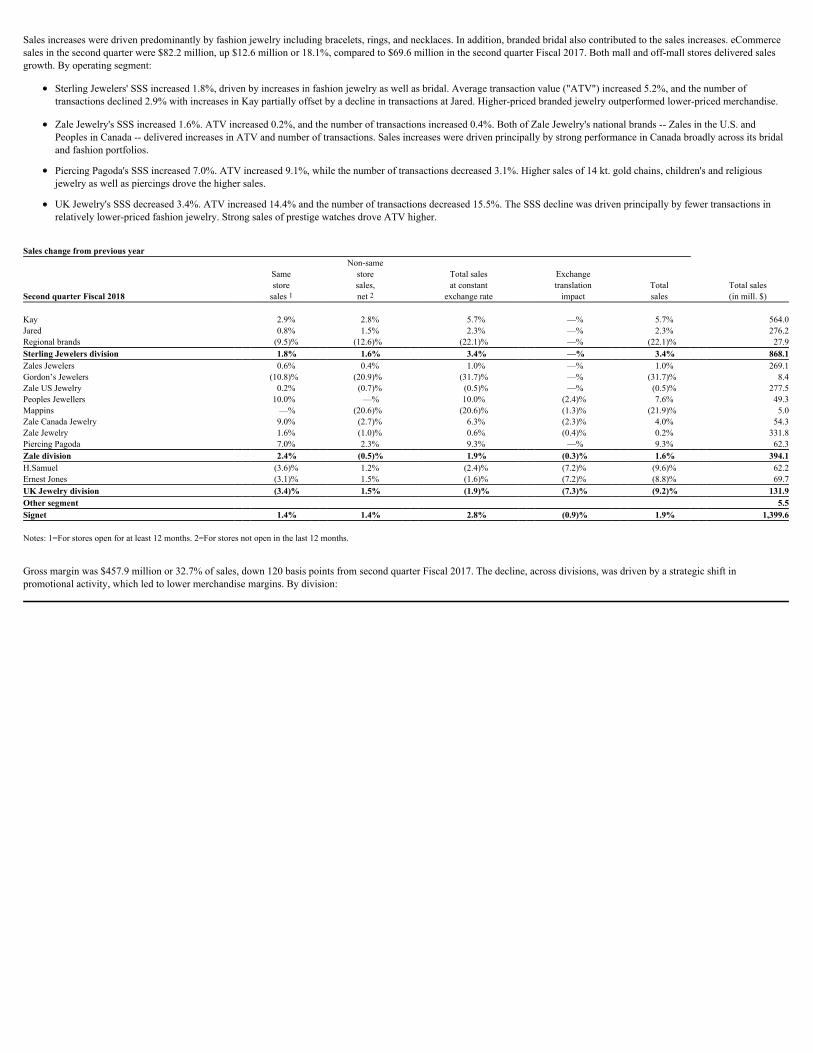
Sales increases were driven predominantly by fashion jewelry including bracelets, rings, and necklaces. In addition, branded bridal also contributed to the sales increases. eCommercesales in the second quarter were $82.2 million, up $12.6 million or 18.1%, compared to $69.6 million in the second quarter Fiscal 2017. Both mall and off-mall stores delivered salesgrowth. By operating segment:
Sterling Jewelers' SSS increased 1.8%, driven by increases in fashion jewelry as well as bridal. Average transaction value ("ATV") increased 5.2%, and the number oftransactions declined 2.9% with increases in Kay partially offset by a decline in transactions at Jared. Higher-priced branded jewelry outperformed lower-priced merchandise.
Zale Jewelry's SSS increased 1.6%. ATV increased 0.2%, and the number of transactions increased 0.4%. Both of Zale Jewelry's national brands -- Zales in the U.S. andPeoples in Canada -- delivered increases in ATV and number of transactions. Sales increases were driven principally by strong performance in Canada broadly across its bridaland fashion portfolios.
Piercing Pagoda's SSS increased 7.0%. ATV increased 9.1%, while the number of transactions decreased 3.1%. Higher sales of 14 kt. gold chains, children's and religiousjewelry as well as piercings drove the higher sales.
UK Jewelry's SSS decreased 3.4%. ATV increased 14.4% and the number of transactions decreased 15.5%. The SSS decline was driven principally by fewer transactions inrelatively lower-priced fashion jewelry. Strong sales of prestige watches drove ATV higher.
Sales change from previous year
Non-same Same store Total sales Exchangestore sales, at constant translation Total Total sales
Second quarter Fiscal 2018 sales 1 net 2 exchange rate impact sales (in mill. $)
Kay 2.9% 2.8% 5.7% —% 5.7% 564.0Jared 0.8% 1.5% 2.3% —% 2.3% 276.2Regional brands (9.5)% (12.6)% (22.1)% —% (22.1)% 27.9Sterling Jewelers division 1.8% 1.6% 3.4% —% 3.4% 868.1Zales Jewelers 0.6% 0.4% 1.0% —% 1.0% 269.1Gordon’s Jewelers (10.8)% (20.9)% (31.7)% —% (31.7)% 8.4Zale US Jewelry 0.2% (0.7)% (0.5)% —% (0.5)% 277.5Peoples Jewellers 10.0% —% 10.0% (2.4)% 7.6% 49.3Mappins —% (20.6)% (20.6)% (1.3)% (21.9)% 5.0Zale Canada Jewelry 9.0% (2.7)% 6.3% (2.3)% 4.0% 54.3Zale Jewelry 1.6% (1.0)% 0.6% (0.4)% 0.2% 331.8Piercing Pagoda 7.0% 2.3% 9.3% —% 9.3% 62.3Zale division 2.4% (0.5)% 1.9% (0.3)% 1.6% 394.1H.Samuel (3.6)% 1.2% (2.4)% (7.2)% (9.6)% 62.2Ernest Jones (3.1)% 1.5% (1.6)% (7.2)% (8.8)% 69.7UK Jewelry division (3.4)% 1.5% (1.9)% (7.3)% (9.2)% 131.9Other segment 5.5Signet 1.4% 1.4% 2.8% (0.9)% 1.9% 1,399.6
Notes: 1=For stores open for at least 12 months. 2=For stores not open in the last 12 months.
Gross margin was $457.9 million or 32.7% of sales, down 120 basis points from second quarter Fiscal 2017. The decline, across divisions, was driven by a strategic shift inpromotional activity, which led to lower merchandise margins. By division:
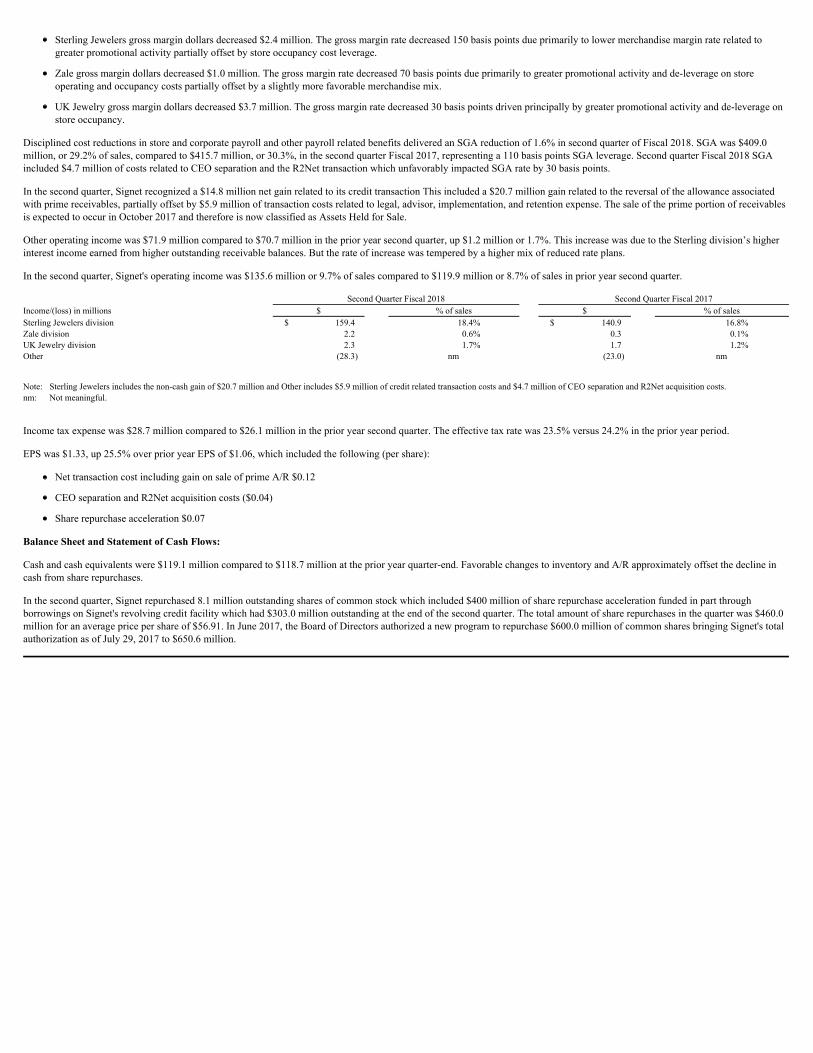
Sterling Jewelers gross margin dollars decreased $2.4 million. The gross margin rate decreased 150 basis points due primarily to lower merchandise margin rate related togreater promotional activity partially offset by store occupancy cost leverage.
Zale gross margin dollars decreased $1.0 million. The gross margin rate decreased 70 basis points due primarily to greater promotional activity and de-leverage on storeoperating and occupancy costs partially offset by a slightly more favorable merchandise mix.
UK Jewelry gross margin dollars decreased $3.7 million. The gross margin rate decreased 30 basis points driven principally by greater promotional activity and de-leverage onstore occupancy.
Disciplined cost reductions in store and corporate payroll and other payroll related benefits delivered an SGA reduction of 1.6% in second quarter of Fiscal 2018. SGA was $409.0million, or 29.2% of sales, compared to $415.7 million, or 30.3%, in the second quarter Fiscal 2017, representing a 110 basis points SGA leverage. Second quarter Fiscal 2018 SGAincluded $4.7 million of costs related to CEO separation and the R2Net transaction which unfavorably impacted SGA rate by 30 basis points.
In the second quarter, Signet recognized a $14.8 million net gain related to its credit transaction This included a $20.7 million gain related to the reversal of the allowance associatedwith prime receivables, partially offset by $5.9 million of transaction costs related to legal, advisor, implementation, and retention expense. The sale of the prime portion of receivablesis expected to occur in October 2017 and therefore is now classified as Assets Held for Sale.
Other operating income was $71.9 million compared to $70.7 million in the prior year second quarter, up $1.2 million or 1.7%. This increase was due to the Sterling division’s higherinterest income earned from higher outstanding receivable balances. But the rate of increase was tempered by a higher mix of reduced rate plans.
In the second quarter, Signet's operating income was $135.6 million or 9.7% of sales compared to $119.9 million or 8.7% of sales in prior year second quarter.
Second Quarter Fiscal 2018 Second Quarter Fiscal 2017Income/(loss) in millions $ % of sales $ % of salesSterling Jewelers division $ 159.4 18.4% $ 140.9 16.8%Zale division 2.2 0.6% 0.3 0.1%UK Jewelry division 2.3 1.7% 1.7 1.2%Other (28.3) nm (23.0) nm
Note: Sterling Jewelers includes the non-cash gain of $20.7 million and Other includes $5.9 million of credit related transaction costs and $4.7 million of CEO separation and R2Net acquisition costs.nm: Not meaningful.
Income tax expense was $28.7 million compared to $26.1 million in the prior year second quarter. The effective tax rate was 23.5% versus 24.2% in the prior year period.
EPS was $1.33, up 25.5% over prior year EPS of $1.06, which included the following (per share):
Net transaction cost including gain on sale of prime A/R $0.12
CEO separation and R2Net acquisition costs ($0.04)
Share repurchase acceleration $0.07
Balance Sheet and Statement of Cash Flows:
Cash and cash equivalents were $119.1 million compared to $118.7 million at the prior year quarter-end. Favorable changes to inventory and A/R approximately offset the decline incash from share repurchases.
In the second quarter, Signet repurchased 8.1 million outstanding shares of common stock which included $400 million of share repurchase acceleration funded in part throughborrowings on Signet's revolving credit facility which had $303.0 million outstanding at the end of the second quarter. The total amount of share repurchases in the quarter was $460.0million for an average price per share of $56.91. In June 2017, the Board of Directors authorized a new program to repurchase $600.0 million of common shares bringing Signet's totalauthorization as of July 29, 2017 to $650.6 million.

At the end of the second quarter, A/R-net was $664.5 million and A/R-held for sale was $1,055.6 million for a total of $1,720.1 in A/R held by Signet. This represents an increase of4.2% compared to $1,650.6 million at the prior year quarter-end. The second quarter Sterling Jewelers in-house credit sales increased 1.3% and credit participation rate was 61.7%compared to 63.1% in the second quarter last year. Credit sales increased but decreased as a percent of tender used due principally to a decline in application volume. Finance chargeincome in the second quarter was $69.9 million and net bad debt was $57.6 million -- a favorable difference of $12.3 million. This compares to a difference of $14.8 million in the prioryear. The decline was due principally to slower credit sales and credit plan mix.
Net inventories were $2,282.1 million, down 5.6% compared to $2,418.3 million at the prior year quarter-end. This was driven primarily by a focus on working capital across thebusiness.
Long term debt was $705.3 million compared to $1,330.5 million in the prior year period. The $625.2 million decline was driven principally by the reclassification of the asset backedsecuritization to loans and overdrafts (a.k.a. short term debt). The asset backed securitization of $600.0 million is expected to be repaid in October 2017 with the proceeds associatedwith the sale of Signet's prime portfolio.
Signet’s capital allocation is essentially unchanged in light of the resolution of the Company’s credit strategic review. Signet remains committed to maintaining an investment gradeprofile with a strong balance sheet and financial flexibility to fund its business and growth strategy. As noted, the proceeds from the transaction will be used towards redeeming the$600.0 million securitization facility. The remaining $400.0 million of proceeds from the sale will be used to repay the short-term loan associated with the R2Net acquisition and otherborrowings under the revolver. Signet does not expect material additional share repurchases in Fiscal 2018. The Company is targeting to maintain an adjusted leverage ratio between3.0x to 3.5x.
On July 29, 2017 Signet had 3,637 stores totaling 5.1 million square feet of selling space. Since prior year-end, store count decreased by 45 and square feet of selling space decreased0.4%. The majority of new store openings were in off-mall locations, while store closures focused on regional brands.
Quarterly Dividend:
Signet’s board declared a quarterly cash dividend of $0.31 per share for the third quarter of Fiscal 2018, payable on November 30, 2017 to shareholders of record on October 27, 2017,with an ex-dividend date of October 26, 2017.
Conference Call:
A conference call is scheduled today at 8:30 a.m. ET and a simultaneous audio webcast and slide presentation are available at www.signetjewelers.com . The slides are available to bedownloaded from the website. The call details are:
Dial-in: 1-647-788-4901 Access code: 44319273
A replay and transcript of the call will be posted on Signet's website as soon as they are available and will be accessible for one year.
About Signet and Safe Harbor Statement:
Signet Jewelers Limited is the world's largest retailer of diamond jewelry. Signet operates approximately 3,600 stores primarily under the name brands of Kay Jewelers, Zales, JaredThe Galleria Of Jewelry, H.Samuel, Ernest Jones, Peoples and Piercing Pagoda. Further information on Signet is available at www.signetjewelers.com . See also www.kay.com ,www.zales.com , www.jared.com , www.hsamuel.co.uk , www.ernestjones.co.uk , www.peoplesjewellers.com and www.pagoda.com .

This release contains statements which are forward-looking statements within the meaning of the Private Securities Litigation Reform Act of 1995. These statements, based uponmanagement's beliefs and expectations as well as on assumptions made by and data currently available to management, include statements regarding, among other things, Signet'sresults of operation, financial condition, liquidity, prospects, growth, strategies and the industry in which Signet operates. The use of the words "expects," "intends," "anticipates,""estimates," "predicts," "believes," "should," "potential," "may," "forecast," "objective," "plan," or "target," and other similar expressions are intended to identify forward-lookingstatements. These forward-looking statements are not guarantees of future performance and are subject to a number of risks and uncertainties, including but not limited to Signet'sexpectation about the benefits and costs, the anticipated terms and availability of financing, and the timing of the closing of the R2Net transaction, including future financial andoperating results, Signet’s expectations, including timing, regarding the anticipated closings of the various credit portfolio transactions, statements about the benefits of the creditportfolio sales including future financial and operating results, Signet’s or the other parties’ ability to satisfy the requirements for consummation of the agreements relating to the creditportfolio transactions, including due to regulatory or legal impediments, the effect of regulatory conditions on the credit purchase agreements and credit program agreements, generaleconomic conditions, regulatory changes following the United Kingdom’s announcement to exit from the European Union, risks relating to Signet being a Bermuda corporation, themerchandising, pricing and inventory policies followed by Signet, the reputation of Signet and its brands, the level of competition in the jewelry sector, the cost and availability ofdiamonds, gold and other precious metals, regulations relating to customer credit, seasonality of Signet's business, financial market risks, deterioration in customers’ financialcondition, exchange rate fluctuations, changes in Signet's credit rating, changes in consumer attitudes regarding jewelry, management of social, ethical and environmental risks,security breaches and other disruptions to Signet's information technology infrastructure and databases, inadequacy in and disruptions to internal controls and systems, changes inassumptions used in making accounting estimates relating to items such as extended service plans and pensions, the impact of the acquisition of Zale Corporation on relationships,including with employees, suppliers, customers and competitors, and our ability to successfully integrate Zale's operations and to realize synergies from the transaction.
For a discussion of these and other risks and uncertainties which could cause actual results to differ materially from those expressed in any forward-looking statement, see the "RiskFactors" section of Signet's Fiscal 2017 Annual Report on Form 10-K filed with the SEC on March 16, 2017 and quarterly reports on Form 10-Q filed with the SEC. Signet undertakesno obligation to update or revise any forward-looking statements to reflect subsequent events or circumstances, except as required by law.
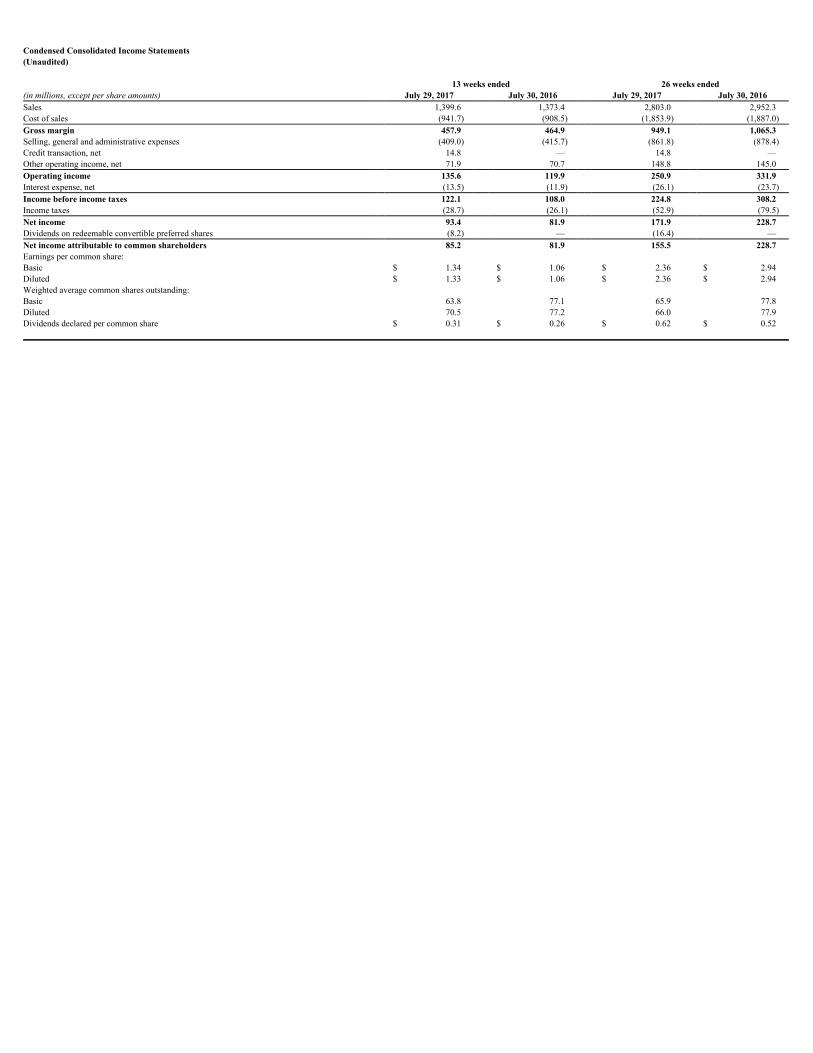
Condensed Consolidated Income Statements(Unaudited)
13 weeks ended 26 weeks ended
(in millions, except per share amounts) July 29, 2017 July 30, 2016 July 29, 2017 July 30, 2016Sales 1,399.6 1,373.4 2,803.0 2,952.3Cost of sales (941.7) (908.5) (1,853.9) (1,887.0)Gross margin 457.9 464.9 949.1 1,065.3Selling, general and administrative expenses (409.0) (415.7) (861.8) (878.4)Credit transaction, net 14.8 — 14.8 —Other operating income, net 71.9 70.7 148.8 145.0 Operating income 135.6 119.9 250.9 331.9Interest expense, net (13.5) (11.9) (26.1) (23.7)Income before income taxes 122.1 108.0 224.8 308.2Income taxes (28.7) (26.1) (52.9) (79.5)Net income 93.4 81.9 171.9 228.7Dividends on redeemable convertible preferred shares (8.2) — (16.4) — Net income attributable to common shareholders 85.2 81.9 155.5 228.7Earnings per common share:Basic $ 1.34 $ 1.06 $ 2.36 $ 2.94Diluted $ 1.33 $ 1.06 $ 2.36 $ 2.94Weighted average common shares outstanding:Basic 63.8 77.1 65.9 77.8Diluted 70.5 77.2 66.0 77.9Dividends declared per common share $ 0.31 $ 0.26 $ 0.62 $ 0.52
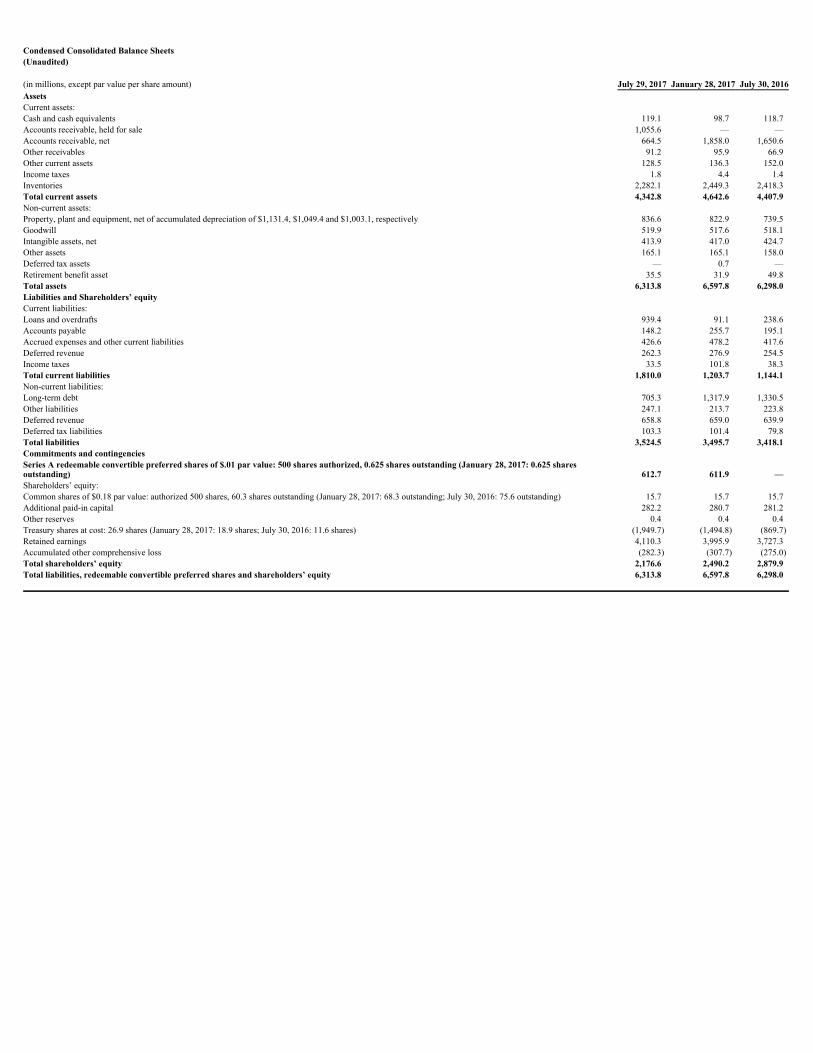
Condensed Consolidated Balance Sheets(Unaudited)
(in millions, except par value per share amount) July 29, 2017 January 28, 2017 July 30, 2016AssetsCurrent assets:Cash and cash equivalents 119.1 98.7 118.7Accounts receivable, held for sale 1,055.6 — —Accounts receivable, net 664.5 1,858.0 1,650.6Other receivables 91.2 95.9 66.9Other current assets 128.5 136.3 152.0Income taxes 1.8 4.4 1.4Inventories 2,282.1 2,449.3 2,418.3Total current assets 4,342.8 4,642.6 4,407.9Non-current assets:Property, plant and equipment, net of accumulated depreciation of $1,131.4, $1,049.4 and $1,003.1, respectively 836.6 822.9 739.5Goodwill 519.9 517.6 518.1Intangible assets, net 413.9 417.0 424.7Other assets 165.1 165.1 158.0Deferred tax assets — 0.7 —Retirement benefit asset 35.5 31.9 49.8Total assets 6,313.8 6,597.8 6,298.0Liabilities and Shareholders’ equityCurrent liabilities:Loans and overdrafts 939.4 91.1 238.6Accounts payable 148.2 255.7 195.1Accrued expenses and other current liabilities 426.6 478.2 417.6Deferred revenue 262.3 276.9 254.5Income taxes 33.5 101.8 38.3Total current liabilities 1,810.0 1,203.7 1,144.1Non-current liabilities:Long-term debt 705.3 1,317.9 1,330.5Other liabilities 247.1 213.7 223.8Deferred revenue 658.8 659.0 639.9Deferred tax liabilities 103.3 101.4 79.8Total liabilities 3,524.5 3,495.7 3,418.1Commitments and contingenciesSeries A redeemable convertible preferred shares of $.01 par value: 500 shares authorized, 0.625 shares outstanding (January 28, 2017: 0.625 sharesoutstanding) 612.7 611.9 —Shareholders’ equity:Common shares of $0.18 par value: authorized 500 shares, 60.3 shares outstanding (January 28, 2017: 68.3 outstanding; July 30, 2016: 75.6 outstanding) 15.7 15.7 15.7Additional paid-in capital 282.2 280.7 281.2Other reserves 0.4 0.4 0.4Treasury shares at cost: 26.9 shares (January 28, 2017: 18.9 shares; July 30, 2016: 11.6 shares) (1,949.7) (1,494.8) (869.7)Retained earnings 4,110.3 3,995.9 3,727.3Accumulated other comprehensive loss (282.3) (307.7) (275.0)Total shareholders’ equity 2,176.6 2,490.2 2,879.9Total liabilities, redeemable convertible preferred shares and shareholders’ equity 6,313.8 6,597.8 6,298.0
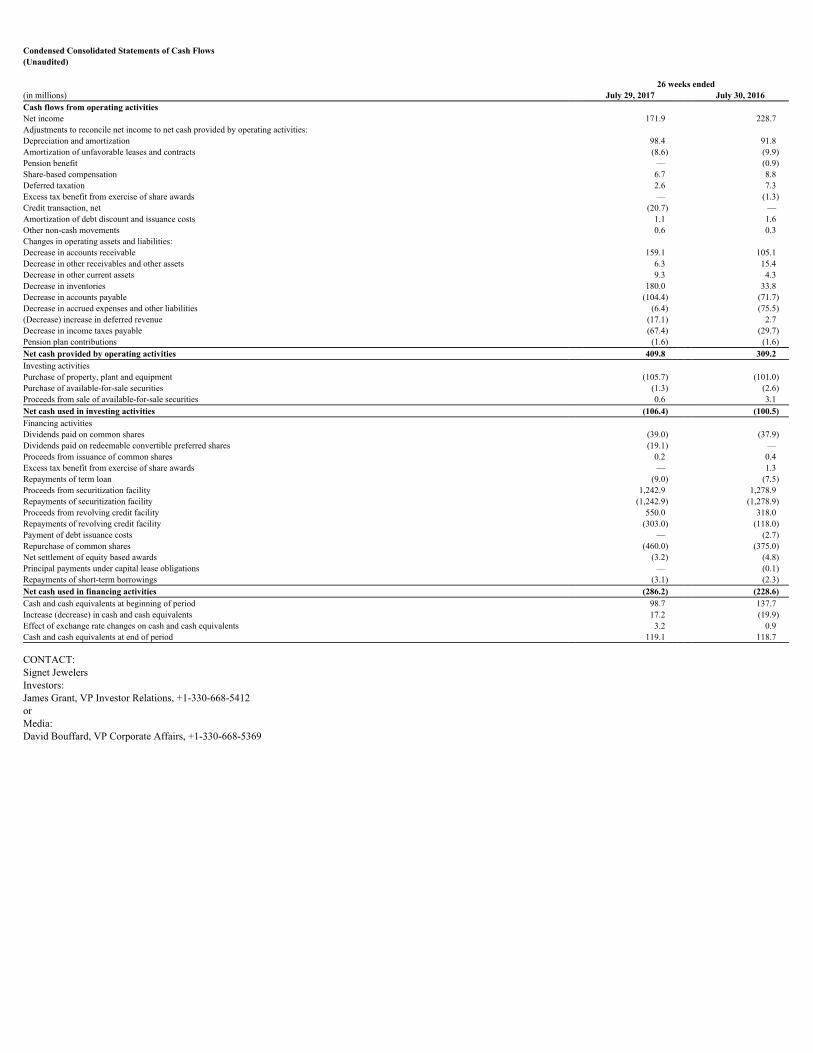
Condensed Consolidated Statements of Cash Flows(Unaudited)
26 weeks ended
(in millions) July 29, 2017 July 30, 2016Cash flows from operating activities Net income 171.9 228.7Adjustments to reconcile net income to net cash provided by operating activities:Depreciation and amortization 98.4 91.8Amortization of unfavorable leases and contracts (8.6) (9.9)Pension benefit — (0.9)Share-based compensation 6.7 8.8Deferred taxation 2.6 7.3Excess tax benefit from exercise of share awards — (1.3)Credit transaction, net (20.7) —Amortization of debt discount and issuance costs 1.1 1.6Other non-cash movements 0.6 0.3Changes in operating assets and liabilities:Decrease in accounts receivable 159.1 105.1Decrease in other receivables and other assets 6.3 15.4Decrease in other current assets 9.3 4.3Decrease in inventories 180.0 33.8Decrease in accounts payable (104.4) (71.7)Decrease in accrued expenses and other liabilities (6.4) (75.5)(Decrease) increase in deferred revenue (17.1) 2.7Decrease in income taxes payable (67.4) (29.7)Pension plan contributions (1.6) (1.6)Net cash provided by operating activities 409.8 309.2 Investing activitiesPurchase of property, plant and equipment (105.7) (101.0)Purchase of available-for-sale securities (1.3) (2.6)Proceeds from sale of available-for-sale securities 0.6 3.1 Net cash used in investing activities (106.4) (100.5)Financing activitiesDividends paid on common shares (39.0) (37.9)Dividends paid on redeemable convertible preferred shares (19.1) —Proceeds from issuance of common shares 0.2 0.4Excess tax benefit from exercise of share awards — 1.3Repayments of term loan (9.0) (7.5)Proceeds from securitization facility 1,242.9 1,278.9Repayments of securitization facility (1,242.9) (1,278.9)Proceeds from revolving credit facility 550.0 318.0Repayments of revolving credit facility (303.0) (118.0)Payment of debt issuance costs — (2.7)Repurchase of common shares (460.0) (375.0)Net settlement of equity based awards (3.2) (4.8)Principal payments under capital lease obligations — (0.1)Repayments of short-term borrowings (3.1) (2.3)Net cash used in financing activities (286.2) (228.6)Cash and cash equivalents at beginning of period 98.7 137.7Increase (decrease) in cash and cash equivalents 17.2 (19.9)Effect of exchange rate changes on cash and cash equivalents 3.2 0.9Cash and cash equivalents at end of period 119.1 118.7
CONTACT: Signet Jewelers Investors: James Grant, VP Investor Relations, +1-330-668-5412 or Media: David Bouffard, VP Corporate Affairs, +1-330-668-5369

Exhibit 99.2
Second Quarter Fiscal 2018 ResultsThursday, August 24, 2017
Forward Looking Statements & Other Disclosure Matters Forward-Looking Statements – This presentation contains statements which are forward-looking statements within the meaning of the Private Securities Litigation Reform Act of 1995. These statements, based upon management's beliefs and expectations as well as on assumptions made by and data currently available to management, include statements regarding, among other things, Signet's results of operation, financial condition, liquidity, prospects, growth, strategies and the industry in which Signet operates. The use of the words "expects," "intends," "anticipates," "estimates," "predicts," "believes," "should," "potential," "may," "forecast," "objective," "plan," or "target," and other similar expressions are intended to identify forward-looking statements. These forward-looking statements are not guarantees of future performance and are subject to a number of risks and uncertainties, including but not limited to Signet’s expectations about the benefits and costs of the R2Net transaction, including future financial and operating results, Signet’s expectations, including timing, regarding the anticipated closings of the various credit portfolio transactions, the anticipated terms and availability of financing and the timing of closing, statements about the benefits of the credit portfolio sales including future financial and operating results, Signet’s or the other parties’ ability to satisfy the requirements for consummation of the agreements relating to the credit portfolio transactions, including due to regulatory or legal impediments, the outcome of Signet’s conversion of its accounting methodology, the effect of regulatory conditions on the credit purchase agreements and credit program agreements, general economic conditions, regulatory changes following the United Kingdom’s announcement to exit from the European Union, a decline in consumer spending, the merchandising, pricing and inventory policies followed by Signet, the reputation of Signet and its brands, the level of competition in the jewelry sector, the cost and availability of diamonds, gold and other precious metals, regulations relating to customer credit, seasonality of Signet’s business, financial market risks, deterioration in customers’ financial condition, exchange rate fluctuations, changes in Signet’s credit rating, changes in consumer attitudes regarding jewelry, management of social, ethical andenvironmental risks, security breaches and other disruptions to Signet’s information technology infrastructure and databases, inadequacy in and disruptions to internal controls and systems, changes in assumptions used in making accounting estimates relating to items such as extended service plans and pensions, risks related to Signet being a Bermuda corporation, the impact of the acquisition of Zale Corporation on relationships, including with employees, suppliers, customers and competitors, and our ability to successfully integrate Zale Corporation’s operations and to realize synergies from the transactionFor a discussion of these and other risks and uncertainties which could cause actual results to differ materially from those expressed in any forward-looking statement, see the “Risk Factors” section of Signet's Fiscal 2017 Annual Report on Form 10-K filed with the SEC on March 16, 2017 and quarterly reports on Form 10-Q. Signet undertakes no obligation to update or revise any forward-looking statements to reflect subsequent events or circumstances, except as required by law.
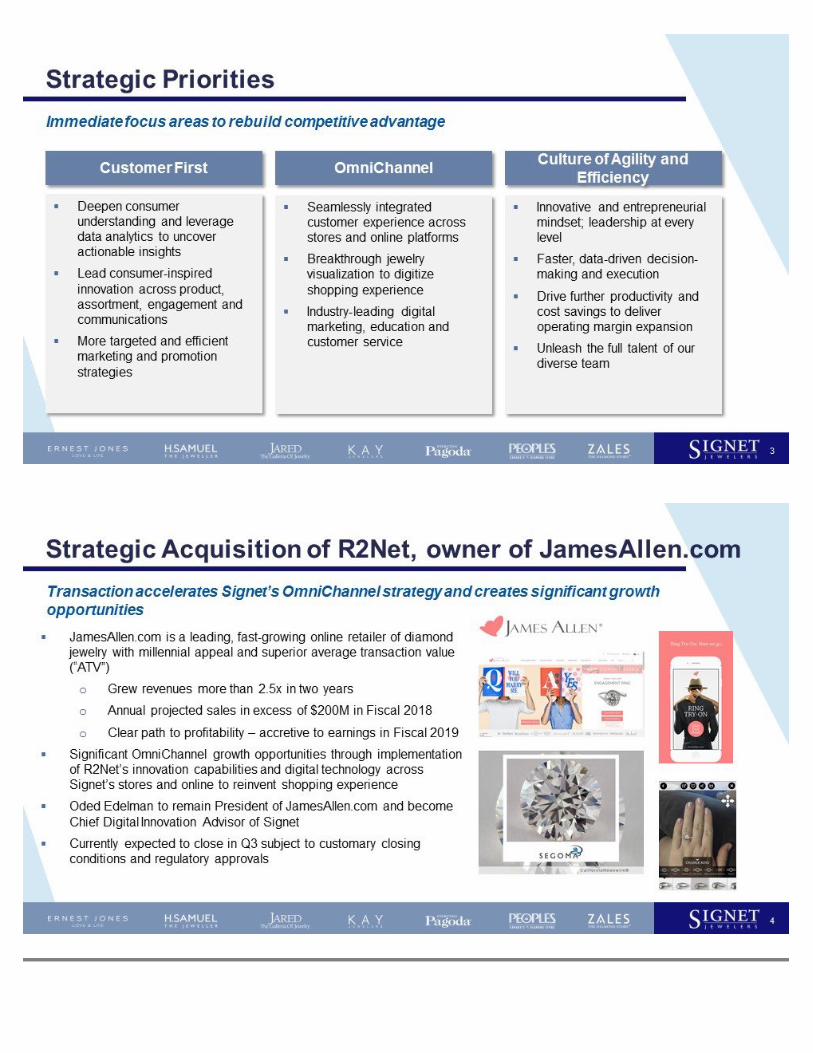
Strategic Priorities 3 Deepen consumer understanding and leverage data analytics to uncover actionable insights Lead consumer-inspired innovation across product, assortment, engagement and communicationsMore targeted and efficient marketing and promotion strategies Customer First Seamlessly integrated customer experience across stores and online platforms Breakthrough jewelry visualization to digitize shopping experienceIndustry-leading digital marketing, education and customer service OmniChannel Innovative and entrepreneurial mindset; leadership at every levelFaster, data-driven decision-making and executionDrive further productivity and cost savings to deliver operating margin expansionUnleash the full talent of our diverse team Culture of Agility and Efficiency Immediate focus areas to rebuild competitive advantage
Strategic Acquisition of R2Net, owner of JamesAllen.com JamesAllen.com is a leading, fast-growing online retailer of diamond jewelry with millennial appeal and superior average transaction value (“ATV”)Grew revenues more than 2.5x in two years Annual projected sales in excess of $200M in Fiscal 2018 Clear path to profitability – accretive to earnings in Fiscal 2019Significant OmniChannel growth opportunities through implementation of R2Net’s innovation capabilities and digital technology across Signet’s stores and online to reinvent shopping experienceOded Edelman to remain President of JamesAllen.com and become Chief Digital Innovation Advisor of SignetCurrently expected to close in Q3 subject to customary closing conditions and regulatory approvals 4 Transaction accelerates Signet’s OmniChannel strategy and creates significant growth opportunities
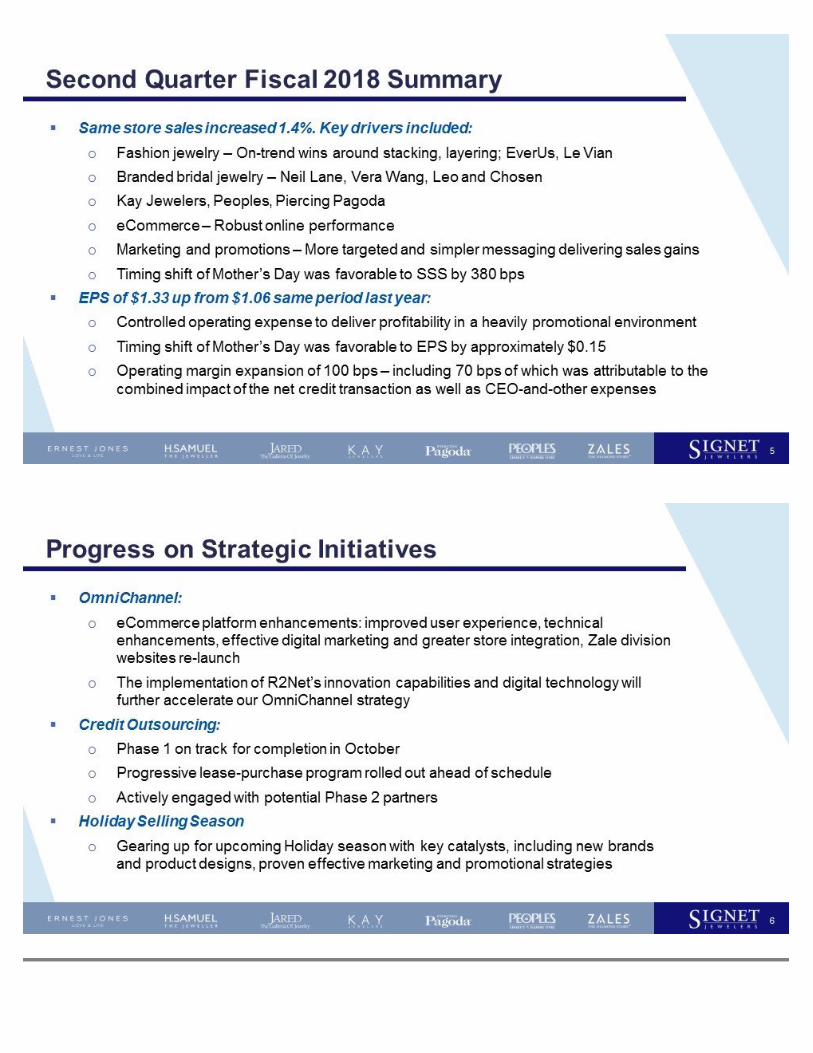
Second Quarter Fiscal 2018 Summary Same store sales increased 1.4%. Key drivers included:Fashion jewelry – On-trend wins around stacking, layering; EverUs, Le VianBranded bridal jewelry – Neil Lane, Vera Wang, Leo and ChosenKay Jewelers, Peoples, Piercing PagodaeCommerce – Robust online performanceMarketing and promotions – More targeted and simpler messaging delivering sales gainsTiming shift of Mother’s Day was favorable to SSS by 380 bpsEPS of $1.33 up from $1.06 same period last year:Controlled operating expense to deliver profitability in a heavily promotional environmentTiming shift of Mother’s Day was favorable to EPS by approximately $0.15Operating margin expansion of 100 bps – including 70 bps of which was attributable to the combined impact of the net credit transaction as well as CEO-and-other expenses 5
Progress on Strategic Initiatives OmniChannel:eCommerce platform enhancements: improved user experience, technical enhancements, effective digital marketing and greater store integration, Zale division websites re-launchThe implementation of R2Net’s innovation capabilities and digital technology will further accelerate our OmniChannel strategyCredit Outsourcing:Phase 1 on track for completion in OctoberProgressive lease-purchase program rolled out ahead of scheduleActively engaged with potential Phase 2 partnersHoliday Selling Season Gearing up for upcoming Holiday season with key catalysts, including new brands and product designs, proven effective marketing and promotional strategies 6
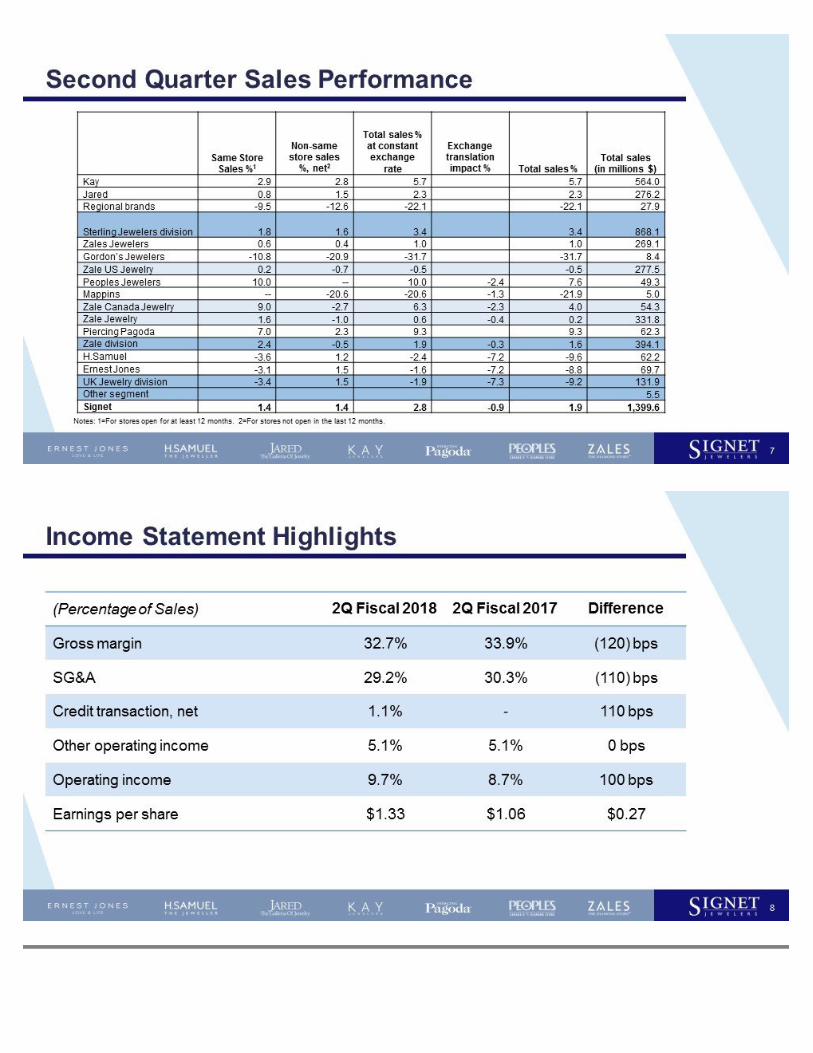
Second Quarter Sales Performance 7 Notes: 1=For stores open for at least 12 months. 2=For stores not open in the last 12 months. Same Store Sales %1 Non-same store sales %, net2 Total sales % at constant exchange rate Exchange translation impact % Total sales % Total sales(in millions $) Kay 2.9 2.8 5.7 5.7 564.0 Jared 0.8 1.5 2.3 2.3 276.2 Regional brands -9.5 -12.6 -22.1 -22.1 27.9 Sterling Jewelers division 1.8 1.6 3.4 3.4 868.1 Zales Jewelers 0.6 0.4 1.0 1.0 269.1 Gordon’s Jewelers -10.8 -20.9 -31.7 -31.7 8.4 Zale US Jewelry 0.2 -0.7 -0.5 -0.5 277.5 Peoples Jewelers 10.0 -- 10.0 -2.4 7.6 49.3 Mappins -- -20.6 -20.6 -1.3 -21.9 5.0 Zale Canada Jewelry 9.0 -2.7 6.3 -2.3 4.0 54.3 Zale Jewelry 1.6 -1.0 0.6 -0.4 0.2 331.8 Piercing Pagoda 7.0 2.3 9.3 9.3 62.3 Zale division 2.4 -0.5 1.9 -0.3 1.6 394.1 H.Samuel -3.6 1.2 -2.4 -7.2 -9.6 62.2 Ernest Jones -3.1 1.5 -1.6 -7.2 -8.8 69.7 UK Jewelry division -3.4 1.5 -1.9 -7.3 -9.2 131.9 Other segment 5.5 Signet 1.4 1.4 2.8 -0.9 1.9 1,399.6
Income Statement Highlights (Percentage of Sales) 2Q Fiscal 2018 2Q Fiscal 2017 Difference Gross margin 32.7% 33.9% (120) bps SG&A 29.2% 30.3% (110) bps Credit transaction, net 1.1% - 110 bps Other operating income 5.1% 5.1% 0 bps Operating income 9.7% 8.7% 100 bps Earnings per share $1.33 $1.06 $0.27 8
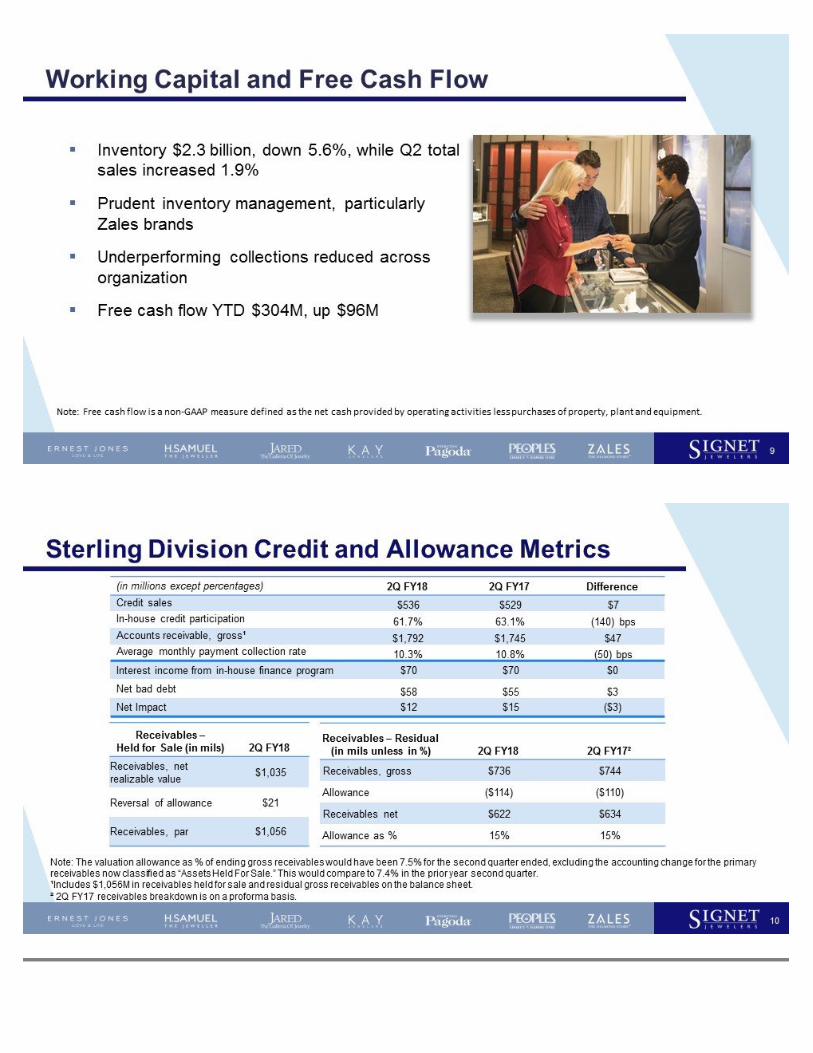
Working Capital and Free Cash Flow Inventory $2.3 billion, down 5.6%, while Q2 total sales increased 1.9%Prudent inventory management, particularly Zales brandsUnderperforming collections reduced across organizationFree cash flow YTD $304M, up $96M 9 Note: Free cash flow is a non-GAAP measure defined as the net cash provided by operating activities less purchases of property, plant and equipment.
Sterling Division Credit and Allowance Metrics (in millions except percentages) 2Q FY18 2Q FY17 Difference Credit sales $536 $529 $7 In-house credit participation 61.7% 63.1% (140) bps Accounts receivable, gross¹ $1,792 $1,745 $47 Average monthly payment collection rate 10.3% 10.8% (50) bps Interest income from in-house finance program $70 $70 $0 Net bad debt $58 $55 $3 Net Impact $12 $15 ($3) Receivables – Residual (in mils unless in %) 2Q FY18 2Q FY17² Receivables, gross $736 $744 Allowance ($114) ($110) Receivables net $622 $634 Allowance as % 15% 15% 10 Note: The valuation allowance as % of ending gross receivables would have been 7.5% for the second quarter ended, excluding the accounting change for the primary receivables now classified as “Assets Held For Sale.” This would compare to 7.4% in the prior year second quarter.¹Includes $1,056M in receivables held for sale and residual gross receivables on the balance sheet. ² 2Q FY17 receivables breakdown is on a proforma basis. Receivables –Held for Sale (in mils) 2Q FY18 Receivables, net realizable value $1,035 Reversal of allowance $21 Receivables, par $1,056
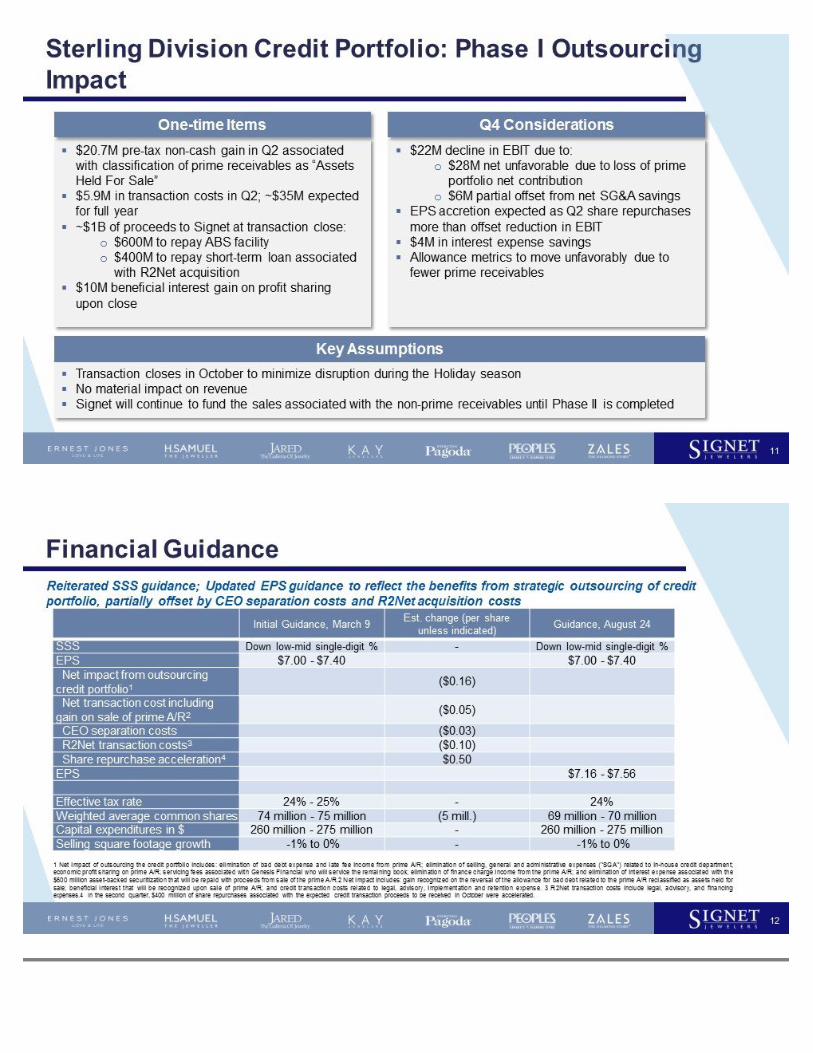
Sterling Division Credit Portfolio: Phase I Outsourcing Impact 11 $20.7M pre-tax non-cash gain in Q2 associated with classification of prime receivables as “Assets Held For Sale”$5.9M in transaction costs in Q2; ~$35M expected for full year~$1B of proceeds to Signet at transaction close:$600M to repay ABS facility$400M to repay short-term loan associated with R2Net acquisition$10M beneficial interest gain on profit sharing upon close $22M decline in EBIT due to:$28M net unfavorable due to loss of prime portfolio net contribution$6M partial offset from net SG&A savingsEPS accretion expected as Q2 share repurchases more than offset reduction in EBIT$4M in interest expense savingsAllowance metrics to move unfavorably due to fewer prime receivables One-time Items Q4 Considerations Key Assumptions Transaction closes in October to minimize disruption during the Holiday seasonNo material impact on revenue Signet will continue to fund the sales associated with the non-prime receivables until Phase II is completed
Financial Guidance 12 Reiterated SSS guidance; Updated EPS guidance to reflect the benefits from strategic outsourcing of credit portfolio, partially offset by CEO separation costs and R2Net acquisition costs 1 Net impact of outsourcing the credit portfolio includes: elimination of bad debt expense and late fee income from prime A/R; elimination of selling, general and administrative expenses ("SGA") related to in-house credit department; economic profit sharing on prime A/R; servicing fees associated with Genesis Financial who will service the remaining book; elimination of finance charge income from the prime A/R; and elimination of interest expense associated with the $600 million asset-backed securitization that will be repaid with proceeds from sale of the prime A/R.2 Net impact includes: gain recognized on the reversal of the allowance for bad debt related to the prime A/R reclassified as assets held for sale; beneficial interest that will be recognized upon sale of prime A/R; and credit transaction costs related to legal, advisory, implementation and retention expense. 3 R2Net transaction costs include legal, advisory, and financing expenses.4 In the second quarter, $400 million of share repurchases associated with the expected credit transaction proceeds to be received in October were accelerated. Initial Guidance, March 9 Est. change (per share unless indicated) Guidance, August 24 SSS Down low-mid single-digit % - Down low-mid single-digit % EPS $7.00 - $7.40 $7.00 - $7.40 Net impact from outsourcing credit portfolio1 ($0.16) Net transaction cost including gain on sale of prime A/R2 ($0.05) CEO separation costs ($0.03) R2Net transaction costs3 ($0.10) Share repurchase acceleration4 $0.50 EPS $7.16 - $7.56 Effective tax rate 24% - 25% - 24% Weighted average common shares 74 million - 75 million (5 mill.) 69 million - 70 million Capital expenditures in $ 260 million - 275 million - 260 million - 275 million Selling square footage growth -1% to 0% - -1% to 0%

Signet Jewelers Ltd.