Embed Size (px)
Citation preview

Italian Stock Market Opportunities Conference 2014
Paris ‐May 26th, 2014

Our Group: business sectors
Electronics & laser technologiesMachinery Division
Laser and sheet metal fabrication machinery: 2D and 3D laser cutting welding and
Industrial electronics (power and control electronics,
i l l )3D laser cutting, welding and drilling, punching, combined punching/laser or
numerical controls).High power CO2 and Nd:YAGlaser sources for industrial
punching/shearing, bending, automation and FMS.
laser sources for industrial applications.
Turnover 2103Euro 301 million
Turnover 2013Euro 48 million
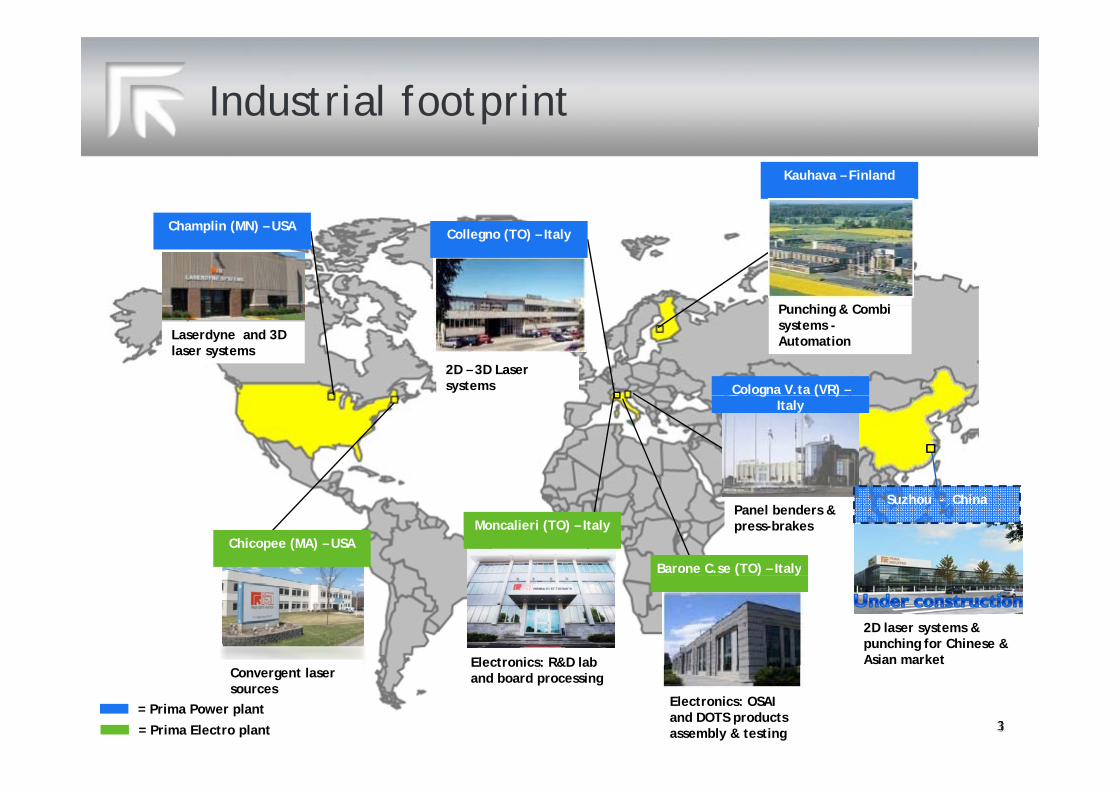
Industrial footprint
Kauhava – Finland
P hi & C bi
Champlin (MN) – USACollegno (TO) – Italy
2D – 3D Laser systems
Punching & Combisystems -AutomationLaserdyne and 3D
laser systems
Cologna V.ta (VR) –g ( )Italy
Panel benders & press-brakes
Barone C.se (TO) – Italy
Moncalieri (TO) – ItalyChicopee (MA) – USA
Suzhou - China
Electronics: R&D lab
( ) y
2D laser systems & punching for Chinese & Asian marketElectronics: R&D lab
and board processingConvergent laser sources
Electronics: OSAI and DOTS products assembly & testing
= Prima Power plant
= Prima Electro plant
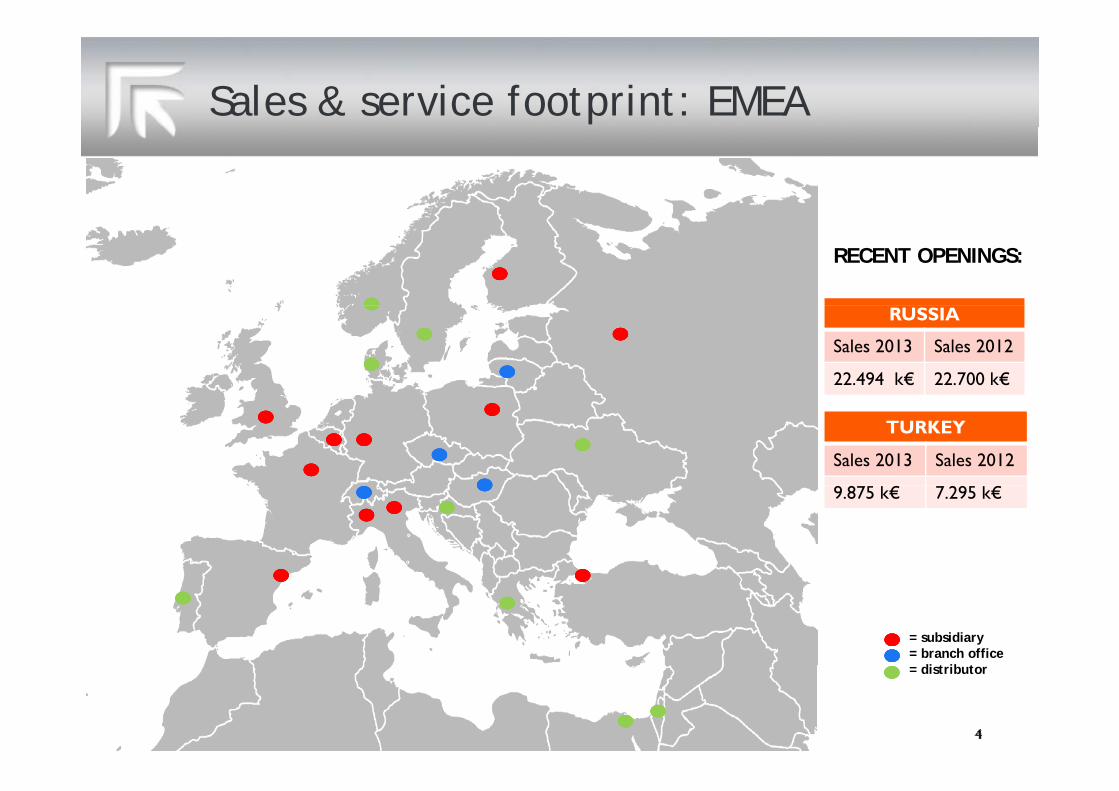
Sales & service footprint: EMEA
RECENT OPENINGS:
RUSSIA
Sales 2013 Sales 2012
22.494 k€ 22.700 k€
TURKEY
Sales 2013 Sales 2012
9.875 k€ 7.295 k€
= subsidiary= branch office di t ib t= distributor
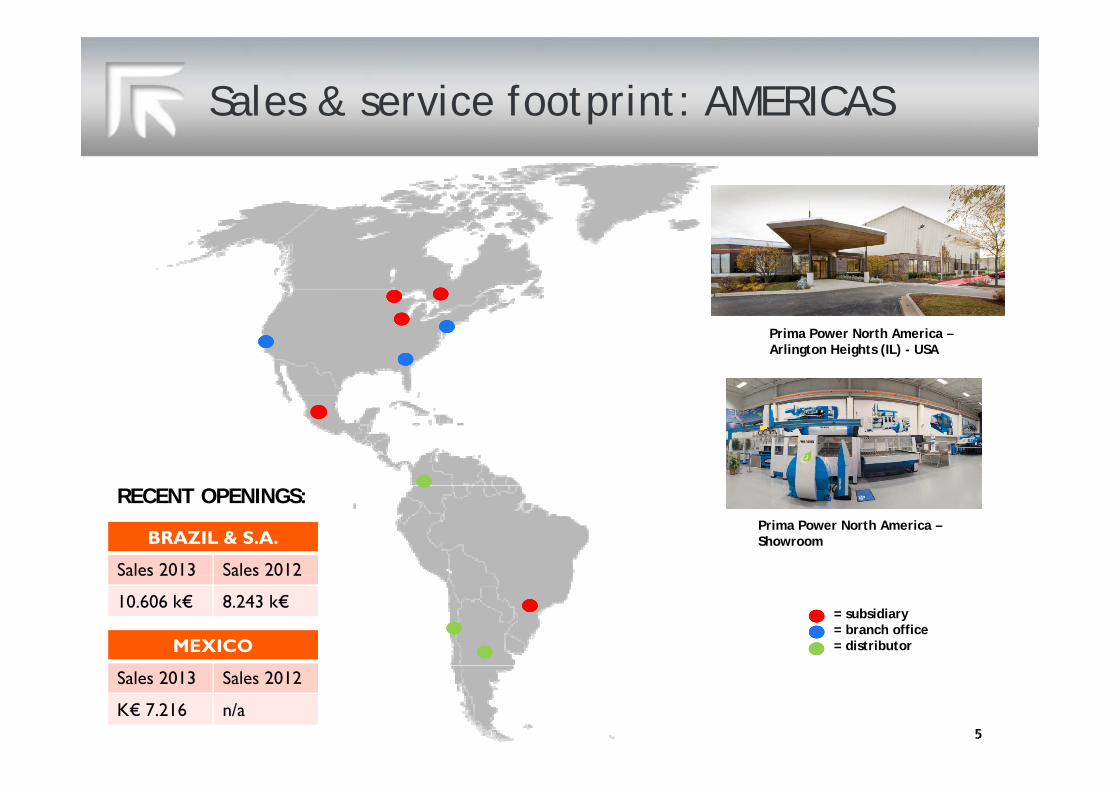
Sales & service footprint: AMERICAS
Prima Power North America –Arlington Heights (IL) - USA
Prima Power North America –Showroom
RECENT OPENINGS:
BRAZIL & S.A.
Sales 2013 Sales 2012
= subsidiary= branch office= distributor
Sales 2013 Sales 2012
10.606 k€ 8.243 k€
MEXICO
Sales 2013 Sales 2012
K€ 7.216 n/a
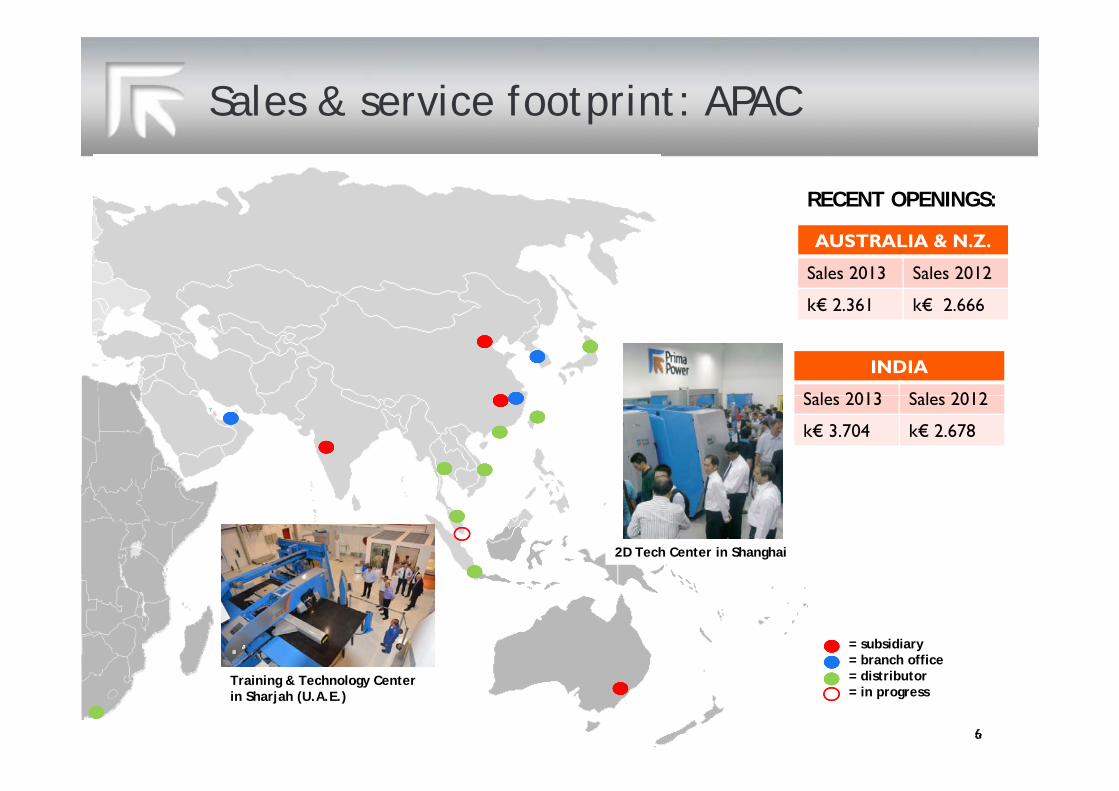
Sales & service footprint: APAC
RECENT OPENINGS:
AUSTRALIA & N.Z.
Sales 2013 Sales 2012
k€ 2 361 k€ 2 666k€ 2.361 k€ 2.666
INDIA
S l 2013 S l 2012Sales 2013 Sales 2012
k€ 3.704 k€ 2.678
2D Tech Center in Shanghai
= subsidiary= branch office= distributor= in progress
Training & Technology Centerin Sharjah (U.A.E.)
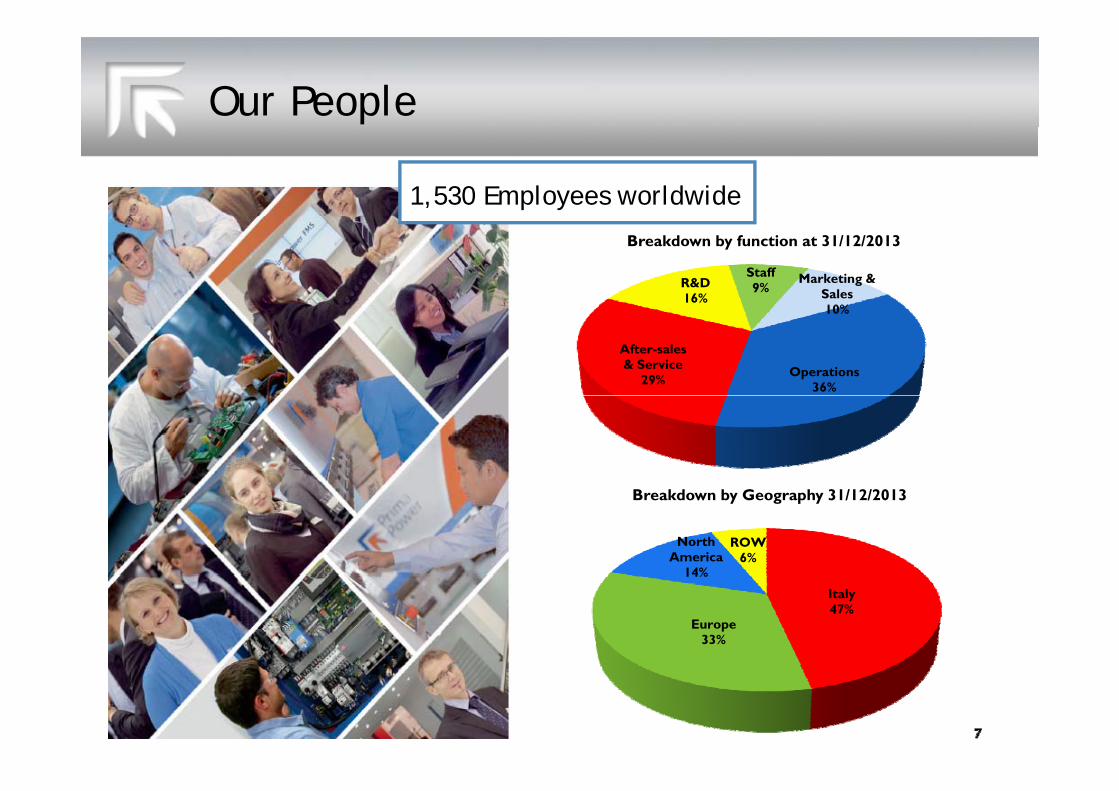
Our People
1,530 Employees worldwide
R&D16%
Staff9%
Marketing & Sales10%
Breakdown by function at 31/12/2013
Operations36%
After-sales & Service
29%
10%
North America
14%
ROW6%
Breakdown by Geography 31/12/2013
Italy47%
Europe33%
14%
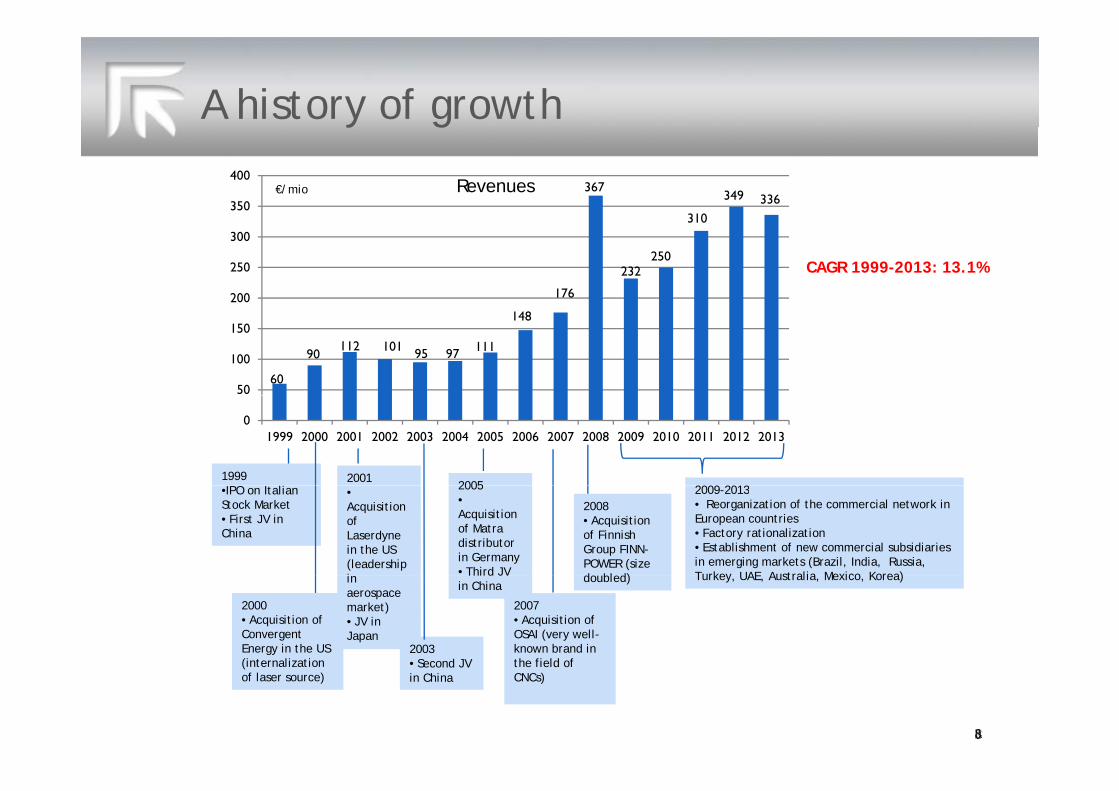
A history of growth
367
310
349 336350
400Revenues€/mio
y g
176
232250
310
200
250
300
CAGR 1999-2013: 13.1%
60
90112 101 95 97 111
148
50
100
150
01999 2000 2001 2002 2003 2004 2005 2006 2007 2008 2009 2010 2011 2012 2013
1999 20012005 2009 2013•IPO on Italian
Stock Market• First JV in China
•Acquisition of Laserdynein the US (leadership i
2005•Acquisition of Matradistributor in Germany • Third JV
2008• Acquisition of Finnish Group FINN-POWER (size d bl d)
2009-2013• Reorganization of the commercial network in European countries• Factory rationalization• Establishment of new commercial subsidiaries in emerging markets (Brazil, India, Russia, Turkey UAE Australia Mexico Korea)
2000• Acquisition of Convergent Energy in the US (internalization
in aerospace market)• JV in Japan
2003• Second JV
Third JV in China
2007• Acquisition of OSAI (very well-known brand in the field of
doubled) Turkey, UAE, Australia, Mexico, Korea)
(internalization of laser source)
Second JV in China
the field of CNCs)
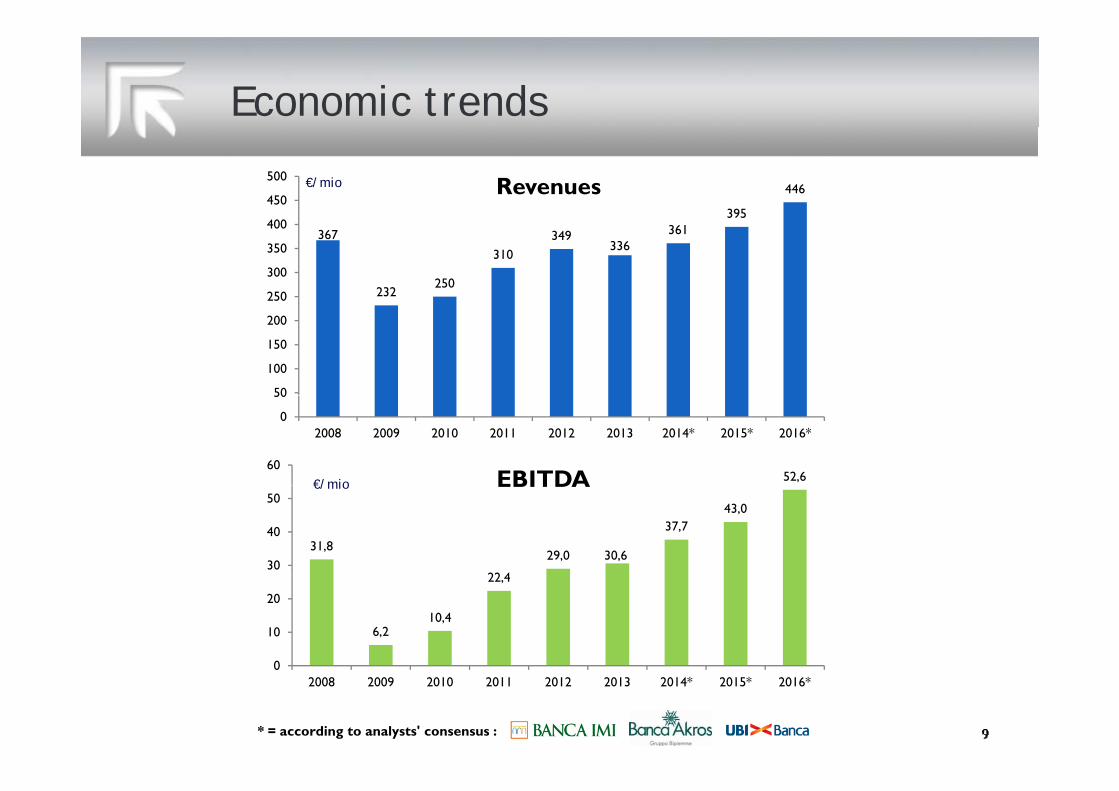
Economic trends
395
446450
500 Revenues€/mio
367
232250
310349
336361
395
250
300
350
400
50
100
150
200
0
50
2008 2009 2010 2011 2012 2013 2014* 2015* 2016*
€/mio 52,660
EBITDA€/mio
31,8
22 4
29,0 30,6
37,743,0
30
40
50EBITDA
6,210,4
22,4
0
10
20
* = according to analysts' consensus :
02008 2009 2010 2011 2012 2013 2014* 2015* 2016*
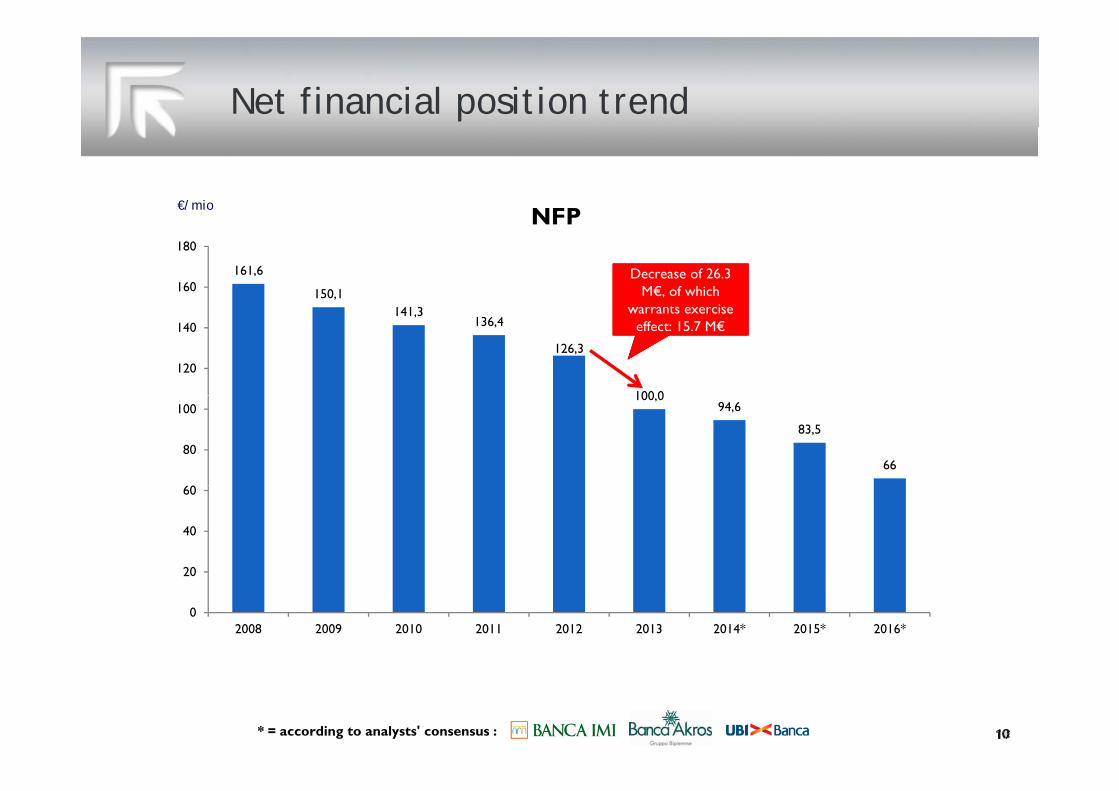
Net financial position trend
NFP€/mio
161,6
150,1160
180
NFP
Decrease of 26.3 M€, of which
t i
Decrease of 26.3 M€, of which
t i 141,3136,4
126,3
100 0
120
140warrants exercise
effect: 15.7 M€warrants exercise
effect: 15.7 M€
100,094,6
83,5
6680
100
20
40
60
0
20
2008 2009 2010 2011 2012 2013 2014* 2015* 2016*
* = according to analysts' consensus :

Geographic trends
R b kdRevenues breakdown
2008 31/12/2013
ItalyItaly
2008 31/12/2013
Italy13% Europe
31%
North AmericaAsia & R.o.W.
24% Europe43%
North America
Asia & R.o.W.16%
22%34%North America17%
Extra-Europe: 33% Extra-Europe: 56%
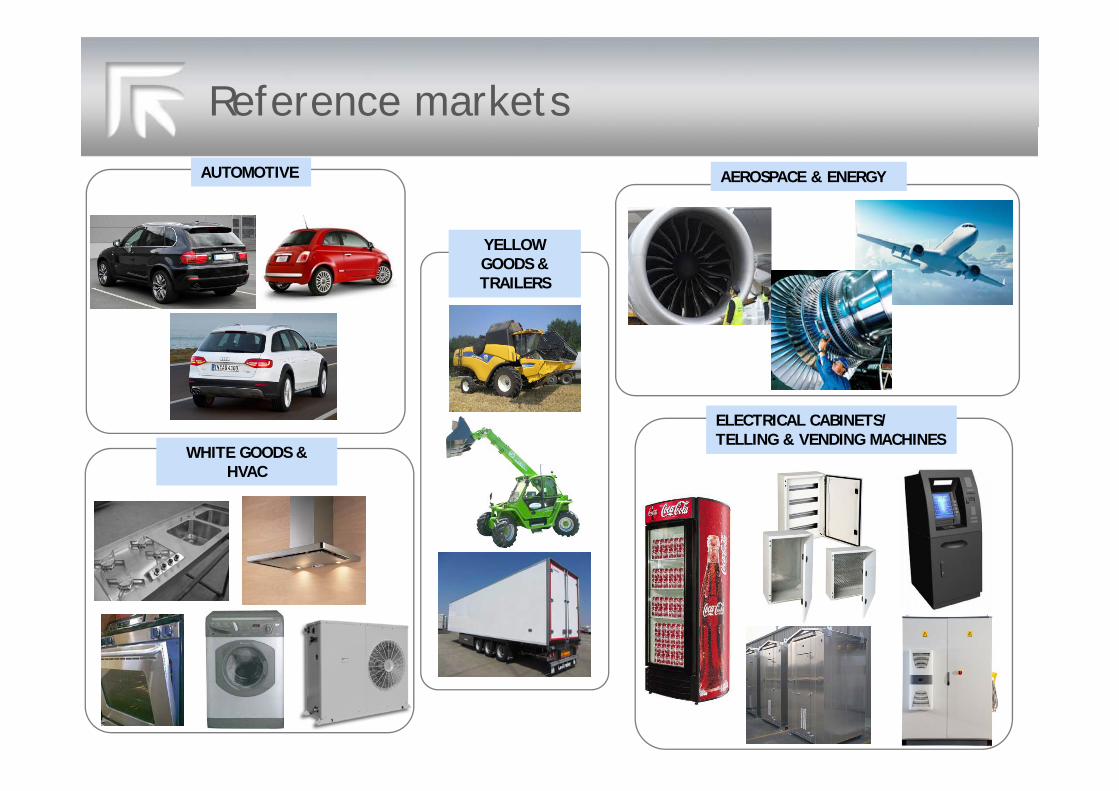
Reference marketsAUTOMOTIVE AEROSPACE & ENERGY
YELLOW GOODS & TRAILERS
WHITE GOODS & HVAC
ELECTRICAL CABINETS/TELLING & VENDING MACHINES
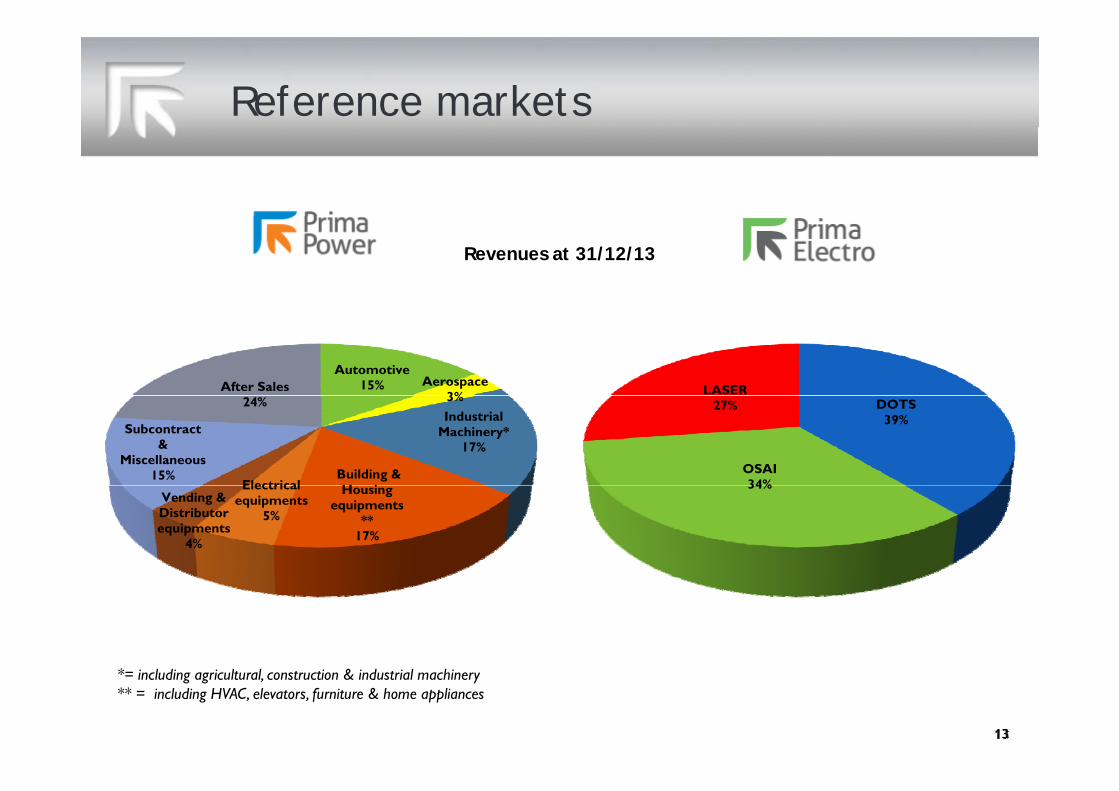
Reference markets
Revenues at 31/12/13
Automotive15% Aerospace
3%After Sales LASER3%
Industrial Machinery*
17%
Building & H i Electrical
Subcontract &
Miscellaneous15%
24% DOTS39%
OSAI34%
27%
Housing equipments
**17%
Electrical equipments
5%Vending & Distributor equipments
4%
34%
*= including agricultural, construction & industrial machinery ** = including HVAC, elevators, furniture & home appliances
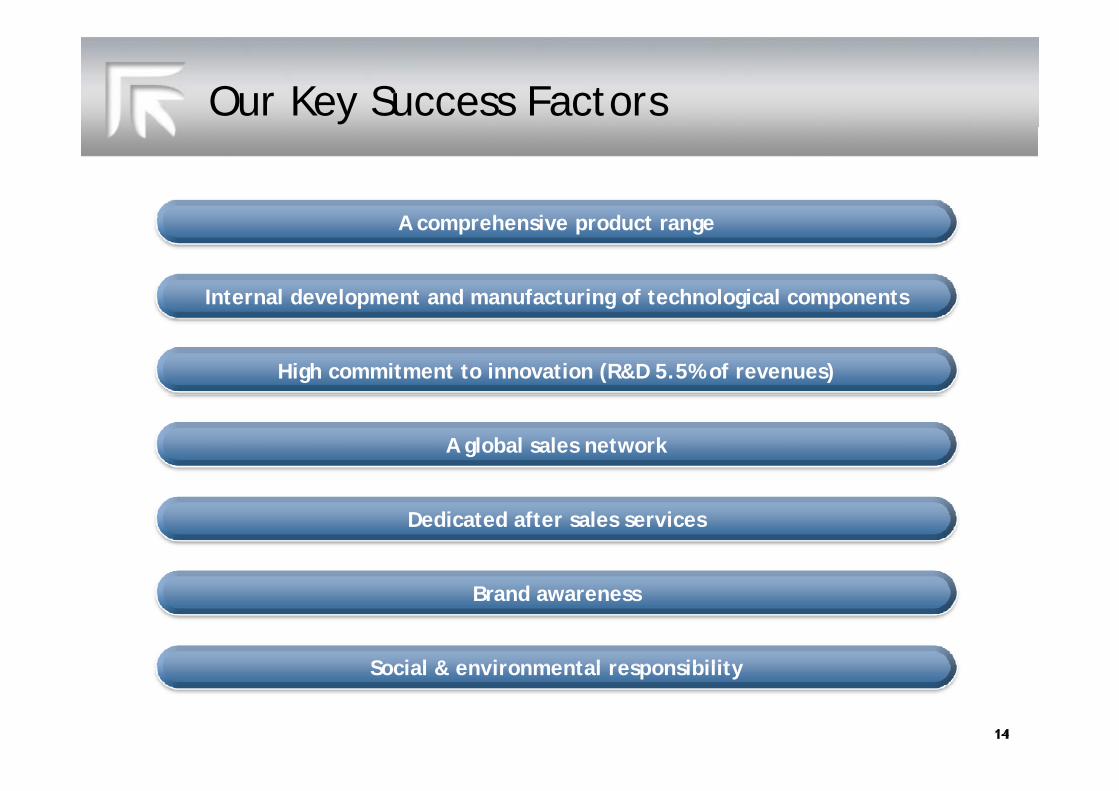
Our Key Success Factors
A h i d t A comprehensive product range
Internal development and manufacturing of technological componentsp g g p
High commitment to innovation (R&D 5.5% of revenues)
A global sales network
Dedicated after sales services
Brand awareness
Social & environmental responsibilitySocial & environmental responsibility
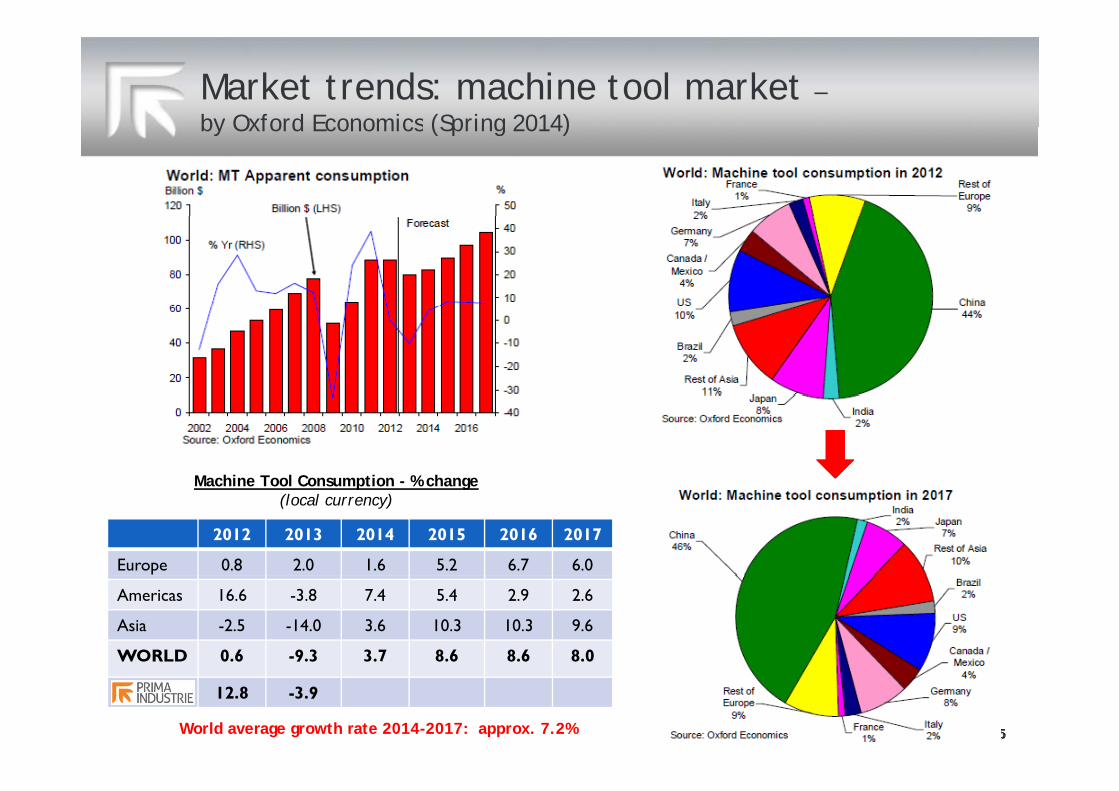
Market trends: machine tool market –by Oxford Economics (Spring 2014)by Oxford Economics (Spring 2014)
Machine Tool Consumption - % changeMachine Tool Consumption % change(local currency)
2012 2013 2014 2015 2016 2017
Europe 0.8 2.0 1.6 5.2 6.7 6.0
Americas 16.6 -3.8 7.4 5.4 2.9 2.6
Asia -2.5 -14.0 3.6 10.3 10.3 9.6
WORLD 0.6 -9.3 3.7 8.6 8.6 8.0
12.8 -3.9
World average growth rate 2014-2017: approx. 7.2%
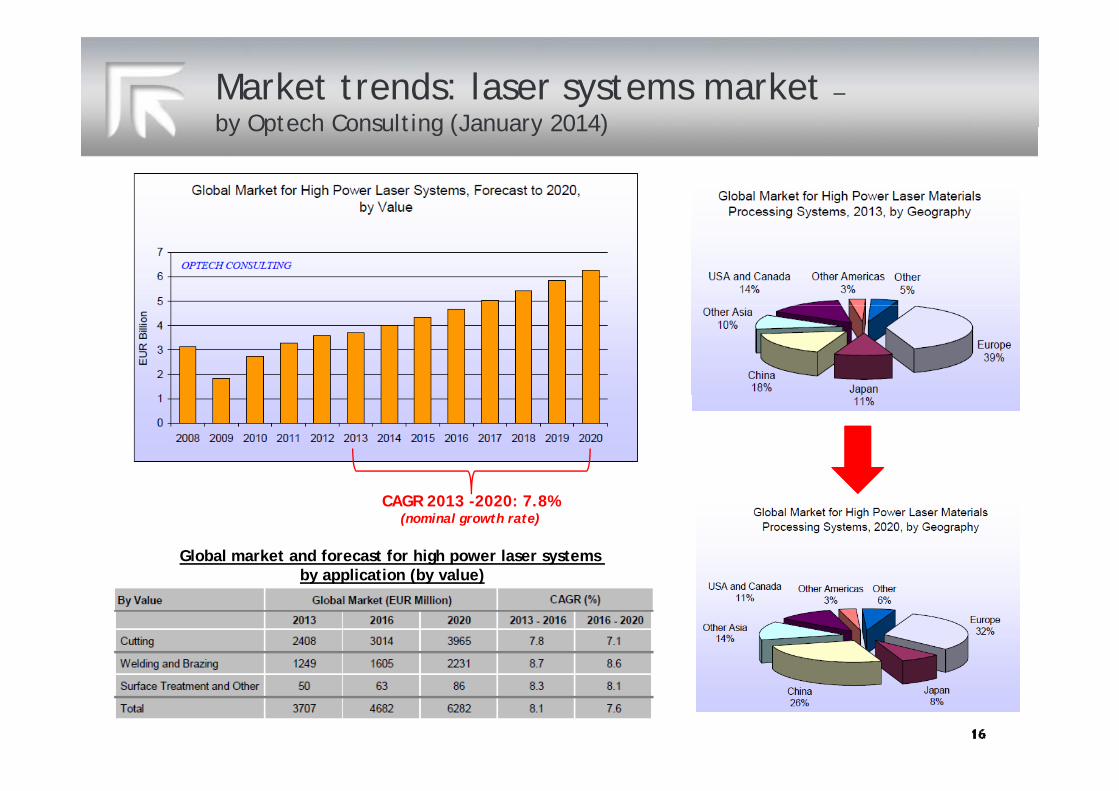
Market trends: laser systems market –by Optech Consulting (January 2014)by Optech Consulting (January 2014)
Global market and forecast for high power laser systems by application (by value)
CAGR 2013 -2020: 7.8%(nominal growth rate)
by application (by value)
Market trends: Prima outlook - assumptions
INERTIAL GROWTH LEAD BY THE MARKET:
• Assumption of the external researches’ expectations for the coming years, which
indicate a growth by:
7 2% f hi t l ld k t (2014 2017)• 7.2% for machine tool world market (2014-2017)
• 7.8% cagr (2013-2020) for high power laser systems
NEW GROWTH ENGINES:
• Additional revenues & profitability coming from the new manufacturing unit in China
(Prima Power Suzhou)
• Exploitation of the recently established subsidiaries in high growth markets (Brazil,
Turkey Russia Mexico India Australia)Turkey, Russia, Mexico, India, Australia)
• Establishment of a new commercial subsidiary in South East Asia
• Significant pipeline of new products starting from 2014g p p p g
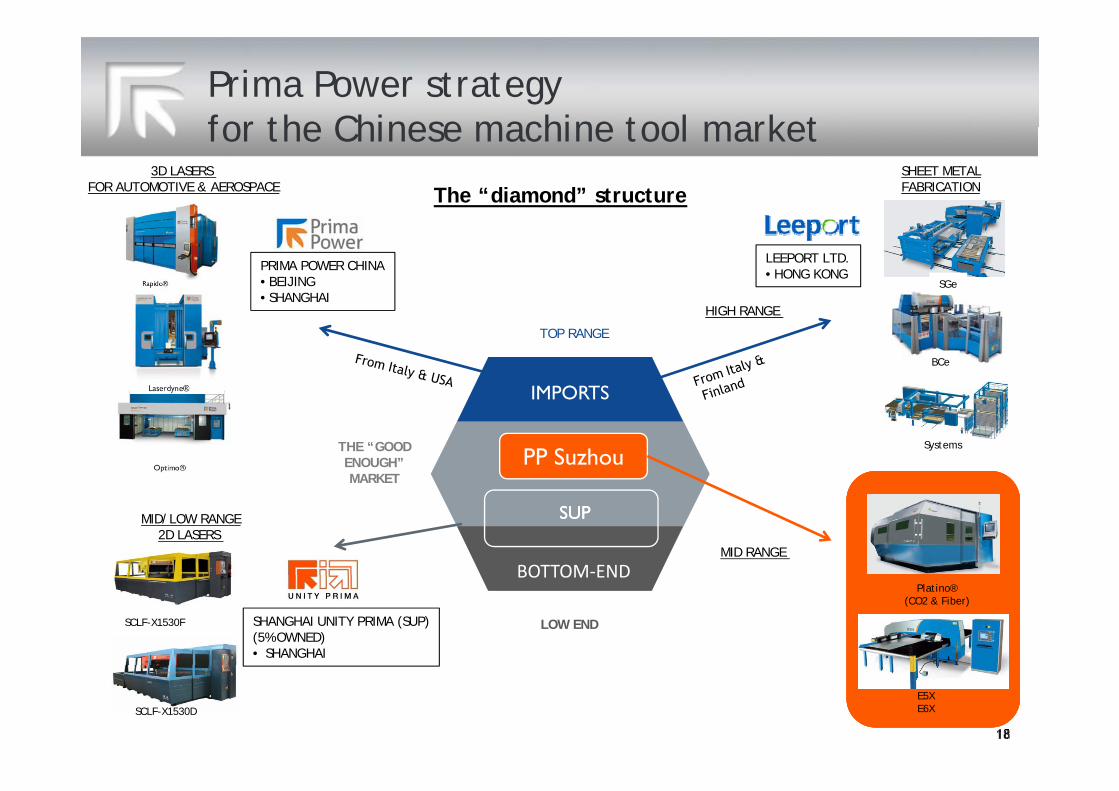
Prima Power strategy for the Chinese machine tool marketfor the Chinese machine tool market
The “diamond” structure3D LASERS
FOR AUTOMOTIVE & AEROSPACESHEET METAL FABRICATION
PRIMA POWER CHINA• BEIJING• SHANGHAI
LEEPORT LTD.• HONG KONG
HIGH RANGE
SGe
IMPORTS
HIGH RANGE
BCe
TOP RANGE
PUCPP Suzhou
IMPORTS
THE “GOOD ENOUGH”MARKET
Systems
SUPSUP
BOTTOM‐ENDMID RANGE
MID/LOW RANGE2D LASERS
SHANGHAI UNITY PRIMA (SUP)(5% OWNED)• SHANGHAI
Platino®(CO2 & Fiber)
SCLF-X1530F
BOTTOM END
LOW END
E5XE6XSCLF-X1530D
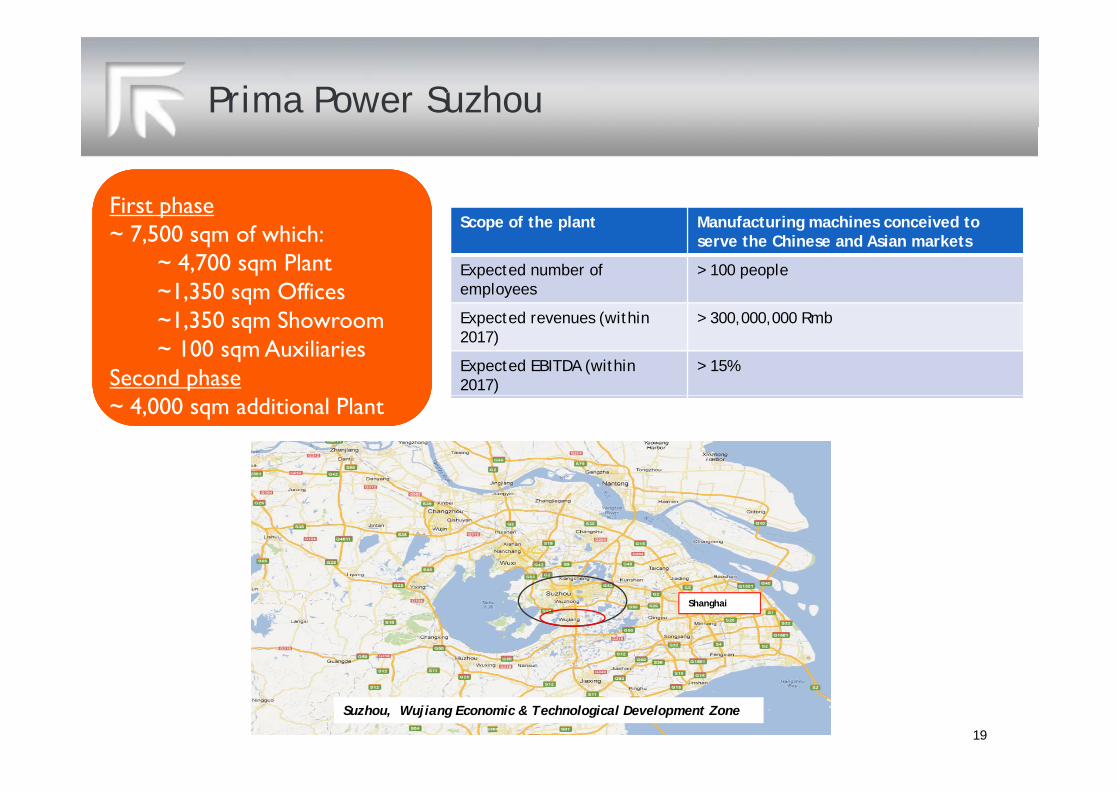
Prima Power Suzhou
First phaseS f h l M f i hi i d
p~ 7,500 sqm of which:
~ 4,700 sqm Plant~1,350 sqm Offices
Scope of the plant Manufacturing machines conceived to serve the Chinese and Asian markets
Expected number of employees
> 100 people
~1,350 sqm Showroom~ 100 sqm Auxiliaries
Second phase
Expected revenues (within 2017)
> 300,000,000 Rmb
Expected EBITDA (within 2017)
> 15%
~ 4,000 sqm additional Plant
Shanghai
19
Suzhou, Wujiang Economic & Technological Development Zone
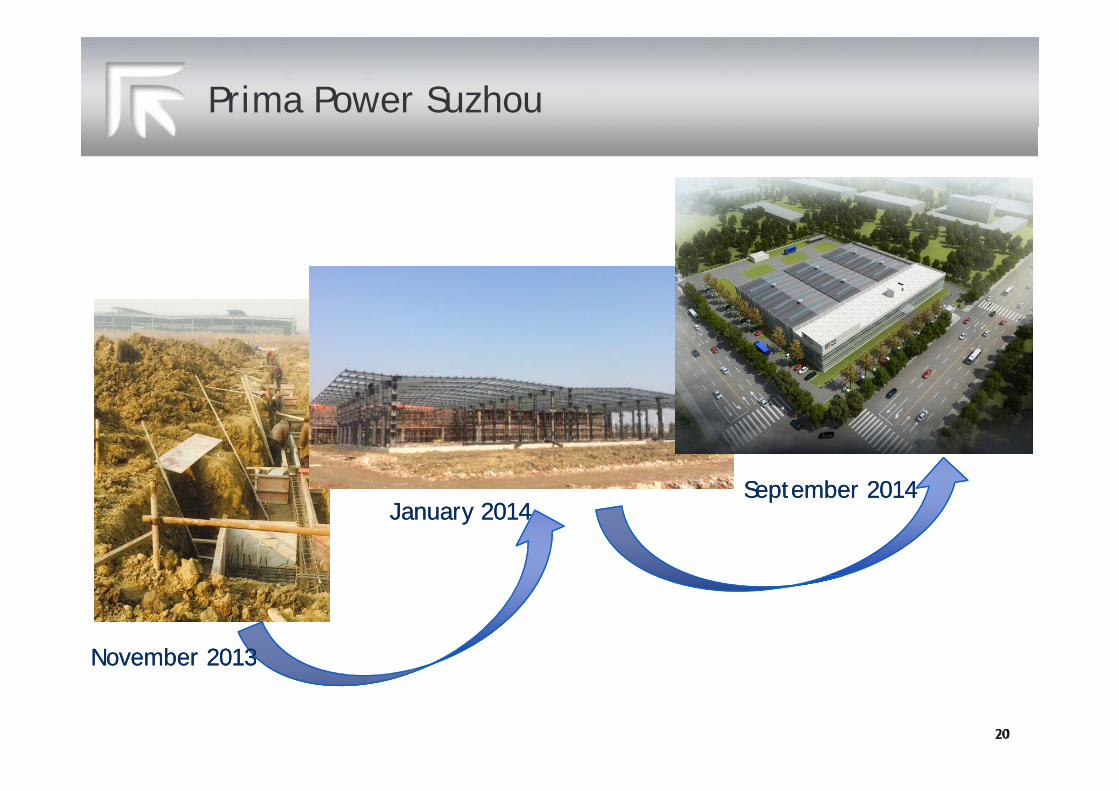
Prima Power Suzhou
September 2014September 2014September 2014September 2014JanuaryJanuary 20142014
November 2013November 2013November 2013November 2013
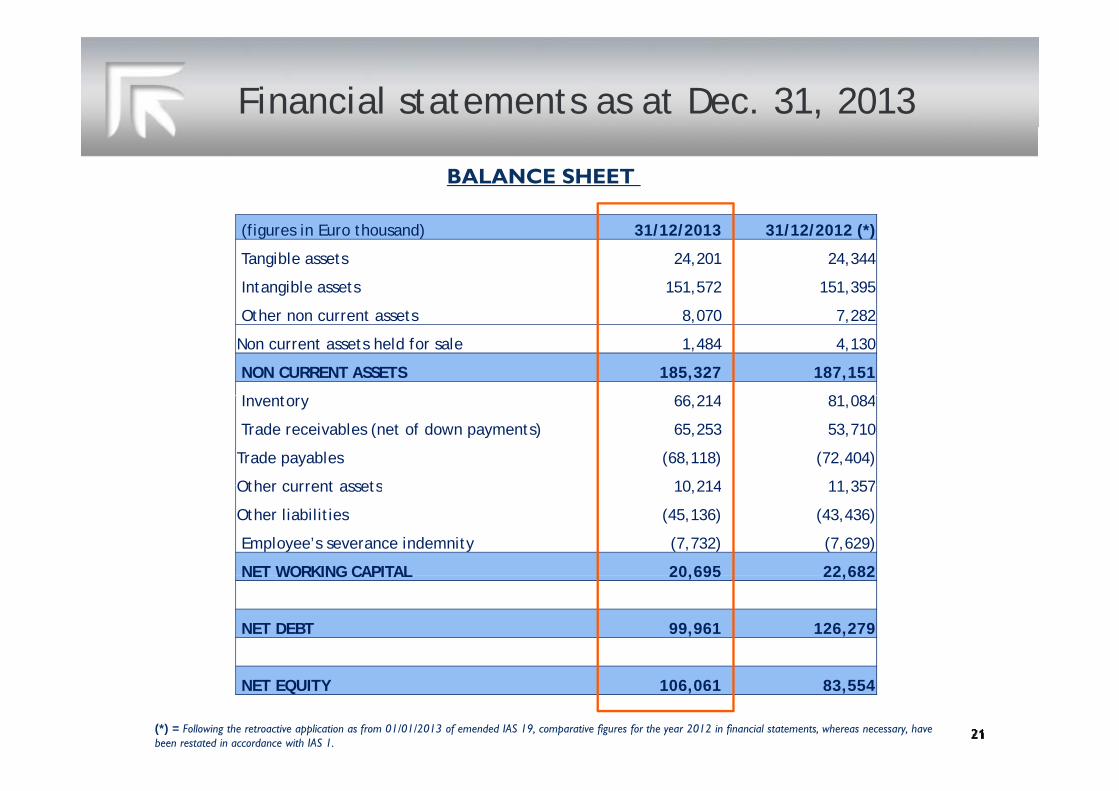
Financial statements as at Dec. 31, 2013
BALANCE SHEET
(figures in Euro thousand) 31/12/2013 31/12/2012 (*)
Tangible assets 24,201 24,344
Intangible assets 151,572 151,395
Other non current assets 8,070 7,282
Non current assets held for sale 1,484 4,130
NON CURRENT ASSETS 185,327 187,151
I t 66 214 81 084Inventory 66,214 81,084
Trade receivables (net of down payments) 65,253 53,710
Trade payables (68,118) (72,404)
Other current assets 10 214 11 357Other current assets 10,214 11,357
Other liabilities (45,136) (43,436)
Employee’s severance indemnity (7,732) (7,629)
NET WORKING CAPITAL 20,695 22,682NET WORKING CAPITAL 20,695 22,682
NET DEBT 99,961 126,279
NET EQUITY 106,061 83,554
(*) = Following the retroactive application as from 01/01/2013 of emended IAS 19, comparative figures for the year 2012 in financial statements, whereas necessary, have been restated in accordance with IAS 1.
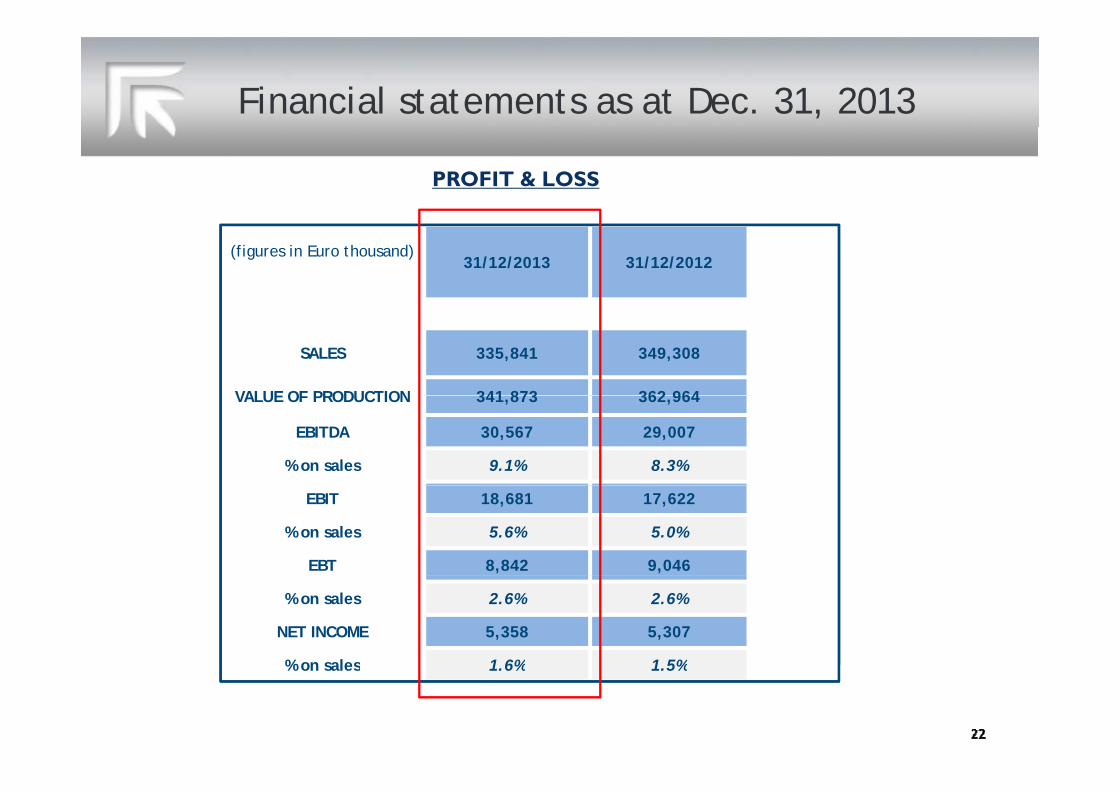
Financial statements as at Dec. 31, 2013
PROFIT & LOSS
(figures in Euro thousand)31/12/2013 31/12/2012
SALES 335,841 349,308
VALUE OF PRODUCTION 341 873 362 964VALUE OF PRODUCTION 341,873 362,964
EBITDA 30,567 29,007
% on sales 9.1% 8.3%
EBIT 18,681 17,622
% on sales 5.6% 5.0%
EBT 8,842 9,046
% on sales 2.6% 2.6%
NET INCOME 5,358 5,307
% on sales 1 6% 1 5%% on sales 1.6% 1.5%
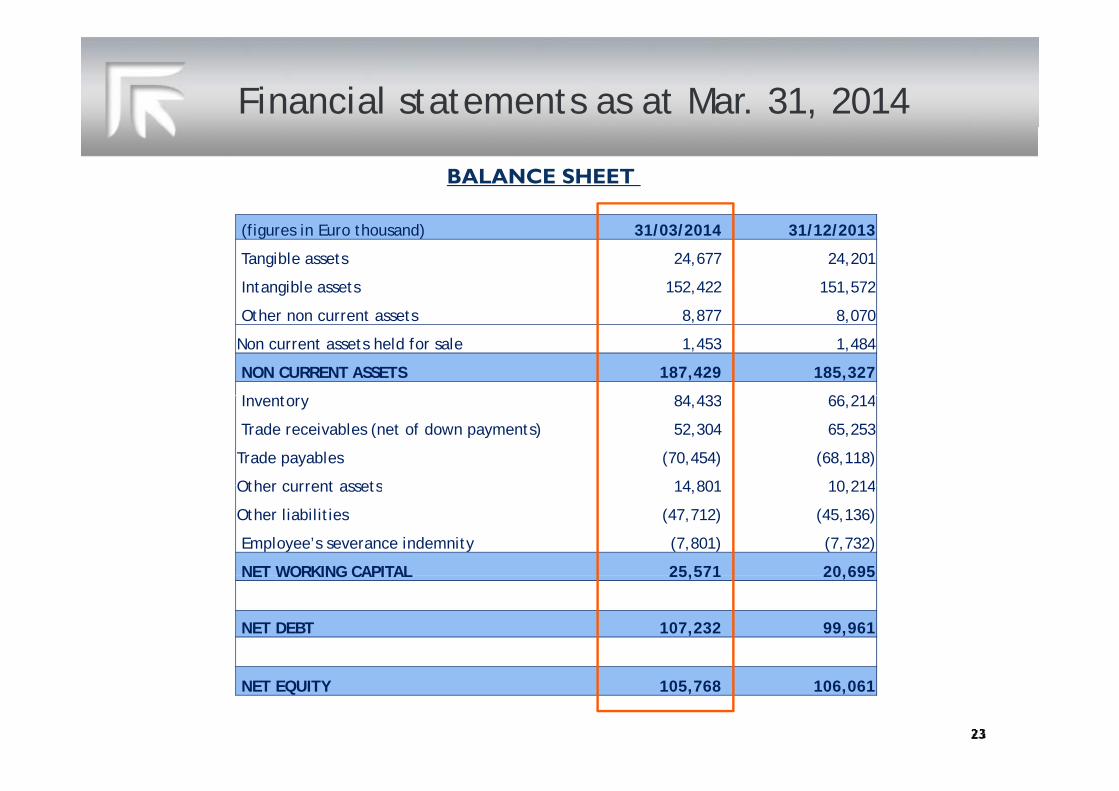
Financial statements as at Mar. 31, 2014
BALANCE SHEET
(figures in Euro thousand) 31/03/2014 31/12/2013
Tangible assets 24,677 24,201
Intangible assets 152,422 151,572
Other non current assets 8,877 8,070
Non current assets held for sale 1,453 1,484
NON CURRENT ASSETS 187,429 185,327
I t 84 433 66 214Inventory 84,433 66,214
Trade receivables (net of down payments) 52,304 65,253
Trade payables (70,454) (68,118)
Other current assets 14 801 10 214Other current assets 14,801 10,214
Other liabilities (47,712) (45,136)
Employee’s severance indemnity (7,801) (7,732)
NET WORKING CAPITAL 25,571 20,695NET WORKING CAPITAL 25,571 20,695
NET DEBT 107,232 99,961
NET EQUITY 105,768 106,061
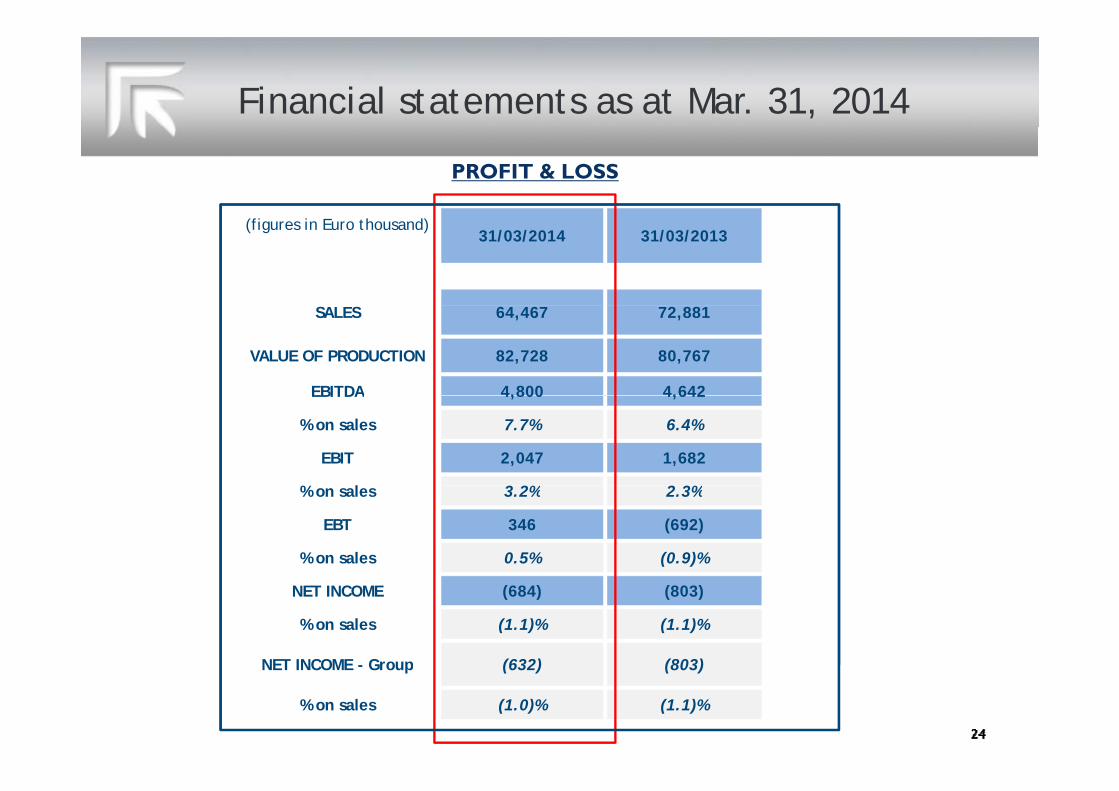
Financial statements as at Mar. 31, 2014
PROFIT & LOSS
(figures in Euro thousand)31/03/2014 31/03/2013
SALES 64,467 72,881
VALUE OF PRODUCTION 82,728 80,767
EBITDA 4,800 4,642EBITDA 4,800 4,642
% on sales 7.7% 6.4%
EBIT 2,047 1,682
% l 3 2% 2 3%% on sales 3.2% 2.3%
EBT 346 (692)
% on sales 0.5% (0.9)%
NET INCOME (684) (803)
% on sales (1.1)% (1.1)%
NET INCOME - Group (632) (803)NET INCOME - Group (632) (803)
% on sales (1.0)% (1.1)%
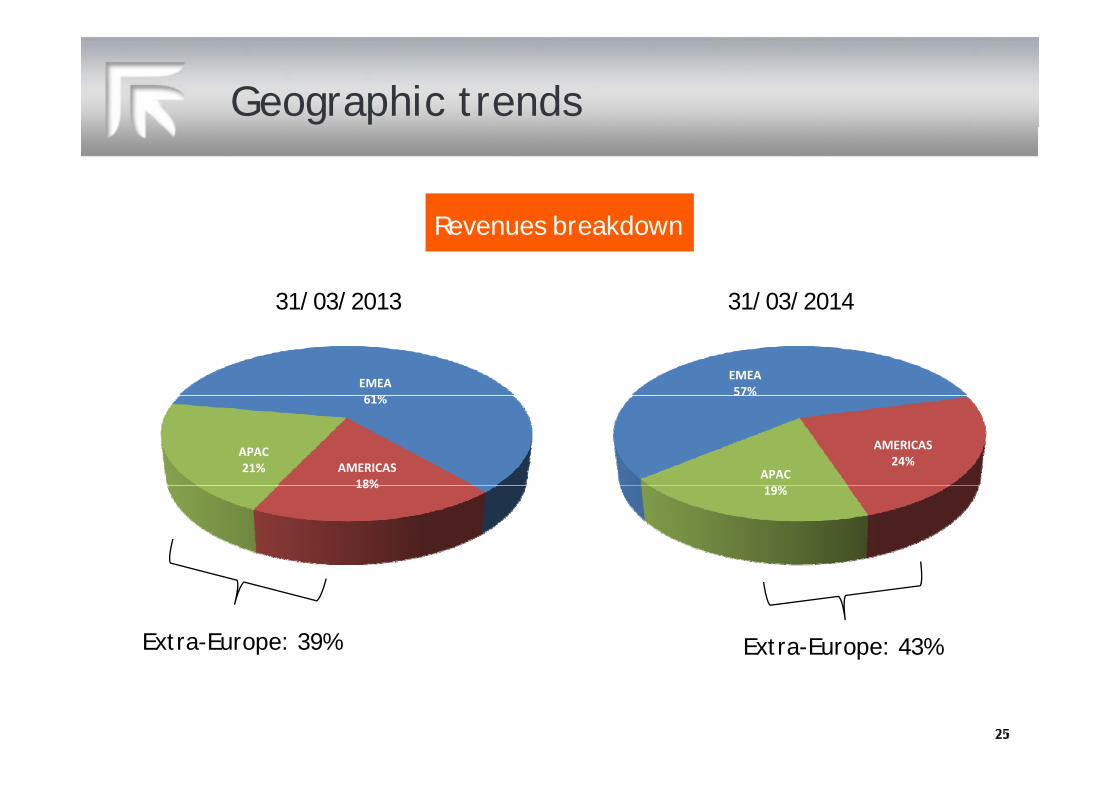
Geographic trends
R b kdRevenues breakdown
31/03/2013 31/03/201431/03/2013 31/03/2014
EMEA61%
EMEA57%
61%
AMERICAS18%
APAC21%
%
AMERICAS24%
APAC18% 19%
Extra-Europe: 39% Extra-Europe: 43%
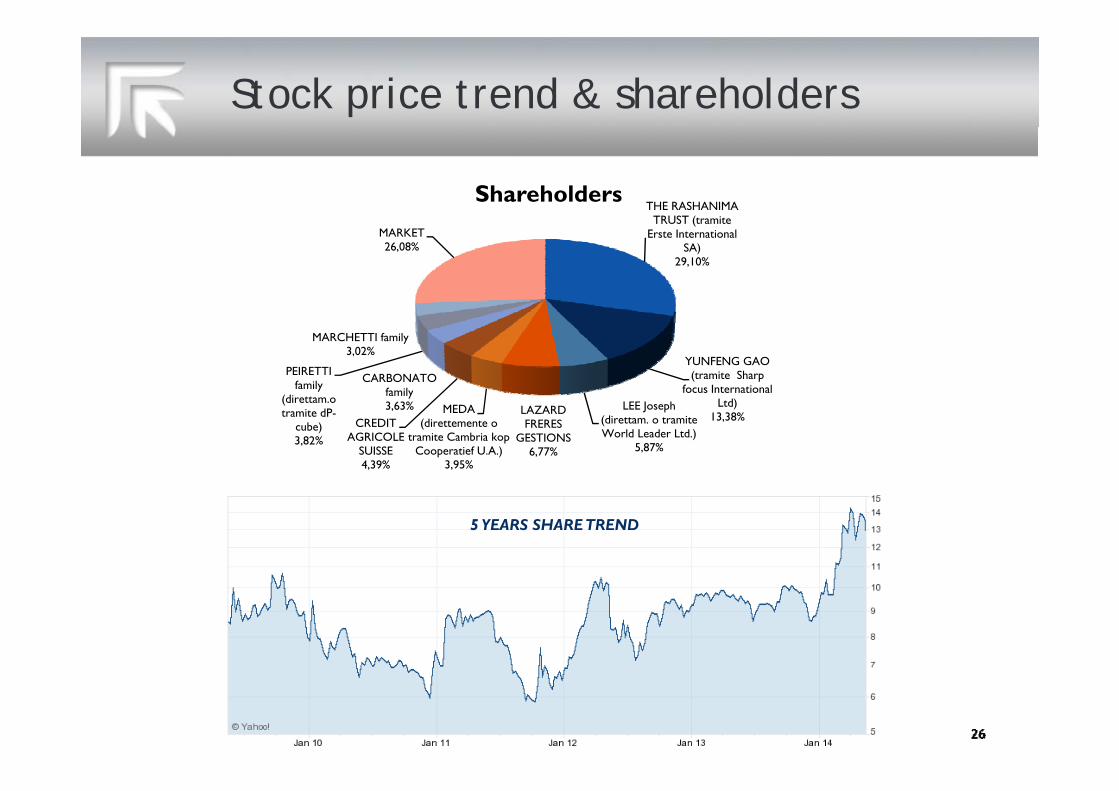
Stock price trend & shareholders
THE RASHANIMA TRUST (
ShareholdersTRUST (tramite
Erste International SA)
29,10%
MARKET26,08%
YUNFENG GAO (tramite Sharp
focus International CARBONATO
family
PEIRETTI family
(di
MARCHETTI family3,02%
Ltd)13,38%
LEE Joseph (direttam. o tramite World Leader Ltd.)
5,87%
LAZARD FRERES
GESTIONS6,77%
MEDA (direttemente o
tramite Cambria kop Cooperatief U.A.)
3,95%
CREDIT AGRICOLE
SUISSE4,39%
family3,63%(direttam.o
tramite dP-cube)3,82%
5 YEARS SHARE TREND
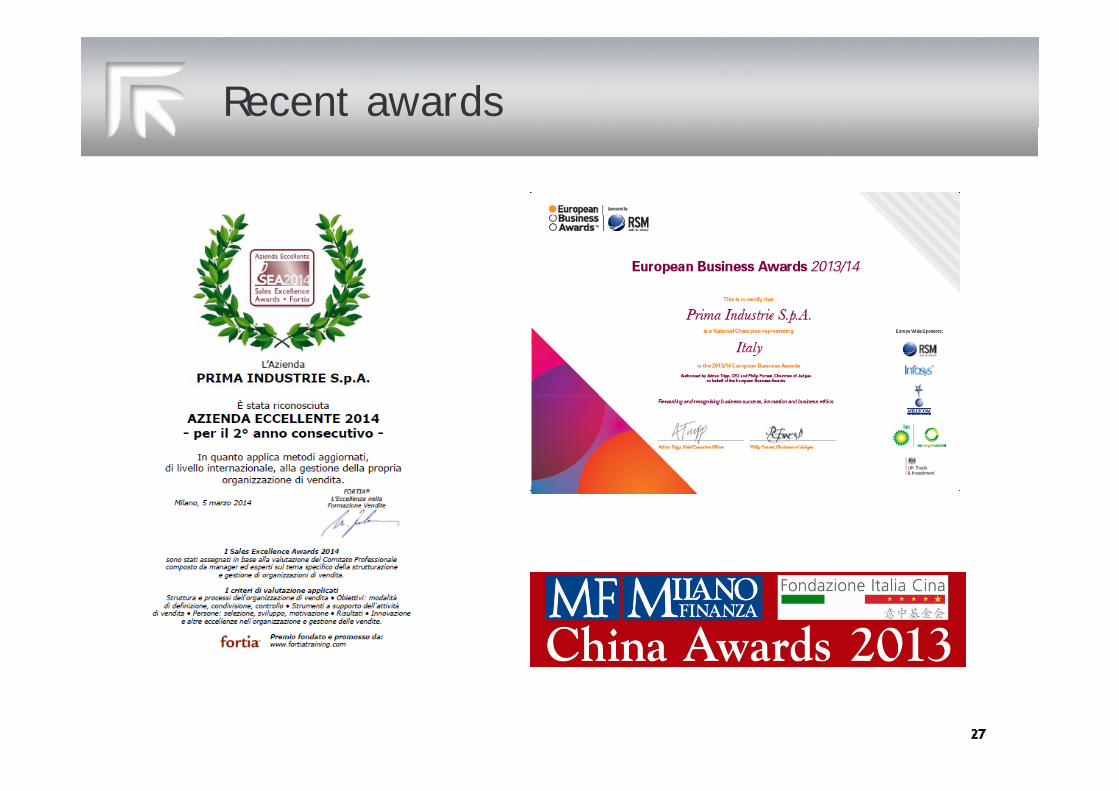
Recent awards
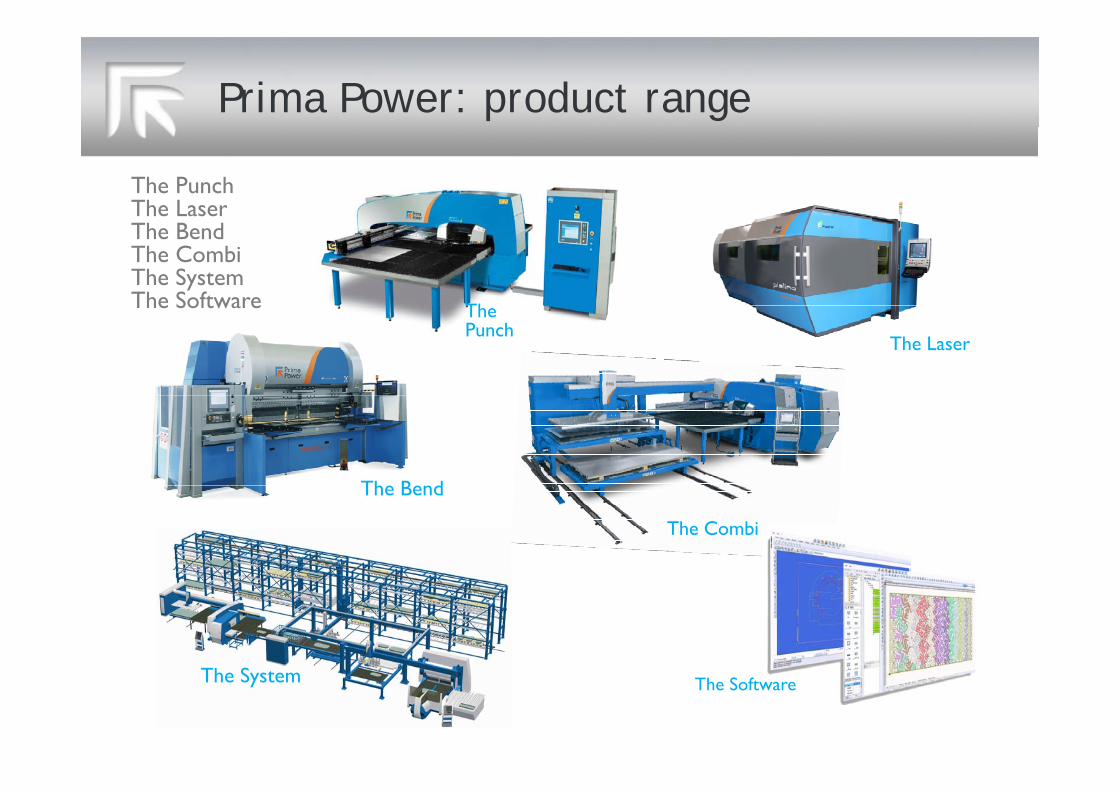
Prima Power: product range
The PunchThe Laser
Th
The LaserThe BendThe CombiThe SystemThe Software The
PunchThe Software
The Laser
Th B dThe Bend
The Combi
The System The Software

Prima Power – selected customers
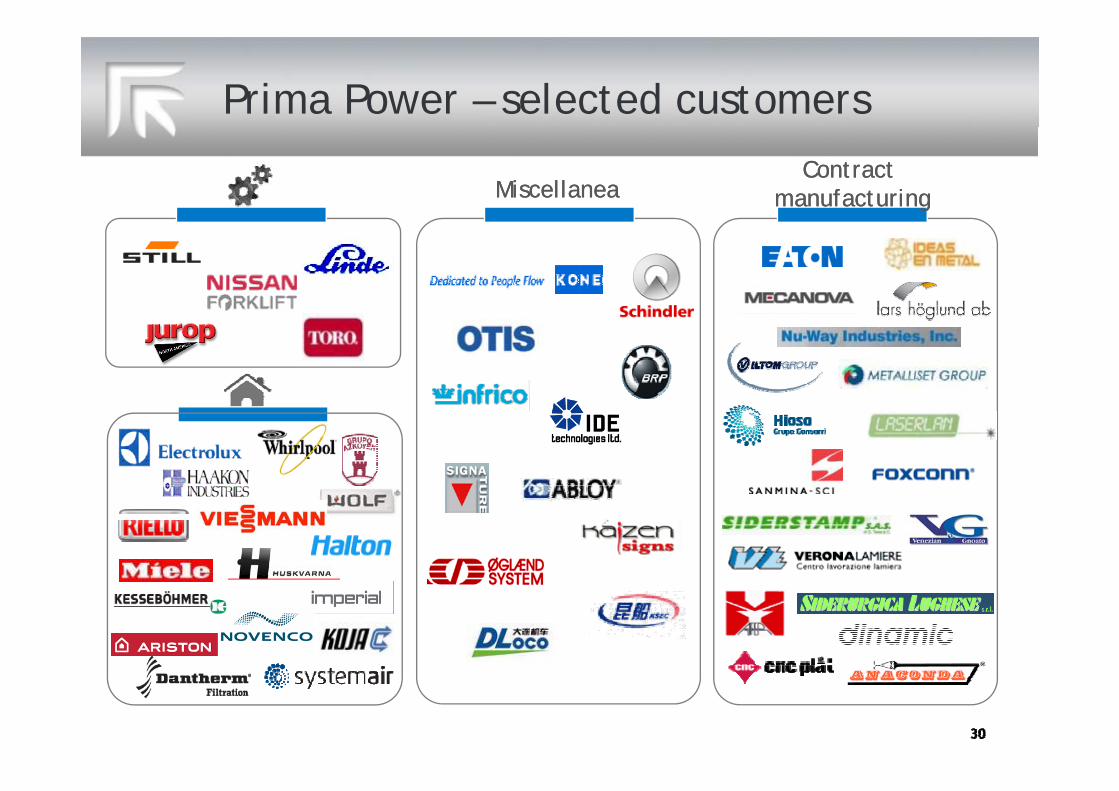
Prima Power – selected customers
MiscellaneaMiscellaneaContractContract
manufacturingmanufacturing
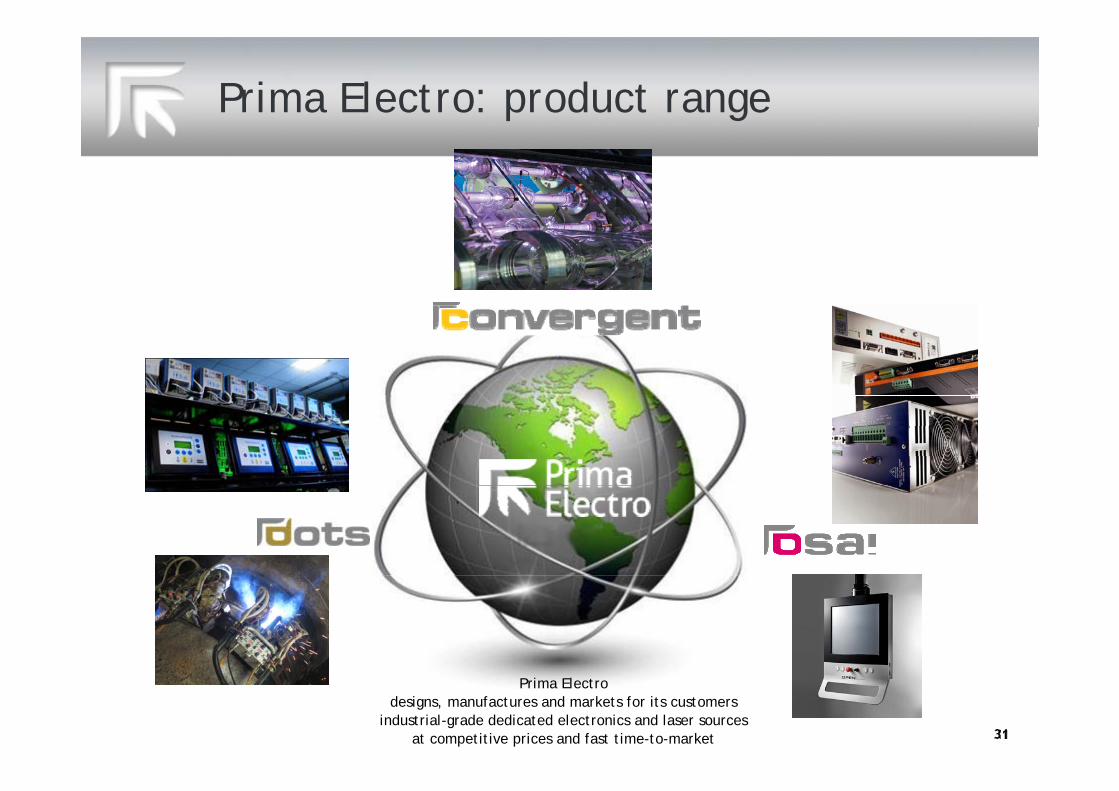
Prima Electro: product range
Prima Electro designs, manufactures and markets for its customers
industrial-grade dedicated electronics and laser sources at competitive prices and fast time-to-market
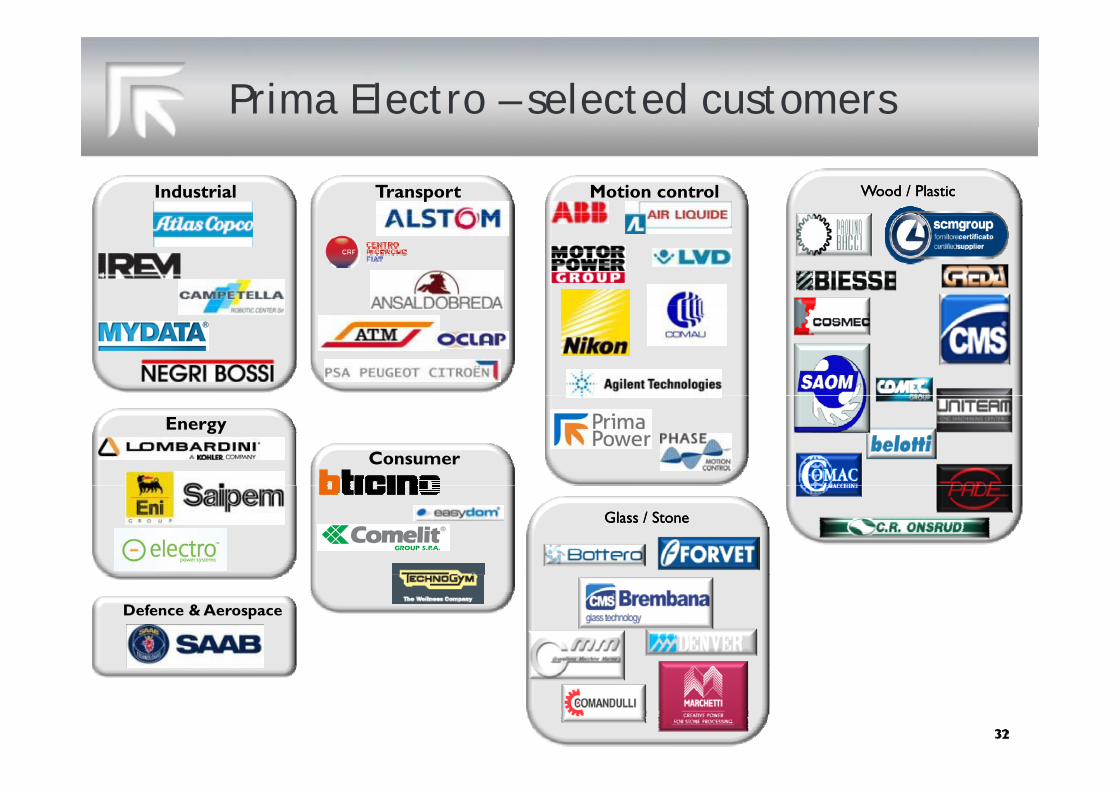
Prima Electro – selected customers
Industrial Transport Motion control Wood / PlasticWood / Plastic
Energy
Consumer
Glass / StoneGlass / Stone
Defence & Aerospace