Embed Size (px)
Citation preview
Italian Private Equity and Venture Capital AssociationItalian Private Equity and Venture Capital Association
Il mercato del seed e Il mercato del seed e venture capital in Italiaventure capital in Italia
PaviaPavia, , 2277th th May 2002May 2002
Anna GervasoniAnna Gervasoni
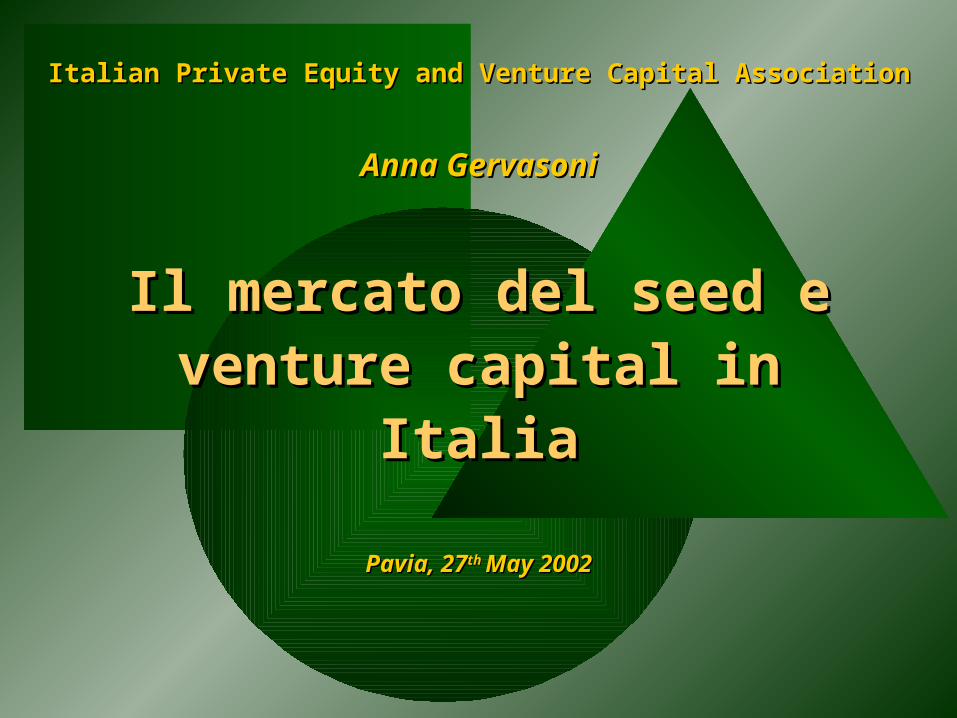
Investment activity by number, Investment activity by number, companies and amountcompanies and amount
269 175
944
390 309
1.778
646 490
2.968
489364
2.185
0
1.000
2.000
3.000
1998 1999 2000 2001
Number Companies Amount (Euro mln)
- 26 %
A.I.F.I.A.I.F.I.
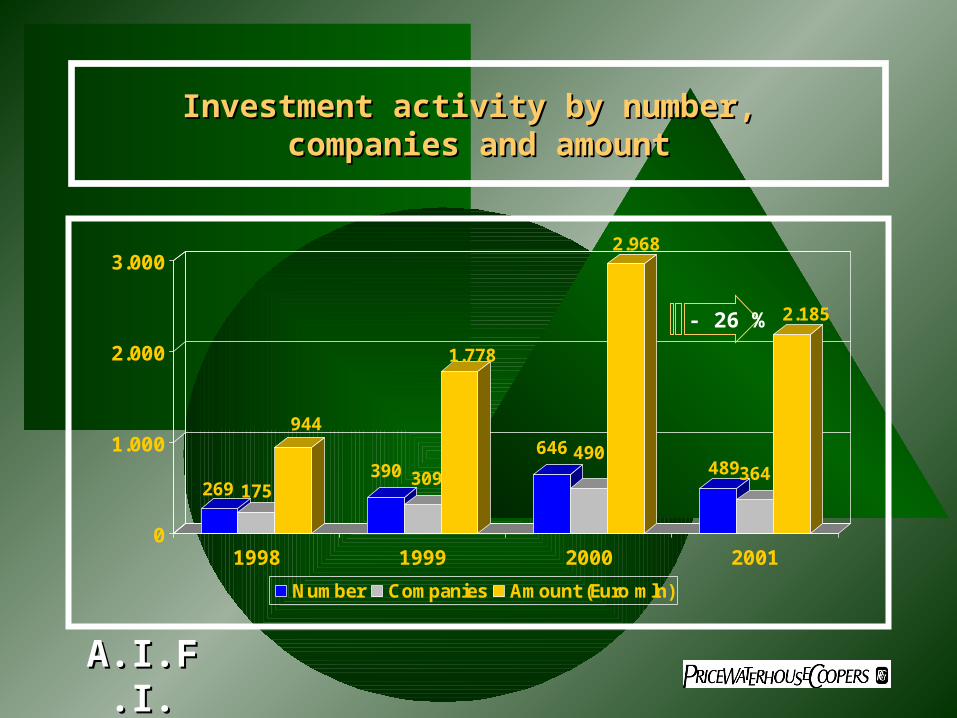
2001: % stage distribution of investments2001: % stage distribution of investments
46%
13%
38%34%
10%6% 6%
47%
0%
10%
20%
30%
40%
50%
Seed/Start up Expansion Replacement Buy out
Number Amount
A.I.F.I.A.I.F.I.
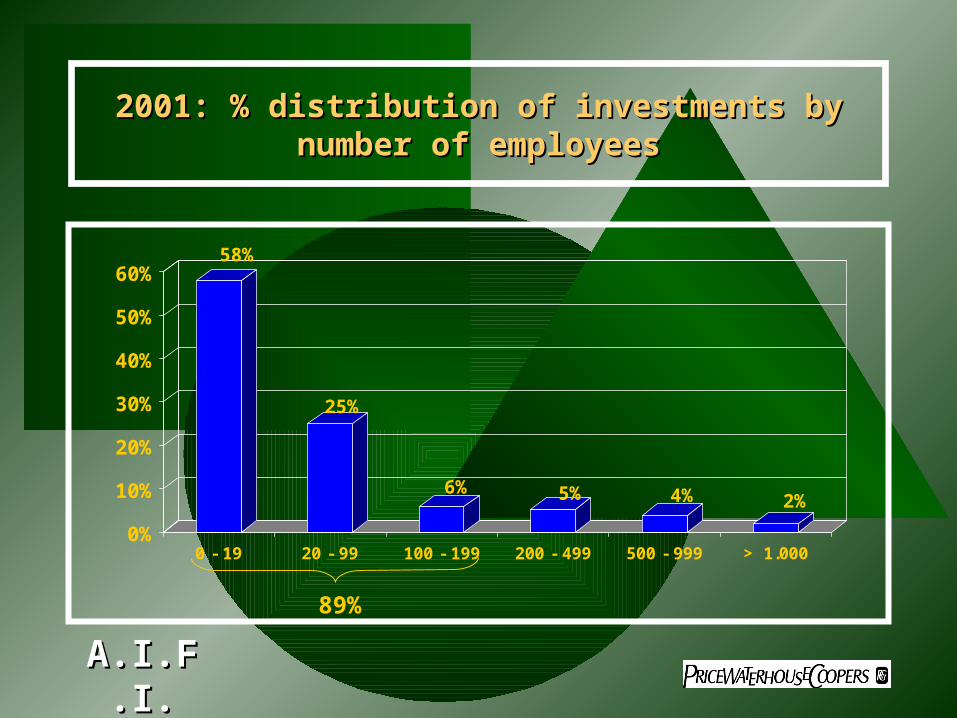
2001: % distribution of investments by 2001: % distribution of investments by number of employeesnumber of employees
A.I.F.I.A.I.F.I.
58%
25%
6% 5% 4% 2%
0%
10%
20%
30%
40%
50%
60%
0 - 19 20 - 99 100 - 199 200 - 499 500 - 999 > 1.000
89%

2001: Geographical distribution of 2001: Geographical distribution of investmentsinvestments
A.I.F.I.A.I.F.I.
80%84%
17%14%
3% 2%
0%
20%
40%
60%
80%
100%
Italy Europe Other
Number Amount

2001: Target companies distribution by 2001: Target companies distribution by regionregion
A.I.F.I.A.I.F.I.
36
16
51
13334445579121620
30
79
0
20
40
60
80
100
Lomba
rdia
Emilia Ro
mag
na
Friu
li
Tos
cana
Ven
eto
Piemon
te
Laz
io
March
e
Calab
ria
Sarde
gna
Cam
pania
Pug
lia
Abruz
zo
Ligu
ria
Sici
lia
Tren
tino A.
A.
Umbria
Molise N/A
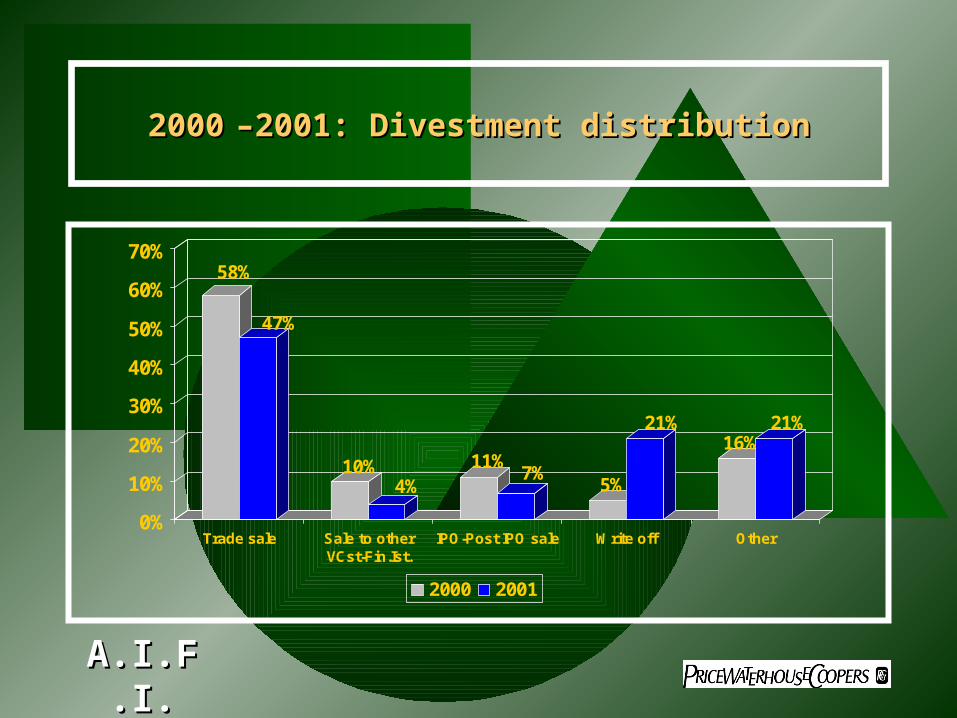
20002000 ––2001: Divestment distribution2001: Divestment distribution
A.I.F.I.A.I.F.I.
58%
47%
10%4%
11%7%
5%
21%16%
21%
0%
10%
20%
30%
40%
50%
60%
70%
Trade sale Sale to otherVCst-Fin.Ist.
IPO-Post IPO sale Write off Other
2000 2001
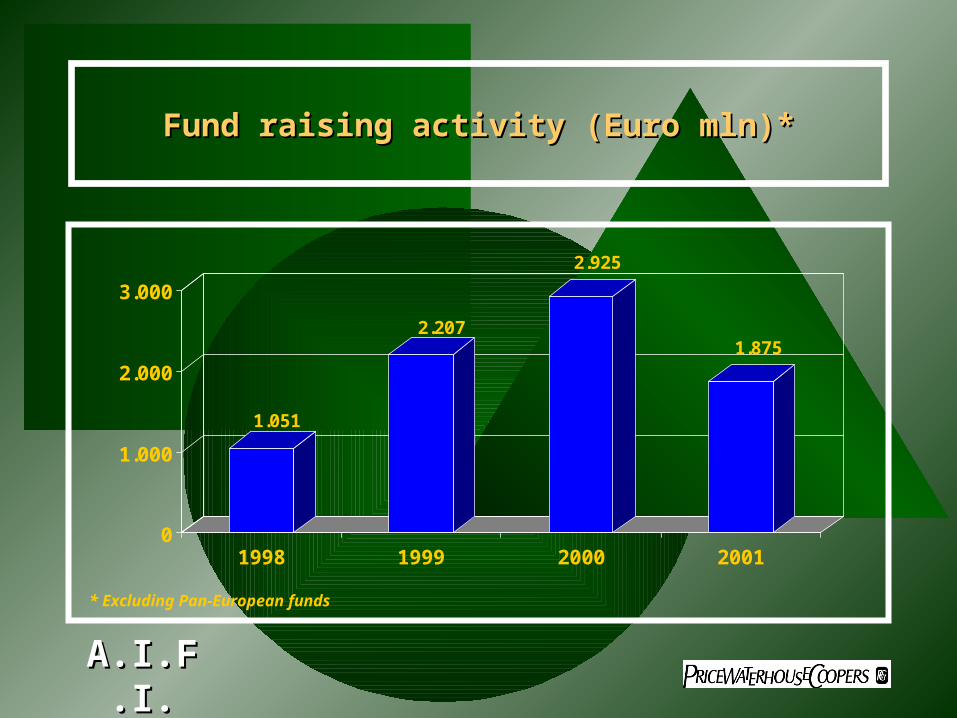
Fund raising activity (Euro mln)*Fund raising activity (Euro mln)*
A.I.F.I.A.I.F.I.
1.051
2.207
2.925
1.875
0
1.000
2.000
3.000
1998 1999 2000 2001
* Excluding Pan-European funds
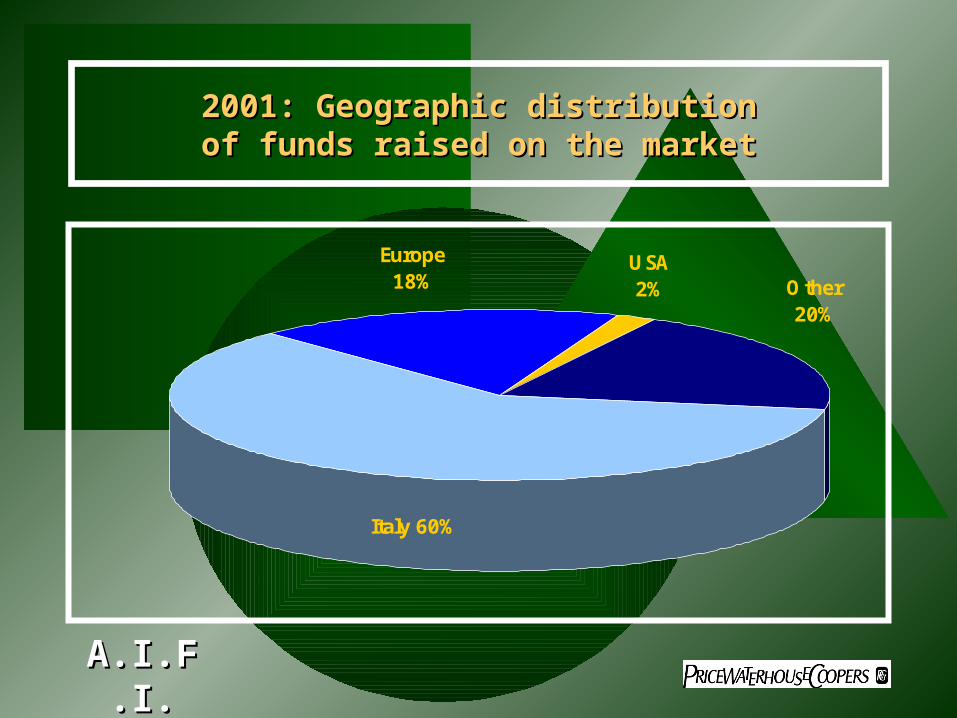
2001: Geographic distribution2001: Geographic distributionof funds raised on the marketof funds raised on the market
A.I.F.I.A.I.F.I.
Other20%
USA2%
Europe18%
Italy 60%

Focus: Early stage Focus: Early stage High TechHigh Tech
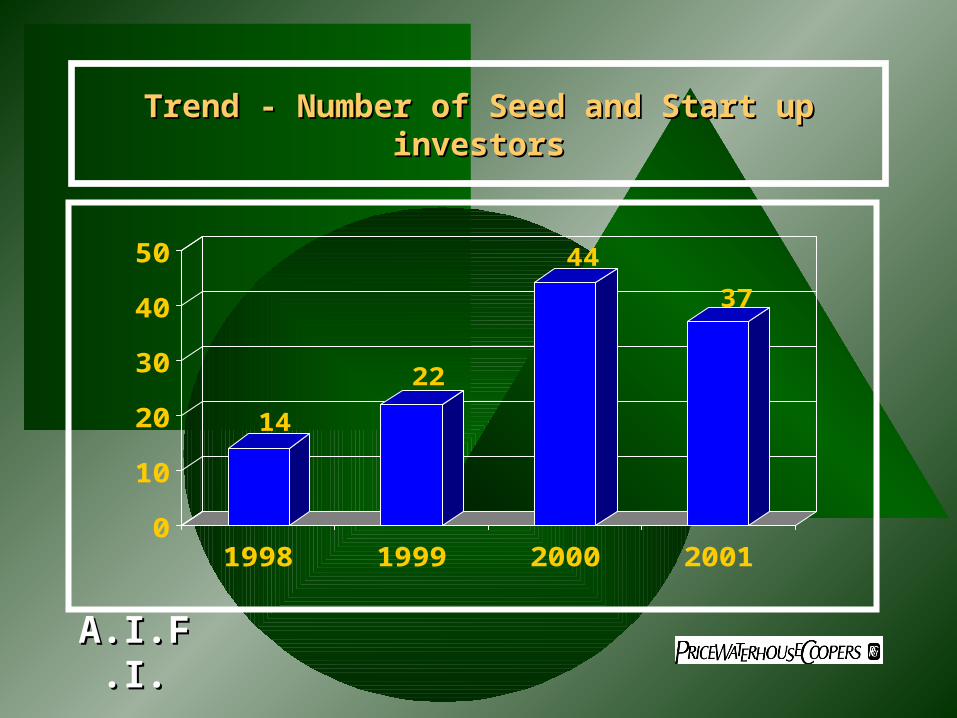
Trend - Trend - Number of Seed and Start up Number of Seed and Start up investorsinvestors
14
22
44
37
0
10
20
30
40
50
1998 1999 2000 2001
A.I.F.I.A.I.F.I.

Trend - Seed and Start up investmentsTrend - Seed and Start up investmentsby number and amountby number and amount
94 109153 147
339
540
222
291
0
200
400
600
1998 1999 2000 2001
Number Amount (Euro mln)
A.I.F.I.A.I.F.I.
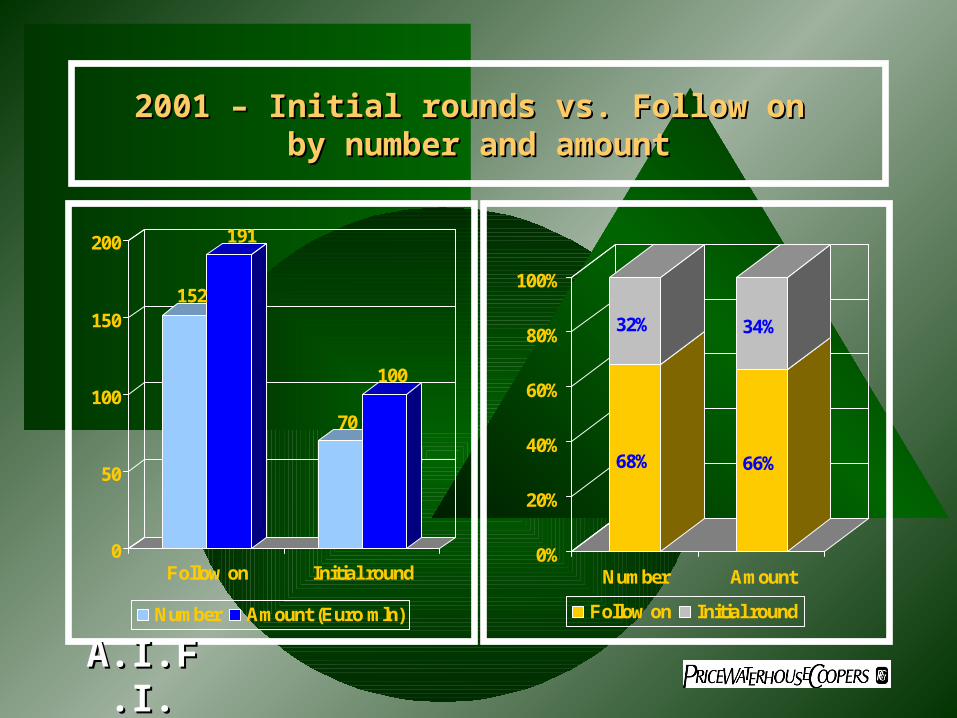
68%
32%
66%
34%
0%
20%
40%
60%
80%
100%
Number Amount
Follow on Initial round
2001 – Initial rounds vs. Follow on 2001 – Initial rounds vs. Follow on by number and amountby number and amount
152
191
70
100
0
50
100
150
200
Follow on Initial round
Number Amount (Euro mln)
A.I.F.I.A.I.F.I.
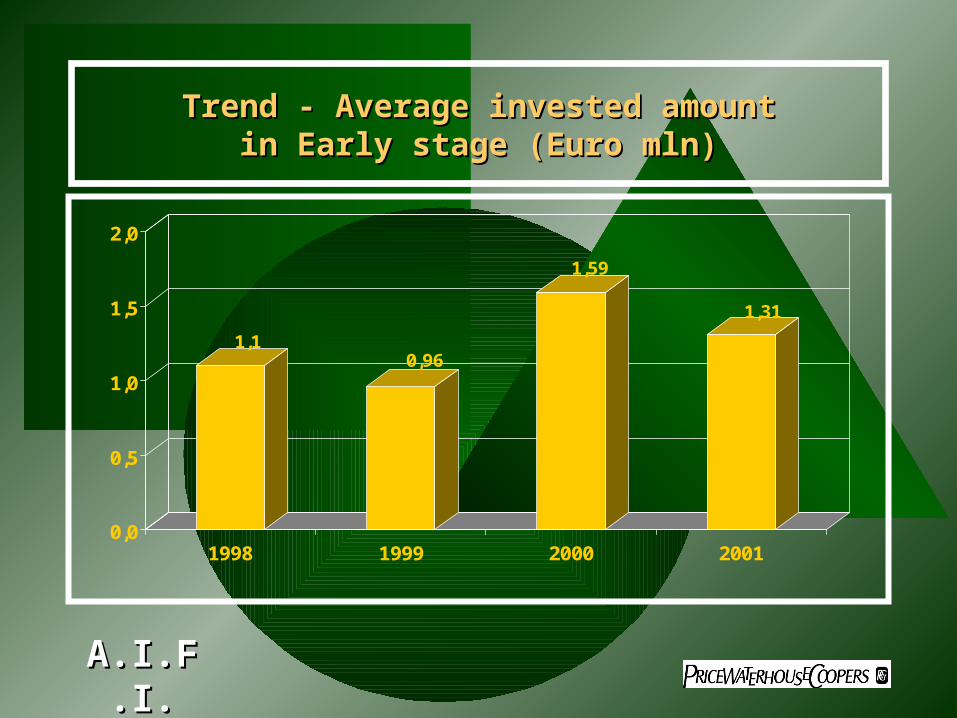
Trend - Average invested amountTrend - Average invested amountin Early stage (Euro mln)in Early stage (Euro mln)
1,10,96
1,59
1,31
0,0
0,5
1,0
1,5
2,0
1998 1999 2000 2001
A.I.F.I.A.I.F.I.
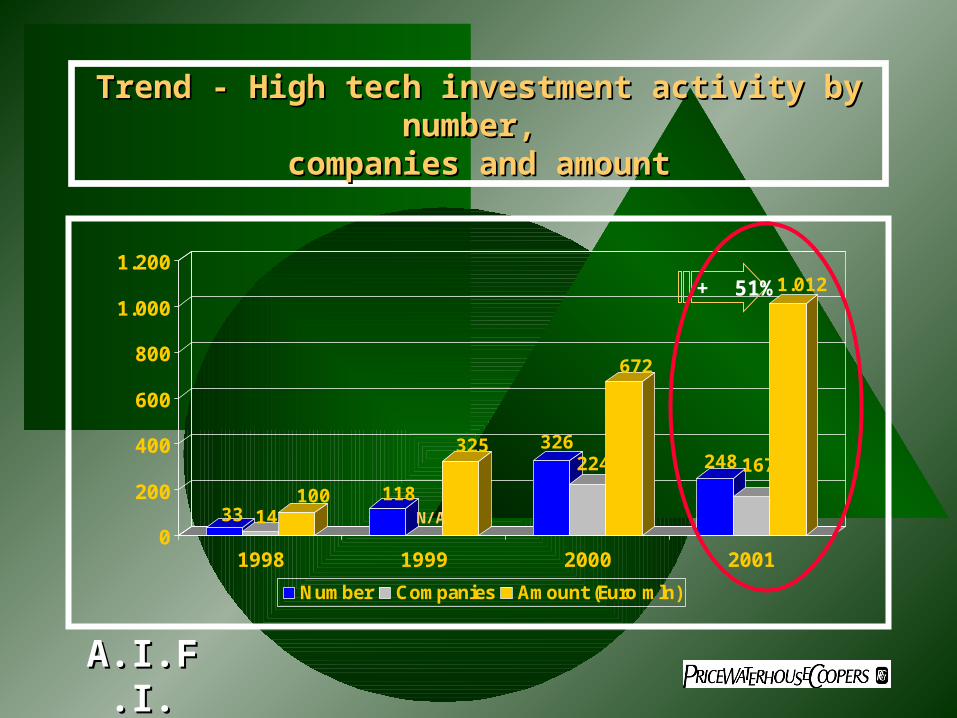
Trend - Trend - High tech investment activity by High tech investment activity by number, number,
companies and amountcompanies and amount
33 14100 118
325 326224
672
248167
1.012
0
200
400
600
800
1.000
1.200
1998 1999 2000 2001
Number Companies Amount (Euro mln)
A.I.F.I.A.I.F.I.
N/A
+ 51%
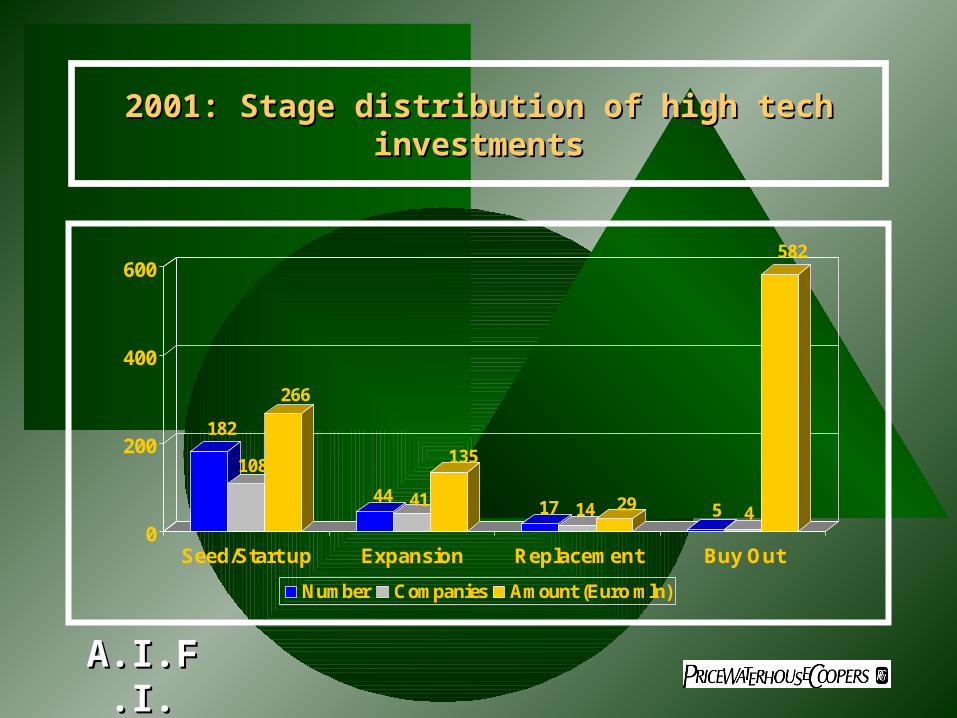
2001: Stage distribution of high tech 2001: Stage distribution of high tech investmentsinvestments
182
108
266
44 41
135
17 14 29 5 4
582
0
200
400
600
Seed/Start up Expansion Replacement Buy Out
Number Companies Amount (Euro mln)
A.I.F.I.A.I.F.I.
A.I.F.I.A.I.F.I.
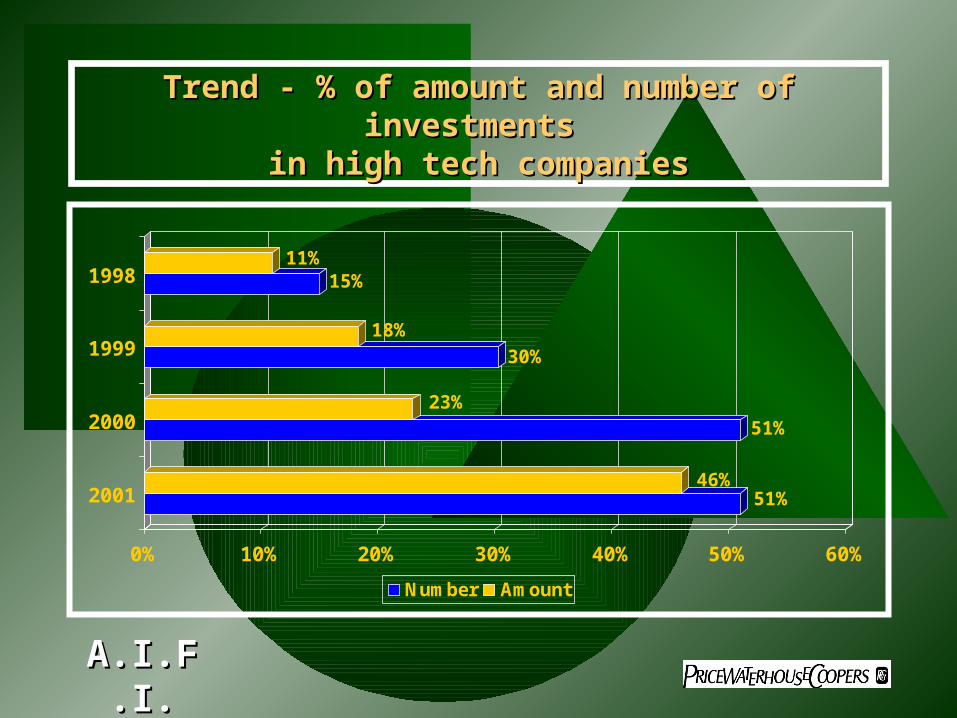
Trend - % of amount and number of Trend - % of amount and number of investments investments
in high tech companiesin high tech companies
51%46%
51%23%
30%18%
15%11%
0% 10% 20% 30% 40% 50% 60%
2001
2000
1999
1998
Number Amount

Trend – Investment activity in high tech Trend – Investment activity in high tech companiescompanies
by stage (number)by stage (number)
77
266
188
2553 44
4 417 12 3 5
0
50
100
150
200
250
300
Seed/Start up Expansion Replacement Buy out
1999 2000 2001
A.I.F.I.A.I.F.I.
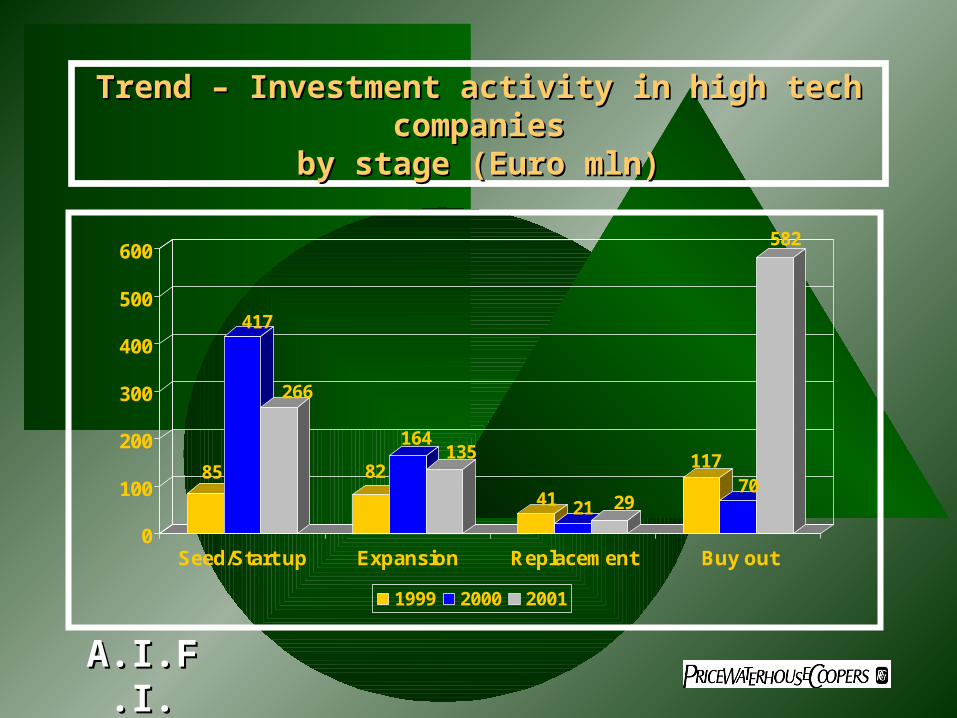
Trend – Investment activity in high tech Trend – Investment activity in high tech companiescompanies
by stage (Euro mln)by stage (Euro mln)
85
417
266
82
164135
41 21 29
11770
582
0
100
200
300
400
500
600
Seed/Start up Expansion Replacement Buy out
1999 2000 2001
A.I.F.I.A.I.F.I.

2001 –2001 – Seed and Start up investmentSeed and Start up investmentssby sectorby sector (Euro mln)(Euro mln)
18
3
247
23
0
50
100
150
200
250
300
Seed Start up
High Tech amount Low Tech amount
A.I.F.I.A.I.F.I.
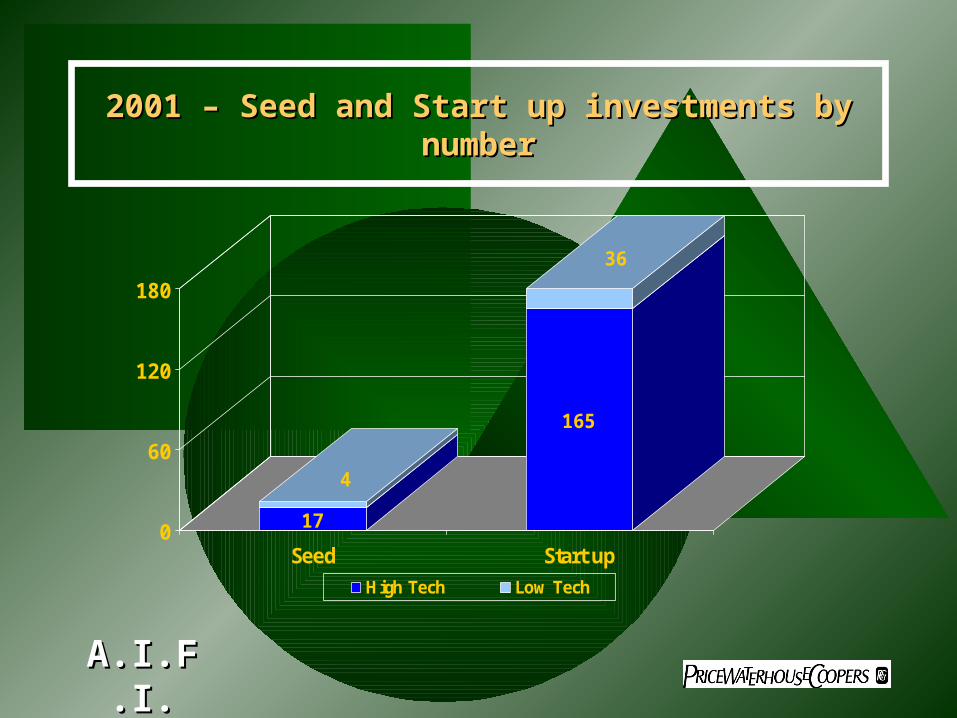
2001 – Seed and Start up investments by 2001 – Seed and Start up investments by numbernumber
17
4
165
36
0
60
120
180
Seed Start up
High Tech Low Tech
A.I.F.I.A.I.F.I.

2001 - Number of Early stage investments2001 - Number of Early stage investmentsby type of investorsby type of investors
3
36
2
16
0 0 211 13
128
110
0
25
50
75
100
125
150
Adv. of PE funds andInt. Banks
Advisor of venturecapital funds
Italian Banks andsubsidiaries
Italian closed-endfunds
Industrial/PrivateInv. Comp.
Regional and Publicplayers
Seed Start up
A.I.F.I.A.I.F.I.

Trend Trend – – Early stage investmentsEarly stage investmentsby type of investors (% number)by type of investors (% number)
7% 29% 10% 3% 8% 43%
6% 64% 10% 5% 14%
5% 63% 6% 8% 18%
0% 10% 20% 30% 40% 50% 60% 70% 80% 90% 100%
2001
2000
1999
Adv. of PE funds and Int. Banks Advisor of VC funds
Italian Banks and subsidiaries Italian closed-end funds
Industrial/Private Inv. Comp. Regional and Public players
A.I.F.I.A.I.F.I.
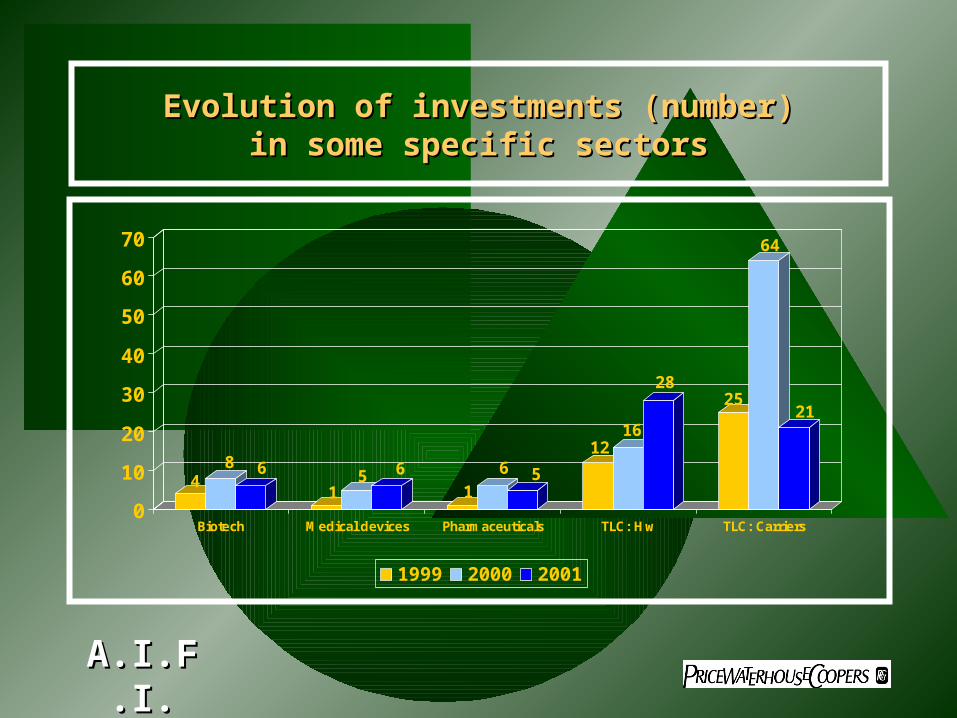
Evolution of investments (number)Evolution of investments (number)in some specific sectorsin some specific sectors
48 6
15 6
16 5
1216
2825
64
21
0
10
20
30
40
50
60
70
Biotech Medical devices Pharmaceuticals TLC: Hw TLC: Carriers
1999 2000 2001
A.I.F.I.A.I.F.I.

Sectoral distribution of Sectoral distribution of Early stage Early stage dealsdeals(by number)(by number)
51 2 3
63
12
27
58
16
0
15
30
45
60
Biotech Medical devices Pharmaceuticals TLC: Hw TLC: Carriers
2000 2001
A.I.F.I.A.I.F.I.

2001: Sectoral distribution of high tech 2001: Sectoral distribution of high tech investments by number (%)investments by number (%)
Others4%
Biotech2%
IT15%
Electronics2%
Industrial Automation
1%
Internet40%
Medical devices1%
Telecom19%
Manufacturing8%
Other services4%
Communication (other)
4%
A.I.F.I.A.I.F.I.
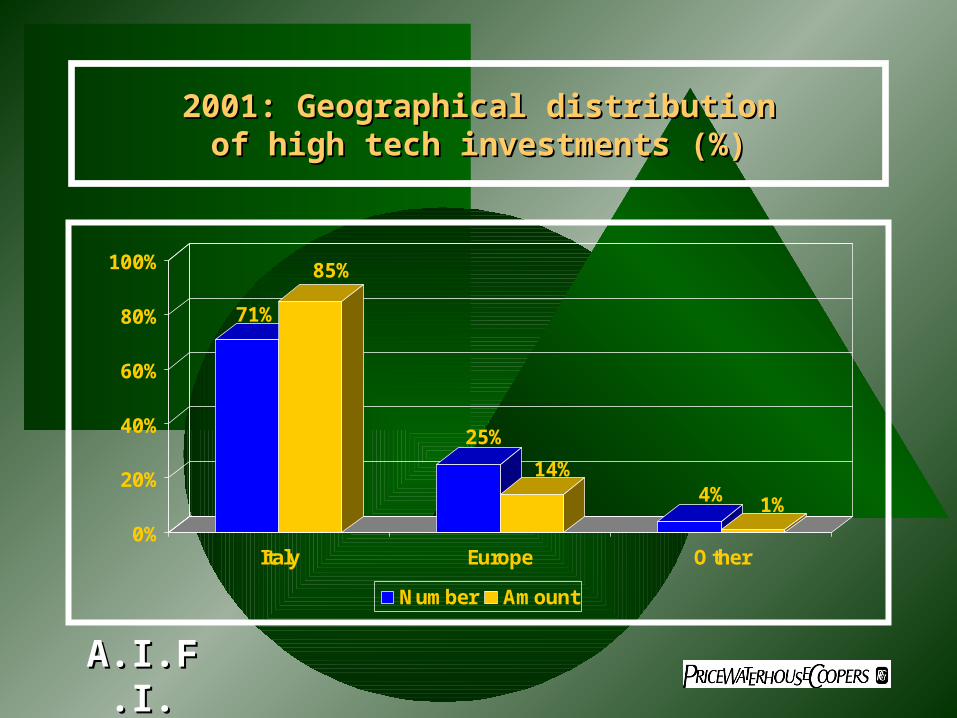
2001: Geographical distribution2001: Geographical distributionof high tech investments (%)of high tech investments (%)
71%
85%
25%
14%4% 1%
0%
20%
40%
60%
80%
100%
Italy Europe Other
Number Amount
A.I.F.I.A.I.F.I.
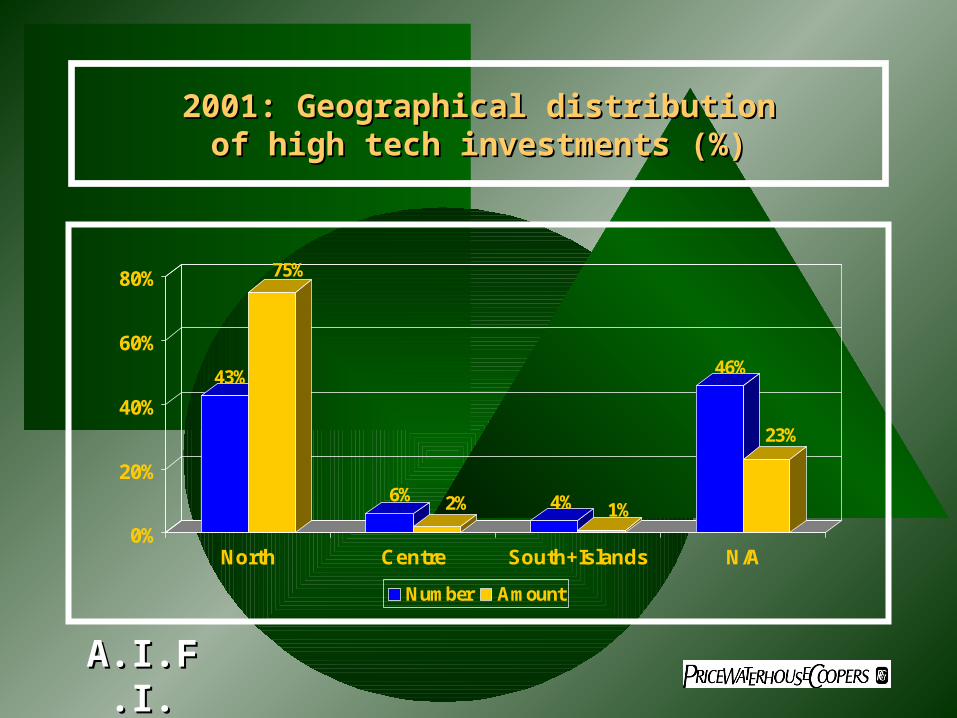
2001: Geographical distribution2001: Geographical distributionof high tech investments (%)of high tech investments (%)
43%
75%
6% 2% 4% 1%
46%
23%
0%
20%
40%
60%
80%
North Centre South+Islands N/A
Number Amount
A.I.F.I.A.I.F.I.
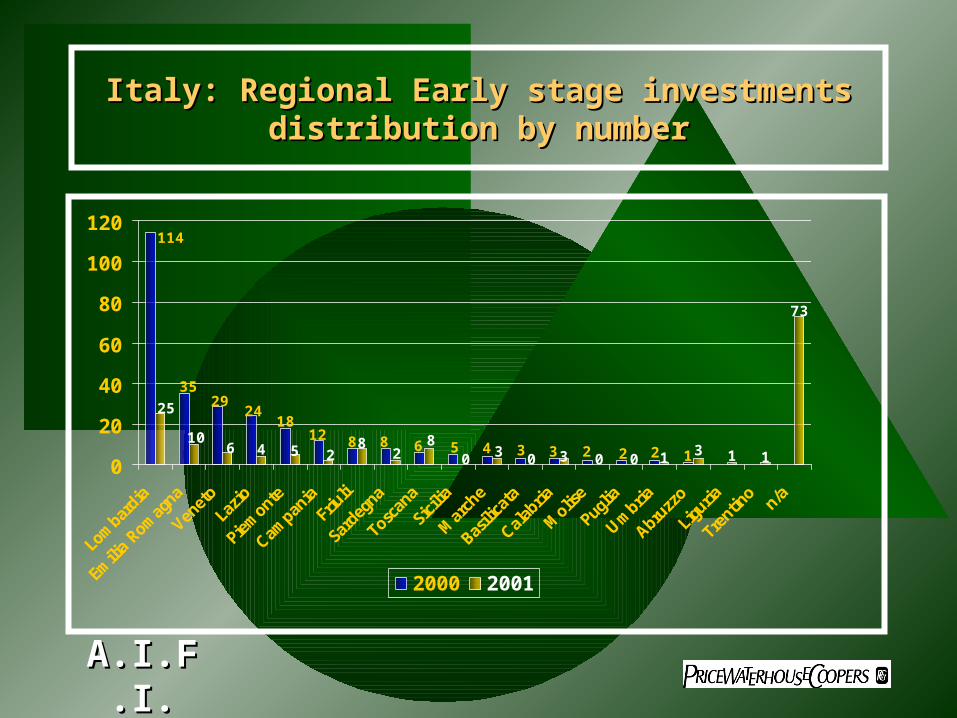
Italy: Regional Early stage investments Italy: Regional Early stage investments distribution by numberdistribution by number
114
3529
2418
12 8 8 6 5 4 3 3 2 2 2 1
25
106 4 5 2
82
80 3 0 3 0 0 1 3 1 1
73
0
20
40
60
80
100
120
Lomba
rdia
Emilia Ro
mag
na
Vene
toLa
zio
Piem
onte
Campa
nia
Friuli
Sardeg
na
Toscan
a
Sicil
ia
March
e
Basil
icata
Calabria
Molise
Pugli
a
Umbria
Abruzz
o
Ligu
ria
Tren
tino
n/a
2000 2001
A.I.F.I.A.I.F.I.

Italy: Regional high tech investments Italy: Regional high tech investments distributiondistributionby numberby number
0112222335561718
27
131
30
81
1002110514250
6713
4
45
0
20
40
60
80
100
120
140
2000 2001
A.I.F.I.A.I.F.I.

Focus: The incubation Focus: The incubation systemsystem
The sampleThe sample
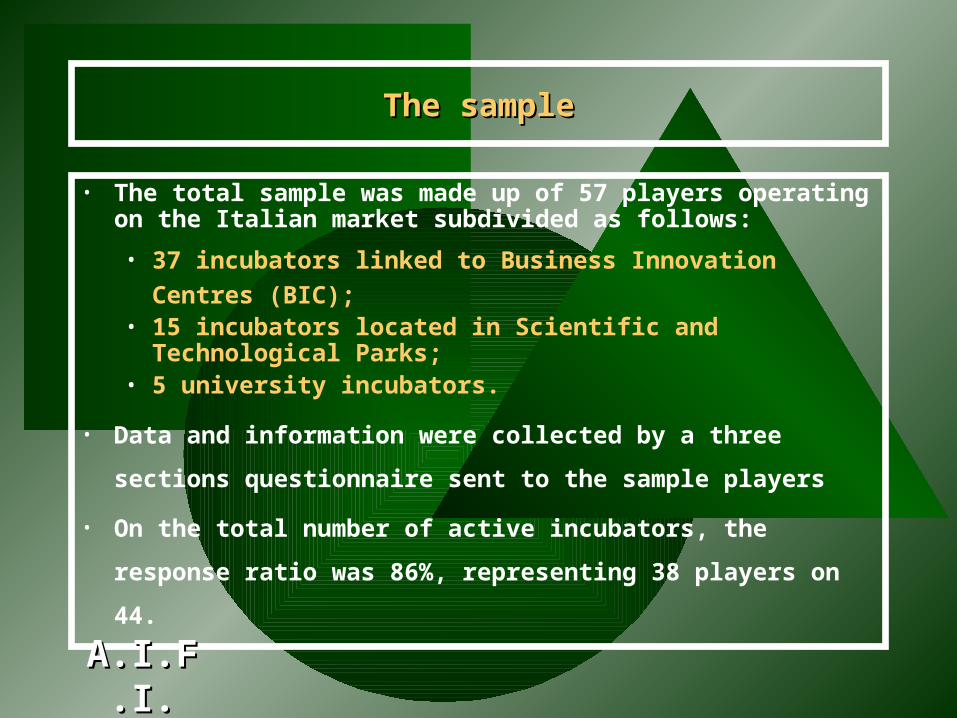
• The total sample was made up of 57 players operating on the Italian market subdivided as follows:
• 37 incubators linked to Business Innovation Centres (BIC);
• 15 incubators located in Scientific and Technological Parks;
• 5 university incubators.
• Data and information were collected by a three
sections questionnaire sent to the sample players
• On the total number of active incubators, the
response ratio was 86%, representing 38 players on
44.
A.I.F.I.A.I.F.I.
The research evidenceThe research evidence
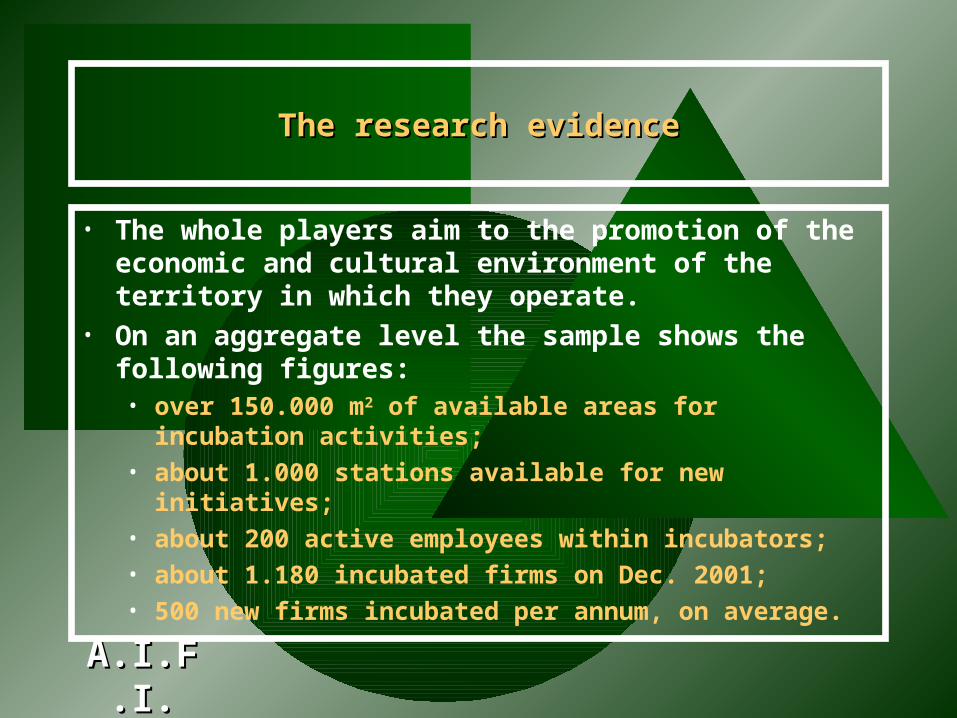
• The whole players aim to the promotion of the economic and cultural environment of the territory in which they operate.
• On an aggregate level the sample shows the following figures:• over 150.000 m2 of available areas for incubation
activities;• about 1.000 stations available for new initiatives;• about 200 active employees within incubators;• about 1.180 incubated firms on Dec. 2001;• 500 new firms incubated per annum, on average.
A.I.F.I.A.I.F.I.
The research evidenceThe research evidence (cont’) (cont’)
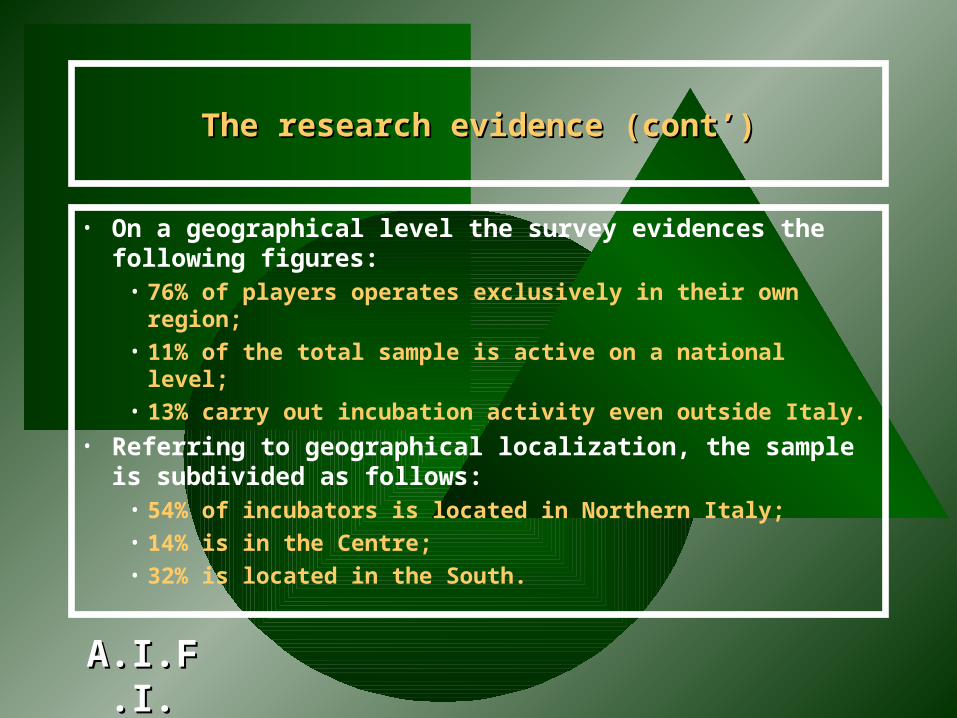
• On a geographical level the survey evidences the following figures:
• 76% of players operates exclusively in their own region;
• 11% of the total sample is active on a national level;
• 13% carry out incubation activity even outside Italy.• Referring to geographical localization, the sample
is subdivided as follows:• 54% of incubators is located in Northern Italy;• 14% is in the Centre;• 32% is located in the South.
A.I.F.I.A.I.F.I.
The figuresThe figures
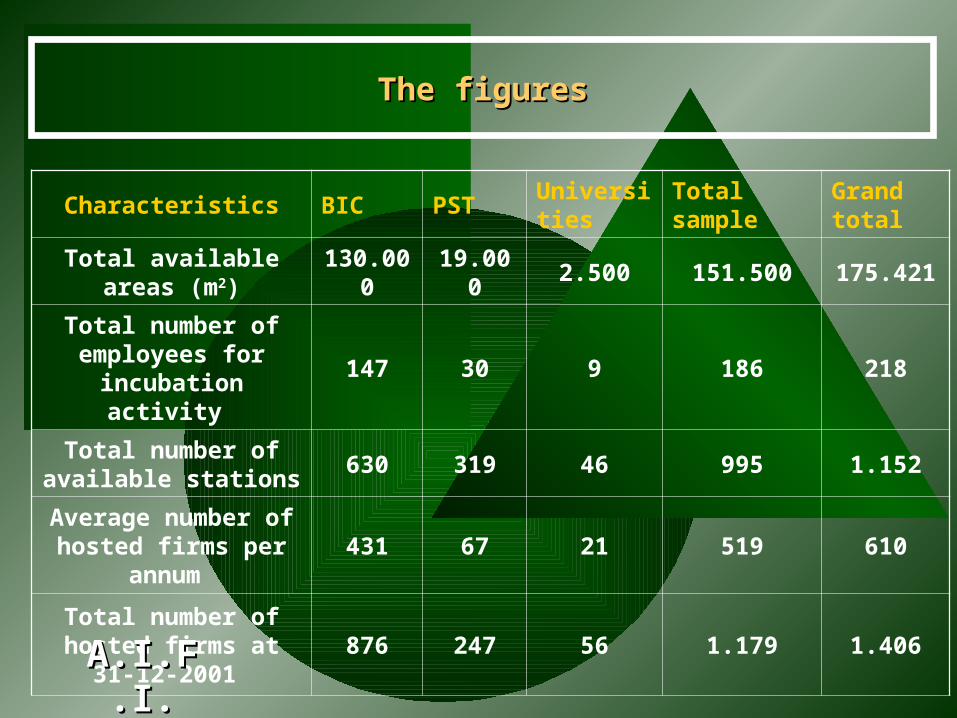
Characteristics BIC PSTUniversities
Total sample
Grand total
Total available areas (m2)
130.000
19.000
2.500 151.500 175.421
Total number of employees for
incubation activity 147 30 9 186 218
Total number of available stations
630 319 46 995 1.152
Average number of hosted firms per
annum 431 67 21 519 610
Total number of hosted firms at 31-
12-2001 876 247 56 1.179 1.406
A.I.F.I.A.I.F.I.
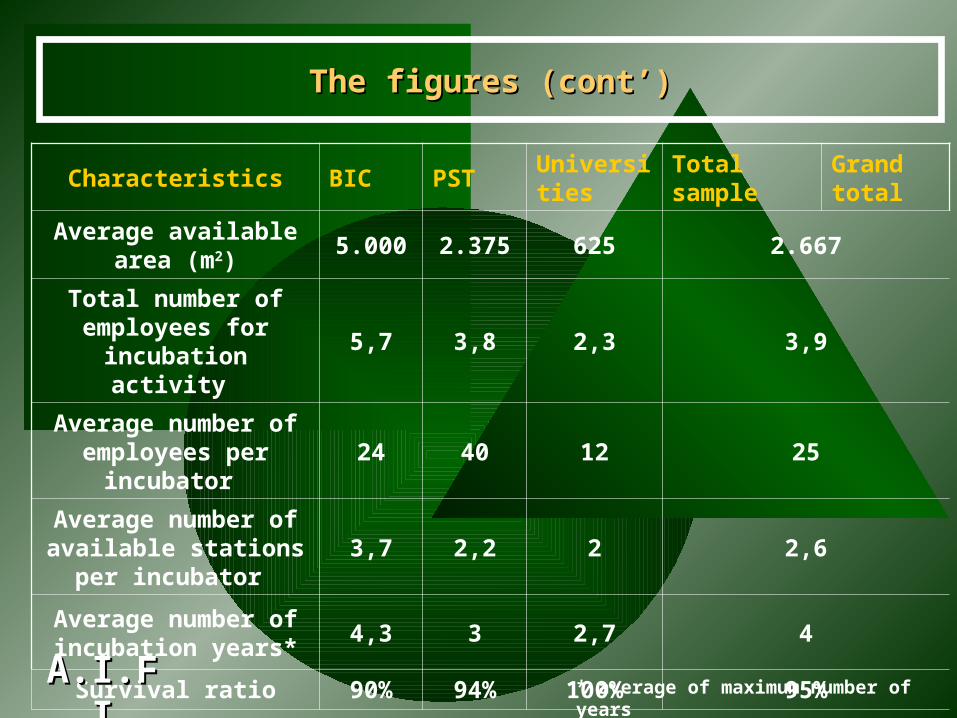
Characteristics BIC PSTUniversities
Total sample
Grand total
Average available area (m2)
5.000 2.375 625 2.667
Total number of employees for
incubation activity 5,7 3,8 2,3 3,9
Average number of employees per
incubator 24 40 12 25
Average number of available stations
per incubator 3,7 2,2 2 2,6
Average number of incubation years*
4,3 3 2,7 4
Survival ratio 90% 94% 100% 95%
The figuresThe figures (cont’) (cont’)
* average of maximum number of yearsA.I.F.I.A.I.F.I.
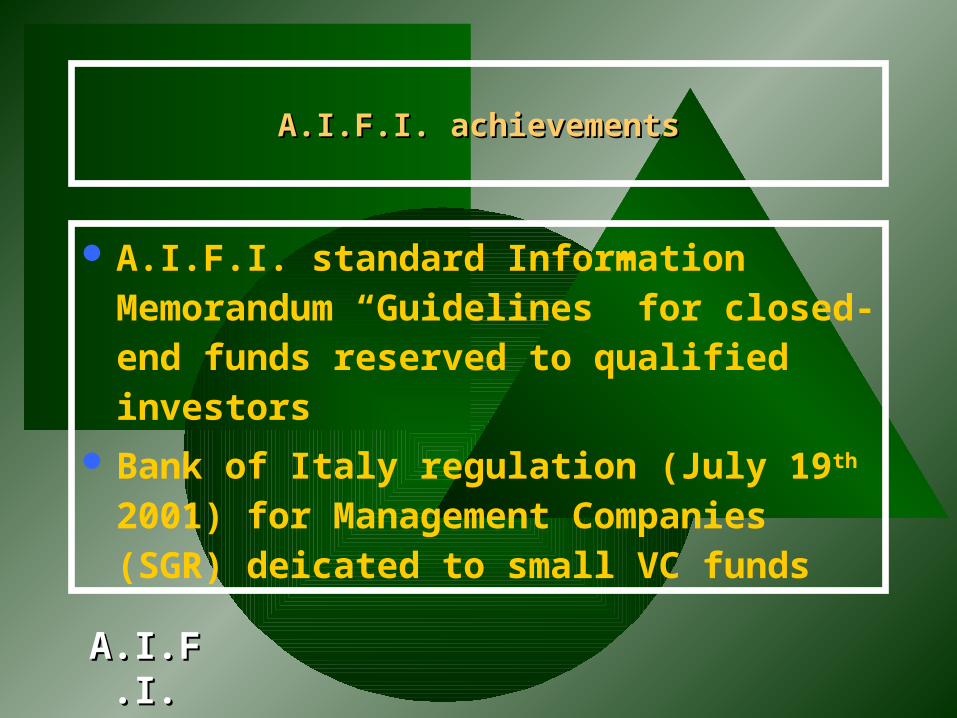
A.I.F.I. achievementsA.I.F.I. achievements
A.I.F.I. standard Information Memorandum “Guidelines” for closed-end funds reserved to qualified investors
Bank of Italy regulation (July 19th
2001) for Management Companies (SGR) deicated to small VC funds
A.I.F.I.A.I.F.I.
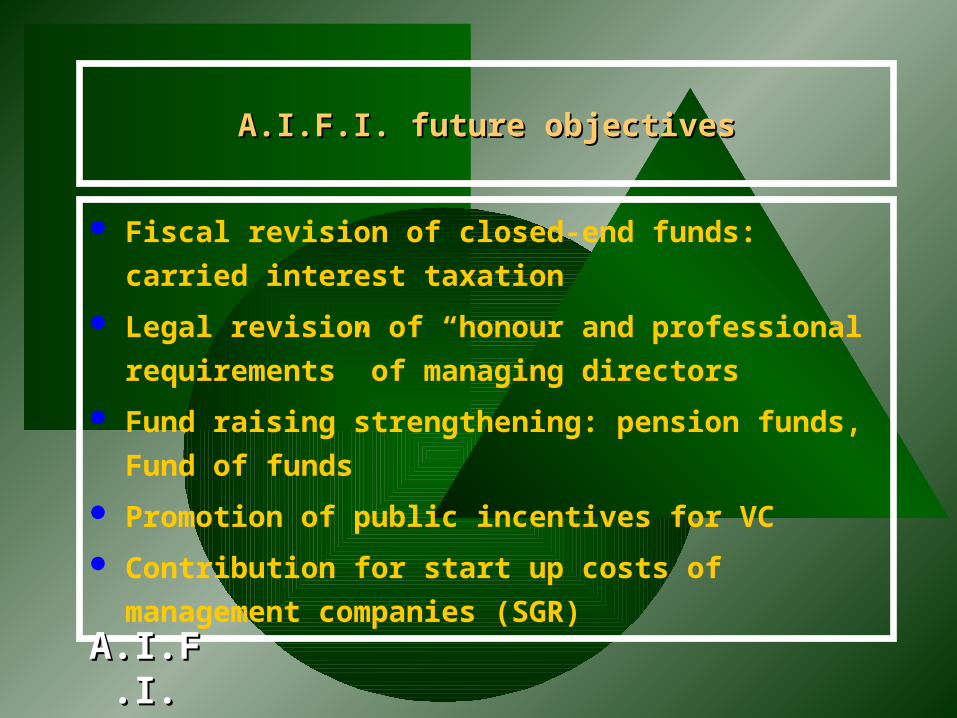
Fiscal revision of closed-end funds: carried
interest taxation
Legal revision of “honour and professional
requirements” of managing directors
Fund raising strengthening: pension funds,
Fund of funds
Promotion of public incentives for VC
Contribution for start up costs of
management companies (SGR)
A.I.F.I. future objectivesA.I.F.I. future objectives
A.I.F.I.A.I.F.I.

www.aifi.itwww.aifi.it


![VENTURE CAPITAL FOR SUSTAINABILITY 2007 REPORT [2007] Venture Capital... · growing sector as Venture Capital for Sustainability ... Venture Capitalists’ stake in ... Venture Capital](https://img.pdfslide.us/doc/110x75/5a7926b77f8b9a00168dc540/venture-capital-for-sustainability-2007-2007-venture-capitalgrowing-sector.jpg)