Embed Size (px)
Citation preview

ITALIAN ENERGY MARKET OVERVIEW
2015 & 2016 | MARKET ANALYSIS & PRICE FORECASTING
March 2017

2
AGENDA
Wholesale
power market
02
Weather
03
Market prices
and margins
04
Main Featuersof the Italian
energy market
01

3
EUROPEAN ENERGY MARKET SIZESTHE ITALIAN MARKET IN THE EUROPEAN CONTEXT
The Italian market stands 4th in the European electricity market ranking, and 3rd in the European gas
market ranking.
The Italian electricity demand in 2016 is roughly at the same level as in 2014, with a -2.1 % reduction y/y.
The Italian gas demand in 2016 stands below 2013 level (-2.1 bcm according to preliminary 2016 data).
Source: IHS Cera, Snam Rete Gas and Terna.* Power demand data do not include losses.
*

4
ITALIAN ELECTRICITY DEMANDHISTORICAL TREND
Source: IHS Cera and Terna
Electricity demand in 2015 increased by 2% y/y, mainly due to the high summer temperature. In 2016
electricity demand decreased to the 2014 level (minimum level since 2001).

5
ITALIAN ELECTRICITY DEMANDDEMAND BY SECTOR AND COMPARED TO GDP
Source: AEEGSI 2016 annual report, Terna, Eurostat
In 2015 an increase in consumption y/y was registered in every sector excepted the industrial one.
GDP in 2015 increased by 0.8% after the recession begun in 2008 (in this period, GDP was positive only
in 2010 and 2011).
Despite the increase, the 2015 consumption was 7% lower than in 2008.
• Gross Domestic Product at market prices; base: 2010

6
ITALIAN ELECTRICITY DEMANDLIBERALIZED AND REGULATED MARKETS
Source: AEEGSI 2016 annual report
REGULATED MARKET
AU (Acquirente Unico – Single Buyer): State-owned body responsible for the electricity supply to the regulated
market.
AU sources electricity on the wholesale forward market and on the spot power exchange.
* Sales to wholesalers and resellers not included.
18
,1%
25
,0%
18
,1%

7
ITALIAN GAS CONSUMPTIONDEMAND BY SECTOR AND RECENT TRENDS
Source: Snam Rete Gas
Improving gas consumption in 2016 (69.7 bmc, est.) with a significant contribution from thermoeletric
(+2.3 bcm, est.) and industrial (+0.5 bcm, est.) segments.
+12%Thermoelectricconsumption
2016 (e.)2015
+4.1%Total
consumption
2016 (e.)2015

8
ELECTRICITY PRODUCTION MIXSTEADY INCREASE IN THE RENEWABLE SHARE
Source: Terna and AEEGSI annual report 2016
2015 recorded an increase y/y in the relative importance of conventional thermal generation (to 62%, mainly
thanks to CCGTs), also due to high summer temperatures and to lower hydro production. Despite this, the
conventional thermo generation share was lower than in the years up to 2012.
Steady increase in the renewables production share.
Preliminary data on 2016 show an increase in thermo generation thanks to the reduction in imports and hydro
* Renewables include PV, wind, geothermal and biomass production

9
ELECTRICITY PRODUCTION MARKET SHARESNATIONAL INCUMBENT IS STILL THE MAIN PLAYER
Source: AEEGSI annual report 2016
The national incumbent is still the main player, with a 25.7% market share, rather stable (27% in 2014).
The first 6 operators produce nearly 50% of the Italian power generation.
EPH is a new entrant in the Italian market (it bought thermo plants from E.On).
A2A (including Edipower) is the fourth player.
37
,0%
25
,7%

10
INSTALLED CAPACITY VS. CONSUMPTIONOVERCAPACITY IS DECREASING
Due to overcapacity, investments in conventional thermoelectric plants have halted in the last years and some of the least
efficient plants were closed: in 2015, thermo capacity was 6 GW lower than in 2014 and further closures occurred in 2016.
Additional renewable capacity, subsidized by tariffs, has been installed; due to the reduction in the incentives, the increase in FV
and wind capacity slowed down.
The drop in electricity consumption and the simultaneous investment in new (mainly renewable) production plants caused the
recent system overcapacity. A reversion in this trend arised in 2016 and at the beginning of 2017, when the French nuclear
outages (combined to high French demand) caused a reduction in Italian imports , with a need for strong domestic production.
In July 2015 there was the historical peak in power demand (the previous was in December 2007). According to Assoelettrica,
the reserve margin in peak demand hours in 2015 was about 19%, compared to more than 45% in the previous two years.
Under-capacity Over-capacity
Source: Terna, Assoelettrica
Demandpeak (July):
59,3 GW
Demandpeak(Dic.):56,8,GW

11
ITALIAN RENEWABLE PRODUCTION MIXFV AND WIND REPRESENT 40% OF RENEWABLE PRODUCTION
Hydroelectric production share among renewable production has decreased, due to the increase in other sources of
production (mainly FV and wind). Moreover, in 2016 precipitations were very low.
The increase in FV and wind production has slowed down, due to lower incentives. Despite this, in 2016, the sum of PV and
wind production accounted for nearly 40% of the whole renewables production and nearly 15% of total Italian power
production.
Source: Terna (2016 data are preliminary)

12
DISTRIBUTED GENERATION IN 2014
Distributed Generation (DG) is the total amount of power plants connected to the distribution system.
In 2014 the energy gross production of DG amounted to 64.3 TWh, about 23% of national production,
through around 657,000 plants.
Nearly 40% of the energy comes from new renewable sources (solar and wind)
Source: AEEGSI
DG REPRESENTS ABOUT 23% OF NATIONAL PRODUCTION

13
RENEWABLE POWER INSTALLATIONS
In the last two years, FV and wind capacity growth slowed down due to the reduction in incentives.
The other renewables sources capacity is rather stable. Neverthless, renewable capacity is still on a
growing trend.
The annual cost for non FV renewable production incentives in 2016 was 5.58 billion euros
Source: Terna, GSE
• Wind: 9.2 GW in 2015 3.5 GW in 2008
• Solar: 18.9 GW in 2015 0.4 GW in 2008
RENEWABLES STILL ON A GROWING TREND (BUT SLOWER)
14
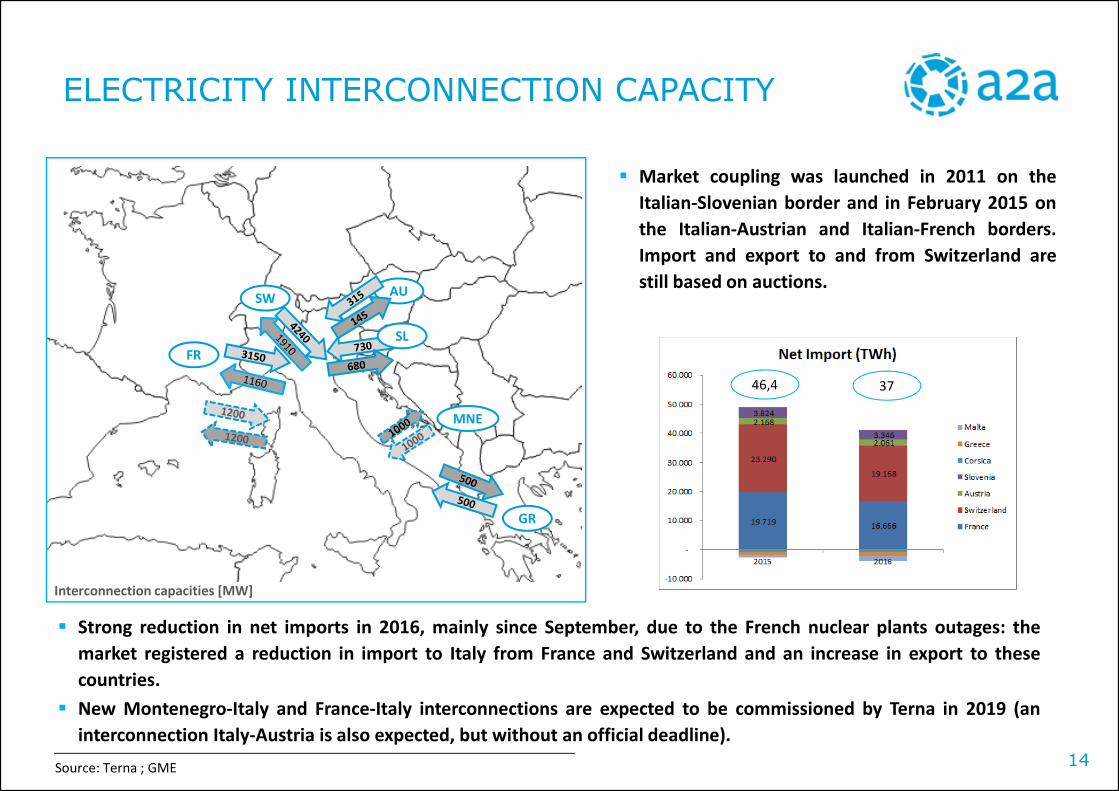
ELECTRICITY INTERCONNECTION CAPACITY
Strong reduction in net imports in 2016, mainly since September, due to the French nuclear plants outages: the
market registered a reduction in import to Italy from France and Switzerland and an increase in export to these
countries.
New Montenegro-Italy and France-Italy interconnections are expected to be commissioned by Terna in 2019 (an
interconnection Italy-Austria is also expected, but without an official deadline).
Market coupling was launched in 2011 on the
Italian-Slovenian border and in February 2015 on
the Italian-Austrian and Italian-French borders.
Import and export to and from Switzerland are
still based on auctions.
Source: Terna ; GME
3746,4
FR
SW AU
GR
Interconnection capacities [MW]
MNE
SL

15
GAS INTERCONNECTION CAPACITY
Interconnection and storage capacities [bcm/year]
NetherlandsNorway
Algeria
Interconnection capacities are allocated to
the market participants through explicit
auctions and through long-term contracts
The gas in the pipelines is normally in-
flowed (except Gorizia)
Source: MSE Statistics;Snam Rete Gas, Stogit, Edison Stoccaggio data
Lybia
Russia
LNGLNG
Griespass Gorizia
Mazara del Vallo
Gela
Panigaglia
Rovigo
Tarvisio
Storage
17
Livorno
64.9 bcmImport
volumes in2016 (est.)
LNG
16
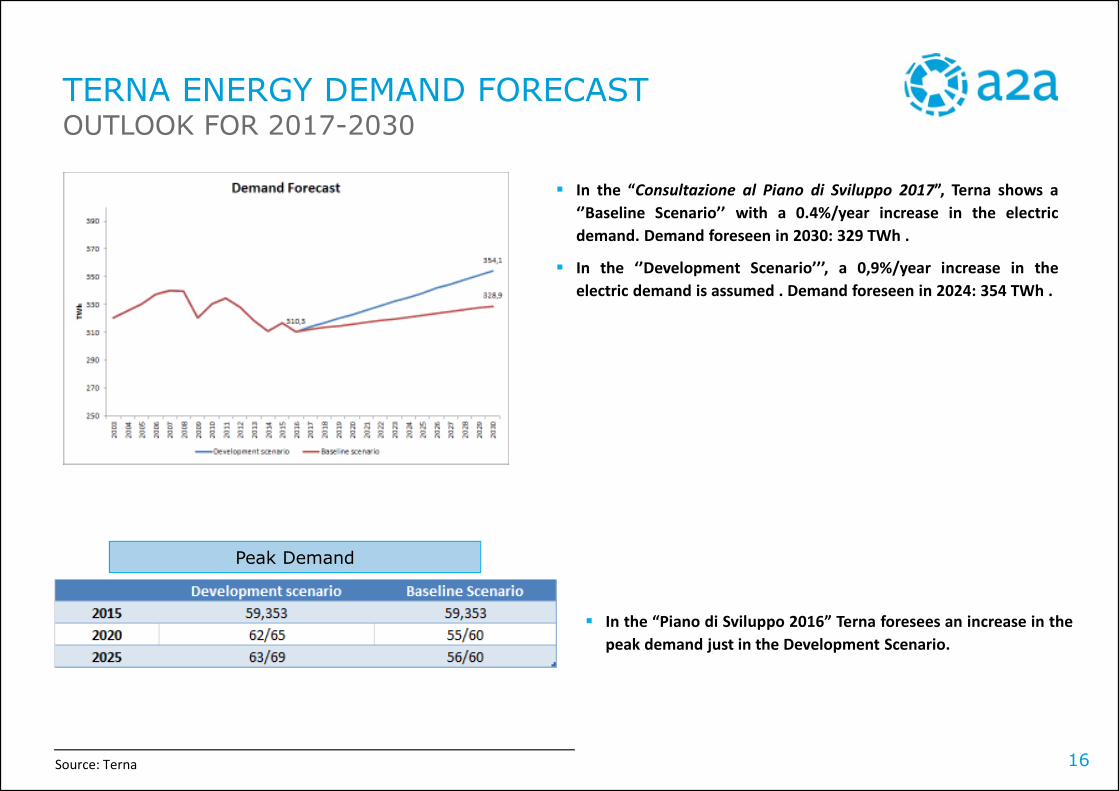
TERNA ENERGY DEMAND FORECAST
In the “Consultazione al Piano di Sviluppo 2017”, Terna shows a
‘’Baseline Scenario’’ with a 0.4%/year increase in the electric
demand. Demand foreseen in 2030: 329 TWh .
In the ‘’Development Scenario’’’, a 0,9%/year increase in the
electric demand is assumed . Demand foreseen in 2024: 354 TWh .
In the “Piano di Sviluppo 2016” Terna foresees an increase in the
peak demand just in the Development Scenario.
Source: Terna
Peak Demand
OUTLOOK FOR 2017-2030

17
Source: GSE
In December 2016, the latest auctions were held for the incentivation of renewable production from plants > 5 MW.
The results show a strong competition in the on-shore wind sector, where the MW offered were nearly 250% the MW
auctioned. In this auction, the winner plants bidded a 40% discounts compared to the basis incentive: than means a 66
€/MWh remuneration for the energy produced.
The other auctions (off-shore wind, bioenergy, geothermo, thermodynamic FV) registered one participant each, with a
capacity equal or lower than the auctioned one.
THE LATEST AUCTIONS FOR RENEWABLES INCENTIVES
STRONG COMPETITION IN THE WIND SECTOR

18
AGENDA
Wholesale
power market
02
Weather
03
Market prices
and margins
04
Main Featuersof the Italian
energy market
01

19
Terna (the Italian TSO) procures through the Ancillary Service Market (MSD) the resources for the balance of the power
system and to solve the inter-zonal congestions.
The MSD is cleared through a pay as bid algorithm. Terna is the central counterparty which accepts bids/offers from
market participants related to different reserve and balancing services.
The market is divided into:
• «ex-ante MSD»: 4 sub-sessions, where Terna trades energy and balancing services in order to releasecongestions and to create reserve margins (secondary and tertiary reserve);
• «Balancing Market» (MB): 5 sub-sessions, where Terna trades real-time balancing services to restoresecondary/tertiary reserve and to maintain the balance of the grid.
Each plant admitted to the market must provide bids and offers for each of the following services:
• Secondary Reserve;• Tertiary Reserve;• Start-up;• Shut-down;• Change of plant configuration.
In the last years, the needs for Upward services has
remained fairly stable, while Terna has increased the
volumes it has sold on the MSD markets (downward
volumes); this has reduced the delta among Downward and
Upward volumes after the peak observed in 2014.
ANCILLARY SERVICE POWER MARKET (MSD)

20
85%
POWER DISTRIBUTION SERVICE
Source: AEEGSI
The incumbent is still the main player in the
market.
Besides A2A and Acea, competition is spread
across several small players.
Most distributors are pretty small, with very local
distribution network and few customers.

21
GAS DISTRIBUTION SERVICE
Source: AEEGSI
The incumbent is still the main player in the
market.
Competition is spread across several small
players.
Most distributors are pretty small, with the largest
part within the 5 to 50 thousands customers served
range.
24
,3%
16
,7%
19
,8%

22
AGENDA
Wholesale
power market
02
Weather
03
Market prices
and margins
04
Main Featuersof the Italian
energy market
01

23
ITALIAN TEMPERATURES, PRECIPITATIONS AND WIND
Temperatures in 2016 in Italy were slightly lower than in 2015 (lower in Summer, higher in Winter), but higher than
the historical average.
Year 2016 is the third consecutive hottest year on record (since 1880), in terms of global temperatures.
Precipitations in 2016 were higher than in 2015, but lower than the historical average, especially in Q4.
Wind in 2016 was higher than in 2015.
Source: Bloomberg. Temperatures are the average temperature (usually of the high and low) that was observed between 7am and 7pm local. Precipitations include rainfall and the liquid equivalent of snowand sleet (measurement: Integer in 100th millimeters). Wind Speed is the average sustained winds which does not include wind gust. Bloomberg data are subject to ex-post adjustiments.
2016 TEMPERATURES LOWER THAN IN 2015 IN SUMMER

24
AGENDA
Wholesale
power market
02
Weather
03
Market prices
and margins
04
Main Featuersof the Italian
energy market
01

25
2016 and 2015 have similar shapes,
even if 2015 have higher values on
the negative side of the curve.
The difference among 2016-15 shape
and 2008’s is quite straightforward:
2008 shows a significantly higher
variance of price distribution around
the mean.
The difference between peak and
base load prices has strongly
decreased in the last years.
Peak Load prices decrease more than
base load prices over the time, driven
by strong increase in renewable
capacity, especially solar capacity that
produce mostly during peak hours.
SPOT PRICE HOURLY SHAPE
Delta Peak – Baseload (€/MWh)
PUN hourly shape
hours

26
FORWARD MARKETS FOR POWER
In 2015, Italian forward electricity volumes were 2 times those exchanged on spot markets. Forward volumes
have increased by some 150% y-o-y.
Volumes traded OTC in markets different from the MTE (Mercato a Termine, managed by the Italian NEMO
GME) have boomed in 2014 and in 2015.
Traded power volumes for Italy on spot and forward markets
Source: GME

27
Italian prices higher than European prices.
Trend of heavy decrease in prices since
2008 due to generation overcapacity.
After 2013, commodities prices decline and
RES installation helped easing pressure on
power prices
Marginal technology
EU AND ITALIAN POWER PRICES
CCGT is still the main marginal
technology.
Increase in the marginality of
import/market coupling, due to the
higher French and Swiss prices in the
second part of 2016.
The difference between coal plants and
CCGTs prices (in the hours in which they
are marginal) narrowed, due to the
increased gas competitiveness.

28
CCT = Zonal Price – PUN
• In 2016 we observed a continuation of the declining trend of Sicily CCT, which declined steadily
from the peak of 2013-2014.
• Overall, we can observe a clear reduction of prices variation in 2016 if compared to previous years
Source: Gestore Mercato Elettrico (GME), Terna
ITALIAN ELECTRICITY CONGESTION COST BY ZONE (CCT)
€/MWh 2013 2014 2015 2016
North -1,4 -1,7 0,4 0,0
C-north -1,9 -2,5 -0,9 -0,2
C-South -3,7 -3,2 -1,5 -1,2
South -5,8 -4,7 -2,9 -2,4
Sicily 29,0 28,8 5,2 4,8
Sardinia -1,5 0,1 -1,2 -1,2
CCT
29
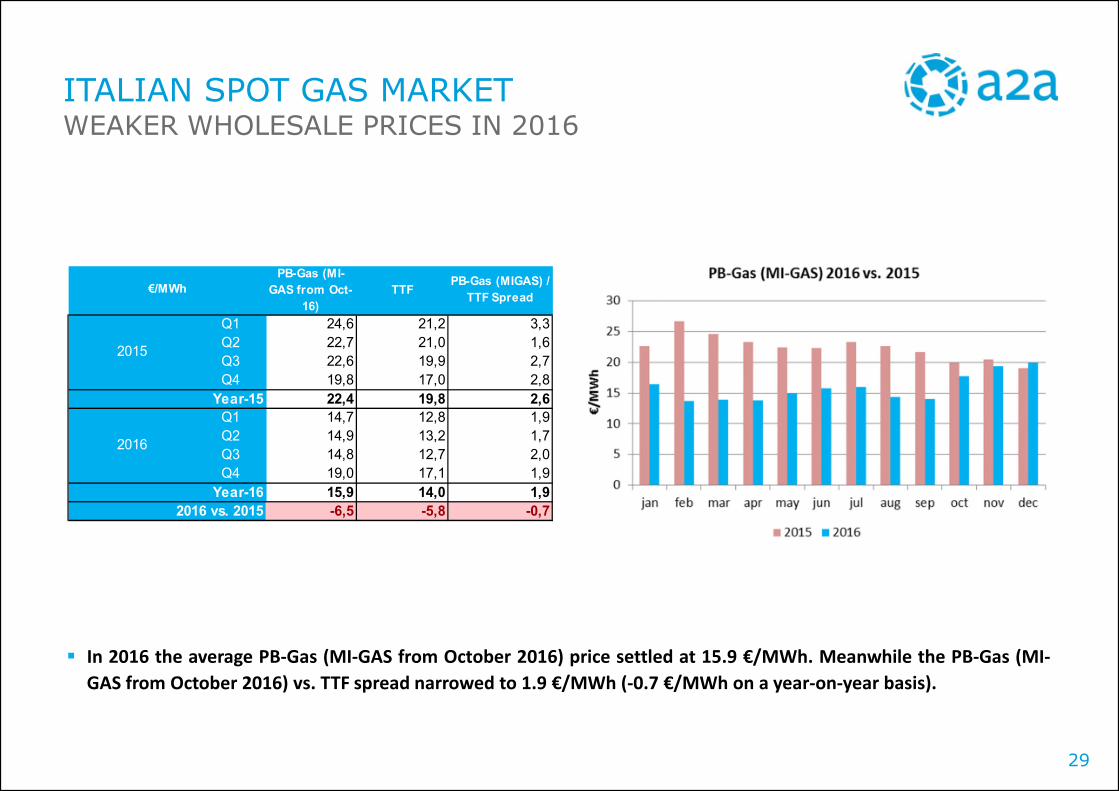
ITALIAN SPOT GAS MARKETWEAKER WHOLESALE PRICES IN 2016
In 2016 the average PB-Gas (MI-GAS from October 2016) price settled at 15.9 €/MWh. Meanwhile the PB-Gas (MI-
GAS from October 2016) vs. TTF spread narrowed to 1.9 €/MWh (-0.7 €/MWh on a year-on-year basis).
PB-Gas (MI-
GAS from Oct-
16)
TTFPB-Gas (MIGAS) /
TTF Spread
Q1 24,6 21,2 3,3
Q2 22,7 21,0 1,6
Q3 22,6 19,9 2,7
Q4 19,8 17,0 2,8
Year-15 22,4 19,8 2,6
Q1 14,7 12,8 1,9
Q2 14,9 13,2 1,7
Q3 14,8 12,7 2,0
Q4 19,0 17,1 1,9
Year-16 15,9 14,0 1,9
2016 vs. 2015 -6,5 -5,8 -0,7
€/MWh
2015
2016

30
EUA ETS SPOT MARKET PRICE
In 2015, the bullish trend was largely driven by the sentiment linked to the COP21 in December, reaching more than 8.5
€/ton that month.
Once that effect vanished (with no immediate implications), the price dipped to under 5 €/ton at the beginning of
2016. Prices then rebounded to 6.8 €/ton, and sharply dropped after the Brexit referendum (23rd June). In the second
half of 2016, prices moved in a range from slightly under 4 €/ton to 6.5 €/ton.
STRONG DECLINES AT THE END OF 2015 AND AFTER BREXITREFERENDUM

31
CLEAN SPARK AND DARK SPREAD
Increase in CCGTs’ margin in 2016, due to lower gas prices: CPSS were higher in 2015 only in Summer, due to
the high temperatures. In both years, CSS showed an increase during the last months.
In 2016, CDS registered a decrease, due to lower power prices.
Clean Spark Spread: PUN (BL/PL) – gas PSV cost (eff. 51%) – EUA cost – CV cost (up to 2014)- variable transport costsClean Dark Spread PUN BL –coal cost (API2 + spread MED + variable transport costs - eff. 35%) – EUA cost – CV cost (up to 2014)
INCREASE IN CSS, DECLINE IN CDS

ITALIAN ENERGY MARKET OVERVIEW
APPENDIX | MARKET ANALYSIS & PRICE FORECASTING
March 2017

33
BIOGAS AND BIOMETHANE IN ITALYPERSPECTIVES
Biogas is a naturally occurring gas which is produced by the anaerobic digestion of organic matter (agricultural
residues, energy crops, sewage sludge, separated household waste and organic industrial waste)
Biomethane can be either upgraded biogas from anaerobic digestion or cleaned syngas from gasification of biomass
Italy represents the 2nd Country in Europe for the number of biogas production plants installed (after Germany,
European Biogas Association data)
The Italian Government, in its public consultation launched on the 14/12/2016 regarding the Decree Draft on
biomethane use, fixed a national target for biomethane production at 1.1 bcm/y by 2022.
17,240 biogas plants in Europe (31/12/2014)
Total installed capacity of 8,293 Mwel
(European Biogas Association data)
367 biomethane AD plants in Europe (31/12/2014)
Total upgrading capacity 310 thousands cm/hof raw biogas
(European Biogas Association data)

34
ELECTRIC CARS SALES DEVELOPMENT IN ITALY
According to the E-Mobility Report by Milan Politecnico, Italy represents only 1 % of electric cars sales in Europe, with
only around 8.000 electric cars sold since 2012.
In Italy, electric cars sales have a 0.1% market share, one of the lowest in Europe.
The potential growth should lead to a number of electric cars in Italy between 70,000 and 130,000 in 2020, with a very
limited impact on power demand (between 150 and 280 GWh/y)
Source: E-Mobility report, politecnico di Milano, January 2017.
Total:around8,000
Total:around8,000