Embed Size (px)
Citation preview
Italian Economic Outlook and the SEZs as investment opportunity
Massimo DEANDREIS General Manager - SRM
Beijing, 28th October 2019
2
In 2016 we launched the proposal to establish SEZs in Southern Italian ports with a strong documentation on the impact that Free Zones have already had in some countries. In 2017 the Italian Government adopted a specific national Law (in accordance with the EU) to establish SEZs…
SRM Profile We are an Economic Research Center belonging to
Intesa Sanpaolo Banking Group We are based in Naples and our studies have a special focus on:
Italian Regional Economy, especially Southern Italian economy and the Mediterranean region Maritime Economy, ports and logistic sectors Energy and infrastructure

3 Outline
3
Southern Italian Economy: not only tourism but also a structured industry in key sectors
Italian ports are evolving and gaining competitiveness: towards a new model of port
Italian Special Economic Zones: a new opportunity for investment
Why is a partnership with China strategic?
How Intesa Sanpaolo Bank is supporting the attractiveness of SEZs to investors
Why entering in the Mediterranean Area means investing in a strategic geo-economic location?
4
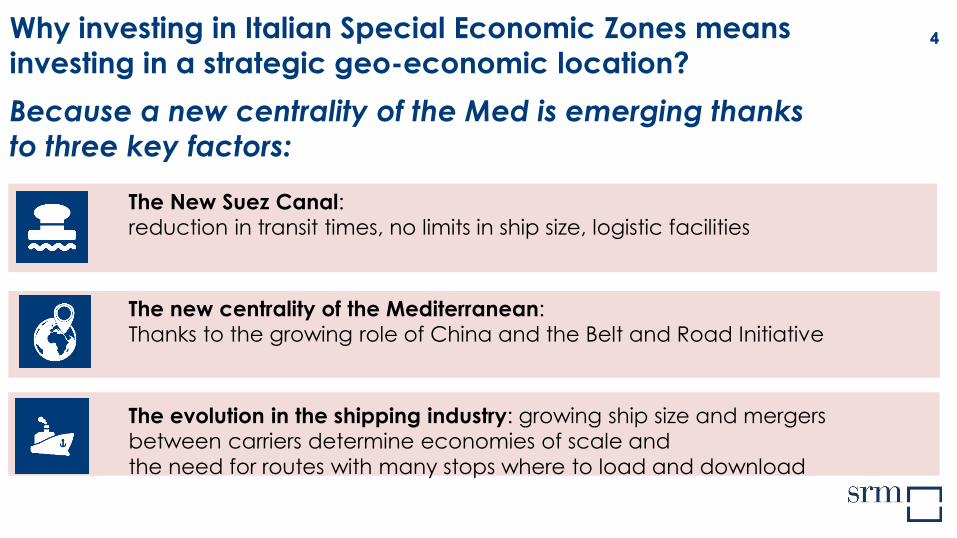
The New Suez Canal: reduction in transit times, no limits in ship size, logistic facilities
The new centrality of the Mediterranean: Thanks to the growing role of China and the Belt and Road Initiative
The evolution in the shipping industry: growing ship size and mergers between carriers determine economies of scale and the need for routes with many stops where to load and download
Why investing in Italian Special Economic Zones means investing in a strategic geo-economic location?
Because a new centrality of the Med is emerging thanks to three key factors:
4

5
World Seaborne trade 2019 12 bn tonnes
2019-2023: +3.8% average per year
Source: SRM su Unctad, Drewry Shipping Co., Banchero Costa, IHS Markit
+2.6%
+2% +1.4%
CONTAINER DRY BULK OIL
FORECASTS 2019:
Let’s start with the global maritime trade scenario
80% of global trade by
volume and 70%
by value are seaborne trade
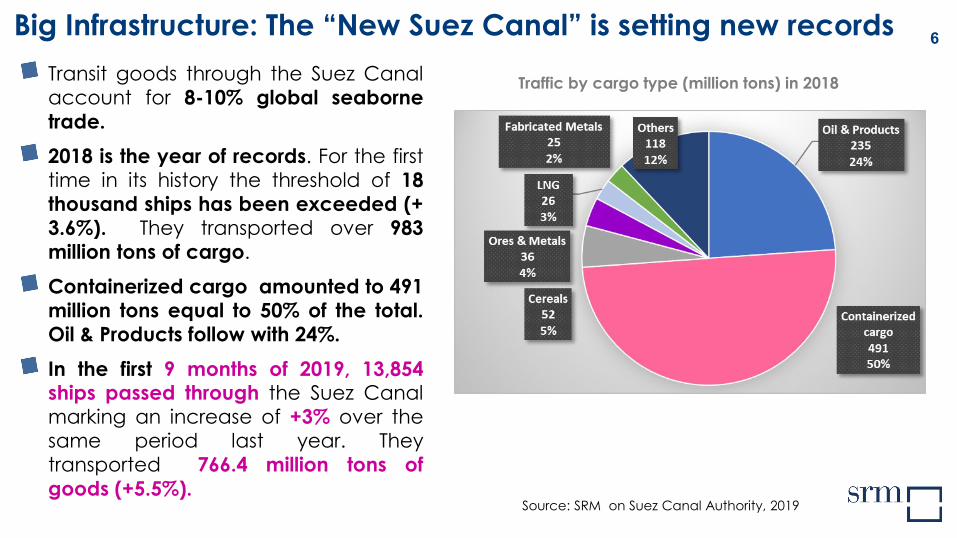
6 Big Infrastructure: The “New Suez Canal” is setting new records Transit goods through the Suez Canal account for 8-10% global seaborne trade. 2018 is the year of records. For the first time in its history the threshold of 18 thousand ships has been exceeded (+ 3.6%). They transported over 983 million tons of cargo.
Containerized cargo amounted to 491 million tons equal to 50% of the total. Oil & Products follow with 24%. In the first 9 months of 2019, 13,854 ships passed through the Suez Canal marking an increase of +3% over the same period last year. They transported 766.4 million tons of goods (+5.5%).
Source: SRM on Suez Canal Authority, 2019
Traffic by cargo type (million tons) in 2018

7
WEST, S.W. MED 48.0
EAST, S.E. MED 86.0
NORTH MED 62.5
BLACK SEA 89.4
WEST, S.W. MED 41.3
EAST, S.E. MED 110.6
BLACK SEA 3.7
NORTH MED 97.6
TOT. SOUTHBOUND 524.6 (+9.8%) TOT. NORTHBOUND 458.8 (+6.6%)
New Suez Canal and the MED ports (2018 on 2014)
In both directions, the Med ports represent 55% of the total.
Million tonnes and Var % on 2014 Source: SRM on Suez Canal Authority, 2019
+40%
-21%
+14%
+13%
+7%
+25%
-13%
+2%
7

8
27% 41%
53% 46%
20% 13%
1995 2018
Europe-Far East Transpacific Transatlantic
New Centrality of the Mediterranean: The growth of shares on the Europe-Far East Route
In 2018, the Europe-Far East and the Transpacific were by far the two biggest trade routes, accounting to 25 and 28 mln TEUs of traffic respectively.
Europe-Far East: from 27% in 1995 to 41% in 2018.
As a result of this growth, the Mediterranean recovers its centrality
Source: SRM on Unctad, 2018
Estimated containerized cargo flows on major East–West container trade routes, 1995–2018 (% TEU)
8

9 Entering the Mediterranean means to meet European, North Africa and the Middle East markets with an option to reach the East Coast of the US
VALENCIA PIRAEUS
ROTTERDAM
ABU DHABI
AMBARLI
SUEZ CANAL
ASHDOD
HAIFA
MARSEILLE
MALTA
ANTWERP
ZEEBRUGGE HAMBURG
BILBAO
9
Source: SRM
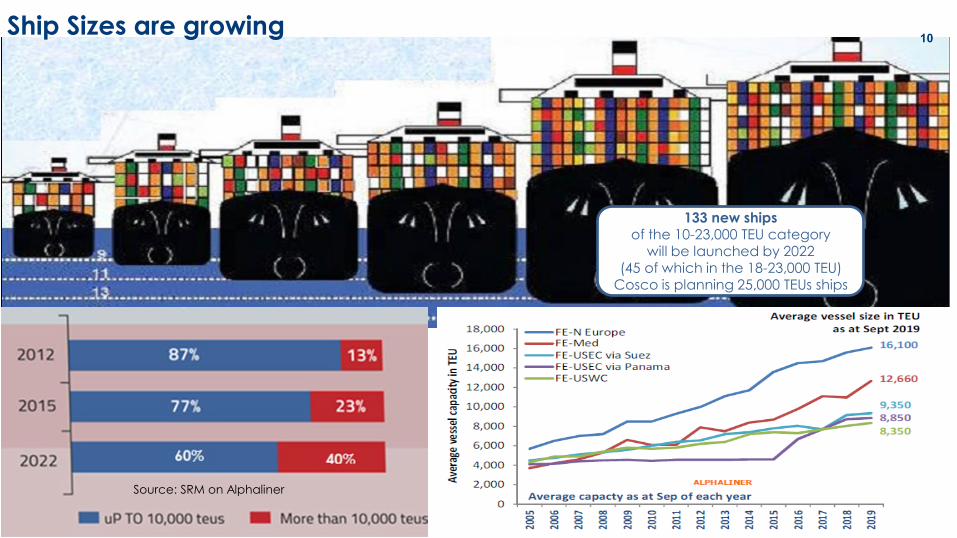
10 Ship Sizes are growing
Source: SRM on Alphaliner
133 new ships of the 10-23,000 TEU category
will be launched by 2022 (45 of which in the 18-23,000 TEU)
Cosco is planning 25,000 TEUs ships

11 Let’s sum-up the most important data on the shipping sector in the Mediterranean
Source: SRM on Eurostat, Suez canal Authority, ISTAT, Port Authorities
11 11
27% WORLD’S
CONTAINER LINER
SERVICES
19 PORTS THROUGHPUT >1 MLN TEUs
+514% GROWTH OF CONTAINER
TRAFFIC SINCE 1995
614 mln tonnes SHORT SEA SHIPPING 983 mln
tonnes SUEZ CARGO
TRAFFIC
83% SHARE OF
SEABORNE TRADE BETWEEN ITALY AND THE MED
20% GLOBAL
SHIPPING TRAFFIC
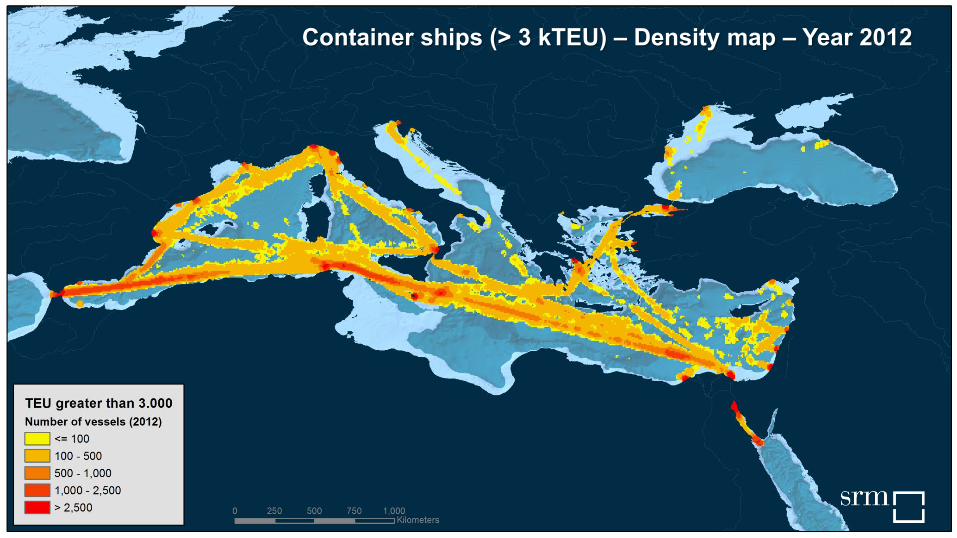
Container ships (> 3 kTEU) – Density map – Year 2012

Container ships (> 3 kTEU) – Density map – Year 2018

Italy as a logistic and energetic bridge between Europe, the Mediterranean and Asia
14 Port Network Authorities, 2 port Authorities and at least 5 strategic ports
Trade leader with Med and the BRI
Strategic gas pipelines from North Africa and Asia
Italy: a pivotal country in the middle of the Mediterranean
TRIESTE
GENOA
NAPLES BARI
TARANTO
14

15 Italy is one of the biggest economies in Europe
3rd for GDP (€1.7 trillion) in the EU*
2nd for manufacturing value added in the EU (V.A. over €260 bn)
4th for total export (over €460 bn) with almost €100 bn surplus in the manufacturing trade balance (2nd EU Country after Germany)
1st in the EU for certified quality products (863 out of 3356 in the EU = 26%)
In Italy, almost 40% of total trade is seaborne, equal to €254 bn. This percentage reaches 65% in Southern Italy.
* EU Monetary Union
Italy ranked…
The value of the sea for the industry…

16 The Italian Ports are evolving: the New Law 16
Reorganization of the ports into strategic decision centers, from 24 Port Authorities to 14 Port Network Authorities and 2 Port Authorities. A new Governance considerably slimmed down, compared to the past with a key role of light Management Committee. Simplification - ongoing process in order to have two “single windows”: o For Customs & Controls under the
coordination of the National Custom Agency;
o To coordinate all administrative and authorization duties;
Central coordination under Ministry of Infrastructure and Transport (MIT).
Source: SRM on Ministry of Infrastructures and Transport
17
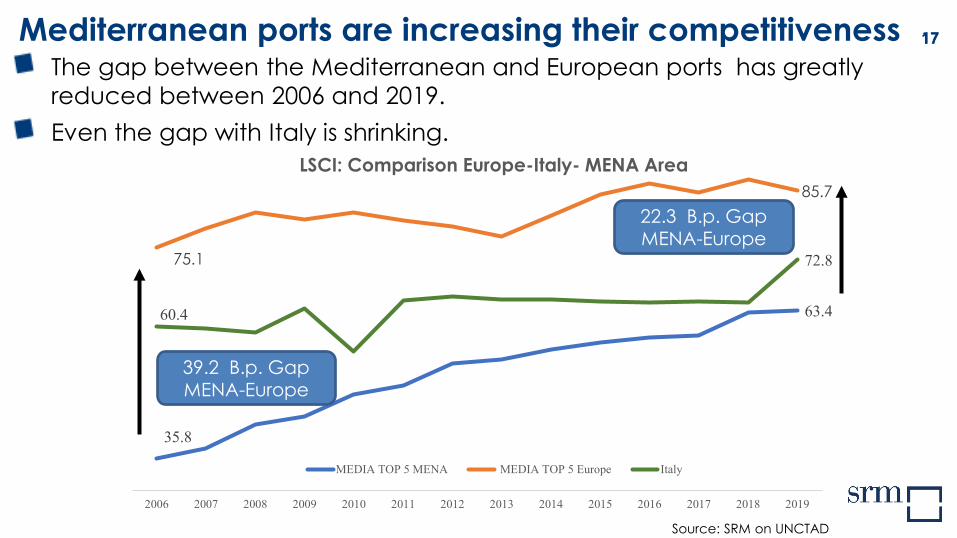
The gap between the Mediterranean and European ports has greatly reduced between 2006 and 2019. Even the gap with Italy is shrinking.
17
Source: SRM on UNCTAD
Mediterranean ports are increasing their competitiveness
35.8
63.4
75.1
85.7
60.4
72.8
2006 2007 2008 2009 2010 2011 2012 2013 2014 2015 2016 2017 2018 2019
LSCI: Comparison Europe-Italy- MENA Area
MEDIA TOP 5 MENA MEDIA TOP 5 Europe Italy
39.2 B.p. Gap MENA-Europe
22.3 B.p. Gap MENA-Europe

18
Doing Business: Trading across borders
2007 2018
Rank: 110 1
Customs
Infrastructure
International Shipments
Logistics competence
Tracking & Tracing
Timeliness
Score: 3.47
3.85
3.51
3.66
3.85
4.13
3.19
3.52
3.57
3.63
3.66
3.93
LSCI Rank: 13 14
LPI: Rank: 22 19
…and Italian port and logistic system improve its ranking
In 2019
19
TRIESTE
GENOA
NAPLES
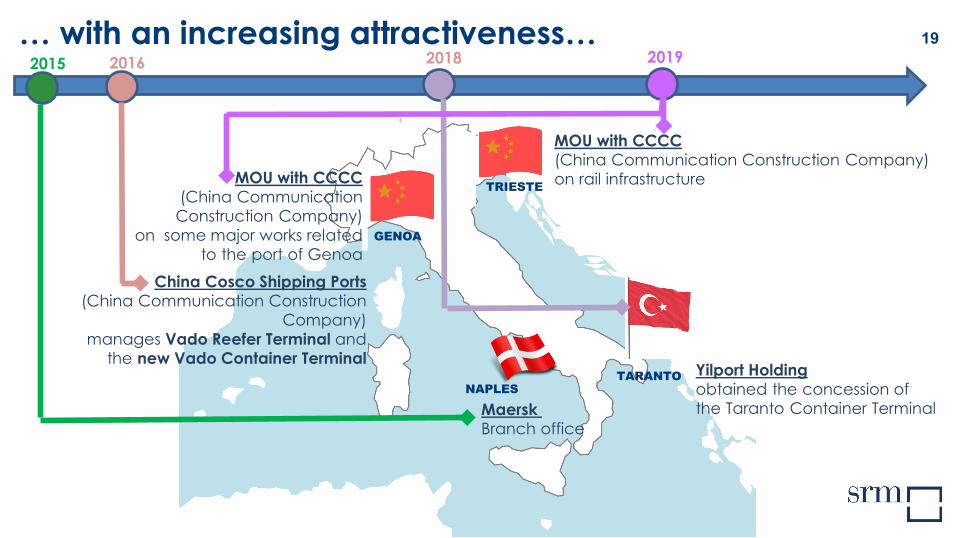
… with an increasing attractiveness…
TARANTO
MOU with CCCC (China Communication Construction Company) on rail infrastructure MOU with CCCC
(China Communication Construction Company)
on some major works related to the port of Genoa
China Cosco Shipping Ports (China Communication Construction
Company) manages Vado Reefer Terminal and
the new Vado Container Terminal Yilport Holding obtained the concession of the Taranto Container Terminal Maersk
Branch office
2015 2016 2018 2019
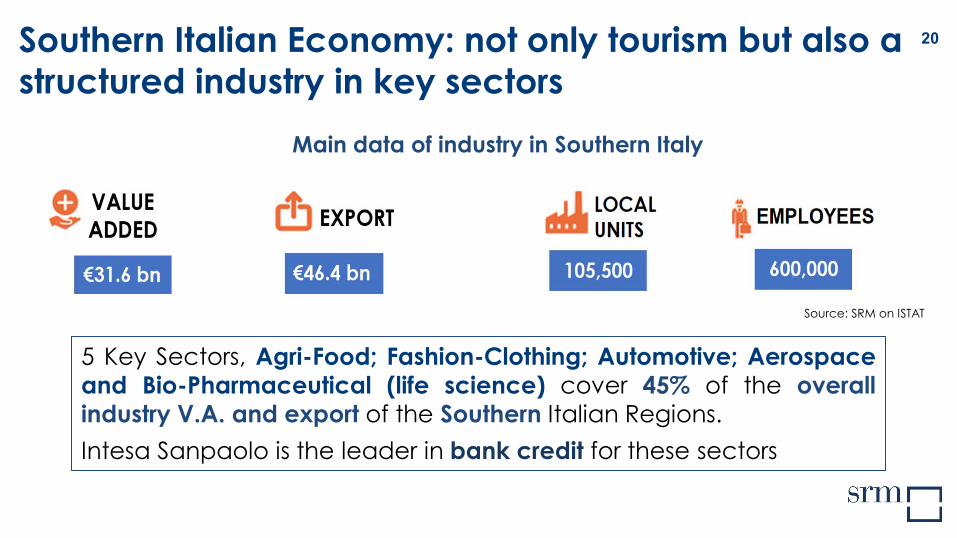
20 Southern Italian Economy: not only tourism but also a structured industry in key sectors
Main data of industry in Southern Italy
5 Key Sectors, Agri-Food; Fashion-Clothing; Automotive; Aerospace and Bio-Pharmaceutical (life science) cover 45% of the overall industry V.A. and export of the Southern Italian Regions. Intesa Sanpaolo is the leader in bank credit for these sectors
Source: SRM on ISTAT

Source: Istat, Movimprese, Prometeia. 2018 data
GDP: almost €99 bn
Enterprises: 488,798 units
Trade: almost €24 bn
Main sectors of export: automotive& aerospace, food &beverage, pharma
Patent applications per million inhabitants: 14.0 (Naples)
Tourism: 21.7 mln overnight stays
Recognised capabilities: • Apple (ICT) • Technological pole of San Giovanni a Teduccio (University of Naples Federico II) • IMAST - Italian technological district for the engineering of polymeric and composite materials • Digital Hub 4.0 • CIRA Italian Aerospace Research Centre • Ceinge -advanced biotechnology applied to Human Health
Naples-Salerno SEZ Area 21
Naples
22
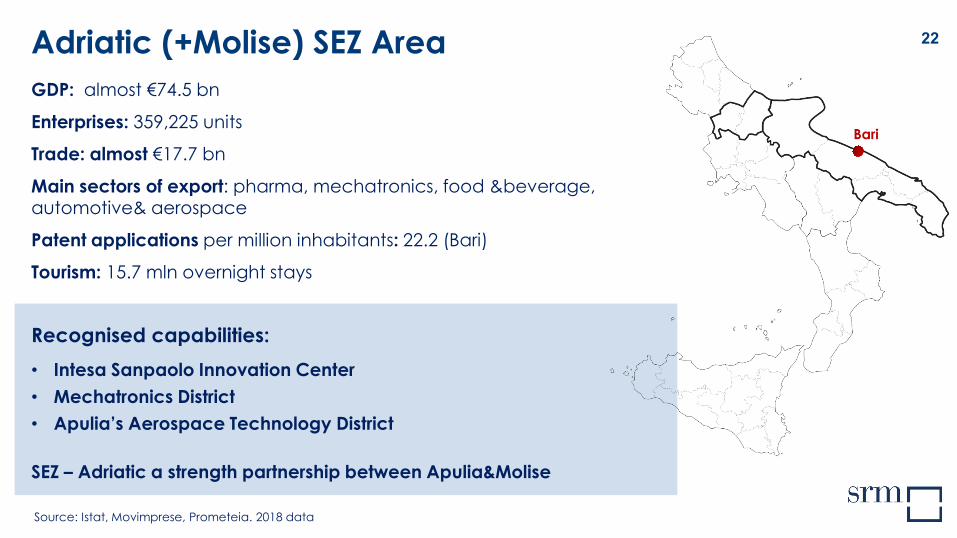
Source: Istat, Movimprese, Prometeia. 2018 data
GDP: almost €74.5 bn
Enterprises: 359,225 units
Trade: almost €17.7 bn
Main sectors of export: pharma, mechatronics, food &beverage, automotive& aerospace
Patent applications per million inhabitants: 22.2 (Bari)
Tourism: 15.7 mln overnight stays
Recognised capabilities: • Intesa Sanpaolo Innovation Center • Mechatronics District • Apulia’s Aerospace Technology District SEZ – Adriatic a strength partnership between Apulia&Molise
Adriatic (+Molise) SEZ Area
Bari

23
Source: Istat, Movimprese, Prometeia. 2018 data
GDP: almost €80.8 bn
Enterprises: 381,215 units
Trade: €23 bn
Main sectors of export: metal products, automotive& aerospace, electronic equipment Tourism: 17.8 mln overnight stays Recognised capabilities: Here there is the Second largest European steel plant in Europe (acquired by Arcelor-Mittal in Nov 2018)
SEZ Ionica- a strength partnership between Taranto&Basilicata: The region with the highest level of crude oil production in Italy (with a volume amounting to approximately 3.7 mln tonnes in 2018).
Big players of oil sector: ENI, Total
Ionica (+Basilicata) SEZ Area
Taranto

Specific tax credit for the purchase of instrumental assets: UP TO €50 M FOR EACH INVESTMENT with potential additional regional incentives
Italian Free Zones: SEZ basic criteria for Naples, Bari & Taranto
SEZ only in the Southern Italian ports (l. 123/17)
Companies: import-export oriented - by sea
Strategic sectors: Food & B., Aeronautical, Mechanical, Automotive, Fashion&Clothing, Energy, Bio-Pharma
Special agreement with Intesa Sanpaolo Bank
Duration of activity in the SEZ: at least 7 years, while the lifetime of a SEZ amounts to 7 years (+7 years)
Tax discounts and reduction of bureaucracy NAPLES SALERNO
ADRIATIC (+ MOLISE)
IONICA (+BASILICATA)
SEZ
INTERREGIONAL SEZ
Total government allocation: €506 M
24
A new online procedure for tax
credit: https://www.agenziaentrate.gov.it/portal
e/web/guest/-/provvedimento-del-
09-08-2019
legal and economic details in the paper delivered

25 Southern Italy: expected SEZs’ benefits
EXPORT: in the SEZs export is 40% higher than that generated in the territory. INVESTMENTS: Public resources have a 1:3 multiplier effect; each euro of tax credit activates 2 Euros of private capital.
INTERNATIONAL TRAFFIC: an analysis has shown an average annual increase in container traffic of 8.4% (in Italy, this traffic has shown an average annual increase of 1.1% in the last 10 years).
The GDP (almost €200 bn) of the 4 regions as a whole is approximately equal to the GDP of a Medium size European country such as Greece or Finland
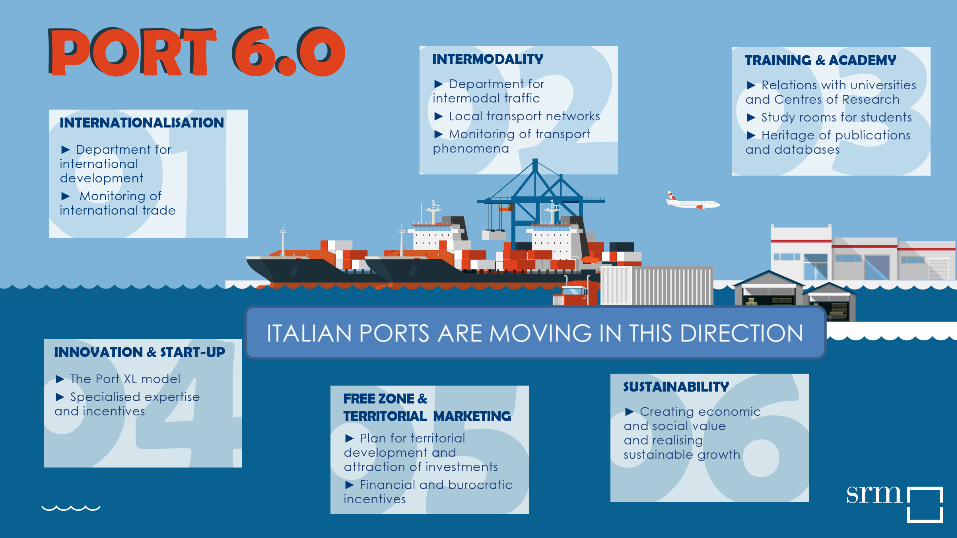
ITALIAN PORTS ARE MOVING IN THIS DIRECTION

27
Intesa Sanpaolo established a specific credit facility of €1.5 bn to support new investments inside the Special Economic Zones
Intesa Sanpaolo is organising an international ROADSHOW for the Southern Italian Regions SEZs … after Dubai now we are in Beijing…
What is Intesa Sanpaolo Bank doing to support SEZs investment attractiveness?
Intesa Sanpaolo opened a Desk devoted to supporting companies who want to invest in the 3 SEZs of Campania, Adriatic and Ionica
… because Intesa Sanpaolo is the leading Italian bank


![Has SEZs in India Lost Its Sheen (1)[1]](https://img.pdfslide.us/doc/110x75/577d28ec1a28ab4e1ea58e9d/has-sezs-in-india-lost-its-sheen-11.jpg)