Embed Size (px)
Citation preview
Please see addendum of this report for important disclosures.
ITA Economics PanelAerospace & Defense: What Lies Ahead?
Gautam [email protected]
September 15, 2009
1
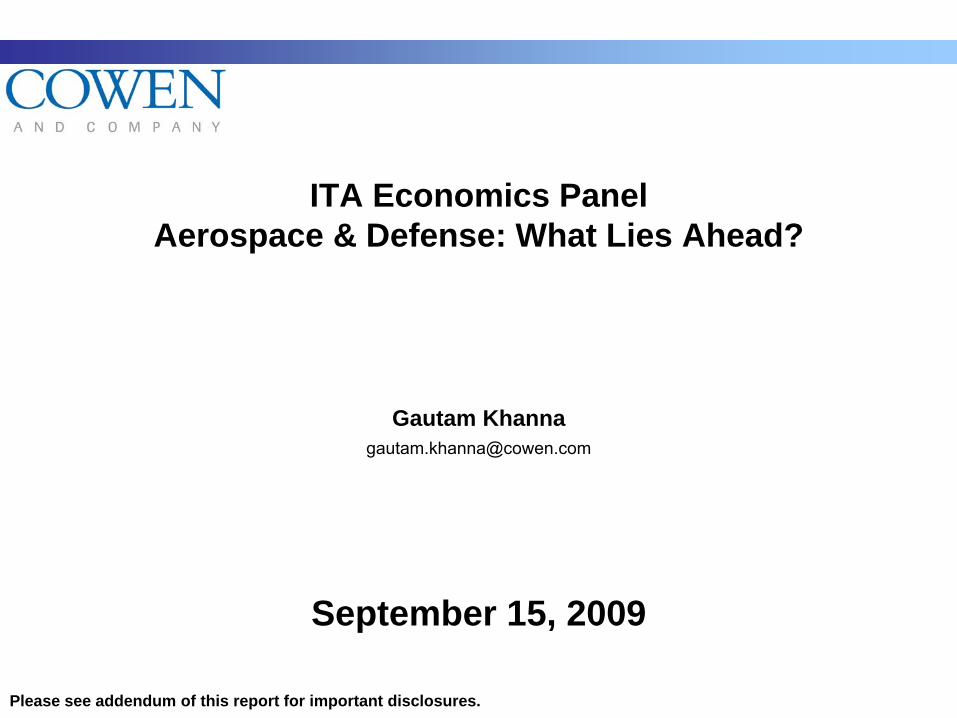
Commercial Air Transport Indicators Are Still Negative► RPM Growth Is Negative – Off 8-9% YTD; ASM Still Catching Up► North American LF near record levels as airlines slash ticket prices; Prices off 14%+
Source: ATA, AEA, AAPA, IATA
2
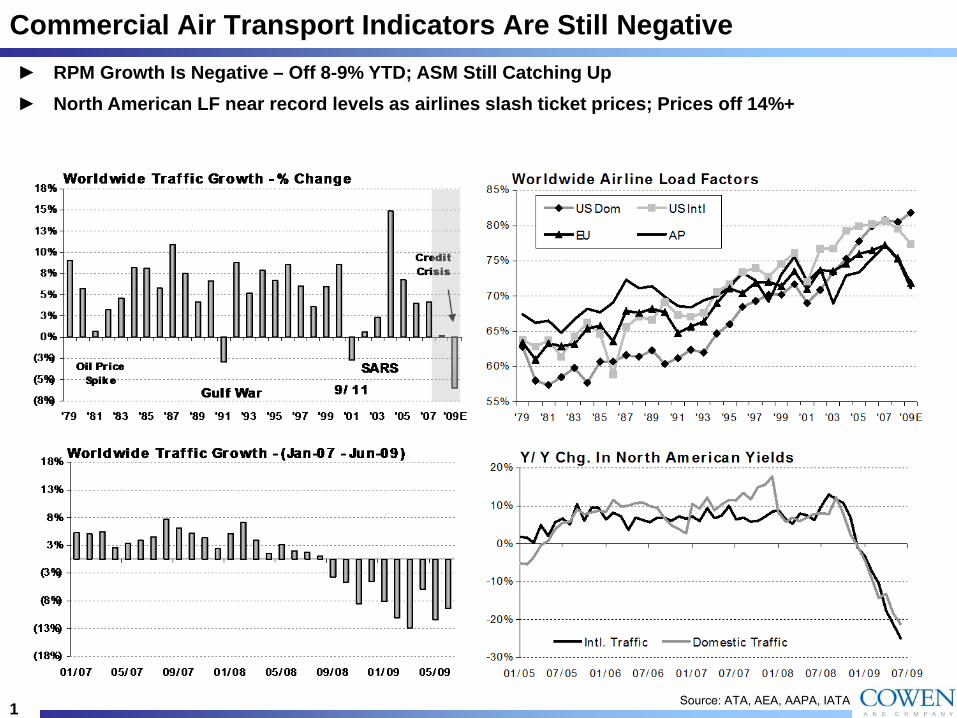
Commercial Air Transport Indicators Are Still Negative
► Here is the raw data
Source: ATA, AEA, AAPA, Amstat, Boeing , Airbus
3
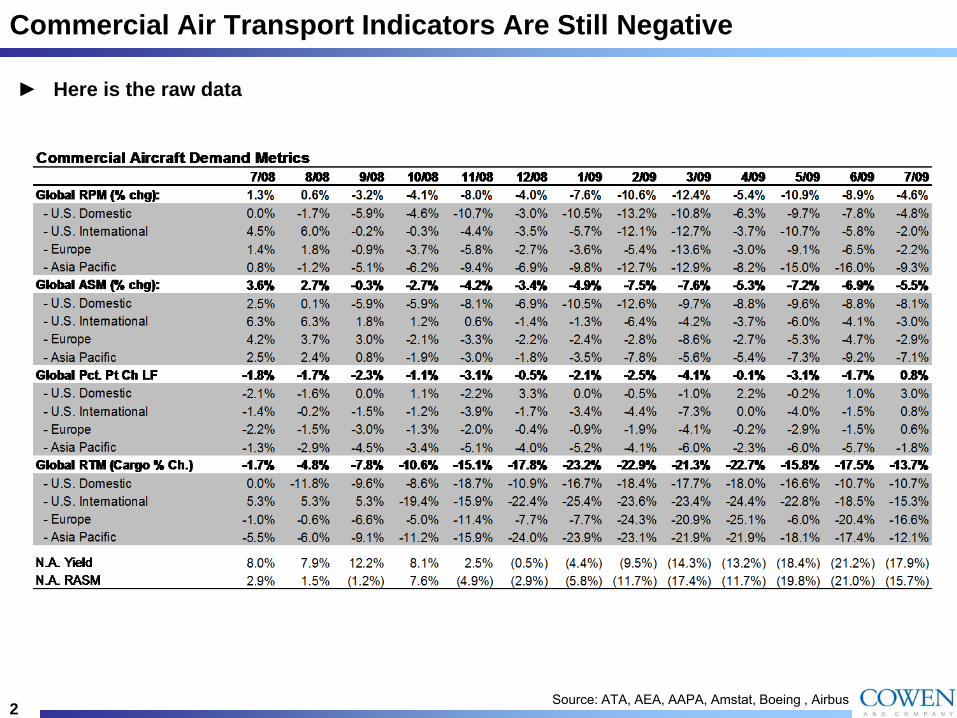
Parked Aircraft A Growing Overhang
► Stored New Aircraft Have Doubled To 2%+ of Fleet► Older Planes Stored @ 21% Of Fleet – May Return Given Oil Price Drop
Source: Ascend
4
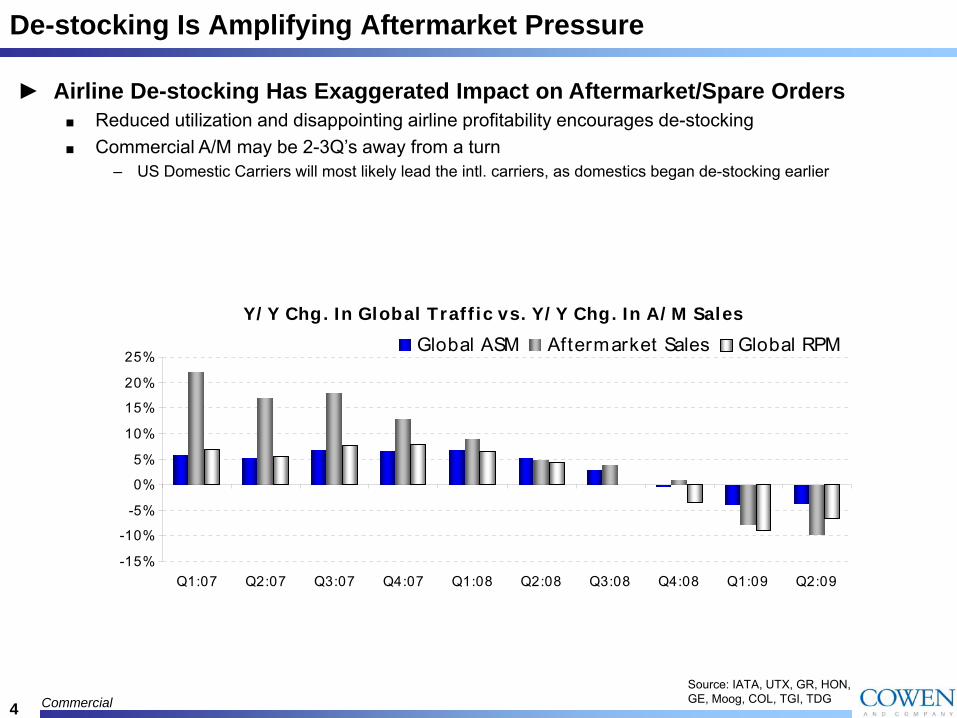
De-stocking Is Amplifying Aftermarket Pressure
Commercial
► Airline De-stocking Has Exaggerated Impact on Aftermarket/Spare Orders■ Reduced utilization and disappointing airline profitability encourages de-stocking■ Commercial A/M may be 2-3Q’s away from a turn
– US Domestic Carriers will most likely lead the intl. carriers, as domestics began de-stocking earlier
Source: IATA, UTX, GR, HON, GE, Moog, COL, TGI, TDG
Y/ Y Chg. In Global Traff ic vs. Y/ Y Chg. In A/ M Sales
-15%
-10%
-5%
0%
5%
10%
15%
20%
25%
Q1:07 Q2:07 Q3:07 Q4:07 Q1:08 Q2:08 Q3:08 Q4:08 Q1:09 Q2:09
Global ASM Aftermarket Sales Global RPM
5
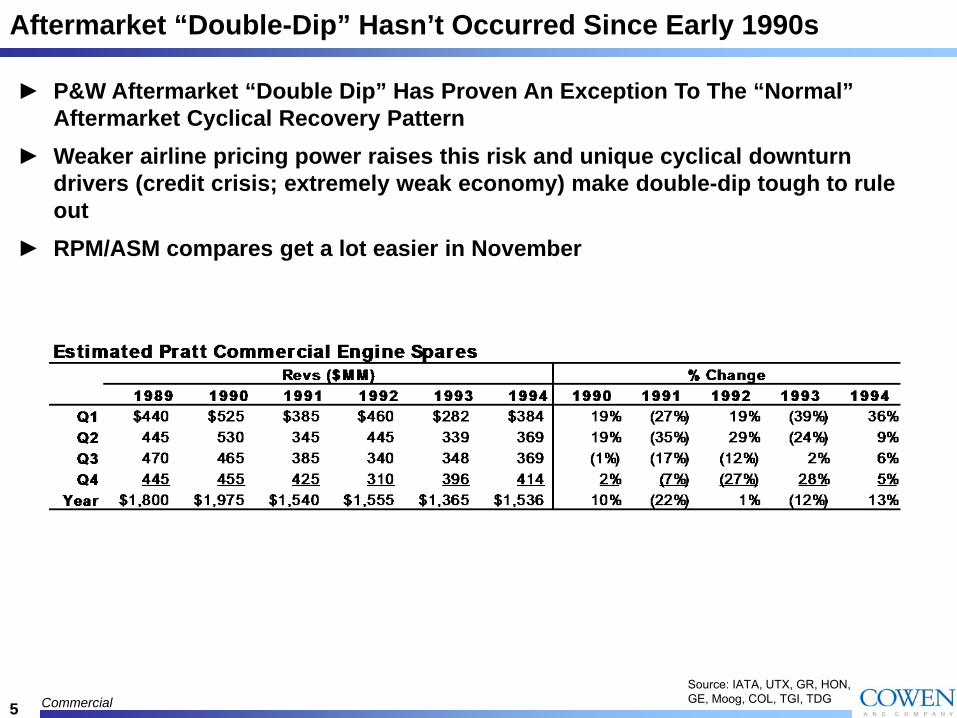
Aftermarket “Double-Dip” Hasn’t Occurred Since Early 1990s
Commercial
► P&W Aftermarket “Double Dip” Has Proven An Exception To The “Normal” Aftermarket Cyclical Recovery Pattern
► Weaker airline pricing power raises this risk and unique cyclical downturn drivers (credit crisis; extremely weak economy) make double-dip tough to rule out
► RPM/ASM compares get a lot easier in November
Source: IATA, UTX, GR, HON, GE, Moog, COL, TGI, TDG
6
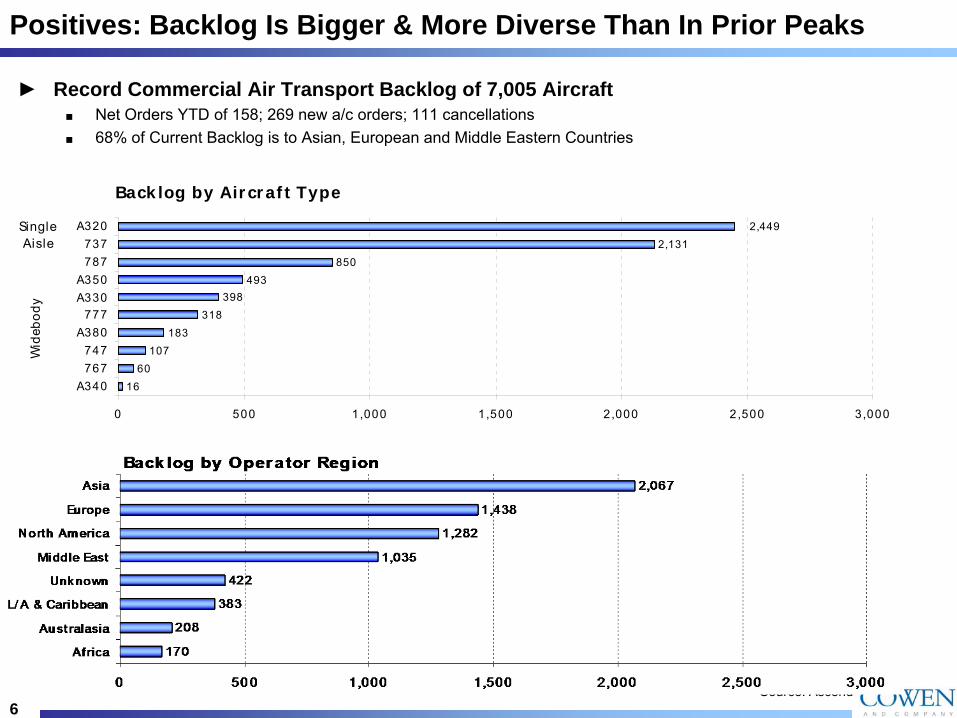
Positives: Backlog Is Bigger & More Diverse Than In Prior Peaks
► Record Commercial Air Transport Backlog of 7,005 Aircraft■ Net Orders YTD of 158; 269 new a/c orders; 111 cancellations■ 68% of Current Backlog is to Asian, European and Middle Eastern Countries
Source: Ascend
1660
107183
318398
493850
2,1312,449
0 500 1,000 1,500 2,000 2,500 3,000
A340767747
A380777
A330A350
787737
A320Single Aisle
Wid
ebod
y
Back log by Air cr af t Type

7
Risk Area: Backlog Vulnerability Is Higher On Single Aisles
► Airbus more exposed to higher risk of cancellations/deferrals over long-term► Single aisle aircraft have greatest risk of cancellations/deferrals
■ Higher risk aircraft = LCC, Up-start carriers, &/or in bankruptcy
Source: Ascend
8
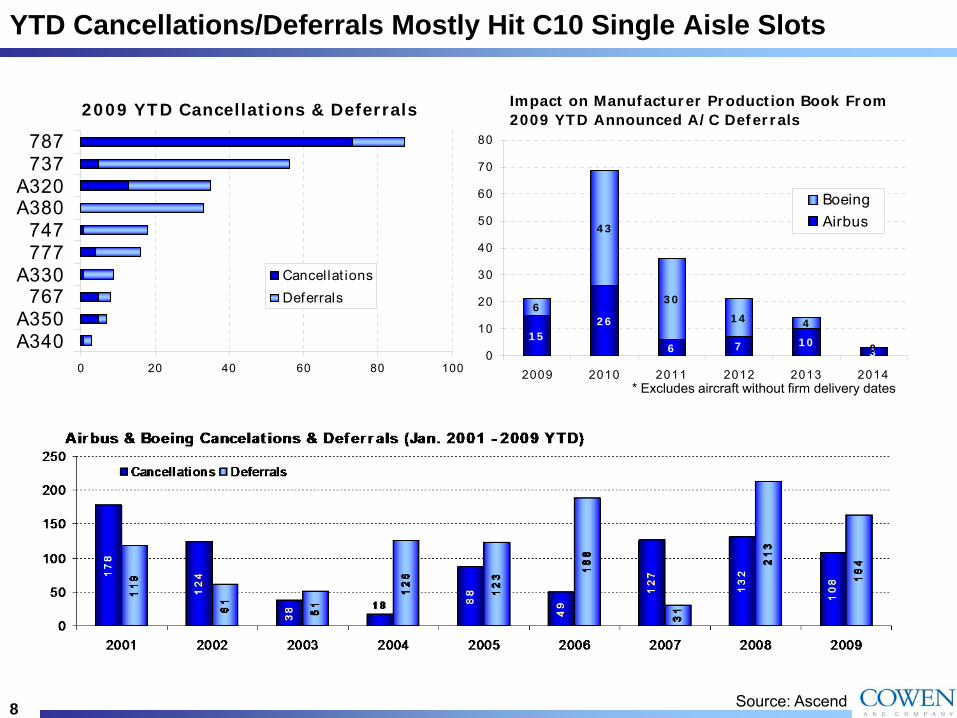
YTD Cancellations/Deferrals Mostly Hit C10 Single Aisle Slots
Source: Ascend
1 52 6
6 7 1 03
6
4 3
3 01 4 4
00
10
20
30
40
50
60
70
80
2009 2010 2011 2012 2013 2014
BoeingAirbus
Impact on Manufactur er Pr oduct ion Book Fr om 2009 YTD Announced A/ C Defer r als
0 20 40 60 80 100
A340A350
767A330
777747
A380A320
737787
Cancellat ionsDeferrals
2009 YT D Cancellat ions & Deferrals
* Excludes aircraft without firm delivery dates

9
C10 Rate Cuts Possible Given Big RPM/ASM Gap; Downturns Tend To Endure
► Sharp 2009 traffic drop (est. 5-7%) vs. 4% growth in airline rated capacity (includes stored aircraft) augurs OE capacity cuts & extended downturn■ RSM/ASM Gap A Whopping 10%+ in 2009■ LT traffic growth in the 4-5% range; we expect C10 RPM gains to remain below LT average
■ Delivery downturns normally last 3-4 years; with avg. annual unit declines of 14-15%
10
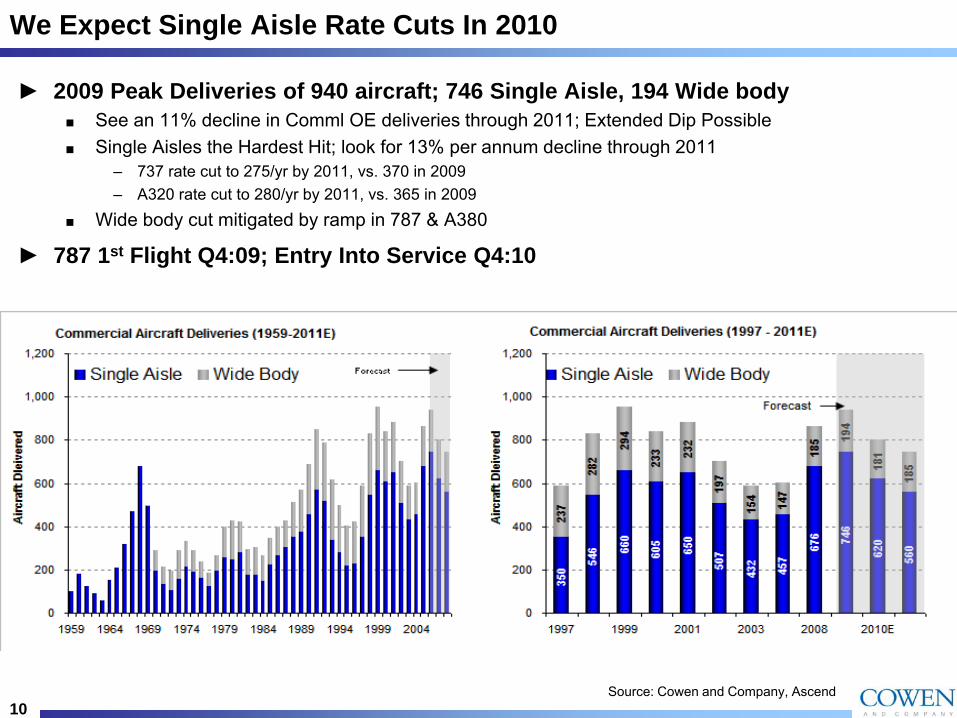
We Expect Single Aisle Rate Cuts In 2010
► 2009 Peak Deliveries of 940 aircraft; 746 Single Aisle, 194 Wide body■ See an 11% decline in Comml OE deliveries through 2011; Extended Dip Possible■ Single Aisles the Hardest Hit; look for 13% per annum decline through 2011
– 737 rate cut to 275/yr by 2011, vs. 370 in 2009– A320 rate cut to 280/yr by 2011, vs. 365 in 2009
■ Wide body cut mitigated by ramp in 787 & A380
► 787 1st Flight Q4:09; Entry Into Service Q4:10
Source: Cowen and Company, Ascend
11
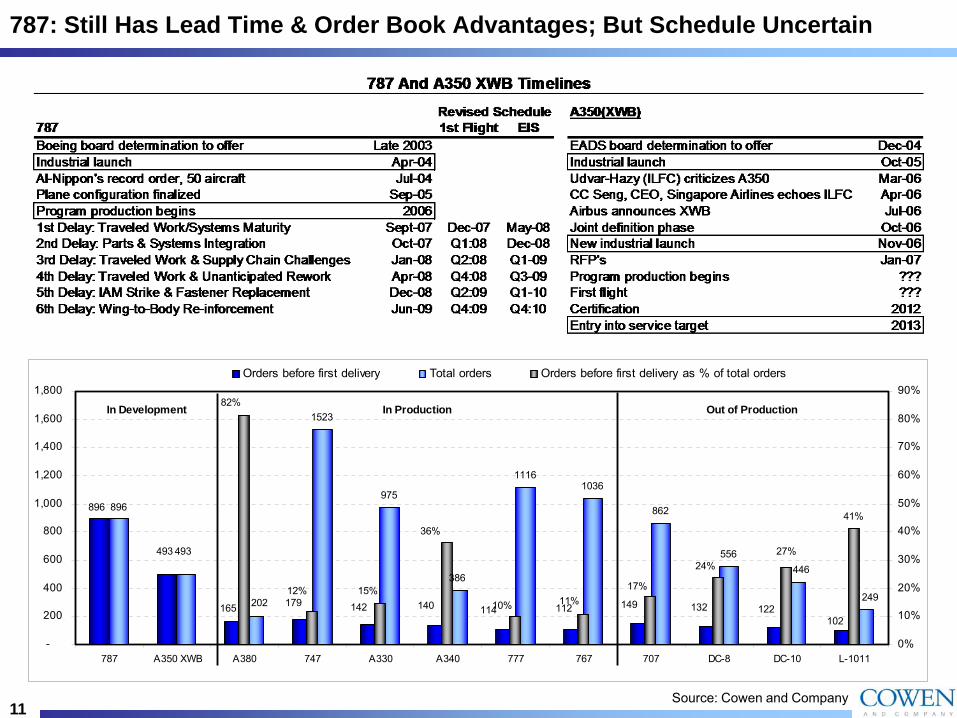
787: Still Has Lead Time & Order Book Advantages; But Schedule Uncertain
Source: Cowen and Company
1523
975
386
11161036
862
556
102122132149112114140
896
493
165 179 142
896
493
202
446
249
41%
27%
15%11%
24%
17%
10%
36%
12%
82%
-
200
400
600
800
1,000
1,200
1,400
1,600
1,800
787 A350 XWB A380 747 A330 A340 777 767 707 DC-8 DC-10 L-10110%
10%
20%
30%
40%
50%
60%
70%
80%
90%Orders before first delivery Total orders Orders before first delivery as % of total orders
In Production Out of ProductionIn Development
12
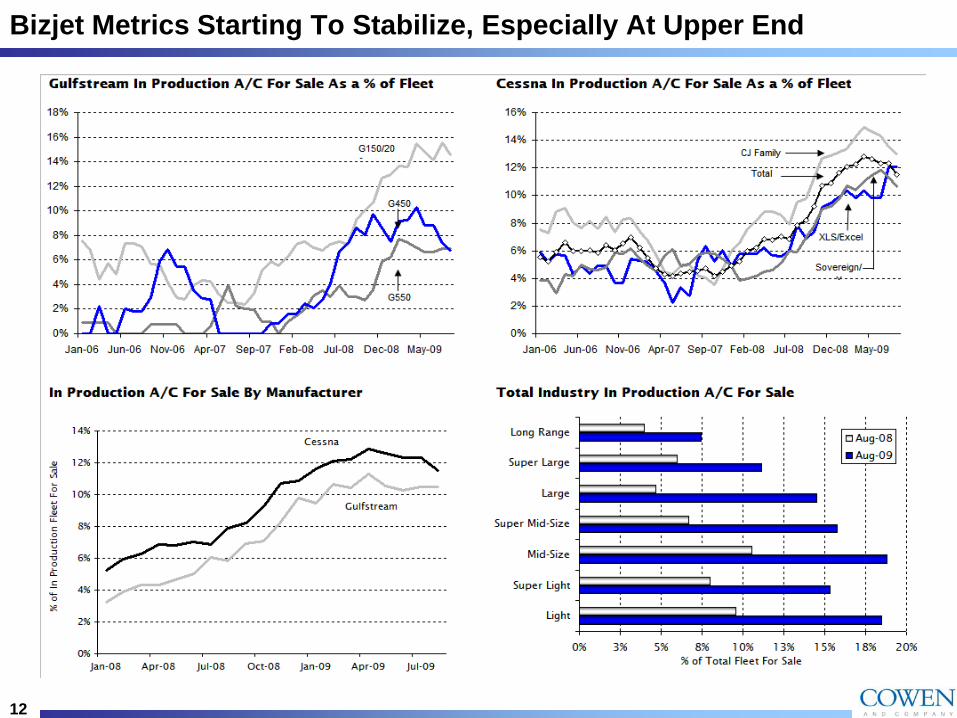
Bizjet Metrics Starting To Stabilize, Especially At Upper End

13
Bizjet Cycle In Sharp Drop; But Past Downturns Only Lasted 2 years
► Pre-Owned Trends Starting To Stabilize ► 2009-10 Delivery Collapse Matches Past Nasty, Two-Year Downswings
Source: Amstat, Company Documents

14
Gulfstream Better Positioned Than CessnaGulfstream Advantages Vs. Cessna
■ Upper end holds up better in downturns■ Stronger B/L – larger, better deposit trade-
in terms; less dependent on public cos. ■ Less dependent on mid-range sector(10%
EBIT vs. 50%+)■ Less vertically integrated (R&D/DA)■ More new product thrust (G650/G250)
Two tier cycle thesis intact
Source: MSCI, Company Documents

Please see addendum of this report for important disclosures.
Defense Spending & JSF
16
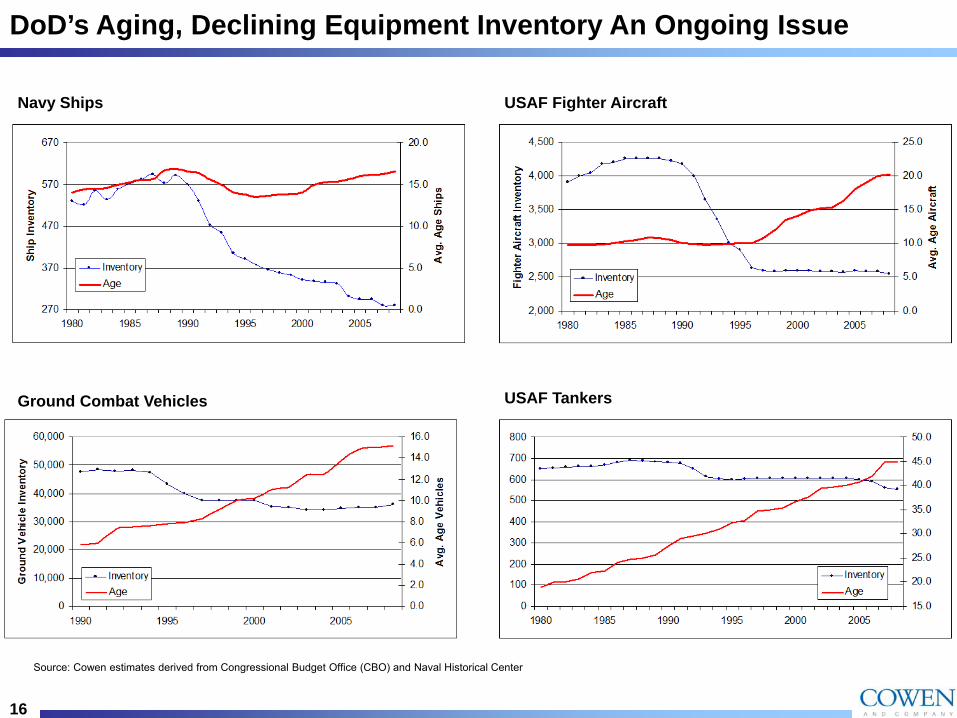
DoD’s Aging, Declining Equipment Inventory An Ongoing Issue
Navy Ships USAF Fighter Aircraft
Ground Combat Vehicles
Source: Cowen estimates derived from Congressional Budget Office (CBO) and Naval Historical Center
USAF Tankers
17
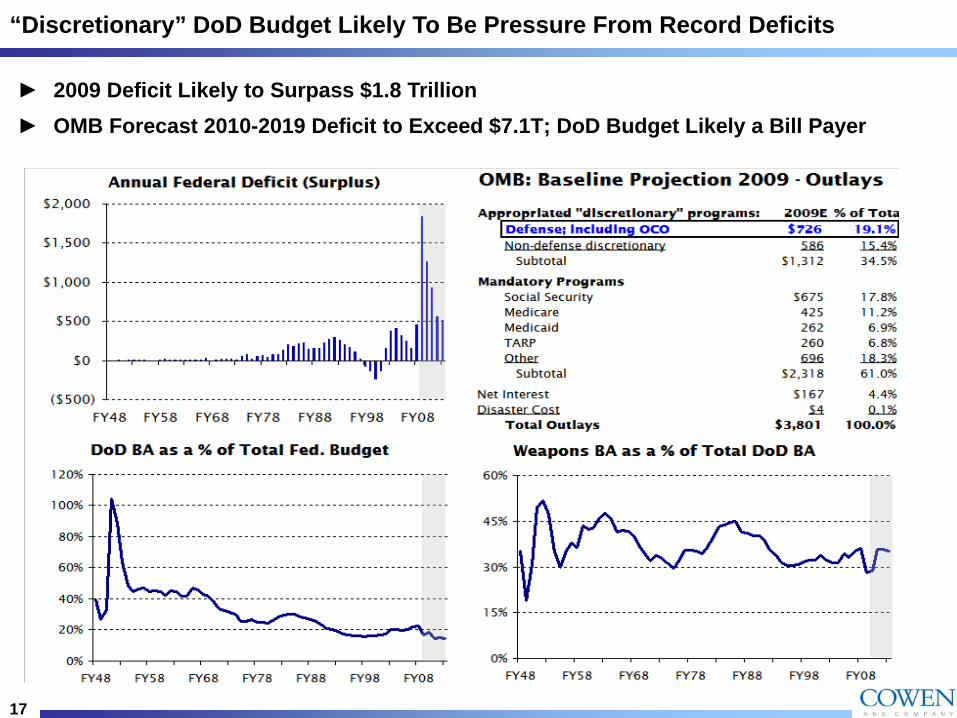
“Discretionary” DoD Budget Likely To Be Pressure From Record Deficits
► 2009 Deficit Likely to Surpass $1.8 Trillion► OMB Forecast 2010-2019 Deficit to Exceed $7.1T; DoD Budget Likely a Bill Payer
18
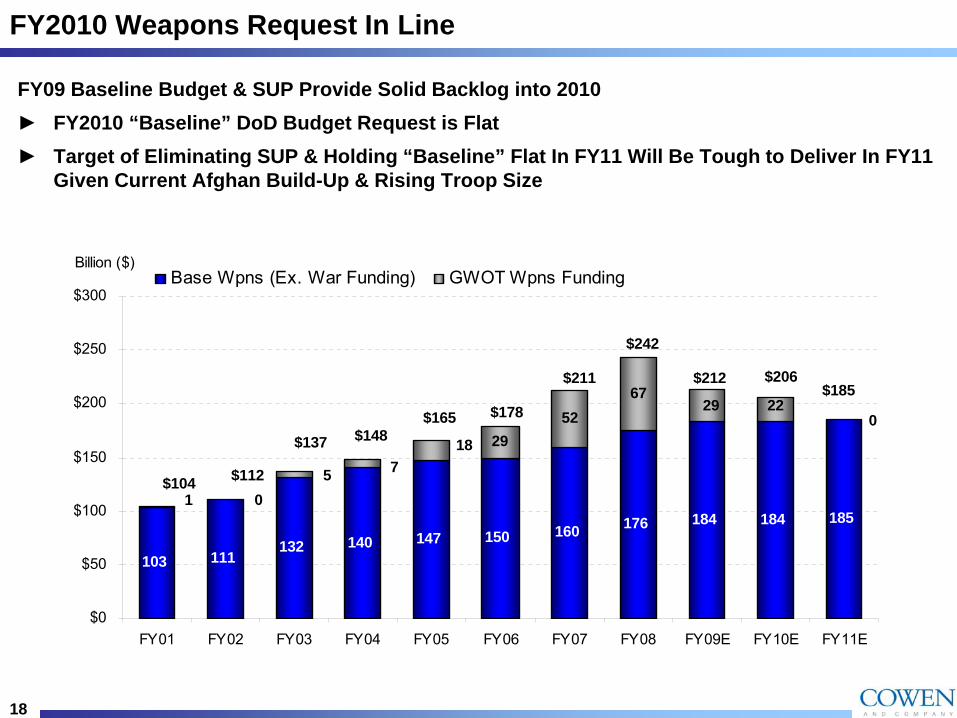
FY2010 Weapons Request In Line
FY09 Baseline Budget & SUP Provide Solid Backlog into 2010► FY2010 “Baseline” DoD Budget Request is Flat ► Target of Eliminating SUP & Holding “Baseline” Flat In FY11 Will Be Tough to Deliver In FY11
Given Current Afghan Build-Up & Rising Troop Size
103 111132 140 147 150 160 176 184 184 185
2952
67
501
718
0
$0
$50
$100
$150
$200
$250
$300
FY01 FY02 FY03 FY04 FY05 FY06 FY07 FY08 FY09E FY10E FY11E
Base Wpns (Ex. War Funding) GWOT Wpns Funding
$137 $148$165 $178
$211
$242
$212 $206
$104
$185
$112
29 22
Billion ($)

19
Procurement The “Swing Item” When DoD Budgets Move Dramatically
20
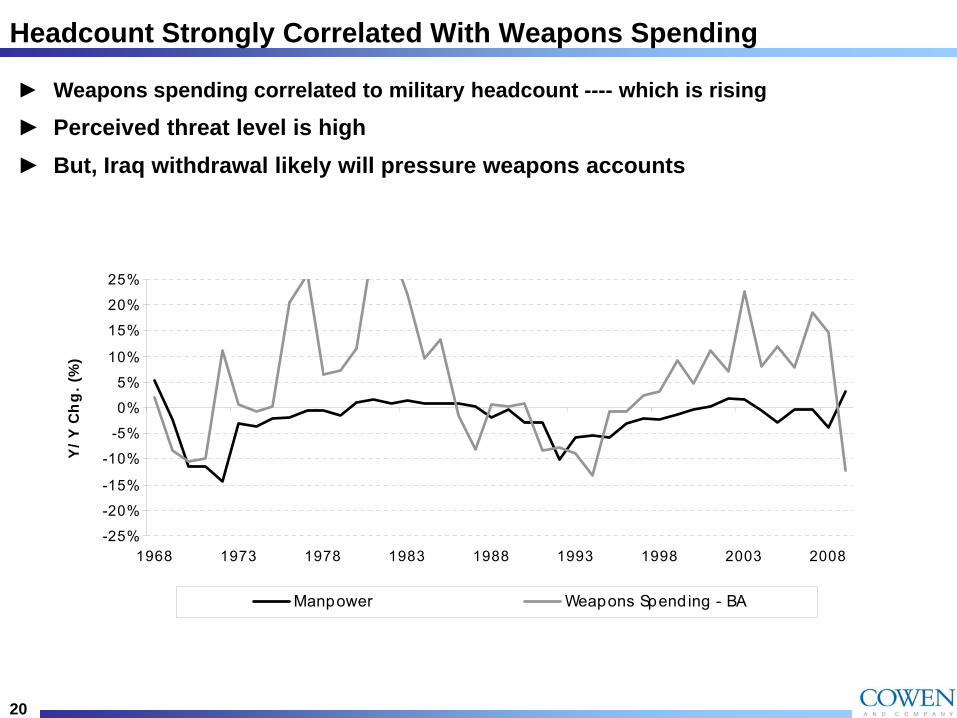
Headcount Strongly Correlated With Weapons Spending
-25%
-20%
-15%
-10%
-5%
0%
5%
10%
15%
20%
25%
1968 1973 1978 1983 1988 1993 1998 2003 2008
Y/Y
Ch
g. (
%)
Manpower Weapons Spending - BA
► Weapons spending correlated to military headcount ---- which is rising
► Perceived threat level is high► But, Iraq withdrawal likely will pressure weapons accounts
21
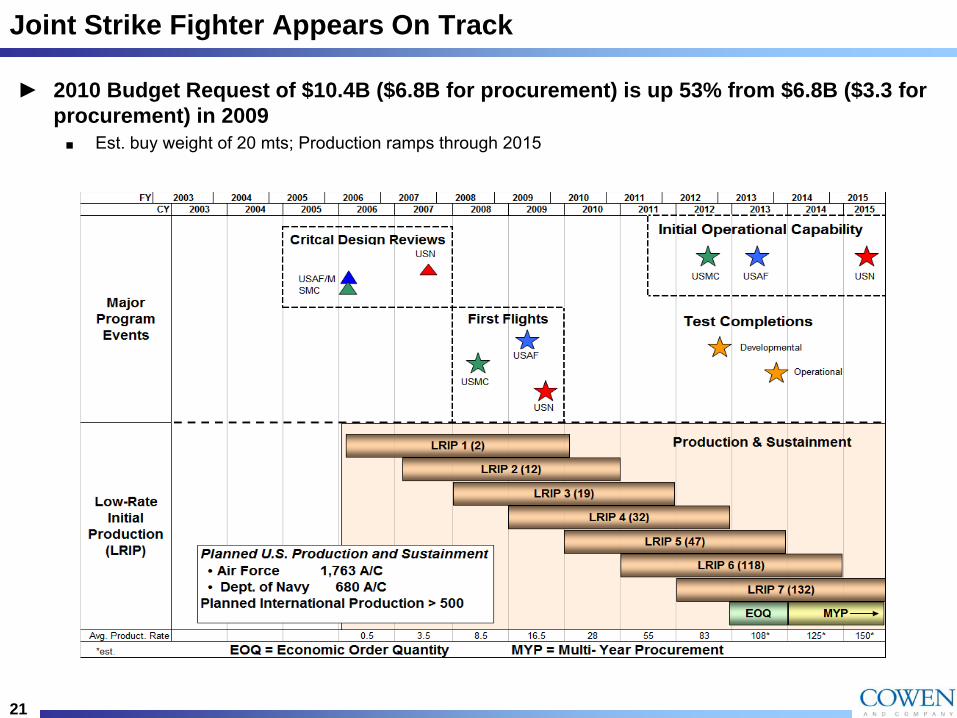
Joint Strike Fighter Appears On Track
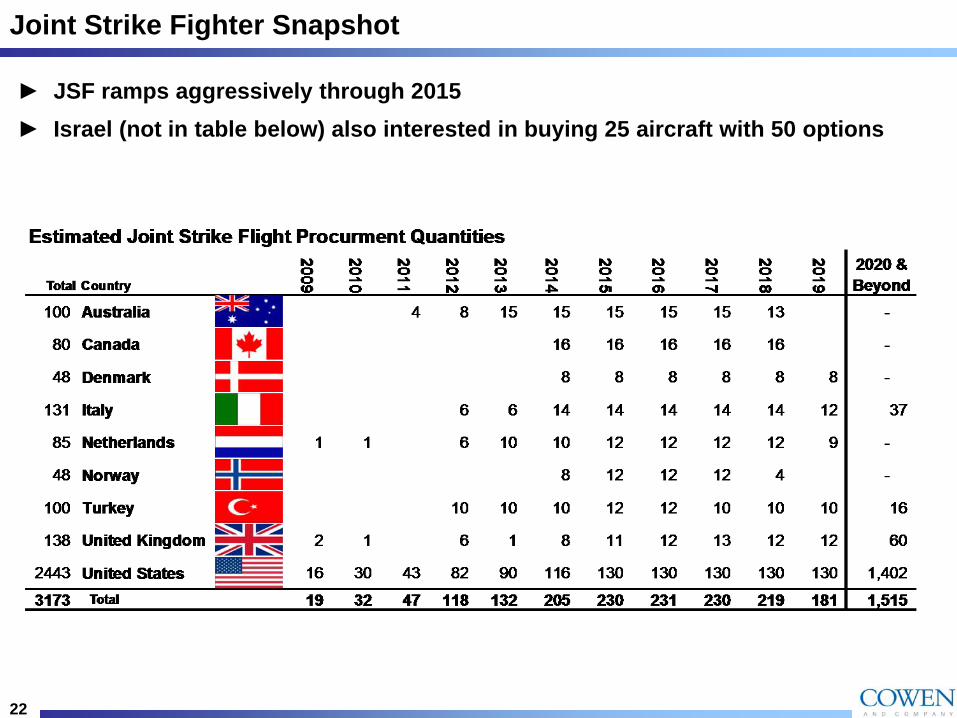
► 2010 Budget Request of $10.4B ($6.8B for procurement) is up 53% from $6.8B ($3.3 for procurement) in 2009■ Est. buy weight of 20 mts; Production ramps through 2015
22
Joint Strike Fighter Snapshot
► JSF ramps aggressively through 2015 ► Israel (not in table below) also interested in buying 25 aircraft with 50 options
23


![[eBook Ita] Manuale Ita Pratico Di Java](https://img.pdfslide.us/doc/110x75/55cf9c46550346d033a944be/ebook-ita-manuale-ita-pratico-di-java-56310138ab62e.jpg)


![[Manuali - ITA] - Warhammer 40k ITA - Codex Cataciani](https://img.pdfslide.us/doc/110x75/5571f85549795991698d2f00/manuali-ita-warhammer-40k-ita-codex-cataciani.jpg)