Embed Size (px)
Citation preview
1
www.LSAdvisors.com
QUARTERLY REVIEW & OUTLOOK Q2-2019
It was the best of mes, it was the worst of mes, it was the
age of wisdom, it was the age of foolishness...
— A Tale of Two Ci es by Charles Dickens
B y nearly any measure, the first half of the year has been a successful one for
investors. Why then would we suggest it is both the best of mes and also
the worst of mes? We find ourselves conflicted by the mixed messages we
see as we look at both the stock market and the bond market.
Domes c large‐cap stocks (the S&P 500) posted one of the best first halves in
decades, while small and mid‐sized stocks also posted very healthy returns. Foreign
markets lagged domes c returns, but generally all stock market indices provided a
solid years’ worth of returns in the first six months.
Bonds also provided investors with significant
returns during the first half, with high quality and
lower quality bonds genera ng generous
performance.
Therein lies the rub. It is a very unusual
environment when both stocks and bonds do
extraordinarily well. When stocks do well, it is
generally because economic growth is solid. Strong
growth pushes corporate earnings higher, and over
the long‐term, earnings drive stock prices higher.
On the other hand, bonds tend to perform well
when interest rates are declining, and lower rates
generally suggest an economy that is languishing
and a Fed that is cu ng interest rates in the hopes
of re‐accelera ng economic growth. Why then did
we see good gains in both stocks and bonds?
Risk Management
Transcends Everything
2
QUARTERLY REVIEW & OUTLOOK Q2-2019
As we reported last quarter, the Fed changed its
policy stance earlier this year. From an
environment where interest rates were expected to
steadily increase, the Fed announced its inten on
to pause rate hikes and make policy decisions based
on the actual economic data that was being
reported. The Fed reported that “uncertain es
about the outlook have increased,” and the
market assumed that an interest rate cut was
forthcoming. Investors, seeing that the Fed was
going to ease interest rates, pushed bond prices
higher and interest rates lower in an cipa on of
the coming policy shi . So while the Fed had only
signaled its intent to cut rates, the market has
already pushed interest rates lower.
A key support for the bond market has been the
very well‐contained outlook on infla on. One of
the classic causes of infla on has typically been
wage infla on. As workers demand higher wages,
companies are forced to accept lower profit
margins or raise prices to offset higher labor costs.
Wage infla on has been increasing for several years
and is now running at about 3.4%, almost double
the rate of infla on. Over the last 50 years, wage
growth has averaged 4.1%. As we enter the
longest expansion in history, and despite the push
by many large corpora ons to raise minimum
wages, we are seeing wage infla on that remains
contained and well below the average over the
last half‐century.
Produc vity is one of the components of wage
infla on, and produc vity growth has been anemic
for quite some me, averaging just 1.6% over the
past ten years. We acknowledge that produc vity
sta s cs were developed to try to calculate how
many widgets were produced by how many
workers, and may not have fully adjusted to 21st
century manufacturing techniques. More recently,
produc vity numbers have been rising, and the
recent report of 3.4% is the highest number since
September of 2014. Increases in produc vity help
keep wage costs down, and the recent gains have
contributed to maintaining the rate of infla on
below the Fed’s long‐term target of 2%.
Another contributor holding infla on in check has
been the price of oil. Lower oil prices are a result
of a drama c increase in produc on in the United
States. This has been driven by the technological
innova on of fracturing shale forma ons,
commonly called “fracking” (our favorite f‐word).
U.S. produc on has increased by 34% since 2016.
This represents an increase of just over 5 million
barrels per day, and it is expected that U.S.
produc on will increase by another 1.5 million
barrels per day in 2020, another 7% increase.
www.LSAdvisors.com
3
Compare that with the global increase in demand of
4.2 million barrels per day since 2016. Put another
way, the U.S. has increased produc on by 120% of
the growth in demand, and U.S. produc on is to
increase faster than global demand again in 2020.
It is no wonder that OPECers are scrambling to trim
produc on in order to try to keep oil prices stable.
Lower oil prices have also contributed to the low
infla on environment and that gives the Fed more
flexibility in se ng its policy decisions.
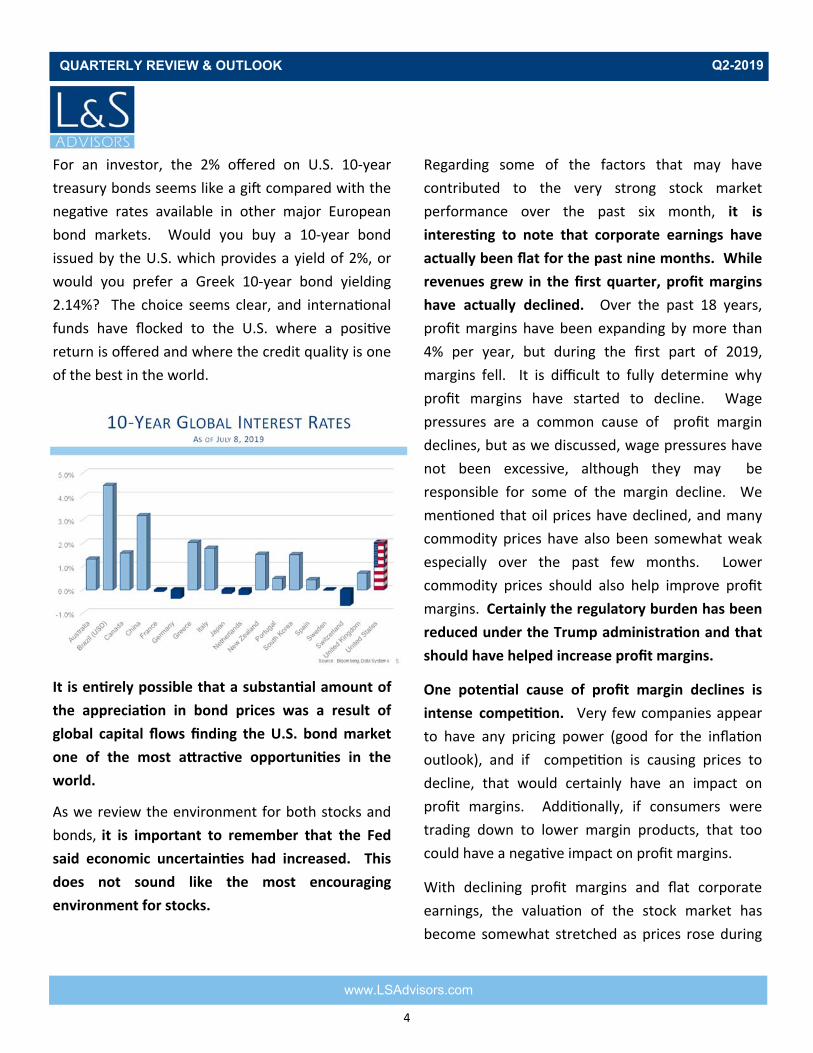
Another issue that drove interest rates lower is the
fact that U.S. interest rates are some of the
highest in the developed world. Only Brazil,
Mexico, Greece, and China offer 10‐year
government bond interest rates that are higher
than those of U.S. 10‐year bonds. In fact, as of this
wri ng, German 10‐year interest rates are a
nega ve 0.37%. Yes you read that correctly —
interest rates in Germany are nega ve. That
means you buy a bond for $100.37 and expect to
get $100.00 back at expira on. An investor is
guaranteed a loss. This policy guarantees the
return of your money but no return on your
money.
Remember that Europe was dragged into the chasm
of the Great Recession along with every other
na on. As the U.S. recovery started to accelerate,
the Europeans fell into their sovereign debt crisis
where investors worried that the PIGS of Europe
(Portugal, Italy, Greece, and Spain) would be forced
to exit the European Union. Just as U.S. interest
rates were kept ar ficially low to encourage
investment, the European Central Bankers kept
pushing rates lower and lower un l they were
actually nega ve. Their goal was to encourage
investment, and the thought was if investors could
not earn any return by purchasing government
bonds, they would invest their funds elsewhere to
earn a be er return. Sadly, that policy has not
worked as expected, and interest rates remain
nega ve in France, Germany, the Netherlands,
Switzerland and Japan.
QUARTERLY REVIEW & OUTLOOK Q2-2019
www.LSAdvisors.com
4
For an investor, the 2% offered on U.S. 10‐year
treasury bonds seems like a gi compared with the
nega ve rates available in other major European
bond markets. Would you buy a 10‐year bond
issued by the U.S. which provides a yield of 2%, or
would you prefer a Greek 10‐year bond yielding
2.14%? The choice seems clear, and interna onal
funds have flocked to the U.S. where a posi ve
return is offered and where the credit quality is one
of the best in the world.
It is en rely possible that a substan al amount of
the apprecia on in bond prices was a result of
global capital flows finding the U.S. bond market
one of the most a rac ve opportuni es in the
world.
As we review the environment for both stocks and
bonds, it is important to remember that the Fed
said economic uncertain es had increased. This
does not sound like the most encouraging
environment for stocks.
Regarding some of the factors that may have
contributed to the very strong stock market
performance over the past six month, it is
interes ng to note that corporate earnings have
actually been flat for the past nine months. While
revenues grew in the first quarter, profit margins
have actually declined. Over the past 18 years,
profit margins have been expanding by more than
4% per year, but during the first part of 2019,
margins fell. It is difficult to fully determine why
profit margins have started to decline. Wage
pressures are a common cause of profit margin
declines, but as we discussed, wage pressures have
not been excessive, although they may be
responsible for some of the margin decline. We
men oned that oil prices have declined, and many
commodity prices have also been somewhat weak
especially over the past few months. Lower
commodity prices should also help improve profit
margins. Certainly the regulatory burden has been
reduced under the Trump administra on and that
should have helped increase profit margins.
One poten al cause of profit margin declines is
intense compe on. Very few companies appear
to have any pricing power (good for the infla on
outlook), and if compe on is causing prices to
decline, that would certainly have an impact on
profit margins. Addi onally, if consumers were
trading down to lower margin products, that too
could have a nega ve impact on profit margins.
With declining profit margins and flat corporate
earnings, the valua on of the stock market has
become somewhat stretched as prices rose during
QUARTERLY REVIEW & OUTLOOK Q2-2019
www.LSAdvisors.com
5
the first half. Low interest rates help to make the
compe on for investor funds from bonds less
a rac ve, nega ng some of the increases in
valua on metrics. With valua ons approaching
recent highs, we would not be surprised to see the
market pause somewhat, par cularly a er the
strong run of the first half. We do acknowledge
that valua on is a terrible metric to gage short‐term
expected returns from stocks, but higher valua on
provides one more reason to be a bit cau ous as
the second half unfolds.
One of the concerns that has been raised is the
very high level of inventory accumula on that has
been powering economic growth. Over the last
two quarters, private inventories have grown by
$236 billion. Contrast that with $119 billion of
inventory accumula on over the previous three
quarters.
Inventory accumula on tends to occur for two
reasons. First, companies may try to increase
produc on in an cipa on of a change in the
environment. The threat of addi onal tariffs may
cause companies to rush to order supplies before
prices rise. Addi onally, inventories tend to
accumulate when demand slows and companies
have not fully adjusted their produc on schedules.
In either case, once accumulated, those excess
inventories must be worked off before addi onal
orders are placed. This suggests that growth
immediately following a period of large inventory
accumula on is likely to be slower.
President Trump started his trade war in January of
2018 with tariffs on foreign‐made solar panels.
Tariffs on steel and aluminum followed, as did more
broad‐based tariffs on other Chinese goods. From
that date, the price of the S&P 500 is up 3.8%. Add
another 3% in dividends, and the total return of the
stock market has been 6.9% over the past 18
months, less than 5% per year annualized. We have
seen significant vola lity as the President has added
threats of more tariffs, and we have seen relief
rallies as the president has backed away from those
threats. Since the trade war began, the price of
the S&P 500 is up less than 4%.
QUARTERLY REVIEW & OUTLOOK Q2-2019
www.LSAdvisors.com
6
QUARTERLY REVIEW & OUTLOOK QUARTERLY REVIEW & OUTLOOK Q2-2019
www.LSAdvisors.com
It seems apparent that the market has voted on
how successful it sees this policy or “tac c.”
Worries about making mistakes similar to those
that exacerbated the Great Depression in the
1930’s may not be over‐exaggera on. Lately, the
President has threatened tariffs on Mexico to
encourage it to reduce the number of refugees
seeking asylum from hos le lands south of Mexico
that had, only a few short years ago, been safe
places to live.
Even more discouraging is the recent discussion of
expanding tariffs to the EU to penalize Europe for
the subsidies provided to Airbus to enable them to
be er compete with Boeing. Let’s be clear that
these subsidies are viola ons of trade rules that
have been agreed to, yet they persist.
Further, let us also agree that China has taken
advantage of its posi on as a member of the WTO
(World Trade Organiza on). Their the of
intellectual property has, at mes, been egregious.
These are complex problems requiring complex
solu ons that are exceedingly difficult to resolve.
S ll, when your only tool is a hammer, all problems
tend to look like nails. The market has stumbled in
the face of tariffs, and if trade wars were so “easy
to win,” we would not be wai ng for the next
posi ve tweet on trade nego a on progress while
the stock market languished.
The good news for the U.S. is that our economy is
not very dependent on trade and exports for our
GDP growth. Only about 8% of our economy is
dependent on exports. The news for na ons that
depend more on exports to support their
economies is not nearly as sanguine. The export‐
led countries of Germany, Korea, Taiwan, Canada,
the UK, Japan, and Russia are already seeing their
manufacturing sectors contract. Other export‐led
economies such as China, Brazil, and Mexico are
on the cusp of contrac on in their manufacturing
sectors. Many economies have strong service
sectors and are able to withstand a contrac on in
manufacturing without falling into recession. The
number of manufacturing sectors that are
contrac ng at the same me seems more than
coincidental.
For those that see our commentary as being too
poli cally mo vated, understand that we are
repor ng on the data not on the poli cal
consequences that might transpire. The data
suggests that the uncertainty surrounding trade is
having a deleterious impact on global growth.
As we evaluate risks to the economy and to the
market, there are several criteria we look to. As we
7
men oned earlier, the Fed changed its policy
outlook earlier this year, and policy interest rates
have remained constant for the first half of the
year. More recently the Fed’s commentary
suggested a more conciliatory approach, and the
market expects policy rates to be decreased later
this month. There is an old adage that investors
should never fight the Fed. The fact that the Fed is
perceived as moving to a more accommoda ve
stance suggests the risk of a policy mistake have
diminished. While market expecta ons can o en
differ from actual Fed policy decisions, a more
investor‐friendly Fed helps reduce risks for
investors.
Like the Fed, foreign central bankers have
maintained accommoda ve policies across the
globe. Recently, Australia lowered their policy
rates to the lowest in history. Chris ne Legarde,
currently the head of the Interna onal Monetary
Fund, was recently nominated to head the
European Central Bank (ECB). It is widely believed
she will closely follow the policies of her
predecessor Mario Draghi, who famously said the
ECB would do “whatever is necessary” to preserve
the European Union. Investor‐friendly policies
from other central bankers across the globe
suggest that the risks of a policy mistake remain
well‐contained.
Despite easy monetary policies, economic growth
remains quite slow. Following a solid beginning to
the year, it is widely expected that economic
growth has slowed as the second quarter
progressed. The Atlanta Fed now projects
economic growth will be only about 1.3% in the
second quarter, less than half the rate of the first
quarter. While we expect the U.S. economy to
avoid a recession for the remainder of this year,
and into 2020, the very slow growth we are
experiencing does suggest an economy that could
be more suscep ble to an external shock, should
one occur.
Global growth also remains somewhat
disappoin ng. While there are small green shoots
that give us hope the worst is behind us, the
contrac ng manufacturing sector in so many
countries suggests that any recovery might be
limited. S ll, the risk that things get materially
worse seems quite modest.
We also look to credit markets to help us evaluate
when risks might be building, and here the news is
quite good. There are no signs of credit problems,
as both lower quality and high quality companies
are having no difficulty raising money. Credit costs
remain quite low and signs of systemic problems
are not apparent. This supports our belief that the
QUARTERLY REVIEW & OUTLOOK Q2-2019
www.LSAdvisors.com
8
risks of a recession star ng any me soon are quite
low.
The tone of the market has been pre y good, with
the S&P 500 making new highs as the first half of
the year ended. We would prefer to see more
broad‐based par cipa on that included small‐caps,
mid‐caps, and other asset classes also making new
highs, but overall the tone of the market has been
construc ve. We remain a bit cau ous that
second quarter earnings reports could be a li le
disappoin ng and that might set the tone for the
market to give back some of the large gains posted
during the first half. We also worry that while the
poten al for a policy mistake by the Fed has
diminished, the poten al for a policy mistake
regarding trade remains elevated.
The market has posted solid returns during the
first half and some cau on might be prudent as
earnings growth might slow along with the
economy. S ll, signs of a recession are missing
and credit market problems that caused so much
pain in 2007‐09 seem absent. Following a more
cau ous stance for the third quarter, we suspect
the fourth quarter could again be good for
investors.
As always, it is important that we know of any
changes in your financial situa on. Please feel free
to call us if you have any ques ons or comments
regarding your investment por olio.
Benne Gross CFA, CAIA
President
DISCLOSURES:
L&S Advisors, Inc. (“L&S”) is a privately owned corporation headquartered in Los Angeles, CA. L&S was originally founded in 1979 and dissolved in 1996. The two founders, Sy Lippman and Ralph R. Scott, continued managing portfolios together and reformed the corporation in May 2006. The firm registered as an investment advisor with the U.S. Securities and Exchange commission in June 2006. L&S performance results prior to the reformation of the firm were achieved by the portfolio managers at a prior entity and have been linked to the performance history of L&S. The firm is defined as all accounts exclusively managed by L&S from 10/31/2005, as well as accounts managed in conjunction with other, external advisors via the Wells Fargo DMA investment program for the periods 05/02/2014, through the present time.
L&S claims compliance with the Global Investment Performance Standards (GIPS®) . L&S has been independently verified by Ashland Partners & Company LLP for the periods October 31, 2005 through December 31, 2015, and ACA Performance Services for the periods from January 1, 2016 to December 31, 2018. Upon request to Sy Lippman at [email protected], L&S can provide the L&S Advisors GIPS Annual Disclosure Presentation which provides a GIPS compliant presentation as well as a list of all composite descriptions.
L&S is a registered investment adviser with the U.S. Securities and Exchange Commission (“SEC”) and is notice filed in various states. Any reference to or use of the terms “registered investment adviser” or “registered,” does not imply that L&S or any person associated with L&S has achieved a certain level of skill or training. L&S may only transact business or render personalized investment advice in those states and international jurisdictions where we are registered, notice filed, or where we qualify for an exemption or exclusion from registration requirements. Information in this newsletter is provided for informational purposes only and should not be construed as a solicitation to effect, or attempt to effect, either transactions in securities or the rendering of personalized investment advice. Any communications with prospective clients residing in states or international jurisdictions where L&S and its advisory affiliates are not registered or licensed shall be limited so as not to trigger registration or licensing requirements. Opinions expressed herein are subject to change without notice. L&S has exercised reasonable professional care in preparing this information, which has been obtained from sources we believe to be reliable; however, L&S has not independently verified, or attested to, the accuracy or authenticity of the information. L&S shall not be liable to customers or anyone else for the inaccuracy or non-authenticity of the information or for any errors of omission in content regardless of the cause of such inaccuracy, non-authenticity, error, or omission, except to the extent arising from the sole gross negligence of L&S. In no event shall L&S be liable for consequential damages.
The S&P 500 index is a free-float market capitalization weighted index of 500 of the largest U.S. companies. The index is calculated on a total return basis with dividends reinvested and is not available for direct investment. The composition of L&S’ strategies generally differs significantly from the securities that comprise the index due to L&S’ active investment process and other variables. L&S does not, and makes no attempt to, mirror performance of the index in the aggregate, and the volatility of L&S’ strategies may be materially different from that of the referenced indices.
L&S’ current disclosure statement as set forth in ADV 2 of Form ADV as well as our Privacy Notice is available for your review upon request.
QUARTERLY REVIEW & OUTLOOK Q2-2019
www.LSAdvisors.com
12121 Wilshire Boulevard, Suite 1100 Los Angeles, California 90025
310.893.6060 www.LSAdvisors.com
V071019