Embed Size (px)
Citation preview
AUTHOR
It’s a MAD* World *Mutually Assured Destruction
ANDREW HARMSTONEManaging Director
Andrew is lead portfolio manager for the Global Balanced Risk Control Strategy (GBaR). He joined Morgan Stanley in 2008 and has 36 years of industry experience.
SOLUTIONS & MULTI ASSET | GLOBAL BALANCED RISK CONTROL | MACRO INSIGHT | SEPTEMBER 2017
“When people run in circles It’s a very very mad worldMad world.”— Mad World, Tears for Fears, 1982
Hurricanes, floods, fires and earthquakes are enough for the planet to bear. Add in heavy legislative agendas, potential tightening by central banks and spiralling tensions between the U.S. and North Korea, and the net effect for investors is an increased number of potential “event risks.” The world seems to be going mad as the nuclear standoff revives the Cold War concept of mutually assured destruction (MAD).
Our positive view throughout 2017 has been supported by healthy global economic data and, until recently, accommodative central bank policy. Other reasons for optimism have included low global market volatility, favourable conditions for capital investment and consumer spending, the latter having been bolstered by low energy prices. These fundamental drivers remain strong—so strong, in fact, that they could prompt central banks to start monetary tightening, following the U.S. Federal Reserve’s (Fed) lead — and the bond markets seem to be factoring that in. But the positive backdrop is complicated by the geopolitical risks, which argue for moving into safe-haven assets.
North Korea: MAD?
The tension between the U.S. and North Korea appears to be getting worse, building up a pattern where a missile test by North Korea triggers a reaction from the U.S., and markets fall. When neither side says anything for a few days, investors relax and the market rebounds. Then the cycle repeats. There is no clear resolution because neither side is willing to compromise.
2
MACRO INSIGHT
MORGAN STANLEY INVESTMENT MANAGEMENT | SOLUTIONS & MULTI-ASSET
1 http://www.businessinsider.com/ap-putin-north-korea-will-eat-grass-before-giving-up-nukes-2017-9
North Koreans clearly consider their nuclear weapons to be a core asset. They repeatedly cite other nations that gave up their nuclear capability, like Libya and Iraq, and were subsequently invaded. Whether their concerns are purely defensive or whether they intend to use their nuclear capabilities to gain leverage over South Korea is an open question that is hotly debated by Korea experts. But it is clear they do not intend to abandon their nuclear programme, considering it to be their one “ace in the hole”.
For the U.S., allowing a state as unpredictable as North Korea the ability to potentially reach the continental U.S. with a nuclear-armed warhead is unacceptable.
We expect the standoff to escalate further before it is resolved. One of the U.S. strategies is to impose drastic sanctions on North Korea to bring them to their knees, but both China and the UN have already tightened sanctions, with no apparent effect. As Russian President
Vladimir Putin said recently, North Koreans “will eat grass but will not give up the [nuclear] programme.”1
Markets: Hell no, we won’t glow
The markets are unusually sensitive when it comes to nuclear issues, even non-military ones like the Fukushima meltdown in 2011. Although markets tend to stabilise when there is no news, each escalation in the North Korea crisis leads to renewed nervousness. This up and down movement is the definition of volatility, so investors need to prepare for it.
When put under pressure, both President Trump and Supreme Leader Kim tend to double down rather than pull back, so whilst actual military conflict is still unlikely, we believe there is a higher probability of the two sides pushing each other ever closer to military conflict. Eventually the threat of MAD may force a resolution, but neither of the
key protagonists really seems willing to compromise at this stage.
As a result, the odds have shortened and investors are getting nervous. We expect volatility to persist until a resolution is found—and when it comes, we could get a very rapid rebound in the market, particularly if the underlying economy is solid. But for now, the confluence of factors pushing volatility up in the short term makes us cautious about assets that are sensitive to this particular risk.
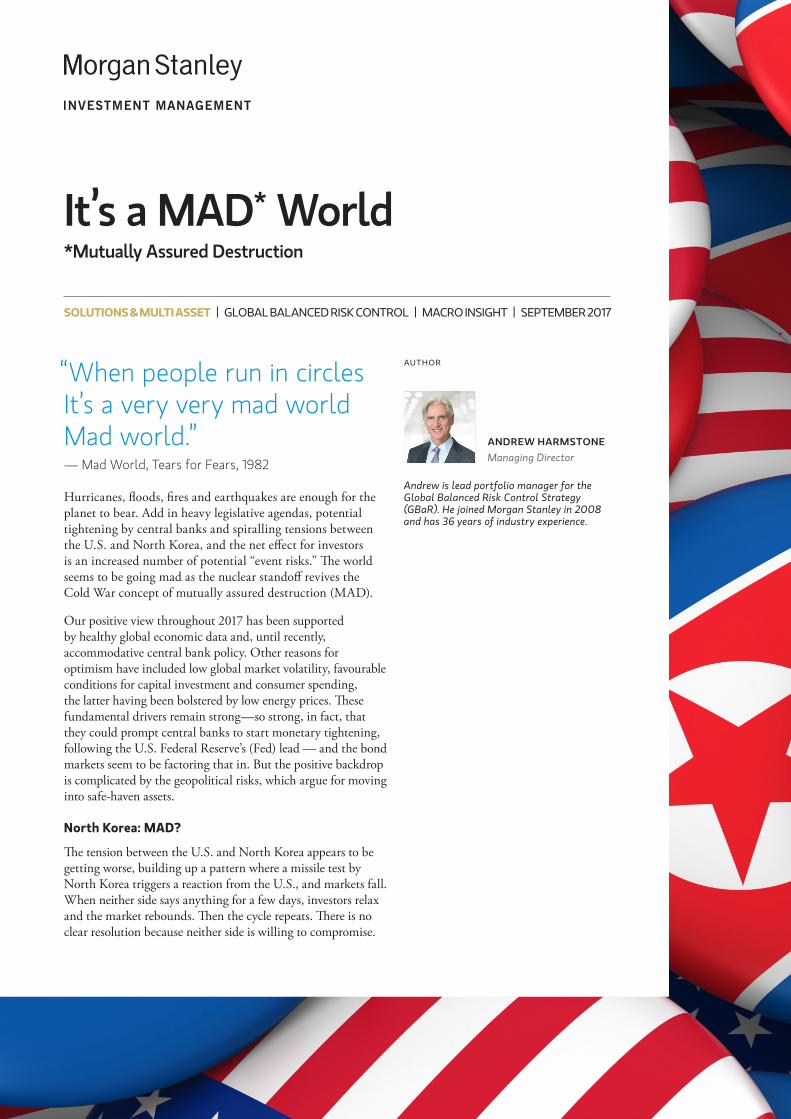
It is possible to correlate the periods of tension with North Korea to the prices of assets. For example, when North Korea threatened to strike Guam, most regional indices fell, notably the MSCI Emerging Market Asia Index and the MSCI India Index. The MSCI Emerging Markets Latin America Index, on the other hand, was relatively insulated, as was the U.S. Subsequently, EMEA and Latin America Emerging Markets rebounded most strongly
DISPLAY 1
Dr. Strangelove moments: “How markets stopped worrying about the bomb”
MSCI EM Asia
Guam Threat (9-11 Aug)
MSCI India Japan (Topix) MSCI EM EMEA MSCI EM Latin America
S&P 500 Gold
Recovery (11 Aug – 6 Sep)
-2.8%
3.3%
-2.7%
3.0%
-1.2%-0.4%
-1.6%
5.2%
-0.9%
6.9%
-1.3%
1.1% 1.1%
4.2%
Least Sensitivethreat to North Korea
Most Sensitivethreat to North Korea
Source: Bloomberg, MSCI Emerging Markets Asia Index, MSCI India Index, Tokyo Stock Price Index (TOPIX), MSCI Emerging Markets EMEA Index, MSCI Emerging Markets Latin America Index, S&P 500 Index, Gold Bullion, London Bullion Market US dollars per troy ounce – from the ICE Benchmark Administration (IBA) data as of 31 August 2017. The performance of these indices is provided for illustrative purposes only and is not meant to depict the performance of a specific investment. Past performance is no guarantee of future results. See disclosure section for index definitions.
3
IT ’S A MAD* WORLD (*MUTUALLY ASSURED DESTRUCTION)
SOLUTIONS & MULTI-ASSET | MORGAN STANLEY INVESTMENT MANAGEMENT
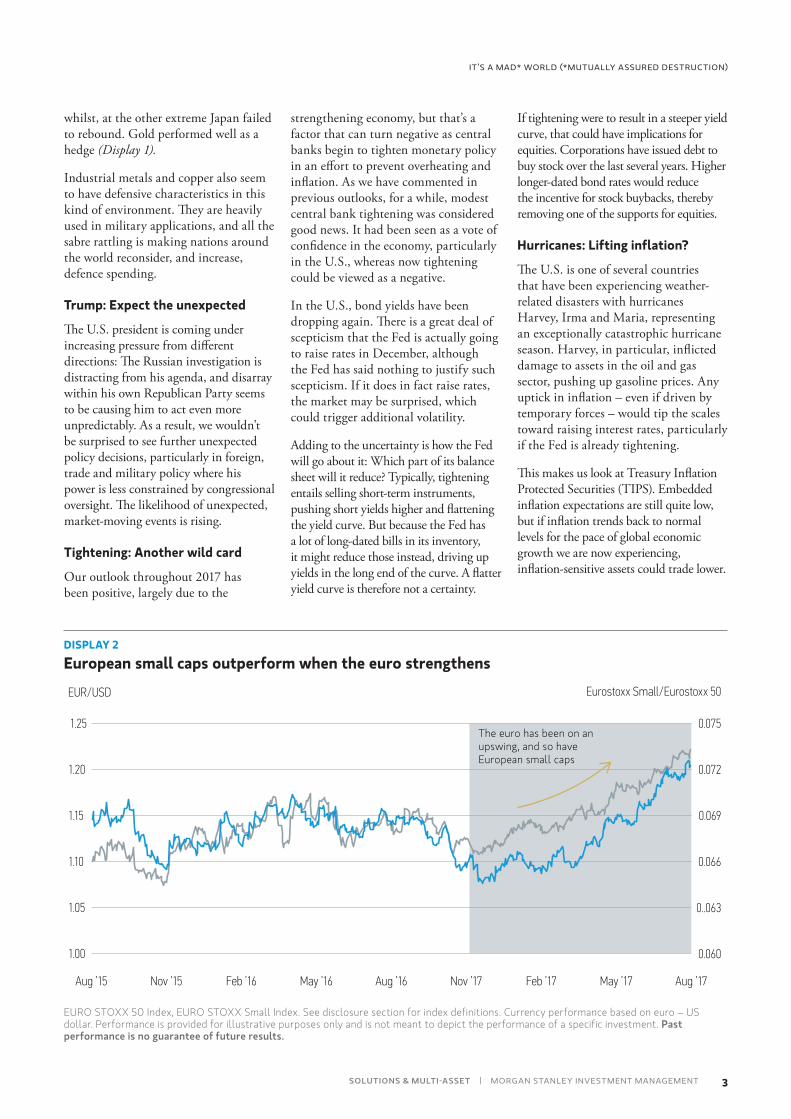
DISPLAY 2
European small caps outperform when the euro strengthens
1.00
1.05
1.15
1.10
1.20
Aug ’15
EUR/USD Rate (LHS)
1.25
0.060
0.066
0..063
0.069
0.072
0.075
EUR/USD Eurostoxx Small/Eurostoxx 50
Nov ’15 Feb ’16 May ’16 Aug ’16 Nov ’17 Feb ’17 May ’17 Aug ’17
Eurostoxx Small/Eurostoxx 50 Ratio (RHS)
The euro has been on an upswing, and so have European small caps
EURO STOXX 50 Index, EURO STOXX Small Index. See disclosure section for index definitions. Currency performance based on euro – US dollar. Performance is provided for illustrative purposes only and is not meant to depict the performance of a specific investment. Past performance is no guarantee of future results.
whilst, at the other extreme Japan failed to rebound. Gold performed well as a hedge (Display 1).
Industrial metals and copper also seem to have defensive characteristics in this kind of environment. They are heavily used in military applications, and all the sabre rattling is making nations around the world reconsider, and increase, defence spending.
Trump: Expect the unexpected
The U.S. president is coming under increasing pressure from different directions: The Russian investigation is distracting from his agenda, and disarray within his own Republican Party seems to be causing him to act even more unpredictably. As a result, we wouldn’t be surprised to see further unexpected policy decisions, particularly in foreign, trade and military policy where his power is less constrained by congressional oversight. The likelihood of unexpected, market-moving events is rising.
Tightening: Another wild card
Our outlook throughout 2017 has been positive, largely due to the
strengthening economy, but that’s a factor that can turn negative as central banks begin to tighten monetary policy in an effort to prevent overheating and inflation. As we have commented in previous outlooks, for a while, modest central bank tightening was considered good news. It had been seen as a vote of confidence in the economy, particularly in the U.S., whereas now tightening could be viewed as a negative.
In the U.S., bond yields have been dropping again. There is a great deal of scepticism that the Fed is actually going to raise rates in December, although the Fed has said nothing to justify such scepticism. If it does in fact raise rates, the market may be surprised, which could trigger additional volatility.
Adding to the uncertainty is how the Fed will go about it: Which part of its balance sheet will it reduce? Typically, tightening entails selling short-term instruments, pushing short yields higher and flattening the yield curve. But because the Fed has a lot of long-dated bills in its inventory, it might reduce those instead, driving up yields in the long end of the curve. A flatter yield curve is therefore not a certainty.
If tightening were to result in a steeper yield curve, that could have implications for equities. Corporations have issued debt to buy stock over the last several years. Higher longer-dated bond rates would reduce the incentive for stock buybacks, thereby removing one of the supports for equities.
Hurricanes: Lifting inflation?
The U.S. is one of several countries that have been experiencing weather-related disasters with hurricanes Harvey, Irma and Maria, representing an exceptionally catastrophic hurricane season. Harvey, in particular, inflicted damage to assets in the oil and gas sector, pushing up gasoline prices. Any uptick in inflation – even if driven by temporary forces – would tip the scales toward raising interest rates, particularly if the Fed is already tightening.
This makes us look at Treasury Inflation Protected Securities (TIPS). Embedded inflation expectations are still quite low, but if inflation trends back to normal levels for the pace of global economic growth we are now experiencing, inflation-sensitive assets could trade lower.
4
MACRO INSIGHT
MORGAN STANLEY INVESTMENT MANAGEMENT | SOLUTIONS & MULTI-ASSET
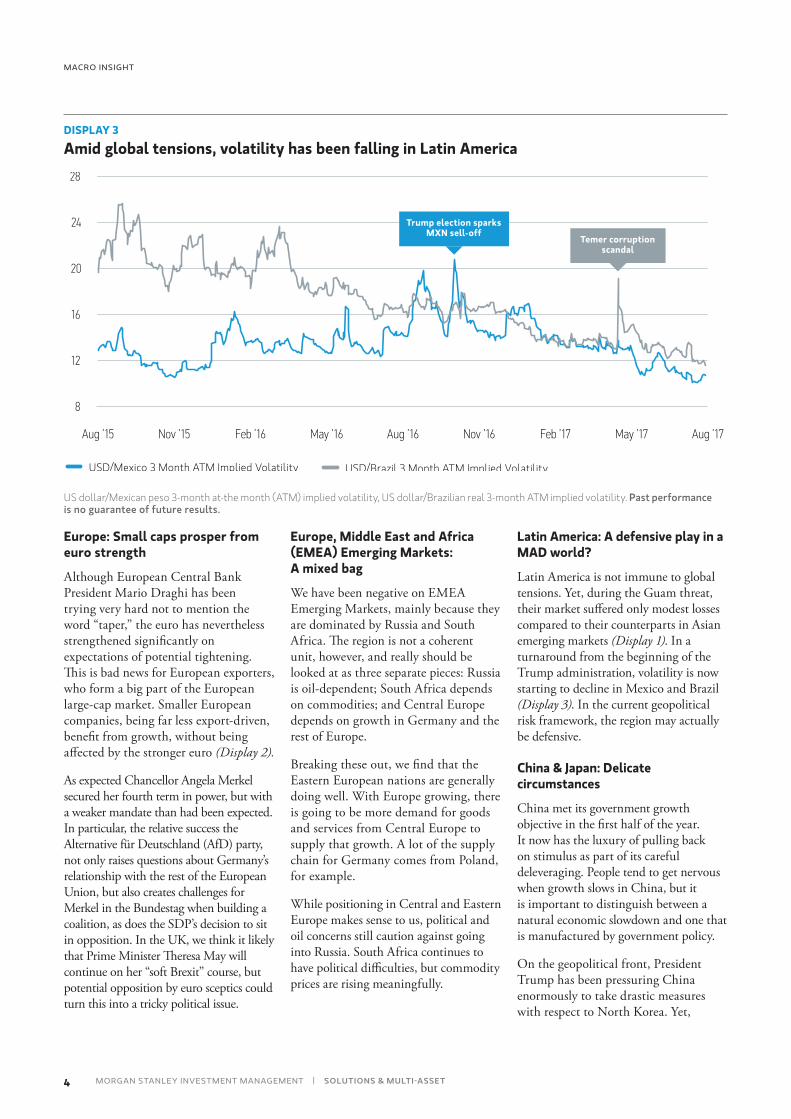
DISPLAY 3
Amid global tensions, volatility has been falling in Latin America
8
16
12
20
24
Aug ’15
USD/Mexico 3 Month ATM Implied Volatility
28
Nov ’15 Feb ’16 May ’16 Aug ’16 Nov ’16 Feb ’17 May ’17 Aug ’17
USD/Brazil 3 Month ATM Implied Volatility
Trump election sparks MXN sell-off
Temer corruption scandal
US dollar/Mexican peso 3-month at-the month (ATM) implied volatility, US dollar/Brazilian real 3-month ATM implied volatility. Past performance is no guarantee of future results.
Europe: Small caps prosper from euro strength
Although European Central Bank President Mario Draghi has been trying very hard not to mention the word “taper,” the euro has nevertheless strengthened significantly on expectations of potential tightening. This is bad news for European exporters, who form a big part of the European large-cap market. Smaller European companies, being far less export-driven, benefit from growth, without being affected by the stronger euro (Display 2).
As expected Chancellor Angela Merkel secured her fourth term in power, but with a weaker mandate than had been expected. In particular, the relative success the Alternative für Deutschland (AfD) party, not only raises questions about Germany’s relationship with the rest of the European Union, but also creates challenges for Merkel in the Bundestag when building a coalition, as does the SDP’s decision to sit in opposition. In the UK, we think it likely that Prime Minister Theresa May will continue on her “soft Brexit” course, but potential opposition by euro sceptics could turn this into a tricky political issue.
Europe, Middle East and Africa (EMEA) Emerging Markets: A mixed bag
We have been negative on EMEA Emerging Markets, mainly because they are dominated by Russia and South Africa. The region is not a coherent unit, however, and really should be looked at as three separate pieces: Russia is oil-dependent; South Africa depends on commodities; and Central Europe depends on growth in Germany and the rest of Europe.
Breaking these out, we find that the Eastern European nations are generally doing well. With Europe growing, there is going to be more demand for goods and services from Central Europe to supply that growth. A lot of the supply chain for Germany comes from Poland, for example.
While positioning in Central and Eastern Europe makes sense to us, political and oil concerns still caution against going into Russia. South Africa continues to have political difficulties, but commodity prices are rising meaningfully.
Latin America: A defensive play in a MAD world?
Latin America is not immune to global tensions. Yet, during the Guam threat, their market suffered only modest losses compared to their counterparts in Asian emerging markets (Display 1). In a turnaround from the beginning of the Trump administration, volatility is now starting to decline in Mexico and Brazil (Display 3). In the current geopolitical risk framework, the region may actually be defensive.
China & Japan: Delicate circumstances
China met its government growth objective in the first half of the year. It now has the luxury of pulling back on stimulus as part of its careful deleveraging. People tend to get nervous when growth slows in China, but it is important to distinguish between a natural economic slowdown and one that is manufactured by government policy.
On the geopolitical front, President Trump has been pressuring China enormously to take drastic measures with respect to North Korea. Yet,
5
IT ’S A MAD* WORLD (*MUTUALLY ASSURED DESTRUCTION)
SOLUTIONS & MULTI-ASSET | MORGAN STANLEY INVESTMENT MANAGEMENT
there is a limit to what China can do: Sanctions strong enough to be truly effective would trigger a major refugee crisis for China, since the Yalu River separating the two countries is relatively easy to cross.
Japan has had more than one North Korean missile fly over them. Even though their performance has been decent, exposure to Japanese equities is relatively risky given that it would be an obvious target for North Korea.
Anticipating risk events: It’s what we do
With the risk from North Korea looming larger, it is interesting that the
VIX2, at 12%, hasn’t gone up as much as might be expected. We think part of the reason is that investors don’t quite know how to price in this volatility.
This particular risk event is extremely unlikely to materialise, but also extremely negative if it does happen, which means that taking a weighted average of the really bad case and the good case doesn’t give a satisfactory position. We, therefore, think it prudent to reduce exposures to volatility and higher-risk areas and put in defensive positions where possible. As we cut back on equities, which tend to have high durations, we have increased durations modestly on the bond side to balance this out.
There seems to be a lot of mad running in circles in the political world recently, driving event risks in the markets. These risks are not equivalent across regions and sectors, which allows us to anticipate risk events and actively adjust asset allocations accordingly.
When some of these issues, like North Korea, are resolved, we expect these risks to turn into opportunities. We will be watching closely and ready to readjust our portfolios.
2 This index performance is provided for illustrative purposes only and is not meant to depict the performance of a specific investment. Past performance is no guarantee of future results. See disclosure section for index definitions. Source: Bloomberg, data as of 30 May 2017. The VIX is the Chicago Board Options Exchange (CBOE) Volatility Index ®, (VIX ®) a key measure of expected volatility using S&P 500 stock index option prices.
6 MORGAN STANLEY INVESTMENT MANAGEMENT | SOLUTIONS & MULTI-ASSET
IMPORTANT DISCLOSURES This commentary is for use of Professional Clients only, except in the U.S. where the material may be redistributed or used with the general public. The views and opinions are those of the author as of the date of publication and are subject to change at any time due to market or economic conditions and may not necessarily come to pass. Furthermore, the views will not be updated or otherwise revised to reflect information that subsequently becomes available or circumstances existing, or changes occurring, after the date of publication. The views expressed do not reflect the opinions of all portfolio managers at Morgan Stanley Investment Management (MSIM) or the views of the firm as a whole, and may not be reflected in all the strategies and products that the Firm offers. Forecasts and/or estimates provided herein are subject to change and may not actually come to pass. Information regarding expected market returns and market outlooks is based on the research, analysis and opinions of the authors. These conclusions are speculative in nature, may not come to pass and are not intended to predict the future performance of any specific Morgan Stanley Investment Management product. Certain information herein is based on data obtained from third party sources believed to be reliable. However, we have not verified this information, and we make no representations whatsoever as to its accuracy or completeness. The information herein is a general communications which is not impartial and has been prepared solely for information and educational purposes and does not constitute an offer or a recommendation to buy or sell any particular security or to adopt any specific investment strategy. The material contained herein has not been based on a consideration of any individual client circumstances and is not investment advice, nor should it be construed in any way as tax, accounting, legal or regulatory advice. To that end, investors should seek independent legal and financial advice, including advice as to tax consequences, before making any investment decision. There is no assurance that a strategy will achieve its investment objective. Portfolios are subject to market risk, which is the possibility that the market values of securities owned by the portfolio will decline. There is the risk that the Adviser’s asset allocation methodology and assumptions regarding the Underlying Portfolios may be incorrect in light of actual market conditions and the Portfolio may not achieve its investment objective. Share prices also tend to be volatile and there is a significant possibility of loss. Concentration in a single region may make the portfolio more volatile than one that invests globally. The portfolio’s investments in commodity-linked notes involve substantial risks, including risk of loss of a significant portion of their principal value. In addition to commodity risk, they may be subject to additional special risks, such as risk of loss of interest and principal, lack of secondary market and risk of greater volatility, that do not affect traditional equity and debt securities. Currency fluctuations could erase investment gains or add to investment losses. Derivative instruments can be illiquid, may disproportionately increase losses and may have a potentially large negative impact on the portfolio’s performance. The risks of investing in emerging market countries are greater than the risks generally associated with investments in foreign developed countries. In general, equity securities’ values also fluctuate in response to activities specific to a company. Fixed-income securities are subject to the ability of an issuer to make timely principal and interest payments (credit risk), changes in interest rates (interest-rate risk), the creditworthiness of the issuer and general market liquidity (market risk). In the current rising interest-rate environment, bond prices may fall and may result in periods of volatility and increased portfolio redemptions. Longer-term securities may be more sensitive to interest rate changes. In a declining interest-rate environment, the portfolio may generate less income. The use of leverage may increase volatility in the Portfolio. Stocks of small-capitalization companies carry special risks, such as limited product lines, markets and financial resources, and greater market volatility than securities of larger, more established companies. Charts and graphs provided herein are for illustrative purposes only. Past performance is no guarantee of future results. The indexes are unmanaged and do not include any expenses, fees or sales charges. It is not possible to invest directly in an index. Any index referred to herein is the intellectual property (including registered trademarks) of the applicable licensor. Any product based on an index is in no way sponsored, endorsed, sold or promoted by the applicable licensor and it shall not have any liability with respect thereto. The MSCI Emerging Markets Asia Index captures large and mid-cap representation across 8 Emerging Markets countries. With 535 constituents, the index covers approximately 85% of the free float-adjusted market capitalization in each country. The MSCI India Index measures the performance of the Indian equity market. The Tokyo Stock Price Index (TOPIX) is the composite index for the Tokyo Stock Exchange (TSE) tracking all domestic stocks from the First Section of the exchange. The index is a measure of the market value changes of the common stocks on the TSE. The MSCI Emerging Markets Europe, Middle East and Africa Index is a free float-adjusted market capitalization weighted index that is
designed to measure the equity market performance of the emerging market countries of Europe, the Middle East & Africa. The MSCI Emerging Markets Latin America Index is a free float-adjusted market capitalization index that is designed to measure equity market performance of emerging markets within Latin America. The MSCI Emerging Markets Latin America Index consists of the following 5 emerging market country indices: Brazil, Chile, Colombia, Mexico and Peru. The S&P 500® Index measures the performance of the large cap segment of the U.S. equities market, covering approximately 75% of the U.S. equities market. The Index includes 500 leading companies in leading industries of the U.S. economy. The EURO STOXX 50 Index is a market capitalization-weighted stock index of 50 large, blue chip European companies operating within Eurozone nations. The universe for selection is found within the 18 Dow Jones EURO STOXX Super sector indexes, from which members are ranked by size and placed on a selection list. The EURO STOXX Small Index is weighted by free-float market cap and represents the small cap companies of 11 Eurozone countries: Austria, Belgium, Finland, France, Germany, Ireland, Italy, Luxembourg, the Netherlands, Portugal and Spain.This communication is not a product of Morgan Stanley’s Research Department and should not be regarded as a research recommendation. The information contained herein has not been prepared in accordance with legal requirements designed to promote the independence of investment research and is not subject to any prohibition on dealing ahead of the dissemination of investment research. This commentary is only intended for, and will be only distributed to, persons resident in jurisdictions where distribution or availability would not be contrary to local laws or regulations. There is no guarantee that any investment strategy will work under all market conditions, and each investor should evaluate their ability to invest for the long-term, especially during periods of downturn in the market. Prior to investing, investors should carefully review the strategy’s / product’s relevant offering document. There are important differences in how the strategy is carried out in each of the investment vehicles.
EMEAThis communication was issued and approved in the United Kingdom by Morgan Stanley Investment Management Limited, 25 Cabot Square, Canary Wharf, London E14 4QA, authorized and regulated by the Financial Conduct Authority, for distribution to Professional Clients only and must not be relied upon or acted upon by Retail Clients (each as defined in the UK Financial Conduct Authority’s rules). Financial intermediaries are required to satisfy themselves that the information in this document is suitable for any person to whom they provide this document in view of that person’s circumstances and purpose. MSIM shall not be liable for, and accepts no liability for, the use or misuse of this document by any such financial intermediary. If such a person considers an investment she/he should alwa ys ensure that she/he has satisfied herself/himself that she/he has been properly advised by that financial intermediary about the suitability of an investment.
U.S.A separately managed account may not be suitable for all investors. Separate accounts managed according to the Strategy include a number of securities and will not necessarily track the performance of any index. Please consider the investment objectives, risks and fees of the Strategy carefully before investing. A minimum asset level is required. For important information about the investment manager, please refer to Form ADV Part 2.
Please consider the investment objectives, risks, charges and expenses of the funds carefully before investing. The prospectuses contain this and other information about the funds. To obtain a prospectus please download one at morganstanley.com/im or call 1-800-548-7786. Please read the prospectus carefully before investing.Morgan Stanley Distribution, Inc. serves as the distributor for Morgan Stanley Funds.
NOT FDIC INSURED | OFFER NOT BANK GUARANTEED | MAY LOSE VALUE | NOT INSURED BY ANY FEDERAL GOVERNMENT AGENCY | NOT A BANK DEPOSIT
HONG KONGThis document has been issued by Morgan Stanley Asia Limited for use in Hong Kong and shall only be made available to “professional investors” as defined under the Securities and Futures Ordinance of Hong Kong (Cap 571). The contents of this document have not been reviewed nor approved by any regulatory authority including the Securities and Futures Commission in Hong Kong. Accordingly, save where an exemption is available under the relevant law, this document shall not be issued, circulated, distributed, directed at, or made available to, the public in Hong Kong.

7SOLUTIONS & MULTI-ASSET | MORGAN STANLEY INVESTMENT MANAGEMENT
SINGAPOREThis document should not be considered to be the subject of an invitation for subscription or purchase, whether directly or indirectly, to the public or any member of the public in Singapore other than (i) to an institutional investor under section 304 of the Securities and Futures Act, Chapter 289 of Singapore (“SFA”), (ii) to a “relevant person” (which includes an accredited investor) pursuant to section 305 of the SFA, and such distribution is in accordance with the conditions specified in section 305 of the SFA; or (iii) otherwise pursuant to, and in accordance with the conditions of, any other applicable provision of the SFA. In particular, for investment funds that are not authorized or recognized by the MAS, units in such funds are not allowed to be offered to the retail public; any written material issued to persons as aforementioned in connection with an offer is not a prospectus as defined in the SFA and, accordingly, statutory liability under the SFA in relation to the content of prospectuses does not apply, and investors should consider carefully whether the investment is suitable for them.
AUSTRALIA This publication is disseminated in Australia by Morgan Stanley Investment Management (Australia) Pty Limited ACN: 122040037, AFSL No. 314182, which accept responsibility for its contents. This publication, and any access to it, is intended only for “wholesale clients” within the meaning of the Australian Corporations Act. All information contained herein is proprietary and is protected under copyright law. Morgan Stanley Investment Management is the asset management division of Morgan Stanley. This document may be translated into other languages. Where such a translation is made this English version remains definitive. If there are any discrepancies between the English version and any version of this document in another language, the English version shall prevail.

© 2017 Morgan Stanley CRC 1904331 Exp. 9/25/2018 9037138 Lit-Link: GBAROUTLOOK-0917A4
Explore our site at www.morganstanley.com/im


![Untitled-1 [] Company... · 2018. 1. 16. · Smad Construction Smad Sm Smad Construction mad Construction nstruction MAD Smad Construction MAD' Smad Construction MAD Smad Construction](https://img.pdfslide.us/doc/110x75/60b16e4aa21c90011033e8c0/untitled-1-company-2018-1-16-smad-construction-smad-sm-smad-construction.jpg)