Embed Size (px)
Citation preview
District Statistical Handbook 2015-16 Page 1
“We have the duty of formulating, of summarising and of communicating our conclusions, in intelligence form, in recognition of the right of ‘other’ free minds to utilize them in making ‘their own decisions’.”
-R.A.Fisher
(Father of Statistics)
“It is easy to lie with statistics. It is hard to tell the truth without statistics”.
-Andrejs Dunkels
District Statistical Handbook 2015-16 Page 2
PREFACE
The publication of “District Statistical Hand Book 2015-16 -
Salem” presents the latest statistical data on various Socio-Economic
aspects of Salem District. Statistical Tables presented in this book
highlight the trends in the development and progress in various
sectors of Salem District’s economy.
I extend my sincere thanks to Dr. V.Irai Anbu, I.A.S, Principal
Secretary/Commissioner, Department of Economics and Statistics,
Chennai, Thiru. V.Sampath, I.A.S, District Collector, Salem and
Thiru.K.Ravi Kumar, M.A., B.Ed., B.L., M.B.A., Regional Joint
Director of Statistics, Salem for their valuable support and
suggestions offered for enhancing the quality for this publication.
The co-operation extended by various Heads of Departments of
State and Central Governments, Public Sector Undertakings and
Other organizations in bringing out this book is acknowledged with
profound gratitude.It is hoped that this Hand Book will be a useful
reference book to Administrators, Planners, Scholars, Statisticians,
Economists and to all those who are interested in the Socio-
Economic Planning of Salem District.
I express my appreciation to all the Officers and Staff of this
office for compiling the data relating to this Hand Book.
Suggestions for improving future compilations are most welcome.
Place: Salem
Date:
DeputyDirector of Statistics,
Salem
District Statistical Handbook 2015-16 Page 3

District Statistical Handbook 2015-16 Page 4
District Statistical Handbook 2015-16 Page 5

District Statistical Handbook 2015-16 Page 6

District Statistical Handbook 2015-16 Page 7
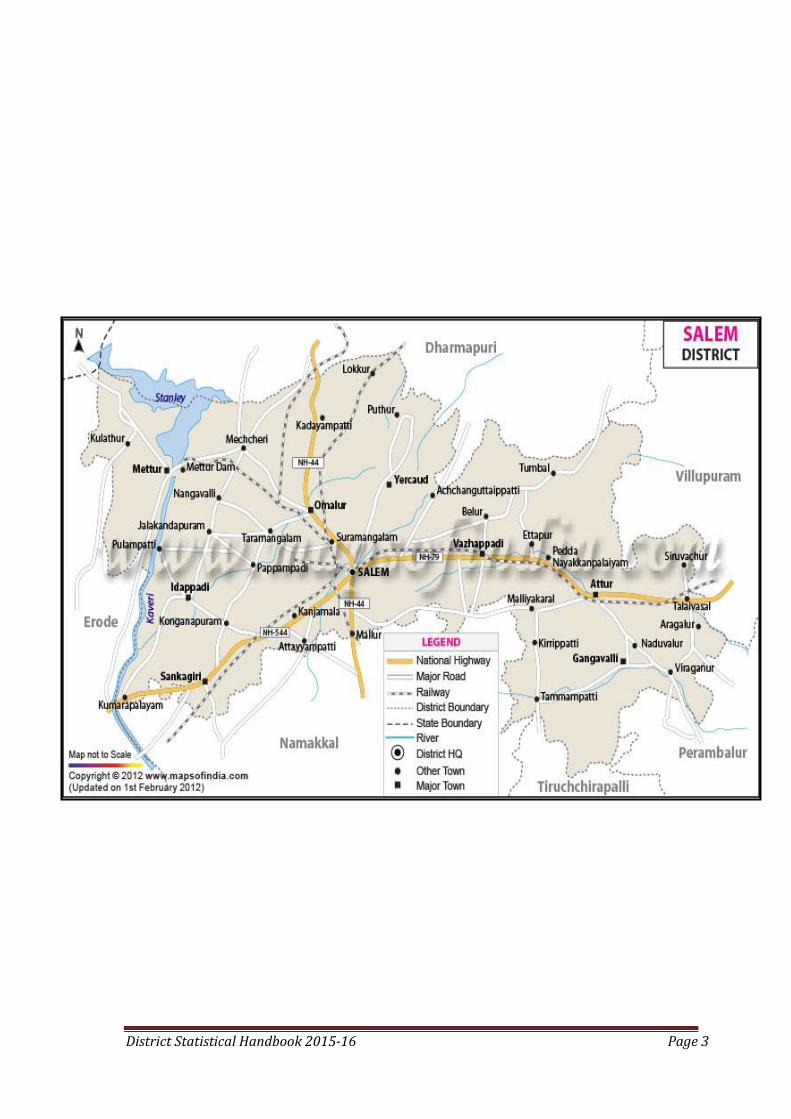
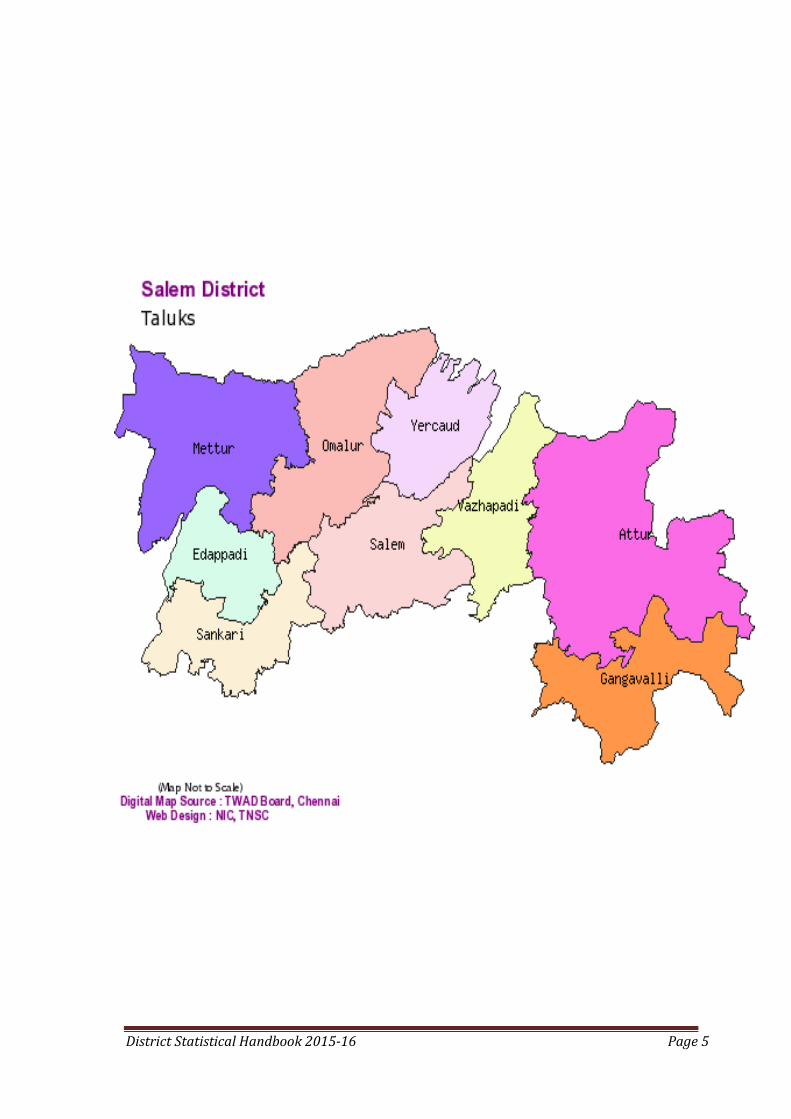
SALIENT FEATURES OF SALEM DISTRICT
I. PHYSICAL FEATURE
Salem is one of the biggest districts and it is centrally situated in Tamil
Nadu. It is a Geologist‘s paradise, surrounded by hills and the landscape dotted with
hillocks. Salem has vibrant culture dating back to the ancient Kongu Nadu. As a
district, Salem has its singinficance in various aspects such as Mango Cultivation,
Silver Ornaments, Textiles, Sago industries and Steel production. It has thirteen
taluks. During the year 2014-15, Salem West, Salem South and
Pethanaikkanpalayam are newly formed taluks in this district. There are many things
in Salem that are noteworthy by its virtue of its location and social set-up.
II. AREA AND POPULATION
Salem district‘s geographical area is 5245 sq.kms. While Salem district
occupies the 9th
rank among the districts in Tamil Nadu in regard to size, the
population of Salem district occupies 5th
rank among districts in Tamil Nadu. As per
2001 census 53.65% persons are in rural areas and remaining 46.35% persons are in
urban areas. The population of Scheduled castes and Scheduled tribes in the district
are 15.5% and 3.50% respectively. The density of population as per 2001 census
573.
As per the population census 2011, the total population of the district is 34,
82,056 of which 17, 81,571 are males and the remaining 1700485 are females. The
percentage of decadal growth rate of population has declined to 15.37 % during 2001-11
from 17.2& of 1991-2001. The sex ratio has gone up to 954 females per 1000 males as per
census 2011 when compared to 929 females per 1000 males in 2001 census. It is ranked as
31st among all districts of the State in respect of sex ratio. The population density per square
kilometer has increased to 663 in census 2011 from 575 of the pervious census 2001.
Salem District has been ranked at 5th place according to the most populous district
in the State and its share to the State‘s total population is 4.82%.
The overall literacy rate of Salem District as per 2011 census is 73.86% with males‘
literacy rate at 80.24 % and females‘ literacy rate at 65.15%. The corresponding literacy
rates of combined, males and females were 65.09%, 74.4% and 55.2% respectively in 2001
census.
District Statistical Handbook 2015-16 Page 8
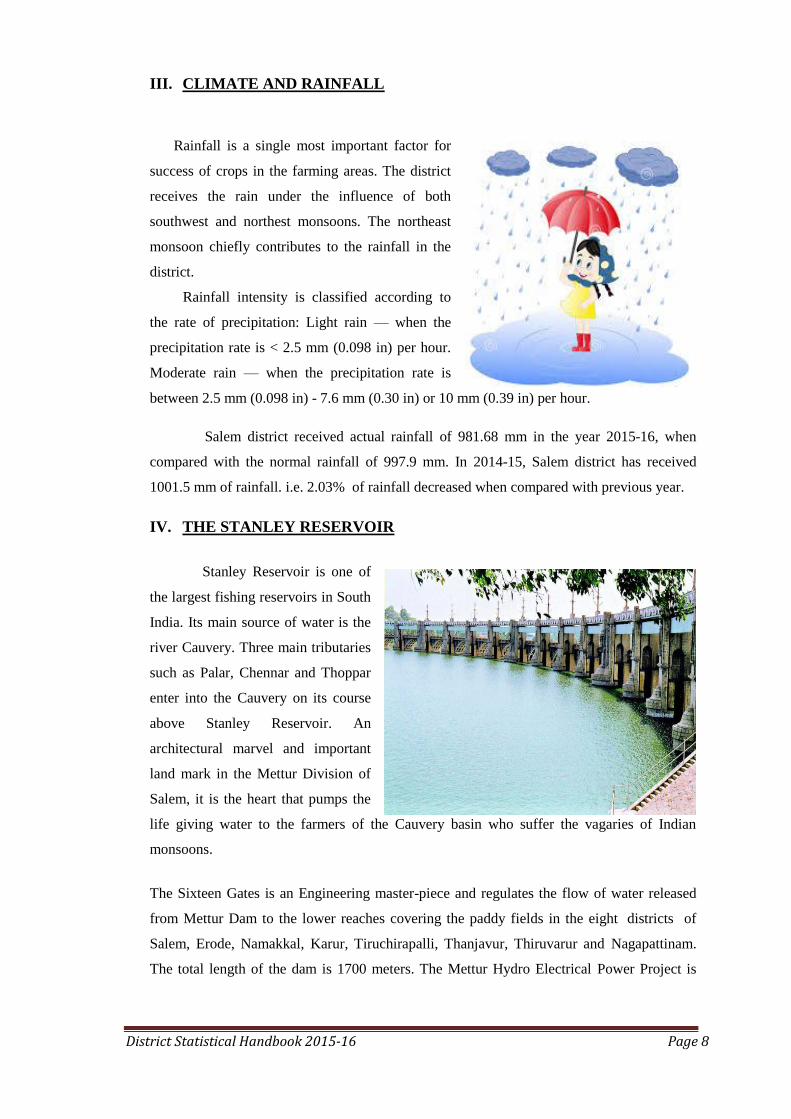
III. CLIMATE AND RAINFALL
Rainfall is a single most important factor for
success of crops in the farming areas. The district
receives the rain under the influence of both
southwest and northest monsoons. The northeast
monsoon chiefly contributes to the rainfall in the
district.
Rainfall intensity is classified according to
the rate of precipitation: Light rain — when the
precipitation rate is < 2.5 mm (0.098 in) per hour.
Moderate rain — when the precipitation rate is
between 2.5 mm (0.098 in) - 7.6 mm (0.30 in) or 10 mm (0.39 in) per hour.
Salem district received actual rainfall of 981.68 mm in the year 2015-16, when
compared with the normal rainfall of 997.9 mm. In 2014-15, Salem district has received
1001.5 mm of rainfall. i.e. 2.03% of rainfall decreased when compared with previous year.
IV. THE STANLEY RESERVOIR
Stanley Reservoir is one of
the largest fishing reservoirs in South
India. Its main source of water is the
river Cauvery. Three main tributaries
such as Palar, Chennar and Thoppar
enter into the Cauvery on its course
above Stanley Reservoir. An
architectural marvel and important
land mark in the Mettur Division of
Salem, it is the heart that pumps the
life giving water to the farmers of the Cauvery basin who suffer the vagaries of Indian
monsoons.
The Sixteen Gates is an Engineering master-piece and regulates the flow of water released
from Mettur Dam to the lower reaches covering the paddy fields in the eight districts of
Salem, Erode, Namakkal, Karur, Tiruchirapalli, Thanjavur, Thiruvarur and Nagapattinam.
The total length of the dam is 1700 meters. The Mettur Hydro Electrical Power Project is
District Statistical Handbook 2015-16 Page 9
also quite large. Dam, park, major hydroelectric power stations and hills on all sides make
Mettur a good tourist attraction.
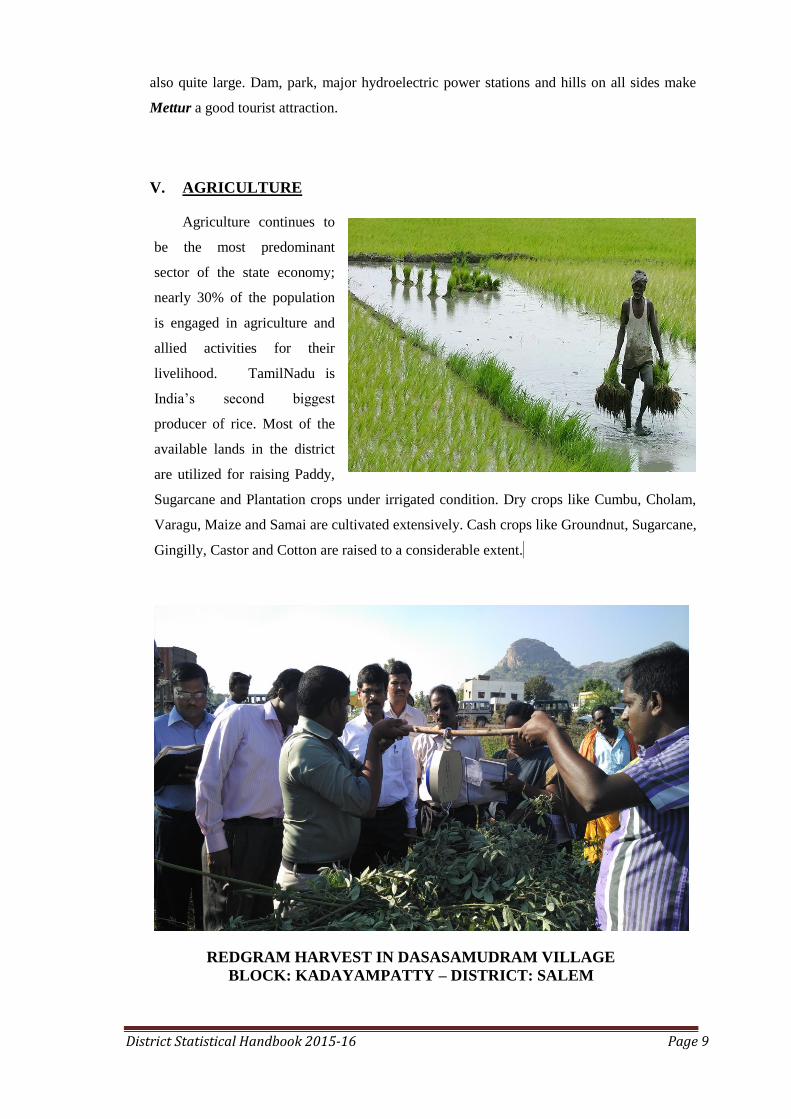
V. AGRICULTURE
Agriculture continues to
be the most predominant
sector of the state economy;
nearly 30% of the population
is engaged in agriculture and
allied activities for their
livelihood. TamilNadu is
India‘s second biggest
producer of rice. Most of the
available lands in the district
are utilized for raising Paddy,
Sugarcane and Plantation crops under irrigated condition. Dry crops like Cumbu, Cholam,
Varagu, Maize and Samai are cultivated extensively. Cash crops like Groundnut, Sugarcane,
Gingilly, Castor and Cotton are raised to a considerable extent. 0
REDGRAM HARVEST IN DASASAMUDRAM VILLAGE
BLOCK: KADAYAMPATTY – DISTRICT: SALEM
District Statistical Handbook 2015-16 Page 10
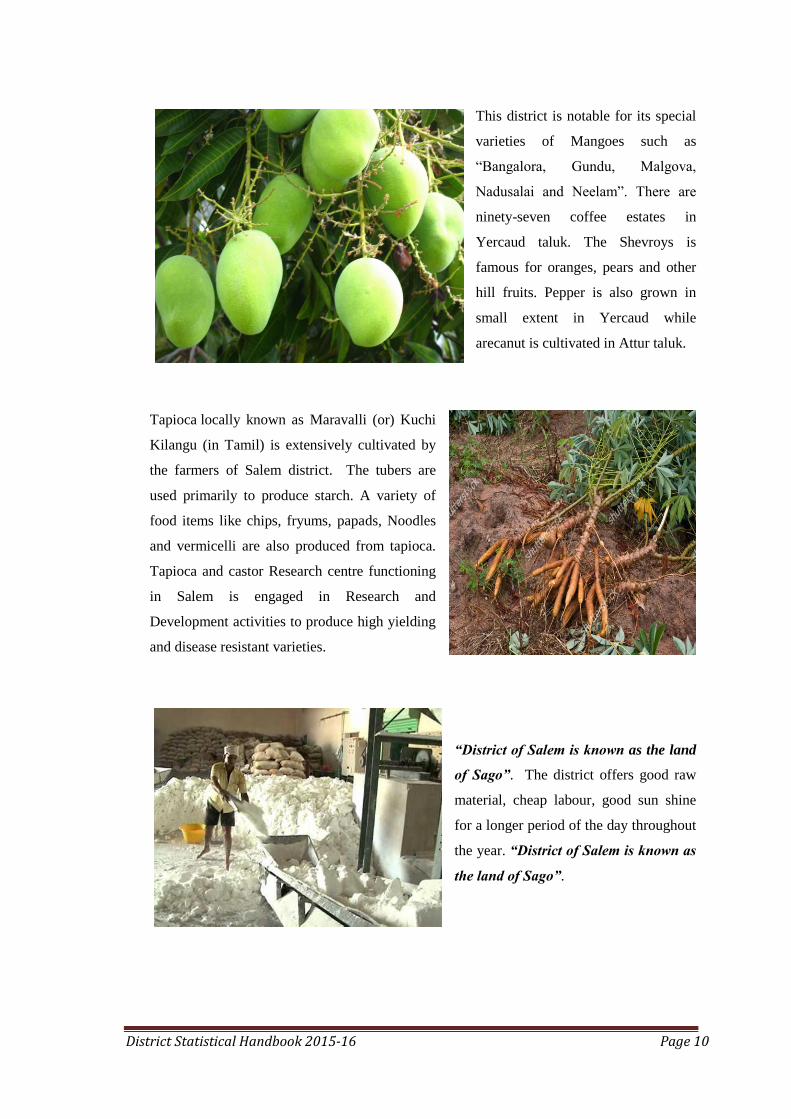
This district is notable for its special
varieties of Mangoes such as
―Bangalora, Gundu, Malgova,
Nadusalai and Neelam‖. There are
ninety-seven coffee estates in
Yercaud taluk. The Shevroys is
famous for oranges, pears and other
hill fruits. Pepper is also grown in
small extent in Yercaud while
arecanut is cultivated in Attur taluk.
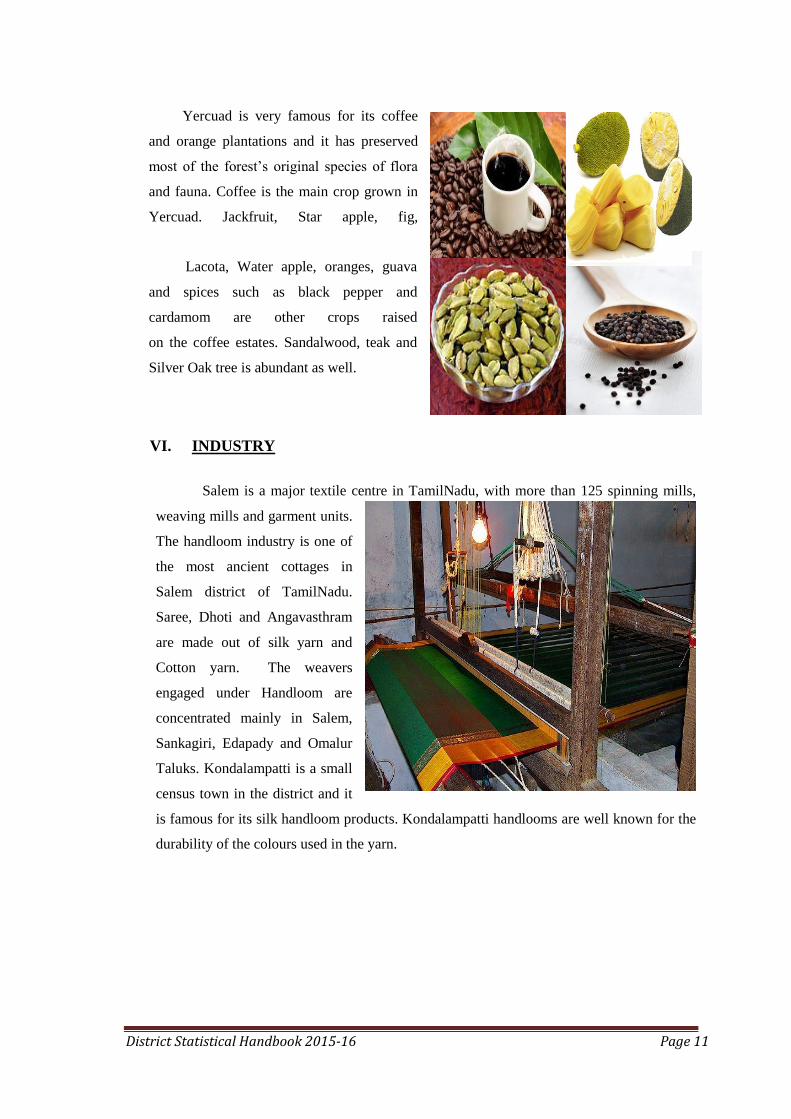
Tapioca locally known as Maravalli (or) Kuchi
Kilangu (in Tamil) is extensively cultivated by
the farmers of Salem district. The tubers are
used primarily to produce starch. A variety of
food items like chips, fryums, papads, Noodles
and vermicelli are also produced from tapioca.
Tapioca and castor Research centre functioning
in Salem is engaged in Research and
Development activities to produce high yielding
and disease resistant varieties.
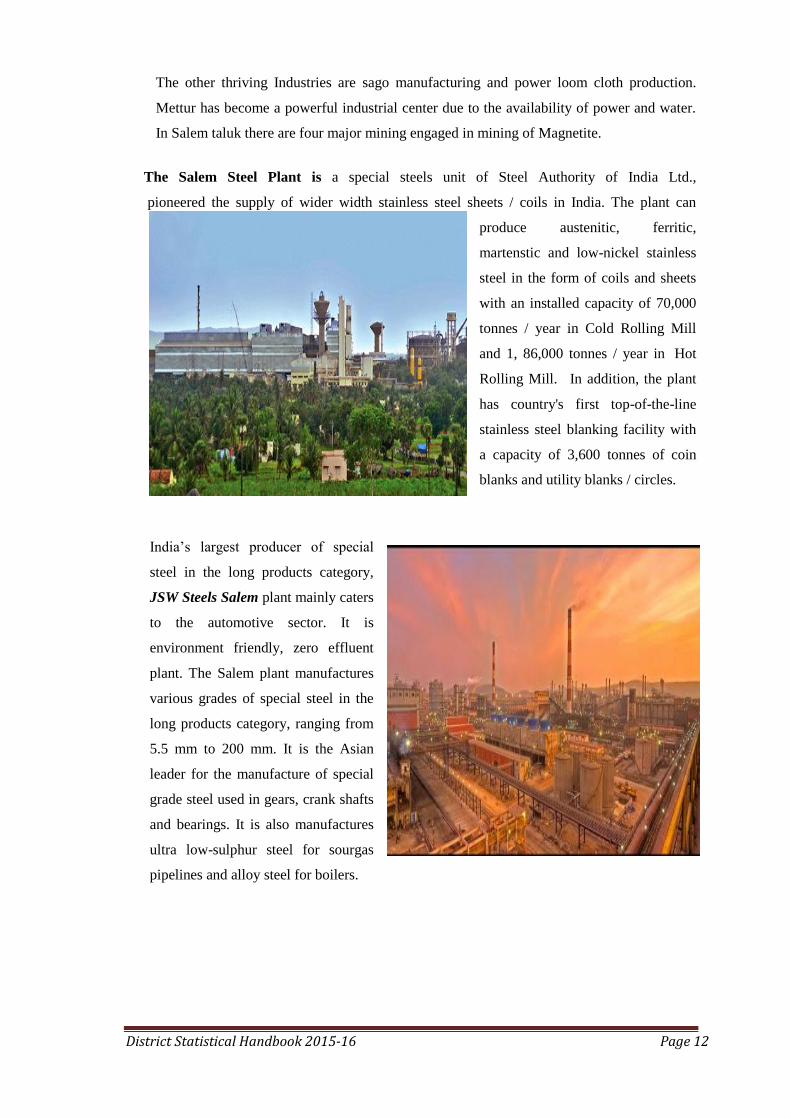
“District of Salem is known as the land
of Sago”. The district offers good raw
material, cheap labour, good sun shine
for a longer period of the day throughout
the year. “District of Salem is known as
the land of Sago”.
District Statistical Handbook 2015-16 Page 11
Yercuad is very famous for its coffee
and orange plantations and it has preserved
most of the forest‘s original species of flora
and fauna. Coffee is the main crop grown in
Yercuad. Jackfruit, Star apple, fig,
Lacota, Water apple, oranges, guava
and spices such as black pepper and
cardamom are other crops raised
on the coffee estates. Sandalwood, teak and
Silver Oak tree is abundant as well.
VI. INDUSTRY
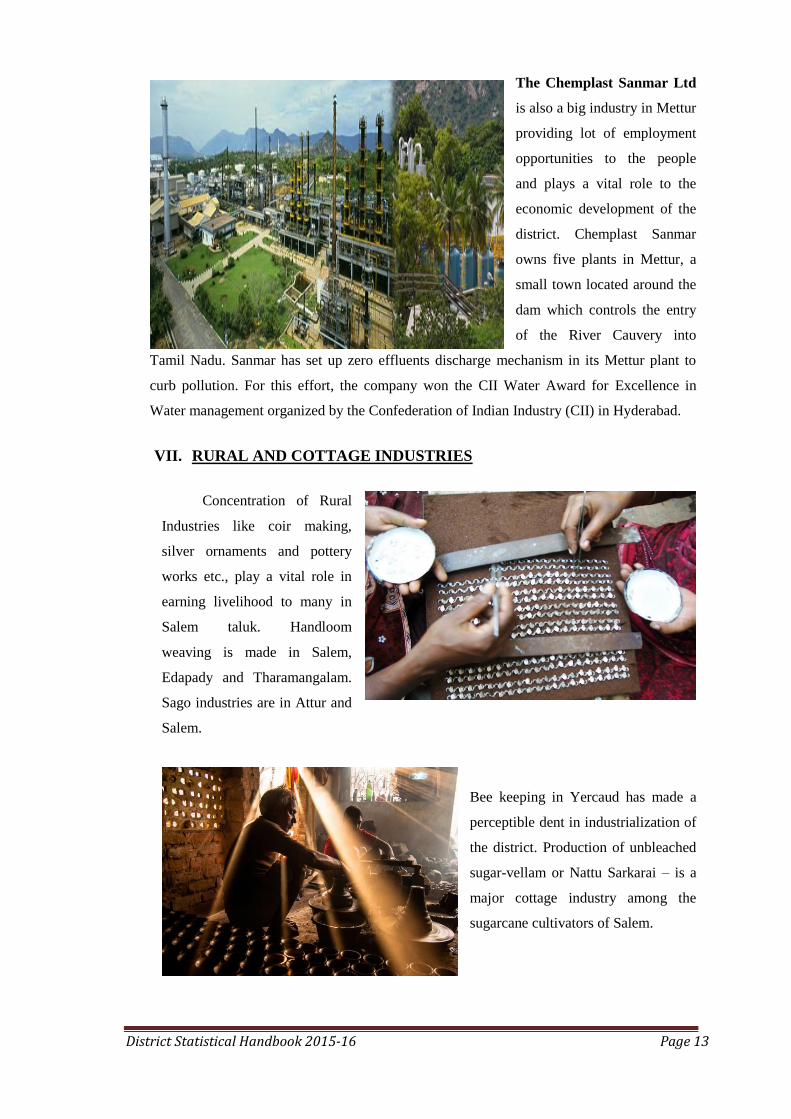
Salem is a major textile centre in TamilNadu, with more than 125 spinning mills,
weaving mills and garment units.
The handloom industry is one of
the most ancient cottages in
Salem district of TamilNadu.
Saree, Dhoti and Angavasthram
are made out of silk yarn and
Cotton yarn. The weavers
engaged under Handloom are
concentrated mainly in Salem,
Sankagiri, Edapady and Omalur
Taluks. Kondalampatti is a small
census town in the district and it
is famous for its silk handloom products. Kondalampatti handlooms are well known for the
durability of the colours used in the yarn.
District Statistical Handbook 2015-16 Page 12
The other thriving Industries are sago manufacturing and power loom cloth production.
Mettur has become a powerful industrial center due to the availability of power and water.
In Salem taluk there are four major mining engaged in mining of Magnetite.
The Salem Steel Plant is a special steels unit of Steel Authority of India Ltd.,
pioneered the supply of wider width stainless steel sheets / coils in India. The plant can
produce austenitic, ferritic,
martenstic and low-nickel stainless
steel in the form of coils and sheets
with an installed capacity of 70,000
tonnes / year in Cold Rolling Mill
and 1, 86,000 tonnes / year in Hot
Rolling Mill. In addition, the plant
has country's first top-of-the-line
stainless steel blanking facility with
a capacity of 3,600 tonnes of coin
blanks and utility blanks / circles.
India‘s largest producer of special
steel in the long products category,
JSW Steels Salem plant mainly caters
to the automotive sector. It is
environment friendly, zero effluent
plant. The Salem plant manufactures
various grades of special steel in the
long products category, ranging from
5.5 mm to 200 mm. It is the Asian
leader for the manufacture of special
grade steel used in gears, crank shafts
and bearings. It is also manufactures
ultra low-sulphur steel for sourgas
pipelines and alloy steel for boilers.
District Statistical Handbook 2015-16 Page 13
The Chemplast Sanmar Ltd
is also a big industry in Mettur
providing lot of employment
opportunities to the people
and plays a vital role to the
economic development of the
district. Chemplast Sanmar
owns five plants in Mettur, a
small town located around the
dam which controls the entry
of the River Cauvery into
Tamil Nadu. Sanmar has set up zero effluents discharge mechanism in its Mettur plant to
curb pollution. For this effort, the company won the CII Water Award for Excellence in
Water management organized by the Confederation of Indian Industry (CII) in Hyderabad.
VII. RURAL AND COTTAGE INDUSTRIES
Concentration of Rural
Industries like coir making,
silver ornaments and pottery
works etc., play a vital role in
earning livelihood to many in
Salem taluk. Handloom
weaving is made in Salem,
Edapady and Tharamangalam.
Sago industries are in Attur and
Salem.
Bee keeping in Yercaud has made a
perceptible dent in industrialization of
the district. Production of unbleached
sugar-vellam or Nattu Sarkarai – is a
major cottage industry among the
sugarcane cultivators of Salem.
District Statistical Handbook 2015-16 Page 14
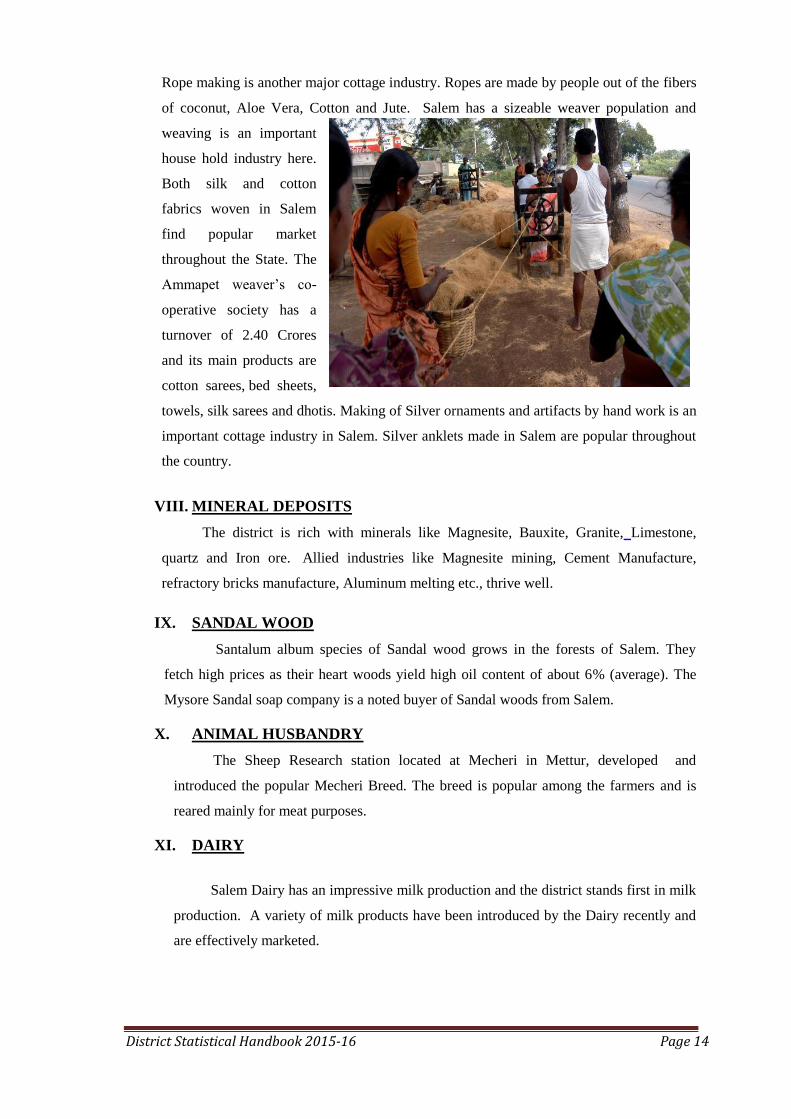
Rope making is another major cottage industry. Ropes are made by people out of the fibers
of coconut, Aloe Vera, Cotton and Jute. Salem has a sizeable weaver population and
weaving is an important
house hold industry here.
Both silk and cotton
fabrics woven in Salem
find popular market
throughout the State. The
Ammapet weaver‘s co-
operative society has a
turnover of 2.40 Crores
and its main products are
cotton sarees, bed sheets,
towels, silk sarees and dhotis. Making of Silver ornaments and artifacts by hand work is an
important cottage industry in Salem. Silver anklets made in Salem are popular throughout
the country.
VIII. MINERAL DEPOSITS
The district is rich with minerals like Magnesite, Bauxite, Granite, Limestone,
quartz and Iron ore. Allied industries like Magnesite mining, Cement Manufacture,
refractory bricks manufacture, Aluminum melting etc., thrive well.
IX. SANDAL WOOD
Santalum album species of Sandal wood grows in the forests of Salem. They
fetch high prices as their heart woods yield high oil content of about 6% (average). The
Mysore Sandal soap company is a noted buyer of Sandal woods from Salem.
X. ANIMAL HUSBANDRY
The Sheep Research station located at Mecheri in Mettur, developed and
introduced the popular Mecheri Breed. The breed is popular among the farmers and is
reared mainly for meat purposes.
XI. DAIRY
Salem Dairy has an impressive milk production and the district stands first in milk
production. A variety of milk products have been introduced by the Dairy recently and
are effectively marketed.

District Statistical Handbook 2015-16 Page 15
XII. CINEMA THEATRES
Salem was once a popular Tinsel town where the earlier Tamil movies were
created in the Modern Theatres. The people of Salem are great movie viewers and the
popularity of cinema is evident from the fact that there are nearly a hundred and odd
Theatres in the district-perhaps the largest in any district. Nevertheless these industries
are reduced due to developing of modern Technologies nowadays.
XIII. TEMPLES
Many temples with intricate sculptures
and imposing towers are found in the
district of Salem, built by indigenous
rulers‘ centuries before the British era.
Some of the popular temples are the
Taramangalam Shivan Temple in
Omalur and the Sukavaneswarar
temple, Kottai Mariamman temple,
Parsanna Venkatesha Perumal temple
in Salem.
XIV. FORT
Forts had existed in Salem
town and Omalur said to have
been visited by Tipu Sultan.
Uncared for not even the ruins
of these monuments remain to
be seen today. However at
Sankagiri an impressive fort is
seen on a hillock, with its
elaborate and massive
ramparts running all the way
up the hill. This fort is said to
have been the holding of ―Theeran Chinnamalai‖ – an indigenous warrior who fought
against British oppression.

District Statistical Handbook 2015-16 Page 16
XV. TOURISM
Yercuad is a hill station and popular
summer resort in Salem. It is located
in the Shevaroys range of hills in the
Eastern Ghats, the yercuad hill area
is called the “Shevoray Hills” and it
is also called as “Jewel of the
South”. The Shervarayan temple
deep inside a narrow cavern with a
rivulet rippling behind the idols is
one of the main spots of tourist
attraction.
‗Kurunji‘ once in twelve years also attracts tourists. Coffee, spices like
cardomom, pepper, fruits like "Kamala" Orange, butter fruit, Jack fruit are grown in
Yercaud and find good market. Yercaud houses many colonial buildings and churches.
The prestigious residential school “The Montfort School” is at Yercaud. Yercaud is
populary known as poorer Ooty.
District Statistical Handbook 2015-16 Page 17
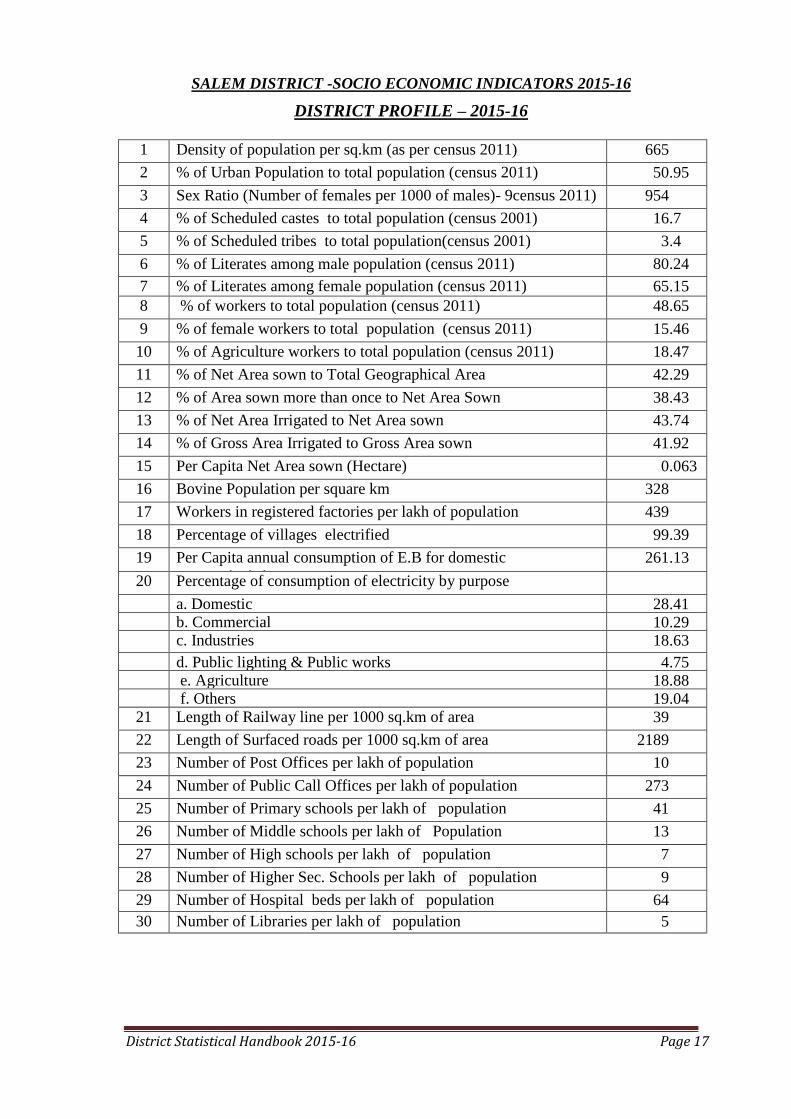
SALEM DISTRICT -SOCIO ECONOMIC INDICATORS 2015-16
DISTRICT PROFILE – 2015-16
1 Density of population per sq.km (as per census 2011) 665
2 % of Urban Population to total population (census 2011) 50 .95
3 Sex Ratio (Number of females per 1000 of males)- 9census 2011) 954
4 % of Scheduled castes to total population (census 2001) 16 .7
5 % of Scheduled tribes to total population(census 2001) 3 .4
6 % of Literates among male population (census 2011) 80
.24
7 % of Literates among female population (census 2011) 65 .15
8 % of workers to total population (census 2011) 48 .65
9 % of female workers to total population (census 2011) 15 .46
10 % of Agriculture workers to total population (census 2011) 18 .47
11 % of Net Area sown to Total Geographical Area 42 .29
12 % of Area sown more than once to Net Area Sown 38 .43
13 % of Net Area Irrigated to Net Area sown 43 .74
14 % of Gross Area Irrigated to Gross Area sown 41 .92
15 Per Capita Net Area sown (Hectare) 0 .063
16 Bovine Population per square km 328
17 Workers in registered factories per lakh of population 439
18 Percentage of villages electrified 99 .39
19 Per Capita annual consumption of E.B for domestic
purpose(units)
261 .13
20 Percentage of consumption of electricity by purpose
a. Domestic 28 .41 b. Commercial 10 .29 c. Industries 18 .63
d. Public lighting & Public works 4 .75 e. Agriculture
18 .88 f. Others 19 .04
21 Length of Railway line per 1000 sq.km of area 39
22 Length of Surfaced roads per 1000 sq.km of area 2189
23 Number of Post Offices per lakh of population 10
24 Number of Public Call Offices per lakh of population 273
25 Number of Primary schools per lakh of population 41
26 Number of Middle schools per lakh of Population 13
27 Number of High schools per lakh of population 7
28 Number of Higher Sec. Schools per lakh of population 9
29 Number of Hospital beds per lakh of population 64
30 Number of Libraries per lakh of population
5
District Statistical Handbook 2015-16 Page 18
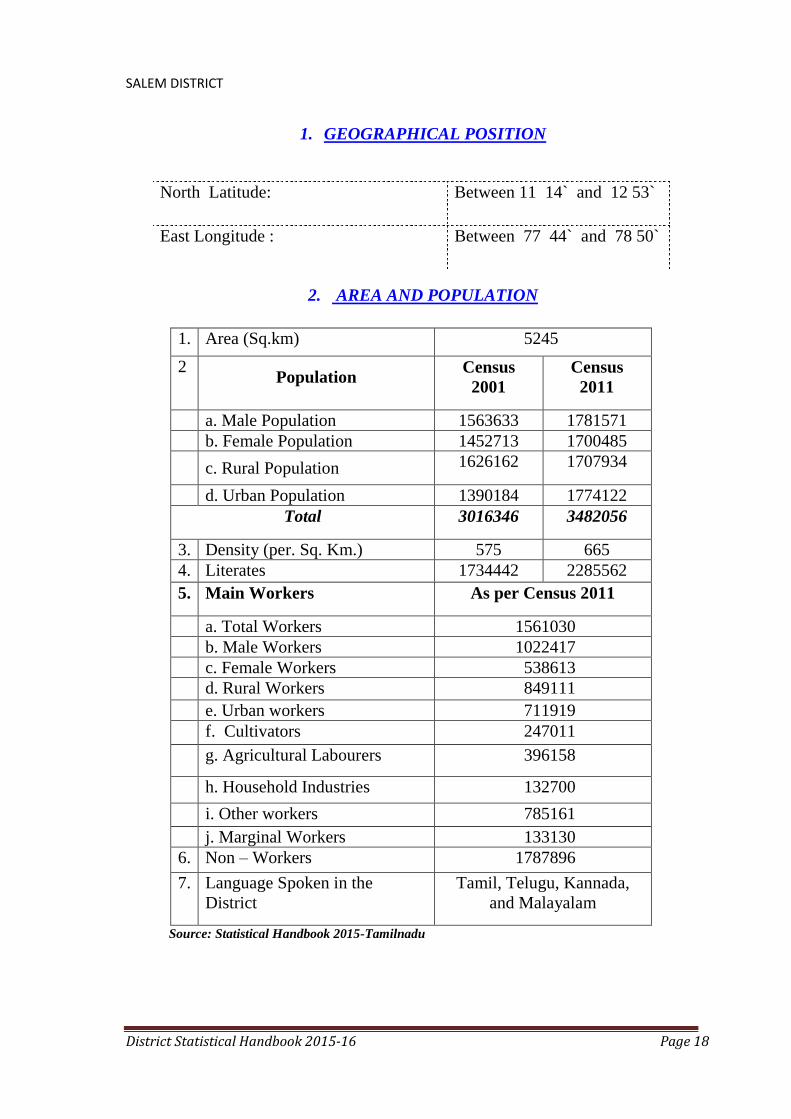
SALEM DISTRICT
1. GEOGRAPHICAL POSITION
North Latitude: Between 11 14` and 12 53`
East Longitude : Between 77 44` and 78 50`
2. AREA AND POPULATION
1. Area (Sq.km) 5245
2 Population
Census
2001
Census
2011
a. Male Population 1563633 1781571
b. Female Population 1452713 1700485
c. Rural Population 1626162 1707934
d. Urban Population 1390184 1774122
Total 3016346 3482056
3. Density (per. Sq. Km.) 575 665
4. Literates 1734442 2285562
5. Main Workers As per Census 2011
a. Total Workers 1561030
b. Male Workers 1022417
c. Female Workers 538613
d. Rural Workers 849111
e. Urban workers 711919
f. Cultivators 247011
g. Agricultural Labourers 396158
h. Household Industries 132700
i. Other workers 785161
j. Marginal Workers 133130
6. Non – Workers 1787896
7. Language Spoken in the
District
Tamil, Telugu, Kannada,
and Malayalam
Source: Statistical Handbook 2015-Tamilnadu

District Statistical Handbook 2015-16 Page 19
Fig .1.Forecasting Population for 2021-2041
3. VITAL STATISTICS 2015-16
S.No. Details Nos.
1. Birth 51217
2. Death 17729
3. Infant Details(Death)
4.
Birth Rate (per 1000 population)
a. Rural 16.2
b. Urban 12.1
5.
Death Rate (per 1000 Population)
a. Rural 6.1
b. Urban 3.1
c. Combined 5.2
6. Infant Mortality rate (per 1000 live births)
a. Rural
b. Urban
c. Combined
-
14532
7. Expectation of life at birth
a. Male
b. Female
8. Number of Deaths of women due to problems
related to child birth
a) At the time of delivery 1
b)During Pregnancy 10
c).After Child birth (within 42 days) 30

District Statistical Handbook 2015-16 Page 20
4. TEMPERATURE (IN DEGREE CELCIUS) 2015-16
a. Plains
1. Maximum 39.5
2. Minimum 17.0
b. Hill Station (Yercaud)
1. Maximum
2. Minimum
Source: Indian Meteorological Department
5. RAINFALL ( MM ) 2015-16
a. Normal
1. South West 471.9
2. North East 309.5
b. Actual
1. South West 378.3
2. North East 400.6
Source: Indian Meteorological Department

District Statistical Handbook 2015-16 Page 21
6. AGRICULTURE
S.Number Details Year : 2015-16
a. Total Cultivated area (Hectares) 304745.600
b. Net Area sown (Hectares) 220138.195
c. Area Sown more than once
(Hectares)
84607.405
d. Area and production of principal
crops
Area
(Hectares)
in “000”
Production
“000”
(Tonnes)
1. Rice 24713.805
2. Millets and Other Cereals 115671.880
3. Pulses 63980.195
4. Sugarcane 8255.475
5. Groundnut 21818.285
6. Gingelly 3317.070
7. Cotton (Lints) 12467.270
e. Agricultural land Holdings (2015-16)
1. Holdings 318159
2. Area (Hectares) 266464.618
3. Average size of holdings
(Hectares)
0.840
f. a. Important Food Crops Paddy, Cholam, Cumbu, Ragi
Redgram, Greengram,
Blackgram, Horsegram,
Turmeric, Sugarcane, Mango,
Banana, Tapioca, Groundnut
& Gingelly
b. Important Non-food Crops Cotton, Castor Seed, Coffee
and Fodder Crops
Source: District G-Return 2015-16 of Salem

District Statistical Handbook 2015-16 Page 22
7. IRRIGATION
S.Number Source of Irrigation Year : 2015-16
1. Net Area irrigated by (Hectares)
a. Government Canals 1770.00
b. Private Canals --
c. Tanks --
d. Tube wells 18801.09
e. Other wells 75733.42
f. Other sources --
Total Net Area Irrigated 96304.51
2. Gross Area irrigated 127751.48
3. Name of Rivers Cauveri, Sarabanga
Nathi, Vasista Nathi and
Suvetha Nathi
4. Name of Lakes Govindavadi Eri,
Ayyanar Koil Eri,
Mookaneri Eri, Attur
Pudu Eri, Umayalpuram
Eri, Thedavoor Eri,
Arangaloor Eri,
Sendarapatty Eri,
Naduvalur Eri, Sarvoy
Perioya Eri
jangamasamuthiram Eri
and Vadaman Eri.
Source: District G-return 2015-16 of Salem

District Statistical Handbook 2015-16 Page 23
8. ANIMAL HUSBANDRY
S.Number Items Year : 2015-
16 1. VETERINARY INSTITUTIONS
a. Veterinary Hospitals 6
b. Veterinary Dispensaries 132
c. Clinical Centres
d. Sub Centres
0
21
2. POULTRY DEVELOPMENT
a. Chicks produced in hatcheries (Nos.) 2070500
b. Birds Sold for breeding (Nos.) 931400
c. Birds sold for food (Nos.) 1139100
3. LIVESTOCK CENSUS(2004)
Livestock and Poultry population
a. Cattle 558323
b. Buffaloes 79841
c. Sheep 345608
d. Goat 449203
e. Poultry 4360450
Source: Joint Director of Animal Husbandry, Salem
9. DAIRY DEVELOPMENT
S.Number Subject Year : 2015-16 a. Diaries 1 b. Milk Chilling Plants 1 c. No of Milk Co-op Societies Registered 705 Functioning 611
d. Milk Production (Lakh Litres) Flush Season 3.79810(Average per day)
Lean Season 3.52653(Average per day)
Source: Deputy Director of Cooperative Milk Societies, Salem
10. FISHERIES
S.No Subject Year: 2015-16 1. Length of Coastal Line (KM) NIL 2. Number of Coastal Blocks NIL 3. No of Coastal Centres NIL 4. Marine Fish Production (Tonnes) NIL 5. Inland Fish Production (Tonnes) 1713.614
Source: Assistant Director of Fisheries, Mettur Dam

District Statistical Handbook 2015-16 Page 24
11. FOREST
S.No Subject Year :2015-16 1. Forest Area (Hect.) 126540 a. Reserved Forests 103104 b. Unclassified Forests 858 c. Reserved Lands 22578
2. Out-Turn of Forest Products a. Firewood (MT) 2699.752 b. Sandalwood (Heart wood) (MT) 101426.750 c. Sandalwood (Sapwood) (MT) 2000.000 d. Tamarind (MT) 58.767 e. Curry Leaves (MT) 2.300 f. Eanchi (MT) 3.300 g. Vilangai (MT) 0.100 h. Jack Fruits (MT) 1.200 i. Pulpwood (MT) 327.914 j. Other MFP (MT) 2.985 k. Coconut (Nos.) 164 l. Palmyra Fruits (Nos.) 3200
Source: Conservator of Forests, Salem Circle, Salem
12. ELECTRICITY
S.Number Subject Year :2015-16
1. GENERATION OF ELECTRICITY ( in
M.U)
a. HYDRO 4613.59700
b. WIND MILL GENERATION NIL
c. THERMAL 6232.972
d. POWER PURCHASED NIL
e. GAS TRUBINE NIL
2. CONSUMPTION OF ELECTRITY (In. M. U.) (In %)
a. Agriculture 664.43 20.73
b. Industry 690.87 23.74
c. Commercial 265.72 7.49
d. Domestic 1436.46 40.58
e. Public Lighting & Water
works
128.48 4.10
f. Sales to Licenses 2.32 0.5
g. Sales to Other States 0.0 0.0
h. Miscellaneous 25.32 3.32
3. RURAL ELECTRIFICATION
Nos. Area
Irrigated

District Statistical Handbook 2015-16 Page 25
a. Number of Pump sets
Energized
136032 148824
Hecs. Total. Electrified
b. Electrified (Villages) 653 Nos. 649 Nos.
Total Electrified
c. Electrified (Hamlets) 5555 Nos. 5549 Nos.
Source: S.E, TNEB, Salem & Mettur Circles
13. ENTERPRISES
S.Number Number of Enterprises Rural Urban
1 Number of Agricultural Enterprises 9671 2093
2 Number of Non-Agricultural Enterprises 28046 30960
Number of Enterprises
a).With Premises 25604 27900
b). Without Premises 12113 5153
Source: Economic Census
14. INDUSTRIES
Year: 2015-16
1. No of Working Factories (Registered) 808
2. No of Man days Worked (Lakhs) 88.540
3. No of Trade Unions
a. During 2011-2012 14
b. Up to March 2012 1547
4. No of Strikes 4
5. No of Lockouts 4
6. Large Scale Industries 31
7. Medium Scale Industries 12
8. Small Scale Industries
a. During 2011-2012 N.A
b. Up to March 2012 1226
9. Cottage Industries
a. During 2011-2012 N.A
b. Up to March 2012 15
10. Others
a. During 2011-2012 N.A
b. Up to March 2012 N.A
11. NAME OF THE IMPORTANT INDUSTRIES
1. S.P.SUPER FINE COTTON MILLS P LTD. CUDDALUR MAIN ROAD,
ATTUR
2. RASI TEXTILES P LTD., CUDALURE MAIN ROAD, ATTUR
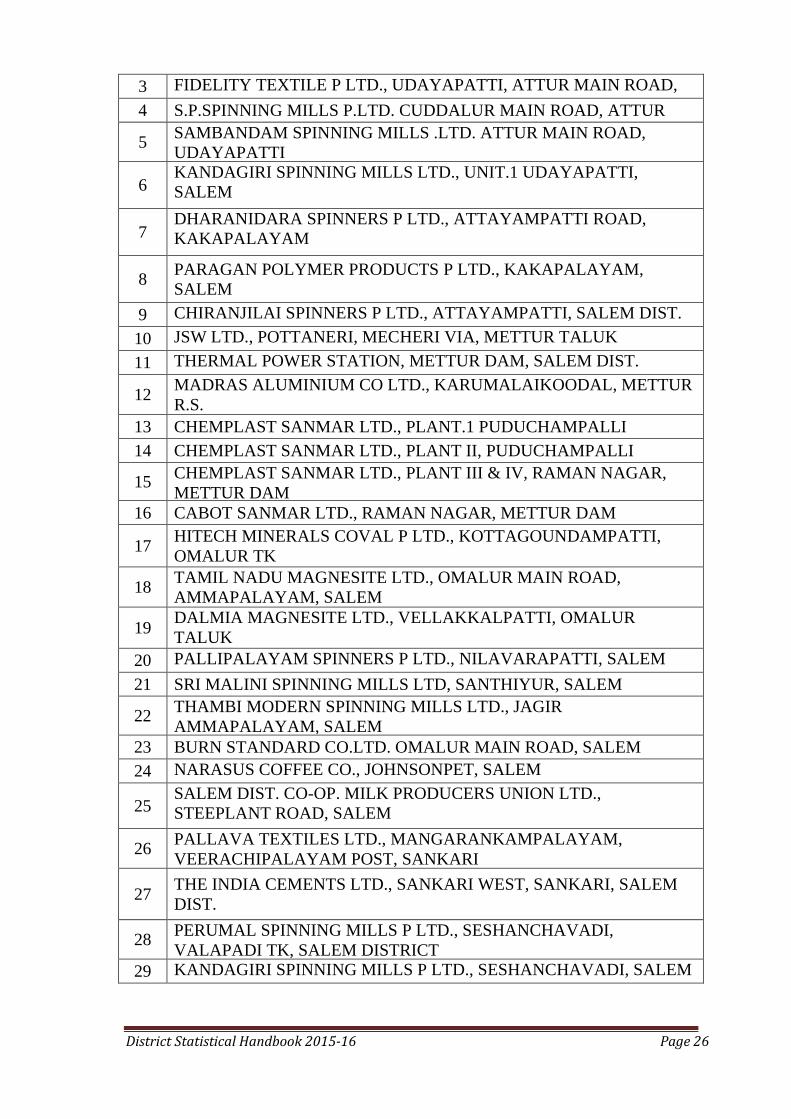
District Statistical Handbook 2015-16 Page 26
3 FIDELITY TEXTILE P LTD., UDAYAPATTI, ATTUR MAIN ROAD,
SALEM 4 S.P.SPINNING MILLS P.LTD. CUDDALUR MAIN ROAD, ATTUR
5 SAMBANDAM SPINNING MILLS .LTD. ATTUR MAIN ROAD,
UDAYAPATTI
6
KANDAGIRI SPINNING MILLS LTD., UNIT.1 UDAYAPATTI,
SALEM
7 DHARANIDARA SPINNERS P LTD., ATTAYAMPATTI ROAD,
KAKAPALAYAM
8 PARAGAN POLYMER PRODUCTS P LTD., KAKAPALAYAM,
SALEM
9 CHIRANJILAI SPINNERS P LTD., ATTAYAMPATTI, SALEM DIST.
10 JSW LTD., POTTANERI, MECHERI VIA, METTUR TALUK
11 THERMAL POWER STATION, METTUR DAM, SALEM DIST.
12
MADRAS ALUMINIUM CO LTD., KARUMALAIKOODAL, METTUR
R.S.
13 CHEMPLAST SANMAR LTD., PLANT.1 PUDUCHAMPALLI
14 CHEMPLAST SANMAR LTD., PLANT II, PUDUCHAMPALLI
15 CHEMPLAST SANMAR LTD., PLANT III & IV, RAMAN NAGAR,
METTUR DAM
16 CABOT SANMAR LTD., RAMAN NAGAR, METTUR DAM
17 HITECH MINERALS COVAL P LTD., KOTTAGOUNDAMPATTI,
OMALUR TK
18 TAMIL NADU MAGNESITE LTD., OMALUR MAIN ROAD,
AMMAPALAYAM, SALEM
19
DALMIA MAGNESITE LTD., VELLAKKALPATTI, OMALUR
TALUK
20 PALLIPALAYAM SPINNERS P LTD., NILAVARAPATTI, SALEM
21 SRI MALINI SPINNING MILLS LTD, SANTHIYUR, SALEM
22 THAMBI MODERN SPINNING MILLS LTD., JAGIR
AMMAPALAYAM, SALEM
23 BURN STANDARD CO.LTD. OMALUR MAIN ROAD, SALEM
24 NARASUS COFFEE CO., JOHNSONPET, SALEM
25
SALEM DIST. CO-OP. MILK PRODUCERS UNION LTD.,
STEEPLANT ROAD, SALEM
26
PALLAVA TEXTILES LTD., MANGARANKAMPALAYAM,
VEERACHIPALAYAM POST, SANKARI
27
THE INDIA CEMENTS LTD., SANKARI WEST, SANKARI, SALEM
DIST.
28 PERUMAL SPINNING MILLS P LTD., SESHANCHAVADI,
VALAPADI TK, SALEM DISTRICT
29 KANDAGIRI SPINNING MILLS P LTD., SESHANCHAVADI, SALEM
DIST.
District Statistical Handbook 2015-16 Page 27
30 SALEM STEEL PLANT, ALAGUSAMUDRAM, THARAMANGALAM
MAIN ROAD, SALEM.
31 SAMBANDAM SIVA TETILES LTD., KATTUVEPPILLAIPATTI,
SESHANCHAVADI PO, 32 HUTSON DIARYPVT. LTD, KARUMAMPURAM
33 L.S.P. OIL MILLS PVT LTD, SALEM
34 SONAL VYPAR PVT LTD, SALEM-2
12. Name of the Industrial Park Nil
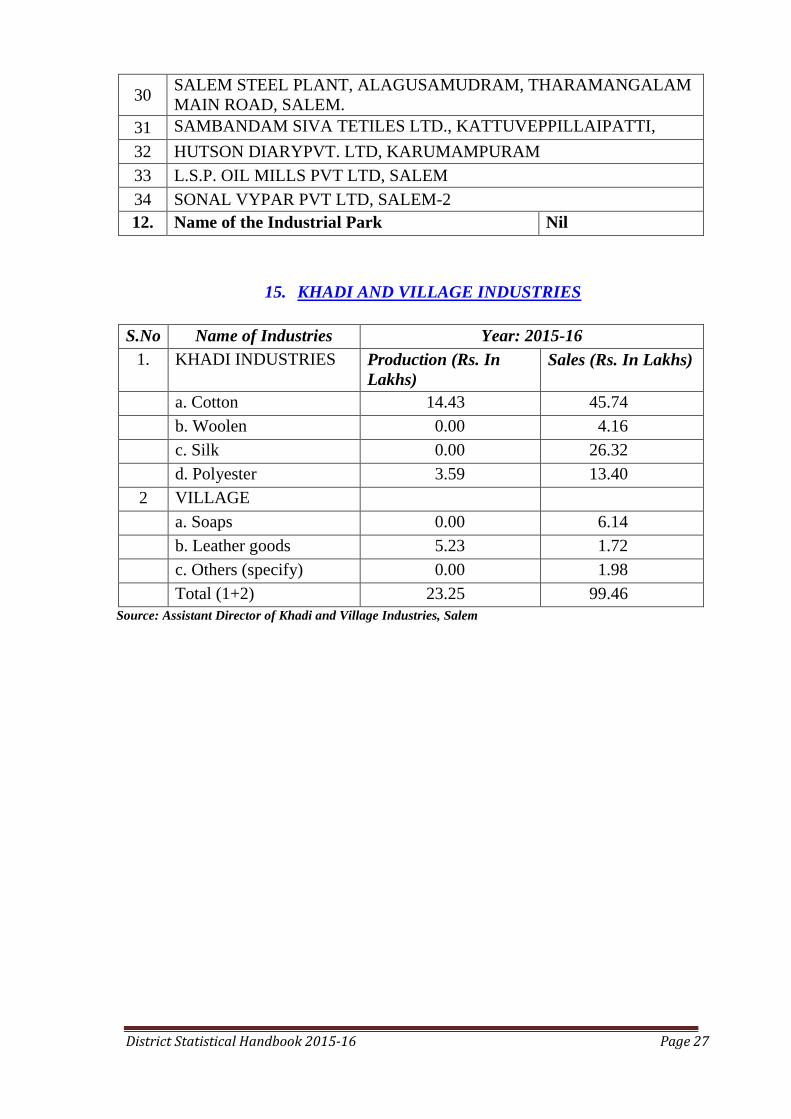
15. KHADI AND VILLAGE INDUSTRIES
S.No Name of Industries Year: 2015-16
1. KHADI INDUSTRIES Production (Rs. In
Lakhs)
Sales (Rs. In Lakhs)
a. Cotton 14.43 45.74
b. Woolen 0.00 4.16
c. Silk 0.00 26.32
d. Polyester 3.59 13.40
2 VILLAGE
INDUSTRIES
a. Soaps 0.00 6.14
b. Leather goods 5.23 1.72
c. Others (specify) 0.00 1.98
Total (1+2) 23.25 99.46
Source: Assistant Director of Khadi and Village Industries, Salem

District Statistical Handbook 2015-16 Page 28
16. MEDICAL AND HEALTH
1. Modern Medicine Nos.
a. No of Hospitals 11
b. Dispensaries 1
c. Primary Health Centres 85
d. Urban Health Centres 20
e. Health Sub Centres 398
f. Other Medical Institutions (MMU) 21
g. Beds in Hospitals and Dispensaries 2635
h. Total Number of Doctors 474
i. Total Number of Nurses 729
2. Indian Medicine
a. No of Hospitals 14
b. Dispensaries 6
c. Primary Health Centres 24
d. Beds in Hospitals and Dispensaries
e. Total Number of Doctors 41
f. Total Number of Nurses 15
3. Homeopathy
a. No of Hospitals 3
b. Dispensaries NIL
c. Primary Health Centres 1
c. Beds in Hospitals and Dispensaries NIL
d. Total Number of Doctors 3
e. Total Number of Nurses NIL
Source: Head of Concerned Health & Medical Departments, Salem

District Statistical Handbook 2015-16 Page 29
17. EDUCATION
S.No Category of Institutions Year:2015-16
1 Universities 2
2 Arts and Science Colleges 20
3. Colleges for Professional Education
a. Medicine
1. Allopathic 3
2. Indian Medicine (Siddha) 1
3. Homeopathy 2
b. Engineering Colleges 20
c. Agriculture Colleges -
d. Veterinary Colleges -
e. Law College 1
4 College for Special Education (Nursing) 6
5 Pre-Primary Schools 248
6 Primary Schools 1422
7 Middle Schools 428
8 High Schools 241
9 Higher Secondary Schools 288
10 Teacher Training Institute 37
11 Number of Fresh Entries (male, Female) N.A
12 Number of students passed at Xth Std 42598
13. Number of Students Passed at XIIth Std 29008
13. Number of Children never enrolled in School N.A
Source: Concerned Heads of Departments, Salem District

District Statistical Handbook 2015-16 Page 30
18. TRANSPORT
1. ROAD LENGTH (KM)
a. National Highways 182.600
b. State Highways & Rural Roads 2441.163
c. Corporation & Municipalities Road 1169.654
d. Panchayat Union & Panchayat Road 8606.850
e. Town Panchayat & Township Road 1134.205
f. Others (Forest Roads) 85.985
2. REGISTERED MOTOR VEHICLES
a. Commercial 10684
b. Non- Commercial 58532
3. RAILWAY LENGTH(KM)
a. Route Length
1. Broad Gauge 797
2. Meter Gauge 65
b. Track Length
1. Broad Gauge 986
2. Meter Gauge 46
c. Number of Railway Stations 103
4 NUMBER OF SEA PORTS NIL
5 NUMBER OF AIRPORTS 1
6 NAME OF THE AIRPORT Kamalapuram
7 NAME OF THE SEA PORT NIL
8 NAME OF THE EXPORT COMMODITY Textiles, Yarn,
Granites, Readymade
Garments, Coir
products & Salem
Stainless Steel
9 NAME OF THE IMPORT COMMODITIES Pulses, Grams, Edible
Oil
Source: Concerned Authorities in Salem District

District Statistical Handbook 2015-16 Page 31
19. COMMUNICATION
1 Post & Telegraph
a. Post Offices Doing Postal Business Alone 374
b. Post Offices Doing Post & Telegraph Business N.A
2. Telephones
a. No of Telephones in use 135583
b. No of Public Call Offices 6979
c. No of Telephone Exchanges 143
Source: BSNL & Postal Departments, Salem District
20. CO-OPERATION
1 Primary Land Development Banks 6
2 Co-Operative APEX Banks (TNSC) NIL
3 District Central CO-operative Banks/ Branches 1
4 Urban Banks 8
5 Primary Agricultural Credit Societies 205
6 Housing Co-operative Societies --
7 Employees Co-operative Societies 98
8 Lift Irrigation Societies 1
9 Weavers Co-operative Societies -
10 Industrial Co-operative Societies -
11 Khadi & Village Industries Societies -
12 Primary Co-operative Societies(Lamp) 5
13 Co-Operative Sugar Mills NIL
14 Co-operative Marketing Societies 2
15 Others Co –operative Societies (Lamp&LCS) 7
Source: Joint registrar of Cooperatives Societies, Salem.
District Statistical Handbook 2015-16 Page 32
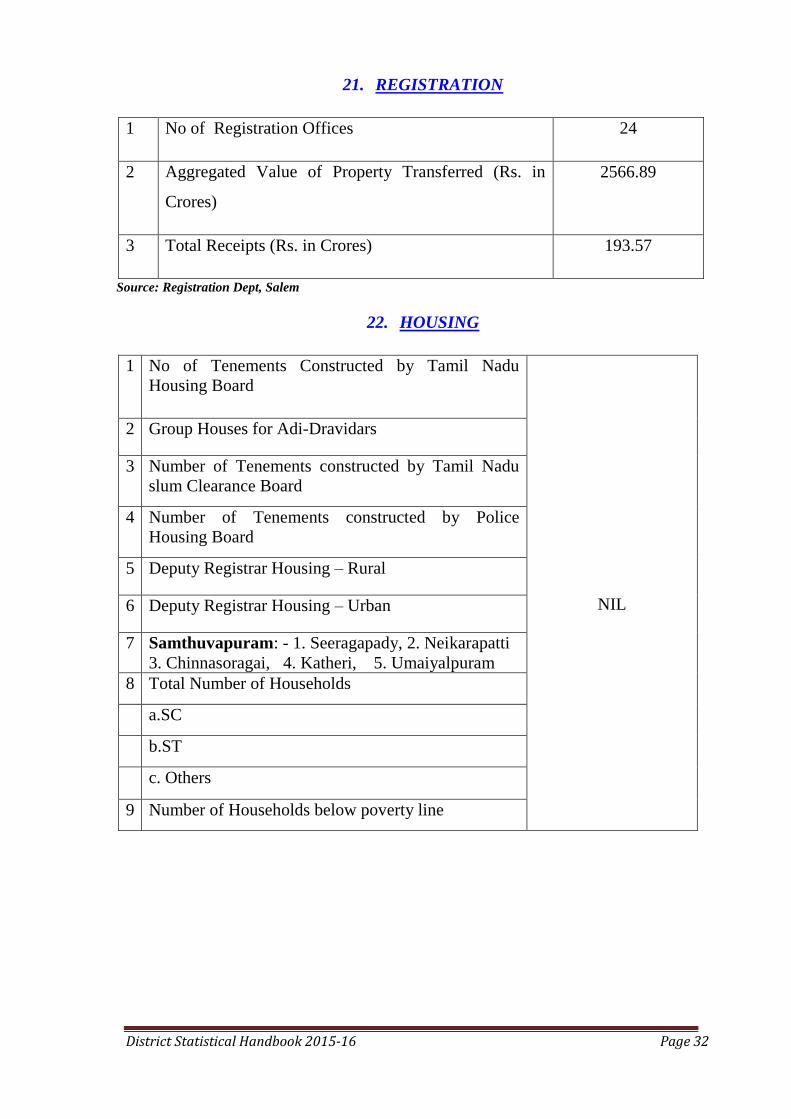
21. REGISTRATION
1 No of Registration Offices 24
2 Aggregated Value of Property Transferred (Rs. in
Crores)
2566.89
3 Total Receipts (Rs. in Crores) 193.57
Source: Registration Dept, Salem
22. HOUSING
1 No of Tenements Constructed by Tamil Nadu
Housing Board
NIL
2 Group Houses for Adi-Dravidars
3 Number of Tenements constructed by Tamil Nadu
slum Clearance Board
4 Number of Tenements constructed by Police
Housing Board
5 Deputy Registrar Housing – Rural
6 Deputy Registrar Housing – Urban
7 Samthuvapuram: - 1. Seeragapady, 2. Neikarapatti
3. Chinnasoragai, 4. Katheri, 5. Umaiyalpuram
8 Total Number of Households
a.SC
b.ST
c. Others
9 Number of Households below poverty line

District Statistical Handbook 2015-16 Page 33
23. SOCIAL WELFARE (IN NOS)
1 Old age pensioners 79080
2 Destitute physically handicapped 2526
3 Destitute Widow Pension 38404
4 Destitute Agri. Labourer Pension 5435
5 Destitute & Deserted Widow Pension 13864
6 Unmarried Poor Women Pension 416
7 National Disabled Pension 2675
8 National Widow pension 17411
9 Women Welfare Co-operative Societies 2
10 Training Centres 5
11 Mahalir Mandram 1052
12 Women Development Centres
i) Group
ii) Member
1052
10955
13 Uzhavar Santhai: (Ammapettai, Dadagapatti,
Suramangalam, Attayampatti, Attur, Mettur,
Thammampatti)
7

District Statistical Handbook 2015-16 Page 34
24. NUTRITIOUS MEALS PROGRAMME
Name of Programme No of Centres No of Beneficiaries
1. P.T.M.G.R. 1794 221089
2. I.C.D.S. 2696 63973
25. REVENUE ADMINISTRATIVE DIVISIONS
1 Revenue Divisions 4
2 Revenue Taluks 13
3 Revenue Firkas 42
4 Revenue Villages 653
26. LOCAL BODIES
1 Corporations 1
2 Municipalities 3
3 Third Grade Municipality 1
4 Panchayat Unions 20
5 Village Panchayats 385
27. COMMUNITY DEVELOPMENT
1 No of Blocks Covered 20
2 Population Covered (Lakhs) 34.82
3 Area Covered (Sq. Km) 5205.30
District Statistical Handbook 2015-16 Page 35
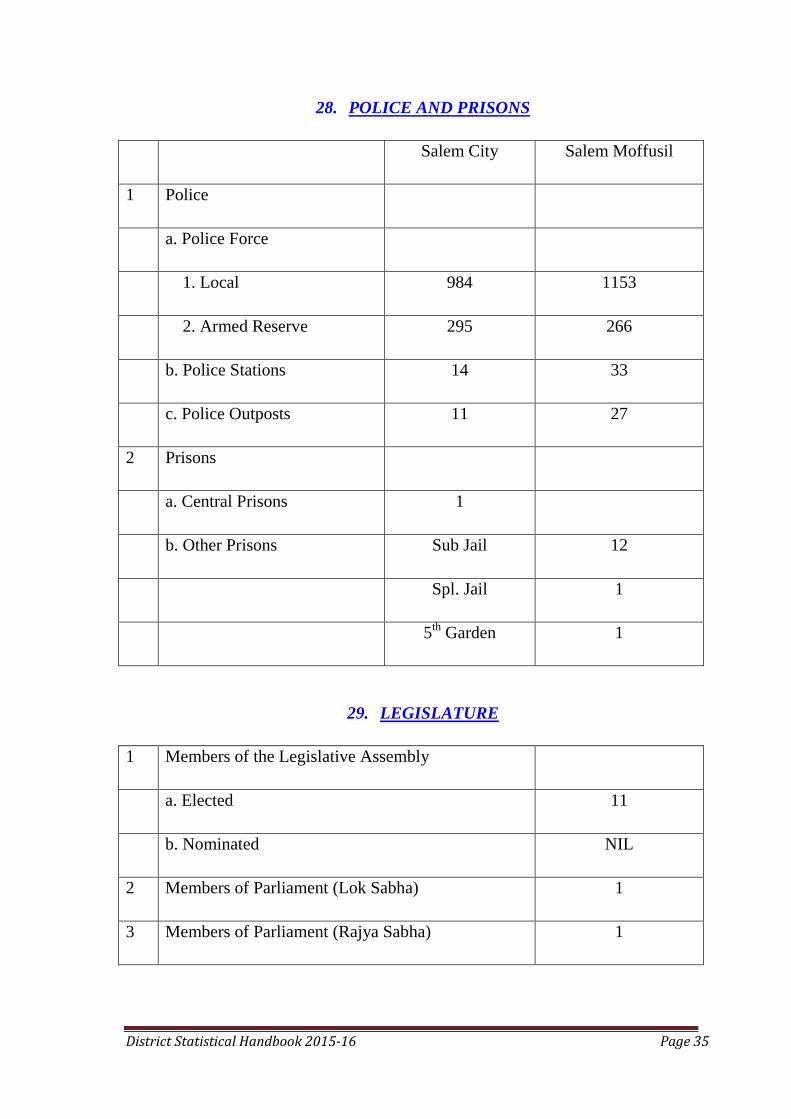
28. POLICE AND PRISONS
Salem City Salem Moffusil
1 Police
a. Police Force
1. Local 984 1153
2. Armed Reserve 295 266
b. Police Stations 14 33
c. Police Outposts 11 27
2 Prisons
a. Central Prisons 1
b. Other Prisons Sub Jail 12
Spl. Jail 1
5th
Garden 1
29. LEGISLATURE
1 Members of the Legislative Assembly
a. Elected 11
b. Nominated NIL
2 Members of Parliament (Lok Sabha) 1
3 Members of Parliament (Rajya Sabha) 1

District Statistical Handbook 2015-16 Page 36
30. CINEMA THEATRES
1 Permanent
a. Air-conditioned 17
b. Non Air- Conditioned 42
c. Air – cooled -
Total 59
2 Multiplex Cinema 1 (5Screens)
3 Permanent 50
3 Semi Permanent 4
4 Touring --
31. BANKING AND INSURANCE
1 a. Bank Offices 225
b. Primary Co-operative Societies 207
2 Life Insurance
a. Offices 8
b. Policies Issued 118809
c. Sum Assured (Rs. in Crores) 1508.00
District Statistical Handbook 2015-16 Page 37
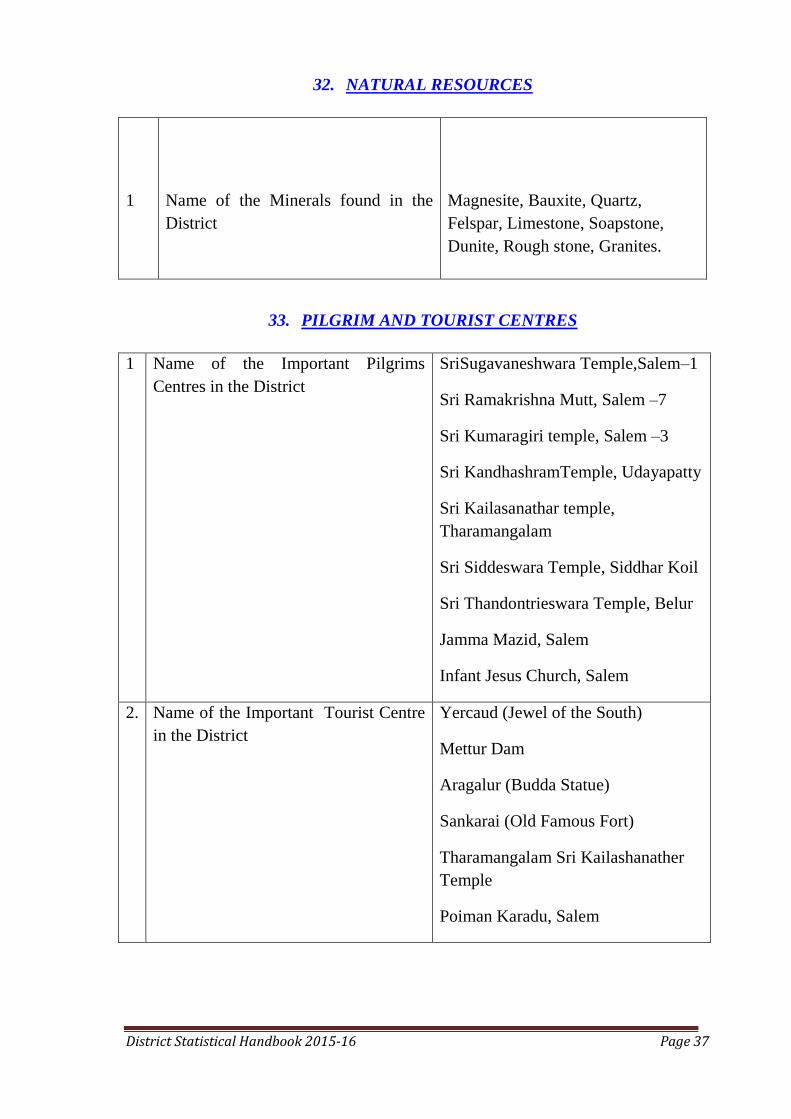
32. NATURAL RESOURCES
1
Name of the Minerals found in the
District
Magnesite, Bauxite, Quartz,
Felspar, Limestone, Soapstone,
Dunite, Rough stone, Granites.
33. PILGRIM AND TOURIST CENTRES
1 Name of the Important Pilgrims
Centres in the District
SriSugavaneshwara Temple,Salem–1
Sri Ramakrishna Mutt, Salem –7
Sri Kumaragiri temple, Salem –3
Sri KandhashramTemple, Udayapatty
Sri Kailasanathar temple,
Tharamangalam
Sri Siddeswara Temple, Siddhar Koil
Sri Thandontrieswara Temple, Belur
Jamma Mazid, Salem
Infant Jesus Church, Salem
2. Name of the Important Tourist Centre
in the District
Yercaud (Jewel of the South)
Mettur Dam
Aragalur (Budda Statue)
Sankarai (Old Famous Fort)
Tharamangalam Sri Kailashanather
Temple
Poiman Karadu, Salem

District Statistical Handbook 2015-16 Page 38
INDEX OF TABLES
Sl.
Number STATISTICAL TABLES 2015-16
Page
Number
1.AREA AND POPULATION
1.1(a) Tamil Nadu and Salem District- Provisional Population Totals, Rural
Urban- As per Census 2011
45
1.1(b) Area, Population, Literates, SCs and STs –Sex-wise by Taluk-
As per Census 2011 48
1.2 Population by Broad Industrial Categories of workers 49
1.3 Population by Religion 49
1.4 Population by Age Groups 50
1.5 Population of the District – Decennial Growth 50
1.6 Salient Features of 2011 Census – Block and Municipality wise 52
2.CLIMATE & RAINFALL
2.1 Temperature at Selected Stations 53
2.2 Monthly Rainfall Data – Station wise with maintaining Department
Particulars
54
2.3 Time Series Data of Rainfall by seasons 58
3.AGRICULTURE
3.1 Soil Classification 59
3.2 Land Utilisation 60
3.3 Area and Production of Crops 61
3.4 Agricultural Machinery and Implements 62
3.5 Number and Area of Operational Holdings 63
3.6 Consumption of Chemical Fertilizers and Pesticides 65
3.7 Regulated Markets 65
3.8 Crop Insurance Scheme 66
3.9 Sericulture 66
4.IRRIGATION
4.1 Sources of water supply with Command Area – Block wise 67
4.2 Actual Area Irrigated (Net and Gross) by Source 68
4.3 Area Irrigated by Crops 69
4.4 Details of Dams, Tanks, Wells and Bore wells 70
5.ANIMAL HUSBANDRY
5.1 Livestock Population 71
5.2 Veterinary Institutions and Animals treated – Block wise 72
5.3 Number of Veterinary Hospitals 73
5.4 Diary Development 73
5.5 Poultry Development 74
5.6 Fisheries Development and Production 75
6.BANKING AND INSURANCE
6.1 Number of Commercial Banks 76
6.2 Insurance Schemes 76
District Statistical Handbook 2015-16 Page 39
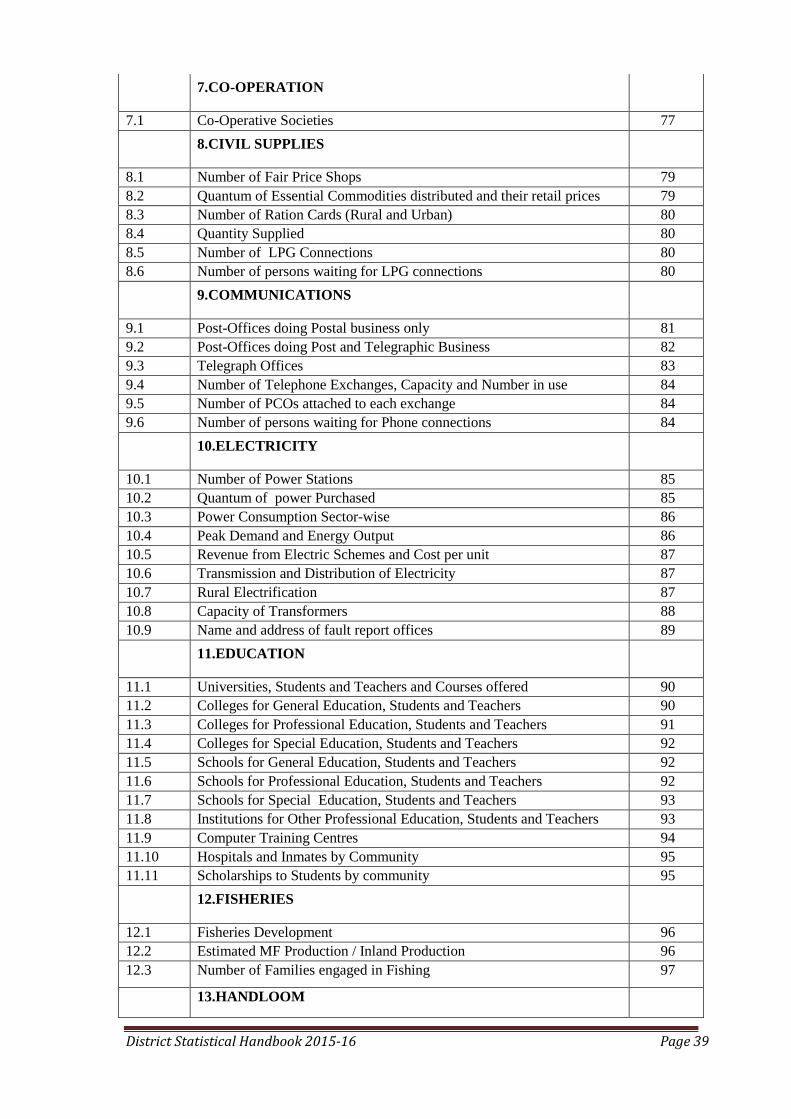
7.CO-OPERATION
7.1 Co-Operative Societies 77
8.CIVIL SUPPLIES
8.1 Number of Fair Price Shops 79
8.2 Quantum of Essential Commodities distributed and their retail prices 79
8.3 Number of Ration Cards (Rural and Urban) 80
8.4 Quantity Supplied 80
8.5 Number of LPG Connections 80
8.6 Number of persons waiting for LPG connections 80
9.COMMUNICATIONS
9.1 Post-Offices doing Postal business only 81
9.2 Post-Offices doing Post and Telegraphic Business 82
9.3 Telegraph Offices 83
9.4 Number of Telephone Exchanges, Capacity and Number in use 84
9.5 Number of PCOs attached to each exchange 84
9.6 Number of persons waiting for Phone connections 84
10.ELECTRICITY
10.1 Number of Power Stations 85
10.2 Quantum of power Purchased 85
10.3 Power Consumption Sector-wise 86
10.4 Peak Demand and Energy Output 86
10.5 Revenue from Electric Schemes and Cost per unit 87
10.6 Transmission and Distribution of Electricity 87
10.7 Rural Electrification 87
10.8 Capacity of Transformers 88
10.9 Name and address of fault report offices 89
11.EDUCATION
11.1 Universities, Students and Teachers and Courses offered 90
11.2 Colleges for General Education, Students and Teachers 90
11.3 Colleges for Professional Education, Students and Teachers 91
11.4 Colleges for Special Education, Students and Teachers 92
11.5 Schools for General Education, Students and Teachers 92
11.6 Schools for Professional Education, Students and Teachers 92
11.7 Schools for Special Education, Students and Teachers 93
11.8 Institutions for Other Professional Education, Students and Teachers 93
11.9 Computer Training Centres 94
11.10 Hospitals and Inmates by Community 95
11.11 Scholarships to Students by community 95
12.FISHERIES
12.1 Fisheries Development 96
12.2 Estimated MF Production / Inland Production 96
12.3 Number of Families engaged in Fishing 97
13.HANDLOOM

District Statistical Handbook 2015-16 Page 40
13.1 Number of Focal Centres with Location details 98
13.2 Number of Societies and Variety-wise Production 99
13.3 Number of Power Looms and Number of Employees working 99
13.4 Number of Families engaged 100
14.HANDICRAFTS
14.1 Name and Addresses of Handicrafts 101
14.2 Articles available in the Handicrafts 102
14.3 Value of Articles produced and Value of Articles Sold 103
14.4 Number of Families engaged in Handicrafts 104
15.HEALTH & FAMILY WELFARE
15.1 Hospitals, Dispensaries, Bed Strength, Doctors and Nurses 105
15.2 Number of allied Pathological Units available 105
15.3 Disease-wise Patients treated 106
15.4 Distribution of Medical Personnel 107
15.5 Progress of Family Welfare Programmes 107
16. HOUSING
16.1 Plans sanctioned, Building completed under Private Sector 108
16.2 Plans sanctioned, Building completed under Public Sector 108
16.3 Amount invested in Housing and Building activity under Public Sector 108
16.4 Construction Activity of Tamil Nadu Housing Board 109
16.5 Construction Activity of Tamil Nadu Slum Clearance Board 109
16.6 Index Number of Building Construction Cost in Urban Centres 110
16.7 Labour Charges of Construction Workers 110
17.INDUSTRIES
17.1 Results of ASI 111
17.2 Estimates of Value of Output and Value Added by Manufacturing by
Industries based on ASI
111
17.3 Industrial production 112
17.4 Production and Value of Major Minerals in the District 112
17.5 Production of Handloom Cloth 113
17.6 Small Scale Industries 114
17.7 Khadi and Village Industries 115
17.8 Number of Printing presses 115
17.9 Number of photocopy (Xerox) centres 116
18.FACTORIES
18.1 Registered and Working Factories 117
18.2 Employment in Working Factories 117
18.3 Trade Unions, Industrial Disputes by Strikes, Lockouts and Gheraos 118
19.LOCAL BODIES
19.1 Municipal Bodies Area and Population by Grades 119
19.2 Municipal Bodies by Taluks 119
19.3 Panchayat Union, Villages / Town Panchayats 120
19.4 Revenue Divisions, Taluks, Firkas and Revenue villages 120

District Statistical Handbook 2015-16 Page 41
19.5 Tax Collected by Corporation / Municipality / Panchayat Union/ Town
Panchayat/ Village Panchayat 120
19.6 Rural Development Activities 121
20.LABOUR AND EMPLOYMENT
20.1 Number of Persons registered during the year and Total Number of
Persons waiting up to the end of the year as per Live Register
122
20.2 Number of Placement during and up to the end of the year 122
21.LEGAL SERVICE
21.1 Judicial Division and Original Jurisdiction 123
21.2 Results of Civil and Criminal cases in the Court of Original Jurisdiction,
Civil Suits Regular 126
21.3 Nature of free Legal Services available and Number of Beneficiaries,
Number of cases disposed of in Lok Adalat during the year 127
21.4 Number of Advocates practicing in Courts 127
22.LIBRARIES
22.1 List of Head and Branch Libraries in the District with details of
members, books available and readers
128
22.2 Number of Libraries houses in Government Building / Rental Building 128
22.3 Number of Reading Rooms - Part time Libraries 129
23.MINING & QUARRYING
23.1 Number of Mining and Quarrying units in the District 130
23.2 Classification –wise production during the year 130
24. MANUFACTURING SECTOR
24.1 Number of Food and other allied manufacturing units in the district 131
24.2 Number of Non-Food manufacturing units in the district 131
25.MEDICAL SERVICES
25.1 Number of Medical Colleges in the district with Students and Teachers 132
25.2 Number of College of Pharmacy with Students and Teachers 132
25.3 Number of Medical Stores in the District – Category wise 133
25.4 Number of Veterinary Colleges with Students and Teachers 133
26.MOTOR VEHICLES
26.1 Number of Motor Vehicles (Category-wise) Registered during the year
and up to the end of the year 134
26.2 Number of Motor Vehicles (Category-wise) available for hire purpose
during the year and up to the end of the year
136
26.3 Number of Persons issued with Driving Licenses 136
27.NON- CONVENTIONAL ENERGY GENERATON
27.1 Number of Solar Energy generating units in the district with Production
Area
137
27.2 Number of Wind Mills, Generating units with production data 137

District Statistical Handbook 2015-16 Page 42
28.POLICE AND PRISIONS
28.1 Police Force 138
28.2 Cognizable Offences under Indian Penal Code 138
28.3 Prisons and Convicts 139
28.4 Number of Cases Registers under PCR./ SC & ST Act 140
28.5 Number of Cases Registered against Woman Harassment and Dowry 140
29.PUBLIC HEALTH
29.1 Public Health and Medical Services rendered by Organisations and
individual
141
29.2 Number of Primary Health Centres with Sub-Centre 142
30.PRINTING AND PUBLICATION
30.1 Number of News papers, Weekly Magazines, Monthly Magazine etc.,
Published
143
30.2 Number of Publishers in the district other than Newspapers and
Magazines
143
30.3 Number of Printing Presses in the district 144
31.PRICE INDICES
31.1 Index Numbers of Wholesale Prices of Tamil Nadu 2015-16 145
31.2 Consumer Price Index Numbers for Industrial Workers 2015-16 146
31.3 Consumer Price Index Numbers 2015-16 (Numbers for Rural, Urban
and Combined)
147
31.4 All India Consumer Price Index Numbers for Industrial workers 2015-
16
147
31.5 Consumer Price Index Numbers for selected essential items in Rural
Tamil Nadu 2015-16
148
31.6 Consumer Price Index Numbers for selected essential items in
Urban Tamil Nadu 2015-16
148
32.QUALITY CONTROL
32.1 List of Industrial / Establishment Units having Quality Control
Facilities and the products subjected to Quality Control
149
33.REGISTRATION
33.1 Number of Registration Offices in the district 149
33.2 Registration and Aggregate Value of properties transferred during the
year
150
34.REPAIR AND SERVICE
34.1 Authorised Automobile Repair and Service Stations 150
34.2 Authorised Electrical and Electronic goods Repair and Services Units 151
35. RESTAURANTS AND HOTELS
35.1 Restaurants, Cafes and Other Eating and Drinking Places 152
35.2 Details of Hotels 152
36.RECREATION AND CULTURAL SERVICES
36.1 List of Cinema Theatres and their Capacities 153
36.2 List of Clubs and Associations 155
District Statistical Handbook 2015-16 Page 43
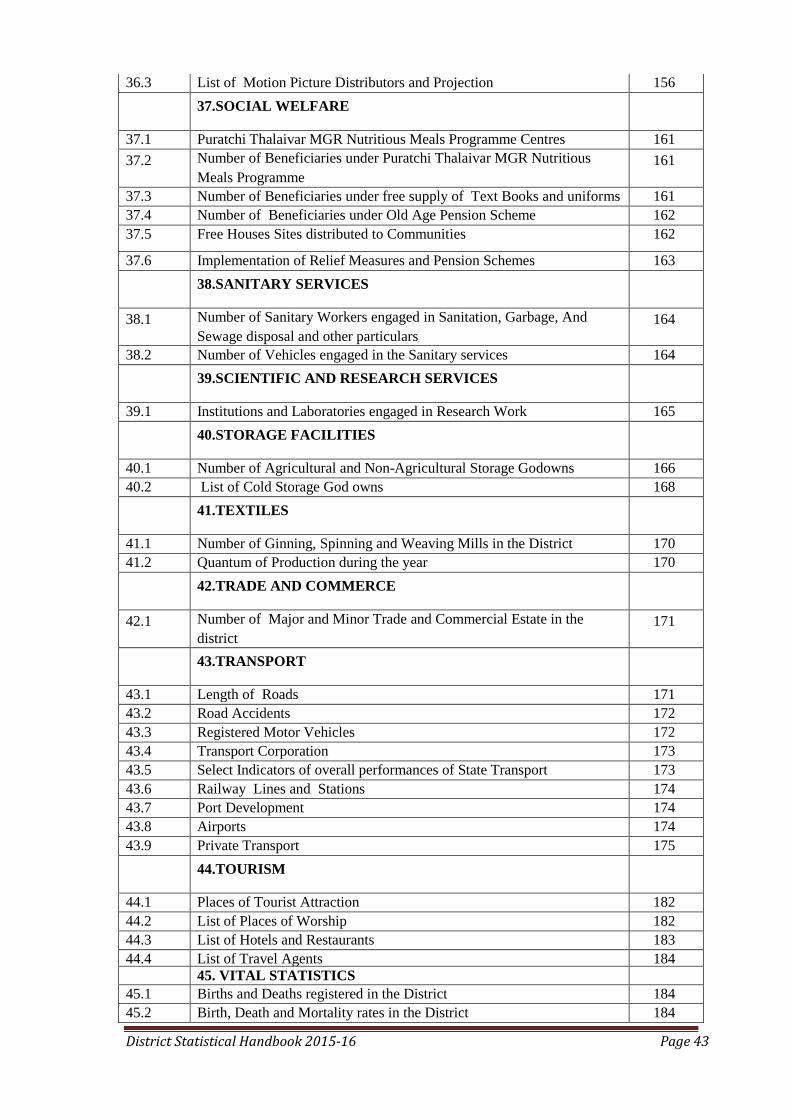
36.3 List of Motion Picture Distributors and Projection 156
37.SOCIAL WELFARE
37.1 Puratchi Thalaivar MGR Nutritious Meals Programme Centres 161
37.2 Number of Beneficiaries under Puratchi Thalaivar MGR Nutritious
Meals Programme
161
37.3 Number of Beneficiaries under free supply of Text Books and uniforms 161
37.4 Number of Beneficiaries under Old Age Pension Scheme 162
37.5 Free Houses Sites distributed to Communities 162
37.6 Implementation of Relief Measures and Pension Schemes 163
38.SANITARY SERVICES
38.1 Number of Sanitary Workers engaged in Sanitation, Garbage, And
Sewage disposal and other particulars
164
38.2 Number of Vehicles engaged in the Sanitary services 164
39.SCIENTIFIC AND RESEARCH SERVICES
39.1 Institutions and Laboratories engaged in Research Work 165
40.STORAGE FACILITIES
40.1 Number of Agricultural and Non-Agricultural Storage Godowns 166
40.2 List of Cold Storage God owns 168
41.TEXTILES
41.1 Number of Ginning, Spinning and Weaving Mills in the District 170
41.2 Quantum of Production during the year
170
42.TRADE AND COMMERCE
42.1 Number of Major and Minor Trade and Commercial Estate in the
district
171
43.TRANSPORT
43.1 Length of Roads 171
43.2 Road Accidents 172
43.3 Registered Motor Vehicles 172
43.4 Transport Corporation 173
43.5 Select Indicators of overall performances of State Transport
Corporation
173
43.6 Railway Lines and Stations 174
43.7 Port Development 174
43.8 Airports 174
43.9 Private Transport 175
44.TOURISM
44.1 Places of Tourist Attraction 182
44.2 List of Places of Worship 182
44.3 List of Hotels and Restaurants 183
44.4 List of Travel Agents 184 45. VITAL STATISTICS
45.1 Births and Deaths registered in the District 184
45.2 Birth, Death and Mortality rates in the District 184
District Statistical Handbook 2015-16 Page 44
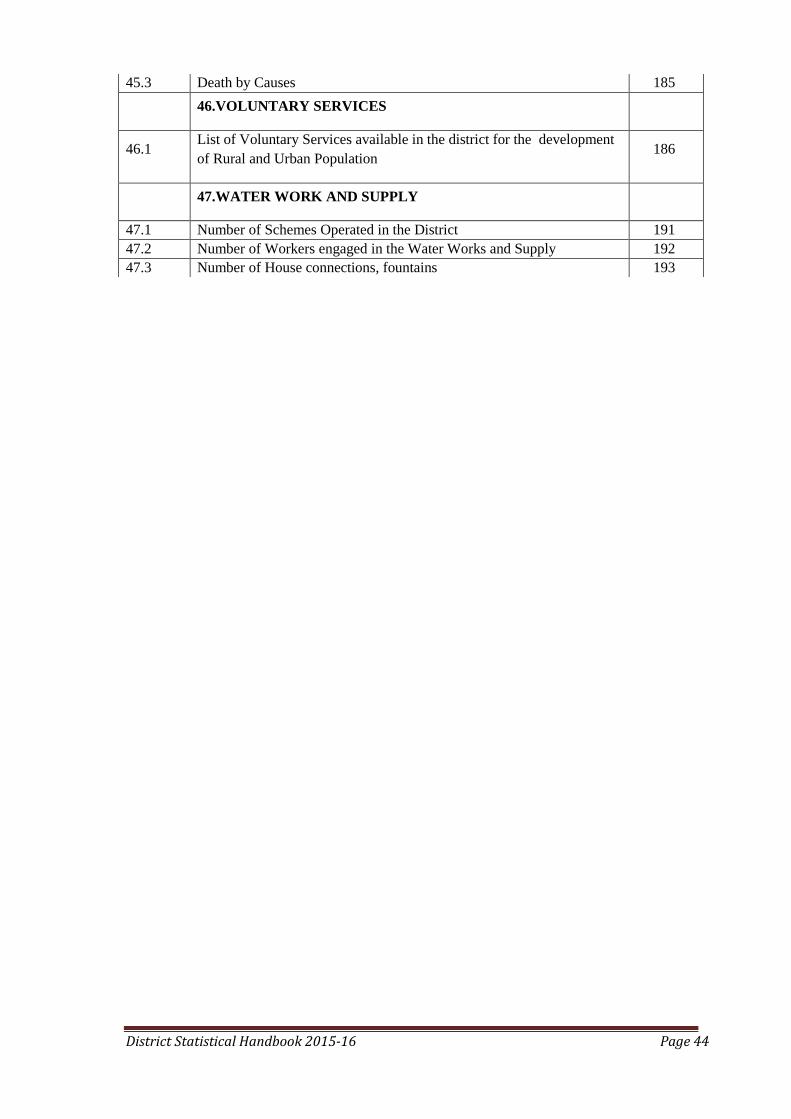
45.3 Death by Causes 185
46.VOLUNTARY SERVICES
46.1 List of Voluntary Services available in the district for the development
of Rural and Urban Population 186
47.WATER WORK AND SUPPLY
47.1 Number of Schemes Operated in the District 191
47.2 Number of Workers engaged in the Water Works and Supply 192
47.3 Number of House connections, fountains 193

District Statistical Handbook 2015-16 Page 45
1. AREA AND POPULATION
1.1(a) TAMILNADU AND SALEM DISTRICT- PROVISIONAL POPULATION
TOTALS, RURAL & URBAN AREAS (As per Census 2011)
State/District
Total
/Rural
/Urban
Population 2011 Population 2001
Persons Male Female Persons Male Female
1 2 3 4 5 6 7 8
TAMILNADU
Total 72138958 36158871 35980087 62405679 31400909 31004770
Rural 37189229 18663701 18525528 34921681 17531494 17390187
Urban 34949729 17495170 17454559 27483998 13869415 13614583
SALEM
Total 3482056 1781571 1700485 3016346 1563633 1452713
Rural 1707934 883274 824660 1626162 852453 773709
Urban 1774122 898297 875825 1390184 711180 679004
State/District
Total
/Rural
/Urban
% to Total Population 2011 % to Total Population 2001
Persons Male Female Persons Male Female
1 2 9 10 11 12 13 14
TAMILNADU
Total 100 100 100 100 100 100
Rural 51.55 51.62 51.49 55.96 55.83 56.09
Urban 48.45 48.38 48.51 44.04 44.17 43.91
SALEM
Total 100 100 100 100 100 100
Rural 48.96 49.48 48.41 53.91 54.52 53.26
Urban 51.04 50.52 51.59 46.09 45.48 46.74
State/District
Total
/Rural
/Urban
Decadal Growth Rate 2001-2011 Child Population in the
age-group 0-6, 2011
Persons Male Female Persons Male Female
1 2 15 16 17 18 19 20
TAMILNADU
Total 15.60 15.15 16.05 6894821 3542351 3352470
Rural 6.49 6.46 6.53 3651552 1885037 1766515
Urban 27.16 26.14 28.20 3243269 1657314 1585955
SALEM
Total 15.37 13.87 16.98 323102 168560 154542
Rural 4.77 3.34 6.34 162740 85783 76957
Urban 27.78 26.50 29.11 160362 82777 77585
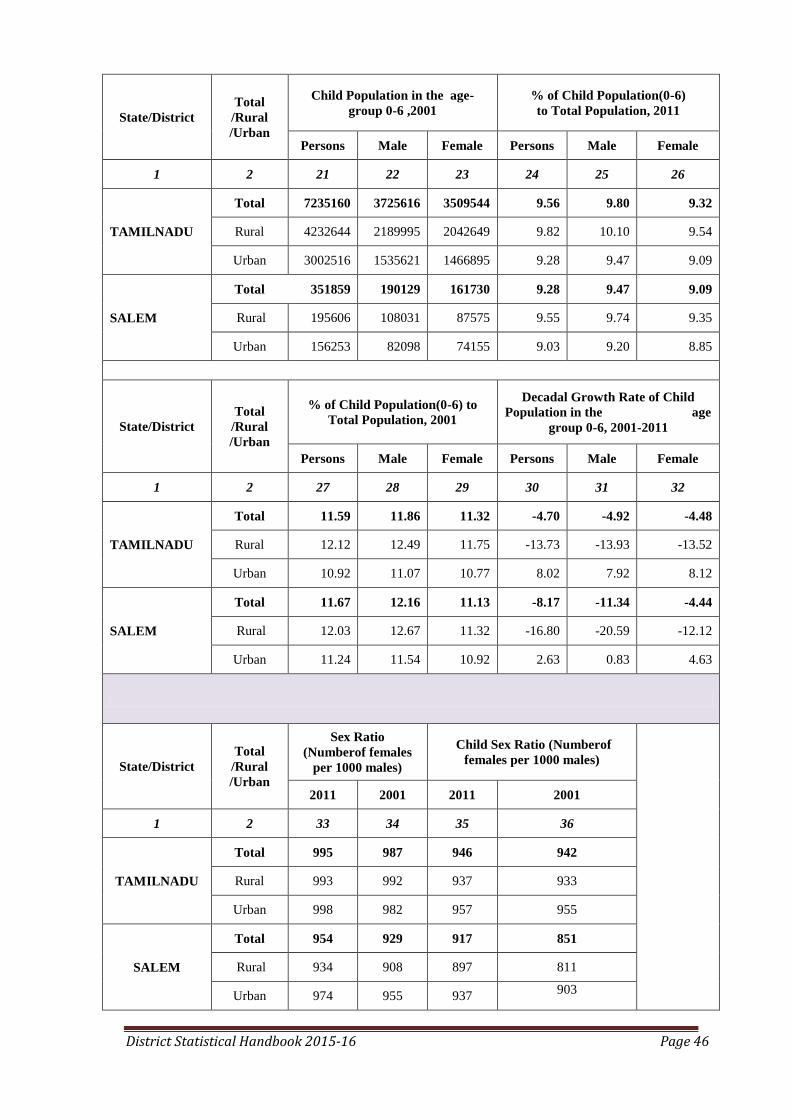
District Statistical Handbook 2015-16 Page 46
State/District
Total
/Rural
/Urban
Child Population in the age-
group 0-6 ,2001
% of Child Population(0-6)
to Total Population, 2011
Persons Male Female Persons Male Female
1 2 21 22 23 24 25 26
TAMILNADU
Total 7235160 3725616 3509544 9.56 9.80 9.32
Rural 4232644 2189995 2042649 9.82 10.10 9.54
Urban 3002516 1535621 1466895 9.28 9.47 9.09
SALEM
Total 351859 190129 161730 9.28 9.47 9.09
Rural 195606 108031 87575 9.55 9.74 9.35
Urban 156253 82098 74155 9.03 9.20 8.85
State/District
Total
/Rural
/Urban
% of Child Population(0-6) to
Total Population, 2001
Decadal Growth Rate of Child
Population in the age
group 0-6, 2001-2011
Persons Male Female Persons Male Female
1 2 27 28 29 30 31 32
TAMILNADU
Total 11.59 11.86 11.32 -4.70 -4.92 -4.48
Rural 12.12 12.49 11.75 -13.73 -13.93 -13.52
Urban 10.92 11.07 10.77 8.02 7.92 8.12
SALEM
Total 11.67 12.16 11.13 -8.17 -11.34 -4.44
Rural 12.03 12.67 11.32 -16.80 -20.59 -12.12
Urban 11.24 11.54 10.92 2.63 0.83 4.63
State/District
Total
/Rural
/Urban
Sex Ratio
(Numberof females
per 1000 males)
Child Sex Ratio (Numberof
females per 1000 males)
2011 2001 2011 2001
1 2 33 34 35 36
TAMILNADU
Total 995 987 946 942
Rural 993 992 937 933
Urban 998 982 957 955
SALEM
Total 954 929 917 851
Rural 934 908 897 811
Urban 974 955 937 903

District Statistical Handbook 2015-16 Page 47
State/District
Total
/Rural
/Urban
Literates 2011 Literates 2001
Persons Male Female Persons Male Female
1 2 37 38 39 40 41 42
TAMILNADU
Total 52413116 28314595 24098521 40524545 22809662 17714883
Rural 24752447 13771878 10980569 20319498 11835689 8483809
Urban 27660669 14542717 13117952 20205047 10973973 9231074
SALEM
Total 2311715 1300874 1010841 1734442 1021772 712670
Rural 1019440 596530 422910 819312 506149 313163
Urban 1292275 704344 587931 915130 515623 399507
State/District
Total
/Rural
/Urban
Decadal Growth Rate of
Literates, 2001-2011 Literacy Rate 2011
Persons Male Female Persons Male Female
1 2 43 44 45 46 47 48
TAMILNADU
Total 29.34 24.13 36.04 80.33 86.81 73.86
Rural 21.82 16.36 29.43 73.80 82.08 65.52
Urban 36.90 32.52 42.11 87.24 91.82 82.67
SALEM
Total 33.28 27.32 41.84 73.23 80.70 65.43
Rural 24.43 17.86 35.04 66.16 75.02 56.71
Urban 41.21 36.60 47.16 79.97 86.23 73.57
State/District
Total
/Rural
/Urban
Literacy Rate 2001
Gender
Gap in
Literacy
Persons Male Female 2011
1 2 49 50 51 52
TAMILNADU
Total 73.45 82.42 64.43 12.95
Rural 66.21 77.15 55.28 16.56
Urban 82.53 88.97 75.99 9.16
SALEM
Total 65.09 74.39 55.20 15.27
Rural 57.27 67.99 45.64 18.31
Urban 74.16 81.96 66.05 12.65
Source: Population Census 2011
District Statistical Handbook 2015-16 Page 48
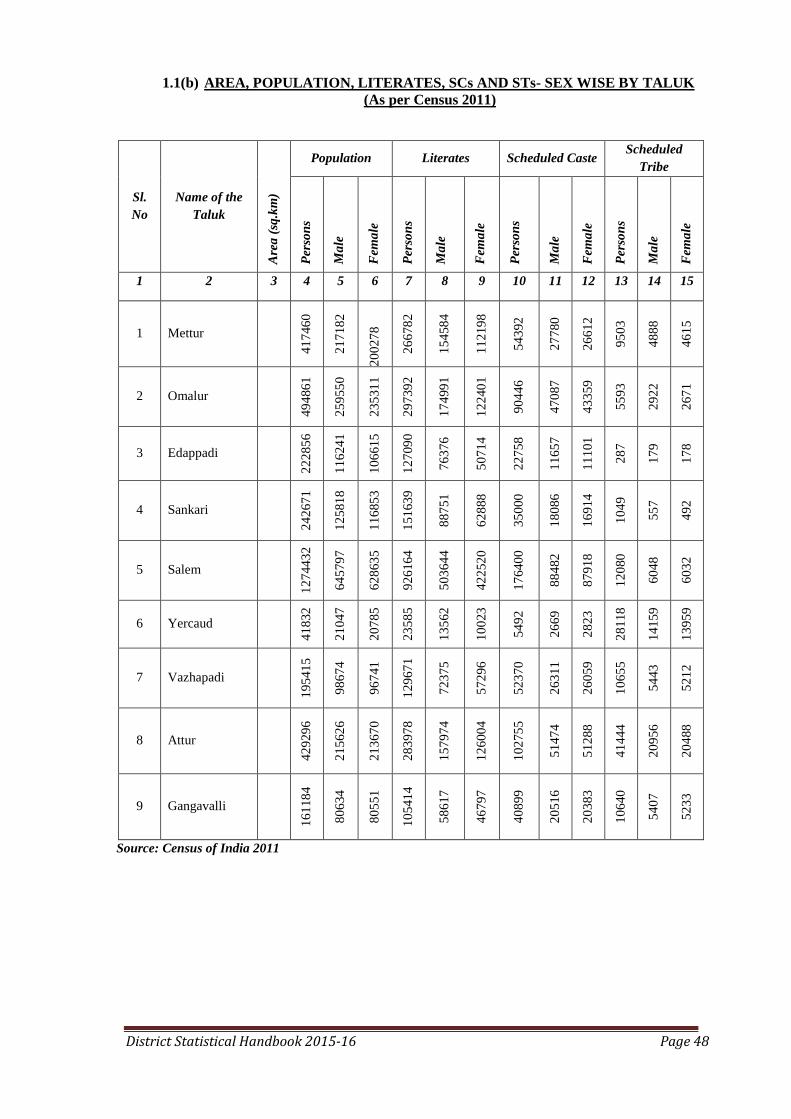
1.1(b) AREA, POPULATION, LITERATES, SCs AND STs- SEX WISE BY TALUK
(As per Census 2011)
Sl.
No
Name of the
Taluk
Are
a (
sq.k
m)
Population Literates Scheduled Caste Scheduled
Tribe
Per
son
s
Ma
le
Fem
ale
Per
son
s
Ma
le
Fem
ale
Per
son
s
Ma
le
Fem
ale
Per
son
s
Ma
le
Fem
ale
1 2 3 4 5 6 7 8 9 10 11 12 13 14 15
1 Mettur
41
746
0
21
718
2
20
027
8
26
678
2
15
458
4
11
219
8
54
392
27
780
26
612
95
03
48
88
46
15
2 Omalur
49
486
1
25
955
0
23
531
1
29
739
2
17
499
1
12
240
1
90
446
47
087
43
359
55
93
29
22
26
71
3 Edappadi
22
285
6
11
624
1
10
661
5
12
709
0
76
376
50
714
22
758
11
657
11
101
28
7
17
9
17
8
4 Sankari
24
267
1
12
581
8
11
685
3
15
163
9
88
751
62
888
35
000
18
086
16
914
10
49
55
7
49
2
5 Salem
12
744
32
64
579
7
62
863
5
92
616
4
50
364
4
42
252
0
17
640
0
88
482
87
918
12
080
60
48
60
32
6 Yercaud
41
832
21
047
20
785
23
585
13
562
10
023
54
92
26
69
28
23
28
118
14
159
13
959
7 Vazhapadi
19
541
5
98
674
96
741
12
967
1
72
375
57
296
52
370
26
311
26
059
10
655
54
43
52
12
8 Attur
42
929
6
21
562
6
21
367
0
28
397
8
15
797
4
12
600
4
10
275
5
51
474
51
288
41
444
20
956
20
488
9 Gangavalli
16
118
4
80
634
80
551
10
541
4
58
617
46
797
40
899
20
516
20
383
10
640
54
07
52
33
Source: Census of India 2011

District Statistical Handbook 2015-16 Page 49
1.2. POPULATION BY BROAD INDUSTRIAL CATEGORIES OF WORKERS
Source: Census of India 2011
1.3. POPULATION BY RELIGION
Sl.
Number
(1)
Religion
(2)
Persons in
the District
(3)
Persons in
Tamil Nadu
(4)
Percentage
in the
District
(5)
(%) in
Tamil
Nadu
(6)
1 Hindu 2883909 54985079 95.61 88.11
2 Muslim 77648 3470647 2.57 5.56
3 Christian 50450 3785060 1.67 6.06
4 Sikh 0 0 0 0
5 Buddhist 0 0 0 0
6 Jain 0 0 0 0
7 Other Religions 2034 105549 0.07 0.17
8 Religions not stated 2305 5934 0.08 0.10
Total Population 3016346 62405679 100.00 100.00
Source: Census of India 2011
Sl.
No
Industrial Category
Salem District Tamil Nadu
Persons % to total
workers Persons
% to total
workers
1 2 3 4 5 6
1. Total Main Workers
a) Cultivators
b) Agricultural Labourers
c) Household Industry
Manufacturing, Processing,
Servicing and Repairs
d) Other Workers
1561030
247011
396158
132700
785161
48.0
7.6
12.2
4.1
24.1
27942181
3855375
7234101
1119458
15733247
45.9
6.3
11.9
1.8
25.4
2 Marginal Workers
Total Workers
Non Workers
133130
2355190
1787896
4.1
100.00
4942500
60826862
39262349
8.1
100.00
Total Population
3482056
72147030
District Statistical Handbook 2015-16 Page 50
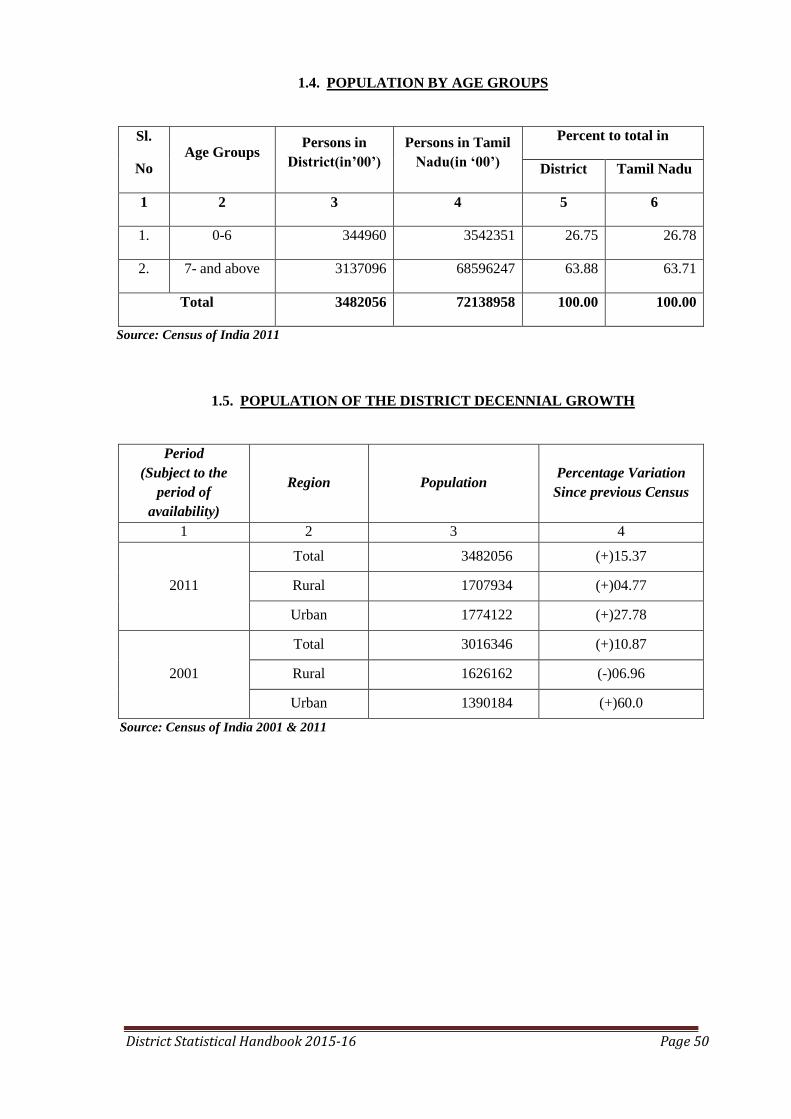
1.4. POPULATION BY AGE GROUPS
Sl.
No Age Groups
Persons in
District(in’00’)
Persons in Tamil
Nadu(in ‘00’)
Percent to total in
District Tamil Nadu
1 2 3 4 5 6
1. 0-6 344960 3542351 26.75 26.78
2. 7- and above 3137096 68596247 63.88 63.71
Total 3482056 72138958 100.00 100.00
Source: Census of India 2011
1.5. POPULATION OF THE DISTRICT DECENNIAL GROWTH
Period
(Subject to the
period of
availability)
Region Population Percentage Variation
Since previous Census
1 2 3 4
2011
Total 3482056 (+)15.37
Rural 1707934 (+)04.77
Urban 1774122 (+)27.78
2001
Total 3016346 (+)10.87
Rural 1626162 (-)06.96
Urban 1390184 (+)60.0
Source: Census of India 2001 & 2011

District Statistical Handbook 2015-16 Page 51
Chart-1 Population of Salem District for the year 2001 and 2011
Chart-2 Male and Female Population of Salem District for the year – 2011
District Statistical Handbook 2015-16 Page 52
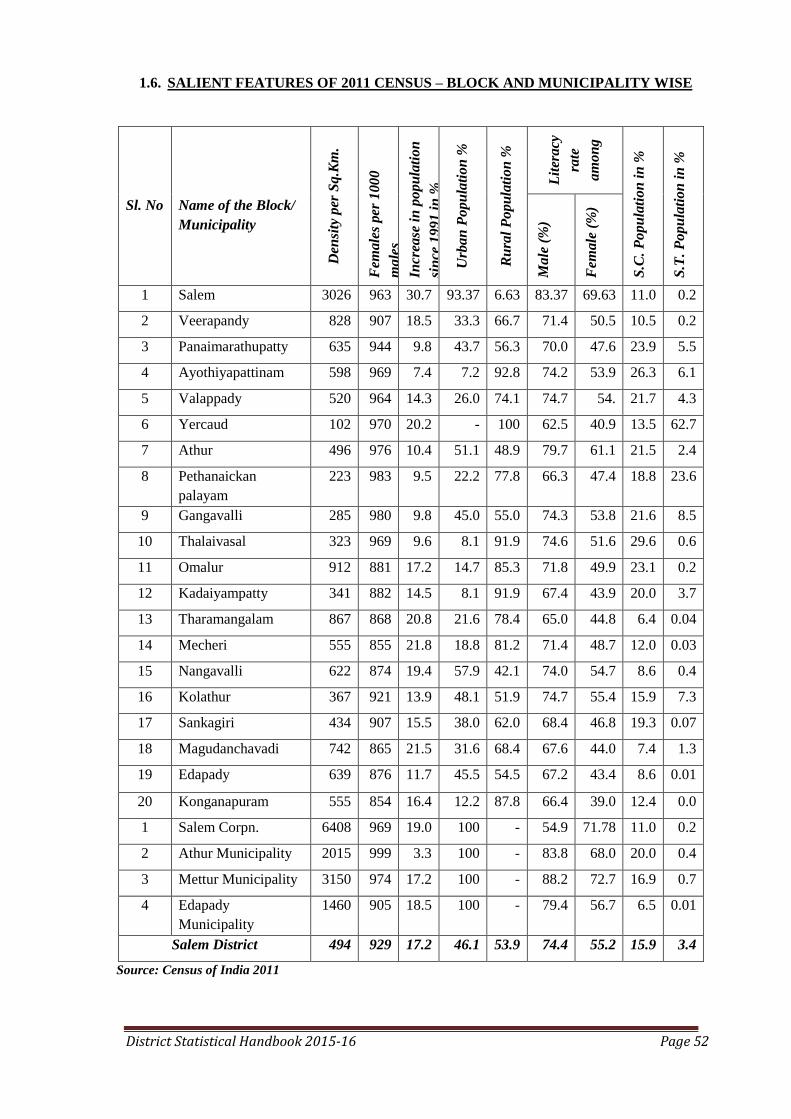
1.6. SALIENT FEATURES OF 2011 CENSUS – BLOCK AND MUNICIPALITY WISE
Sl. No
Name of the Block/
Municipality
Den
sity
per
Sq
.Km
.
Fem
ale
s per
100
0
ma
les
Incr
ease
in
po
pu
lati
on
sin
ce 1
99
1 i
n %
Urb
an
Po
pu
lati
on
%
Ru
ral
Po
pu
lati
on
%
Lit
era
cy
rate
am
on
g
S.C
. P
op
ula
tio
n i
n %
S.T
. P
op
ula
tio
n i
n %
Ma
le (
%)
Fem
ale
(%
)
1 Salem 3026 963 30.7 93.37 6.63 83.37 69.63 11.0 0.2
2 Veerapandy 828 907 18.5 33.3 66.7 71.4 50.5 10.5 0.2
3 Panaimarathupatty 635 944 9.8 43.7 56.3 70.0 47.6 23.9 5.5
4 Ayothiyapattinam 598 969 7.4 7.2 92.8 74.2 53.9 26.3 6.1
5 Valappady 520 964 14.3 26.0 74.1 74.7 54. 21.7 4.3
6 Yercaud 102 970 20.2 - 100 62.5 40.9 13.5 62.7
7 Athur 496 976 10.4 51.1 48.9 79.7 61.1 21.5 2.4
8 Pethanaickan
palayam
223 983 9.5 22.2 77.8 66.3 47.4 18.8 23.6
9 Gangavalli 285 980 9.8 45.0 55.0 74.3 53.8 21.6 8.5
10 Thalaivasal 323 969 9.6 8.1 91.9 74.6 51.6 29.6 0.6
11 Omalur 912 881 17.2 14.7 85.3 71.8 49.9 23.1 0.2
12 Kadaiyampatty 341 882 14.5 8.1 91.9 67.4 43.9 20.0 3.7
13 Tharamangalam 867 868 20.8 21.6 78.4 65.0 44.8 6.4 0.04
14 Mecheri 555 855 21.8 18.8 81.2 71.4 48.7 12.0 0.03
15 Nangavalli 622 874 19.4 57.9 42.1 74.0 54.7 8.6 0.4
16 Kolathur 367 921 13.9 48.1 51.9 74.7 55.4 15.9 7.3
17 Sankagiri 434 907 15.5 38.0 62.0 68.4 46.8 19.3 0.07
18 Magudanchavadi 742 865 21.5 31.6 68.4 67.6 44.0 7.4 1.3
19 Edapady 639 876 11.7 45.5 54.5 67.2 43.4 8.6 0.01
20 Konganapuram 555 854 16.4 12.2 87.8 66.4 39.0 12.4 0.0
1 Salem Corpn. 6408 969 19.0 100 - 54.9 71.78 11.0 0.2
2 Athur Municipality 2015 999 3.3 100 - 83.8 68.0 20.0 0.4
3 Mettur Municipality 3150 974 17.2 100 - 88.2 72.7 16.9 0.7
4 Edapady
Municipality
1460 905 18.5 100 - 79.4 56.7 6.5 0.01
Salem District 494 929 17.2 46.1 53.9 74.4 55.2 15.9 3.4
Source: Census of India 2011
District Statistical Handbook 2015-16 Page 53
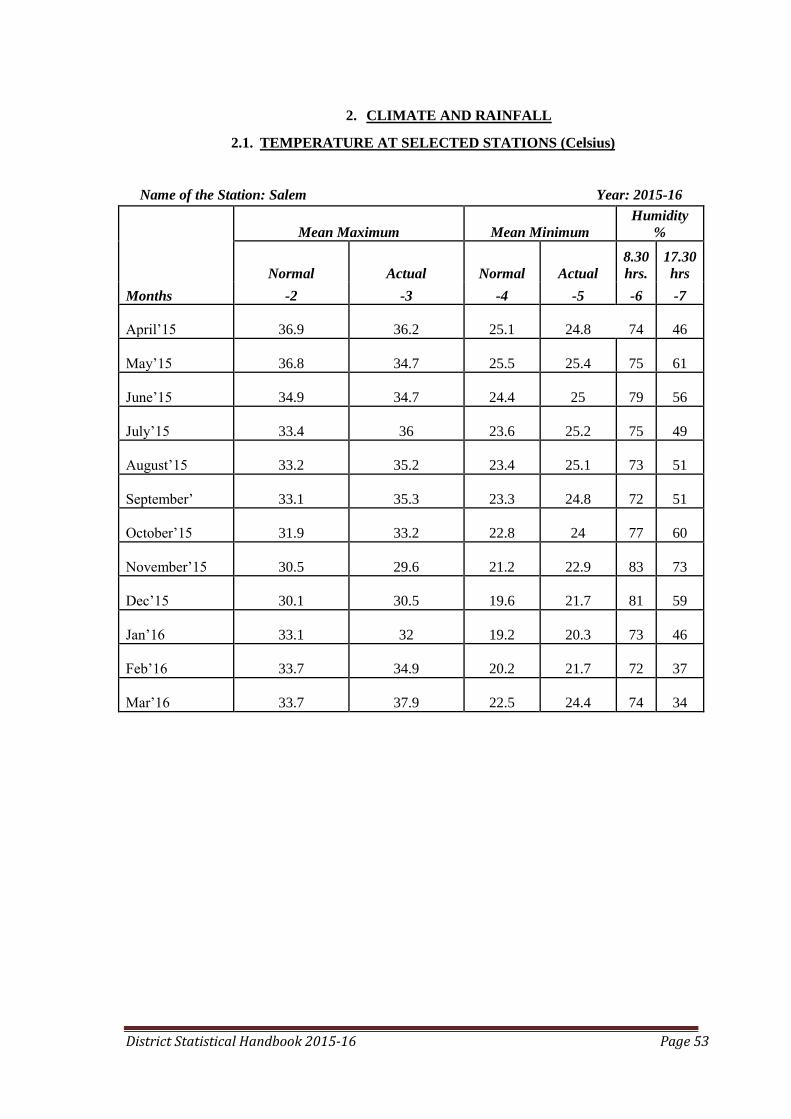
2. CLIMATE AND RAINFALL
2.1. TEMPERATURE AT SELECTED STATIONS (Celsius)
Name of the Station: Salem Year: 2015-16
Months
Mean Maximum Mean Minimum
Humidity
%
Normal Actual Normal Actual
8.30
hrs.
17.30
hrs
-2 -3 -4 -5 -6 -7
April‘15 36.9 36.2 25.1 24.8 74 46
May‘15 36.8 34.7 25.5 25.4 75 61
June‘15 34.9 34.7 24.4 25 79 56
July‘15 33.4 36 23.6 25.2 75 49
August‘15 33.2 35.2 23.4 25.1 73 51
September‘ 33.1 35.3 23.3 24.8 72 51
October‘15 31.9 33.2 22.8 24 77 60
November‘15 30.5 29.6 21.2 22.9 83 73
Dec‘15 30.1 30.5 19.6 21.7 81 59
Jan‘16 33.1 32 19.2 20.3 73 46
Feb‘16 33.7 34.9 20.2 21.7 72 37
Mar‘16 33.7 37.9 22.5 24.4 74 34
District Statistical Handbook 2015-16 Page 54
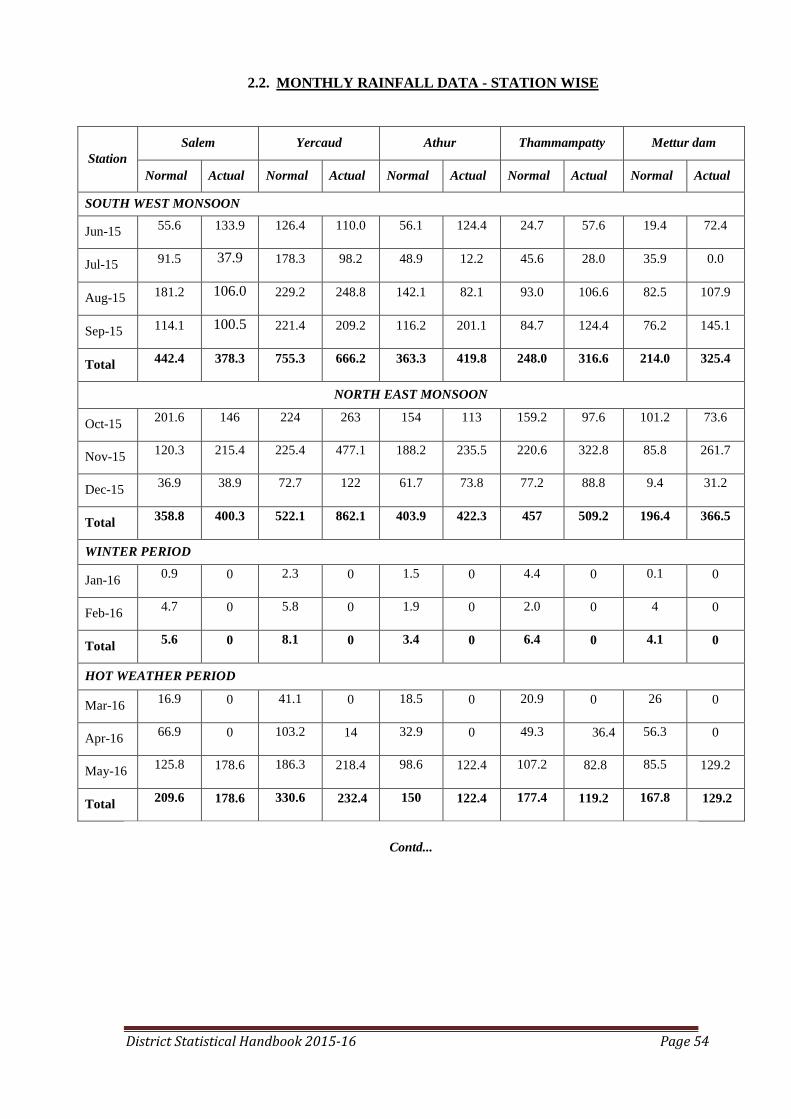
2.2. MONTHLY RAINFALL DATA - STATION WISE
Station
Salem Yercaud Athur Thammampatty Mettur dam
Normal Actual Normal Actual Normal Actual Normal Actual Normal Actual
SOUTH WEST MONSOON
Jun-15 55.6 133.9 126.4 110.0 56.1 124.4 24.7 57.6 19.4 72.4
Jul-15 91.5 37.9 178.3 98.2 48.9 12.2 45.6 28.0 35.9 0.0
Aug-15 181.2 106.0 229.2 248.8 142.1 82.1 93.0 106.6 82.5 107.9
Sep-15 114.1 100.5 221.4 209.2 116.2 201.1 84.7 124.4 76.2 145.1
Total 442.4 378.3 755.3 666.2 363.3 419.8 248.0 316.6 214.0 325.4
NORTH EAST MONSOON
Oct-15 201.6 146 224 263 154 113 159.2 97.6 101.2 73.6
Nov-15 120.3 215.4 225.4 477.1 188.2 235.5 220.6 322.8 85.8 261.7
Dec-15 36.9 38.9 72.7 122 61.7 73.8 77.2 88.8 9.4 31.2
Total 358.8 400.3 522.1 862.1 403.9 422.3 457 509.2 196.4 366.5
WINTER PERIOD
Jan-16 0.9 0 2.3 0 1.5 0 4.4 0 0.1 0
Feb-16 4.7 0 5.8 0 1.9 0 2.0 0 4 0
Total 5.6 0 8.1 0 3.4 0 6.4 0 4.1 0
HOT WEATHER PERIOD
Mar-16 16.9 0 41.1 0 18.5 0 20.9 0 26 0
Apr-16 66.9 0 103.2 14 32.9 0 49.3 36.4 56.3 0
May-16 125.8 178.6 186.3 218.4 98.6 122.4 107.2 82.8 85.5 129.2
Total 209.6 178.6 330.6 232.4 150 122.4 177.4 119.2 167.8 129.2
Contd...
District Statistical Handbook 2015-16 Page 55
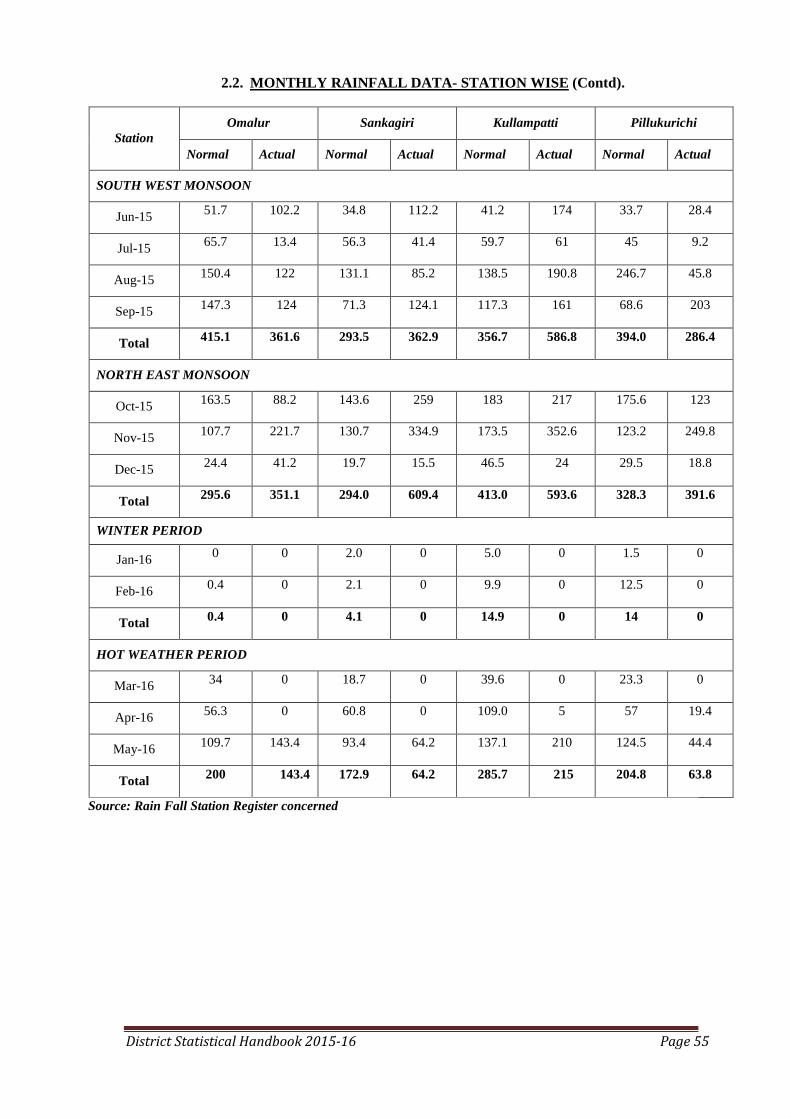
2.2. MONTHLY RAINFALL DATA- STATION WISE (Contd).
Station
Omalur Sankagiri Kullampatti Pillukurichi
Normal Actual Normal Actual Normal Actual Normal Actual
SOUTH WEST MONSOON
Jun-15 51.7 102.2 34.8 112.2 41.2 174 33.7 28.4
Jul-15 65.7 13.4 56.3 41.4 59.7 61 45 9.2
Aug-15 150.4 122 131.1 85.2 138.5 190.8 246.7 45.8
Sep-15 147.3 124 71.3 124.1 117.3 161 68.6 203
Total 415.1 361.6 293.5 362.9 356.7 586.8 394.0 286.4
NORTH EAST MONSOON
Oct-15 163.5 88.2 143.6 259 183 217 175.6 123
Nov-15 107.7 221.7 130.7 334.9 173.5 352.6 123.2 249.8
Dec-15 24.4 41.2 19.7 15.5 46.5 24 29.5 18.8
Total 295.6 351.1 294.0 609.4 413.0 593.6 328.3 391.6
WINTER PERIOD
Jan-16 0 0 2.0 0 5.0 0 1.5 0
Feb-16 0.4 0 2.1 0 9.9 0 12.5 0
Total 0.4 0 4.1 0 14.9 0 14 0
HOT WEATHER PERIOD
Mar-16 34 0 18.7 0 39.6 0 23.3 0
Apr-16 56.3 0 60.8 0 109.0 5 57 19.4
May-16 109.7 143.4 93.4 64.2 137.1 210 124.5 44.4
Total 200 143.4 172.9 64.2 285.7 215 204.8 63.8
Source: Rain Fall Station Register concerned
District Statistical Handbook 2015-16 Page 56
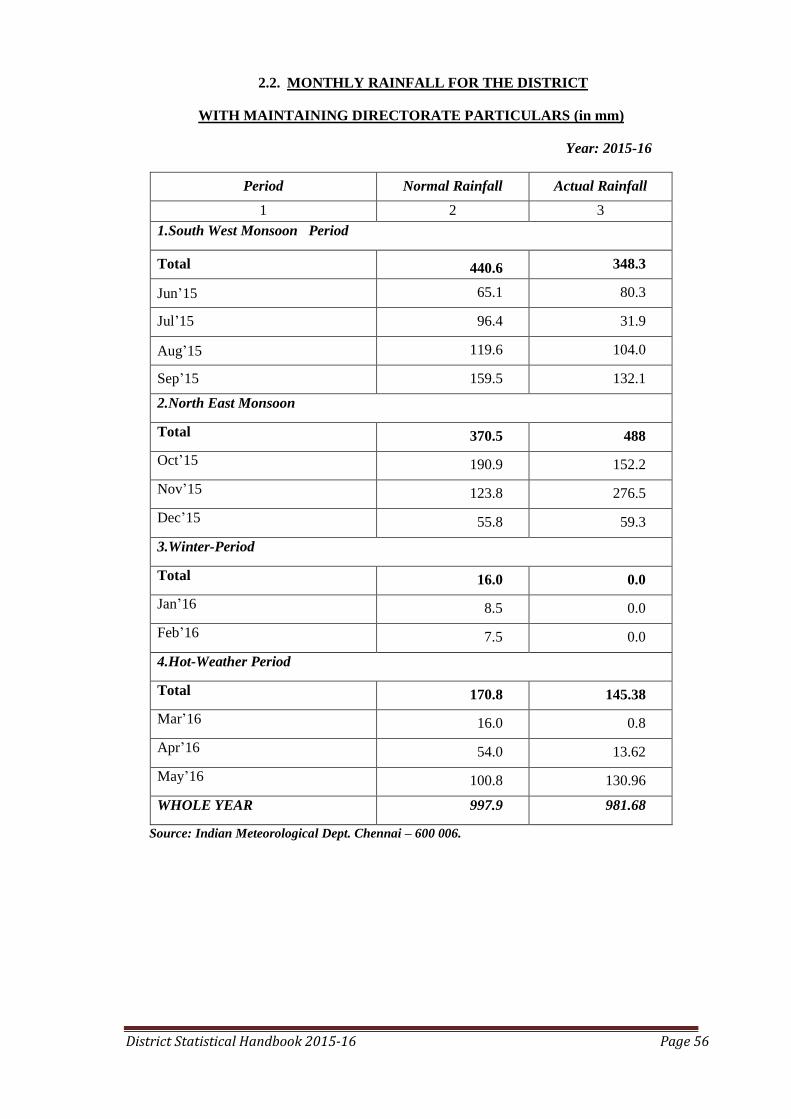
2.2. MONTHLY RAINFALL FOR THE DISTRICT
WITH MAINTAINING DIRECTORATE PARTICULARS (in mm)
Year: 2015-16
Period Normal Rainfall Actual Rainfall
1 2 3
1.South West Monsoon Period
Total 440.6 348.3
Jun‘15 65.1 80.3
Jul‘15 96.4 31.9
Aug‘15 119.6 104.0
Sep‘15 159.5 132.1
2.North East Monsoon
Total 370.5 488
Oct‘15 190.9 152.2
Nov‘15 123.8 276.5
Dec‘15 55.8 59.3
3.Winter-Period
Total 16.0 0.0
Jan‘16 8.5 0.0
Feb‘16 7.5 0.0
4.Hot-Weather Period
Total 170.8 145.38
Mar‘16 16.0 0.8
Apr‘16 54.0 13.62
May‘16 100.8 130.96
WHOLE YEAR 997.9 981.68
Source: Indian Meteorological Dept. Chennai – 600 006.

District Statistical Handbook 2015-16 Page 57
0
50
100
150
200
250
300
350
400
450
500
550
S.W. Monsoon N.E.Monsoon Winter Hot-Weather
Rai
nfal
l (m
m)
Seasons
Salem District Season-wise Rainfall - 2015-16
ACTUAL
NORMAL
Chart.3. Season-wise Rainfall in Salem District for the Year 2015-16
970
975
980
985
990
995
1000
Actual Normal
Rai
n f
all (
mm
)
RAIN FALL IN SALEM DISTRICT IN 2015-16
Chart4. Rainfall for the year 2015-16-Salem District
District Statistical Handbook 2015-16 Page 58
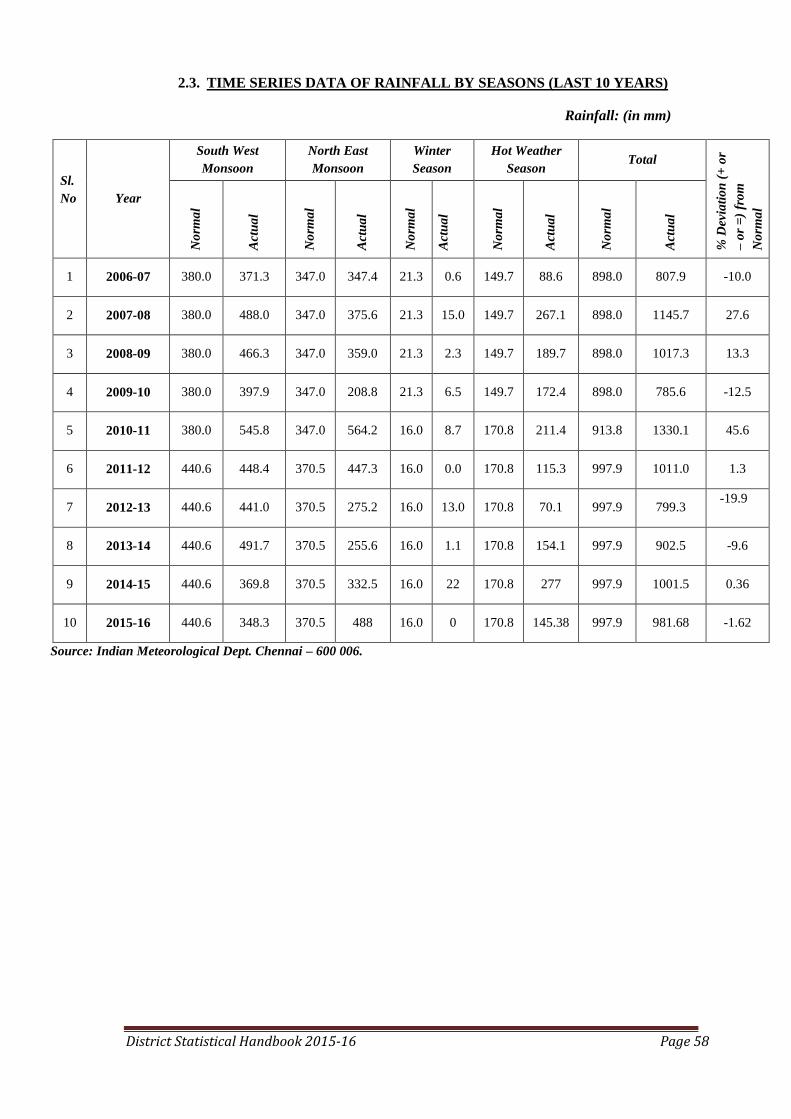
2.3. TIME SERIES DATA OF RAINFALL BY SEASONS (LAST 10 YEARS)
Rainfall: (in mm)
Sl.
No
Year
South West
Monsoon
North East
Monsoon
Winter
Season
Hot Weather
Season Total
% D
evi
ati
on
(+
or
– o
r =
) fr
om
No
rma
l
No
rma
l
Act
ua
l
No
rma
l
Act
ua
l
No
rma
l
Act
ua
l
No
rma
l
Act
ua
l
No
rma
l
Act
ua
l
1 2006-07 380.0 371.3 347.0 347.4 21.3 0.6 149.7 88.6 898.0 807.9 -10.0
2 2007-08 380.0 488.0 347.0 375.6 21.3 15.0 149.7 267.1 898.0 1145.7 27.6
3 2008-09 380.0 466.3 347.0 359.0 21.3 2.3 149.7 189.7 898.0 1017.3 13.3
4 2009-10 380.0 397.9 347.0 208.8 21.3 6.5 149.7 172.4 898.0 785.6 -12.5
5 2010-11 380.0 545.8 347.0 564.2 16.0 8.7 170.8 211.4 913.8 1330.1 45.6
6 2011-12 440.6 448.4 370.5 447.3 16.0 0.0 170.8 115.3 997.9 1011.0 1.3
7 2012-13 440.6 441.0 370.5 275.2 16.0 13.0 170.8 70.1 997.9 799.3 -19.9
8 2013-14 440.6 491.7 370.5 255.6 16.0 1.1 170.8 154.1 997.9 902.5 -9.6
9 2014-15 440.6 369.8 370.5 332.5 16.0 22 170.8 277 997.9 1001.5 0.36
10 2015-16 440.6 348.3 370.5 488 16.0 0 170.8 145.38 997.9 981.68 -1.62
Source: Indian Meteorological Dept. Chennai – 600 006.

District Statistical Handbook 2015-16 Page 59
3. AGRICULTURE
3.1. SOIL CLASSIFICATION
Year: 2015-16
Source: Asst. Soil Chemist, Salem
Sl.Number
(1)
Type of Soil
(2)
Places in District
(3)
1. Red Calcareous Parts of Salem, Athur, Sankagiri, Mettur and Omalur
taluks in Salem District
2. Red Non Calcareous ---- do ----
3. Brown Soil Calcareous Parts of Salem, Mettur and Omalur taluks in Salem
District
4. Red Collurial
Caleareous
Parts of Salem, Sankagiri, Mettur, Omalur taluks in
Salem District.
5. Red Collurial Non
Calcareous Parts of Sankagiri and Mettur taluks in Salem District
6. Black Soils Parts of Salem, Athur, Sankagiri, Mettur and Omalur
taluks in Salem District
7. Alluvial Calcareous Parts of Sankagiri and Mettur Taluks
8. Brown soil Non
Calcareous Yercaud Taluk
District Statistical Handbook 2015-16 Page 60
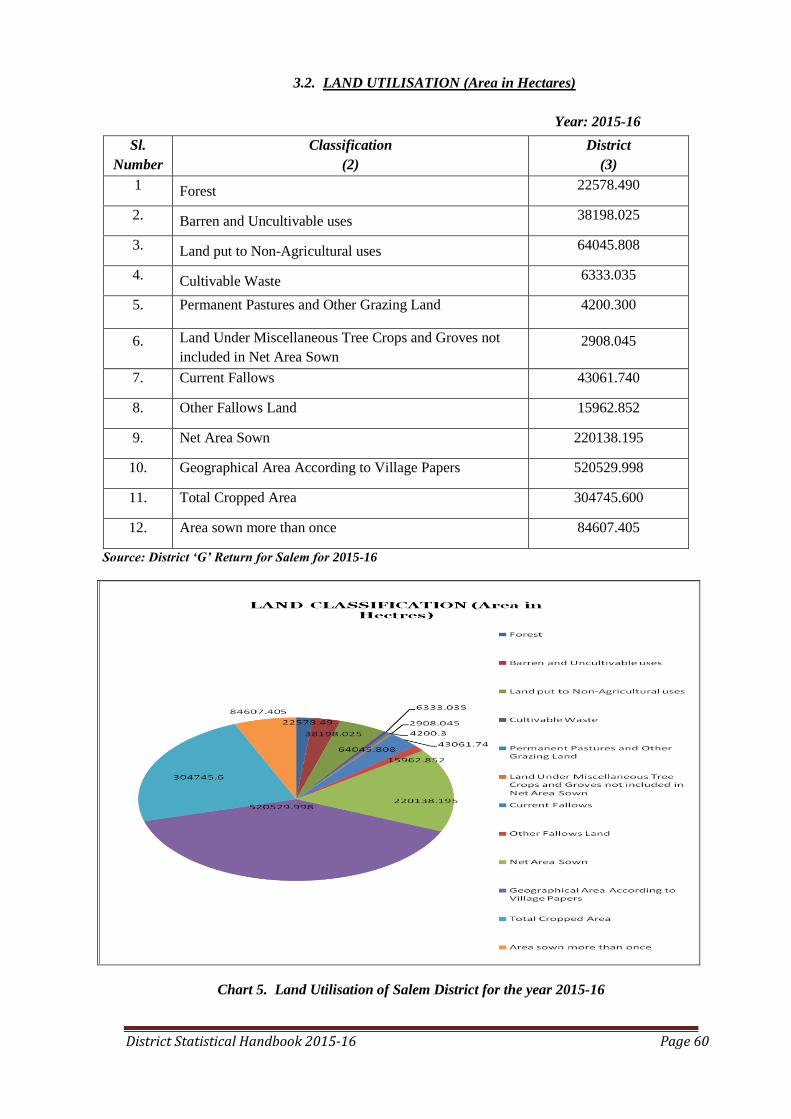
3.2. LAND UTILISATION (Area in Hectares)
Year: 2015-16
Source: District „G‟ Return for Salem for 2015-16
Chart 5. Land Utilisation of Salem District for the year 2015-16
Sl.
Number
(1)
Classification
(2)
District
(3)
1 Forest 22578.490
2. Barren and Uncultivable uses 38198.025
3. Land put to Non-Agricultural uses 64045.808
4. Cultivable Waste 6333.035
5. Permanent Pastures and Other Grazing Land 4200.300
6. Land Under Miscellaneous Tree Crops and Groves not
included in Net Area Sown 2908.045
7. Current Fallows 43061.740
8. Other Fallows Land 15962.852
9. Net Area Sown 220138.195
10. Geographical Area According to Village Papers 520529.998
11. Total Cropped Area 304745.600
12. Area sown more than once 84607.405
72040.416
District Statistical Handbook 2015-16 Page 61
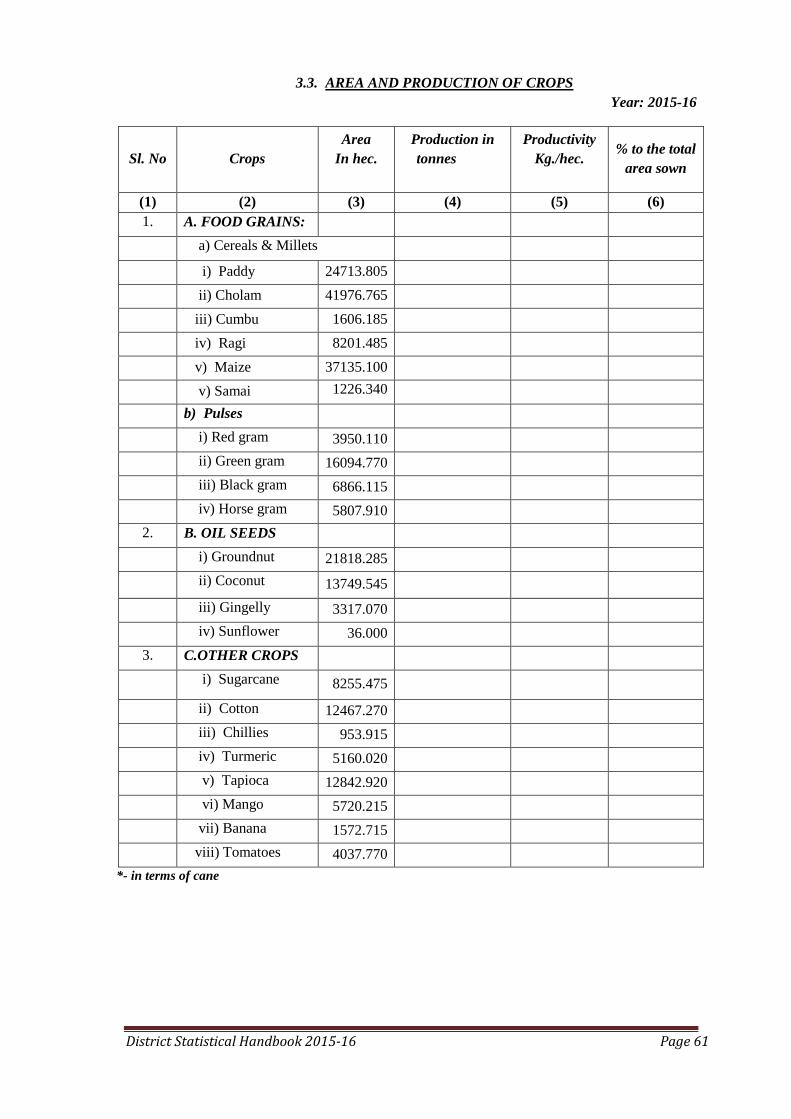
3.3. AREA AND PRODUCTION OF CROPS
Year: 2015-16
Sl. No
Crops
Area
In hec.
Production in
tonnes
Productivity
Kg./hec.
% to the total
area sown
(1) (2) (3) (4) (5) (6)
1. A. FOOD GRAINS:
a) Cereals & Millets
i) Paddy 24713.805
ii) Cholam 41976.765
iii) Cumbu 1606.185
iv) Ragi 8201.485
v) Maize 37135.100
v) Samai 1226.340
b) Pulses
i) Red gram 3950.110
ii) Green gram 16094.770
iii) Black gram 6866.115
iv) Horse gram 5807.910
2. B. OIL SEEDS
i) Groundnut 21818.285
ii) Coconut 13749.545
iii) Gingelly 3317.070
iv) Sunflower 36.000
3. C.OTHER CROPS
i) Sugarcane 8255.475
ii) Cotton 12467.270
iii) Chillies 953.915
iv) Turmeric 5160.020
v) Tapioca 12842.920
vi) Mango 5720.215
vii) Banana 1572.715
viii) Tomatoes 4037.770
*- in terms of cane

District Statistical Handbook 2015-16 Page 62
3.4. AGRICULTURAL MACHINERY AND IMPLEMENTS
Year: 2015-16
Sl.
Number
Item
2011
1 2 3
1. Ploughs
a) Wooden 214292
b) Iron 5708
c) Total 220000
2. Water Pumps for Irrigation Purpose
a) Worked by Oil Engine 29426
b)Worked by Electric Power 119583
c) Total 149009
3. Tractors
a) Government 91
b) Private 3330
c) Total 3421
4. Sugarcane Crushers
a) Worked by Power 740
b) Worked by Bullocks 30
c) Total 770
5. Oil Ghanis --
a) 5 Kg. & above --
b) Less than 5 Kg. --
c) Total --
Source: Based on Quinquennial Livestock Census

District Statistical Handbook 2015-16 Page 63
3.5. NUMBER AND AREA OF OPERATIONAL LAND HOLDINGS
Category
Operation Holders Holders Area
S.C. S.T. Others Total S.C. S.T. Others Total
1 2 3 4 5 6 7 8 9
Below 0.5 10023 6832 135759 152620 2711.031 1881.138 33937.24 38530.73
0.5 to 1.0 4847 5444 70329 80620 3401.52 4132.873 50196.41 57731.42
1.0 to 2.0 2422 4725 51786 58933 3217.93 6898..810 714156.6 81532.35
2.0 to 3.0 419 1234 13986 15639 998.355 3029.065 33531.7 37559.97
3.0 to 4.0 86 410 5095 5591 292.495 1399.15 17436.96 19128.51
4.0 to 5.0 45 175 1999 2219 198.87 776.975 8873.209 9849.054
5.0 to 7.5 30 118 1581 1729 186.385 699.745 9302.655 10188.79
7.5 to 10.0 5 35 392 432 41.525 296.375 3339.037 3676.937
10.0 to 20.0 4 20 237 261 46.98 284.54 3125.72 3457.24
20.0 & Above 0 4 111 115 0 111.25 4698.385 4809.635
Total 17881 18997 281281 318159 11095.1 19509.9 235860 266465
Source: Agriculture Census 2010-11

District Statistical Handbook 2015-16 Page 64
<-0.50
0.50-1.00
1.00-2.00
2.00-3.00
3.00-4.00
4.00-5.00
5.00-7.50
7.50-10.0 10.0-20.0
20.0<
CLASSIFICATION OF LAND HOLDERS 2015-16
Chart- 6 Classification of Land Holders in Salem District

District Statistical Handbook 2015-16 Page 65
3.6. CONSUMPTION OF CHEMICAL FERTILISERS AND PESTICIDES
Year: 2015-16
Source: Joint .Director of Agriculture, Salem
3.7. REGULATED MARKETS
Year: 2015-16
Number of Regulated
Markets
Number of Sub
Regulated
Markets
Quantity arrivals
(„in M.T.‟)
(Product wise)
Receipts
(Product wise)
Rs.in Lakhs
1 2 3 4
1.Salem -- Sugarcane
Jaggary 406 1.05
2.Valappady -- Cotton 392 1.39
3.Attur -- Turmeric 1055 9.71
4.Thalaivasal -- Cotton 83 0.24
5.Gangavalli -- Groundnut - -
6.Thammampatti -- Paddy 146 0.89
7.Karumandurai -- Coconut 558 0.72
8.Sankagiri -- Gingelly 55 0.39
9.Konganapuram -- Cotton 227 0.80
10.Kolathur -- Groundnut 51 0.22
11.Mecheri -- Coconut 4088 9.49
12.Omalur -- Sugarcane
jaggary - -
13.Kadayampatti -- Coconut 895 1.24
Total 7956 25.90
Source: Secretrary, Salem Market Committee, Soolaimedu, Uthamacholapuram, Salem District
Fertilizers (in „000‟ Tonne) Pesticides Urea
(„000‟
Tonne) Nitrogenous
(N)
Phosphates‟
(P2 05)
Potashic
(K2 0)
NPK
Complex
Total
(NPK)
Dust
(Kgs.)
Liquid
(Lit.)
(1) (2) (3) (4) (5) (6) (7) (8)
27.555 12.960 11.029 - 51.544 14047 15421 42.828

District Statistical Handbook 2015-16 Page 66
3.8. CROP INSURANCE SCHEME FOR THE FASLI YEAR 1426 (2015-16)
Year: 2015-16
Sl.
Number Name of the Crop
Number of
Beneficiaries Area in
Hectare
Premium
collected
Loan
Amount
Sanctioned
1 Banana 50 5.57 202.55
2 Sugarcane 1776 33.62 1334.80
3 Tapioca 45 1.10 55.00
4 Paddy II 417 10.32 1032.00
5 Paddy III 17 0.39 39.00
Total 2305 51.00 2673.35
Source: Special Officer, Salem District Central Cooperative Bank, Salem.
3.9. SERICULTURE
Year: 2015-16
Name of the
block
Area under Mulberry
(Acres)
Production of
Cocoons(Kgs)
Value of the cocoon
(Rs.)
1 2 3 4
Mechery 206.75 74150.000 1,13,94,190.000
Edapady 515.70 126636.000 2,27,18,437.00
Salem ® 312.4 96566.000 1,31,31,550.00
Salem (Ex) 522.20 1,29,588.000 2,52,23,131.00
Attur 398.00 1,12,255.000 1,86,44,025.00
Omalur 228.00 56000.000 81,94,950.00
Total 2183.05 5,95,195.000 9,93,06,283.00
Source: Asst.Director of Sericulture, Salem

District Statistical Handbook 2015-16 Page 67
4. IRRIGATION
4.1. SOURCES OF WATER SUPPLY – TALUKWISE
Year: 2015-16
Sl.
Number
Name of
the Taluk
Canals
Numbers
Length
(Km.)
Wells
used for
irrigation
purpose
only
Tube
Wells
Wells
used for
Domestic
Purpose
only
Reser
voirs
Tanks
(Nos.)
1 2 3 4 5 6 7 8 9
1 Salem 0 0 6368 521 1851 0 13
2 Salem
south 0 0 4427 0 2715 0 7
3 Salem west 0 0 3226 0 1711 0 2
4 Yercaud 0 0 0 0 143 0 0
5 Attur 48 89 22091 2026 4969 1 210
6 Gangavalli 8 1 13293 1527 1382 0 34
7 Mettur 3 106 10461 2141 4932 1 3
8 Omalur 4 23 6099 994 2849 0 75
9 Sankagiri 7 0 11128 3298 1585 0 54
10 Edapady 4 2 7577 1802 5755 0 87
11 Valappady 2 0 10557 4539 1588 0 36
Total 76 221 95227 16848 29480 2 521
Source: Salem District G-Return 2015-16
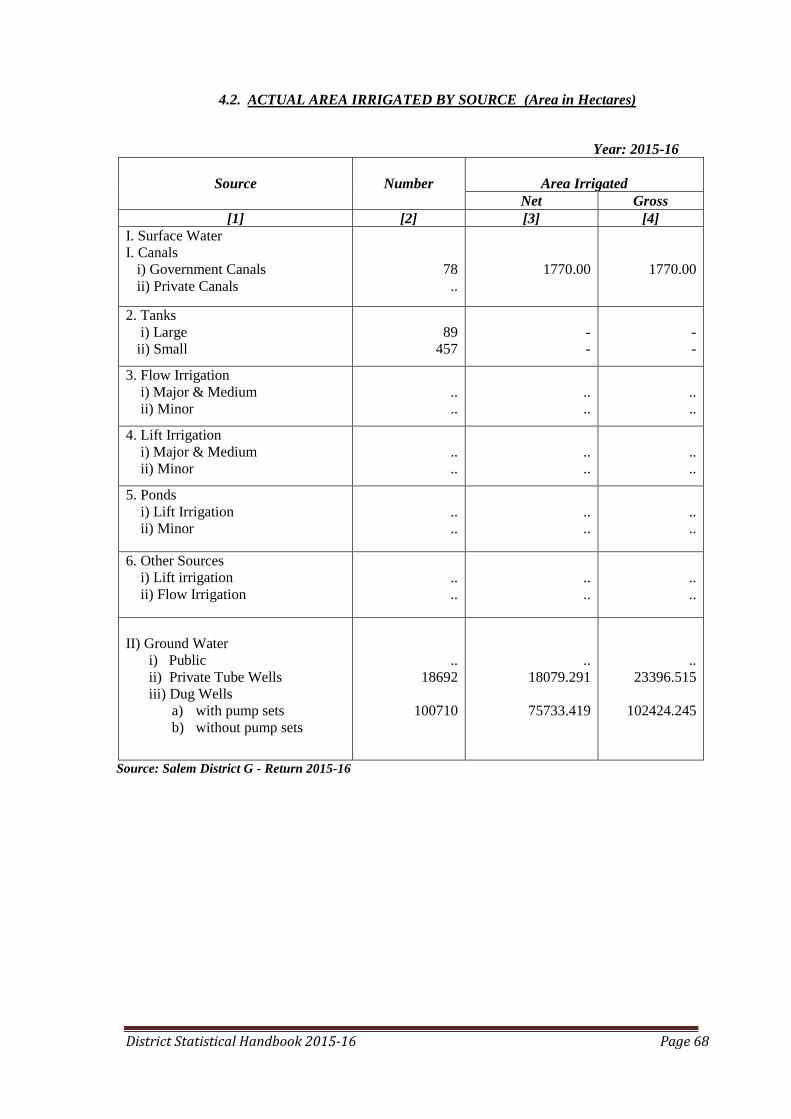
District Statistical Handbook 2015-16 Page 68
4.2. ACTUAL AREA IRRIGATED BY SOURCE (Area in Hectares)
Year: 2015-16
Source
Number
Area Irrigated
Net Gross
[1] [2] [3] [4]
I. Surface Water
I. Canals
i) Government Canals
ii) Private Canals
78
..
1770.00
1770.00
2. Tanks
i) Large
ii) Small
89
457
-
-
-
-
3. Flow Irrigation
i) Major & Medium
ii) Minor
..
..
..
..
..
..
4. Lift Irrigation
i) Major & Medium
ii) Minor
..
..
..
..
..
..
5. Ponds
i) Lift Irrigation
ii) Minor
..
..
..
..
..
..
6. Other Sources
i) Lift irrigation
ii) Flow Irrigation
..
..
..
..
..
..
II) Ground Water
i) Public
ii) Private Tube Wells
iii) Dug Wells
a) with pump sets
b) without pump sets
..
18692
100710
..
18079.291
75733.419
..
23396.515
102424.245
Source: Salem District G - Return 2015-16
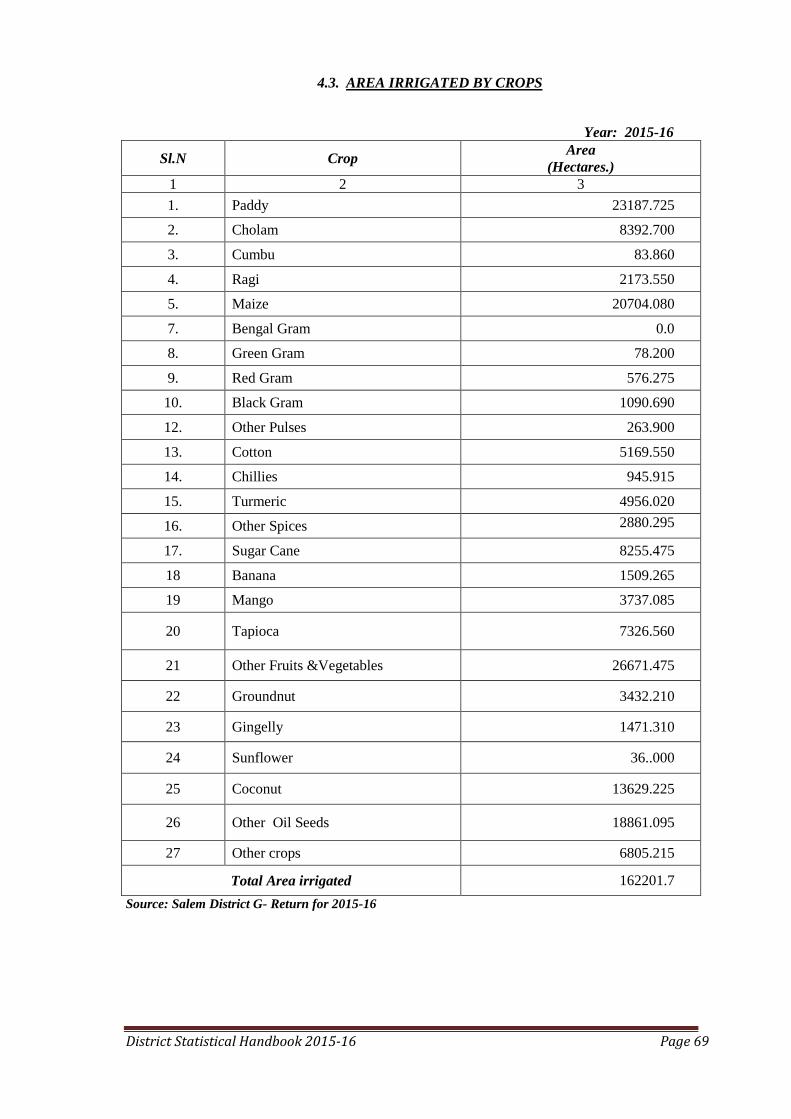
District Statistical Handbook 2015-16 Page 69
4.3. AREA IRRIGATED BY CROPS
Year: 2015-16
Source: Salem District G- Return for 2015-16
Sl.N Crop Area
(Hectares.)
1 2 3
1. Paddy 23187.725
2. Cholam 8392.700
3. Cumbu 83.860
4. Ragi 2173.550
5. Maize 20704.080
7. Bengal Gram 0.0
8. Green Gram 78.200
9. Red Gram 576.275
10. Black Gram 1090.690
12. Other Pulses 263.900
13. Cotton 5169.550
14. Chillies 945.915
15. Turmeric 4956.020
16. Other Spices 2880.295
17. Sugar Cane 8255.475
18 Banana 1509.265
19 Mango 3737.085
20 Tapioca 7326.560
21 Other Fruits &Vegetables 26671.475
22 Groundnut 3432.210
23 Gingelly 1471.310
24 Sunflower 36..000
25 Coconut 13629.225
26 Other Oil Seeds 18861.095
27 Other crops 6805.215
Total Area irrigated 162201.7

District Statistical Handbook 2015-16 Page 70
4.4. DETAILS OF DAMS, TANKS, WELLS AND BORE WELLS
Year: 2015-16
Source: Salem District G-return 2015-16
S.No Name of
the Taluk
Dams Tanks
Nu
mb
er
of
Well
s in
use
Nu
mb
er
of
Bo
re w
ells
Ca
tch
men
ts a
rea
Wa
ter
spre
ad
are
a
Hei
gh
t
Ca
pa
city
Len
gth
of
can
als
Wa
ter
spre
ad
are
a
Ca
pa
city
Hei
gh
t
Len
gth
of
can
als
1 2 3 4 5 6 7 8 9 10 11 12 13
1. Salem - 890 - - - 690 - - - 6368 521
2 Salem
South - 4427 0
4 Salem west 2974 0
5 Athur - 765 - - - 514 - - - 22091 2026
6 Gangavalli - - - - - 150 - - - 11988 796
7 Yercaud - - - - - - - - - - -
8 Omalur - - - - - 420 - - - 14373 991
9 Mettur - 632 - - - 426 - - - 10985 718
10 Sankagiri - 3784 - - - 430 - - - 11436 3410
11 Edapady - 1712 - - - 1012 - - - 7577 1795
12 Valappady - 719 - - - 450 - - - 11301 1957
Total - 8502 - - - 4092 - - - 103525 12214

District Statistical Handbook 2015-16 Page 71
5. ANIMAL HUSBANDARY
5.1. LIVESTOCK POPULATION
ACCORDING TO 19th
LIVE STOCK CENSUS-2012
Sl.
Number
Classification Numbers
(1) (2) (3)
1 Cattle
Exotic / cross breed
Indigenous 552717
2 Buffaloes 78262
3 Sheep 334048
4 Goats 440036
5 Horses 141
6 Pigs 20321
7 Mules 0
8 Camels 0
9 Donkeys 595
10 Domestic Dogs 127089
11 Rabits 2617
Total Animals 1555826
Poultry 4945300
Total lives Stock 6501126
Source: Joint Director of Animal Husbandry, Salem

District Statistical Handbook 2015-16 Page 72
5.2. VETERINARY INSTITUTIONS AND ANIMALS TREATED - BLOCKWISE
(Year: 2015-16)
Sl.
Number Name of the Block
Veterinary Institutions
Su
b-c
entr
es
Other Units
An
imals
tre
ate
d
Ca
stra
tio
n p
erfo
rmed
Po
lycl
inic
Ho
spit
als
Dis
pen
sari
es
Cli
nic
ian
Cen
tres
An
imal
dis
ease
inve
stig
ati
on
un
it
Mo
bil
e u
nit
s
1 2 3 4 5 6 7 8 9 10 11
1 Salem 1 0 7 0 0 1 1
2103776 65632
2 Veerapandy 0 1 8 0 0 0 0
3 P.N.Patty 0 0 8 0 1 0 0
4 A.Pattanam 0 0 10 0 0 0 1
5 Valappady 0 0 7 0 1 0 0
6 P.N.Palayam 0 0 7 0 3 0 1
7 Athur 0 1 7 0 2 0 0
8 Gangavalli 0 0 8 0 0 0 1
9 Thalaivasal 0 0 11 0 1 0 0
10 Yercaud 0 1 3 0 0 0 1
11 Omalur 0 1 7 0 0 0 1
12 Tharamangalam 0 0 5 0 0 0 0
13 Kadaiyampatty 0 0 5 0 1 0 0
14 Mecheri 0 0 5 0 0 0 0
15 Nangavalli 0 0 6 0 0 0 0
16 Kolathur 0 1 6 0 0 0 0
17 Edapady 0 1 6 0 0 0 0
18 Konganapuram 0 0 3 0 1 0 0
19 Sankagiri 0 0 9 0 1 0 0
20 Magundanchavadi 0 0 6 0 0 0 0
Total 1 6 134 0 11 1 6
Source: Joint Director of Animal Husbandry, Salem

District Statistical Handbook 2015-16 Page 73
5.3. NUMBER OF VETERINARY HOSPITALS
Year: 2015-16
Sl.
Number Name of the Block
Number of
Government Hospitals Private Hospitals
1 2 3 4
1. Veerapandy 1 -
2. Yercaud 1 -
3. Attur 1 -
4. Edapady 1 -
5. Omalur 1 -
6. Kolathur(Mettur) 1 -
Total 6 -
Source: Joint Director of Animal Husbandry, Salem
5.4. DAIRY DEVELOPMENT
Year: 2015-16
Name of the
Block/Urban Town
Name and address of
milk societies
Quantity of milk
produced
(In Litres)
Value of milk
produced
(In Rs.)
1 2 3 4
Salem District
The Salem Dist. Co-
operative Milk
Producers Union Ltd
Salem (696 Societies)
172342842 3445133411
Source: General Manager, Salem District Co-op. Milk Producers‟Union Ltd, Sithanoor, Thalavaipatty,
Salem-636302
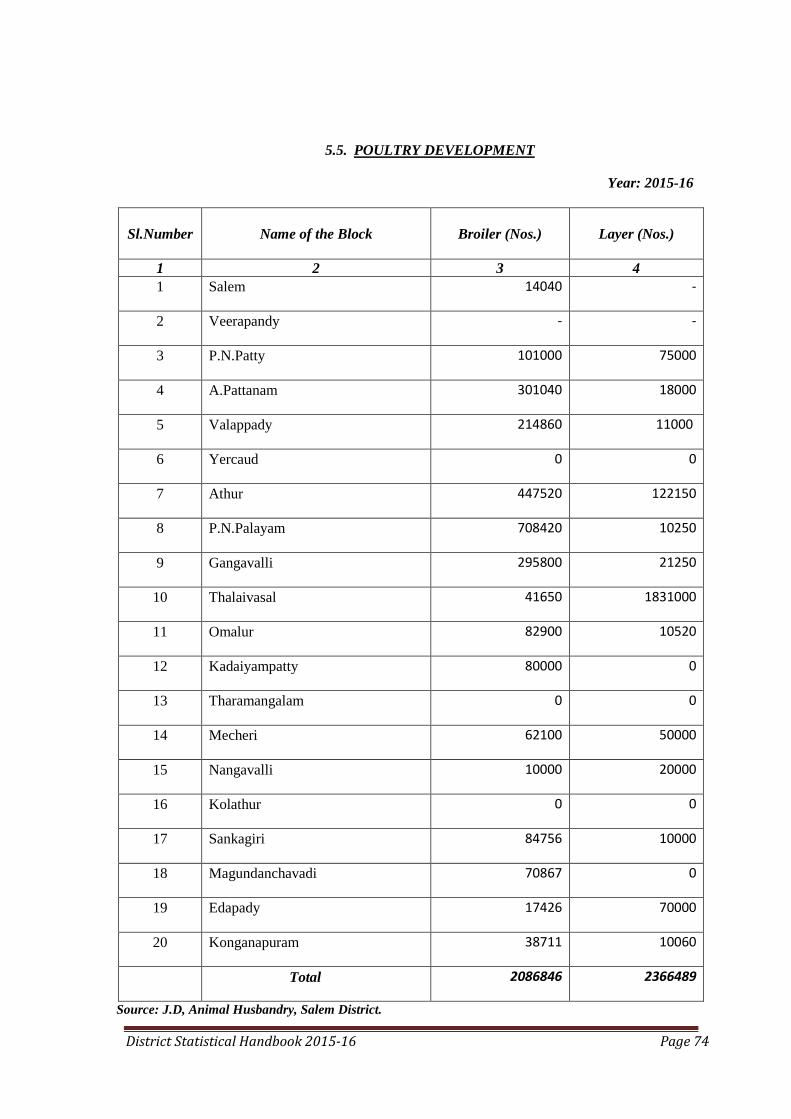
District Statistical Handbook 2015-16 Page 74
5.5. POULTRY DEVELOPMENT
Year: 2015-16
Sl.Number
Name of the Block
Broiler (Nos.)
Layer (Nos.)
1 2 3 4
1 Salem 14040 -
2 Veerapandy - -
3 P.N.Patty 101000 75000
4 A.Pattanam 301040 18000
5 Valappady 214860 11000
6 Yercaud 0 0
7 Athur 447520 122150
8 P.N.Palayam 708420 10250
9 Gangavalli 295800 21250
10 Thalaivasal 41650 1831000
11 Omalur 82900 10520
12 Kadaiyampatty 80000 0
13 Tharamangalam 0 0
14 Mecheri 62100 50000
15 Nangavalli 10000 20000
16 Kolathur 0 0
17 Sankagiri 84756 10000
18 Magundanchavadi 70867 0
19 Edapady 17426 70000
20 Konganapuram 38711 10060
Total 2086846 2366489
Source: J.D, Animal Husbandry, Salem District.

District Statistical Handbook 2015-16 Page 75
5.6. FISHERIES DEVELOPMENT AND PRODUCTION
Year: 2015-16
Name and Address of
Fishing centres
Inland Fish Catch
(Tonne)
Marine Fish Catch
(Tonne)
Number of
Fisherman
engaged
1 2 3 4
Salem 11.48 - 600
Veerapandy 23.32 - 150
P.N.patty 21.33 - 50
A.Pattanam 7.42 - 120
Valappady 10.546 - 50
Yercaud 1.35 - 20
Attur 14.97 - 550
P.N.Palayam 45.35 - 525
Gangavalli 119.6 - 420
Thalaivasal 50.94 - 120
Omalur 14.5 - 50
Kadaiyampatty 21.12 - 350
Tharamangalam 23.417 - 50
Mecheri 3.66 - 250
Nangavalli 1.215 - 50
Kolathur 1294.37 - 2000
Sankagiri 6.125 - 400
Magudanchavadi 9.24 - 20
Edapady 20.89 - 450
Konganapuram 12.411 - 150
District Total 1713.614 - 6375
Source: A.D Fisheries Department, Mettur.
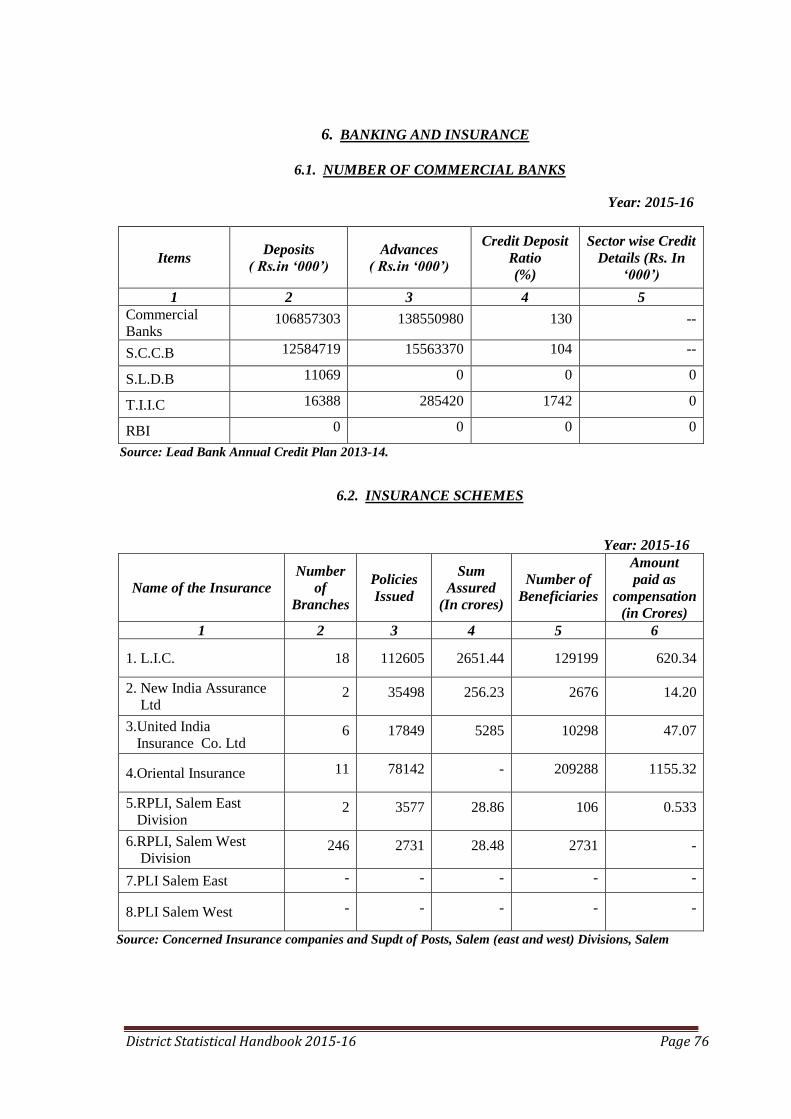
District Statistical Handbook 2015-16 Page 76
6. BANKING AND INSURANCE
6.1. NUMBER OF COMMERCIAL BANKS
Year: 2015-16
Items Deposits
( Rs.in „000‟)
Advances
( Rs.in „000‟)
Credit Deposit
Ratio
(%)
Sector wise Credit
Details (Rs. In
„000‟)
1 2 3 4 5
Commercial
Banks 106857303 138550980 130 --
S.C.C.B 12584719 15563370 104 --
S.L.D.B 11069 0 0 0
T.I.I.C 16388 285420 1742 0
RBI 0 0 0 0
Source: Lead Bank Annual Credit Plan 2013-14.
6.2. INSURANCE SCHEMES
Year: 2015-16
Name of the Insurance
Number
of
Branches
Policies
Issued
Sum
Assured
(In crores)
Number of
Beneficiaries
Amount
paid as
compensation
(in Crores)
1 2 3 4 5 6
1. L.I.C. 18 112605 2651.44 129199 620.34
2. New India Assurance
Ltd 2 35498 256.23 2676 14.20
3.United India
Insurance Co. Ltd 6 17849 5285 10298 47.07
4.Oriental Insurance 11 78142 - 209288 1155.32
5.RPLI, Salem East
Division 2 3577 28.86 106 0.533
6.RPLI, Salem West
Division 246 2731 28.48 2731 -
7.PLI Salem East - - - - -
8.PLI Salem West - - - - -
Source: Concerned Insurance companies and Supdt of Posts, Salem (east and west) Divisions, Salem

District Statistical Handbook 2015-16 Page 77
7. CO-OPERATION
7.1. COOPERATIVE SOCIETIES
LOANS AND ADVANCES (RS.IN. LAKHS) IN 2015-16
Sl.
No
Type of
Societies
Year : 2015-16
Nu
mb
er
of
So
ciet
ies
Mem
ber
ship
Sh
are
Ca
pit
al
Wo
rkin
g
Ca
pit
al
Ou
t
sta
ndin
g
Ove
rdu
e
Nu
mb
er
of
Em
plo
yees
1 Salem District
Central Co-op
Bank
1 1973 24919.40 417916.98 218702.26 5999.95 377
2
Salem District
Consumer Co-op
wholesale Stores
1 2102 49.81 406.75 535.45 - 233
3 Salem District
Co-Op Union 1 1352 - - - - 3
4 Salem Dist. Co-
Op Printing
Press
1 1479 1534.50 44.96 41.17 - 13
5 Nachiappa
Institute of Co-
op Mgt.
1 693 1.11 - - - 4
6 Primary Agri.
Rural &
Development
Banks
6 50183 278.22 3956.45 2620.96 540.84 21
7 Co-op Urban
Banks
8 198649 1597.73 86257.90 43789.81 2794.20 315
8 Urban Credit
Societies 3 11712 145.95 18390.22 10463.44 1197.86 39
9
Agricultural
Producers Co-
Op Marketing
Societies
2 88735 544.00 5292.22 5703.55 353.33 214
10 Lamp Co-Op
Societies 5 32866 253.87 3247.39 4251.78 360.98 44
11 Primary Agri.
Co-Op Banks 205 615095 9560.61 191189.83 167038.21 13250.01 1737

District Statistical Handbook 2015-16 Page 78
Source: Joint Registrar of Cooperative Societies, Salem district.
12
Employees Co-
op Thrift and
Credit Societies
92 53972 11450 84759.36 87061.62 906.1 129
13 Primary Co-op
Stores 5 14075 723.03 93.32 36.61 3.05 49
14 Employees Co-
op Stores 15 1042.20 412.29 3065.35 2577.89 10.99 62
15 Labour Contract
Co-op Societies 0 0 0 0 0 0 0
16 Labour Co-
operative
Society
1 200 3.36 56.13 50.37 0 1
17 Lift Irrigation
Co-operative
Society
1 553 3.94 15.59 21.23 0 1
18 Lift Irrigation
Co- operative
Society
0 0 0 0 0 0 0
19 Students Co-
operative Stores 6 12287 1.036 63.90 0 0 2
20 Semi Model Co-
operative Stores 0 0 0 0 0 0 0
Total 354 1086968 51478.86 814756.4 542894.4 25417.31 3244

District Statistical Handbook 2015-16 Page 79
8. CIVIL SUPPLIES
8.1. NUMBER OF FAIR PRICE SHOPS
Year: 2015-16
Sl.Number Name of the Taluks Number of Shops
1 2 3
1 Salem 212
2 Salem west 98
3 Salem south 114
4 Valappady 106
5. Athur 210
6. Gangavalli 84
7. Yercaud 30
8. Sankagiri 135
9 Edapady 122
10. Mettur 183
11. Omalur 223
District Total 1517
Source: District Supply Officer, Salem
8.2. QUANTUM OF ESSENTIAL COMMODITIES DISTRTIBUTED AND THEIR RETAIL
PRICES
Year: 2015-16
Sl. No Name of the
Commodity Issue Price per (Kg.) Scale of Supply
1
Rice
Super Fine
Fine
Common
Free Rice
Minimum 8+4Kgs
Maximum 20Kgs
Per Unit 4Kgs
2 Wheat Rs.7.50 Each 5Kgs
3 Sugar Rs.13.50 -
4 Kerosene Rs.14.00
No.of
LPG
1
LPG
2
LPG
Corporation 10 3 0
Municipality 06 3 0
Town Panchayat 05 3 0
Rural 03 3 0
Hill Areas 10 3 0
5 Palmoelin Rs.25 1 Lit per card
6 Toor Dhall Rs.30 1Kg per card
7 Urid DhLL Rs.30 1Kg per card
Source: District Supply Officer, Salem

District Statistical Handbook 2015-16 Page 80
8.3. NUMBER OF RATION CARDS (RURAL AND URBAN) 2015-16
Region Number of Ration Cards
Rural
Urban
443635
498687
District Total 942322
Source: District Supply Officer, Salem
8.4. QUANTITY SUPPLIED
Year: 2015-16
Sl. Number
Items
Quantity Supplied (M.T)
1. Rice (Tonne) 175560
2. Wheat (Tonne) 9180
3. Sugar (Tonne) 22420
4 AAY 34560
5. Kerosene (Kilo Litre) 15696(KL)
Source: District Supply Officer, Salem
8.5. NUMBER OF L.P.G. CONNECTIONS
Source: District Supply Officer, Salem
8.6. NUMBER OF PERSONS WATING FOR L.P.G. CONNECTIONS
Year: 2015-16
Sl.Number Name of the Taluks Government L.P.G.Connections
Private L.P.G.
Connections
Single Double Single Double
1. Salem District Nil Nil - -
Source: District Supply Officer, Salem
Sl.Number Name of the Taluks
Government L.P.G.
Connections
Private L.P.G.
Connections
Single Double Single Double
1. Salem District
255690 281410 -- --

District Statistical Handbook 2015-16 Page 81
9. COMMUNICATIONS 9.1. POST OFFICES DOING POSTAL BUSINESS ONLY-2015-16
Number Name of the Blocks/Municipalities Post Office doing postal business only
(Nos.)
1 2 3
1 Salem (including Salem Corporation) 59
2 Veerapandy 13
3 P.N.Patty 18
4 AyothiyaPattanam 19
5 Valappady 29
6 Yercaud 31
7 Attur (including Athur Municipality) 23
8 Pethanaickenpalayam 28
9 Gangavalli 34
10 Thalaivasal 19
11 Omalur 7
12 Kadayampatty 3
13 Tharamangalam 3
14 Mecheri 3
15 Nangavalli 3
-16 Kolathur 1
17 Sankari -
18 M.D.Choultry -
19 Edappady -
20 Konganapuram -
1 Salem Corporation Included in Salem Block
2 Attur Municipality Included in Athur Block
3 Mettur Municipality 8
4 Edappady Municipality -
5 Narasingapuram 6
Source: Senior Supdt of Posts, Salem East & West Divisions, Salem

District Statistical Handbook 2015-16 Page 82
9.2. POST OFFICES DOING POST AND TELEGRAPHIC BUSINESS
Year: 2015-16
S.No Name of the Blocks/Municipalities
Post Office doing Post and
Telegraphic business
(Nos.)
1 2 3
1 Salem
Nil
2 Veerapandy
3 P.N.Patty
4 A.Pattanam
5 Valappady
6 Yercaud
7 Athur
8 P.N.Palayam
9 Gangavalli
10 Thalaivasal
11 Omalur
Nil
12 Kadaiyampatty
13 Tharamangalam
14 Mecheri
15 Nangavalli
16 Kolathur
17 Sankagiri
18 M.D.Choultry
19 Edapady
20 Konganapuram
1. Salem Corporation. Nil
2. Athur Municipality Nil
3. Mettur Municipality Nil
4. Edapady Municipality Nil
5. Narasingapuram Municipality Nil
Source: Senior Supdt of Posts, Salem East & West Divisions, Salem
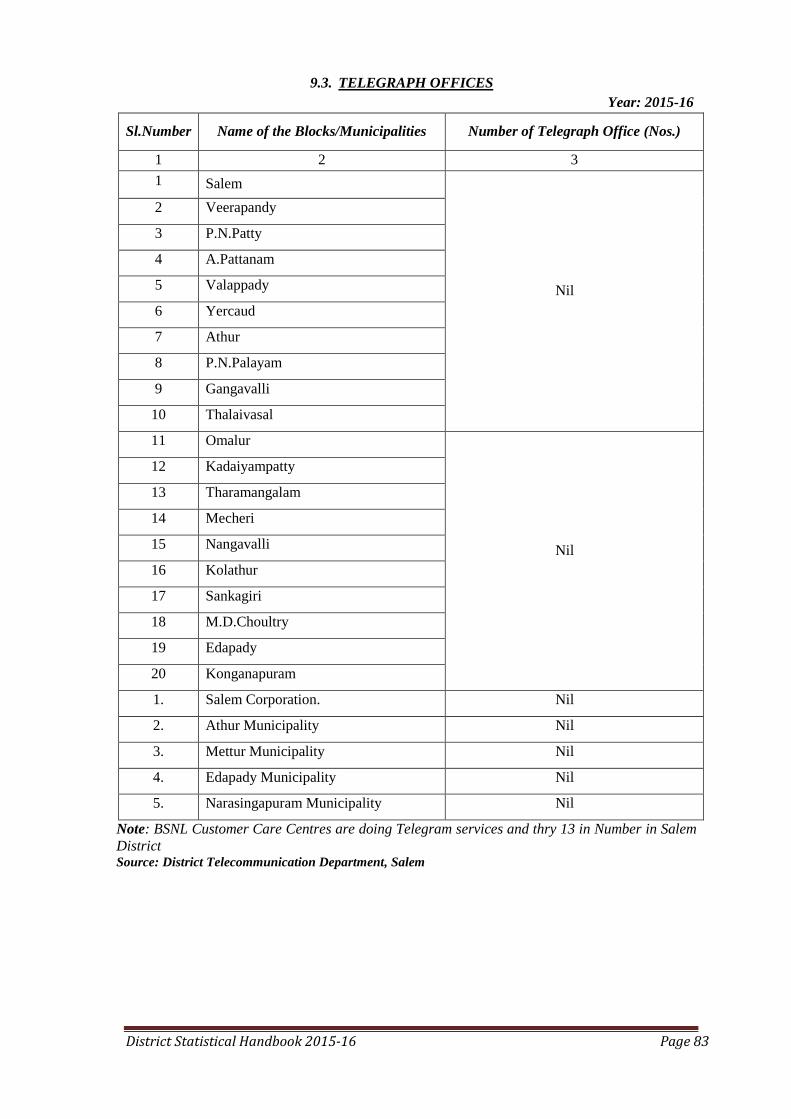
District Statistical Handbook 2015-16 Page 83
9.3. TELEGRAPH OFFICES
Year: 2015-16
Sl.Number Name of the Blocks/Municipalities Number of Telegraph Office (Nos.)
1 2 3
1 Salem
Nil
2 Veerapandy
3 P.N.Patty
4 A.Pattanam
5 Valappady
6 Yercaud
7 Athur
8 P.N.Palayam
9 Gangavalli
10 Thalaivasal
11 Omalur
Nil
12 Kadaiyampatty
13 Tharamangalam
14 Mecheri
15 Nangavalli
16 Kolathur
17 Sankagiri
18 M.D.Choultry
19 Edapady
20 Konganapuram
1. Salem Corporation. Nil
2. Athur Municipality Nil
3. Mettur Municipality Nil
4. Edapady Municipality Nil
5. Narasingapuram Municipality Nil
Note: BSNL Customer Care Centres are doing Telegram services and thry 13 in Number in Salem
District Source: District Telecommunication Department, Salem

District Statistical Handbook 2015-16 Page 84
9.4. NUMBER OF TELEPHONE EXCHANGES, CAPACITY AND NUMBER IN USE
Year: 2015-16
Sl.
Number Item Numbers
1 2 3
1.
2.
3.
4.
5.
Number of Telephone Exchanges
Number of Equipped Capacity
Number of Direct Exchange Lines
Number of Junction Lines
Number of Telephones in use
143
165890
65213
---
135750
Source: General Manager, BSNL, Salem
9.5. NUMBER OF PUBLIC CALL OFFICES ATTACHED TO EACH EXCHANGE
Year: 2015-16
Sl.No Name of the Exchange
Centre
Number of Public Call Office
With STD / ISD Without STD / ISD
1. SALEM SSA 447 5495
Source: General Manager, BSNL, Salem
9.6. NUMBER OF PERSONS WAITING FOR PHONE CONNECTIO
Year: 2015-16
Sl.Number Number of
exchange
Number Of public call office Number of
persons waiting
for phone
connections With STD/ISD
Without
STD/ISD
NIL
Source: General Manager, BSNL, Salem
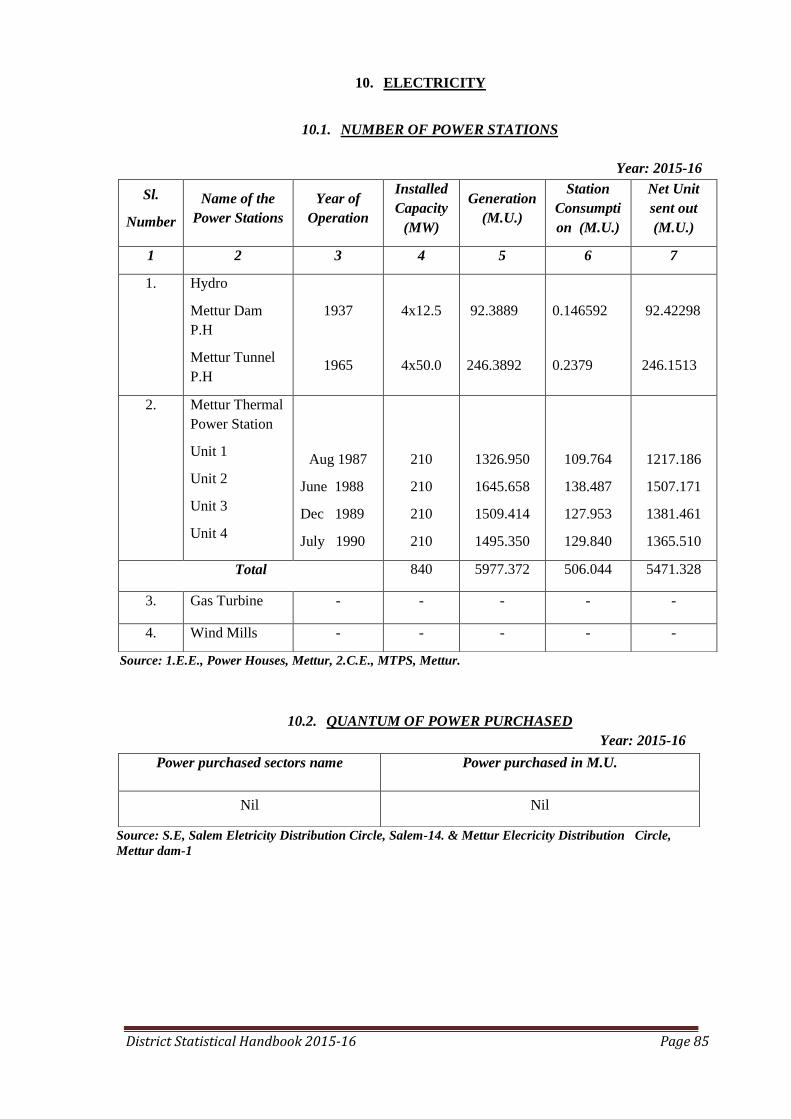
District Statistical Handbook 2015-16 Page 85
10. ELECTRICITY
10.1. NUMBER OF POWER STATIONS
Year: 2015-16
Source: 1.E.E., Power Houses, Mettur, 2.C.E., MTPS, Mettur.
10.2. QUANTUM OF POWER PURCHASED
Year: 2015-16
Source: S.E, Salem Eletricity Distribution Circle, Salem-14. & Mettur Elecricity Distribution Circle,
Mettur dam-1
Sl.
Number
Name of the
Power Stations
Year of
Operation
Installed
Capacity
(MW)
Generation
(M.U.)
Station
Consumpti
on (M.U.)
Net Unit
sent out
(M.U.)
1 2 3 4 5 6 7
1. Hydro
Mettur Dam
P.H
Mettur Tunnel
P.H
1937
1965
4x12.5
4x50.0
92.3889
246.3892
0.146592
0.2379
92.42298
246.1513
2. Mettur Thermal
Power Station
Unit 1
Unit 2
Unit 3
Unit 4
Aug 1987
June 1988
Dec 1989
July 1990
210
210
210
210
1326.950
1645.658
1509.414
1495.350
109.764
138.487
127.953
129.840
1217.186
1507.171
1381.461
1365.510
Total 840 5977.372 506.044 5471.328
3. Gas Turbine - - - - -
4. Wind Mills - - - - -
Power purchased sectors name Power purchased in M.U.
Nil Nil

District Statistical Handbook 2015-16 Page 86
10.3. POWER CONSUMPTION SECTOR WISE
Year: 2015-16
Sl.
Number
Sector
Consumption (M.U) % of the consumption
Salem
Circle
Mettur
circle
Total Salem
Circle
Mettur
circle
Total
1 Industries 214.75 280.21 494.96 11.33 25.94 37.27
2 Agriculture & Huts 400.3 242.93 643.23 15.29 22.48 37.77
3 Domestic 595.48 313.98 909.46 27.77 29.05 56.82
4 Commercial 193.50 124.82 318.32 9.02 11.56 20.58
5 Public lighting and
Public Works 83.75 60.56 144.31 3.91 5.60 9.51
6 Sales to licensees 2.32 14.978 17.298 0.11 1.38 1.49
7 Sales to other States 0 0 0 0 0 0
8 Miscellaneous 106 43.07 149.07 5.32 399.00 9.22
Total 1596.1 1080.548 2676.648 72.75 99.91 172.66
Source: 1. S.E., SEDC, Udaiyapatty, Salem – 14, 2.S.E. MEDC, Mettur
10.4. PEAK DEMAND AND ENERGY OUTPUT
Year: 2015-16
Power Demand
Details
Salem E.D.
Circle
Mettur E.D.
Circle
1 2 3
1. Instantaneous peak demand
2. Sustained peak demand
3. Energy Output
576.93 MW
426.78 MW
2700.11 MU
410 MVA
538.35 MVA
-
Source: 1. S.E., SEDC, Udaiyapatty, Salem – 14, 2.S.E. MEDC, Mettur

District Statistical Handbook 2015-16 Page 87
10.5. REVENUE FROM ELECTRIC SCHEMES AND COST PER UNIT
Year: 2015-16
Sectors Cost per unit Income in Rs. in „000‟
Salem Circle Mettur Circle Salem Circle Mettur Circle
Government 6.74 8.03 1575.35 207773
Public 6.07 5.22 2163.72 316236
Private 9.05 4.01 14111.46 2700728
Total 21.86 17.26 17850.53 3224737
Source: 1. S.E., SEDC, Udaiyapatty, Salem – 14, 2.S.E. MEDC, Mettur
10.6. TRANSMISSION AND DISTRIBUTION OF ELECTRICITY
Year: 2015-16
S.No Item
Salem Circle Mettur Circle
Unit Achievement
Unit Achievement
1 Agri. Pump sets 355 335 291
2 Industrial Services 2511 2511 2794
3 Hut Service 0 0 0
4 H.T.Service 6 6 9
5 O.H.T. Service 390 390 420
6 Non Power Service 6734 6734 17156
7 New 110/22 KV SS
Committee
1 1 2
8 Distribution Transformer
Erected
333 333 260
Distribution Line Erected
(km)
a) HT
83.736
83.736
83.91
9
10 b) LT 502.634 502.634 384.33
Source: 1. S.E., SEDC, Udaiyapatty, Salem – 14, 2.S.E. MEDC, Mettur
10.7. RURAL ELECTRIFICATION 2015-16
Electrified during the year Electrified up to the year
TALUK Village Hamlet
Agri.
TALUK Village Hamlet
Agri.
EB
Circle Pump
set Pumpset
1 2 3 4 1 2 3 4
Salem - - - 355 - - - 90665
Mettur 0 0 0 291 4 156 2485 45770

District Statistical Handbook 2015-16 Page 88
10.8. CAPACITY OF TRANSFORMERS
Year: 2015-16
S. No Name of the Stations / Sub Stations Capacity
1 Nethimedu,Salem 4X25MVA, Auto - 1X80+2X100MVA
2 Udayapatty,Salem 3X25 MVA
3 Karuppur,Salem 3X25 MVA
4 Vembadithalam 1X16 MVA+2X25 MVA
5 Mallur 2X25 MVA
6 Singapuram 2X25 MVA
7 Thumbal 1X10 MVA+ 1X16 MVA
8 Thammampatty 1X16 MVA+1X25 MVA
9 Attur 2X25 MVA
10 Thalaivasal 2X25 MVA
11 Deviakurichi Auto - 2X100 MVA
12 Mettupatty 2X25 MVA
13 Kitchipalayam 3X25 MVA
14 Thedavoor 2X16 MVA
15 Kandampatti 2X16 MVA
16 Hasthampatti 2X25 MVA
17 P.G.Palayam 2X10 MVA
18 Gudamalai 1X10 MVA
19 Maliyakari 1X10 MVA
20 Veerapandy 1X16 MVA
20 Mettur RS 2X16 MVA
21 Kolathur 2X8 MVA
22 Thumbipadi 2X25 MVA
23 Nangavalli 1X10+2X10 MVA
24 Idappady 2X25MVA 25 Sankari 3X25 MVA
26 Jalakandapuram 2X16 MVA
27 Mecheri 2X10 MVA
28 Komarapalayam 2X25MVA
29 Pallipalayam 2X25MVA
30 Poolampatti 2X16 MVA
31 Mettur/Town 1X16+1X16+1X10+1X10 MVA
32 Tharamangalam 2X16 MVA
33 Samayasangilli 2X25 MVA
34 Veppadai 3X16 MVA
35 Iveli 2X16 MVA
36 Thevoor 1X16 MVA
37 Thoppur 1X16 MVA
38 Ettikuttaimedu 1X16 MVA
Source: 1. S.E., SEDC, Udaiyapatty, Salem – 14, 2.S.E. MEDC, Mettur
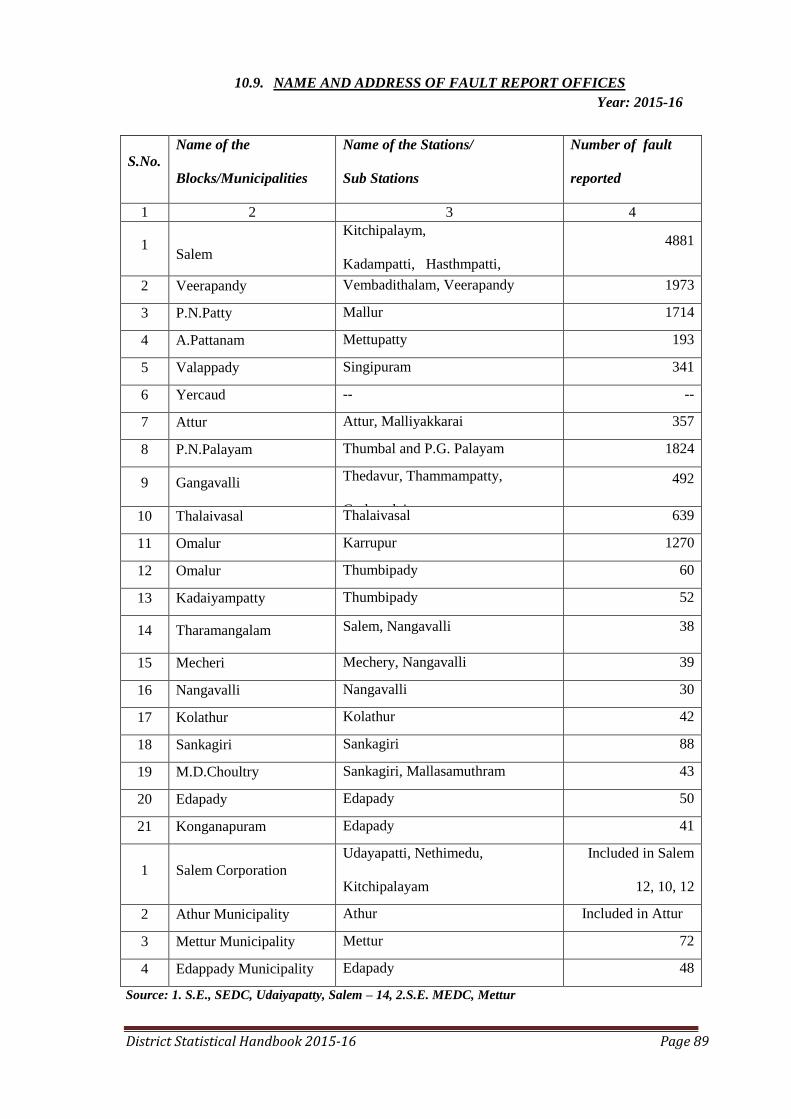
District Statistical Handbook 2015-16 Page 89
10.9. NAME AND ADDRESS OF FAULT REPORT OFFICES
Year: 2015-16
S.No.
Name of the
Blocks/Municipalities
Name of the Stations/
Sub Stations
Number of fault
reported
1 2 3 4
1 Salem
Kitchipalaym,
Kadampatti, Hasthmpatti,
Udaiapatti
4881
2 Veerapandy Vembadithalam, Veerapandy 1973
3 P.N.Patty Mallur 1714
4 A.Pattanam Mettupatty 193
5 Valappady Singipuram 341
6 Yercaud -- --
7 Attur Attur, Malliyakkarai 357
8 P.N.Palayam Thumbal and P.G. Palayam 1824
9 Gangavalli Thedavur, Thammampatty,
Gudamalai
492
10 Thalaivasal Thalaivasal 639
11 Omalur Karrupur 1270
12 Omalur Thumbipady 60
13 Kadaiyampatty Thumbipady 52
14 Tharamangalam Salem, Nangavalli 38
15 Mecheri Mechery, Nangavalli 39
16 Nangavalli Nangavalli 30
17 Kolathur Kolathur 42
18 Sankagiri Sankagiri 88
19 M.D.Choultry Sankagiri, Mallasamuthram 43
20 Edapady Edapady 50
21 Konganapuram Edapady 41
1 Salem Corporation
Udayapatti, Nethimedu,
Kitchipalayam
Included in Salem
12, 10, 12
2 Athur Municipality Athur Included in Attur
3 Mettur Municipality Mettur 72
4 Edappady Municipality Edapady 48
Source: 1. S.E., SEDC, Udaiyapatty, Salem – 14, 2.S.E. MEDC, Mettur

District Statistical Handbook 2015-16 Page 90
11. EDUCATION
11.1. UNIVERSITIES, STUDENTS AND TEACHERS AND COURSES OFFERED
Year: 2015-16
Sl.Number
Name of the
University
Students
Teachers
Numberof
Depts Boys Girls Total
1 2 3 4 5 6 7
1.
Periyar
University,
Salem-636011
640 1154 1794 148 26
Source: Registrar of Respective University (Periyar University).
11.2. COLLEGES FOR GENERAL EDUCATION, STUDENTS AND TEACHERS
Year: 2015-16
Sl.
Number
Name of Institution
Numberof
Institution
Students
Teachers
Boys Girls Total
1 2 3 4 5 6 7
1. Government Colleges 3 4774 5546 10320 308
2. Aided Colleges 2 1510 3098 4608 171
3. Self Financed Colleges 27 9818 25935 35753 1465
4. Constituent Colleges 2 1090 1057 2147 47
Total 31 17192 35636 52828 1991
Source: Registrar of Respective University (Periyar University)
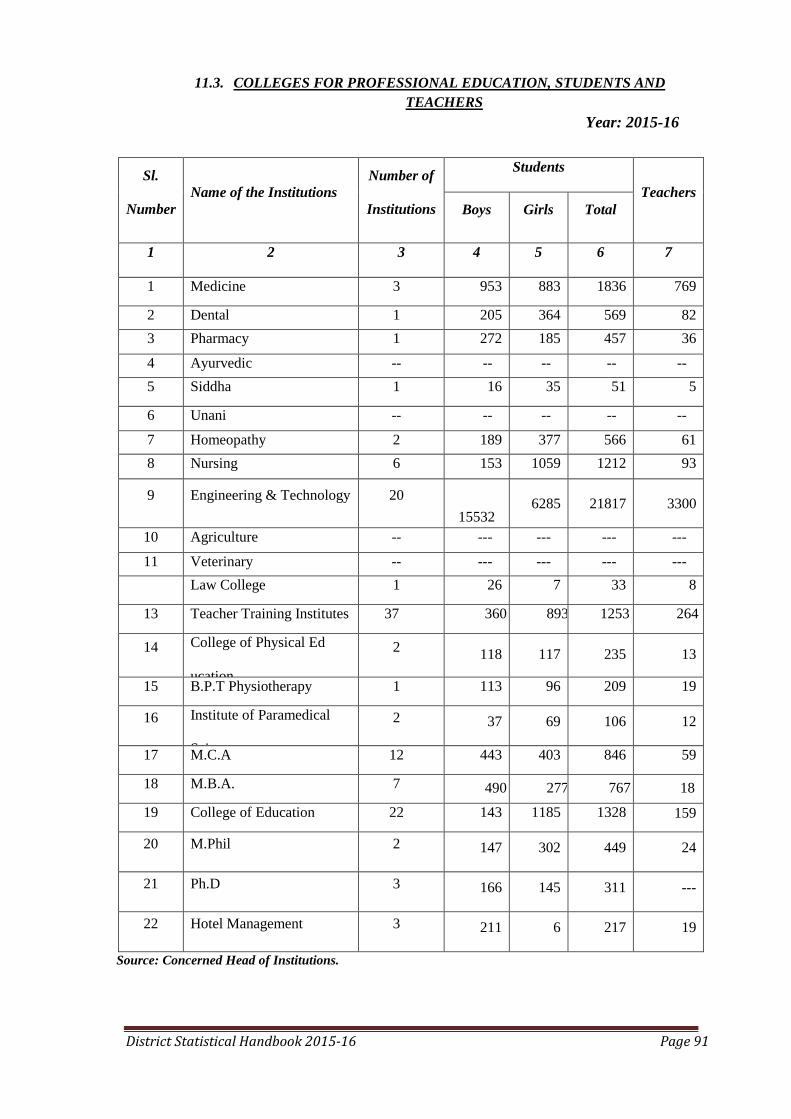
District Statistical Handbook 2015-16 Page 91
11.3. COLLEGES FOR PROFESSIONAL EDUCATION, STUDENTS AND
TEACHERS
Year: 2015-16
Sl.
Number
Name of the Institutions
Number of
Institutions
Students
Teachers
Boys Girls Total
1 2 3 4 5 6 7
1 Medicine 3 953 883 1836 769
2 Dental 1 205 364 569 82
3 Pharmacy 1 272 185 457 36
4 Ayurvedic -- -- -- -- --
5 Siddha 1 16 35 51 5
6 Unani -- -- -- -- --
7 Homeopathy 2 189 377 566 61
8 Nursing 6 153 1059 1212 93
9 Engineering & Technology 20
15532 6285 21817 3300
10 Agriculture -- --- --- --- ---
11 Veterinary -- --- --- --- ---
Law College 1 26 7 33 8
13 Teacher Training Institutes 37 360 893 1253 264
14 College of Physical Ed
ucation
2 118 117 235 13
15 B.P.T Physiotherapy 1 113 96 209 19
16 Institute of Paramedical
Science
2 37 69 106 12
17 M.C.A 12 443 403 846 59
18 M.B.A. 7 490 277 767 18
19 College of Education 22 143 1185 1328 159
20 M.Phil 2 147 302 449 24
21 Ph.D 3 166 145 311 ---
22 Hotel Management 3 211 6 217 19
Source: Concerned Head of Institutions.

District Statistical Handbook 2015-16 Page 92
11.4. COLLEGES FOR SPECIAL EDUCATION, STUDENTS AND TEACHERS
Year: 2015-16
Sl.No Name of Institutions
Number of
Institutions
Students
Teachers Boys Girls Total
1 2 3 4 5 6 7
NIL
11.5. SCHOOLS FOR GENERAL EDUCATION, STUDENTS AND TEACHERS
Year: 2015-16
S.No. Name of the Institutions
Number of
Institutions
Students Teache
rs Boys Girls Total
1 2 3 4 5 6 7
1
Kasturba Gandhi Balika
Vidhyalaya (KGBV)
2 Nursery Only
3 Primary with Nursery
4 Primary Only
5 Primary with Middle
6 Primary with Secondary
7
Primary with Higher
secondary
8 Middle Only
9 Middle with Secondary
10
Middle with Higher
Secondary
11
Secondary with Higher
Secondary 206 63475 71546 135021 4120
Source: DEEO Salem, DEOs Salem and Sankagiri
11.6. SCHOOLS FOR PROFESSIONAL EDUCATION, STUDENTS AND
TEACHERS
Year: 2015-16
Sl.
No
Name of the Institution
Number of
Institutions
Students
Teachers Boys Girls Total
1 2 3 4 5 6 7
1
Teacher Training
Institutions 37
360 893 1253 264
Source: Concerned Institutions
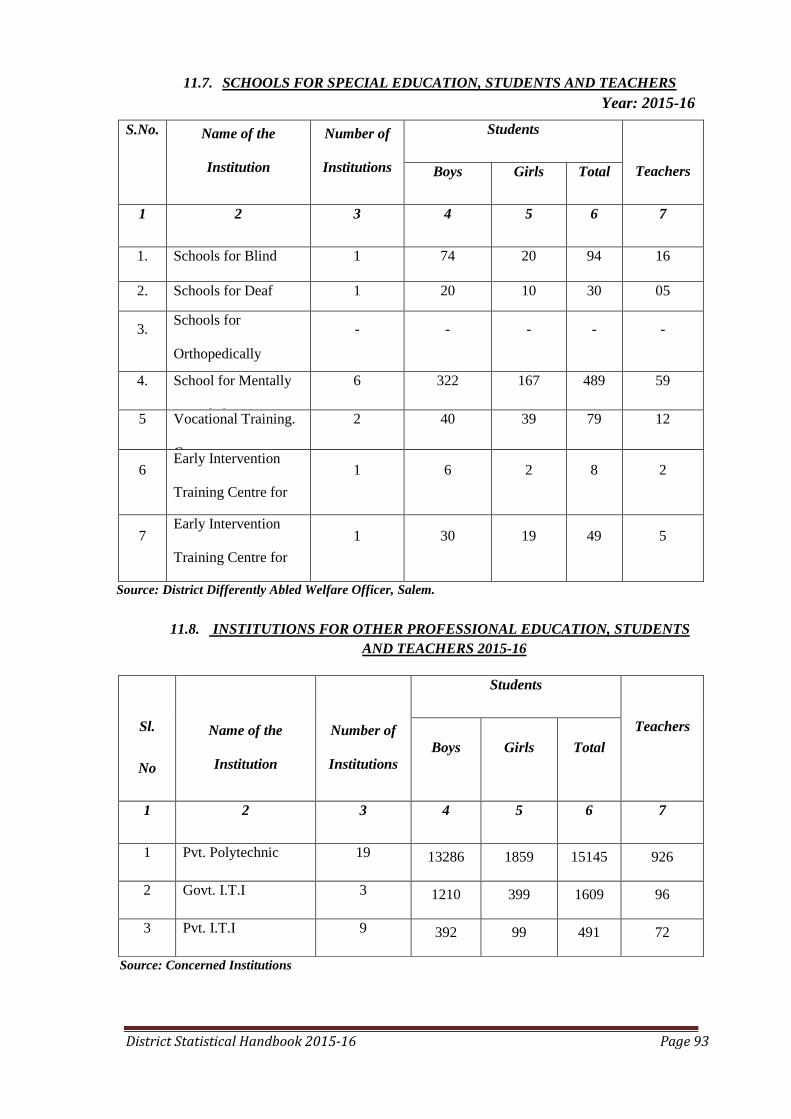
District Statistical Handbook 2015-16 Page 93
11.7. SCHOOLS FOR SPECIAL EDUCATION, STUDENTS AND TEACHERS
Year: 2015-16
S.No.
Name of the
Institution
Number of
Institutions
Students
Teachers Boys Girls Total
1 2 3 4 5 6 7
1. Schools for Blind 1 74 20 94 16
2. Schools for Deaf 1 20 10 30 05
3. Schools for
Orthopedically
Handicapped
- - - - -
4. School for Mentally
Retarded
6 322 167 489 59
5
Vocational Training.
Centres
2 40 39 79 12
6 Early Intervention
Training Centre for
Deaf
1 6 2 8 2
7 Early Intervention
Training Centre for
Mentally Retarded
1 30 19 49 5
Source: District Differently Abled Welfare Officer, Salem.
11.8. INSTITUTIONS FOR OTHER PROFESSIONAL EDUCATION, STUDENTS
AND TEACHERS 2015-16
Source: Concerned Institutions
Sl.
No
Name of the
Institution
Number of
Institutions
Students
Teachers
Boys Girls Total
1 2 3 4 5 6 7
1 Pvt. Polytechnic 19 13286 1859 15145 926
2 Govt. I.T.I 3 1210 399 1609 96
3 Pvt. I.T.I 9 392 99 491 72
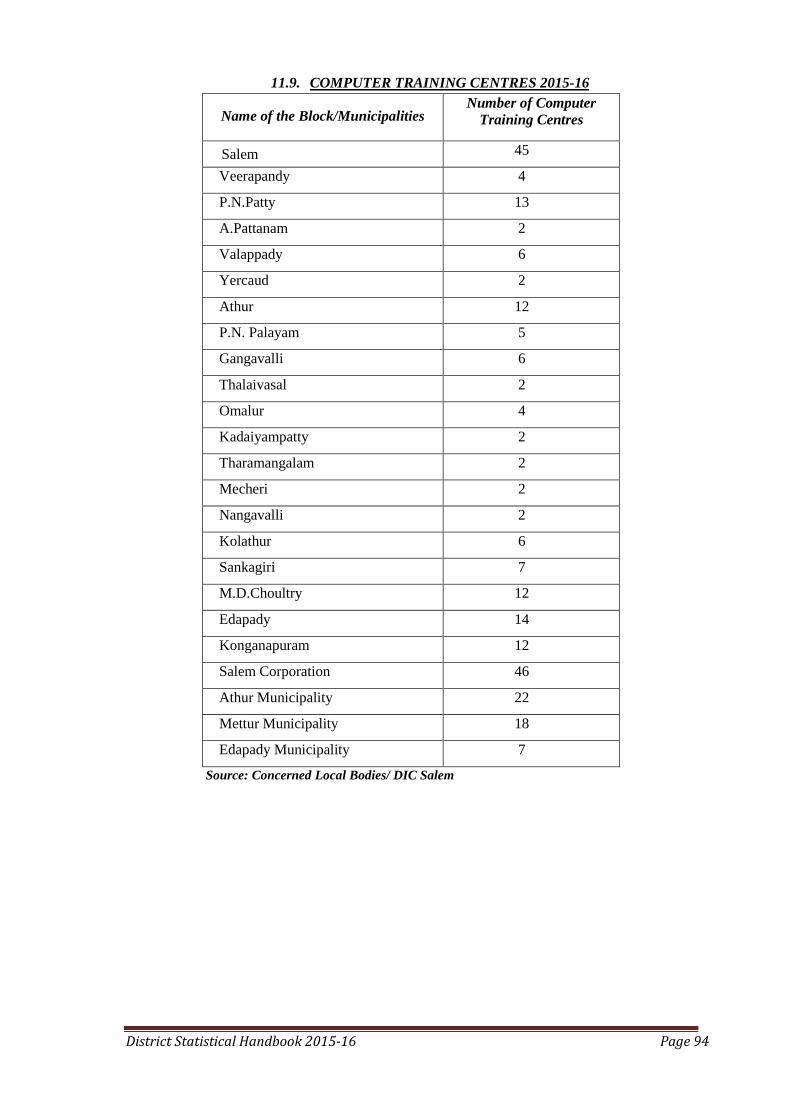
District Statistical Handbook 2015-16 Page 94
11.9. COMPUTER TRAINING CENTRES 2015-16
Name of the Block/Municipalities
Number of Computer
Training Centres
Salem 45
Veerapandy 4
P.N.Patty 13
A.Pattanam 2
Valappady 6
Yercaud 2
Athur 12
P.N. Palayam 5
Gangavalli 6
Thalaivasal 2
Omalur 4
Kadaiyampatty 2
Tharamangalam 2
Mecheri 2
Nangavalli 2
Kolathur 6
Sankagiri 7
M.D.Choultry 12
Edapady 14
Konganapuram 12
Salem Corporation 46
Athur Municipality 22
Mettur Municipality 18
Edapady Municipality 7
Source: Concerned Local Bodies/ DIC Salem

District Statistical Handbook 2015-16 Page 95
11.10. HOSTELS AND INMATES BY COMMUNITY
Number of Hostels Year:2015-16
Scheduled Caste Scheduled Tribe
Most Backward Class
and De-notified
Communities
Backward Class
B G. T. B. G. T. B. G. T. B. G. T
1. 2. 3. 4. 5. 6. 7. 8. 9. 10. 11. 12.
29 13 42 5 7 - - - - - - -
11.10 Contd…
Number of Inmates
Scheduled Caste Scheduled Tribe
Most Backward Class
and De-notified
Communities
Backward Class
B. G. T. B. G. T. B. G. T. B. G. T.
13. 14. 15. 16. 17. 18. 19. 20. 21. 22. 23. 24.
1570 813 2383 218 83 301 - - - - - -
11.11. SCHOLARSHIPS TO STUDENTS BY COMMUNITY
Year: 2015-16
Scheduled Caste/Scheduled Tribe, De-notified Communities/Most Backward Classes
Backward Classes
Number of Beneficiaries
Amount
(Rs. in „000‟)
SC/ST MBC/DC BC SC/ST MBC/DC BC
61997 - - 80405700 - -
Source: District Adi-Dravidar and Tribal Welfare, & District Backward Class and Minorities Welfare
Officer, Salem.

District Statistical Handbook 2015-16 Page 96
12. FISHERIES
12.1. FISHERIES DEVELOPMENT
Year: 2015-16
1. Area
a. Total Coastal Line of the District Nil
b. i. Total Inland Fresh Water spread Area 27,384.469.ha
ii. Estuaries and Brakish Water Area Nil
c. Marine Fishing Villages Nil
2. Fish Production Item Quantity
(Tonne)
Value (Rs.in
lakhs)
Inland 1713.614 10,28,16,840
3. Fisheries Development
a. Freezing Plants Nil
b. Ice plants, and walk in coolers Mettur 2
Ice plant
c. Sea food manufacturing Units in private
sector
Nil
d. Fisheries Training centre
Marine Nil
Inland Fish Culture, Fish Seed production
e. Fishing Vessels (Inland) 2000 Coracle
f. Active Marine Fishermen
4. Export of:
Item Quantity
(Tonne)
Value (Rs.in
lakhs)
Fish and Fish Products Nil Nil Nil
Source: Asst. Director of Fisheries, Mettur Dam, Salem
12.2. ESTIMATED MARINE FISH PRODUCTION / INLAND FISH PRODUCTION
Year: 2015-16
Sl.
Number
Block/Municipalities
Quantity
(Tonne)
Value
(Rs. In lakhs)
1 2 3 4
Salem District 1713.614 10,28,16,840
Source: Asst. Director of Fisheries, Mettur Dam, Salem

District Statistical Handbook 2015-16 Page 97
12.3. NUMBER OF FAMILIES ENGAGED IN FISHING
Year: 2015-16
Sl.Number Name of the Block Number of Fisherman
engaged 1 2 3
1 Salem 450
2 Veerapandy 130
3 Panamarathupatti 575
4 A.pattinam 190
5 Valappady 465
6 Yercaud 10
7 Attur 495
8 P.N.Palayam 585
9 Gangavalli 360
10 Thalaivasal 130
11 Omalur 75
12 Kadaiyampatty 210
13 Tharamangalam 20
14 Mecheri 730
15 Nangavalli 540
16 Kolathur 885
17 Sankagiri 40
18 Magudavanchavadi 20
19 Edappady 310
20 Konganapuram 155
Total 6375
Source: Asst. Director of Fisheries, Mettur Dam, Salem
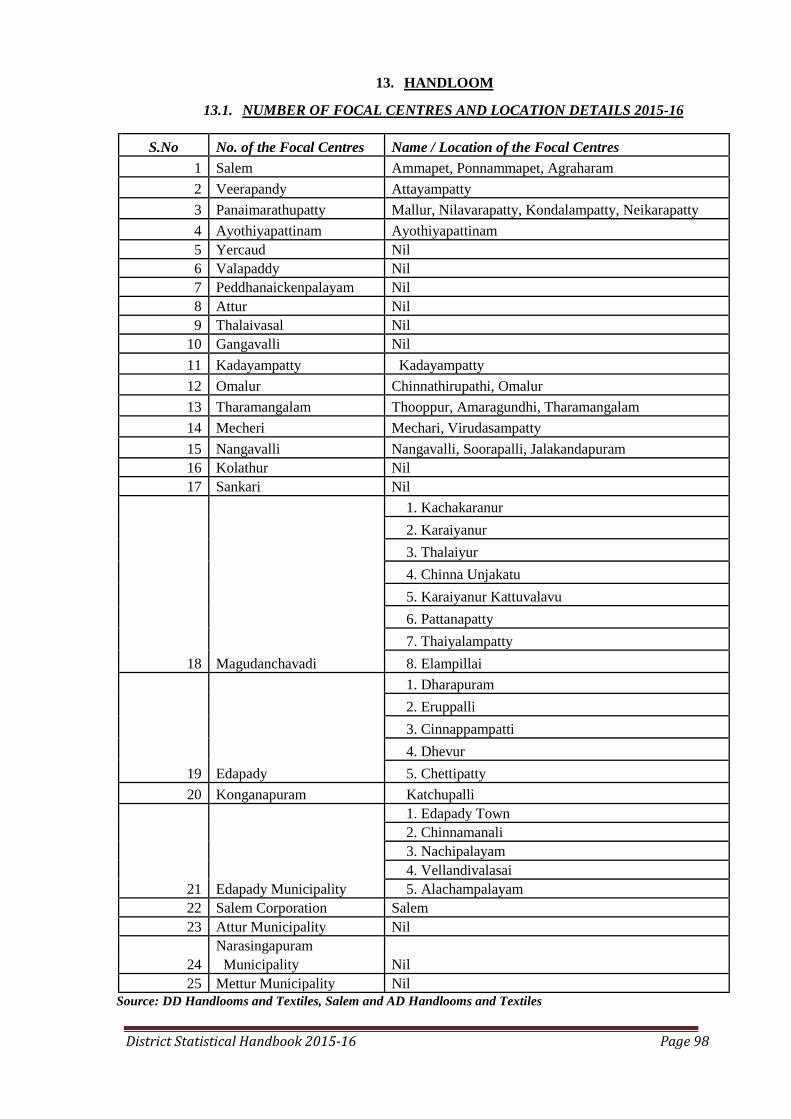
District Statistical Handbook 2015-16 Page 98
13. HANDLOOM
13.1. NUMBER OF FOCAL CENTRES AND LOCATION DETAILS 2015-16
S.No No. of the Focal Centres Name / Location of the Focal Centres
1 Salem Ammapet, Ponnammapet, Agraharam
2 Veerapandy Attayampatty
3 Panaimarathupatty Mallur, Nilavarapatty, Kondalampatty, Neikarapatty
4 Ayothiyapattinam Ayothiyapattinam
5 Yercaud Nil
6 Valapaddy Nil
7 Peddhanaickenpalayam Nil
8 Attur Nil
9 Thalaivasal Nil
10 Gangavalli Nil
11 Kadayampatty Kadayampatty
12 Omalur Chinnathirupathi, Omalur
13 Tharamangalam Thooppur, Amaragundhi, Tharamangalam
14 Mecheri Mechari, Virudasampatty
15 Nangavalli Nangavalli, Soorapalli, Jalakandapuram
16 Kolathur Nil
17 Sankari Nil
18 Magudanchavadi
1. Kachakaranur
2. Karaiyanur
3. Thalaiyur
4. Chinna Unjakatu
5. Karaiyanur Kattuvalavu
6. Pattanapatty
7. Thaiyalampatty
8. Elampillai
19 Edapady
1. Dharapuram
2. Eruppalli
3. Cinnappampatti
4. Dhevur
5. Chettipatty
20 Konganapuram Katchupalli
21 Edapady Municipality
1. Edapady Town
2. Chinnamanali
3. Nachipalayam
4. Vellandivalasai
5. Alachampalayam
22 Salem Corporation Salem
23 Attur Municipality Nil
24
Narasingapuram
Nil Municipality
25 Mettur Municipality Nil
Source: DD Handlooms and Textiles, Salem and AD Handlooms and Textiles

District Statistical Handbook 2015-16 Page 99
13.2. NUMBER OF SOCIETIES & VARIETYWISE PRODUCTION
Year: 2015-16
Source: D.D. Handloom & Textiles, Salem. & A.D. Handloom & Textiles, Tirchencode.
13.3. NUMBER OF POWERLOOMS & EMPLOYEES WORKING
Year: 2015-16
Handloom Division
Number of Power
looms
Number of Employees working
Salem 10 1450
Tiruchencode 9 1244
Total 19 26964
Source: D.D. Handloom & Textiles, Salem. & A.D. Handloom & Textiles, Tirchencode.
Sl.Nu
mber
Ha
ndlo
om
Div
isio
n
Nu
mb
er
of
Soci
etie
s
Cotton Silk Art silk
Mixture of
Art silk &
Cotton
Polyester
Len
gth
in
Met
ers
Va
lue
(Rs.
In
„0
00‟)
Len
gth
in
M
eter
s
Va
lue
(Rs.
In
`00
0‟
Len
gth
in
M
eter
s
Va
lue
(Rs.
In
„0
00‟)
Len
gth
in
M
eter
s
Va
lue
(Rs.
in “
00
0‟)
Len
gth
in
Met
ers
Va
lue
(Rs.
In
„0
00‟)
1 2 3 4 5 6 7 8 9 10 11 12 13
1
Sal
em
64
51
13
23
7
25
41
.42
64
48
56
25
78
.86
86
03
56
23
14
45
66
0
16
6.5
51
75
0
21
5.1
5
2
Tir
uch
enco
de
20
831727
85415515
12652
4326910
- - - - - -

District Statistical Handbook 2015-16 Page 100
13.4. NUMBER OF FAMILIES ENGAGED IN HANDLOOMS AND
POWERLOOMS
Year: 2015-16
Sl.
Number
Name of the Block/Municipalities Number of the families engaged in
Handlooms Power looms
1 2 3 4
1 Salem - -
2 Veerapandy 2878 303
3 P.N.Patty 1651 -
4 A.Pattanam 815 -
5 Valappady - -
6 Yercaud - -
7 Attur - -
8 P.N.Palayam - -
9 Ganvalli - -
10 Thalaivasal - -
11 Omalur 306 -
12 Kadaiyampatty 371 -
13 Tharamangalam 1012 -
14 Mecheri 1409 -
15 Nangavalli 229 -
16 Kolathur - -
17 Sankagiri - 34
18 M.D.Choultry 772 -
19 Edapady 343 -
20 Konganapuram 186 424
1 Salem Corporation 7820 281
2 Athur Municipality - -
3 Mettur Municipality -
4 Edapady Municipality 403 164
5 Narasingapuram Municipality - -
Source: D.D. Handloom & Textiles, Salem. And A.D. Handloom & Textiles, Thiruchencode.
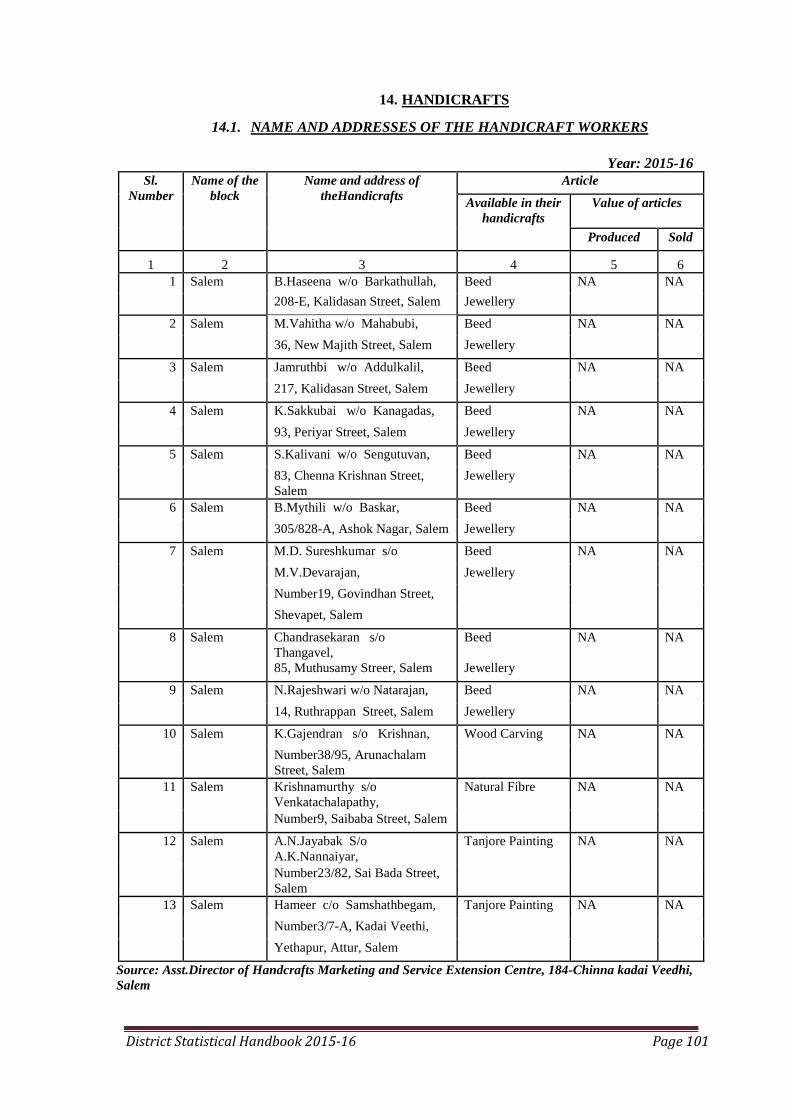
District Statistical Handbook 2015-16 Page 101
14. HANDICRAFTS
14.1. NAME AND ADDRESSES OF THE HANDICRAFT WORKERS
Year: 2015-16
Sl.
Number
Name of the
block
Name and address of
theHandicrafts
Article
Available in their
handicrafts
Value of articles
Produced Sold
1 2 3 4 5 6
1 Salem B.Haseena w/o Barkathullah, Beed NA NA
208-E, Kalidasan Street, Salem Jewellery
2 Salem M.Vahitha w/o Mahabubi, Beed NA NA
36, New Majith Street, Salem Jewellery
3 Salem Jamruthbi w/o Addulkalil, Beed NA NA
217, Kalidasan Street, Salem Jewellery
4 Salem K.Sakkubai w/o Kanagadas, Beed NA NA
93, Periyar Street, Salem Jewellery
5 Salem S.Kalivani w/o Sengutuvan, Beed NA NA
83, Chenna Krishnan Street,
Salem
Jewellery
6 Salem B.Mythili w/o Baskar, Beed NA NA
305/828-A, Ashok Nagar, Salem Jewellery
7 Salem M.D. Sureshkumar s/o Beed NA NA
M.V.Devarajan, Jewellery
Number19, Govindhan Street,
Shevapet, Salem
8 Salem Chandrasekaran s/o
Thangavel,
Beed NA NA
85, Muthusamy Streer, Salem Jewellery
9 Salem N.Rajeshwari w/o Natarajan, Beed NA NA
14, Ruthrappan Street, Salem Jewellery
10 Salem K.Gajendran s/o Krishnan, Wood Carving NA NA
Number38/95, Arunachalam
Street, Salem
11 Salem Krishnamurthy s/o
Venkatachalapathy,
Natural Fibre NA NA
Number9, Saibaba Street, Salem
12 Salem A.N.Jayabak S/o
A.K.Nannaiyar,
Tanjore Painting NA NA
Number23/82, Sai Bada Street,
Salem
13 Salem Hameer c/o Samshathbegam, Tanjore Painting NA NA
Number3/7-A, Kadai Veethi,
Yethapur, Attur, Salem
Source: Asst.Director of Handcrafts Marketing and Service Extension Centre, 184-Chinna kadai Veedhi,
Salem

District Statistical Handbook 2015-16 Page 102
14.2. ARTICLES AVAILABLE IN HANDICRAFTS
YEAR: 2015-16
Sl.No Works Articles Value (in Rs.)
1 Wood works Sandal woods, rose woods, white
wood, rose wood inlay 239790
2. Metal works
Bronze, Iron, Brass and amps, art
plates, sheet metal , block metal,
white metal
3215797
3. Fiber product Jute product, straw pictures, coir
product, misc. fiber. 1500
4. Textiles Appliqué thombai, temple umber
law 18770
5.
Jams and jeweler
Temple jewelers, Semi precious
stones and covering jewelers 120640
6. Painting Thanjour painting 185030
7. Stone carvings Granite stone , shop stone 108489
8. Thanjavur Garland Sandal beds mala 42740
9. Paper machine Danching Doll, Krishna, Laxmi,
Saraswathi Doll and etc. 9425
10. Clay and Plaster of praise Krishna, laxmi, saraswathi Dolls
etc. -
11. Pith temple ariticles
Thanjore temple, madurai temple,
sri rangam temple, trichy rock fort,
velankanni church, Taj mahal.
7820
12. Insane perfumers Bathi and pooja items sandal wood
oil and perfumes. 60000
Total 4010001
Source: Manager, Poompuhar Show Room, Salem-1
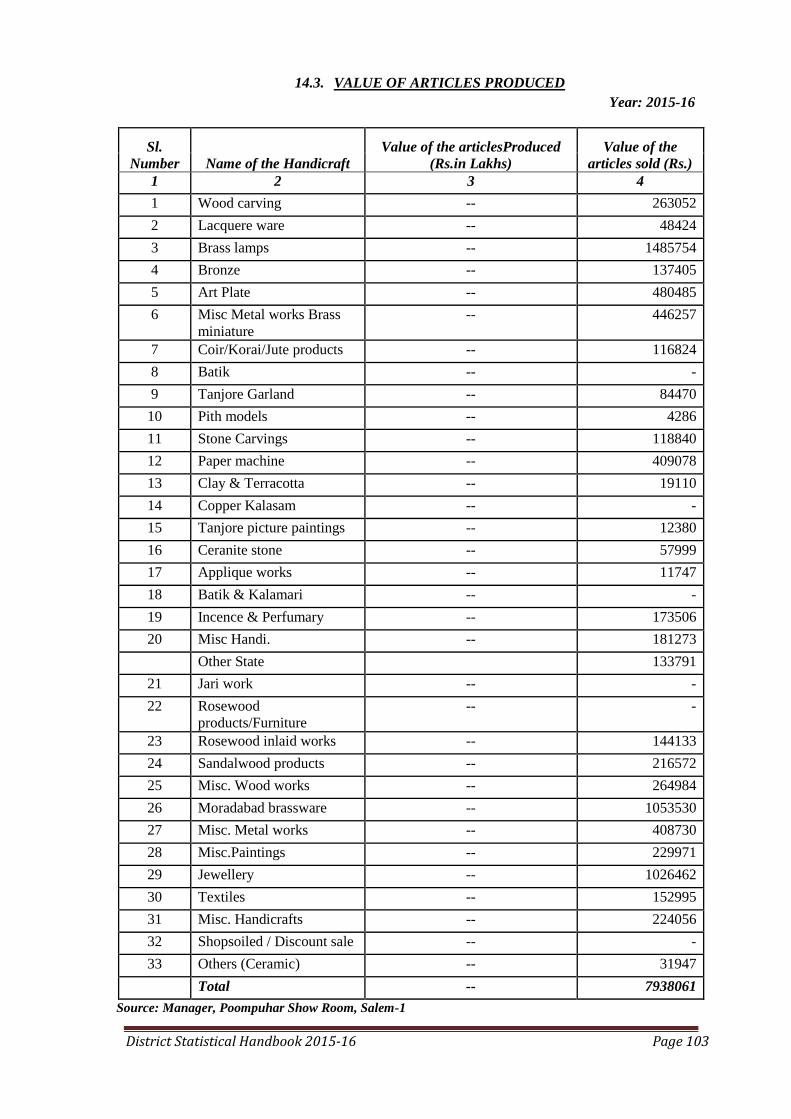
District Statistical Handbook 2015-16 Page 103
14.3. VALUE OF ARTICLES PRODUCED
Year: 2015-16
Sl.
Number Name of the Handicraft
Value of the articlesProduced
(Rs.in Lakhs)
Value of the
articles sold (Rs.)
1 2 3 4
1 Wood carving -- 263052
2 Lacquere ware -- 48424
3 Brass lamps -- 1485754
4 Bronze -- 137405
5 Art Plate -- 480485
6 Misc Metal works Brass
miniature
-- 446257
7 Coir/Korai/Jute products -- 116824
8 Batik -- -
9 Tanjore Garland -- 84470
10 Pith models -- 4286
11 Stone Carvings -- 118840
12 Paper machine -- 409078
13 Clay & Terracotta -- 19110
14 Copper Kalasam -- -
15 Tanjore picture paintings -- 12380
16 Ceranite stone -- 57999
17 Applique works -- 11747
18 Batik & Kalamari -- -
19 Incence & Perfumary -- 173506
20 Misc Handi. -- 181273
Other State 133791
21 Jari work -- -
22 Rosewood
products/Furniture
-- -
23 Rosewood inlaid works -- 144133
24 Sandalwood products -- 216572
25 Misc. Wood works -- 264984
26 Moradabad brassware -- 1053530
27 Misc. Metal works -- 408730
28 Misc.Paintings -- 229971
29 Jewellery -- 1026462
30 Textiles -- 152995
31 Misc. Handicrafts -- 224056
32 Shopsoiled / Discount sale -- -
33 Others (Ceramic) -- 31947
Total -- 7938061
Source: Manager, Poompuhar Show Room, Salem-1
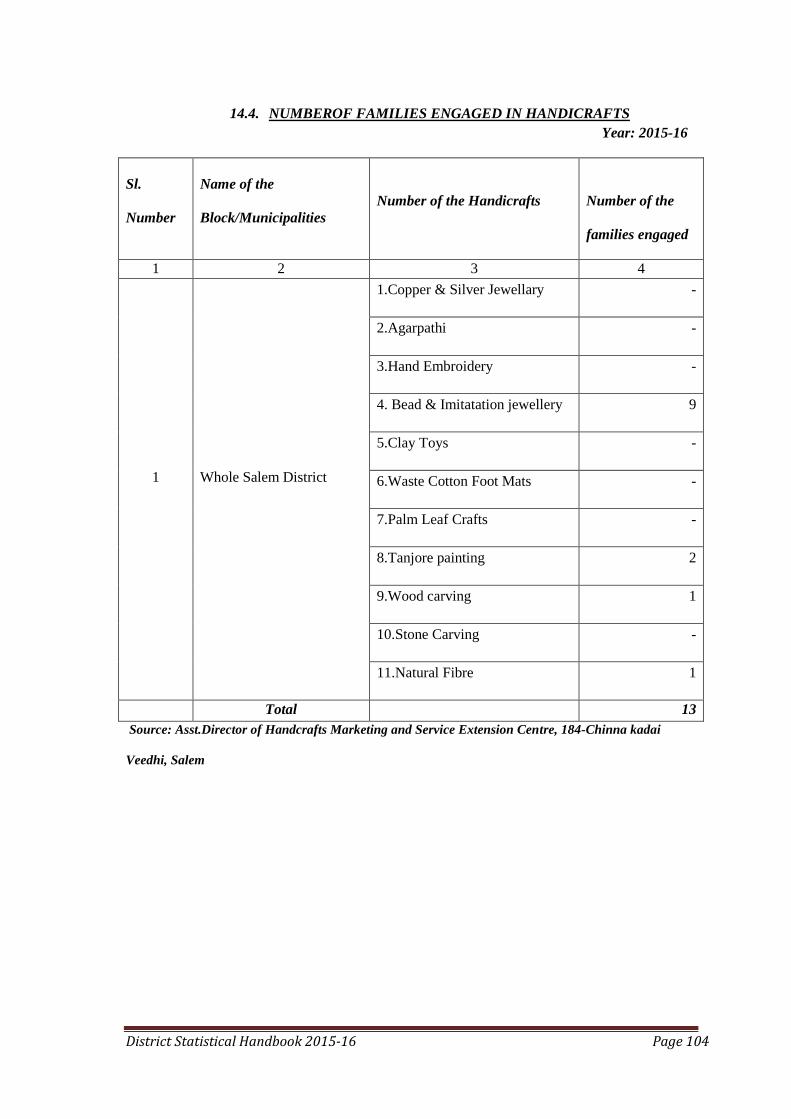
District Statistical Handbook 2015-16 Page 104
14.4. NUMBEROF FAMILIES ENGAGED IN HANDICRAFTS
Year: 2015-16
Sl.
Number
Name of the
Block/Municipalities
Number of the Handicrafts
Number of the
families engaged
1 2 3 4
1 Whole Salem District
1.Copper & Silver Jewellary -
2.Agarpathi -
3.Hand Embroidery -
4. Bead & Imitatation jewellery 9
5.Clay Toys -
6.Waste Cotton Foot Mats -
7.Palm Leaf Crafts -
8.Tanjore painting 2
9.Wood carving 1
10.Stone Carving -
11.Natural Fibre 1
Total 13
Source: Asst.Director of Handcrafts Marketing and Service Extension Centre, 184-Chinna kadai
Veedhi, Salem

District Statistical Handbook 2015-16 Page 105
15. HEALTH & FAMILY WELFARE
15.1. HOSPITALS, DISPENSARIES, BED STRENGTH, DOCTORS AND NURSES
Year: 2015-16
Classification
Mo
dern
Med
icin
e
Indian Medicine
Hom
oeo
pa
thy
Gra
nd
To
tal
Ayu
rved
ic
Sid
dh
a
Un
an
i
Ayu
rved
ic S
idd
ha
Un
an
i co
mb
ined
To
tal
1 2 3 4 5 6 7 8 9
Hospitals 11 0 11 0 0 11 3 25
Dispensaries 1 0 6 0 0 6 0 7
Primary Health
Centres 85 0 23 0 0 23 0 108
Urban Health
Centre 20 0 0 0 0 0 0 20
Health Sub Centres 398 0 0 0 0 0 0 398
Other Medical
Instit
utions(MMU)
21 0 0 0 0 0 0 21
Bed Strength 2635 0 0 0 0 0 0 2635
Number of Doctors 474 0 40 0 0 0 0 514
Number of Nurses 729 0 15 0 0 0 0 744
Source: Joint Director of Medical and Rural Health Services and Famil Welfare, Salem, District Siddha
Medical Officer, Salem-1 & DD Health Services, Salem & Medical Officer, Salem Corporation
15.2. NUMBEROF ALLIED PATHOLOGICAL UNITS AVAILABLE
Year: 2015-16
Sl.Number Name of the Block/Municipality Number of Pathological Units
1 2 3
1 Govt. Mohan Kumaramangalam
Medical College Hospital, Salem
Corporation
1
Source: Dean, Govt Mohan Kumaramangalam Medical College Hospital, Salem
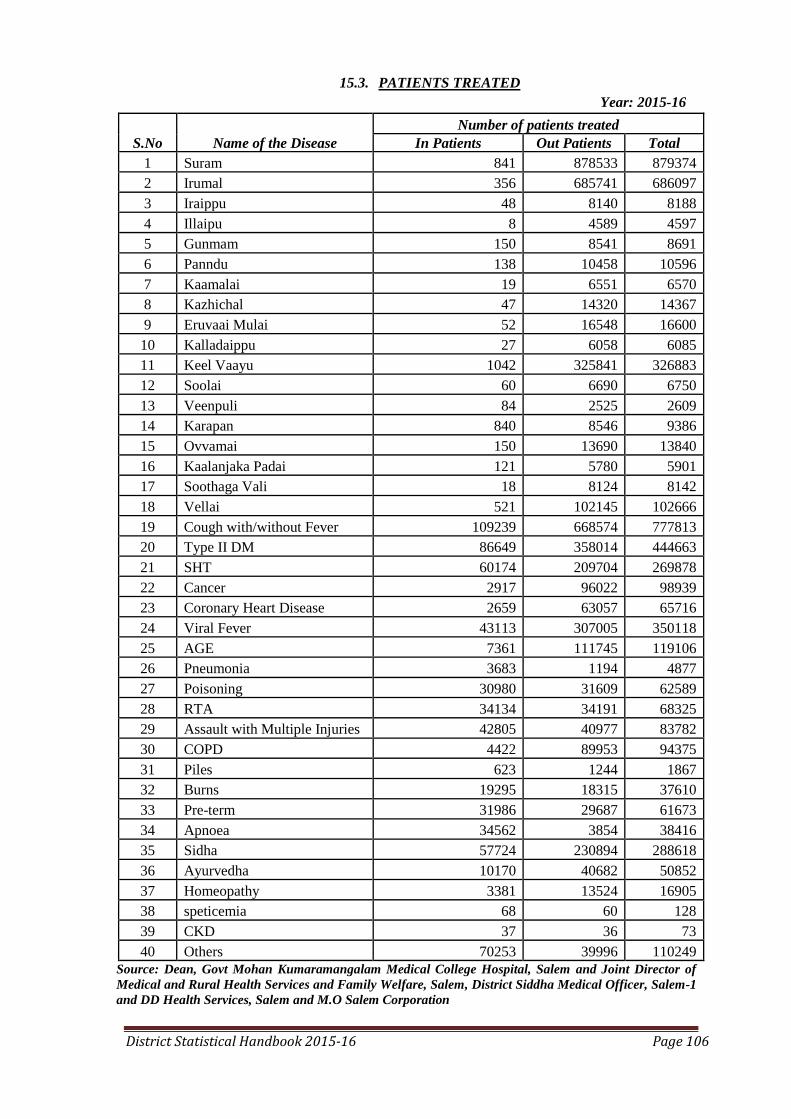
District Statistical Handbook 2015-16 Page 106
15.3. PATIENTS TREATED
Year: 2015-16
S.No Name of the Disease
Number of patients treated
In Patients Out Patients Total
1 Suram 841 878533 879374
2 Irumal 356 685741 686097
3 Iraippu 48 8140 8188
4 Illaipu 8 4589 4597
5 Gunmam 150 8541 8691
6 Panndu 138 10458 10596
7 Kaamalai 19 6551 6570
8 Kazhichal 47 14320 14367
9 Eruvaai Mulai 52 16548 16600
10 Kalladaippu 27 6058 6085
11 Keel Vaayu 1042 325841 326883
12 Soolai 60 6690 6750
13 Veenpuli 84 2525 2609
14 Karapan 840 8546 9386
15 Ovvamai 150 13690 13840
16 Kaalanjaka Padai 121 5780 5901
17 Soothaga Vali 18 8124 8142
18 Vellai 521 102145 102666
19 Cough with/without Fever 109239 668574 777813
20 Type II DM 86649 358014 444663
21 SHT 60174 209704 269878
22 Cancer 2917 96022 98939
23 Coronary Heart Disease 2659 63057 65716
24 Viral Fever 43113 307005 350118
25 AGE 7361 111745 119106
26 Pneumonia 3683 1194 4877
27 Poisoning 30980 31609 62589
28 RTA 34134 34191 68325
29 Assault with Multiple Injuries 42805 40977 83782
30 COPD 4422 89953 94375
31 Piles 623 1244 1867
32 Burns 19295 18315 37610
33 Pre-term 31986 29687 61673
34 Apnoea 34562 3854 38416
35 Sidha 57724 230894 288618
36 Ayurvedha 10170 40682 50852
37 Homeopathy 3381 13524 16905
38 speticemia 68 60 128
39 CKD 37 36 73
40 Others 70253 39996 110249
Source: Dean, Govt Mohan Kumaramangalam Medical College Hospital, Salem and Joint Director of
Medical and Rural Health Services and Family Welfare, Salem, District Siddha Medical Officer, Salem-1
and DD Health Services, Salem and M.O Salem Corporation

District Statistical Handbook 2015-16 Page 107
15.4. DISTRIBUTION OF MEDICAL PERSONNEL
Year: 2015-16
Number of
Doctors
Number of
Nurses
Number of Technical
persons
Others
{specify}
Total
1 2 3 4 5
120 250 189 350 1797
Source: Dean, Govt Mohan Kumaramangalam Medical College Hospital, Salem and District Siddha
Medical Officer, salem-1 and DD Health Services and Family Welfare, Salem
15.5. PROGRESS OF FAMILY WELFARE PROGRAMMES
Year: 2015-16
Sl.Number
Name of the
District
Sterilisation IUD
Users of
conventional
contraceptives
Users of oral
pills
Targ
et
Ach
ie v
emen
t
Targ
et
Ach
ie v
emen
t
Targ
et
Ach
ie v
emen
t
Targ
et
Ach
ie v
emen
t
1 2 3 4 5 6 7 8 9 10
1
Salem
District
16500 12135 15000 13142 8800 2805 4600 1728
Source: Deputy Director of Medical, Rural Health Services and Family Welfare, Salem

District Statistical Handbook 2015-16 Page 108
16. HOUSING
16.1. PLAN SANCTIONED, BUILDING COMPLETED UNDER PRIVATE
SECTOR
Year: 2015-16
Sl.
Number
Name of the Town
Panchayat/Municipalities/
Corporations
Room Unit Size
Private
Sector
1 2 3 4 5 6 7
1 Corporation - - - - 955
2 Municipalities - - - - 192
3 Town Panchayats - - - - NA
4 Third Grade Municipality - - - - 99
Source: Concerned Local Bodies
16.2. PLANS SANCTIONED, BUILDING COMPLETED UNDER PUBLIC SECTOR
Year: 2015-16
Sl.
Number
Name of the
Panchayat Union
Room Unit size Public Sector
1 2 3 4
1 20 Panchayat Unions N.A 1133+199
16.3. AMOUNT INVESTED IN HOUSING AND BUILDING ACTIVITY UNDER
PUBLIC SECTOR
Year: 2015-16
Residential
Rs. in „000‟
Percentage to
total
Non-Residential
Rs. in „000‟
Percentage to
total
Total
Rs. in „000‟
1 2 3 4 5
941831 91.72 84912 8.28 1026743
Source: Department of Economics & Statistics

District Statistical Handbook 2015-16 Page 109
16.4. CONSTRUCTION ACTIVITY OF TAMIL NADU HOUSING BOARD
Year: 2015-16
Sl. No Name of the Scheme Number
1 2 3
1 Low Income Group Housing Schemes Flats -
2 Middle Income Group Housing Schemes -
3 Slum Improvements/Clearance Tenements -
4 Tamil Nadu Government Rental Housing -
5 Subsidized Industrial Housing Tenements -
6 Fire Proof Tenements -
7 Special Low Cost Housing Scheme -
8 Police -
9 Specify any other H.I.G. (Kandampatti East SF
Scheme HIG)
-
Source: Deputy Registrar, Salem Region, Salem.
16.5. CONSTRUCTION ACTIVITY OF TAMIL NADU SLUM CLEARANCE BOARD
Year: 2015-16
Name of
the Block
Item Achievement
1 2 3
1. Number of Tenements sanctioned for
construction
292
2. Number of Tenements constructed Work is in Progress
3. Amount sanctioned (Rs.in lakhs) 2494.47
4. Amount spent (Rs.in lakhs) 146.1
5. Number of tenements occupied Nil
6. Rent received (Rs.in lakhs) Nil
Source: Executive Engineer, Tamil Nadu Slum Clearance Board, Salem Division.

District Statistical Handbook 2015-16 Page 110
16.6. INDEX NUMBERS OF BUILDING CONSTRUCTION COST IN URBAN
CENTRES (1999-2000=100)
Year: 2015-16
S.
No
District Urban
Centres
Building
Index
Building
materials
Construction
cost for
building
Labour
Other
Charges
Combined
Index
1 2 3 4 5 6
1
Salem 253.92 460.17 305.38 318.08
Source: Department of Economics & Statistics
16.7. LABOUR CHARGES OF CONSTRUCTION WORKERS - INDEX
Year: 2015-16
Charges of Male Construction
Workers
Charges of Female Construction
Workers
Combined
1 2 3
461.54 384.62 413.81
Source: Directorate of Economics & Statistics

District Statistical Handbook 2015-16 Page 111
17. INDUSTRIES
17.1. RESULTS OF ANNUAL SURVEY OF INDUSTRIES (Factory Sector)
Year: 2015-16
Characteristics Units Results for all Industries
1 2 3
Salem District To be finalised Taken as CENSUS
Source: Department of Economics & Statistics
17.2. ESTIMATES OF OUTPUT AND VALUE ADDED BY MANUFACTURE
BASED ON ANNUAL SURVEY OF INDUSTRIES
Year: 2015-16
Industry
Group Description of theIndustry
AlL
Employees
Value of
output Rs. In
lakhs
Value
added
1 2 3 4 5
17 Mfg. of textiles 6878 91176.90 N.A
15 Mfg. of food products 2179 27967.75 N.A
22 Publishing, printing 230 2299.05 N.A
19 Leather Chapels - - N.A
14 Mineral crushing such as feldspar, calcite,
Dolomite Calcite - -
N.A
20 Mfg. of wood products 456 6435.60 N.A
24 Mfg. of chemical products 179 11896.30 N.A
23 Mfg. of coke, refined petroleum products - N.A
25 Mfg. of Rubber & Plastic products 744 7092.03 N.A
21 Mfg. of paper products 98 1001.16 N.A
26 Mfg. of other Non-Metallic mineral products 744 7092.03 N.A
17 Calendaring & Zero finishing of cloth - - N.A
33 Mfg. of Medical, Optical instruments 40 965.25 N.A
34 Mfg. of Motor Vehicles 111 1691.80 N.A
35 Mfg. of other transport equipments 201 2584.75 N.A
30 Mfg. of computing machinery 28 82.77 N.A
31 Mfg. of Electrical machinery 413 11107.65 N.A
27 Mfg. of Basic metals 353 5595.00 N.A
29 Mfg. of Machinery & Equipment NEC 1171 21505.75 N.A
32 Mfg. of Radio, Television Equipments 48 231.00 N.A
28 Mfg. of fabrication metal products 985 21460.95 N.A
36 Mfg. of furniture 1480 32788.80 N.A
37 Mfg. of Recycling 58 796.00 N.A
41 Collection, Purification of water 185 1213.40 N.A
18 Readymade Garments 2661 37184.99 N.A
Source: General Manager, District Industries centre Salem.
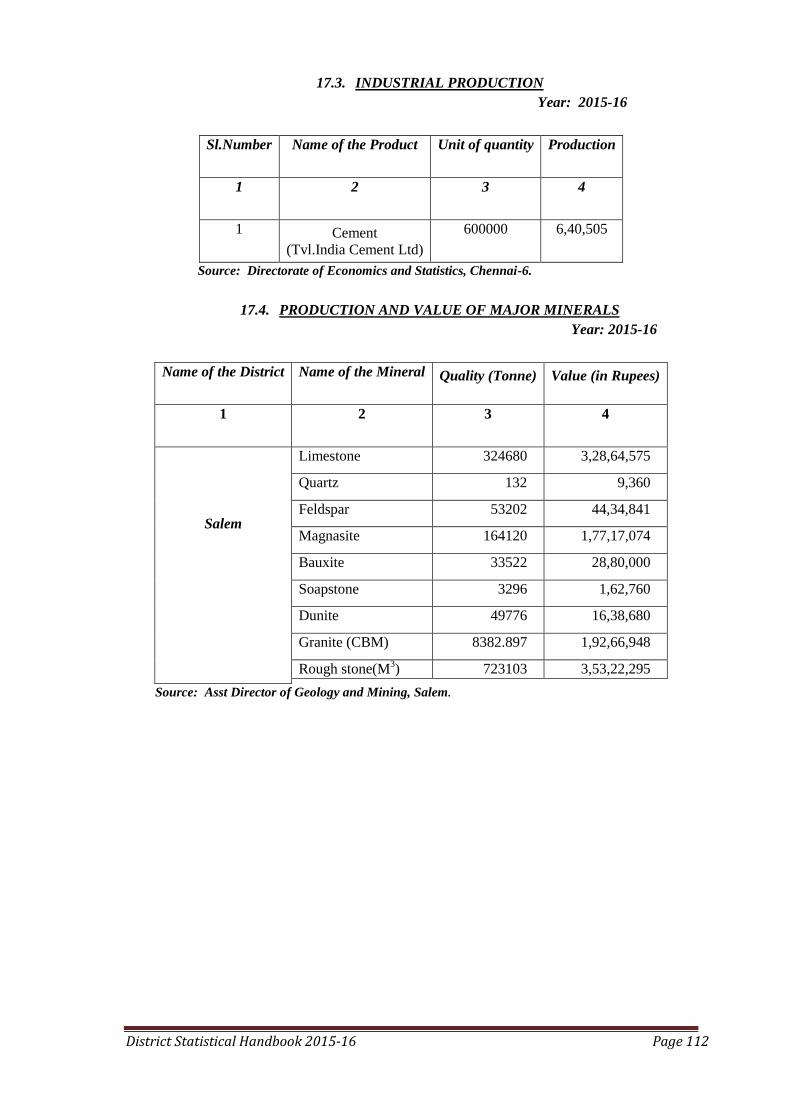
District Statistical Handbook 2015-16 Page 112
17.3. INDUSTRIAL PRODUCTION
Year: 2015-16
Sl.Number Name of the Product Unit of quantity Production
1 2 3 4
1 Cement
(Tvl.India Cement Ltd)
600000 6,40,505
Source: Directorate of Economics and Statistics, Chennai-6.
17.4. PRODUCTION AND VALUE OF MAJOR MINERALS
Year: 2015-16
Name of the District Name of the Mineral Quality (Tonne) Value (in Rupees)
1 2 3 4
Salem
Limestone 324680 3,28,64,575
Quartz 132 9,360
Feldspar 53202 44,34,841
Magnasite 164120 1,77,17,074
Bauxite 33522 28,80,000
Soapstone 3296 1,62,760
Dunite 49776 16,38,680
Granite (CBM) 8382.897 1,92,66,948
Rough stone(M3)
723103 3,53,22,295
Source: Asst Director of Geology and Mining, Salem.

District Statistical Handbook 2015-16 Page 113
17.5. PRODUCTION OF HANDLOOM CLOTH
Year: 2015-16
Sl.
Number
Variety of Cloth Production (In lakh metres)
Salem Div. Tiruchengode Div. Total
1. Silk Dhothy 1717.70 1717.70
2. Silk Saree 2314.00 0.12 2314.12
3. Spun Sarees 0.00 0.00
4. Angavastram 143.61 143.61
5. Shirting 711.57 711.57
6. Export 0.00 0 0.00
7. Cotton Dhothy 233.06 233.06
8. Cotton Saree 406.78 1.53 408.31
9. Lungi 0.00 0.00
10. Bedsheet 124.07 0.19 124.26
11 Carpet 48.48 3.17 51.65
12 Towel 153.34 2.25 155.59
13 Shirting 86.54 86.54
14 Export 0.00 0.00
15 Drill 197.30 0.25 197.55
16 Casement 197.30 0.15 197.45
17 FDS Dhoti 197.30 197.30
18 Uniform 69.36 69.36
19
Other
Others 0.00 0.00
20 Mosquito net 104.65 104.65
Total 6705.06 7.66 6712.72
Source: D.D. Handloom and Textiles, Salem.and AD Handlooms. Thiruchencode
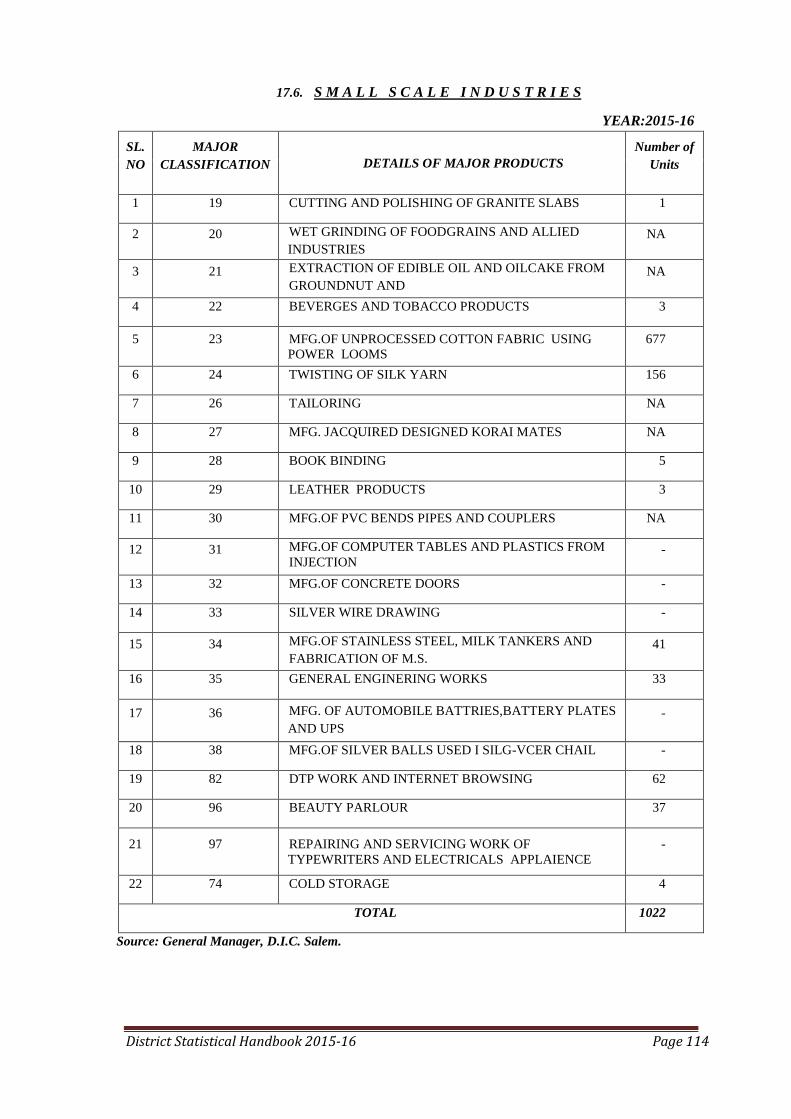
District Statistical Handbook 2015-16 Page 114
17.6. S M A L L S C A L E I N D U S T R I E S
YEAR:2015-16
SL.
NO
MAJOR
CLASSIFICATION DETAILS OF MAJOR PRODUCTS
Number of
Units
1 19 CUTTING AND POLISHING OF GRANITE SLABS 1
2 20 WET GRINDING OF FOODGRAINS AND ALLIED
INDUSTRIES
NA
3 21 EXTRACTION OF EDIBLE OIL AND OILCAKE FROM
GROUNDNUT AND
MFG.OF TAPIOCA STARCH
NA
4 22 BEVERGES AND TOBACCO PRODUCTS 3
5 23 MFG.OF UNPROCESSED COTTON FABRIC USING
POWER LOOMS
677
6 24 TWISTING OF SILK YARN 156
7 26 TAILORING NA
8 27 MFG. JACQUIRED DESIGNED KORAI MATES NA
9 28 BOOK BINDING 5
10 29 LEATHER PRODUCTS 3
11 30 MFG.OF PVC BENDS PIPES AND COUPLERS NA
12 31 MFG.OF COMPUTER TABLES AND PLASTICS FROM
INJECTION
MOULDING
-
13 32 MFG.OF CONCRETE DOORS -
14 33 SILVER WIRE DRAWING -
15 34 MFG.OF STAINLESS STEEL, MILK TANKERS AND
FABRICATION OF M.S.
GATES AND GRILS
41
16 35 GENERAL ENGINERING WORKS 33
17 36 MFG. OF AUTOMOBILE BATTRIES,BATTERY PLATES
AND UPS
-
18 38 MFG.OF SILVER BALLS USED I SILG-VCER CHAIL -
19 82 DTP WORK AND INTERNET BROWSING 62
20 96 BEAUTY PARLOUR 37
21 97 REPAIRING AND SERVICING WORK OF
TYPEWRITERS AND ELECTRICALS APPLAIENCE
-
22 74 COLD STORAGE 4
TOTAL 1022
Source: General Manager, D.I.C. Salem.
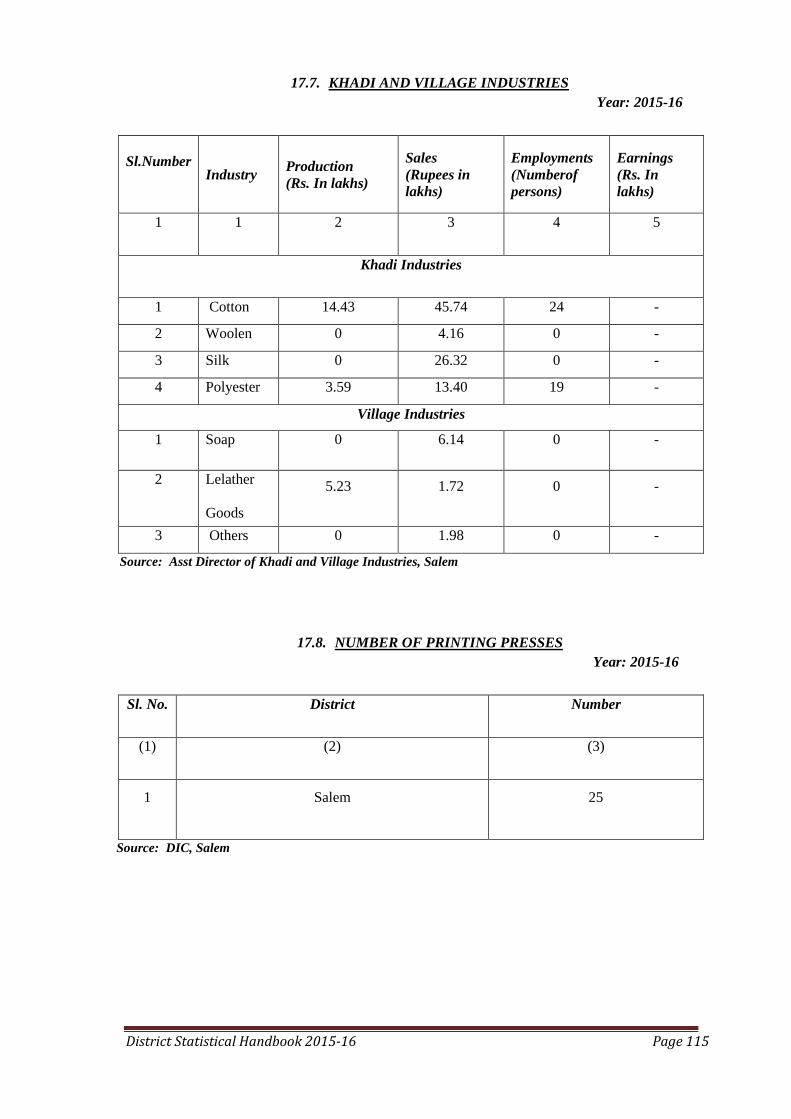
District Statistical Handbook 2015-16 Page 115
17.7. KHADI AND VILLAGE INDUSTRIES
Year: 2015-16
Sl.Number
Industry
Production
(Rs. In lakhs)
Sales
(Rupees in
lakhs)
Employments
(Numberof
persons)
Earnings
(Rs. In
lakhs)
1 1 2 3 4 5
Khadi Industries
1 Cotton 14.43 45.74 24
-
-
2 Woolen 0 4.16 0 -
3 Silk 0 26.32 0 -
4 Polyester 3.59 13.40 19 -
Village Industries
1 Soap 0 6.14 0 -
2 Lelather
Goods
5.23 1.72 0 -
3 Others 0 1.98 0 -
Source: Asst Director of Khadi and Village Industries, Salem
17.8. NUMBER OF PRINTING PRESSES
Year: 2015-16
Sl. No. District Number
(1) (2) (3)
1 Salem 25
Source: DIC, Salem

District Statistical Handbook 2015-16 Page 116
17.9. NUMBER OF PHOTOCOPY (XEROX) CENTRES
Year 2015-16
Sl. Number
Name of the Block / Municipality
Number of Xerox Centres
1 2 3
1 Salem 265
2 Veerapandi 32
3 P.N.Patty 59
4 A.Pattinam 50
5 Valapadi 16
6 Yercaud 15
7 Attur 62
8 P.N.Palayam 25
9 Gangavalli
12
10 Thalaivasal 22
11 Omalur 24
12 Kadayampatty 15
13 Tharamangalam 12
14 Mecheri 13
15 Nangavalli 18
16 Kolathur/Mettur 45
17 Sankagiri 22
18 Mac Donald 14
19 Idapaddy 23
20 Konganapuram 9
Source: DIC, Salem and concernd local bodies

District Statistical Handbook 2015-16 Page 117
18. FACTORIES
18.1. REGISTERED AND WORKING FACTORIES
Year: 2015-16
Sl.
Number
Item Numbers
1 2 3
1.
Factories on the Registered at the beginning of the year
(01.04.2015) 886
2. Factories added during the year (01.04.2015-31.03.2016) 22
3. Factories removed during the year(01.04.2015 to 31.03.2016) 23
4. Factories on the register at the end of the year 885
5. Number of Man days Worked (in Lakhs) 6164000
6 Number of Working Factories 580
Source: Deputy Chief Inspector of Factories, Salem.
18.2. EMPLOYMENT IN WORKING FACTORIES
Year: 2015-16
S.
Number
Item Numbers
1 2 3
1 All factories (Approximate/Actual Employment) 26800
Source: Deputy Chief Inspector of Factories, Salem.

District Statistical Handbook 2015-16 Page 118
18.3. UNIONS: INDUSTRIAL DISPUTES BY STRIKES AND LOCKOUTS
GHERAOS
Year: 2015-16
Sl.Number
Items
Numbers
1 2 3
1.
2.
3.
4.
Number of Registered Trade Unions
Strike:
a. Number of Strikes
b. Number of Workers Involved
c. Number of Mandays Lost
Lockouts:
a. Number of Lockouts
b. Number of workers involved
c. Number of Mandays Lost
Gheraos:
a. Number
b. Workers involved
c. Mandays Lost
11
0
0
1
311
0
0
0
Source: Deputy Commissioner of Labour, 4th
Floor, Collectorate, Salem
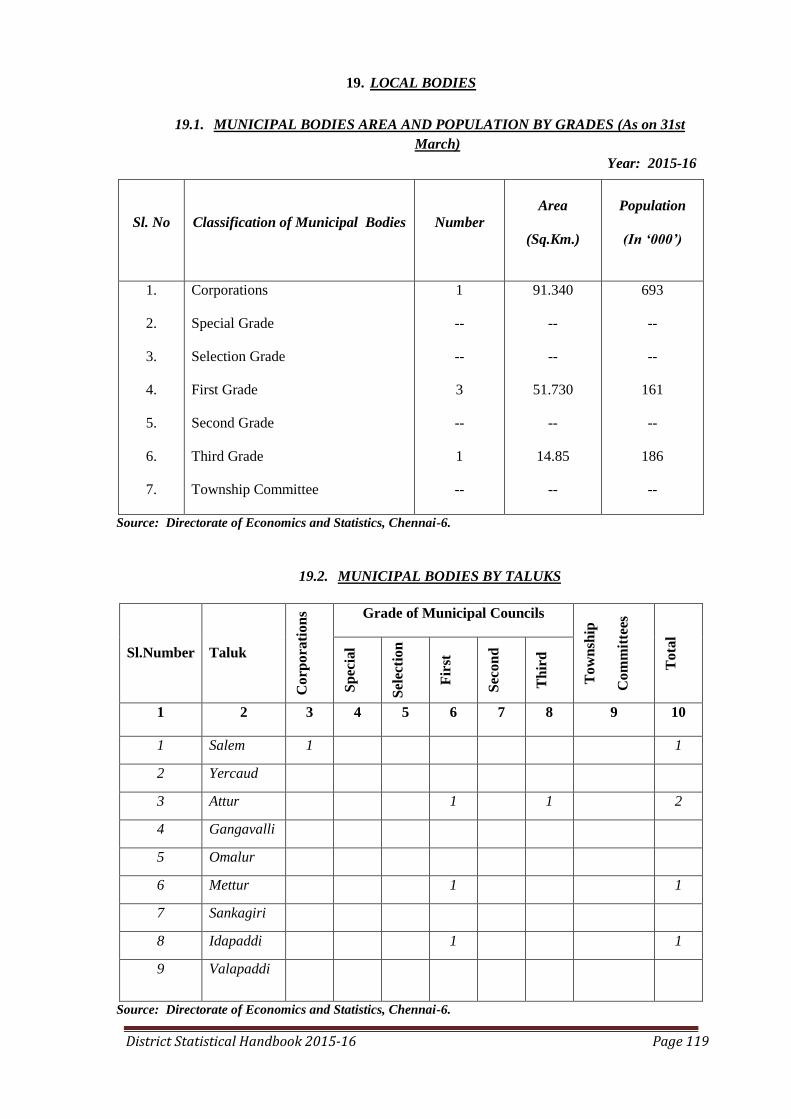
District Statistical Handbook 2015-16 Page 119
19. LOCAL BODIES
19.1. MUNICIPAL BODIES AREA AND POPULATION BY GRADES (As on 31st
March)
Year: 2015-16
Sl. No
Classification of Municipal Bodies
Number
Area
(Sq.Km.)
Population
(In „000‟)
1.
2.
3.
4.
5.
6.
7.
Corporations
Special Grade
Selection Grade
First Grade
Second Grade
Third Grade
Township Committee
1
--
--
3
--
1
--
91.340
--
--
51.730
--
14.85
--
693
--
--
161
--
186
--
Source: Directorate of Economics and Statistics, Chennai-6.
19.2. MUNICIPAL BODIES BY TALUKS
Sl.Number Taluk
Corp
ora
tion
s Grade of Municipal Councils
Tow
nsh
ip
Com
mit
tees
Tota
l
Sp
ecia
l
Sel
ecti
on
Fir
st
Sec
on
d
Th
ird
1 2 3 4 5 6 7 8 9 10
1 Salem 1 1
2 Yercaud
3 Attur 1 1 2
4 Gangavalli
5 Omalur
6 Mettur 1 1
7 Sankagiri
8 Idapaddi 1 1
9 Valapaddi
Source: Directorate of Economics and Statistics, Chennai-6.
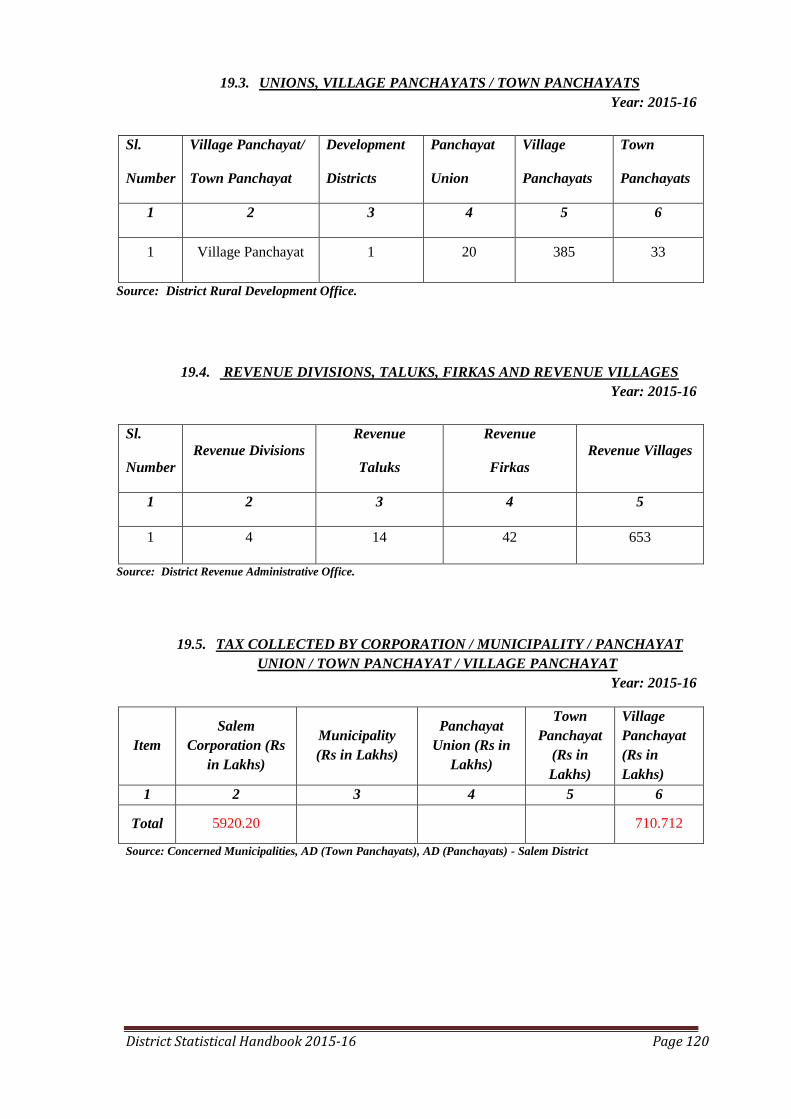
District Statistical Handbook 2015-16 Page 120
19.3. UNIONS, VILLAGE PANCHAYATS / TOWN PANCHAYATS
Year: 2015-16
Sl.
Number
Village Panchayat/
Town Panchayat
Development
Districts
Panchayat
Union
Village
Panchayats
Town
Panchayats
1 2 3 4 5 6
1 Village Panchayat 1 20 385 33
Source: District Rural Development Office.
19.4. REVENUE DIVISIONS, TALUKS, FIRKAS AND REVENUE VILLAGES
Year: 2015-16
Sl.
Number
Revenue Divisions
Revenue
Taluks
Revenue
Firkas
Revenue Villages
1 2 3 4 5
1 4 14 42 653
Source: District Revenue Administrative Office.
19.5. TAX COLLECTED BY CORPORATION / MUNICIPALITY / PANCHAYAT
UNION / TOWN PANCHAYAT / VILLAGE PANCHAYAT
Year: 2015-16
Item
Salem
Corporation (Rs
in Lakhs)
Municipality
(Rs in Lakhs)
Panchayat
Union (Rs in
Lakhs)
Town
Panchayat
(Rs in
Lakhs)
Village
Panchayat
(Rs in
Lakhs)
1 2 3 4 5 6
Total 5920.20 710.712
Source: Concerned Municipalities, AD (Town Panchayats), AD (Panchayats) - Salem District
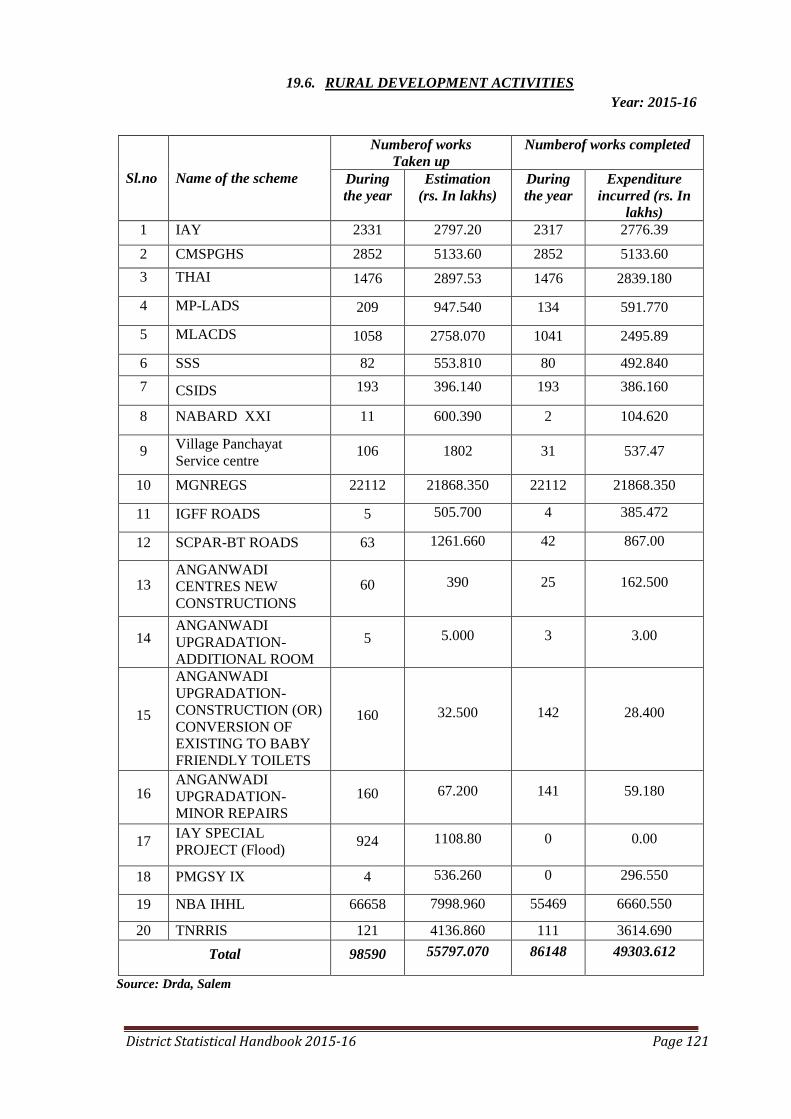
District Statistical Handbook 2015-16 Page 121
19.6. RURAL DEVELOPMENT ACTIVITIES
Year: 2015-16
Sl.no
Name of the scheme
Numberof works
Taken up
Numberof works completed
During
the year
Estimation
(rs. In lakhs)
During
the year
Expenditure
incurred (rs. In
lakhs)
1 IAY 2331 2797.20 2317 2776.39
2 CMSPGHS 2852 5133.60 2852 5133.60
3 THAI 1476 2897.53 1476 2839.180
4 MP-LADS 209 947.540 134 591.770
5 MLACDS 1058 2758.070 1041 2495.89
6 SSS 82 553.810 80 492.840
7 CSIDS 193 396.140 193 386.160
8 NABARD XXI 11 600.390 2 104.620
9 Village Panchayat
Service centre 106 1802 31 537.47
10 MGNREGS 22112 21868.350 22112 21868.350
11 IGFF ROADS 5 505.700 4 385.472
12 SCPAR-BT ROADS 63 1261.660 42 867.00
13 ANGANWADI
CENTRES NEW
CONSTRUCTIONS
60 390 25 162.500
14 ANGANWADI
UPGRADATION-
ADDITIONAL ROOM
5 5.000 3 3.00
15
ANGANWADI
UPGRADATION-
CONSTRUCTION (OR)
CONVERSION OF
EXISTING TO BABY
FRIENDLY TOILETS
160 32.500 142 28.400
16 ANGANWADI
UPGRADATION-
MINOR REPAIRS
160 67.200 141 59.180
17 IAY SPECIAL
PROJECT (Flood) 924 1108.80 0 0.00
18 PMGSY IX 4 536.260 0 296.550
19 NBA IHHL 66658 7998.960 55469 6660.550
20 TNRRIS 121 4136.860 111 3614.690
Total 98590 55797.070 86148 49303.612
Source: Drda, Salem
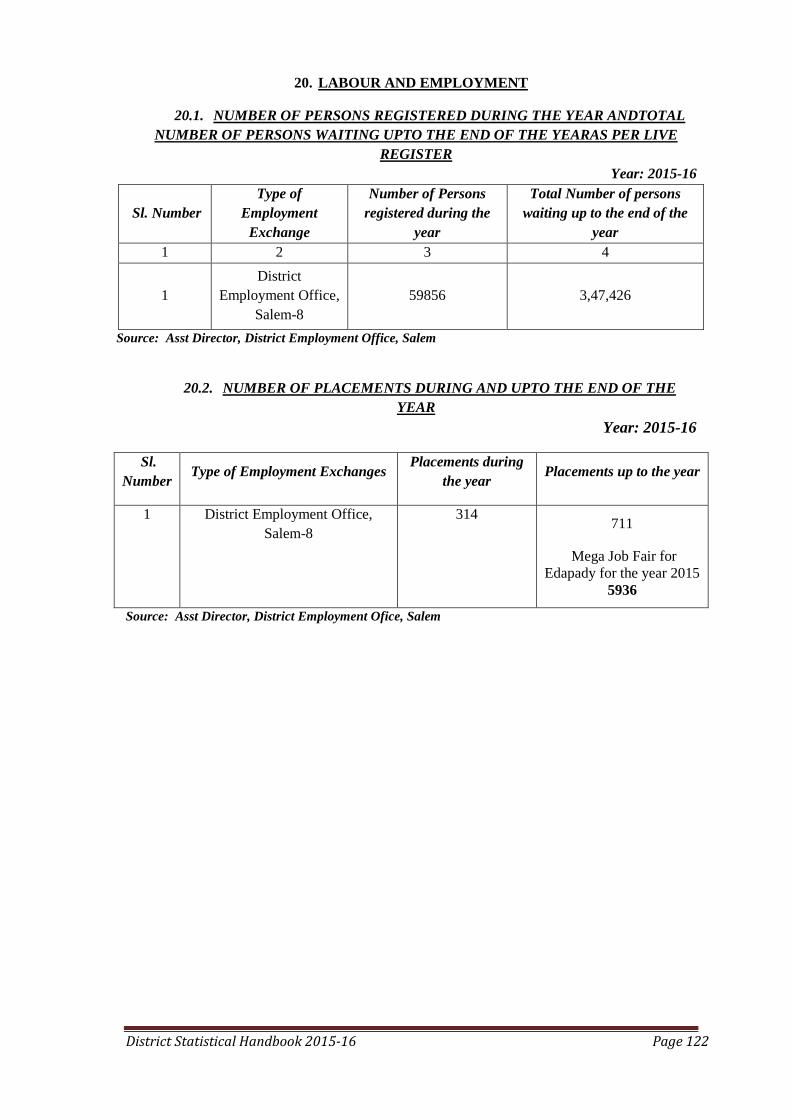
District Statistical Handbook 2015-16 Page 122
20. LABOUR AND EMPLOYMENT
20.1. NUMBER OF PERSONS REGISTERED DURING THE YEAR ANDTOTAL
NUMBER OF PERSONS WAITING UPTO THE END OF THE YEARAS PER LIVE
REGISTER
Year: 2015-16
Sl. Number
Type of
Employment
Exchange
Number of Persons
registered during the
year
Total Number of persons
waiting up to the end of the
year
1 2 3 4
1
District
Employment Office,
Salem-8
59856 3,47,426
Source: Asst Director, District Employment Office, Salem
20.2. NUMBER OF PLACEMENTS DURING AND UPTO THE END OF THE
YEAR
Year: 2015-16
Sl.
Number Type of Employment Exchanges
Placements during
the year Placements up to the year
1 District Employment Office,
Salem-8
314 711
Mega Job Fair for
Edapady for the year 2015
5936
Source: Asst Director, District Employment Ofice, Salem
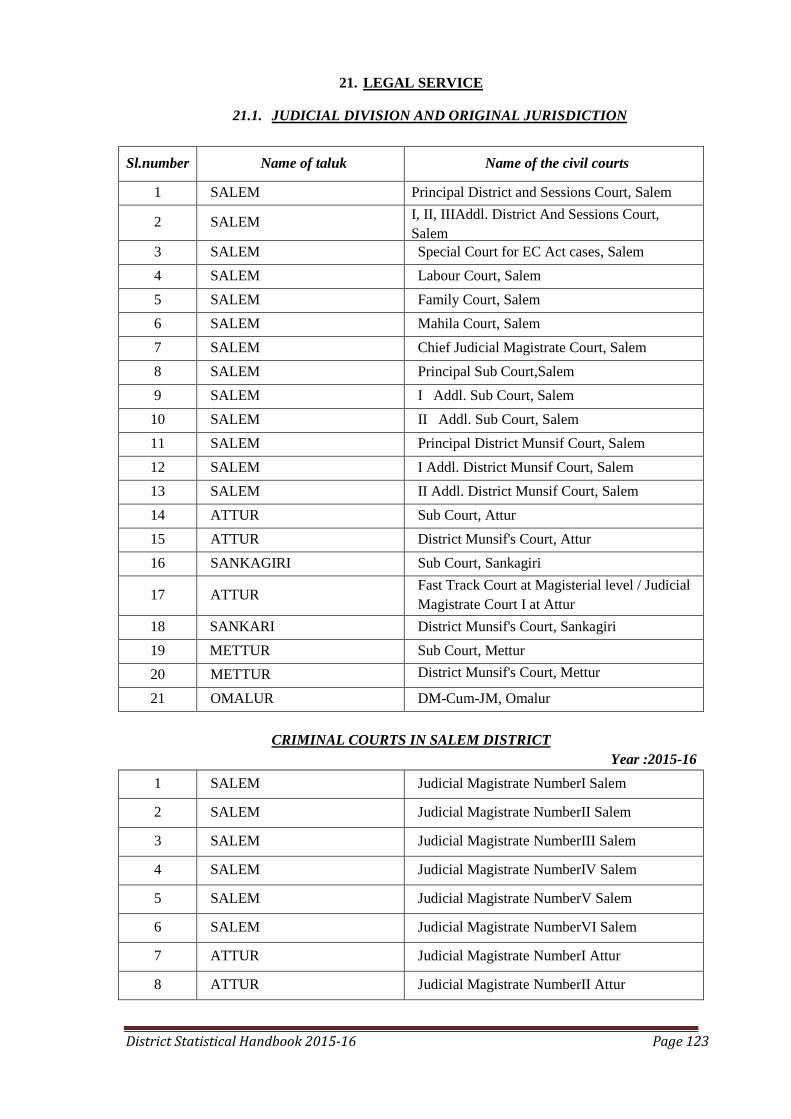
District Statistical Handbook 2015-16 Page 123
21. LEGAL SERVICE
21.1. JUDICIAL DIVISION AND ORIGINAL JURISDICTION
Sl.number Name of taluk Name of the civil courts
1 SALEM Principal District and Sessions Court, Salem
2 SALEM I, II, IIIAddl. District And Sessions Court,
Salem
3 SALEM Special Court for EC Act cases, Salem
4 SALEM Labour Court, Salem
5 SALEM Family Court, Salem
6 SALEM Mahila Court, Salem
7 SALEM Chief Judicial Magistrate Court, Salem
8 SALEM Principal Sub Court,Salem
9 SALEM I Addl. Sub Court, Salem
10 SALEM II Addl. Sub Court, Salem
11 SALEM Principal District Munsif Court, Salem
12 SALEM I Addl. District Munsif Court, Salem
13 SALEM II Addl. District Munsif Court, Salem
14 ATTUR Sub Court, Attur
15 ATTUR District Munsif's Court, Attur
16 SANKAGIRI Sub Court, Sankagiri
17 ATTUR Fast Track Court at Magisterial level / Judicial
Magistrate Court I at Attur
18 SANKARI District Munsif's Court, Sankagiri
19 METTUR Sub Court, Mettur
20 METTUR District Munsif's Court, Mettur
21 OMALUR DM-Cum-JM, Omalur
CRIMINAL COURTS IN SALEM DISTRICT
Year :2015-16
1 SALEM Judicial Magistrate NumberI Salem
2 SALEM Judicial Magistrate NumberII Salem
3 SALEM Judicial Magistrate NumberIII Salem
4 SALEM Judicial Magistrate NumberIV Salem
5 SALEM Judicial Magistrate NumberV Salem
6 SALEM Judicial Magistrate NumberVI Salem
7 ATTUR Judicial Magistrate NumberI Attur
8 ATTUR Judicial Magistrate NumberII Attur
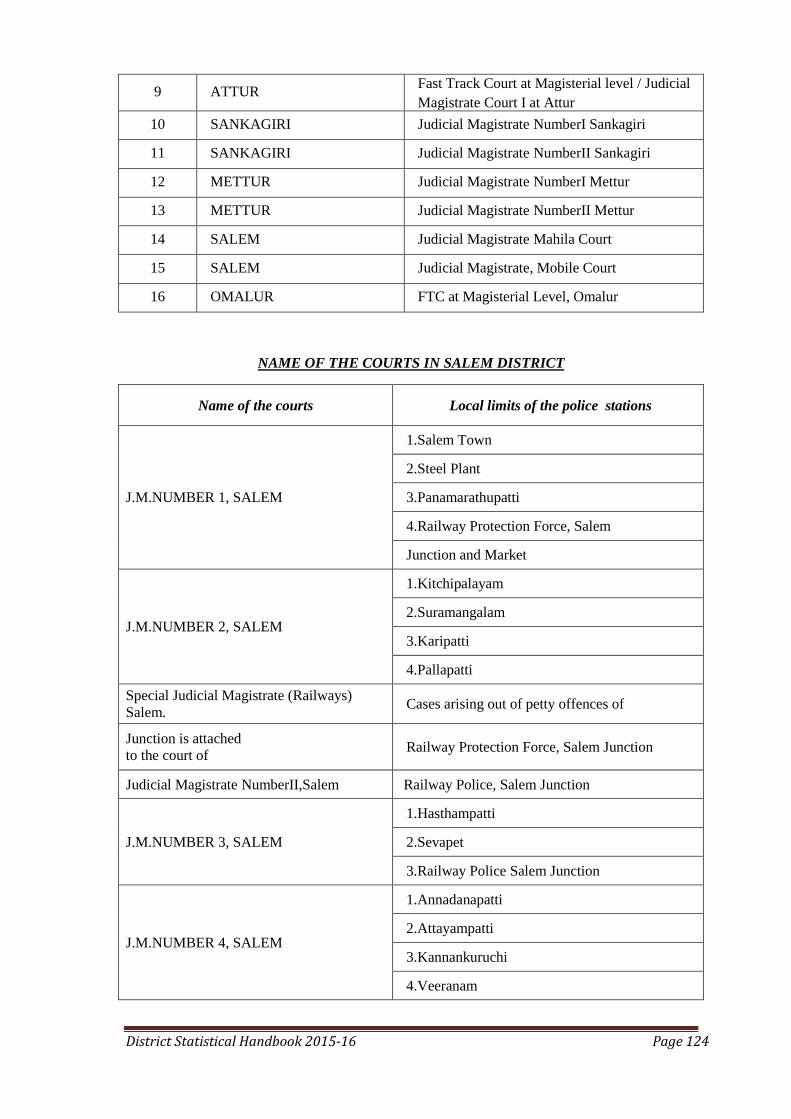
District Statistical Handbook 2015-16 Page 124
9 ATTUR Fast Track Court at Magisterial level / Judicial
Magistrate Court I at Attur
10 SANKAGIRI Judicial Magistrate NumberI Sankagiri
11 SANKAGIRI Judicial Magistrate NumberII Sankagiri
12 METTUR Judicial Magistrate NumberI Mettur
13 METTUR Judicial Magistrate NumberII Mettur
14 SALEM Judicial Magistrate Mahila Court
15 SALEM Judicial Magistrate, Mobile Court
16 OMALUR FTC at Magisterial Level, Omalur
NAME OF THE COURTS IN SALEM DISTRICT
Name of the courts Local limits of the police stations
J.M.NUMBER 1, SALEM
1.Salem Town
2.Steel Plant
3.Panamarathupatti
4.Railway Protection Force, Salem
Junction and Market
J.M.NUMBER 2, SALEM
1.Kitchipalayam
2.Suramangalam
3.Karipatti
4.Pallapatti
Special Judicial Magistrate (Railways)
Salem. Cases arising out of petty offences of
Junction is attached
to the court of Railway Protection Force, Salem Junction
Judicial Magistrate NumberII,Salem Railway Police, Salem Junction
J.M.NUMBER 3, SALEM
1.Hasthampatti
2.Sevapet
3.Railway Police Salem Junction
J.M.NUMBER 4, SALEM
1.Annadanapatti
2.Attayampatti
3.Kannankuruchi
4.Veeranam
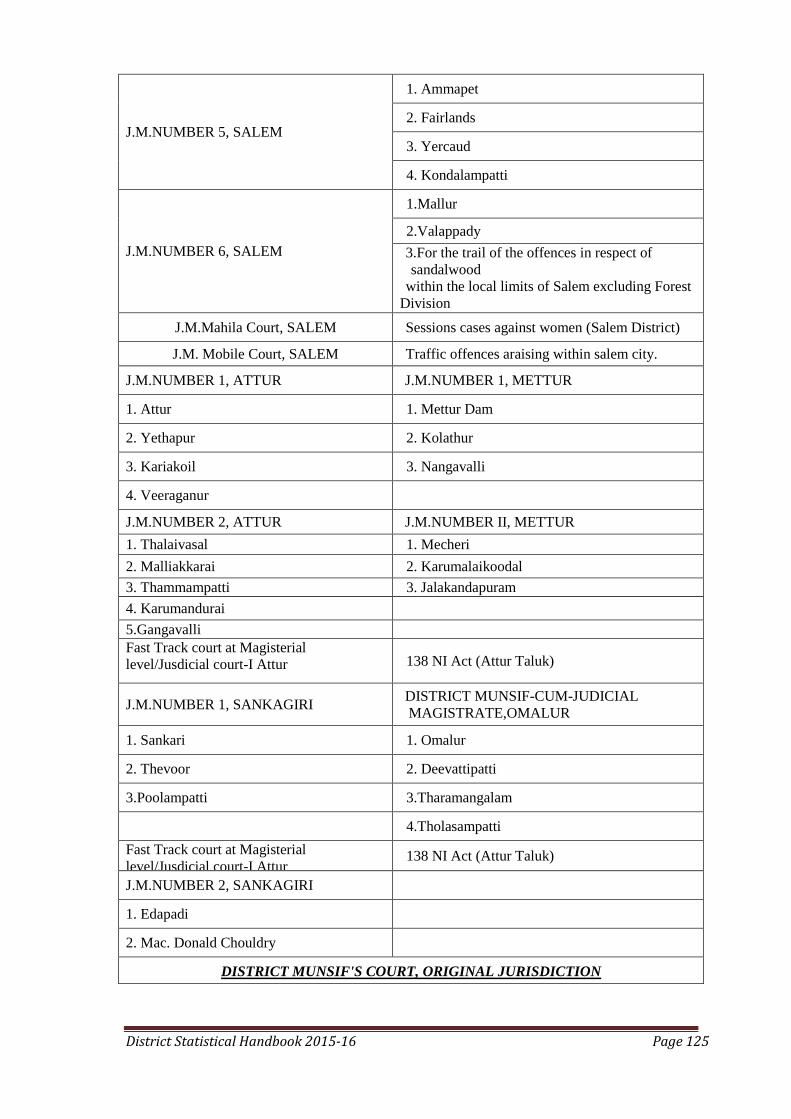
District Statistical Handbook 2015-16 Page 125
J.M.NUMBER 5, SALEM
1. Ammapet
2. Fairlands
3. Yercaud
4. Kondalampatti
J.M.NUMBER 6, SALEM
1.Mallur
2.Valappady
3.For the trail of the offences in respect of
sandalwood
within the local limits of Salem excluding Forest
Division
of Attur J.M.Mahila Court, SALEM Sessions cases against women (Salem District)
J.M. Mobile Court, SALEM Traffic offences araising within salem city.
J.M.NUMBER 1, ATTUR J.M.NUMBER 1, METTUR
1. Attur 1. Mettur Dam
2. Yethapur 2. Kolathur
3. Kariakoil 3. Nangavalli
4. Veeraganur
J.M.NUMBER 2, ATTUR J.M.NUMBER II, METTUR
1. Thalaivasal 1. Mecheri
2. Malliakkarai 2. Karumalaikoodal
3. Thammampatti 3. Jalakandapuram
4. Karumandurai
5.Gangavalli
Fast Track court at Magisterial
level/Jusdicial court-I Attur
138 NI Act (Attur Taluk)
J.M.NUMBER 1, SANKAGIRI DISTRICT MUNSIF-CUM-JUDICIAL
MAGISTRATE,OMALUR
1. Sankari 1. Omalur
2. Thevoor 2. Deevattipatti
3.Poolampatti 3.Tharamangalam
4.Tholasampatti
Fast Track court at Magisterial
level/Jusdicial court-I Attur
138 NI Act (Attur Taluk)
J.M.NUMBER 2, SANKAGIRI
1. Edapadi
2. Mac. Donald Chouldry
DISTRICT MUNSIF'S COURT, ORIGINAL JURISDICTION

District Statistical Handbook 2015-16 Page 126
1 DISTRICT MUNSIF'S
COURT,SALEM SALEM, VALAPPADY, YERCAUD
2 DISTRICT MUNSIF'S
COURT,ATTUR ATTUR
3 DISTRICT MUNSIF'S
COURT,SANKAGIRI SANKAGIRI
4 DISTRICT MUNSIF'S
COURT,METTUR METTUR
5 DISTRICT MUNSIF'S CUM
JUDICIAL MAGISTRATE'S
COURT,OMLAUR
OMALUR
C.J.M. All cases arising out of petty offences of Hasthampatti shall be dealt with by
J.M.Number, Salem
21.2. RESULTS OF ORIGINAL SUITS FOR THE YEAR 2015-16
SL.
NUMBER
NAME OF THE
COURTS
PENDING
AT THE
BEGINNING
31-03-2014
INSTITUTION
01.04.2014-
31.03.15
DISPOSAL
01.04.2014-
31.03.15
PENDING
AS ON
31.03.2015
1
District Courts,
Salem (Prl & I to
III Addl. District
Courts)
735 534 479 790
2
Sub-courts, Salem
(Prl & I to IV
Addl. District
Courts)
1436 656 842 1250
3 Sub-court,
Sangakiri 538 223 176 585
4 Sub-court, Attur 670 230 127 773
5 Sub-Court, Mettur 551 523 242 832
6
District Munsif
Court, Salem (Prl
& I to III Addl.
District Munsif‘s
Courts)
3755 2479 2543 3691
7 District Munsif
Court, Attur 2525 371 287 2609
8 District Munsif
Court, Mettur 1163 289 283 1169
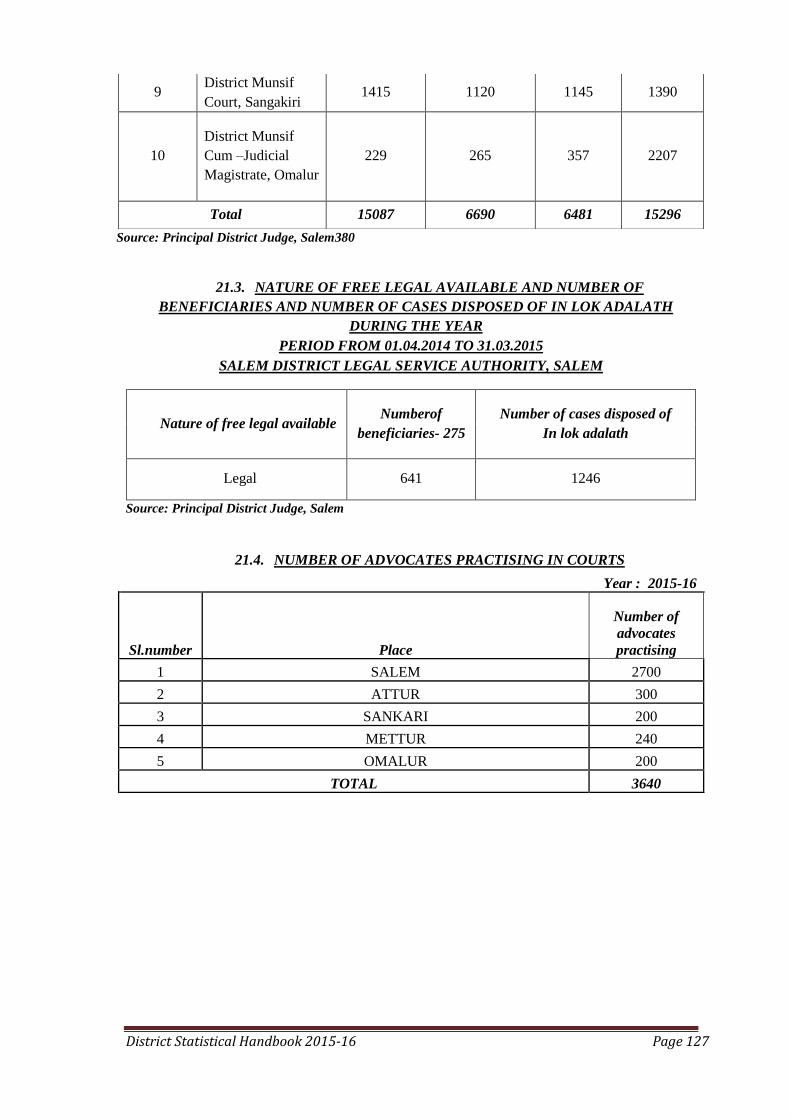
District Statistical Handbook 2015-16 Page 127
Source: Principal District Judge, Salem380
21.3. NATURE OF FREE LEGAL AVAILABLE AND NUMBER OF
BENEFICIARIES AND NUMBER OF CASES DISPOSED OF IN LOK ADALATH
DURING THE YEAR
PERIOD FROM 01.04.2014 TO 31.03.2015
SALEM DISTRICT LEGAL SERVICE AUTHORITY, SALEM
Nature of free legal available Numberof
beneficiaries- 275
Number of cases disposed of
In lok adalath
Legal 641 1246
Source: Principal District Judge, Salem
21.4. NUMBER OF ADVOCATES PRACTISING IN COURTS
Year : 2015-16
Sl.number Place
Number of
advocates
practising
1 SALEM 2700
2 ATTUR 300
3 SANKARI 200
4 METTUR 240
5 OMALUR 200
TOTAL 3640
9 District Munsif
Court, Sangakiri 1415 1120 1145 1390
10
District Munsif
Cum –Judicial
Magistrate, Omalur
229 265 357 2207
Total 15087 6690 6481 15296

District Statistical Handbook 2015-16 Page 128
22. LIBRARIES
22.1. LIST OF HEAD AND BRANCH LIBRARIES IN THE SALEM DISTRICT
ALL DETAILS OF MEMBERS, BOOKS AND READERS
District: Salem YEAR:2015-16
S.No Name of the
Branch library Numbers
Number of
books
available
Number of
readers
1 District Central
Library 1 166352 92824
2 Branch Library 57 1777690 1594121
3 Village Library 72 652119 925250
4 Part Time Library 35 194787 8455
5 Mobile Library 1 8743 8455
6 Children & Women's
Library Section 0 0 0
Source: District Library Officer, Salem
22.2. NUMBER OF LIBRARIES HOUSES IN GOVT. BUILDING / RENTAL
BUILDING
Year: 2015-16
Category
Libraries in
Government
Building
(in Nos.)
Libraries in Rental
Building (in Nos.)
Libraries in Rent
Free Building
( in Nos.)
District central
Library-1 1 - -
Branch Library- 65 44 10 11
Village Library-75 6 3 66
Part Time Library-33 - - 33
Total-165 51 13 110
Source: District Library Officer,Salem

District Statistical Handbook 2015-16 Page 129
22.3. NUMBER OF READING ROOMS [Part Time Libreries]
Year: 2015-16
S.No. Name of the Block Name and Place of Library
Number of
Reading Room
1 Attur
Seeliampatti 1
Unathur 1
Narasingapurm
(Ammapalayam) 1
Narasingapurm (Thillai
Nagar) 1
2
Gangavalli Krishnapuram 1
Gangavalli Naduvalur Samathuvapuram 1
3 Pedanaickenpalayam
Thavapatti 1
A.Karadipatty 1
Kalleripatti 1
Yethapur 1
Karumanthurai 1
4 Panamarathupatti
Kullappanaickanoor 1
Kondalampatti (Neikkarpatti) 1
5 Valappadi
Singipuram 1
Belur (Villvanur) 1
Thikkiyampalayam 1
6 Edappadi
Amman Kovil 1
Koneripatty 1
Pudhur 1
R.Chettipatty 1
7 Magudanchavadi
A.Pudhur 1
Naduvaneri 1
8 Sangakiri
Vinobaji Nagar 1
Thevur 1
Vatrampalayam 1
Katheri 1
9 Kolathur
Kolathur(Chettiyur) 1
Mettur 1
11 Nangavalli
Souriyur(Adivaipatti) 1
Veerakkalpudhur 1
11 Mecheri Mecheri(Konur) 1
12 Omalur Kongupatty(Thottampatty) 1
13 Tharamangalam Pappampadi 1
14 Veerapandy
Attayampatty 1
Ettimanickampatty 1
Nainampatty 1
Sengodampalayam 1
Chinna Seeragapadi 1
Vembadithalam 1
Total 39

District Statistical Handbook 2015-16 Page 130
23. MINING AND QUARRYING
23.1. NUMBER OF MINING AND QUARRYING UNITS IN THE DISTRICT
Year: 2015-16
Sl.No. Name of the
Taluk
Number of
Mining
Number of
Quarry Total
1. 2. 3. 4 5
1. Salem 4 34 38
2 Salem South - 2 2
3 Salem West 5 1 6
4 Valappady - 11 11
5 Yercaud 1 4 5
6 Attur 2 10 12
7 Gangavalli - 6 6
8 Omalur 7 34 41
9 Mettur 13 27 40
10 Sankari 57 40 97
11 Edapady 7 9 16
Total 96 178 274
Source: Asst Director of Geology and Mining, Salem.
23.2. CLASSIFICATION-WISE PRODUCTION DURING THE YEAR 2015-16
Sl.Number
Name of the Minerals Production (in tonnes)
Major Minerals Quantity Value in Rs.
1 2 3 4
1 Limestone 347461 31554589
2 Quartz - -
3 Feldspar 47034 3568806
4 Magnesite 161808 18859679
5 Bauxite 86800 9338157
6 Soapstone 540 55105
7 Dunite 59200 2890311
Minor Minerals
1 Rough Stone (Unit) 665761 29959270
2 Soil/gravel (Unit) 194634 4865850
3 Granite - Black (CBM) 1297.665 4954981
4 Colour Granite (CBM) 10784.401 23838749
Source: Asst Director of Geology and Mining, Salem.

District Statistical Handbook 2015-16 Page 131
24. MANUFACTURING SECTOR
24.1. NUMBER OF FOOD AND ALLIED MANUFACTURING UNITS IN THE
DISTRICT (Rs. In lakhs)
Year: 2015-16
Industry
Group
Name of the
District/Block
Description of the
industry
All
employees
Value of
output Rs. In
lakhs
Value
added
1 2 3 4 5 6
20-21 Salem Food Product 2179 27967.75 -
22 Salem Beverage tobacco
product - - -
Source: General Manager, D.I.C., Salem
24.2. NUMBER OF NON-FOOD MANUFACTURING UNITS IN THE DISTRICT
Year: 2015-16
Industry
Group
Name of the
District/
Block
Description of the
Industry
All
Employees
Value of
output Rs.
In lakhs
Value
added
1 2 3 4 5 6
23
Salem
Cotton textiles 6878 91176.90 NA
24 Wool/Silk - - NA
26 Hosiery / Garments 2661 37184.99 NA
27 Wood products 456 6435.60 NA
28 Printing / Paper 98 1001.16 NA
29 Leather product - - NA
30 Rubber product - - NA
31 Chemical products 179 11896.30 NA
32 Non-Metal Mineral 744 7092.03 NA
33 Basic Metal Products 353 5569.00 NA
34 Metal products & parts 1171 21505.75 NA
35 General Engineering
works
985 21460.95 NA
36 Mfg. of
Batteries/plates/UPS
- - NA
38 Other 397 10288.44 NA
82 DTP works & Internet
Browsing
876 16924.56 NA
96 Beauty Parlour 56 - NA
99 Processing of colour
B&W negatives
- - NA
Source: General Manager, D.I.C., Salem.
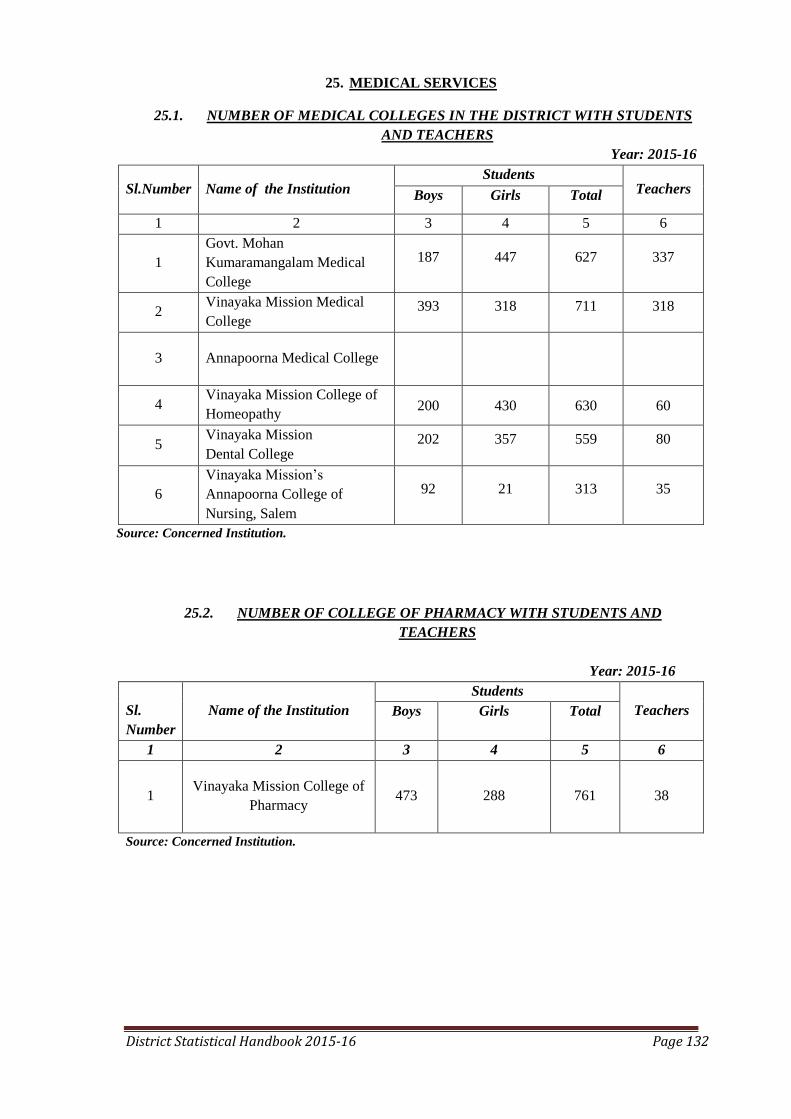
District Statistical Handbook 2015-16 Page 132
25. MEDICAL SERVICES
25.1. NUMBER OF MEDICAL COLLEGES IN THE DISTRICT WITH STUDENTS
AND TEACHERS
Year: 2015-16
Sl.Number Name of the Institution Students
Teachers Boys Girls Total
1 2 3 4 5 6
1
Govt. Mohan
Kumaramangalam Medical
College
187 447 627 337
2 Vinayaka Mission Medical
College 393 318 711 318
3 Annapoorna Medical College
4 Vinayaka Mission College of
Homeopathy 200 430 630 60
5 Vinayaka Mission
Dental College 202 357 559 80
6
Vinayaka Mission‘s
Annapoorna College of
Nursing, Salem
92 21 313 35
Source: Concerned Institution.
25.2. NUMBER OF COLLEGE OF PHARMACY WITH STUDENTS AND
TEACHERS
Year: 2015-16
Sl.
Number
Name of the Institution
Students
Teachers Boys Girls Total
1 2 3 4 5 6
1 Vinayaka Mission College of
Pharmacy 473 288 761 38
Source: Concerned Institution.
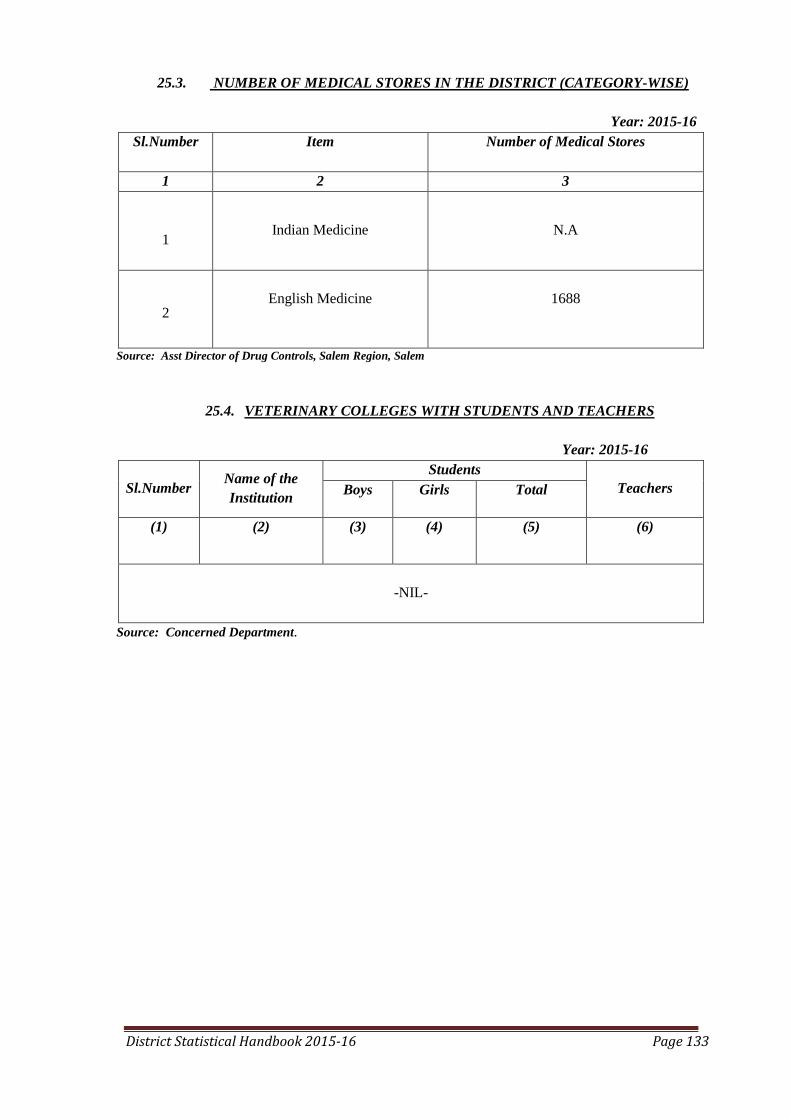
District Statistical Handbook 2015-16 Page 133
25.3. NUMBER OF MEDICAL STORES IN THE DISTRICT (CATEGORY-WISE)
Year: 2015-16
Sl.Number
Item
Number of Medical Stores
1 2 3
1 Indian Medicine N.A
2
English Medicine
1688
Source: Asst Director of Drug Controls, Salem Region, Salem
25.4. VETERINARY COLLEGES WITH STUDENTS AND TEACHERS
Year: 2015-16
Sl.Number Name of the
Institution
Students
Teachers Boys Girls Total
(1) (2) (3) (4) (5) (6)
-NIL-
Source: Concerned Department.
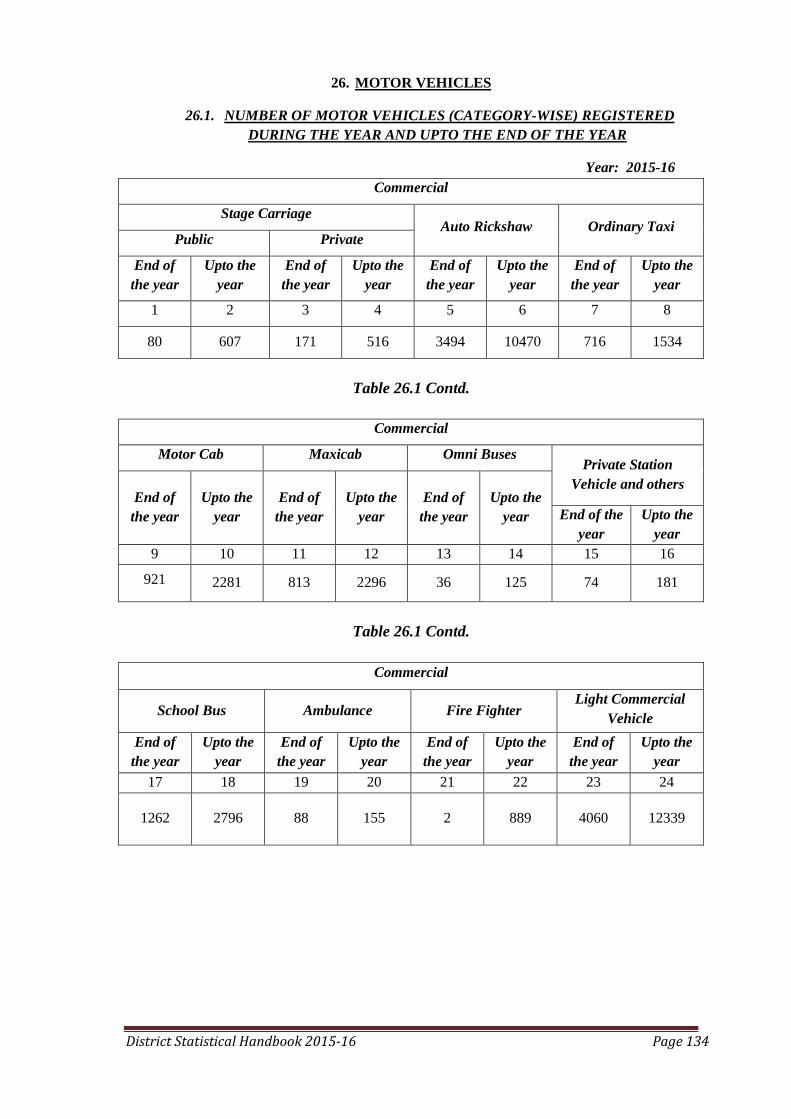
District Statistical Handbook 2015-16 Page 134
26. MOTOR VEHICLES
26.1. NUMBER OF MOTOR VEHICLES (CATEGORY-WISE) REGISTERED
DURING THE YEAR AND UPTO THE END OF THE YEAR
Year: 2015-16
Commercial
Stage Carriage Auto Rickshaw Ordinary Taxi
Public Private
End of
the year
Upto the
year
End of
the year
Upto the
year
End of
the year
Upto the
year
End of
the year
Upto the
year
1 2 3 4 5 6 7 8
80 607 171 516 3494 10470 716 1534
Table 26.1 Contd.
Commercial
Motor Cab Maxicab Omni Buses Private Station
Vehicle and others End of
the year
Upto the
year
End of
the year
Upto the
year
End of
the year
Upto the
year End of the
year
Upto the
year
9 10 11 12 13 14 15 16
921 2281 813 2296 36 125 74 181
Table 26.1 Contd.
Commercial
School Bus Ambulance Fire Fighter Light Commercial
Vehicle
End of
the year
Upto the
year
End of
the year
Upto the
year
End of
the year
Upto the
year
End of
the year
Upto the
year
17 18 19 20 21 22 23 24
1262 2796 88 155 2 889 4060 12339

District Statistical Handbook 2015-16 Page 135
Table 26.1 Contd.
Commercial
Lorry Articulated Vehicle
State Permit National Permit State Permit National Permit
End of
the year
Upto the
year
End of
the year
Upto the
year
End of
the year
Upto the
year
End of the
year
Upto the
year
25 26 27 28 29 30 31 32
7619 19009 3872 7313 1197 2764 335 937
Table 26.1 Contd.
Commercial Non-Commercial Vehicles
Tractor / Trailor Total Motor Cycle Scooter
End of
the year
Upto the
year
End of
the year
Upto the
year
End of
the year
Upto the
year
End of the
year
Upto the
year
33 34 35 36 37 38 39 40
910 8851 17506 64919 216036 778165 26147 144643
Table 26.1 Contd
Non-Commercial Vehicles
Moped Tri-Cycle Auto Motor Car Jeep
End of
the year
Upto the
year
End of
the year
Upto the
year
End of
the year
Upto the
year
End of the
year
Upto the
year
(41) (42) (43) (44) (45) (46) (47) (48)
112728 275368 2 2 21677 129061 62 260
Table 26.1 Contd.
Non-Commercial Vehicles
Station Wagon Tractor Three Wheeler Four Wheeler
End of
the year
Upto the
year
End of
the year
Upto the
year
End of
the year
Upto the
year
End of
the year
Upto the
year
49 50 51 52 53 54 55 56
0 0 14091 22373 1456 6024 415 3335
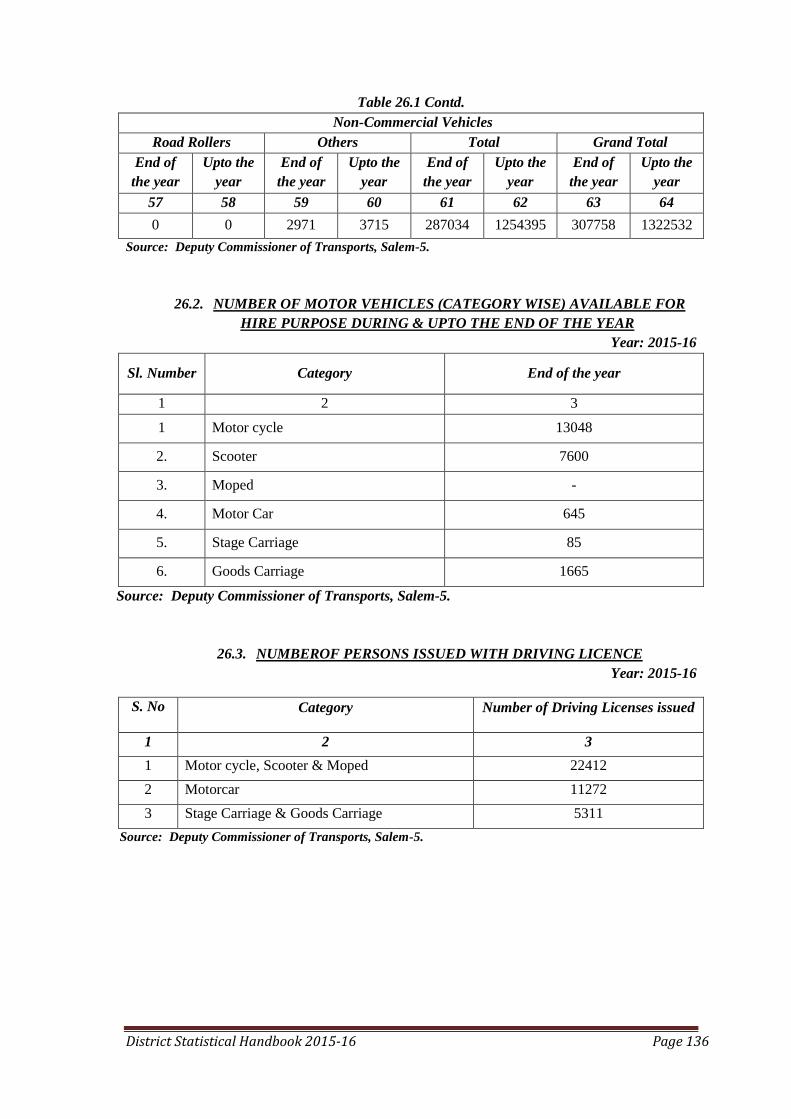
District Statistical Handbook 2015-16 Page 136
Table 26.1 Contd.
Non-Commercial Vehicles
Road Rollers Others Total Grand Total
End of
the year
Upto the
year
End of
the year
Upto the
year
End of
the year
Upto the
year
End of
the year
Upto the
year
57 58 59 60 61 62 63 64
0 0 2971 3715 287034 1254395 307758 1322532
Source: Deputy Commissioner of Transports, Salem-5.
26.2. NUMBER OF MOTOR VEHICLES (CATEGORY WISE) AVAILABLE FOR
HIRE PURPOSE DURING & UPTO THE END OF THE YEAR
Year: 2015-16
Sl. Number Category End of the year
1 2 3
1 Motor cycle 13048
2. Scooter 7600
3. Moped -
4. Motor Car 645
5. Stage Carriage 85
6. Goods Carriage 1665
Source: Deputy Commissioner of Transports, Salem-5.
26.3. NUMBEROF PERSONS ISSUED WITH DRIVING LICENCE
Year: 2015-16
S. No
Category Number of Driving Licenses issued
1 2 3
1 Motor cycle, Scooter & Moped 22412
2 Motorcar 11272
3 Stage Carriage & Goods Carriage 5311
Source: Deputy Commissioner of Transports, Salem-5.

District Statistical Handbook 2015-16 Page 137
27. NON-CONVENTIONAL ENERGY GENERATION
27.1. NUMBER OF SOLAR ENERGY GENERATING UNITS IN THE DISTRICT
WITH PRODUCTION AREA
Year: 2015-16
Sl.
Number
Name and Place of Solar
energy system exist
Install Capacity
(in Mega Watts)
Generation
(in Mega Watts)
1 2 3 4
Nil
Source: Concerned Electricity Generation Units.
27.2. NUMBER OF WIND MILLS, GENERATING UNITS WITH PRODUCTION
DATA
Year: 2015-16
Sl.Number Name and Place of Wind
Mills Generation exist
Install Capacity
(in Mega Units)
Generation
(in Mega Units)
1 2 3 4
NIL
Source: Concerned Electricity Generation Units.

District Statistical Handbook 2015-16 Page 138
28. POLICE AND PRISONS
28.1. POLICE FORCE
Year: 2015-16
S.No
Name of the
Stations
Police
Stations
Spl.
Units
Actual Strength
Total Local
Strength
Armed
Reserve
Strength
1 2 3 4 5 6 7
1 Rural 30 09 1049 314 1363
2 Urban 18 13 1022 328 1363
3 Total 48 22 2086 640 2726
Source: Commissioner of Police, Salem City.and Superintendent of Police, Salem
28.2. COGNIZABLE OFFENCES UNDER INDIAN PENAL CODE
(Including Attempts)
Year: 2015-16
Sl.
Number
Item Number of cases Reported
Urban
(upto 31.7.15)
Rural Total
1. Murder 53 42 95
2. Culpable Homicide
Note amounting to M MU Murder 1 02 3
3. Rape 7 05 12
4. Kidnapping and Abduction 25 54 79
5. Murder for Gain - 02 02
6. Dacoity 2 02 4
7. Robbery 110 25 135
8. Burglary 126 70 196
9. Thefts 418 135 553
10. Riots 74 92 166
11. Criminal Breach of Trust 11 01 12
12. Cheating 69 60 129
13. Counterfeiting 0 0 0
14 Miscellaneous 6345 4069 10414
Total Cognizable Crime Under
I.P.C.
7241 4559 11800 Source: Commissioner of Police, Salem City.and Superintendent of Police, Salem
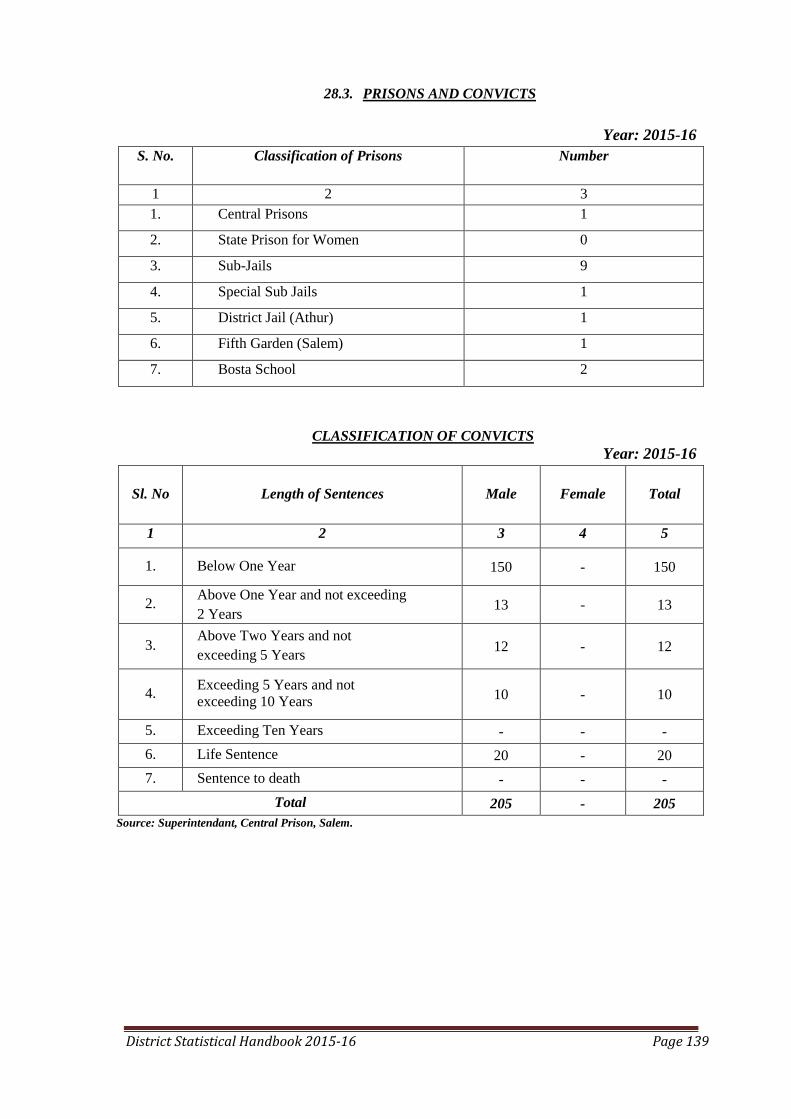
District Statistical Handbook 2015-16 Page 139
28.3. PRISONS AND CONVICTS
Year: 2015-16
S. No.
Classification of Prisons
Number
1 2 3
1. Central Prisons 1
2. State Prison for Women 0
3. Sub-Jails 9
4. Special Sub Jails 1
5. District Jail (Athur) 1
6. Fifth Garden (Salem) 1
7. Bosta School 2
CLASSIFICATION OF CONVICTS
Year: 2015-16
Sl. No
Length of Sentences
Male
Female Total
1 2 3 4 5
1. Below One Year 150 - 150
2. Above One Year and not exceeding
2 Years 13 - 13
3. Above Two Years and not
exceeding 5 Years 12 - 12
4. Exceeding 5 Years and not
exceeding 10 Years 10 - 10
5. Exceeding Ten Years - - -
6. Life Sentence 20 - 20
7. Sentence to death - - -
Total 205 - 205
Source: Superintendant, Central Prison, Salem.

District Statistical Handbook 2015-16 Page 140
28.4. NUMBER OF CASES REGISTERED UNDER P.C.R./ SC & ST ACT
Year: 2015-16
Sl.Number
Name of the Stations
Number of Cases Registered under
P.C.R./ SC & ST Act (upto 31.07.15)
1 2 3
1 Salem District 14
Source: Inspector of Police, Social Justice, Salem District.
28.5. NUMBEROF CASES REGISTERED AGAINST WOMEN HARASMENT AND
DOWRY
Year: 2015-16
Sl.
Number Name of the Station
Number of cases registered against
women harassment and dowry
1 2 3
1
Salem City and Rural
136
Source: Commissioner of Police, Salem City.and Superintendent of Police, Salem.
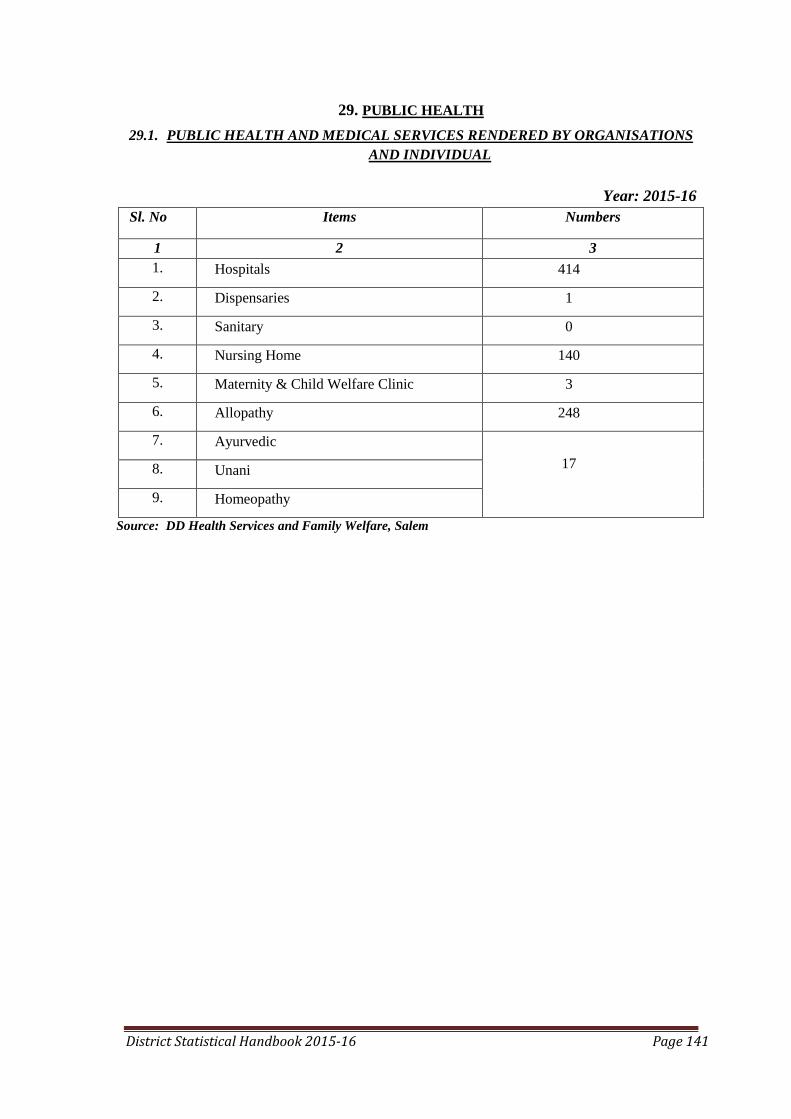
District Statistical Handbook 2015-16 Page 141
29. PUBLIC HEALTH
29.1. PUBLIC HEALTH AND MEDICAL SERVICES RENDERED BY ORGANISATIONS
AND INDIVIDUAL
Year: 2015-16
Sl. No
Items
Numbers
1 2 3
1. Hospitals 414
2. Dispensaries 1
3. Sanitary 0
4. Nursing Home 140
5. Maternity & Child Welfare Clinic 3
6. Allopathy 248
7. Ayurvedic
17 8. Unani
9. Homeopathy
Source: DD Health Services and Family Welfare, Salem
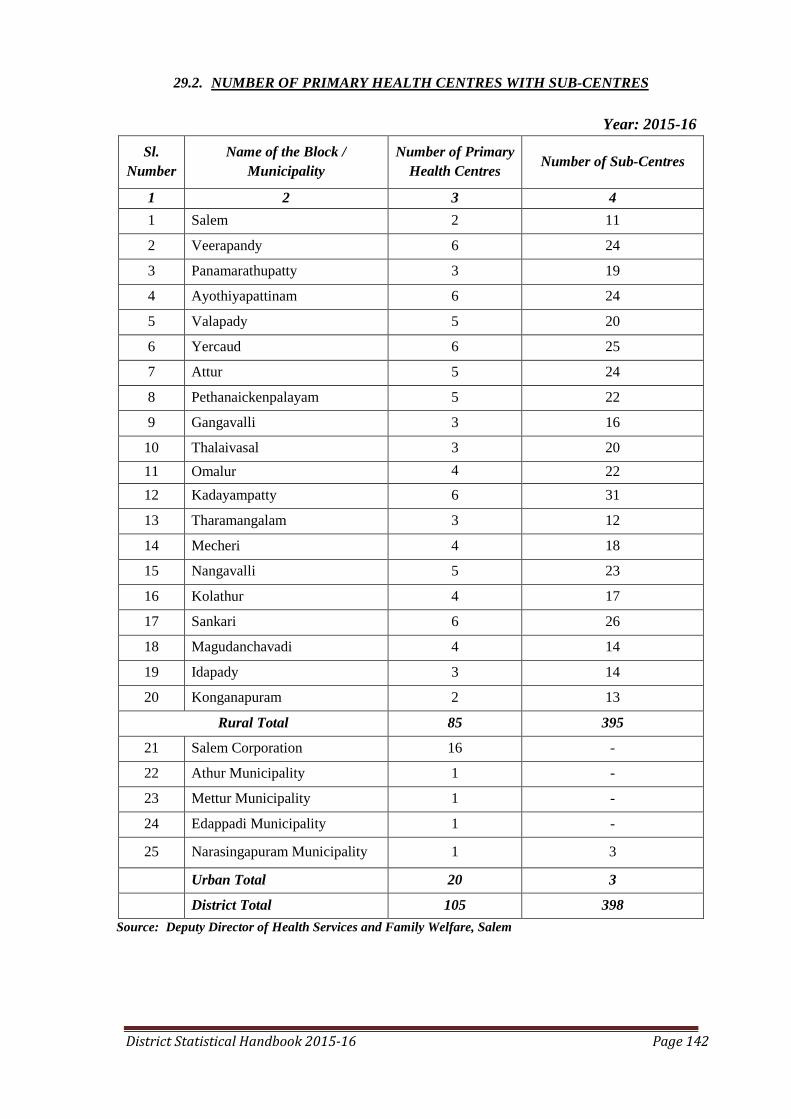
District Statistical Handbook 2015-16 Page 142
29.2. NUMBER OF PRIMARY HEALTH CENTRES WITH SUB-CENTRES
Year: 2015-16
Sl.
Number
Name of the Block /
Municipality
Number of Primary
Health Centres Number of Sub-Centres
1 2 3 4
1 Salem 2 11
2 Veerapandy 6 24
3 Panamarathupatty 3 19
4 Ayothiyapattinam 6 24
5 Valapady 5 20
6 Yercaud 6 25
7 Attur 5 24
8 Pethanaickenpalayam 5 22
9 Gangavalli 3 16
10 Thalaivasal 3 20
11 Omalur 4
22
12 Kadayampatty 6 31
13 Tharamangalam 3 12
14 Mecheri 4 18
15 Nangavalli 5 23
16 Kolathur 4 17
17 Sankari 6 26
18 Magudanchavadi 4 14
19 Idapady 3 14
20 Konganapuram 2 13
Rural Total 85 395
21 Salem Corporation 16 -
22 Athur Municipality 1 -
23 Mettur Municipality 1 -
24 Edappadi Municipality 1 -
25 Narasingapuram Municipality 1 3
Urban Total 20 3
District Total 105 398
Source: Deputy Director of Health Services and Family Welfare, Salem

District Statistical Handbook 2015-16 Page 143
30. PRINTING AND PUBLICATION
30.1. NUMBEROF NEWS PAPERS, WEEKLY MAGAZINES, MONTHLY
MAGAZINES ETC., PUBLISHED
Year: 2015-16
S. No Name of the News Paper
Language of
Publication Type of Periodicals
1 2 3 4
1 The Hindu English Daily
2 The Indian express English Daily 3 Deccan chronicle English Daily
4 Times of india English Daily
5 Daily thanthi Tamil
Daily
6 Dinakaran Tamil
Daily
7 Dinamalar Tamil
Daily
8 Dinamani Tamil
Daily
9 Kalaikathir Tamil
Daily
10 Trinity Mirror English Daily
11 Hindu tamil Tamil
Daily
12 Dinabhoomi Tamil
Daily
13 Makkal kural Tamil
Daily
14 Dinasooriyan Tamil
Daily
15 Janasakthi Tamil
Daily
16 Theekathir Tamil
Daily
17 Dr.namathu M.G.R Tamil
Daily
18 Murasoli Tamil
Daily
19 Malaimalar Tamil
Daily
20 Malaimurasu Tamil
Daily
21 Tamilmurasu Tamil
Daily
22 Kovai Malaimurasu Tamil
Daily Source: Public Relation Officer, Salem
30.2. NUMBER OF PUBLISHERS IN THE DISTRICT OTHER THAN NEWS
PAPERS AND MAGAZINES
Sl.
Number Name of the Publisher
Name of the Block /
Municipality
Number of
Publishers
1 2 3 4
Nil
Source: Public Relation Officer, Salem.
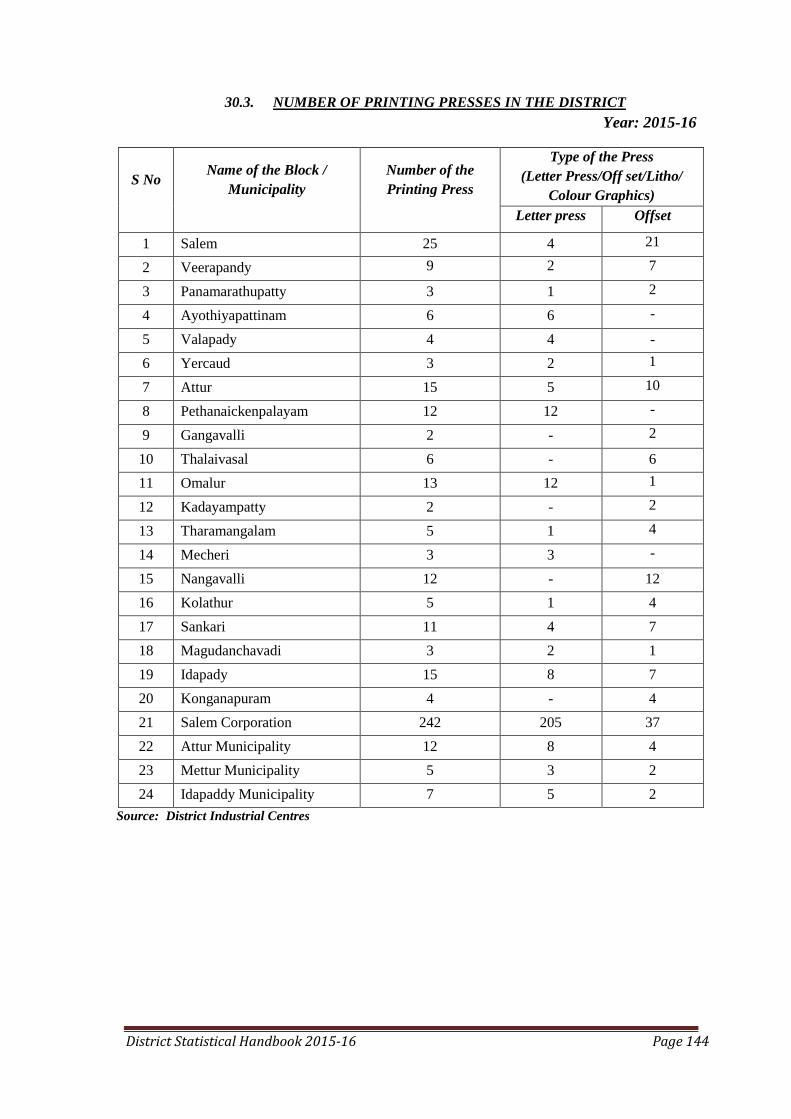
District Statistical Handbook 2015-16 Page 144
30.3. NUMBER OF PRINTING PRESSES IN THE DISTRICT
Year: 2015-16
S No
Name of the Block /
Municipality
Number of the
Printing Press
Type of the Press
(Letter Press/Off set/Litho/
Colour Graphics)
Letter press Offset
1 Salem 25 4 21
2 Veerapandy 9
2 7
3 Panamarathupatty 3 1 2
4 Ayothiyapattinam 6 6 -
5 Valapady 4 4 -
6 Yercaud 3 2 1
7 Attur 15 5 10
8 Pethanaickenpalayam 12 12 -
9 Gangavalli 2 - 2
10 Thalaivasal 6 - 6
11 Omalur 13 12 1
12 Kadayampatty 2 - 2
13 Tharamangalam 5 1 4
14 Mecheri 3 3 -
15 Nangavalli 12 - 12
16 Kolathur 5 1 4
17 Sankari 11 4 7
18 Magudanchavadi 3 2 1
19 Idapady 15 8 7
20 Konganapuram 4 - 4
21 Salem Corporation 242 205 37
22 Attur Municipality 12 8 4
23 Mettur Municipality 5 3 2
24 Idapaddy Municipality 7 5 2
Source: District Industrial Centres

District Statistical Handbook 2015-16 Page 145
31. PRICE - INDICES
31.1. INDEX NUMBERS OF WHOLESALE PRICES OF TAMIL NADU
(Base YEAR: 1970-71=100)
Year: 2015-16
Period
Primary
Articles
Food
Articles
Non
Food
Articles
Minerals
Fuel
Power and
Light
Manu
factured
Products
All
Commodities
1 2 3 4 5 6 7
Apr‘15 2963.28 3703.27 1802.29 1615.85 2844.04 2225.3 2632.73
May‘15 2984.78 3734.22 1809.12 1616.65 2850.46 2241.27 2651.29
Jun‘15 3007.31 3762.57 1824.08 1590.63 2850.53 2254.76 2669.08
Jul‘15 3035.88 3805.04 1832.08 1564.62 2850.53 2266.98 2689.5
Aug‘15 3061.18 3842.49 1838.44 1564.62 2854.33 2269.64 2704.13
Sep‘15 3084.37 3881.57 1836.44 1564.62 2889.64 2273.04 2718.99
Oct‘15 3107.22 3906.59 1856.69 1564.62 2890.98 2276.62 2732.64
Nov‘15 3202.93 4054.59 1870.38 1564.62 2907.87 2288.22 2788.72
Dec‘15 3250.8 4131.95 1871.19 1577.67 2912.41 2294.78 2816.97
Jan‘16 3266.82 4130.50 1916.62 1577.67 2823.53
Feb‘16 3218.06 4044.34 1927.35 1577.67 2795.80
Mar‘16 3240.13 4083.06 1922.95 1577.67 2809.12
Average 3118.56 3923.35 1858.97 1579.74 2736.04
Source: Department of Economics and Statistics, Chennai-6.

District Statistical Handbook 2015-16 Page 146
31.2. CONSUMER PRICE INDEX NUMBERS FOR INDUSTRIAL WORKERS
(BASE YEAR: 2001=100)
Year: 2015-16
Source: Director of Labour Bureau, Shimla
Period
Salem
Apr‘15 244
May‘15 248
Jun‘15 252
Jul‘15 253
Aug‘15 257
Sep‘15 258
Oct‘15 263
Nov‘15 270
Dec‘15 271
Jan‘16
Feb‘16
Mar‘16
AVERAGE
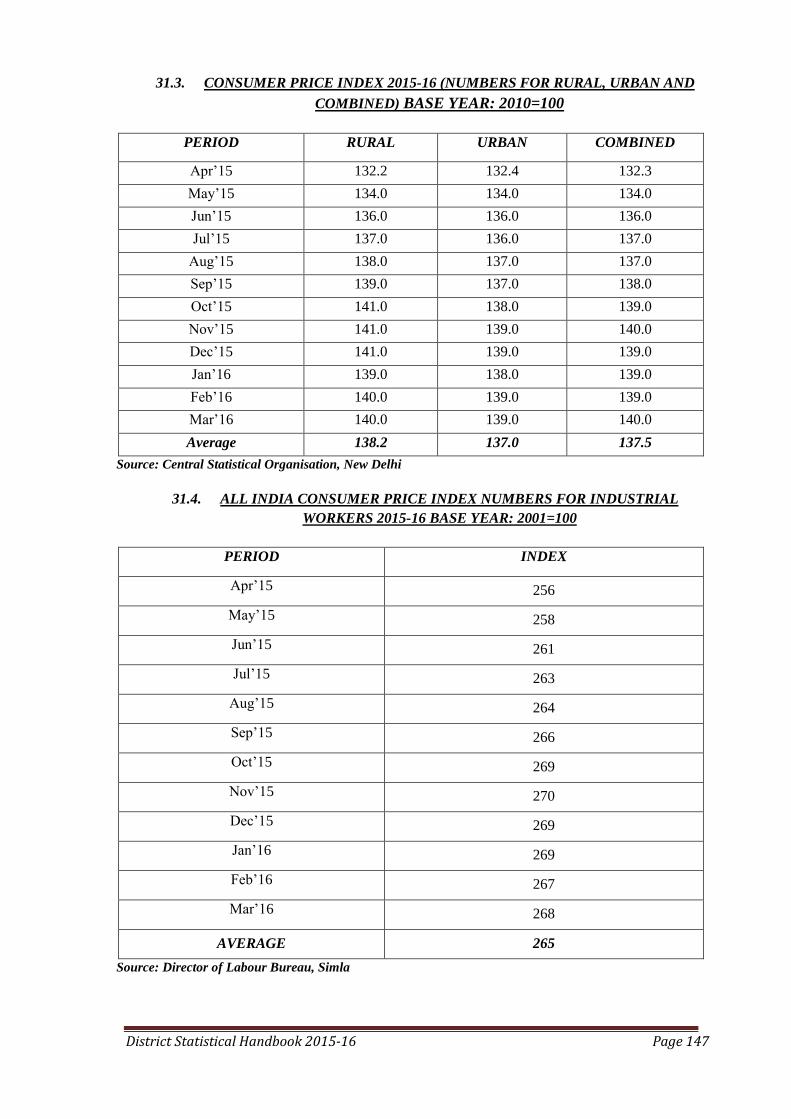
District Statistical Handbook 2015-16 Page 147
31.3. CONSUMER PRICE INDEX 2015-16 (NUMBERS FOR RURAL, URBAN AND
COMBINED) BASE YEAR: 2010=100
PERIOD RURAL URBAN COMBINED
Apr‘15 132.2 132.4 132.3
May‘15 134.0 134.0 134.0
Jun‘15 136.0 136.0 136.0
Jul‘15 137.0 136.0 137.0
Aug‘15 138.0 137.0 137.0
Sep‘15 139.0 137.0 138.0
Oct‘15 141.0 138.0 139.0
Nov‘15 141.0 139.0 140.0
Dec‘15 141.0 139.0 139.0
Jan‘16 139.0 138.0 139.0
Feb‘16 140.0 139.0 139.0
Mar‘16 140.0 139.0 140.0
Average 138.2 137.0 137.5
Source: Central Statistical Organisation, New Delhi
31.4. ALL INDIA CONSUMER PRICE INDEX NUMBERS FOR INDUSTRIAL
WORKERS 2015-16 BASE YEAR: 2001=100
PERIOD INDEX
Apr‘15 256
May‘15 258
Jun‘15 261
Jul‘15 263
Aug‘15 264
Sep‘15 266
Oct‘15 269
Nov‘15 270
Dec‘15 269
Jan‘16 269
Feb‘16 267
Mar‘16 268
AVERAGE 265
Source: Director of Labour Bureau, Simla
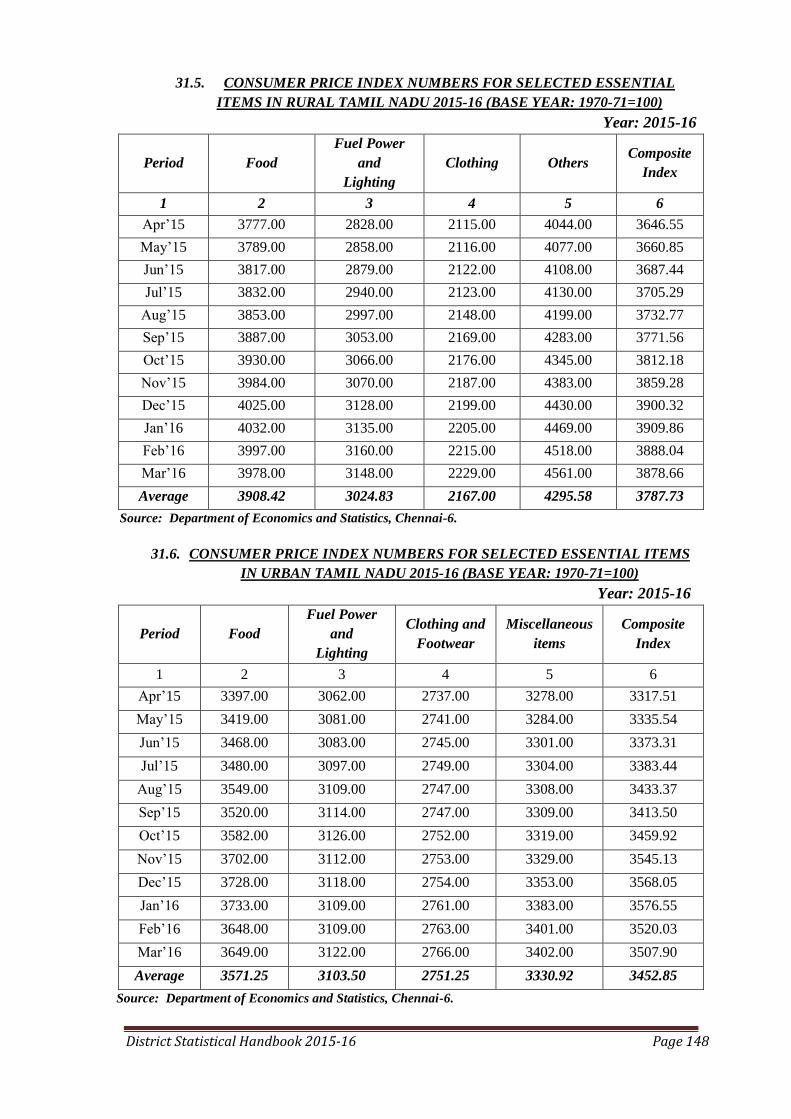
District Statistical Handbook 2015-16 Page 148
31.5. CONSUMER PRICE INDEX NUMBERS FOR SELECTED ESSENTIAL
ITEMS IN RURAL TAMIL NADU 2015-16 (BASE YEAR: 1970-71=100)
Year: 2015-16
Period Food
Fuel Power
and
Lighting
Clothing Others Composite
Index
1 2 3 4 5 6
Apr‘15 3777.00 2828.00 2115.00 4044.00 3646.55
May‘15 3789.00 2858.00 2116.00 4077.00 3660.85
Jun‘15 3817.00 2879.00 2122.00 4108.00 3687.44
Jul‘15 3832.00 2940.00 2123.00 4130.00 3705.29
Aug‘15 3853.00 2997.00 2148.00 4199.00 3732.77
Sep‘15 3887.00 3053.00 2169.00 4283.00 3771.56
Oct‘15 3930.00 3066.00 2176.00 4345.00 3812.18
Nov‘15 3984.00 3070.00 2187.00 4383.00 3859.28
Dec‘15 4025.00 3128.00 2199.00 4430.00 3900.32
Jan‘16 4032.00 3135.00 2205.00 4469.00 3909.86
Feb‘16 3997.00 3160.00 2215.00 4518.00 3888.04
Mar‘16 3978.00 3148.00 2229.00 4561.00 3878.66
Average 3908.42 3024.83 2167.00 4295.58 3787.73
Source: Department of Economics and Statistics, Chennai-6.
31.6. CONSUMER PRICE INDEX NUMBERS FOR SELECTED ESSENTIAL ITEMS
IN URBAN TAMIL NADU 2015-16 (BASE YEAR: 1970-71=100)
Year: 2015-16
Period Food
Fuel Power
and
Lighting
Clothing and
Footwear
Miscellaneous
items
Composite
Index
1 2 3 4 5 6
Apr‘15 3397.00 3062.00 2737.00 3278.00 3317.51
May‘15 3419.00 3081.00 2741.00 3284.00 3335.54
Jun‘15 3468.00 3083.00 2745.00 3301.00 3373.31
Jul‘15 3480.00 3097.00 2749.00 3304.00 3383.44
Aug‘15 3549.00 3109.00 2747.00 3308.00 3433.37
Sep‘15 3520.00 3114.00 2747.00 3309.00 3413.50
Oct‘15 3582.00 3126.00 2752.00 3319.00 3459.92
Nov‘15 3702.00 3112.00 2753.00 3329.00 3545.13
Dec‘15 3728.00 3118.00 2754.00 3353.00 3568.05
Jan‘16 3733.00 3109.00 2761.00 3383.00 3576.55
Feb‘16 3648.00 3109.00 2763.00 3401.00 3520.03
Mar‘16 3649.00 3122.00 2766.00 3402.00 3507.90
Average 3571.25 3103.50 2751.25 3330.92 3452.85
Source: Department of Economics and Statistics, Chennai-6.
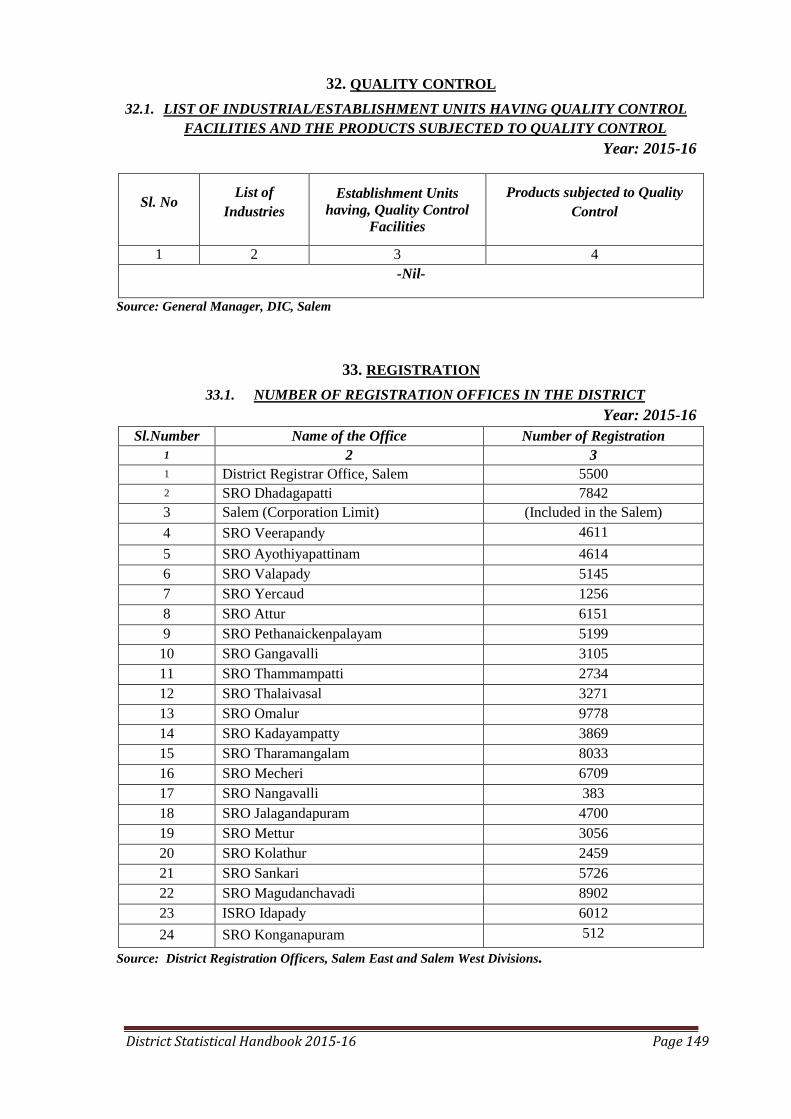
District Statistical Handbook 2015-16 Page 149
32. QUALITY CONTROL
32.1. LIST OF INDUSTRIAL/ESTABLISHMENT UNITS HAVING QUALITY CONTROL
FACILITIES AND THE PRODUCTS SUBJECTED TO QUALITY CONTROL
Year: 2015-16
Sl. No List of
Industries
Establishment Units
having, Quality Control
Facilities
Products subjected to Quality
Control
1 2 3 4
-Nil-
Source: General Manager, DIC, Salem
33. REGISTRATION
33.1. NUMBER OF REGISTRATION OFFICES IN THE DISTRICT
Year: 2015-16
Sl.Number
Name of the Office Number of Registration
1 2 3
1 District Registrar Office, Salem 5500
2 SRO Dhadagapatti 7842
3 Salem (Corporation Limit) (Included in the Salem)
4 SRO Veerapandy 4611
5 SRO Ayothiyapattinam 4614
6 SRO Valapady 5145
7 SRO Yercaud 1256
8 SRO Attur 6151
9 SRO Pethanaickenpalayam 5199
10 SRO Gangavalli 3105
11 SRO Thammampatti 2734
12 SRO Thalaivasal 3271
13 SRO Omalur 9778
14 SRO Kadayampatty 3869
15 SRO Tharamangalam 8033
16 SRO Mecheri 6709
17 SRO Nangavalli 383
18 SRO Jalagandapuram 4700
19 SRO Mettur 3056
20 SRO Kolathur 2459
21 SRO Sankari 5726
22 SRO Magudanchavadi 8902
23 ISRO Idapady 6012
24 SRO Konganapuram 512
Source: District Registration Officers, Salem East and Salem West Divisions.

District Statistical Handbook 2015-16 Page 150
33.2. REGISTRATION AND AGGREGATE VALUE OF PROPERTIES TRANSFERRED
DURING THE YEAR (Rs.in crores)
Year: 2015-16
Number of Registration
(Moveable and
Immoveable)
Aggregate Value of Properties Transferred
(Rs in crores)
(Moveable and Immoveable )
Total Receipts
(Rs. In Lakhs)
1 2 3
111250 5317.66 217.29
Source: District Registration Officers, Salem East and Salem West Divisions
34. REPAIR AND SERVICE
34.1. AUTHORISED AUTOMOBILE REPAIR AND SERVICE STATIONS
Year: 2015-16
Name of the Block / Municipalities
Authorised Automobiles
Repair and Service (in No's.)
1 2
Salem 12
Veerapandy 2
Panamarathupatty 1
Ayothiyapattinam 6
Valapady 3
Yercaud 5
Attur 14
Pethanaickenpalayam 2
Gangavalli 6 Thalaivasal 3
Omalur 2
Kadayampatty 3
Tharamangalam 4
Mecheri 3
Nangavalli 3
Kolathur 5 Sankari 56
Magudanchavadi 3
Idappady 5
Konganapuram 23
Salem Corporation 54
Mettur Municipality 4
Idappady Municipality 2
Attur Municipality 12

District Statistical Handbook 2015-16 Page 151
34.2. AUTHORISED ELECTRICAL AND ELECTRONIC GOODS REPAIR AND
SERVICE UNITS
Year: 2015-16
Name of the Block / Municipalities Electrical and Electronic goods
Repair and Service Units (in No's)
1 2
Salem 32
Veerapandy 15
Panamarathupatty 1
Ayothiyapattinam 2
Valapady -
Yercaud 2
Attur 3
Pethanaickenpalayam --
Gangavalli 2
Thalaivasal -
Omalur 5
Kadayampatty --
Tharamangalam 12
Mecheri 4
Nangavalli 3
Kolathur 6
Sankari 8
Magudanchavadi 5
Idapady 3
Konganapuram 8
Salem Corporation 62
Attur Municipality 9
Mettur Municipality 5
Idapady Municipality 2

District Statistical Handbook 2015-16 Page 152
35. RESTAURANTS AND HOTELS
35.1. RESTAURANTS, CAFES AND OTHER EATING AND DRINKING PLACES
Year: 2015-16
Sl.Number Items Place
1 2 3
1. Restaurants 415
2. Cafes 752
3. Other Eating and Drinking
Centres
2928
Source: Concerned Office.
35.2. DETAILS OF HOTELS
Year: 2015-16
Sl.
Number
Place Name of the Hotels with
Lodging Facilities
Name of the Hotels
without Lodging
Facilities
1 2 3 4
Salem
National Hotel Annapoorna
Salem Castle Srilakshmi
Windsor Castle Lakshmi
L.R.N Excellency Chandra Café
Chenney‘s Gateway Sarathy
Maruthy Hotel Vysya Modern
Vasantha Vihar Malabar Hotel
Hema International Ashok
T.T.D.C K.V.Restaurent
A.K.Lodging Mangala Vilas
Dwarka Hotel Sivasakthi
Selvam Hotel Rukmani
Surya International Sai Vihar
Vasantham Hotel Sakthi
Ganesh Mahal Aryas
Hotel R.K. Saravana
Saravana Classic
Raja Ganapathy
Arul Hotel
Shanmuga Priya
Venkateshwara Hotel
Bombay Briyani
Parasakthi
Indhra Café
Sri Leka
Salem Café
Source: Concerned Office.

District Statistical Handbook 2015-16 Page 153
36. RECREATION AND CULTURAL SERVICES
36.1. LIST OF CINEMA THEATRES AND THEIR CAPACITIES 2015-16
Sl.
No
Name of the corpn./
municipality/block
Sl.number Name of the theatres Capacity
1.
SALEM CORPORATION
1. AD LABS KAILASH A.C 985
2. AD LABS PRAKASH A.C 947
3. SRI RAJESWARI 848
4. AD LABS KEERTHANA 904
5. AD LABS RAMANA 714
6. ALANGAR 1144
7. GEETHALAYA A.C 1158
8. ORIENTAL SAKTHI 573
9. SANGEETH A.C 890
10. SUPRAGEETH A.C 353
11. RAJ SABARI 843
12. AD LABS K.S.THEATRE
A.C 769
13. SARADAS 920
14. GOWRI A.C 788
15. JAYARAM 873
16. SARASWATHY 819
17. A.R.R S.MULTIPLEX –1 652
18. A.R.R.S MULTIPLEX –2 395
19. A.R.R S MULTIPLEX –3 395
20. A.R.R S MULTIPLEX –4 784
21. A.R.R S MULTIPLEX –5 784
22. JEYA 832
23. SREEMAN 920
24. PACHIAMMAN
654
2 ATTUR MUNICIPALITY
25. N.S. THEATRE 854
26. KESAVAN 852
27. VISWANATH 810
28. PADMALAYA 571
29. PRIYALAYA 412
3. METTUR MUNICIPALITY 30. KARPAGAM
601
31. LAKSHMI 586
4 EDAPADY
MUNICIPALITY
32. KALAI YARANGAM 659
33. DEVI
34. SRIKUMARAN
5 VEERAPANDI 35. CHANDRA,
ATTAIYAMPATTY 427

District Statistical Handbook 2015-16 Page 154
36.1. LIST OF CINEMA THEATRES AND THEIR CAPACITIES 2015-16
Sl.
No
Name of the corpn./
municipality/block
Sl.number Name of the theatres Capacity
36. K.V.P.,ELAMPILLAI 661
37. KANDAN, ELAMPILLAI 504
6 PANAMARATHUPATTY 38. SARASWATHY 319
39. DIVYA, KONDALAMPATTY 596
7 VALAPADY 40. MAHESWARI 409
8 GANGAVALLI
41. GOWRI,
THAMMAMPATTY 620
42. NATARAJA
THAMMAMPATTY 761
9 THALAIVASAL 43.
RUKMANI,
VEERAGANOOR 296
44. DHANALAKSHMI 120
10 OMALUR
45. BRINDAVANAM 505
46. THANGAM 267
12 THARAMANGALAM 47. AMMAN,
ALAGUSAMUDRAM 305
13 MECHERY 48. K.S. 257
49. LAVANYA 254
14 NANGAVALLI
50. SOWDAMBIKAI,
JALAKANDAPURAM 367
51. VELUMANI,
JALAKANDAPURAM 497
52. ABIRAMI,
JALAKANDAPURAM 713
53. BALASUBRAMANIYA
NANGAVALLI 410
54. MURUGAN 438
15 KOLATHUR 55. GOWRI 553
16 SANKARI
56. MURUGAN 389
57. KANDAN 321
58. SARAVANA 378
17
MAGUDANCHAVADI 59. NATARAJA
EDANGANASALAI -
Source: Joint Commissioner of Commercial Taxes, Salem

District Statistical Handbook 2015-16 Page 155
36.2. LIST OF CLUBS AND ASSOCIATIONS
Year: 2015-16
Sl. Number Place Name of the Club and Association
1
11
2 3
1
Salem
District Club, Salem
Salem Club, Salem
Cosmopolitan Club, Salem
City Club, Fairland‘s
Youth Club
Crescent Club
Penguin Club
Rotary
Literary Association
Revenue Club
Rotary Club
Lions Club
Jaycees Club
Windsor Club

District Statistical Handbook 2015-16 Page 156
36.3. SALEM FILM DISTRIBUTORS COUNCIL
Year: 2015-16
1 R.MURUGESAN FILM
DISTRIBUTOR 21 G.G.COMBINES
2 NEW FRIENDS FILM 22 M.M.PICTURES
3 SRI GANESH FILMS
CIRCUITS
23 SRI DEVIPRIYA FILMS
4 MAHA SRI BALAJI FILMS 24 STUDIO GREEN
5 DEEPA ENTERPRISES 25 M.SUBRAMANIAM FILMS
6 PRIYADHARSHINI FILMS 26 DEVI SRI MOOKAMBIKA
PICTURES
7 KANAGADARA PICTURES 27 A.V.M.LTD.
8 ANJANA CIRCUIT 28 MURUGALAYA FILMS
9 KARIKALAN PICTURES 29 SIVASAKTHI FILMS
10 SRI SARAVANA PICTURES 30 S.MAHALAKSHMI FILM
DISTRIBUTOR
11 OM MURUGA MOVIES 31 S.J.SHAJAGHAN FILM
DISTRIBUTOR
12 BARATHIRAJA FILMS 32 SRI RAJGANESH FILMS
13 SRI KAVERI COMBINES 33 SRI GANESHA MOVIES
14 OM PACHAIAMMAN
PICTURES
34 M.S.PALANISAMY FILM
DISTRIBUTOR
15 K.M.PICTURES 35 T.S.KRISHNAN FILM
DISTRIBUTOR
16 R.MAHALINGAM FILM
DISTRIBUTOR
36 MAHALAKSHMI
INTERNATIONAL
17 JOTHIMURUGAN PICTURES 37 KARPAGA VINAYAGAR FILMS
18 SRI LAKSHMI ENTERPRISES 38 BALAJI ENTERPRISES
19 VIJALAKSHMI FILMS 39 RAJAMANI ENTERPRISES
20 M.L.S.PICTURES 40 DHARANI FILMS
41 SRI NAVASAKTHIAMMAN
FILM
63 SRI IYYAPPAN FILMS
42 SAPTHAGIRI MOVIES 64 RAMKUMAR PICTURES

District Statistical Handbook 2015-16 Page 157
36.3. SALEM FILM DISTRIBUTORS COUNCIL
Year: 2015-16
43 SRI KANJANA PICTURES 65 SRI LAKSHMI SARASWATHY
FILMS
44 SRI PONKALIAMMAN ARTS 66 SUNDHARESHWARA FILMS
45 RATHNA PICTURS 67 SRI RAJESHWARI PICTURES
46 7G FILMS 68 SRI GANAPATHY VELA FILMS
47 SRI BALASUBRAMANIA
MOVIES
69 SRI KATHAIAMMAN FILMS
48 SRI OM MURUGA MOVIES 70 NEW TULSHI FILMS
49 SRI VASAVI ENTERPRISES 71 MANIRAJA PICTURES
50 SRI UMAIYAL FILMS 72 M.SELVARAJ FILM
DISTRIBUTOR
51 K.G.R. FILMS 73 THAI MOVIES
52 L.PANNEERSELVAM FILM
DISTRIBUTOR
74 J.S.K.FILMS
53 OM VINAYAGA FILMS 75 DHANDAYUTHAPANI FILMS
54 G.RAGUNATHAN FILMS 76 A.G.A.FILMS
55 SRI GIRIMURUGAN FILMS 77 SALEM RAMANATHAN
PICTURES
56 SRI B.A.K.COMBINES 78 VINAYAGA MOVIES
57 PRASANNA ENTERPRISES 79 THE APARNA FILMS
58 JAYA FILMS 80 ANUPRIYA FILMS
59 SRI ELUMALAIYAN
ENTERPRISES
81 SUSHMITHA FILMS
60 KUMARAGIRI MURUGAN
FILMS
82 SREE GUGANENTERPRISES
61 SRI JAYAM FILMS 83 K.B.COMBINES
62 LION MOVIES 84 UMA MAHESHWARI PICTURES
85 SRI DURGAI AMMAN
PICTURES
107 SRI NATARAJA FILMS
86 SRI GURU FILMS 108 SALEM SRI SARASWATHI FILMS
87 JAI RANGA MOVIES 109 SABARI MOVIES
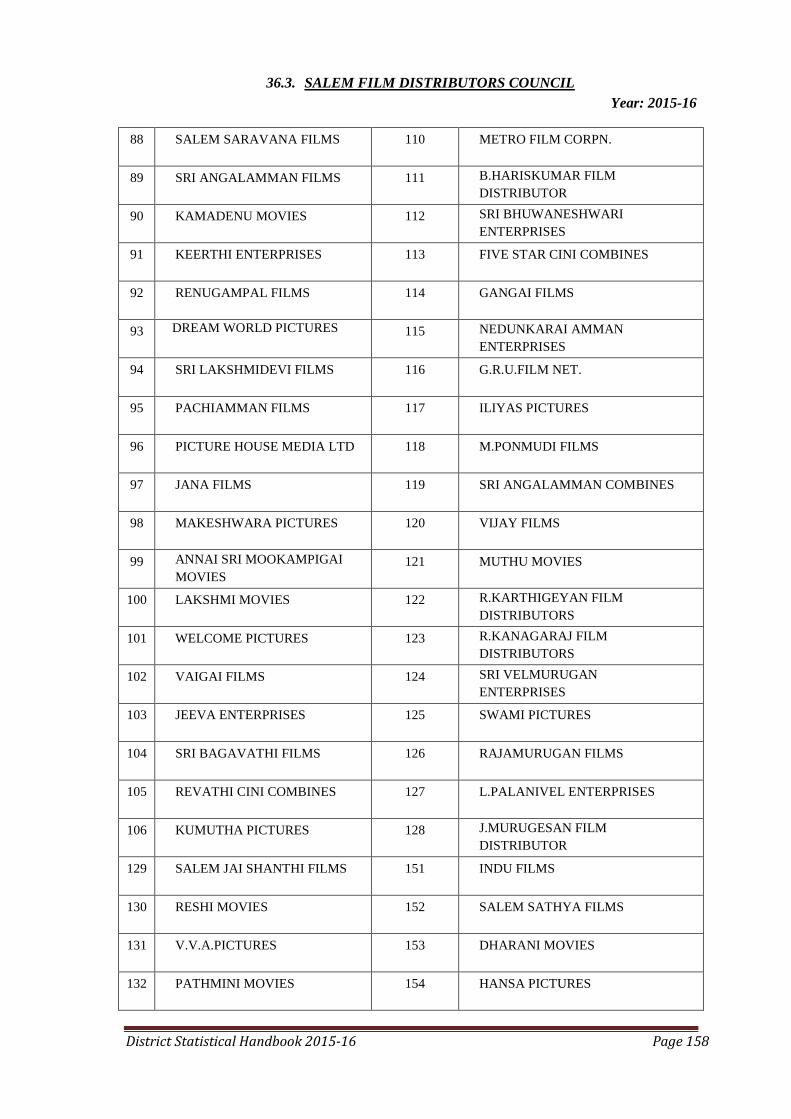
District Statistical Handbook 2015-16 Page 158
36.3. SALEM FILM DISTRIBUTORS COUNCIL
Year: 2015-16
88 SALEM SARAVANA FILMS 110 METRO FILM CORPN.
89 SRI ANGALAMMAN FILMS 111 B.HARISKUMAR FILM
DISTRIBUTOR
90 KAMADENU MOVIES 112 SRI BHUWANESHWARI
ENTERPRISES
91 KEERTHI ENTERPRISES 113 FIVE STAR CINI COMBINES
92 RENUGAMPAL FILMS 114 GANGAI FILMS
93 DREAM WORLD PICTURES 115 NEDUNKARAI AMMAN
ENTERPRISES
94 SRI LAKSHMIDEVI FILMS 116 G.R.U.FILM NET.
95 PACHIAMMAN FILMS 117 ILIYAS PICTURES
96 PICTURE HOUSE MEDIA LTD 118 M.PONMUDI FILMS
97 JANA FILMS 119 SRI ANGALAMMAN COMBINES
98 MAKESHWARA PICTURES 120 VIJAY FILMS
99 ANNAI SRI MOOKAMPIGAI
MOVIES
121 MUTHU MOVIES
100 LAKSHMI MOVIES 122 R.KARTHIGEYAN FILM
DISTRIBUTORS
101 WELCOME PICTURES 123 R.KANAGARAJ FILM
DISTRIBUTORS
102 VAIGAI FILMS 124 SRI VELMURUGAN
ENTERPRISES
103 JEEVA ENTERPRISES 125 SWAMI PICTURES
104 SRI BAGAVATHI FILMS 126 RAJAMURUGAN FILMS
105 REVATHI CINI COMBINES 127 L.PALANIVEL ENTERPRISES
106 KUMUTHA PICTURES 128 J.MURUGESAN FILM
DISTRIBUTOR
129 SALEM JAI SHANTHI FILMS 151 INDU FILMS
130 RESHI MOVIES 152 SALEM SATHYA FILMS
131 V.V.A.PICTURES 153 DHARANI MOVIES
132 PATHMINI MOVIES 154 HANSA PICTURES

District Statistical Handbook 2015-16 Page 159
36.3. SALEM FILM DISTRIBUTORS COUNCIL
Year: 2015-16
133 K.MURUGAN FILM
DISTRIBUTOR
155 SRI ANDAL FILMS
134 G.MATHIVANAN FILM
DISTRIBUTOR
156 V.S.B.FILMS
135 REGA MOVIES 157 B.MADESHWARAN FILM
DISTRIBUTOR
136 SRI LAKSHMI FILMS 158 MADESH FILM DISTRIBUTER
137 SIVASAKTHI PICTURES 159 MEKALA PICTURES
138 K.A.FILMS 160 SRI SOORYA MOVIES
139 VARALAKSHMI PICTURES 161 SATHYA MOVIES
140 MOHAN ENTERPRISES 162 SWARGACHITHRA
141 MANIKANDAN COMBINES 163 MEDIA DREAMS LTD.
142 SENTHILKUMAR PICTURES 164 ABIRAMI THEATRES PVT LTD
143 SABENA PICTURES 165 OSCAR FILMS
144 N.P.JAYARAMAN FILM
DISTRIBUTOR
166 SRI DENANDAL FILMS
145 RAHINI MOVIES 167 V.K.COMBAINES
146 SRI SAKTHI MARIAMMAN
FILMS
168 MANIMEKALA FILMS
147 VICTORY MOVIES 169 S.R.M .PICTURES
148 PRIMIER FILMS 170 SATHYANARAYANA FILMS
149 H.PEROSHGAN FILM
DISTRIBUTOR
171 SRI VENKATESHWARA
PICTURES
150 THILAGAVATHI FILMS 172 ABIRAMI CINI ARTS
173 SREE PERIYA NAIYAGI
AMMAN
FILMS
190 ARRS FILMS
174 SRI CHELLANDIAMMAN
FILMS
191 DROWPATHIAMMAN PICTURES
175 M.SENBHAGAMOORTHI
FILMS
DISTRIBUTER
192 KASTHURI FILM
176 SUGANTHI FILMS 193 PYRAMID MEERA THEATRE
PVT TD
177 ELLORA RELEASES 194 SREE AHDILAKHSMI PICTURES

District Statistical Handbook 2015-16 Page 160
36.3. SALEM FILM DISTRIBUTORS COUNCIL
Year: 2015-16
178 R.K.COMPAINES 195 G.R.GOLD FILMS
179 VISWAS FILMS (P)LTD 196 BARATHAN FILMS
180 VISSAS MEDIA 197 MIDVALLEY ENTERTAINMENT
LTD
181 THAILA MOVIES 198 KAVIN MOVIES
182 VIMAL MOVIES 199 FIVE STAR TRADING
183 RELIANCE BIG PICTURES 200 D.PICTURES
184 MURUGAN FILIMS 201 SUN PICTURES
185 KAN ‗S MEDIA
COMMUNICATIONS
202 V.C PICTURES
186 SUPPLEMENT INDIA 203 K.S PICTURES
187 D.C.R PICTURES 204 POORNIMA ENTERPRISES
188 SRI VETTRIVEL FILMS 205 MONIKA FILMS
189 NANDHINI FILMS 206 GEMINI INDUSTRIES &
IMAGING PVT. LTD
Source: Salem Film Distributors Council, 96 Cinema Nagar, Pallapatti, Salem-636009

District Statistical Handbook 2015-16 Page 161
37. SOCIAL WELFARE
37.1. PURATCHI THALAIVAR M.G.R. NUTRITIOUS MEALS PROGRAMME
CENTRES
Year: 2015-16
School sector Local Body Sector
Total Panchayat
Union
Municipal
Bodies
Corpo
ration
Panchayat
Union
Municipal
Bodies
Corpo
ration ICDS
1 2 3 4 5 6 7 9
1703 90 - -- -- --- - 1793
Source: P.A to Collector (NMP), Salem. And AD Panchayat (Rural), Salem
37.2. NUMBER OF BENEFICIARIES UNDER PURATCHI THALAIVAR M.G.R.
NUTRITIOUS MEALS PROGRAMME
Year: 2015-16
Number of Beneficiaries under age group
Total
2-4
5 to 9 10 to 14
Panchayat
Union
Municipal Bodies
/Corporation
Panchayat
Union
Municipal Bodies
/Corporation
1 2 3 4 5 6
- 104693 5403 107192 5151 222439
Source: P.A to Collector (NMP), Salem. Project Officer, ICDS- Salem
37.3. NUMBER OF BENEFICIARIES UNDER FREE SUPPLY OF TEXT BOOKS
AND UNIFORMS
Year: 2015-16
Sl.No
NAME OF THE
BLOCK/
MUNICIPALITY
Age group 6-14 (Standards I to VIII)
Uniforms Text Books
Boys Girls Boys Girls
1 2 3 4 5 6
1 D.E.O., Salem 30392 33358 32406 33758
2 D.E.O., Sankari
3 D.E.E.O., Salem
TOTAL
Source: DEEO Salem, DEOs Salem and Sankagiri
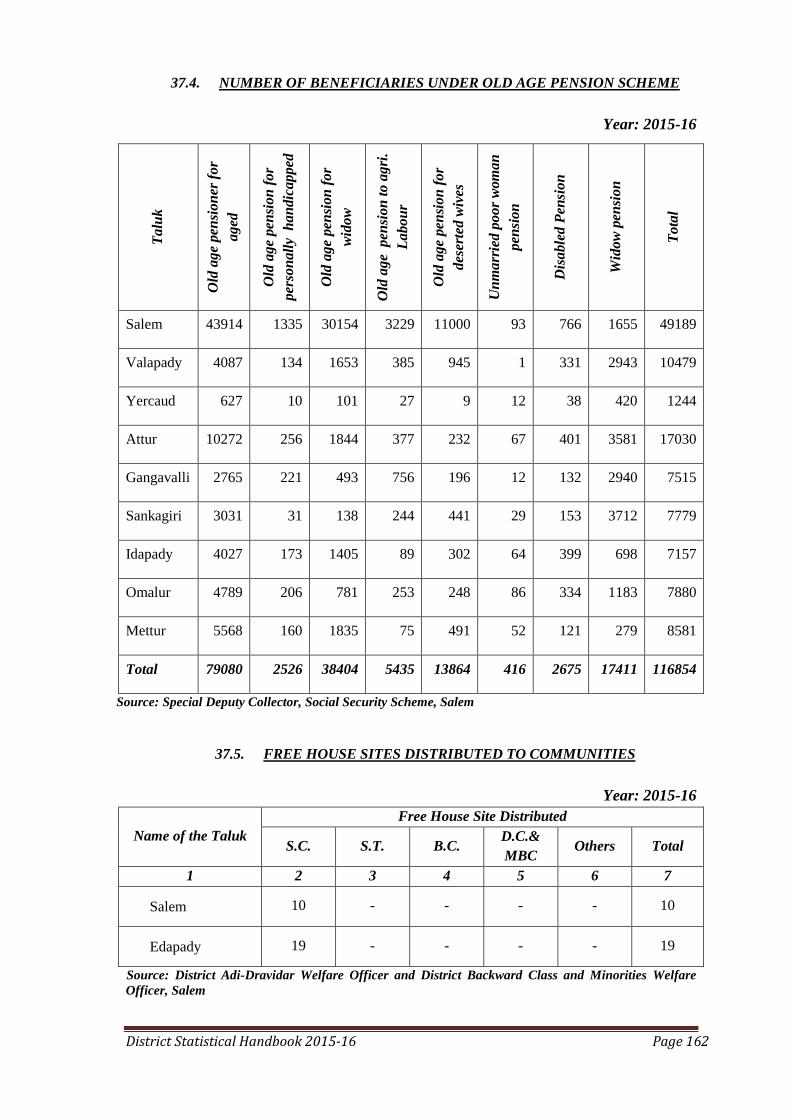
District Statistical Handbook 2015-16 Page 162
37.4. NUMBER OF BENEFICIARIES UNDER OLD AGE PENSION SCHEME
Year: 2015-16
Ta
luk
Old
ag
e pen
sio
ner
fo
r
ag
ed
Old
ag
e pen
sio
n f
or
per
son
all
y h
an
dic
ap
ped
Old
ag
e pen
sio
n f
or
wid
ow
Old
ag
e p
ensi
on
to
ag
ri.
La
bo
ur
Old
ag
e pen
sio
n f
or
des
erte
d w
ives
Un
ma
rrie
d p
oo
r w
om
an
pen
sio
n
Dis
able
d P
ensi
on
Wid
ow
pen
sio
n
To
tal
Salem 43914 1335 30154 3229 11000 93 766 1655 49189
Valapady 4087 134 1653 385 945 1 331 2943 10479
Yercaud 627 10 101 27 9 12 38 420 1244
Attur 10272 256 1844 377 232 67 401 3581 17030
Gangavalli 2765 221 493 756 196 12 132 2940 7515
Sankagiri 3031 31 138 244 441 29 153 3712 7779
Idapady 4027 173 1405 89 302 64 399 698 7157
Omalur 4789 206 781 253 248 86 334 1183 7880
Mettur 5568 160 1835 75 491 52 121 279 8581
Total 79080 2526 38404 5435 13864 416 2675 17411 116854
Source: Special Deputy Collector, Social Security Scheme, Salem
37.5. FREE HOUSE SITES DISTRIBUTED TO COMMUNITIES
Year: 2015-16
Name of the Taluk
Free House Site Distributed
S.C. S.T. B.C. D.C.&
MBC Others Total
1 2 3 4 5 6 7
Salem 10 - - - - 10
Edapady 19 - - - - 19
Source: District Adi-Dravidar Welfare Officer and District Backward Class and Minorities Welfare
Officer, Salem

District Statistical Handbook 2015-16 Page 163
37.6. IMPLEMENTATION OF RELIEF MEASURES AND PENSION SCHEMES
Year: 2015-16
Serial
No
Name of then Scheme / Relief
Measures
No of Beneficiaries
Total
Amount
Disbursed
(Rs in
“000”) SC ST Others Total
1 2 3 4 5 6 7
1. Nalinthaar Nala Thittam 58 2 132 192 1920
2. Accidental relief for workers (death at
the time of work)
- - - - -
3. Freedom fighters pension scheme
a)State Government
- - - - -
b)Central Government - - - - -
c)State& Central Government - - - - -
4. C.M.‘s Relief Fund - - - - -
i)Road Accidents - - - - -
ii)Riot Victim - - 30 30 3000
iii)Others(Specify) - - 5 5 1450
5. Mozhi Kavalar Pension Scheme - - - - -
6. Nalintha Kalaignar Pension Scheme - - - - -
7. Others if any
(Specify)Dr.Muthulashmi Reddy
Maternity Benefit Scheme
Source: PA (G) to Collector, Salem, DD Health Services and Family Welfare, Salem

District Statistical Handbook 2015-16 Page 164
38. SANITARY SERVICES
38.1. NUMBER OF SANITARY WORKERS ENGAGED IN SANITATION, GARBAGE,
AND SEWAGE DISPOSAL AND OTHER PARTICULARS
Year: 2015-16
Sl.No
Corporation/Municipality/
Town Panchayats/ Village
Panchayats
Number of
Workers
engaged in
Sanitation
Number of
Garbage and
Sewage disposal
Other
connected
workers related
with sanitation
1 2 3 4 5
Total 2862 253 71
Source: Concerned Departments
38.2. NUMBER OF VEHICLES ENGAGED IN SANITARY SERVICES
Year: 2015-16
Sl. Number
1.
Name of the Block /Municipality
2.
Number of vehicles engaged in
Sanitary Services
1 2 3
1 Village Panchayats 54
2 Town Panchayats 901
3 Salem corporation 63
4 Attur municipality 8
5 Mettur municipality 9
6 Idapady municipality 8
7 Narasingapuram Municipality 2
Source: Concerned Local Bodies, Salem District
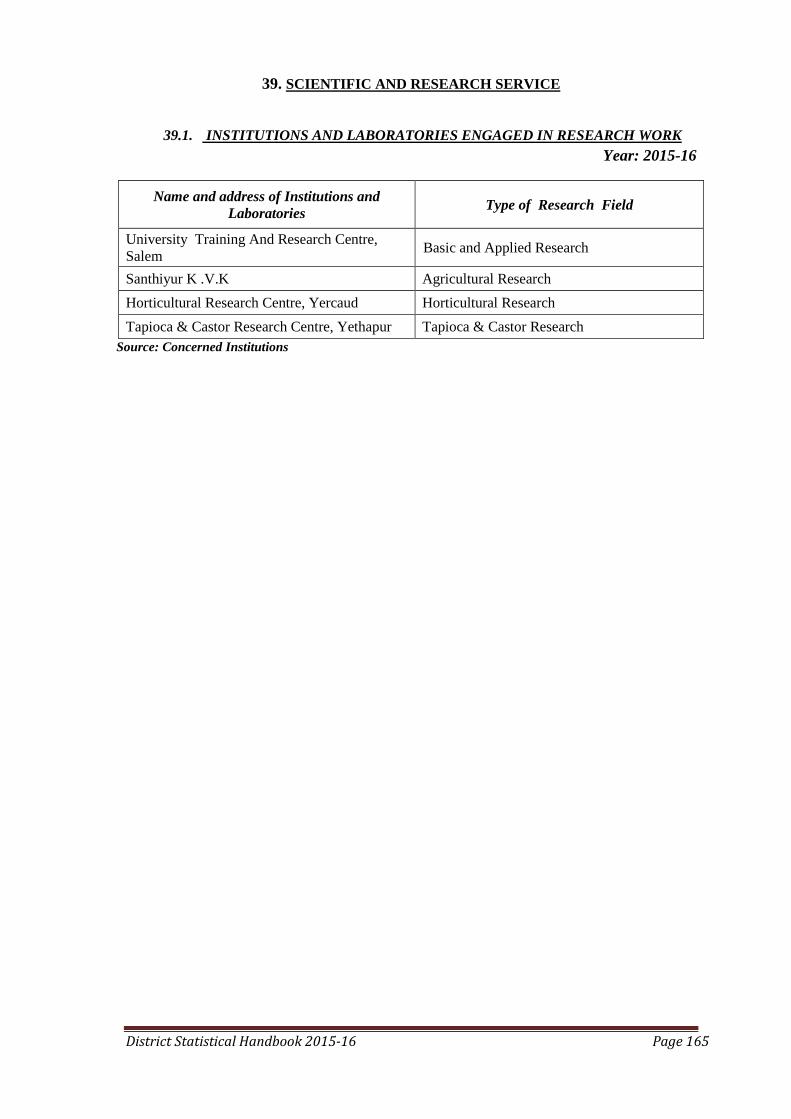
District Statistical Handbook 2015-16 Page 165
39. SCIENTIFIC AND RESEARCH SERVICE
39.1. INSTITUTIONS AND LABORATORIES ENGAGED IN RESEARCH WORK
Year: 2015-16
Name and address of Institutions and
Laboratories Type of Research Field
University Training And Research Centre,
Salem Basic and Applied Research
Santhiyur K .V.K Agricultural Research
Horticultural Research Centre, Yercaud Horticultural Research
Tapioca & Castor Research Centre, Yethapur Tapioca & Castor Research
Source: Concerned Institutions

District Statistical Handbook 2015-16 Page 166
40. STORAGE FACILITIES
40.1. LIST OF AGRICULTURAL AND NON-AGRICULTURAL STORAGE
GODOWNS
Year: 2015-16
Name and address of
Agricultural Godowns
Name of address of
Non-Agricultural Godowns
Government Sub Agriculture Extension Centre
Assistant Director of Agriculture, Agriculture
Extension Centre, Seelanaickenpatti, Salem
Assistant Director of Agriculture, Agriculture
Extension Centre, Panchayat Union office,
Veerapandi Sub Agriculture Extension Centre, Sithar Kovil
Assistant Director of Agriculture,
Panamarathupatti
Assistant Director of Agriculture, Agriculture
Extension Centre, Panchayat Union office,
Ayothiapattinam
Assistant Director of Agriculture, Agriculture
Extension Centre, Panchayat Union office,
Valapady
Assistant Director of Agriculture, Agriculture
Extension Centre, Panchayat Union office,
Yercuad
Assistant Director of Agriculture, Agriculture
Extension Centre, Panchayat Union office,
Attur Sub Agriculture Extension Centre, Mallikarai
Assistant Director of Agriculture, Agriculture
Extension Centre, Panchayat Union office,
P.N.Palayam
Sub Agriculture Extension Centre,
Karumandurai
Assistant Director of Agriculture, Agriculture
Extension Centre, Panchayat Union office,
Gangavalli
Sub Agriculture Extension Centre,
Thammampatti
Assistant Director of Agriculture, Agriculture
Extension Centre, Panchayat Union office,
Thalaivasal Sub Agriculture Extension Centre, Veeraganur
Assistant Director of Agriculture, Agriculture
Extension Centre, Panchayat Union office,
Sangakiri Sub Agriculture Extension Centre, Thevur
Assistant Director of Agriculture, Agriculture
Extension Centre, Panchayat Union office,
Magudanchavadi
Assistant Director of Agriculture, Agriculture
Extension Centre, Panchayat Union office,
Edapadi Sub Agriculture Extension Centre, Poolampatti
Assistant Director of Agriculture, Agriculture

District Statistical Handbook 2015-16 Page 167
Name and address of
Agricultural Godowns
Name of address of
Non-Agricultural Godowns
Government Sub Agriculture Extension Centre
Extension Centre, Panchayat Union office,
Konganapuram
Assistant Director of Agriculture, Agriculture
Extension Centre, Panchayat Union office,
Kolathur Sub Agriculture Extension Centre, Kaveri Cross
Assistant Director of Agriculture, Agriculture
Extension Centre, Panchayat Union office,
Mecheri Sub Agriculture Extension Centre, Vellar.
Assistant Director of Agriculture, Agriculture
Extension Centre, Panchayat Union office,
Nangavalli
Sub Agriculture Extension Centre,
Jalakantapuram
Assistant Director of Agriculture, Agriculture
Extension Centre, Panchayat Union office,
Omalur Sub Agriculture Extension Centre, Karuppur
Assistant Director of Agriculture, Agriculture
Extension Centre, Panchayat Union office,
Tharamangalam
Assistant Director of Agriculture, Agriculture
Extension Centre, Panchayat Union office,
Kadayampatti
Source: D.D.Agricultural Marketing, Salem, Warehousing Corporation, Salem, T.N.C.S.C, Salem and
J.D. Agriculture, Salem

District Statistical Handbook 2015-16 Page 168
40.2. LIST OF COLD STORAGE AND GODOWNS
Year: 2015-16
Sl.Number Name and address of the cold storage
1 2
1 Selvi Cold Storage, Kakapalayam, Sankagiri Taluk
2 Sri Krishna Cold Storage, 10/5, Paranattamangalam main road, Salem.
3. Tomato cold storage, Mecheri
4. Uzhava sandai- Suramangalam, Dadhagapatti, Ammapet, Attur, Hasathampatti.
5. Drying yard- Ramanaickenpalayam, Kallanatham, Abinavam, Deviyakurichi,
Veeragoundanoor, Aragalur, Singipuram, Panamadal, and Kalpaganurand Olapadi.
Source: D.D. Agricultural Marketing, Salem
Sl
No
Name and address of the
cold storage unit with
telephone No
Year of
establishment/Total
cost in Lakhs
Type/Product
stored
Rent charged
for cold storage
(Rs/month) for
different
products.
1 Tomoto cold storage ,
Mecheri
2011/100.000 Tomoto,Fruits
and Vegitables
Tomoto and
vegitables
Rs 150 per
quintal
2 Uzhavar Santhai
Suramangalam 0427-
2460877
2009/6.000
Vegitables,
Fruits ,Greens
and Flowers
Nil
3 Uzhavar Santhai
Suramangalam 0427-
2460877
2009/6.000
Nil
4 Uzhavar Santhai
Suramangalam 0427-
2460877
2009/6.000
Nil
5 Uzhavar Santhai
Suramangalam 0427-
2460877
2009/6.000
Nil
6 Uzhavar Santhai
Suramangalam 0427-
2460877
2009/6.000
Nil
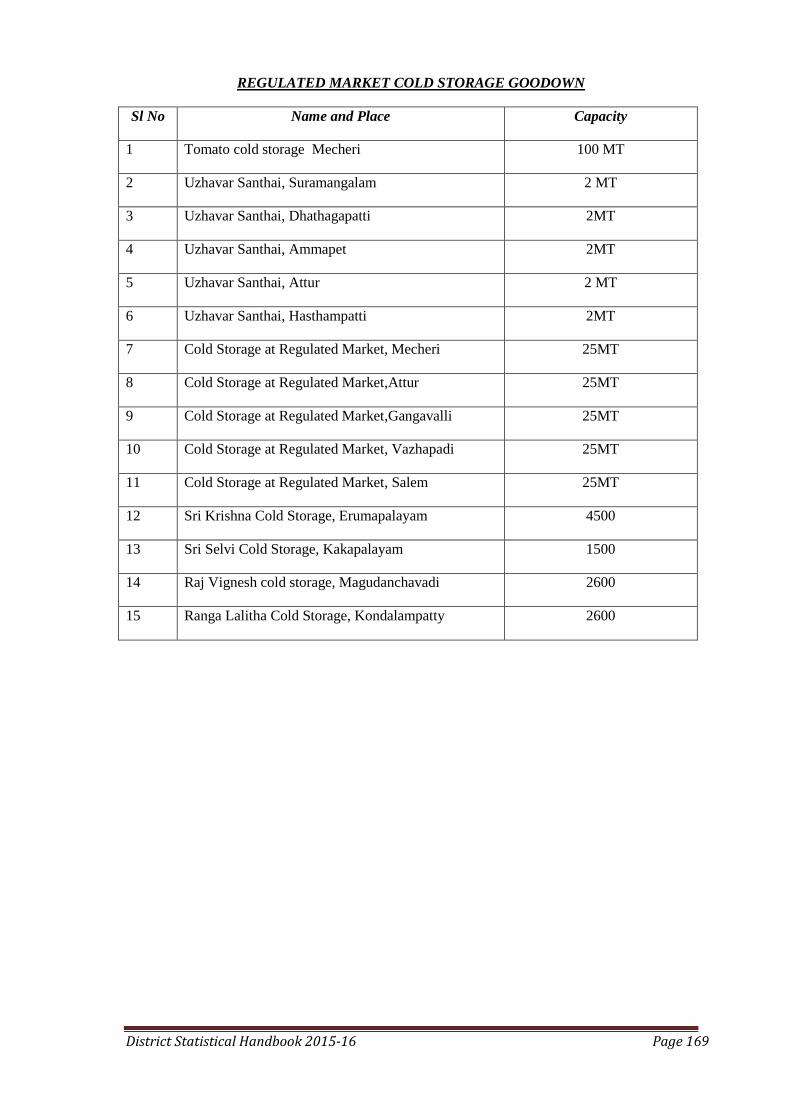
District Statistical Handbook 2015-16 Page 169
REGULATED MARKET COLD STORAGE GOODOWN
Sl No Name and Place Capacity
1 Tomato cold storage Mecheri 100 MT
2 Uzhavar Santhai, Suramangalam 2 MT
3 Uzhavar Santhai, Dhathagapatti 2MT
4 Uzhavar Santhai, Ammapet 2MT
5 Uzhavar Santhai, Attur 2 MT
6 Uzhavar Santhai, Hasthampatti 2MT
7 Cold Storage at Regulated Market, Mecheri 25MT
8 Cold Storage at Regulated Market,Attur 25MT
9 Cold Storage at Regulated Market,Gangavalli 25MT
10 Cold Storage at Regulated Market, Vazhapadi 25MT
11 Cold Storage at Regulated Market, Salem 25MT
12 Sri Krishna Cold Storage, Erumapalayam 4500
13 Sri Selvi Cold Storage, Kakapalayam 1500
14 Raj Vignesh cold storage, Magudanchavadi 2600
15 Ranga Lalitha Cold Storage, Kondalampatty 2600
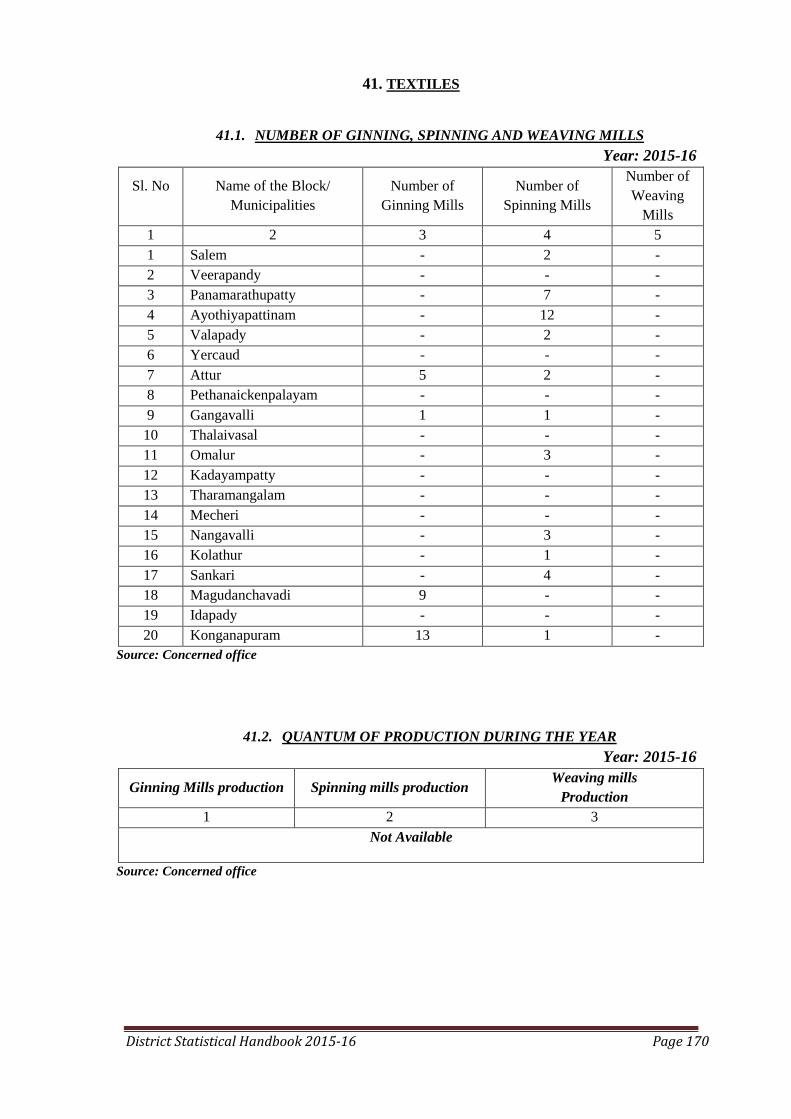
District Statistical Handbook 2015-16 Page 170
41. TEXTILES
41.1. NUMBER OF GINNING, SPINNING AND WEAVING MILLS
Year: 2015-16
Sl. No
Name of the Block/
Municipalities
Number of
Ginning Mills
Number of
Spinning Mills
Number of
Weaving
Mills
1 2 3 4 5
1 Salem - 2 -
2 Veerapandy - - -
3 Panamarathupatty - 7 -
4 Ayothiyapattinam - 12 -
5 Valapady - 2 -
6 Yercaud - - -
7 Attur 5 2 -
8 Pethanaickenpalayam - - -
9 Gangavalli 1 1 -
10 Thalaivasal - - -
11 Omalur - 3 -
12 Kadayampatty - - -
13 Tharamangalam - - -
14 Mecheri - - -
15 Nangavalli - 3 -
16 Kolathur - 1 -
17 Sankari - 4 -
18 Magudanchavadi 9 - -
19 Idapady - - -
20 Konganapuram 13 1 -
Source: Concerned office
41.2. QUANTUM OF PRODUCTION DURING THE YEAR
Year: 2015-16
Ginning Mills production Spinning mills production Weaving mills
Production
1 2 3
Not Available
Source: Concerned office

District Statistical Handbook 2015-16 Page 171
42. TRADE AND COMMERCE
42.1. NUMBER OF MAJOR AND MINOR TRADE AND COMMERCIAL ESTATE
Year: 2015-16
Number of major Trade
Number of minor Trade
Number of Commercial estate
1 2 3
1205 285 Nil
Source: Secretary, Market Committee, Uthamacholapuram.Salem District
43. TRASPORT
43.1. LENGTH OF ROADS (IN KILOMETRES)
Year: 2015-16
Block/ Corporation/
Municipality/
Panchayat Union
Surfaced Roads Un-
surfaced
Roads
Grand
Total Cement
Concrete
Bitu
minous
Water
Bound
Macadam
Total
1 2 3 4 5 6 7
Panchayat Union &
Panchayat Roads 58.590 45.370 0.000 103.960 0.000 103.960
Salem Corporation 63.540 747.150 12.380 823.070 25.560 848.630
Athur Municipality 23.987 44.506 7.274 76.467 1.906 77.673
Narasingapuram
Municipality 8.551 19.060 9.000 36.611 28.409 65.020
Mettur Municipality 14.179 69.711 -- 83.890 0.916 84.806
Edappady
Municipality 22.065 56.150 0.000 78.515 27.540 105.755
Rural Roads
(Nabard) XXI 0.000 18.135 0.000 18.135 0.000 18.135
National High Ways 182.600 182.600 182.600
State High Ways 0.000 1225.427 0.000 1225.427 0.000 1225.427
Town Panchayats
(33) 285.828 562.981 95.373 944.182 190.058 1134.240
Forest Roads 0.0 4.50 26.420 30.92 55.065 85.985
Total 1046.968 8663.995 1684.176 11395.139 2225.328 13620.467
Source: Respective District Heads of Departments
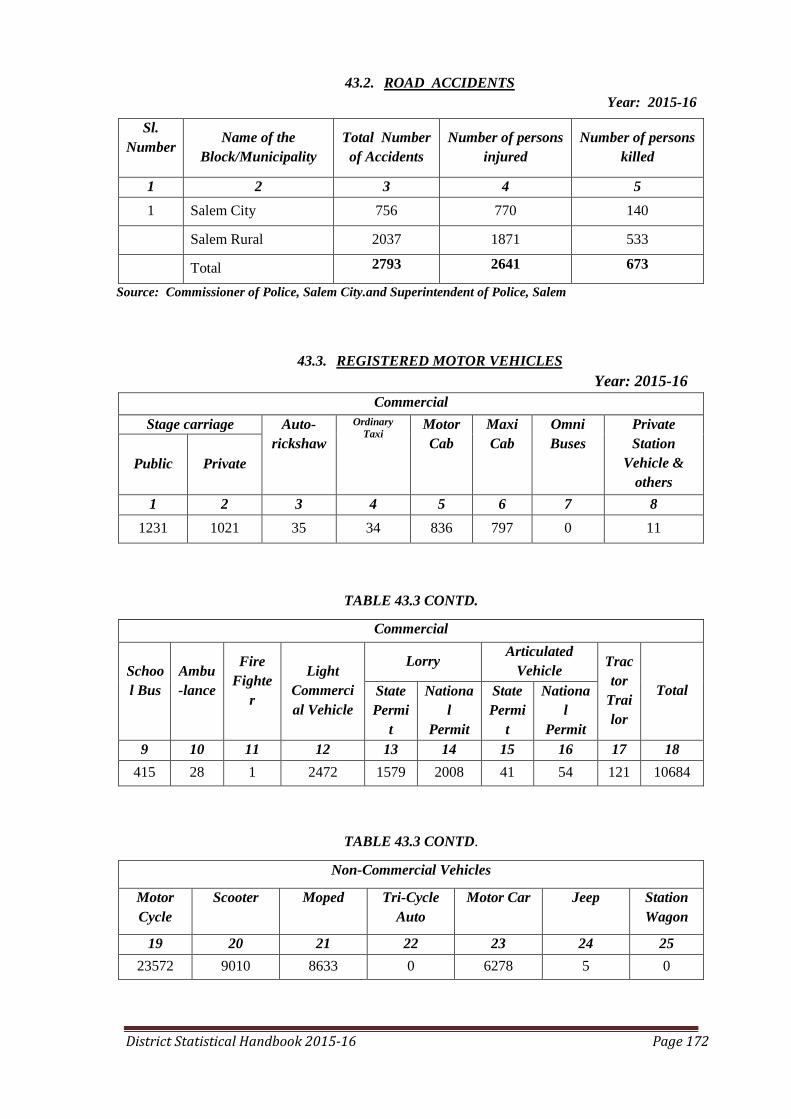
District Statistical Handbook 2015-16 Page 172
43.2. ROAD ACCIDENTS
Year: 2015-16
Sl.
Number
Name of the
Block/Municipality
Total Number
of Accidents
Number of persons
injured
Number of persons
killed
1 2 3 4 5
1 Salem City 756 770 140
Salem Rural 2037 1871 533
Total 2793 2641 673
Source: Commissioner of Police, Salem City.and Superintendent of Police, Salem
43.3. REGISTERED MOTOR VEHICLES
Year: 2015-16
Commercial
Stage carriage Auto-
rickshaw
Ordinary
Taxi
Motor
Cab
Maxi
Cab
Omni
Buses
Private
Station
Vehicle &
others
Public Private
1 2 3 4 5 6 7 8
1231 1021 35 34 836 797 0 11
TABLE 43.3 CONTD.
Commercial
Schoo
l Bus
Ambu
-lance
Fire
Fighte
r
Light
Commerci
al Vehicle
Lorry Articulated
Vehicle Trac
tor
Trai
lor
Total State
Permi
t
Nationa
l
Permit
State
Permi
t
Nationa
l
Permit
9 10 11 12 13 14 15 16 17 18
415 28 1 2472 1579 2008 41 54 121 10684
TABLE 43.3 CONTD.
Non-Commercial Vehicles
Motor
Cycle
Scooter
Moped
Tri-Cycle
Auto
Motor Car
Jeep
Station
Wagon
19 20 21 22 23 24 25
23572 9010 8633 0 6278 5 0
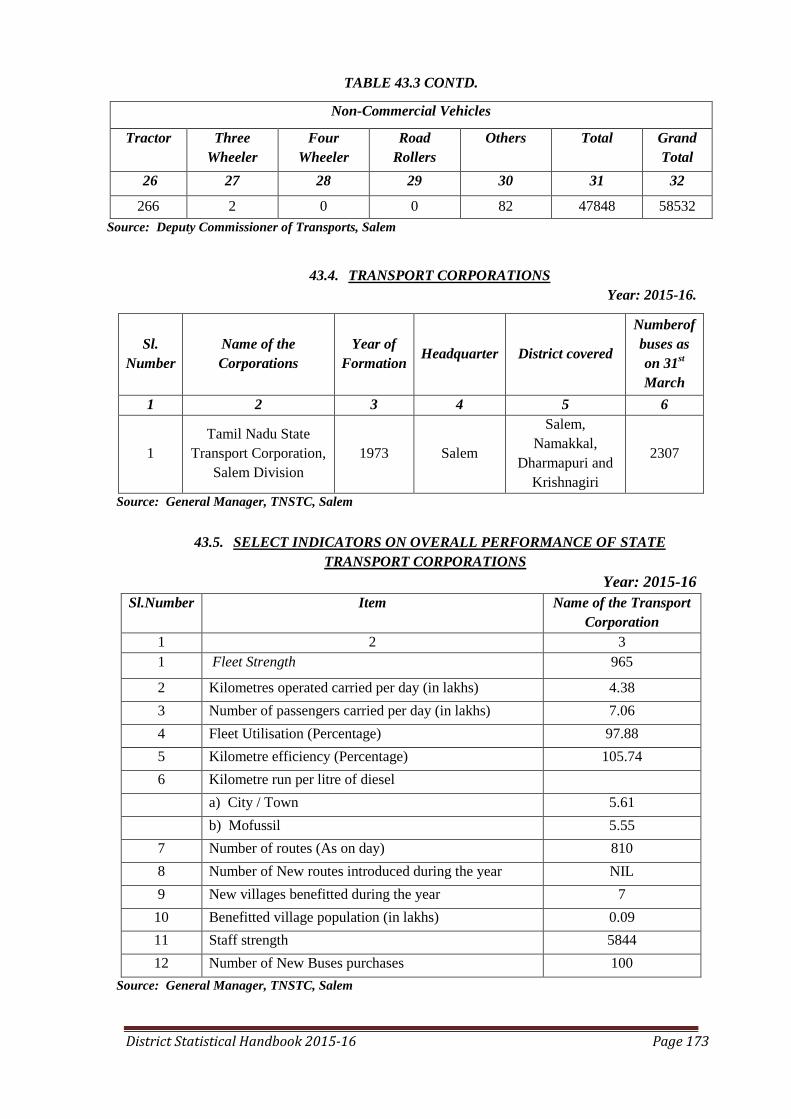
District Statistical Handbook 2015-16 Page 173
TABLE 43.3 CONTD.
Non-Commercial Vehicles
Tractor
Three
Wheeler
Four
Wheeler
Road
Rollers
Others
Total
Grand
Total
26 27 28 29 30 31 32
266 2 0 0 82 47848 58532
Source: Deputy Commissioner of Transports, Salem
43.4. TRANSPORT CORPORATIONS
Year: 2015-16.
Sl.
Number
Name of the
Corporations
Year of
Formation Headquarter District covered
Numberof
buses as
on 31st
March
1 2 3 4 5 6
1
Tamil Nadu State
Transport Corporation,
Salem Division
1973 Salem
Salem,
Namakkal,
Dharmapuri and
Krishnagiri
2307
Source: General Manager, TNSTC, Salem
43.5. SELECT INDICATORS ON OVERALL PERFORMANCE OF STATE
TRANSPORT CORPORATIONS
Year: 2015-16
Sl.Number
Item
Name of the Transport
Corporation
1 2 3
1 Fleet Strength 965
2 Kilometres operated carried per day (in lakhs) 4.38
3 Number of passengers carried per day (in lakhs) 7.06
4 Fleet Utilisation (Percentage) 97.88
5 Kilometre efficiency (Percentage) 105.74
6 Kilometre run per litre of diesel
a) City / Town 5.61
b) Mofussil 5.55
7 Number of routes (As on day) 810
8 Number of New routes introduced during the year NIL
9 New villages benefitted during the year 7
10 Benefitted village population (in lakhs) 0.09
11 Staff strength 5844
12 Number of New Buses purchases 100
Source: General Manager, TNSTC, Salem

District Statistical Handbook 2015-16 Page 174
43.6. RAILWAY LINES AND STATIONS
Year: 2015-16
Item Broad
Guage Meter Gauge
Broad Gauge &
Meter Guage
1 2 3 4
1. Route Length (in Km.) 795 63 858
2. Track Length (in Km.) 1088 63 1151
3. Number of Railway Stations 81 - 81
Source: Southern Railway, Salem.
43.2 PORT DEVELOPMENT
Year: 2015-16
1 Major Ports Nil
2 Intermediate ports Nil
3 Minor ports Nil
4 Vessels entered and Cargo handled Nil
43.2 AIRPORTS
Year: 2015-16
Sl.
Number Airport
Passengers (in „000‟)
Embarked Disembarked Transit Total
1 2 3 4 5 6
1. INTERNATIONAL
AIRPORT, MADRAS
a) International Nil
b) Domestic Nil
2. DOMESTIC AIRPORT Not Available
a) Madras
b) Coimbatore
c) Madurai
d) Tiruchirappalli
e) Salem Not Available
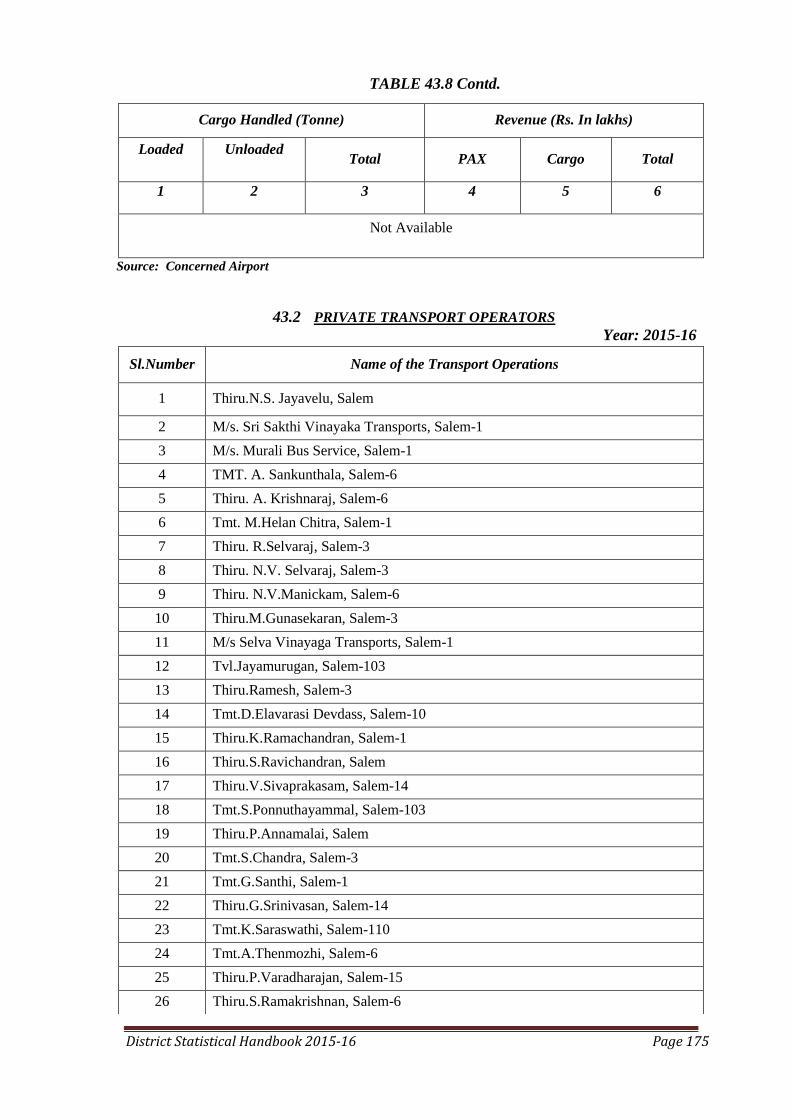
District Statistical Handbook 2015-16 Page 175
TABLE 43.8 Contd.
Cargo Handled (Tonne) Revenue (Rs. In lakhs)
Loaded
Unloaded
Total PAX Cargo Total
1 2 3 4 5 6
Not Available
Source: Concerned Airport
43.2 PRIVATE TRANSPORT OPERATORS
Year: 2015-16
Sl.Number Name of the Transport Operations
1 Thiru.N.S. Jayavelu, Salem
2 M/s. Sri Sakthi Vinayaka Transports, Salem-1
3 M/s. Murali Bus Service, Salem-1
4 TMT. A. Sankunthala, Salem-6
5 Thiru. A. Krishnaraj, Salem-6
6 Tmt. M.Helan Chitra, Salem-1
7 Thiru. R.Selvaraj, Salem-3
8 Thiru. N.V. Selvaraj, Salem-3
9 Thiru. N.V.Manickam, Salem-6
10 Thiru.M.Gunasekaran, Salem-3
11 M/s Selva Vinayaga Transports, Salem-1
12 Tvl.Jayamurugan, Salem-103
13 Thiru.Ramesh, Salem-3
14 Tmt.D.Elavarasi Devdass, Salem-10
15 Thiru.K.Ramachandran, Salem-1
16 Thiru.S.Ravichandran, Salem
17 Thiru.V.Sivaprakasam, Salem-14
18 Tmt.S.Ponnuthayammal, Salem-103
19 Thiru.P.Annamalai, Salem
20 Tmt.S.Chandra, Salem-3
21 Tmt.G.Santhi, Salem-1
22 Thiru.G.Srinivasan, Salem-14
23 Tmt.K.Saraswathi, Salem-110
24 Tmt.A.Thenmozhi, Salem-6
25 Thiru.P.Varadharajan, Salem-15
26 Thiru.S.Ramakrishnan, Salem-6
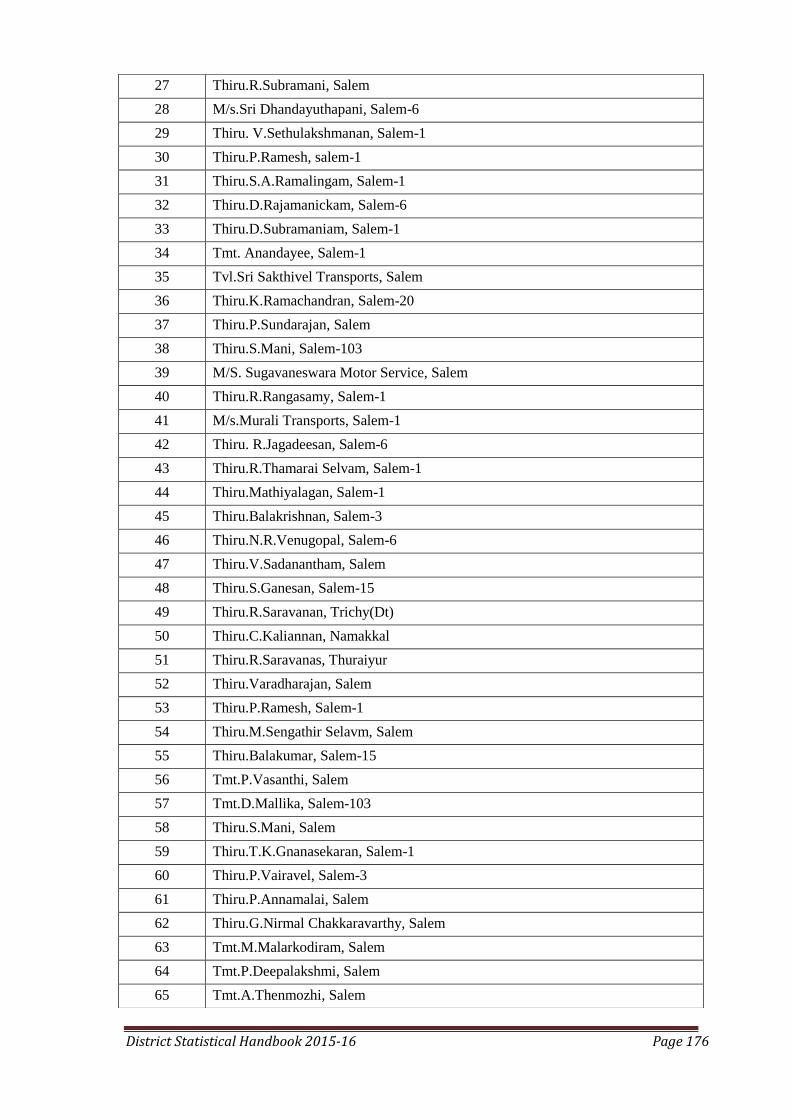
District Statistical Handbook 2015-16 Page 176
27 Thiru.R.Subramani, Salem
28 M/s.Sri Dhandayuthapani, Salem-6
29 Thiru. V.Sethulakshmanan, Salem-1
30 Thiru.P.Ramesh, salem-1
31 Thiru.S.A.Ramalingam, Salem-1
32 Thiru.D.Rajamanickam, Salem-6
33 Thiru.D.Subramaniam, Salem-1
34 Tmt. Anandayee, Salem-1
35 Tvl.Sri Sakthivel Transports, Salem
36 Thiru.K.Ramachandran, Salem-20
37 Thiru.P.Sundarajan, Salem
38 Thiru.S.Mani, Salem-103
39 M/S. Sugavaneswara Motor Service, Salem
40 Thiru.R.Rangasamy, Salem-1
41 M/s.Murali Transports, Salem-1
42 Thiru. R.Jagadeesan, Salem-6
43 Thiru.R.Thamarai Selvam, Salem-1
44 Thiru.Mathiyalagan, Salem-1
45 Thiru.Balakrishnan, Salem-3
46 Thiru.N.R.Venugopal, Salem-6
47 Thiru.V.Sadanantham, Salem
48 Thiru.S.Ganesan, Salem-15
49 Thiru.R.Saravanan, Trichy(Dt)
50 Thiru.C.Kaliannan, Namakkal
51 Thiru.R.Saravanas, Thuraiyur
52 Thiru.Varadharajan, Salem
53 Thiru.P.Ramesh, Salem-1
54 Thiru.M.Sengathir Selavm, Salem
55 Thiru.Balakumar, Salem-15
56 Tmt.P.Vasanthi, Salem
57 Tmt.D.Mallika, Salem-103
58 Thiru.S.Mani, Salem
59 Thiru.T.K.Gnanasekaran, Salem-1
60 Thiru.P.Vairavel, Salem-3
61 Thiru.P.Annamalai, Salem
62 Thiru.G.Nirmal Chakkaravarthy, Salem
63 Tmt.M.Malarkodiram, Salem
64 Tmt.P.Deepalakshmi, Salem
65 Tmt.A.Thenmozhi, Salem

District Statistical Handbook 2015-16 Page 177
66 Thiru.M.Kandasamy, Salem-103
67 R.Jayalakshmi Transport
68 R.Gopal
69 R.Kanchana Prof: Aravind Transport
70 M.Ramesh
71 SNB Transport
72 VRS Transport
73 Swarnambigai Transport
74 Jayaprakash Transport
75 N.Govindaraj
76 Rainbow Motor Service
77 NT Bus Service
78 Sri Lakshmi Bus Service
79 Jayalakshmi Transports
80 R.Somanathan
81 Ramavilas Bus Service
82 S.Adhilakshmi
83 P.Balan Babu
84 A.Ravindran Prop: Aravind Bus Service
85 Selvam Bus Service
86 S.Natarajan
87 LRN Roadways
88 LRN Bus Services(P) Ltd
89 M.Narayanana
90 A.Ayyapparaj
91 K.M.Brothers Transports
92 N.Muthu Gounder
93 K.Malarvizhi
94 Jayashree Bus Service
95 Vijay Venkatesan.s
96 S.Uma propx: Ramavilas Bus Service
97 SMBS Bus Service
98 R.Natarajan
99 N.Sivabakkiam
100 Rangamani Transport
101 PRP Bus Service
102 P.R.Rajendran
103 Balaji Bus Service
104 K.Pannerselvam

District Statistical Handbook 2015-16 Page 178
105 S.Saravanan
106 K.Ramasamy Prop: Ramavilas Bus Service
107 Kannan Bus Service
108 Sri Bhagiyalakshmi Transport
109 T.Krishnaveni
110 N.R.Venugopal
111 Ramani Bus service
112 M.Subramani
113 V.P.Palanisamy
114 N.Premavathi, Prop: SNB transport
115 MKS Bus Service
116 Saraswathi Bus service
117 P.R.Selvi
118 SNB Road & Company
119 I.Dhanam
120 Selvam Bus Service
121 KRSC Bus Service
122 K.Selvaraj
123 V.Natesan
124 D.Yuvaraj
125 E.Jayaraj
126 Duraisamy.S
127 Rainbow Roadways
128 R.Dhanraj
129 Neela Motor Service
130 S.Perumayeeammal Propx: Ramani Bus Ervice
131 Rajaganapathi Transports
132 Vasantha Viswanathan Prop: Ramani Bus Service
133 A.S.Balkrishnan
134 D.Premalatha
135 K.Palaniappan
136 K.Parvatham
137 C.Manivasagam
138 C.Thangavel
139 S.Sulochana LRN Roadways
140 P.Subramaniam
141 ABT Bus Service
142 VRS Bus Service
143 K.Kumar

District Statistical Handbook 2015-16 Page 179
144 PRS Bus Service
145 T.N.Ramesh
146 C.Karuppanna Prop: Kannan Bus Service
147 K.Rajagopal
148 K.S.Kandhaiyan
149 Giridharan
150 P.Kumaresan
151 Sweetha Bus service
152 KRP Transports
153 MF Zaheer Hussain
154 N.Govindaraj
155 D.Selvamani
156 S.G.R.Sridharan
157 M.Narayanan
158 K.Vikram
159 K.Palaniappa Gounder
160 S.Dhanasekaran Prop:Sugavaneswara Transports
161 S.Sukumar (N.S. Roadline)
162 Arul Murugan Transport
163 P.Indrajith
164 C.Devaraju
165 K.Balasubramani
166 K.Valliammal
167 S.Natarajan
168 Sumathi Jagadesan
169 S.Karthikeyan
170 K.R.VijayaKumar
171 T.Usharani
172 Sugavaneswari Transport
173 S.Alfred Swaminathan
174 R.Ravi
175 A.Rajendran
176 K.Palanisamy
177 Senthil Bus Service
178 Muniappan
179 G.Ambiga
180 R.Prakaran
181 P.Balasubramanian
182 Rakkiappan
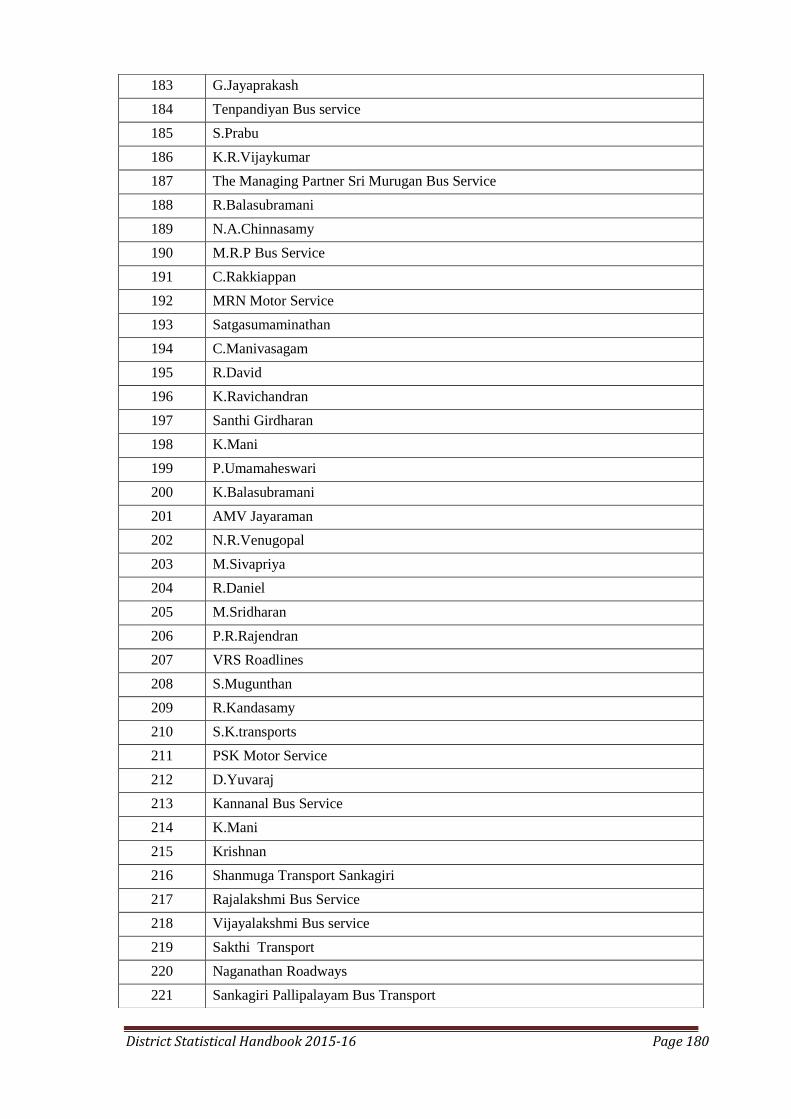
District Statistical Handbook 2015-16 Page 180
183 G.Jayaprakash
184 Tenpandiyan Bus service
185 S.Prabu
186 K.R.Vijaykumar
187 The Managing Partner Sri Murugan Bus Service
188 R.Balasubramani
189 N.A.Chinnasamy
190 M.R.P Bus Service
191 C.Rakkiappan
192 MRN Motor Service
193 Satgasumaminathan
194 C.Manivasagam
195 R.David
196 K.Ravichandran
197 Santhi Girdharan
198 K.Mani
199 P.Umamaheswari
200 K.Balasubramani
201 AMV Jayaraman
202 N.R.Venugopal
203 M.Sivapriya
204 R.Daniel
205 M.Sridharan
206 P.R.Rajendran
207 VRS Roadlines
208 S.Mugunthan
209 R.Kandasamy
210 S.K.transports
211 PSK Motor Service
212 D.Yuvaraj
213 Kannanal Bus Service
214 K.Mani
215 Krishnan
216 Shanmuga Transport Sankagiri
217 Rajalakshmi Bus Service
218 Vijayalakshmi Bus service
219 Sakthi Transport
220 Naganathan Roadways
221 Sankagiri Pallipalayam Bus Transport
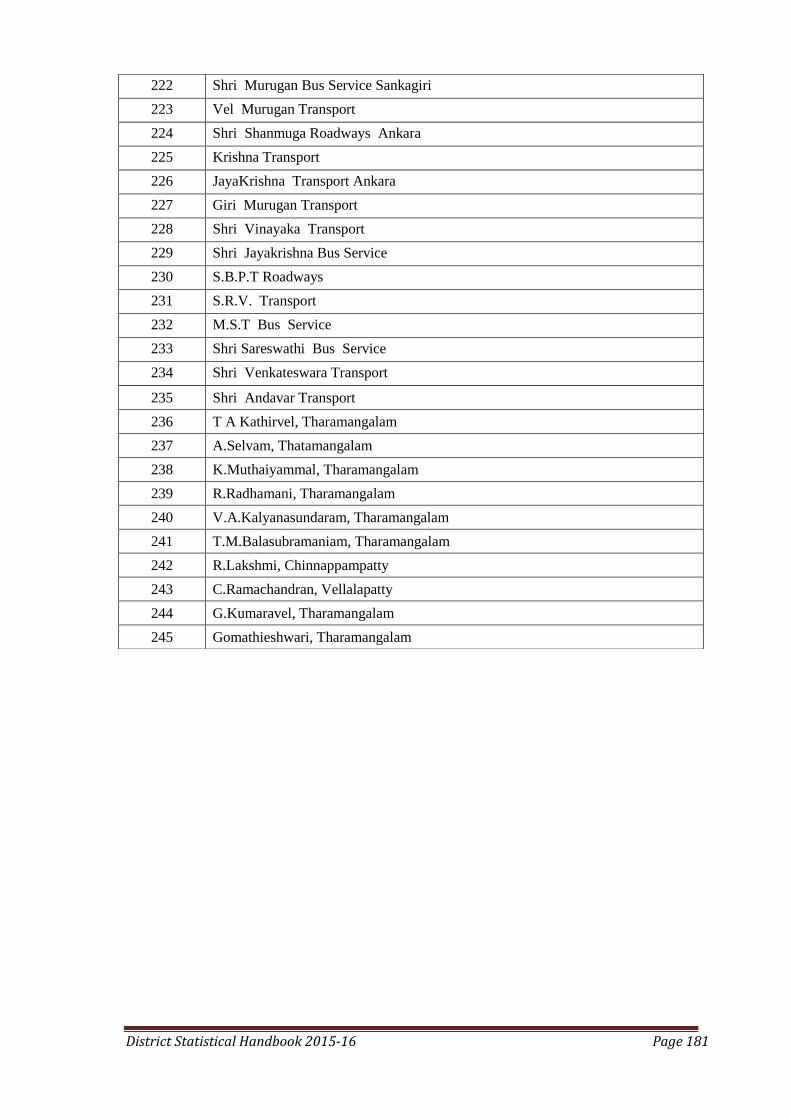
District Statistical Handbook 2015-16 Page 181
222 Shri Murugan Bus Service Sankagiri
223 Vel Murugan Transport
224 Shri Shanmuga Roadways Ankara
225 Krishna Transport
226 JayaKrishna Transport Ankara
227 Giri Murugan Transport
228 Shri Vinayaka Transport
229 Shri Jayakrishna Bus Service
230 S.B.P.T Roadways
231 S.R.V. Transport
232 M.S.T Bus Service
233 Shri Sareswathi Bus Service
234 Shri Venkateswara Transport
235 Shri Andavar Transport
236 T A Kathirvel, Tharamangalam
237 A.Selvam, Thatamangalam
238 K.Muthaiyammal, Tharamangalam
239 R.Radhamani, Tharamangalam
240 V.A.Kalyanasundaram, Tharamangalam
241 T.M.Balasubramaniam, Tharamangalam
242 R.Lakshmi, Chinnappampatty
243 C.Ramachandran, Vellalapatty
244 G.Kumaravel, Tharamangalam
245 Gomathieshwari, Tharamangalam
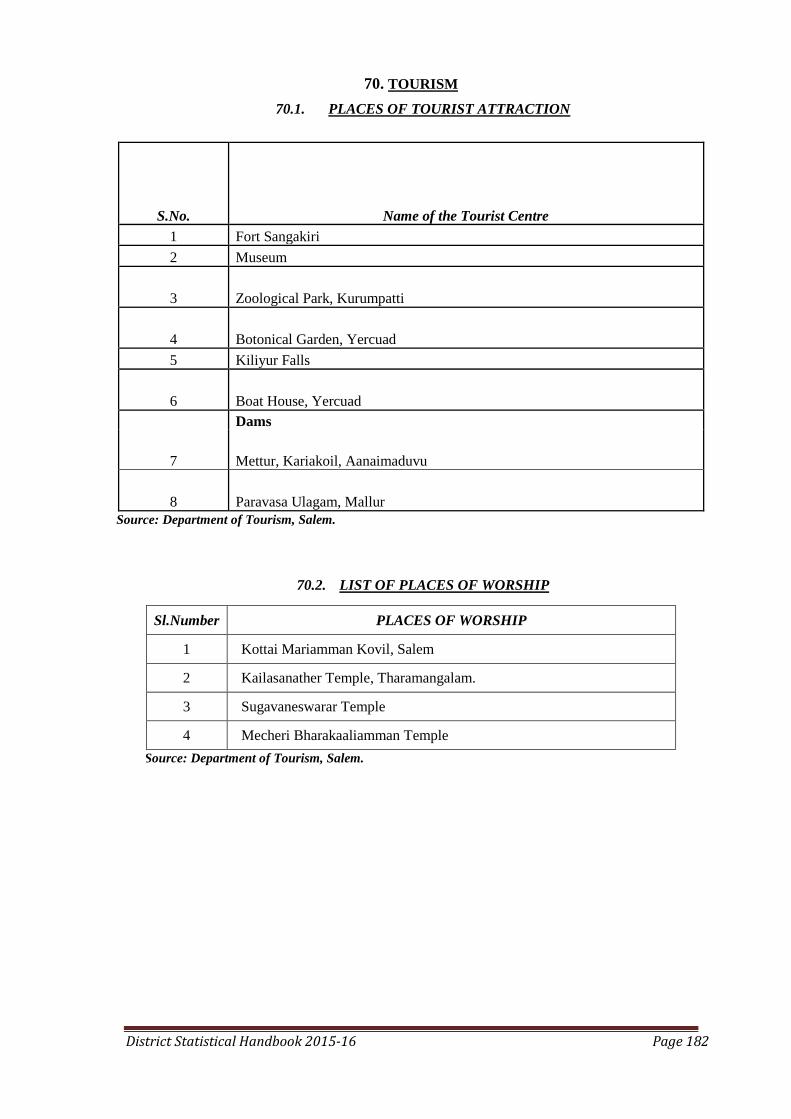
District Statistical Handbook 2015-16 Page 182
70. TOURISM
70.1. PLACES OF TOURIST ATTRACTION
S.No. Name of the Tourist Centre
1 Fort Sangakiri
2 Museum
3 Zoological Park, Kurumpatti
4 Botonical Garden, Yercuad
5 Kiliyur Falls
6 Boat House, Yercuad
7
Dams
Mettur, Kariakoil, Aanaimaduvu
8 Paravasa Ulagam, Mallur
Source: Department of Tourism, Salem.
70.2. LIST OF PLACES OF WORSHIP
Sl.Number PLACES OF WORSHIP
1 Kottai Mariamman Kovil, Salem
2 Kailasanather Temple, Tharamangalam.
3 Sugavaneswarar Temple
4 Mecheri Bharakaaliamman Temple
Source: Department of Tourism, Salem.

District Statistical Handbook 2015-16 Page 183
70.3. DETAILS OF HOTELS.
YEAR : 2015-16
Sl.
Number Place
Name of the hotels with
lodging facilities.
Name of the hotels
without lodging
facilities.
1 SALEM NATIONAL HOTEL ANNAPOORNA
SALEM CASTLE SRI LAKSHMI
WINDSOR CASTLE LAKSHMI
L.R.N.EXCELLENCE CHANDRA CAFE
CHENNEY'S
CATEWAY SALEM CAFE
MARUTHI HOTEL SARATHY
VASANTHA VIHAR VYSYA MODERN
HEMA INTERNATIONAL MALABAR HOTEL
T.T.D.C ASHOK
R.K.LODGE K.V.RESTARANT
DWARAKA HOTELS MANGALA VILAS
SELVAM HOTEL SIVASAKTHI
SURYA INTERNATIONAL RUKMANI
VASNTHAM HOTEL SAI VIHAR
SRI LEKA
SAKTHI
ARYA'S
SARAVANA
SARAVANA CLASSIC
RAJA GANAPATHY
ARUL HOTEL
SHANMUGAPRIYA
VENKATESHWARA
HOTEL
BOMBAY PRIYANI
PSRASAKTHI
INDRA CAFE

District Statistical Handbook 2015-16 Page 184
70.4. TRAVEL AGENTS
Year: 2015-16
Sl.Number List of Travel Agents
1 2
1 K.P.N
2 L.R.N
3 PALANI ANDAVAR
4 LINGAM
5 NEELA
6 KALAI
7 N.S
8 T.M.S
Source: Concerned Office
45. VITAL STATISTICS
71.1. BIRTHS AND DEATHS REGISTERED
Year: 2015-16
Sl.
Number Item Live Births Registered Deaths Registered
1 2 3 4
1 Rural 17178 13708
2 Urban 39036 14623
3 Total 56214 28331
Source: D. D. Health, Corpn. & DD Health Services and Family Welfare, Salem
45.1 BIRTH, DEATH AND INFANT MORTALITY RATES
Year: 2015-16
Birth
(combined)
Death
(combined)
Infant Mortality (Combined)
1 2 3
15.0 5.2 17.5
Source: DD Health Services and Family Welfare, Salem

District Statistical Handbook 2015-16 Page 185
45.1 DEATH BY CAUSES
Year: 2015-16
S.No Name of the Causes For Death Number of the deaths
1 RTA with Head injury 1679
2 Burns 855
3 OPC Poisining 571
4 Septicemia 450
5 Apnoea 113
6 Pre-term 300
7 Aspiration 348
8 Acute Myo Cardial Infarction 1321
9 Birth Asphyxia 283
10 Type 2 DM 998
11
Others
6973
Total 13891
Source: Dean, Govt Mohan Kumaramangalam Medical College Hospital, Salem and M.Os,
Municipalities and Joint Director of Medical and rural Health services and Family Welfare, Salem
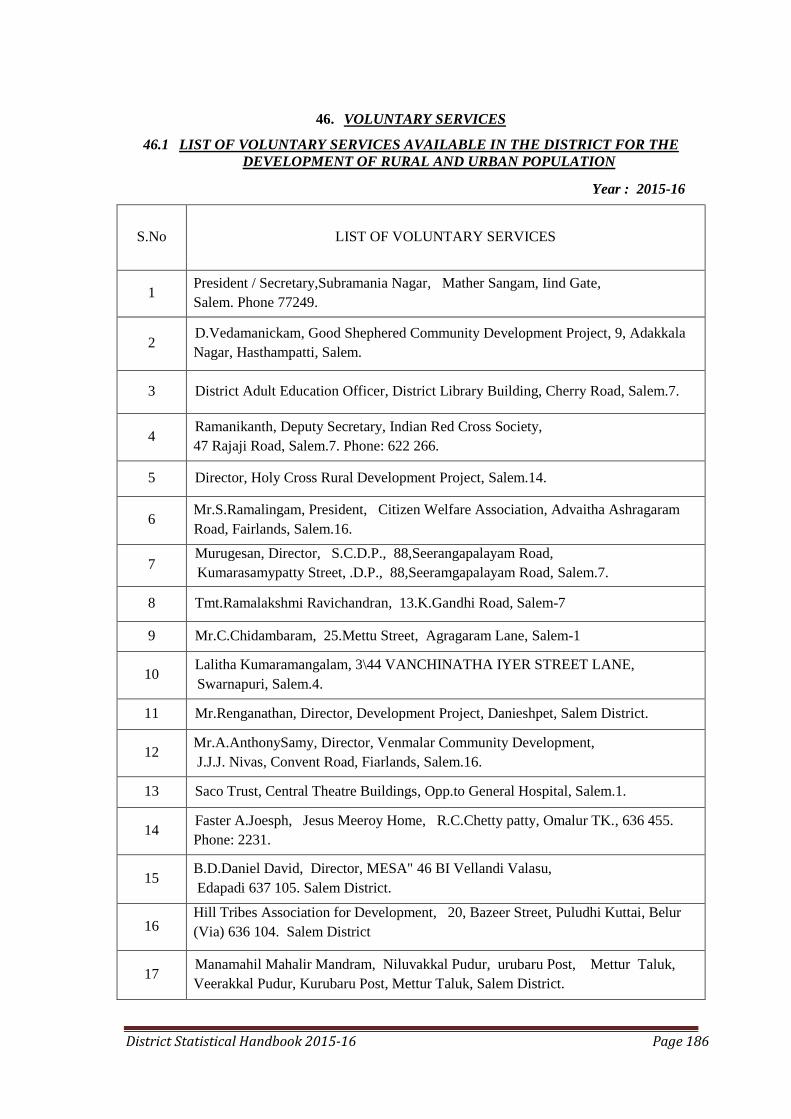
District Statistical Handbook 2015-16 Page 186
46. VOLUNTARY SERVICES
46. VOLUNTARY SERVICES
46.1 LIST OF VOLUNTARY SERVICES AVAILABLE IN THE DISTRICT FOR THE
DEVELOPMENT OF RURAL AND URBAN POPULATION
46.1 LIST OF VOLUNTARY SERVICES AVAILABLE IN THE DISTRICT FOR THE
DEVELOPMENT OF RURAL AND URBAN POPULATION.
Year : 2015-16
S.No LIST OF VOLUNTARY SERVICES
1 President / Secretary,Subramania Nagar, Mather Sangam, Iind Gate,
Salem. Phone 77249.
2 D.Vedamanickam, Good Shephered Community Development Project, 9, Adakkala
Nagar, Hasthampatti, Salem.
3 District Adult Education Officer, District Library Building, Cherry Road, Salem.7.
4 Ramanikanth, Deputy Secretary, Indian Red Cross Society,
47 Rajaji Road, Salem.7. Phone: 622 266.
5 Director, Holy Cross Rural Development Project, Salem.14.
6 Mr.S.Ramalingam, President, Citizen Welfare Association, Advaitha Ashragaram
Road, Fairlands, Salem.16.
7 Murugesan, Director, S.C.D.P., 88,Seerangapalayam Road,
Kumarasamypatty Street, .D.P., 88,Seeramgapalayam Road, Salem.7.
8 Tmt.Ramalakshmi Ravichandran, 13.K.Gandhi Road, Salem-7
9 Mr.C.Chidambaram, 25.Mettu Street, Agragaram Lane, Salem-1
10 Lalitha Kumaramangalam, 3\44 VANCHINATHA IYER STREET LANE,
Swarnapuri, Salem.4.
11 Mr.Renganathan, Director, Development Project, Danieshpet, Salem District.
12 Mr.A.AnthonySamy, Director, Venmalar Community Development,
J.J.J. Nivas, Convent Road, Fiarlands, Salem.16.
13 Saco Trust, Central Theatre Buildings, Opp.to General Hospital, Salem.1.
14 Faster A.Joesph, Jesus Meeroy Home, R.C.Chetty patty, Omalur TK., 636 455.
Phone: 2231.
15 B.D.Daniel David, Director, MESA" 46 BI Vellandi Valasu,
Edapadi 637 105. Salem District.
16 Hill Tribes Association for Development, 20, Bazeer Street, Puludhi Kuttai, Belur
(Via) 636 104. Salem District
17 Manamahil Mahalir Mandram, Niluvakkal Pudur, urubaru Post, Mettur Taluk,
Veerakkal Pudur, Kurubaru Post, Mettur Taluk, Salem District.

District Statistical Handbook 2015-16 Page 187
18 Mallikuttai Namagal Mahalir Mandram, Mallikuttai Post,
Tholasampatti, Salem District.
19 Muthukuttiyur Gandhimathi Mahalir Mandram, Mallikuttai Post,
Elampillai, Magudanchavadi Block, Salem District.
20 Manimagalai Madhar Sangam, Kannankurichi Post, Salem Block & District.
21 Kalaivani Mahalir Mandram, Servampatti, Salem.
22 Sri Sarada College Education Trust, Fairlands, Salem.16.
23 Sarada College for Women, Alagapuram, Salem.7.
24 Social Service Guild, Yercaud, Salem District.
25 Anbu Illam, Lady Seat Road, Yercaud Pin:636 601.
26 Sarada Mahalir Mandram, Thevoor Post, Sankari Block, Salem District.
27 Vijayalakshmi Mahalir Mandram, Kaveripuram Mettu Post, Kolathur Block, Salem
District.
28 Vullayachettipatti Lakshmi Mahalir Mandram, Elampillai, 170.Donalds Choultry
Block, Salem District.
29 Veerapandi Mahalir Mandram, Veerapandi Post & Block, Salem District.
30 Vellai Raja Mahalir Mandram, Vedikkaeanur,Mettur TK., Salem District.
31 C.S.I.Balusamy Illam, Hasthampatty, Salem.7.
32 Y.M.C.A. Gandhi Road, Hasthampatty, Salem.7.
33 Mr.Dass.Programme Co- Ordinator, Pols Puthur, Puthur (P.O), Salem TK., Salem.10.
34 Thirumathi.Sulochana, Joseph Chellamuthu Trust, Cherry Road, Salem.7.
35 St.Judes Handicapped Children School, Tharamangalam, Salem District.
36 Mr.C.Babu, Project Co-Ordinator, Women Self Employment Scheme, The
Communikty Service Guild, 6C Adaikala Nagar, Hasthampatty, Salem.7.
37 Mr.S.Thanikachalam, Project Officer, Aware, 11/105 Pudusamballi, Mettur Dam 635
403.
38 Mr. Raphel Augustian,Executive Director,Yercaud Rural Development Soceity,
Koilmedu, Director,Yercaud Rural Development Society, Koil Medu,Yercaud.
39 Mr.Balakrishnan, Secretary, Peoples Movement for Development,
Venkateswara Compound, Tharamangalam, Salem District.
40
Mr. V. Venkaataraman,Field Consultant Officer, Siddha Extension
Wing,Krishnamoorthy Institutional Agricultural Foundation, R.Number8,
Devaprakash Lodge, 24-D, Sivasamy Road, Salem.1.
41 Mr.Renganathan, Director, Village Reconstration Development Project, Danishpet,
Salem District.
42 Mr.A.Dass,Director, (POLE) Peoples Organization for Liberation
And Education, Periyar Nagar, Puthur, Salem 636 010.

District Statistical Handbook 2015-16 Page 188
43 Mr. Sokkar Areige Trust, 1.Kavandampatty, Idappadi 637 101, Salem District.
44 Mr.Z.E.Justin Project Secretary, Holy Cross Rural Development, K.N.Colony,
Salem.14.
45 Mr.Natarajan,Secretary,District Envitoment Society, Plant Manager, Abilox
Adhasiwes Ltd., Yercaud.
46 Mr.Murugamanickam, Yound India Association, Yethapur, Salem Distirct.
47 Mr. Santhosh, Deputy Director, Shervaroya Hills Tribal Community Development
Project, Ondikadai Post, Yercaud 636 602, Salem District.
48
Mr. A. AnthonySamy, Director, Venmalar Community Development Project,
J.J.J.Nivas, Convent Road, Fairlands, Salem.16.
49 Mr.N.P.Dass, Society for Rural Development Project, Powerkadu Post, Sankarai
Kalli Hills, Salem District.
50 Mr. Perumal, President, Social Service Mission, Thukkiampalayam Post, Valapady,
Salem 636 115.
51 Mr.Sooriya Kanthan,Secretary,MIRA Development,Selevadi Post, Tharamangalam
(Via),Salem District
52 Mr.Vedhamanickam, Director, Good Shephered Community Development Post,
Service Mission, Number9.Adaikala Nagar, Hasthampatty, Salem.7.
53 Seco Trust, Central Theatre Buildings, Opp.to General Hospital, Salem.1.
54 Dr.Murugan, Ruby Clinic, Valapadi, Salem District.
55 Mr.Karunanidhi, CARD, Sathiya Nagar, Kaveripuram (P.O), Kolathur (Via),
Mettur.Tk. Salem District.
56 Mr.Joseph, Secretary, Christian Social Service Mission,
51/Z1,Court Road,Gandhi Nagar, Maravaneri Post,Salem.7.
57 Mrs.Ruby Thiyagarajan, Secretary, YWCA Cherry Road, Salem.7.Phone:63197.
58 Mr.Karunakaran SYARD, Kurinchi Nagar, Semmandapatti Post, Omalur Taluk,
Salem District.
59 Mr.Jesudass Thiyagarajan, Compassion Social Service Mission, 55 Sankar Nagar,
Salem.7.
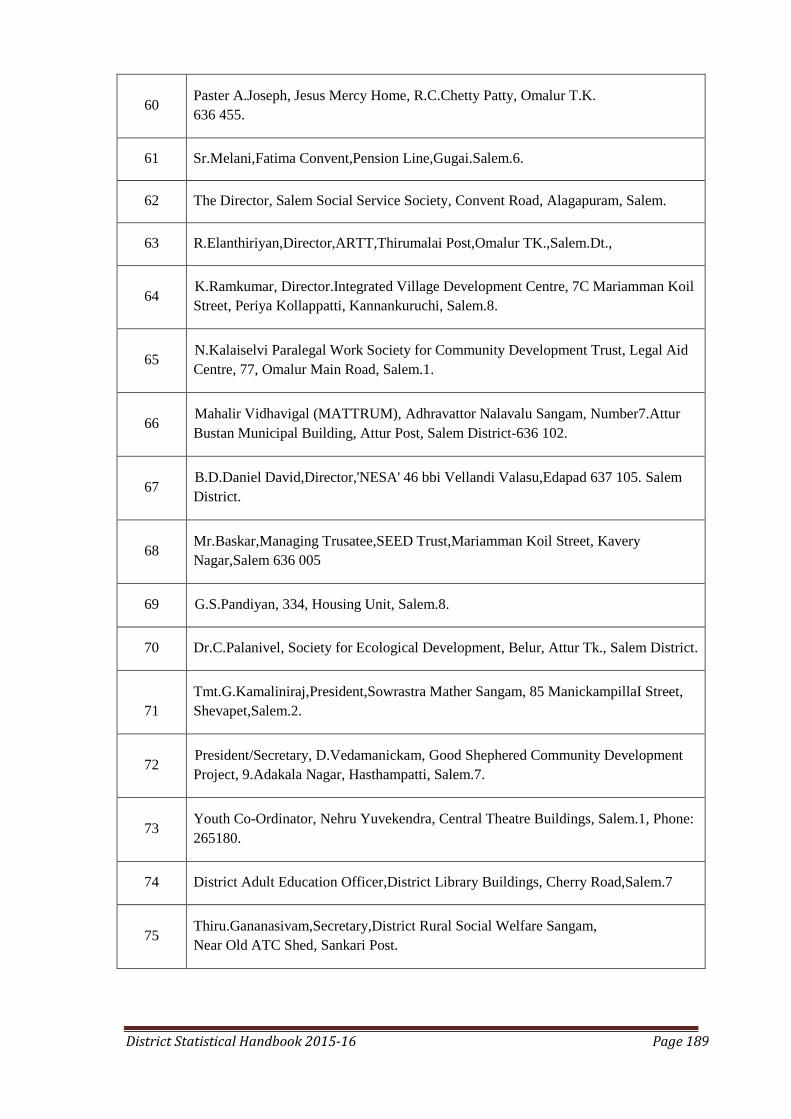
District Statistical Handbook 2015-16 Page 189
60 Paster A.Joseph, Jesus Mercy Home, R.C.Chetty Patty, Omalur T.K.
636 455.
61 Sr.Melani,Fatima Convent,Pension Line,Gugai.Salem.6.
62 The Director, Salem Social Service Society, Convent Road, Alagapuram, Salem.
63 R.Elanthiriyan,Director,ARTT,Thirumalai Post,Omalur TK.,Salem.Dt.,
64 K.Ramkumar, Director.Integrated Village Development Centre, 7C Mariamman Koil
Street, Periya Kollappatti, Kannankuruchi, Salem.8.
65 N.Kalaiselvi Paralegal Work Society for Community Development Trust, Legal Aid
Centre, 77, Omalur Main Road, Salem.1.
66 Mahalir Vidhavigal (MATTRUM), Adhravattor Nalavalu Sangam, Number7.Attur
Bustan Municipal Building, Attur Post, Salem District-636 102.
67 B.D.Daniel David,Director,'NESA' 46 bbi Vellandi Valasu,Edapad 637 105. Salem
District.
68 Mr.Baskar,Managing Trusatee,SEED Trust,Mariamman Koil Street, Kavery
Nagar,Salem 636 005
69 G.S.Pandiyan, 334, Housing Unit, Salem.8.
70 Dr.C.Palanivel, Society for Ecological Development, Belur, Attur Tk., Salem District.
71
Tmt.G.Kamaliniraj,President,Sowrastra Mather Sangam, 85 ManickampillaI Street,
Shevapet,Salem.2.
72 President/Secretary, D.Vedamanickam, Good Shephered Community Development
Project, 9.Adakala Nagar, Hasthampatti, Salem.7.
73 Youth Co-Ordinator, Nehru Yuvekendra, Central Theatre Buildings, Salem.1, Phone:
265180.
74 District Adult Education Officer,District Library Buildings, Cherry Road,Salem.7
75 Thiru.Gananasivam,Secretary,District Rural Social Welfare Sangam,
Near Old ATC Shed, Sankari Post.

District Statistical Handbook 2015-16 Page 190
76 Ramanikanth,Deputy Secretary,Indian Red Cross Society, 47 Rajaji Road,
Salem.7.Phone:62266
77 Mr.S.Ramalingam, President, Citizen Welfare Association, 255 Advitha Asirama
Road, Fairlands, Salem.16.
78 Mr.Gnanasekaran,Project Co--Ordinator,Jesus Mercy Home Association, R.C.Chetty
Patty,Omalur Tk., Salem District
79 Murugesan,Director,S.C.D.P.,88 Seerangapalayam Road,Salem.7.
80 Tmt.Priyamanohar, Salem Ladies Circle, 255 Advaitha Agraharam Road, Salem.16.
81 Tmt.Geetha, President, Kasthuriba Mathar Sangam, Old Suramangalam, Salem.5.
82 Thiyagarajan, Secretary, Campassion Social Service, 55 Sankar Nagar, Salem.7.
83 R.Vasantha, M.A., Director, All India Radio, 28 Mettu Street, Salem.1.
84 Tmt.Ramalakshmi Ravichandran, 13 K.Gandhi Road, Salem.7.
85 G.Chidabaran, 25 Mettu Street, Agragaram Lane, Salem.1.
86 Lalitha Kumaramangalam, 3/44 Vanchinatha Iyer Street, Swarnapuri, Salem.4.
87 St.Louis Convent, Thumbal Post, Attur Tk., Salem District.
88 Suriya Gandhi Mahalir Mandram,Chettipatti,Kaveripuram Post,Salem District
89 Sri Sarada College Educational Trust, Fairlands, Salem District.
90 Sarada Devi Mahalir Mandram, Odskkutoor,Poolampatti Post,Sankari Taluk,
Salem District.
91 Social Service Guild, Yercaud, Salem District.
92 Tharakadu Mahalir Mandram, Tharkadu Village & Post, Mettur Taluk, Salem
District.
93 Valasaiyur Manimegalai Madhar Sangam, Valasaiyur Post, Salem District.
94 Vellai Raja Mahalir Mandram,Vedikkaeanur,Mettur Taluk,Salem District.
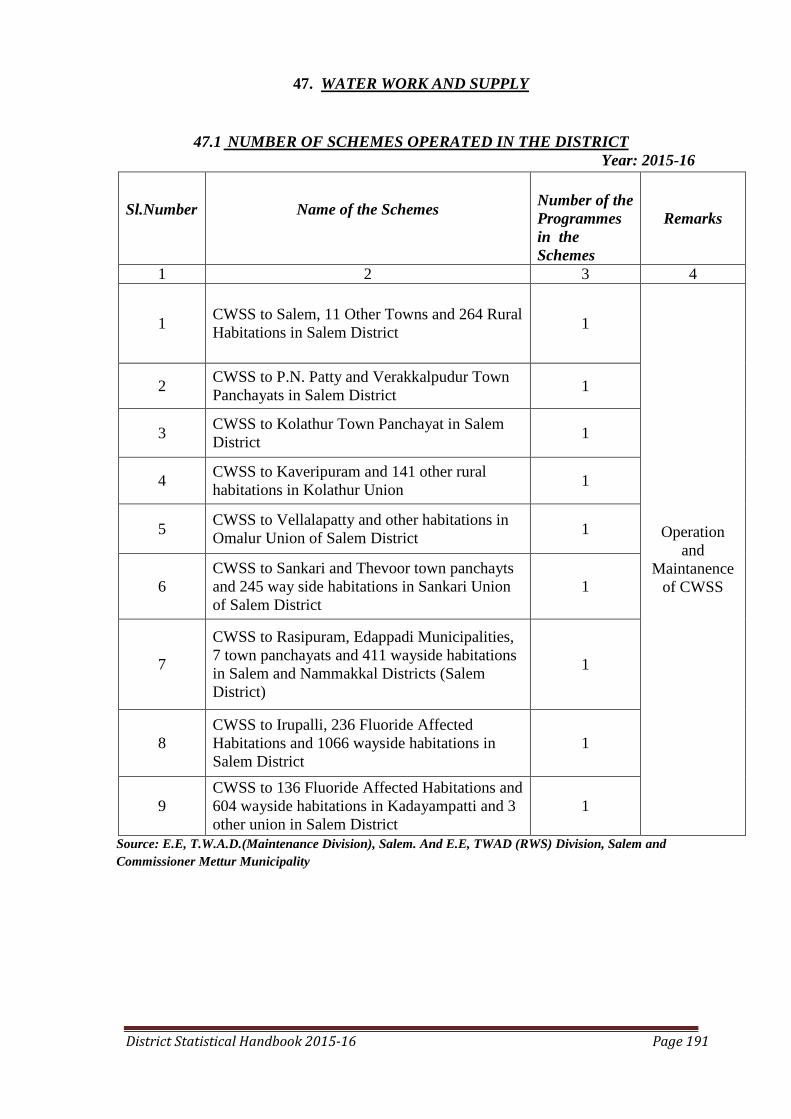
District Statistical Handbook 2015-16 Page 191
47. WATER WORK AND SUPPLY
47.1 NUMBER OF SCHEMES OPERATED IN THE DISTRICT
Year: 2015-16
Sl.Number
Name of the Schemes
Number of the
Programmes
in the
Schemes
Remarks
1 2 3 4
1 CWSS to Salem, 11 Other Towns and 264 Rural
Habitations in Salem District 1
Operation
and
Maintanence
of CWSS
2 CWSS to P.N. Patty and Verakkalpudur Town
Panchayats in Salem District 1
3 CWSS to Kolathur Town Panchayat in Salem
District 1
4 CWSS to Kaveripuram and 141 other rural
habitations in Kolathur Union 1
5 CWSS to Vellalapatty and other habitations in
Omalur Union of Salem District 1
6
CWSS to Sankari and Thevoor town panchayts
and 245 way side habitations in Sankari Union
of Salem District
1
7
CWSS to Rasipuram, Edappadi Municipalities,
7 town panchayats and 411 wayside habitations
in Salem and Nammakkal Districts (Salem
District)
1
8
CWSS to Irupalli, 236 Fluoride Affected
Habitations and 1066 wayside habitations in
Salem District 1
9
CWSS to 136 Fluoride Affected Habitations and
604 wayside habitations in Kadayampatti and 3
other union in Salem District
1
Source: E.E, T.W.A.D.(Maintenance Division), Salem. And E.E, TWAD (RWS) Division, Salem and
Commissioner Mettur Municipality
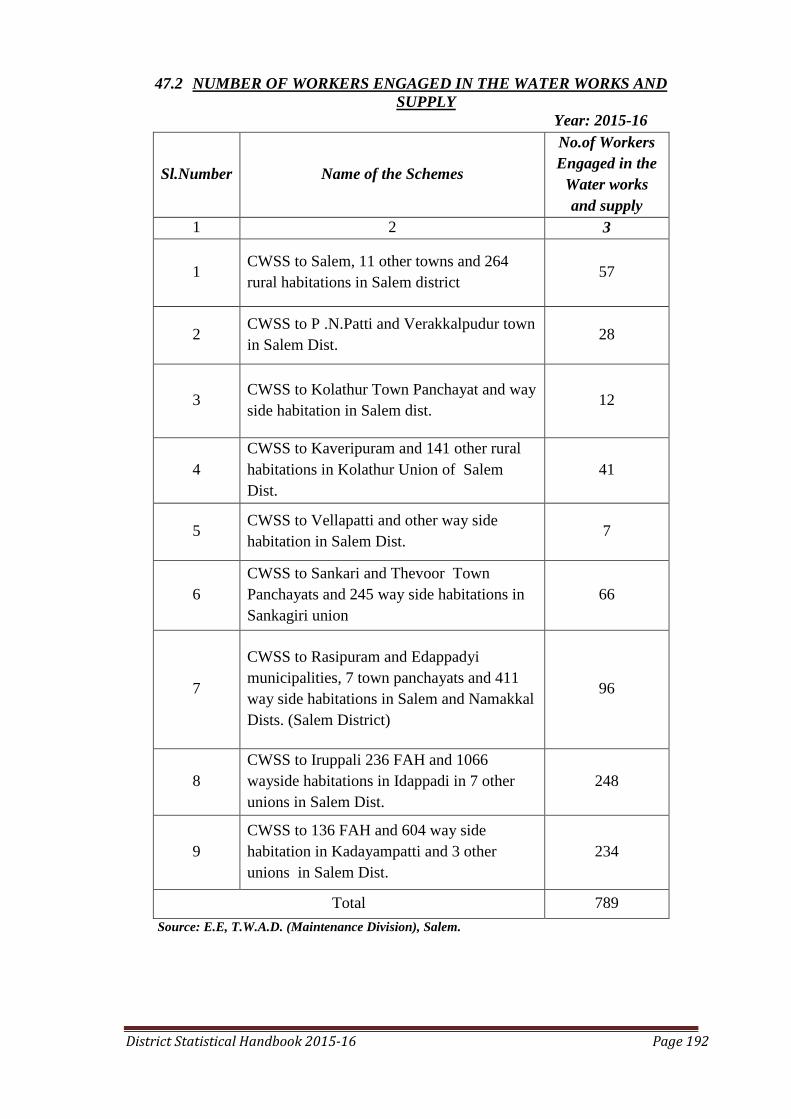
District Statistical Handbook 2015-16 Page 192
47.2 NUMBER OF WORKERS ENGAGED IN THE WATER WORKS AND
SUPPLY
Year: 2015-16
Sl.Number
Name of the Schemes
No.of Workers
Engaged in the
Water works
and supply
1 2 3
1 CWSS to Salem, 11 other towns and 264
rural habitations in Salem district 57
2 CWSS to P .N.Patti and Verakkalpudur town
in Salem Dist. 28
3 CWSS to Kolathur Town Panchayat and way
side habitation in Salem dist. 12
4
CWSS to Kaveripuram and 141 other rural
habitations in Kolathur Union of Salem
Dist.
41
5 CWSS to Vellapatti and other way side
habitation in Salem Dist. 7
6
CWSS to Sankari and Thevoor Town
Panchayats and 245 way side habitations in
Sankagiri union
66
7
CWSS to Rasipuram and Edappadyi
municipalities, 7 town panchayats and 411
way side habitations in Salem and Namakkal
Dists. (Salem District)
96
8
CWSS to Iruppali 236 FAH and 1066
wayside habitations in Idappadi in 7 other
unions in Salem Dist.
248
9
CWSS to 136 FAH and 604 way side
habitation in Kadayampatti and 3 other
unions in Salem Dist.
234
Total 789
Source: E.E, T.W.A.D. (Maintenance Division), Salem.
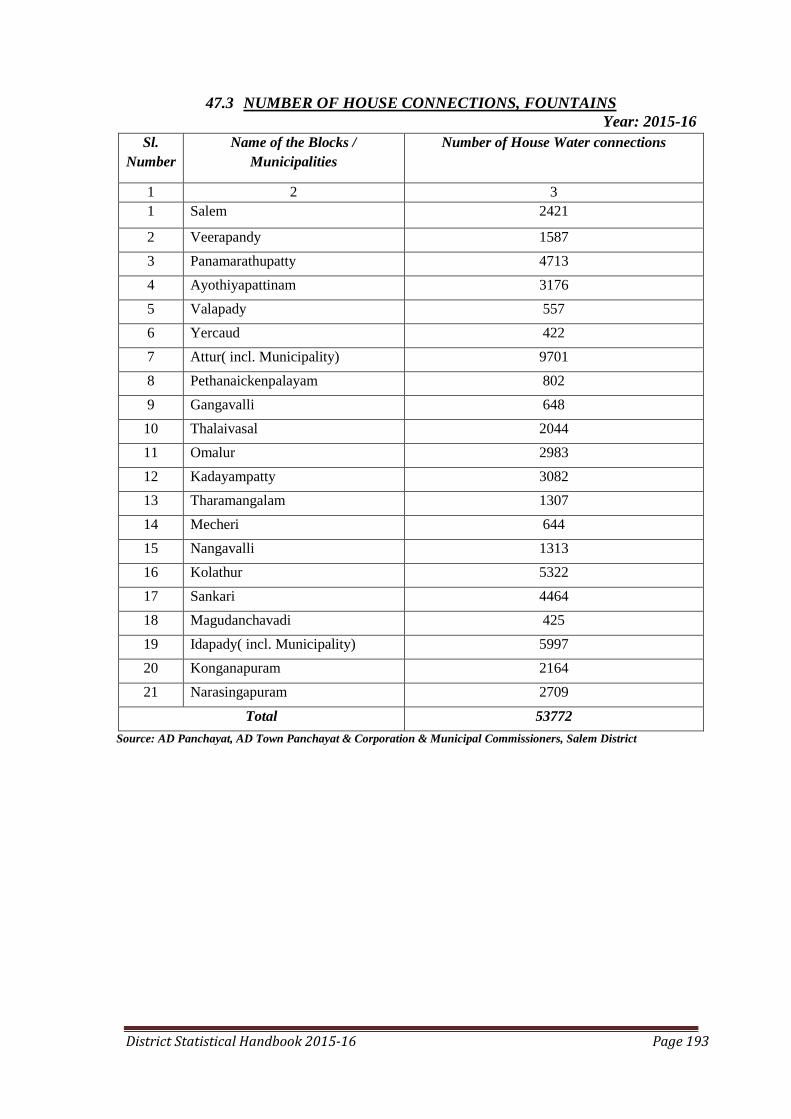
District Statistical Handbook 2015-16 Page 193
47.3 NUMBER OF HOUSE CONNECTIONS, FOUNTAINS
Year: 2015-16
Sl.
Number
Name of the Blocks /
Municipalities
Number of House Water connections
1 2 3
1 Salem 2421
2 Veerapandy 1587
3 Panamarathupatty 4713
4 Ayothiyapattinam 3176
5 Valapady 557
6 Yercaud 422
7 Attur( incl. Municipality) 9701
8 Pethanaickenpalayam 802
9 Gangavalli 648
10 Thalaivasal 2044
11 Omalur 2983
12 Kadayampatty 3082
13 Tharamangalam 1307
14 Mecheri 644
15 Nangavalli 1313
16 Kolathur 5322
17 Sankari 4464
18 Magudanchavadi 425
19 Idapady( incl. Municipality) 5997
20 Konganapuram 2164
21 Narasingapuram 2709
Total 53772
Source: AD Panchayat, AD Town Panchayat & Corporation & Municipal Commissioners, Salem District