Embed Size (px)
Citation preview
IT
Properly treated, blended, and monitoredwaste streams can be recycled through the
water treatment process, thus relievingdisposal problems and conserving water.
is of the cam be
A®G.
SO JOURNAL AWWA
ater treatment plantsgenerate various waste streams during the water pro-duction process as well as during subsequent waste-handling- procedures. Waste streams can be a largevolume, such as spent filter backwash water, whichcan make up more than 3 percent of plant production,or very small, like side streams of filtrate from a fil-ter press, which may represent less than 0.1 percentof plant production.
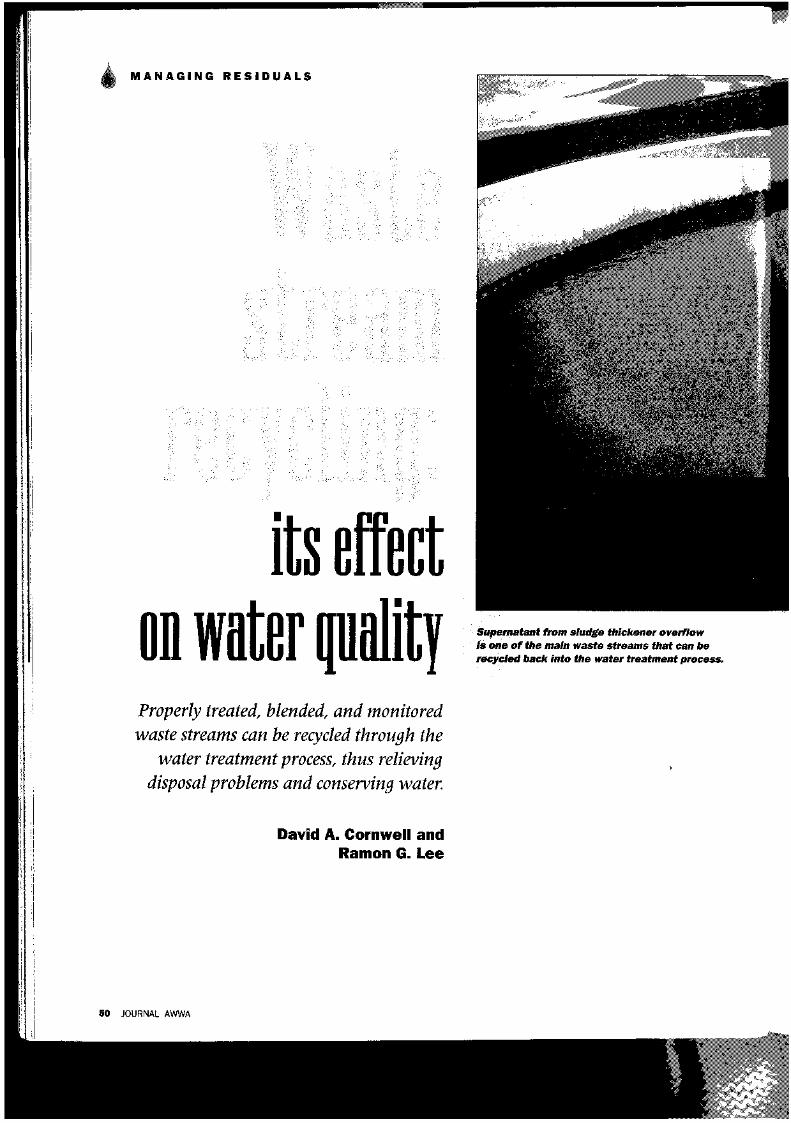
Long In canInto fit© of
Waste recycled to the influent of a water treatmentplant typically contain contaminants at concentrations thatare of concern. These contaminants may include GiardiaCryptosporidium, trifaalomethanes, manganese,assimilable organic carbon. This research shows that proper
—treatment, equalization, monitoring—ofthe waste render suitable for recycling inmany situations.
forWaste streams can be discharged to a sewer, dis-
charged to a stream, or recycled within the treat-ment plant. If a sewer is available and the sewageplant can accept the waste, the discharge of smallquantities of waste streams by this method may beappropriate. Discharge of large quantities of wastes(e.g., spent filter backwash water) may not be accept-able or economically desirable.
Direct discharge to waterways of clarified wastestreams is a widely practiced disposal method. Gen-erally, a discharge permit limits suspended solids(e.g., 30 mg/L) and pH (e.g., 6 to 9) for the water dis-charged. Several states are adding metal, chlorine, andtoxicity standards to the discharge permit, making itincreasingly difficult to discharge water treatmentplant liquid wastes. Several plants are already con-sidering zero discharge (complete plant recycle) as theonly available option. Unfortunately, this option iscomplicated by some state health departments thatare reluctant to permit recycle streams.
Recycling waste streams has the potential to dis-turb the treatment process itself or to affect the qual-ity of the finished water. The adverse effects can becaused by the solids themselves, constituents in the
waste, or contaminants releasedfrom sludge into the overlyingwater. Examples of undesirableconstituents in waste includeGiardia and C^yptosporidium cysts,manganese, iron, total organic
*A full report of this project, "Recycle StreamEffects on Water Treatment" (catlog#90629LH), is available from AWWA Cus-tomer Service (1-800-926-7337). Reports arefree to AWWA Research Foundation sub-scribers by calling 303-347-6121.
NOVEMBER 1994 Si
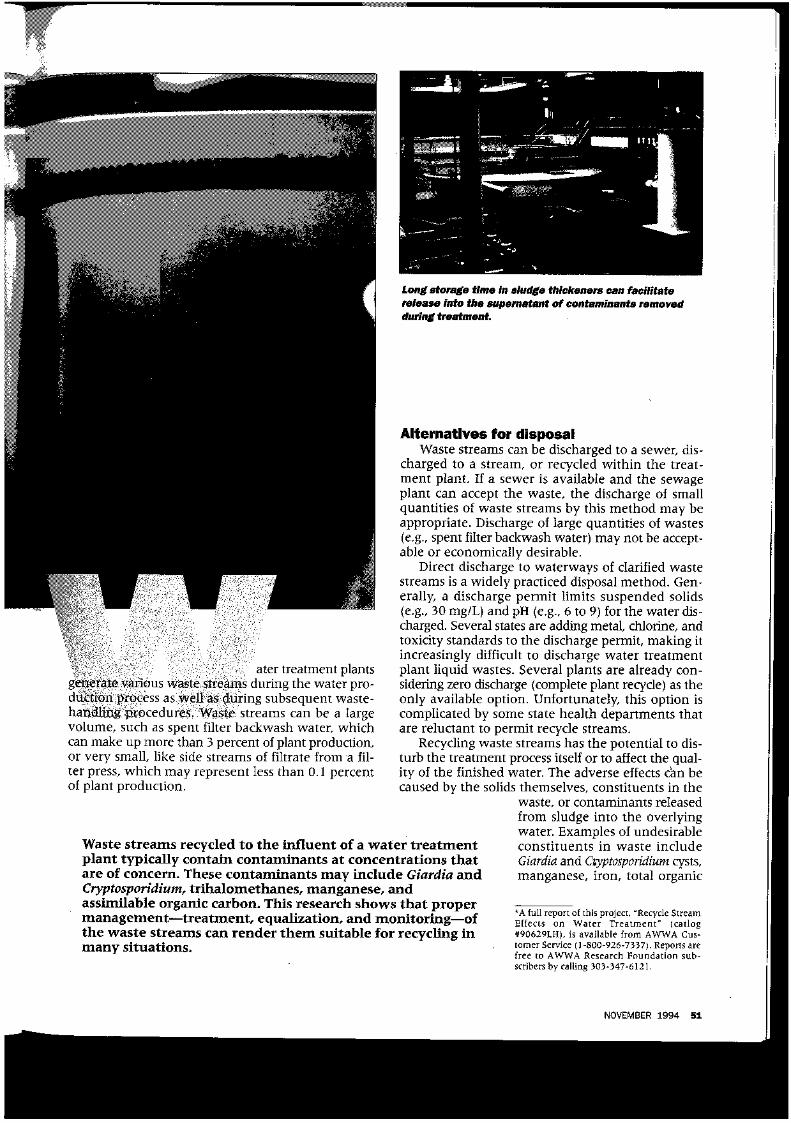
Parameters for evaluati©n at the six sites
Plant
MlanusSwimming RiverBangerMoshannon ValleyNew CastleKanawha Valley
Turbidity Mn AOC Parasites
PryingBed
Pressate Filtrate
XX
carbon (TOG), total trihalomethane (TTHM) precur-sors, and taste and odor. Although some plants haveexperienced problems with recycling waste streams,little published literature deals directly with the char-acteristics, problems, and requirements of effectiveside stream recycling.
Some of the possible effects of sludge storage insedimentation basins were reported by Hoehn, Novak,
in can bethe
the or
and Cumbie in 1987.1 They found significant releasesof manganese, iron, and TOC from sludge in manu-ally cleaned sedimentation basins. Manganese con-centrations in the water applied to the filters werehigher than concentrations in the raw water. Theresearchers also concluded that sludge stored inlagoons can be expected to degrade the overlyingwaters, thus complicating the discharge or recyclingof this supernatant.
The American Water Works Service Company(AWWSC), which is made up of more than 100water plants, has also experienced the benefits and
problems associated withwaste stream recycling. Morethan 20 of these plants thattreat surface water recycleone or more waste streamsinto the treatment process.Although operating person-
x nel obviously carry out thex
x X recycling process carefully to
avoid any significant impact,several plants have reportedadverse effects. These reportssuggest that there may be
optimum operating or water quality conditions forminimizing adverse effects.
The principal objective of this research, which wassupported by the AWWA Research Foundation,2 wasto evaluate the effect of recycling waste streams pro-duced by drinking water treatment back to the head
of the plant.The main waste streams that
can be recycled back to the watertreatment process are classifiedas follows:
« spent-filter backwash water,either containing solids from fil-tration or not containing solidsfrom filtration (after settling);
• sludge thickener overflow (supernatant);• sludge lagoon overflow (supernatant); and• dewatering liquid wastes, which include pres-
sate from filter press, pressate from belt press, centratefrom centrifuge, and leachate from sand drying beds.
Spent-filter backwash water is classified separatelyfrom the other wastes because it is often handled alone,it represents a large volume of water, and it is generallyconsidered the cleanest of the waste streams. Spent-fil-ter backwash water is subdivided into water containingthe solids removed during filtration and water fromwhich the solids have been removed prior to recycling.
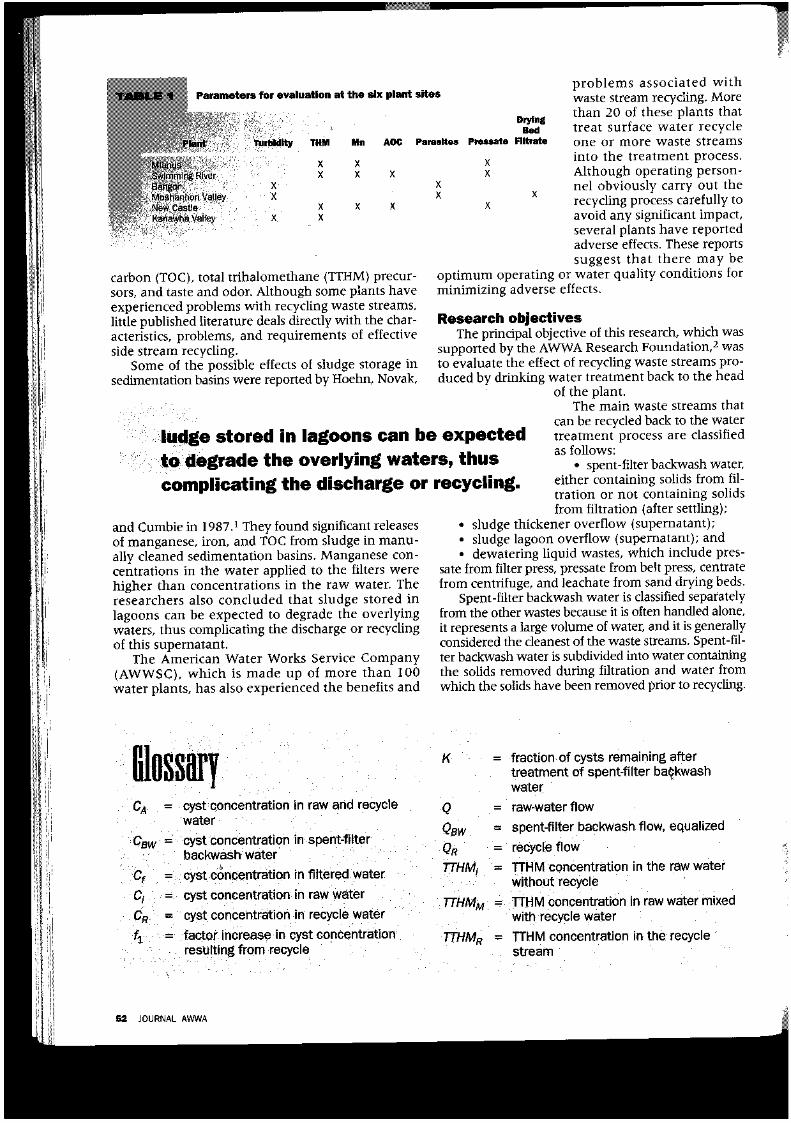
= cyst concentration in raw and recyclewater
CBW -
c,CR
cyst concentration in spent-filterbackwash water
cyst concentration in filtered water
cyst concentration in raw water
cyst concentration in recycle water
factor increase in cyst concentrationresulting from recycle
K = fraction of cysts remaining aftertreatment of spent-filter badkwashwater
Q = raw-water flow
QBW = spent-filter backwash flow, equalized
QR = recycle flow
TTHM} = TTHM concentration in the raw waterwithout recycle
TTHMM = TTHM concentration in raw water mixedwith recycle water
TTHMR = TTHM concentration in the recyclestream
§2 JOURNAL AWWA
At fit©In
M.C.9 m isto the
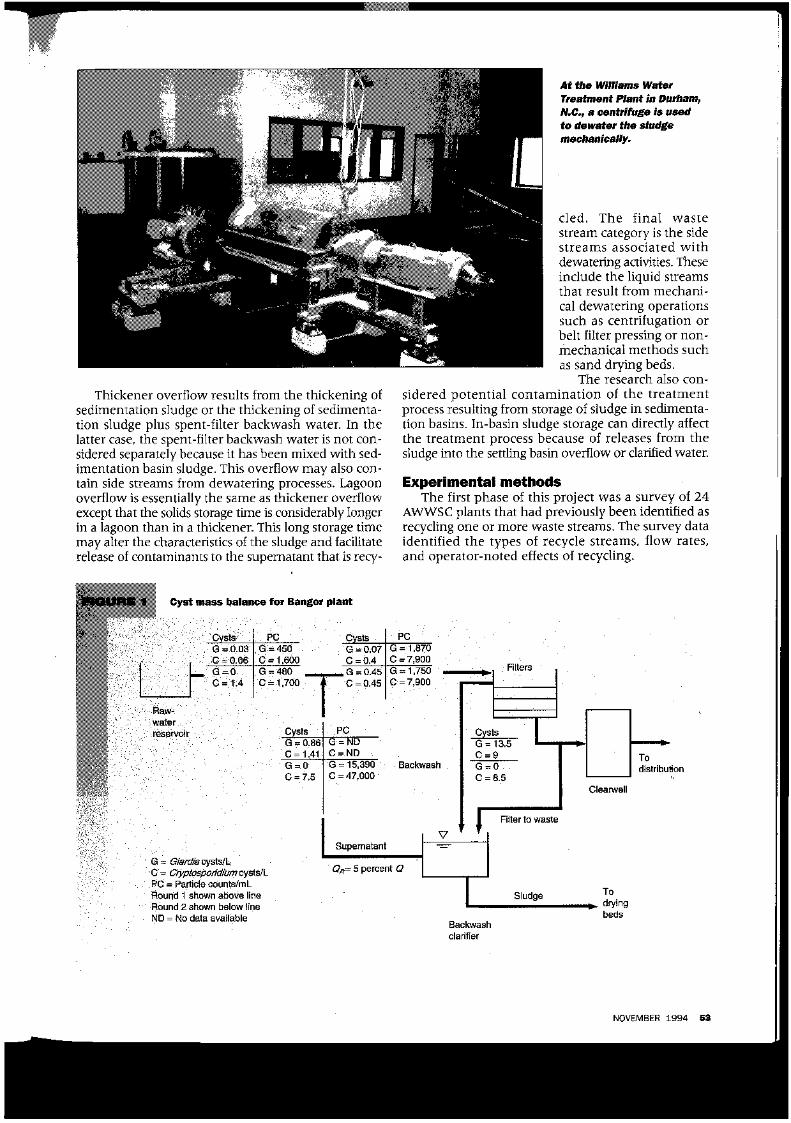
Thickener overflow results from the thickening ofsedimentation sludge or the thickening of sedimenta-tion sludge plus spent-filter backwash water. In thelatter case, the spent-filter backwash water is not con-sidered separately because it has been mixed with sed-imentation basin sludge. This overflow may also con-tain side streams from dewatering processes. Lagoonoverflow is essentially the same as thickener overflowexcept that the solids storage time is considerably longerin a lagoon than in a thickener. This long storage timemay alter the characteristics of the sludge and facilitaterelease of contaminants to the supernatant that is recy-
cled. The final wastestream category is the sidestreams associated withdewatering activities. Theseinclude the liquid streamsthat result from mechani-cal dewatering operationssuch as centrifugation orbelt filter pressing or non-mechanical methods suchas sand drying beds.
The research also con-sidered potential contamination of the treatmentprocess resulting from storage of sludge in sedimenta-tion basins. In-basin sludge storage can directly affectthe treatment process because of releases from thesludge into the settling basin overflow or clarified water.
The first phase of this project was a survey of 24AWWSC plants that had previously been identified asrecycling one or more waste streams. The survey dataidentified the types of recycle streams, flow rates,and operator-noted effects of recycling.
for
CystsG = 0.03G = 0.06G = QC = 1.4
PCG = 45GG = 1,600G = 48QC = 1,700
CystsG = 0.86C = 1.41
= 7,5
G = Giardfa cysts/LC = Cryptosporidfum cysts/LPC = Particle counts/mlRound 1 shown above lineRound 2 shown below lineND = No data available
CystsG = 0.07C = 0,4G = 0.45C = 0.45
PCG = 1,870C = 7,900G = 1,750C = 7,900
PCG = NDC = NDG = 15,390C = 47,000
Supernatant
Backwash
Filters
Todistribution
QR- 5 percent Q
NOVEMBER 1994 S3
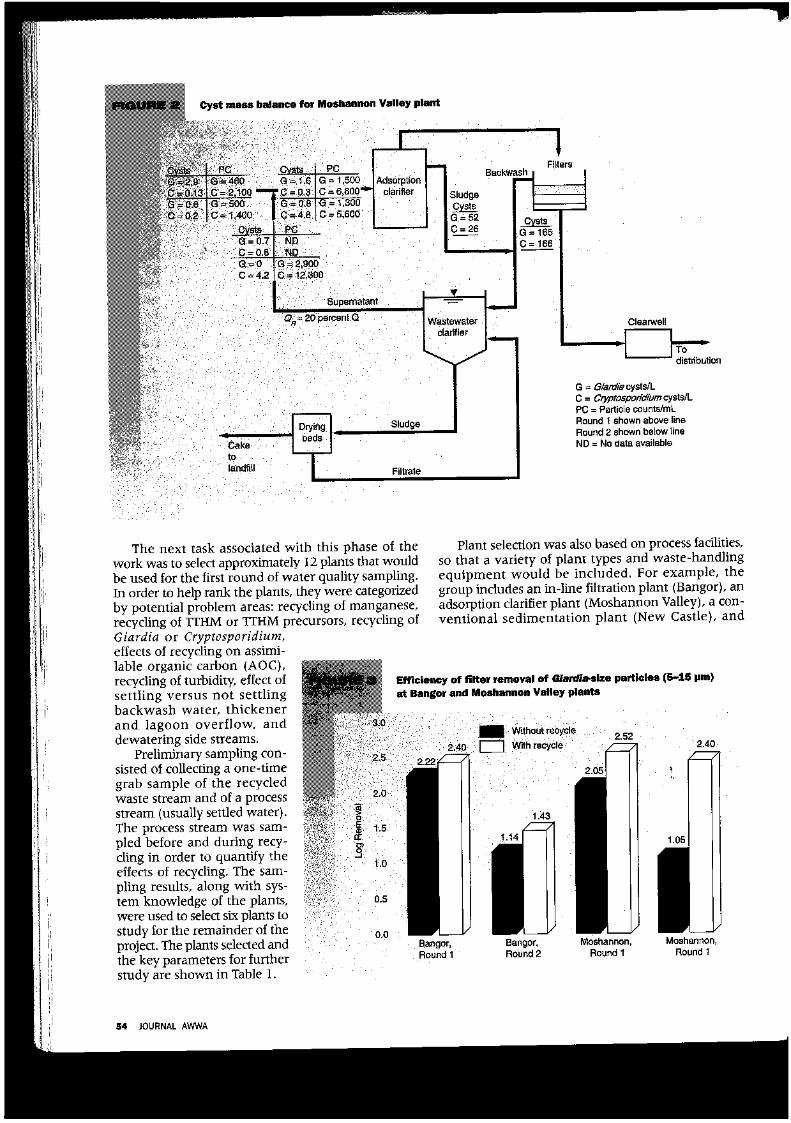
Cyst fealanc© for M©shaiiii©n Valley
Cysts6 = 1.6C = 0,3Q = 0,8C = 4.8
PCG = 1,500C = 6,600G = 1 ,300C = 5,600
PCNDWD
0 = 2,900C a 12,300
Supernatant
£?„= 20 percent QH
Cake
Dryingbeds
Sludge
tolandfill Filtrate
G= G/arcf/acysts/LC = Cryptosporidium cysts/LPC = Particle counts/mlRound 1 shown above lineRound 2 shown below lineND = No data available
The next task associated with this phase of thework was to select approximately 12 plants that wouldbe used for the first round of water quality sampling.In order to help rank the plants, they were categorizedby potential problem areas: recycling of manganese,recycling of TTHM or TTHM precursors, recycling ofGiardia or Cryptosporidium,effects of recycling on assimi-lable organic carbon (AOC),recycling of turbidity, effect ofsettling versus not settlingbackwash water, thickenerand lagoon overflow, anddewatering side streams.
Preliminary sampling con-sisted of collecting a one-timegrab sample of the recycledwaste stream and of a processstream (usually settled water).The process stream was sam-pled before and during recy-cling in order to quantify theeffects of recycling. The sam-pling results, along with sys-tem knowledge of the plants,were used to select six plants tostudy for the remainder of theproject. The plants selected andthe key parameters for furtherstudy are shown in Table 1.
Plant selection was also based on process facilities,so that a variety of plant types and waste-handlingequipment would be included. For example, thegroup includes an in-line filtration plant (Bangor), anadsorption ciarifier plant (Moshannon Valley), a con-ventional sedimentation plant (New Castle), and
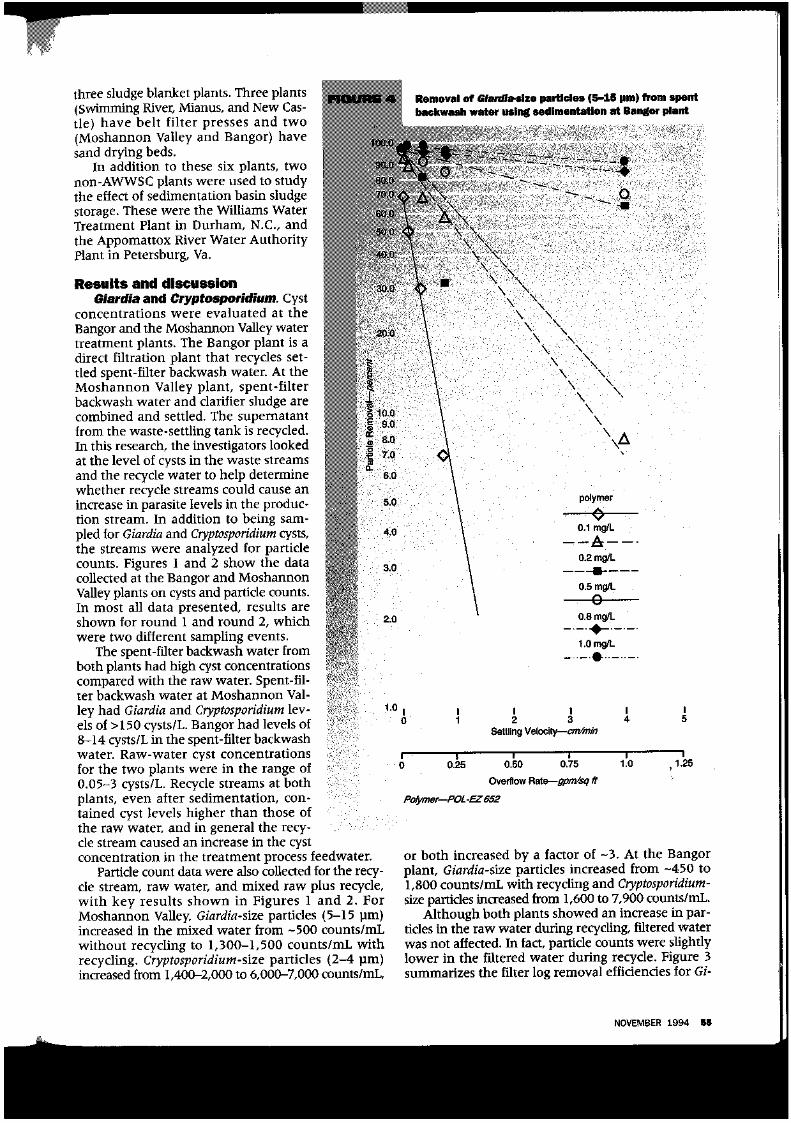
Efficiency ©f filter removal ©f particles (5-15 pm)
at Bang©r and Moshannon Valley plants
Without recycle
With recycle2.52
2.40
Bangor,Round 1
Bangor,Round 2
Woshannon,Round 1
Moshannon,Round 1
54 JOURNAL AWWA
three sludge blanket plants. Three plants(Swimming River, Manus, and New Cas-tle) have belt filter presses and two(Moshannon Valley and Bangor) havesand drying beds.
In addition to these six plants, twonon-AWWSC plants were used to studythe effect of sedimentation basin sludgestorage. These were the Williams WaterTreatment Plant in Durham, N.C., andthe Appomattox River Water AuthorityPlant in Petersburg, Va.
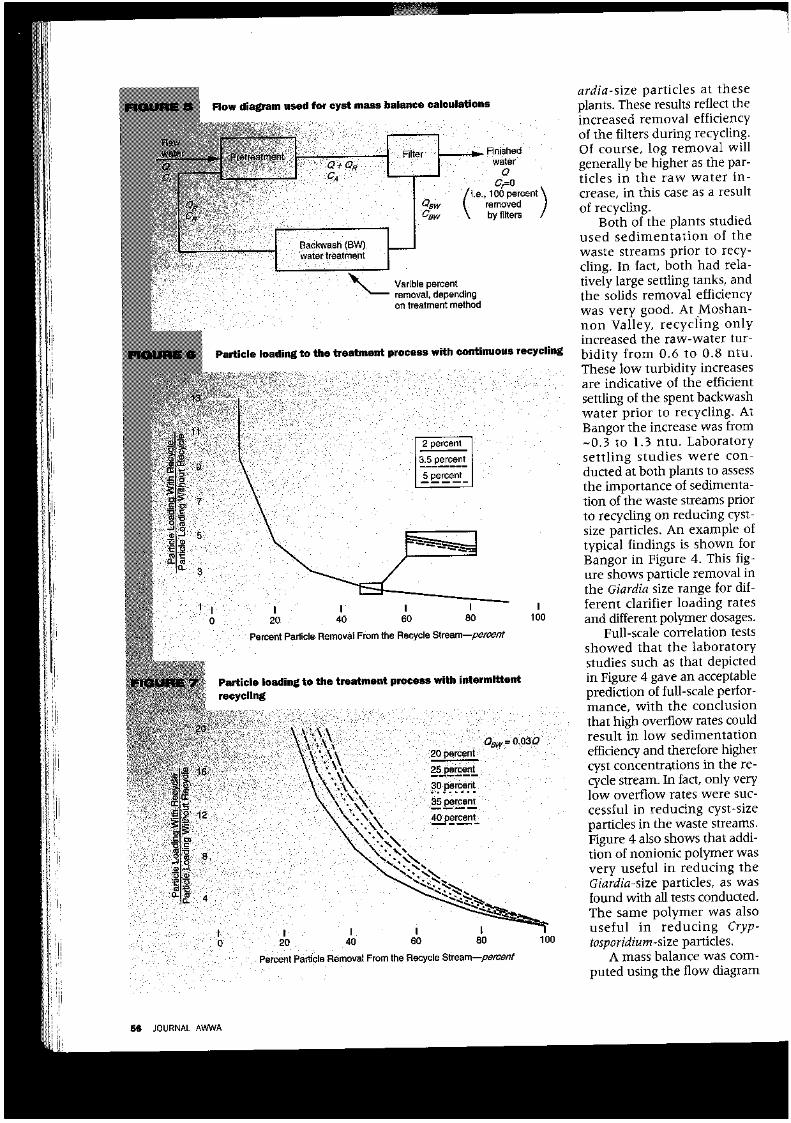
Cryptosporidlum. Cystconcentrations were evaluated at theBangor and the Moshannon Valley watertreatment plants. The Bangor plant is adirect filtration plant that recycles set-tled spent-filter backwash water. At theMoshannon Valley plant, spent-filterbackwash water and clarifier sludge arecombined and settled. The supernatantfrom the waste-settling tank is recycled.In this research, the investigators lookedat the level of cysts in the waste streamsand the recycle water to help determinewhether recycle streams could cause anincrease in parasite levels in the produc-tion stream. In addition to being sam-pled for Giardia and Cryptosporidium cysts,the streams were analyzed for particlecounts. Figures 1 and 2 show the datacollected at the Bangor and MoshannonValley plants on cysts and particle counts.In most all data presented, results areshown for round 1 and round 2, whichwere two different sampling events.
The spent-filter backwash water fromboth plants had high cyst concentrationscompared with the raw water. Spent-fil-ter backwash water at Moshannon Val-ley had Giardia and Cryptosporidium lev-els of >150 cysts/L. Bangor had levels of8-14 cysts/L in the spent-filter backwashwater. Raw-water cyst concentrationsfor the two plants were in the range of0.05-3 cysts/L. Recycle streams at bothplants, even after sedimentation, con-tained cyst levels higher than those ofthe raw water, and in general the recy-cle stream caused an increase in the cystconcentration in the treatment process feedwater.
Particle count data were also collected for the recy-cle stream, raw water, and mixed raw plus recycle,with key results shown in Figures 1 and 2. ForMoshannon Valley, Giardia-size particles (5-15 pm)increased in the mixed water from -500 counts/mLwithout recycling to 1,300-1,500 counts/mL withrecycling. Cryptosporidium-size particles (2-4 pm)increased from 1,400-2,000 to 6,000-7,000 counts/mL,
l©m©vaS of particles put) fromwater at
io
3.0
2,0
1.0 I 1 I I1 2 3 4
Settling Velocity—cm/min
0 0.25 0.50 0.75 1.0 > 1.25
Overflow Rate—gpm/sq ft
Polymer—POL-EZ 652
or both increased by a factor of -3. At the Bangorplant, Giardia-size particles increased from -450 to1,800 counts/mL with recycling and Cryptosporidium-size particles increased from 1,600 to 7,900 counts/mL.
Although both plants showed an increase in par-ticles in the raw water during recycling, filtered waterwas not affected. In fact, particle counts were slightlylower in the filtered water during recycle. Figure 3summarizes the filter log removal efficiencies for Gz-
NOVEMBER 1994 SS
Flow diagram used for cyst mass iiaSance calculations
aOf
Q + Of,— — — • nf
Q#CR
Backwash (BW)water treatment
Filter ._ E .̂ Finishedwater
Q
/i.e., 100 percent \Ogw \ removed )CBW \ by filters /
^v Vanble percent^— removal, depending
on treatment method
Particle loading to the treatment process with continuous recycling
100
Percent Particle Removal From the Recycle Stream—percent
FIGURED
20
12
Particle loading t© the treatment process with intermittentrecycling
20 percent
25 percent
30 percent
SSpercerrt
40 percent
I I0 20
Percent Particle Removal From the Recycle Stream—percent
100
ardia-size particles at theseplants. These results reflect theincreased removal efficiencyof the filters during recycling.Of course, log removal willgenerally be higher as the par-ticles in the raw water in-crease, in this case as a resultof recycling.
Both of the plants studiedused sedimentation of thewaste streams prior to recy-cling. In fact, both had rela-tively large settling tanks, andthe solids removal efficiencywas very good. At Moshan-non Valley, recycling onlyincreased the raw-water tur-bidity from 0.6 to 0.8 ntu.These low turbidity increasesare indicative of the efficientsettling of the spent backwashwater prior to recycling. AtBangor the increase was from-0.3 to 1.3 ntu. Laboratorysettling studies were con-ducted at both plants to assessthe importance of sedimenta-tion of the waste streams priorto recycling on reducing cyst-size particles. An example oftypical findings is shown forBangor in Figure 4. This fig-ure shows particle removal inthe Giardia size range for dif-ferent clarifier loading ratesand different polymer dosages.
Full-scale correlation testsshowed that the laboratorystudies such as that depictedin Figure 4 gave an acceptableprediction of full-scale perfor-mance, with the conclusionthat high overflow rates couldresult in low sedimentationefficiency and therefore highercyst concentrations in the re-cycle stream. In fact, only verylow overflow rates were suc-cessful in reducing cyst-sizeparticles in the waste streams.Figure 4 also shows that addi-tion of nonionic polymer wasvery useful in reducing theGiardia-size particles, as wasfound with all tests conducted.The same polymer was alsouseful in reducing Cryp-tosporidium-size particles.
A mass balance was com-puted using the flow diagram
58 JOURNAL AWWA
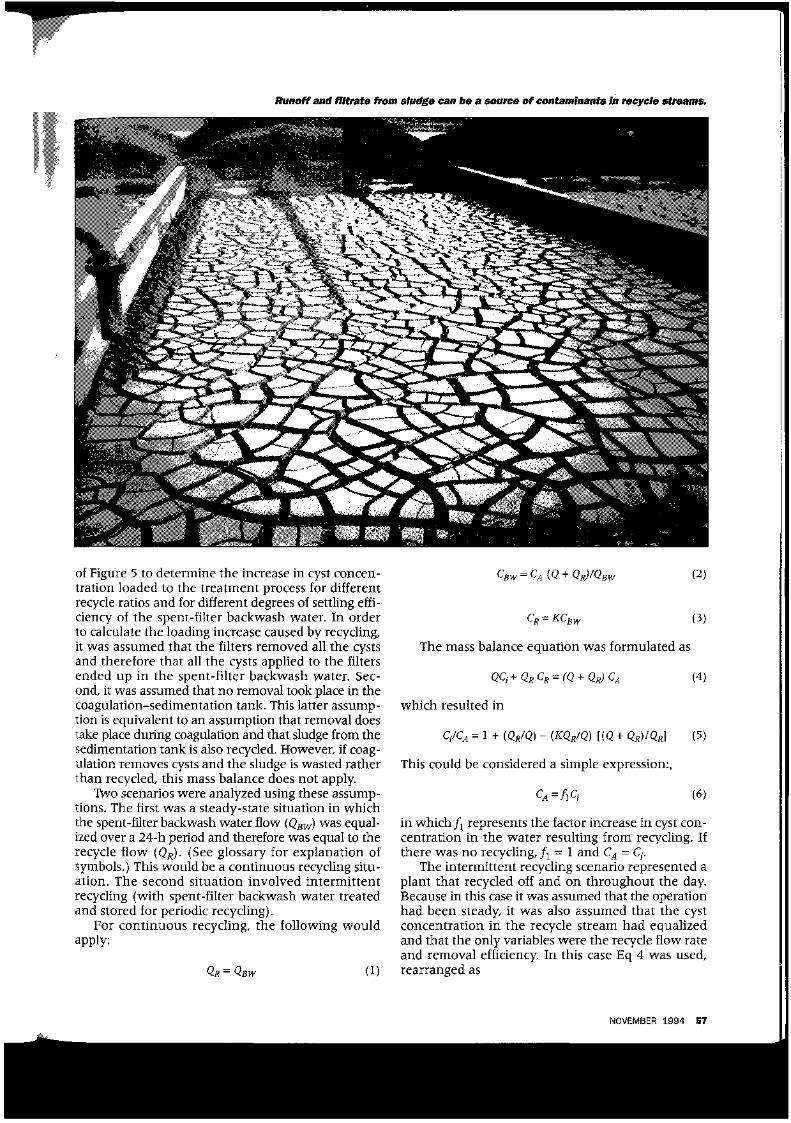
from can ise a source of contaminants in reeyef© streams*
of Figure 5 to determine the increase in cyst concen-tration loaded to the treatment process for differentrecycle ratios and for different degrees of settling effi-ciency of the spent-filter backwash water. In orderto calculate the loading increase caused by recycling,it was assumed that the filters removed all the cystsand therefore that all the cysts applied to the filtersended up in the spent-filter backwash water. Sec-ond, it was assumed that no removal took place in thecoagulation-sedimentation tank. This latter assump-tion is equivalent to an assumption that removal doestake place during coagulation and that sludge from thesedimentation tank is also recycled. However, if coag-ulation removes cysts and the sludge is wasted ratherthan recycled, this mass balance does not apply.
TWo scenarios were analyzed using these assump-tions. The first was a steady-state situation in whichthe spent-filter backwash water flow (Q^w) was equal-ized over a 24-h period and therefore was equal to therecycle flow (Q#). (See glossary for explanation ofsymbols.) This would be a continuous recycling situ-ation. The second situation involved intermittentrecycling (with spent-filter backwash water treatedand stored for periodic recycling).
For continuous recycling, the following wouldapply:
! ~ QBW (1)
(2)
CR = KCBW (3)
The mass balance equation was formulated as
QCi+QRCR=(Q + QR)CA (4)
which resulted in
q/CA = I + (QR/Q) - (KQR/Q) [(Q + QR)/QR] (5)
This could be considered a simple expression:,
£ =f}C- (6)
in which/! represents the factor increase in cyst con-centration in the water resulting from recycling. Ifthere was no recycling, fi = I and CA = C/.
The intermittent recycling scenario represented aplant that recycled off and on throughout the day.Because in this case it was assumed that the operationhad been steady, it was also assumed that the cystconcentration in the recycle stream had equalizedand that the only variables were the recycle flow rateand removal efficiency. In this case Eq 4 was used,rearranged as
NOVEMBER 1994 57
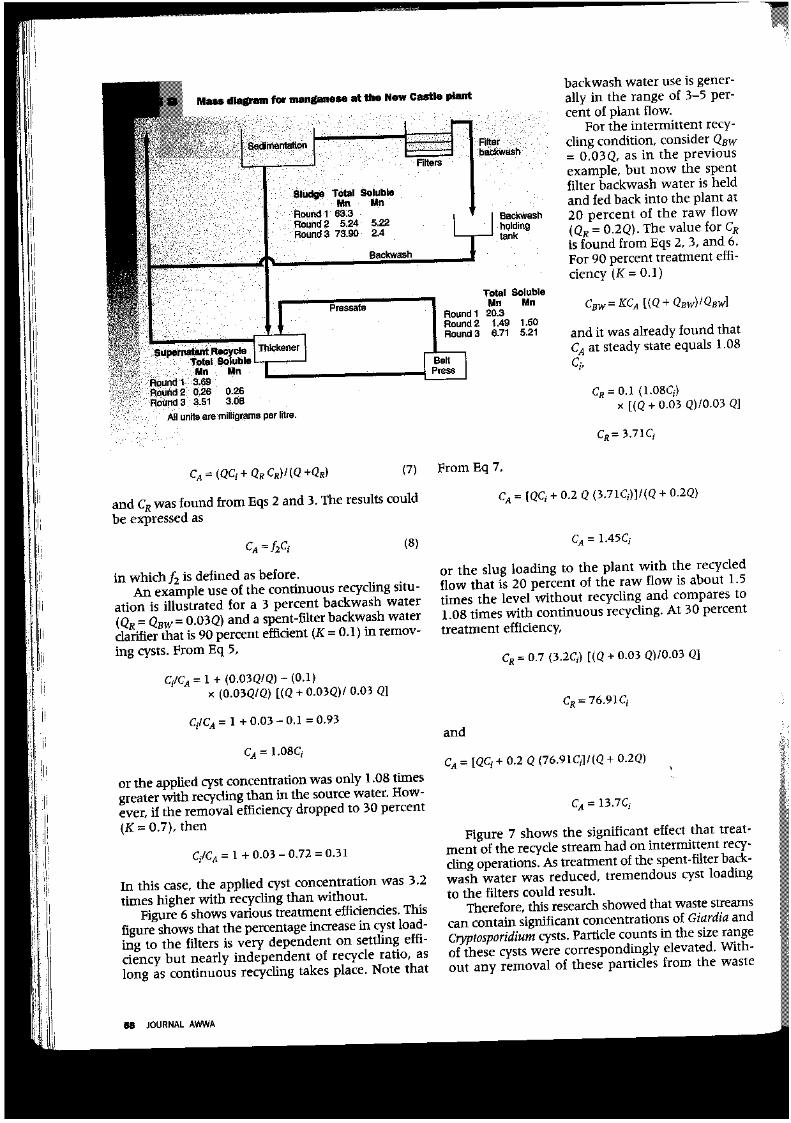
for mangan®s© at th© Stew
Sedimentation
Filters
Sludge Total SolubleMn IWn
Round 1 63.3Round 2 5.24 5.22Rounds 73.90 2,4
Filterbackwash
Backwashholdingtank
Backwash
Pressate
Supernatant RecycleTotal SolubleMn Mn | ^
Round 1 3.69Round 2 0,26 0.26Rounds 3.51 3.08
AH units are milligrams per litre.
Total SolubleMn Mn
Round 1 20.3Round 2 1.49 1.50Round 3 6.71 5.21
backwash water use is gener-ally in the range of 3-5 per-cent of plant flow.
For the intermittent recy-cling condition, consider QBW= 0.03Q, as in the previousexample, but now the spentfilter backwash water is heldand fed back into the plant at20 percent of the raw flow(QR = 0.2Q). The value for CRis found from Eqs 2, 3, and 6.For 90 percent treatment effi-ciency (1C = 0.1)
and it was already found thatCA at steady state equals 1.08C,
Q = 0.1 (1.08Q)x [(Q + 0.03 Q)/0.03 Q]
CR=3.7lCf
CA=(QCi+QRCR)/(Q+QR)
and CR was found from Eqs 2 and 3. The results couldbe expressed as
CA=f2Ct (8)
in which/2 is defined as before.An example use of the continuous recycling situ-
ation is illustrated for a 3 percent backwash water/Q = QBW= 0.03Q) and a spent-filter backwash waterclarifier that is 90 percent efficient (K = 0.1) in remov-ing cysts. From Eq 5,
Q/CA=1 + (0.03Q/Q)-(0.1)x (0.03Q/Q) [(Q + 0.03Q)/ 0.03 Q]
Q/CA= 1+0.03-0.1 =0.93
CA= 1.08Q
or the applied cyst concentration was only 1.08 timesgreater with recycling than in the source water. How-ever, if the removal efficiency dropped to 30 percent(K = 0.7), then
Q/CA= 1 +0.03-0.72 = 0.31
In this case, the applied cyst concentration was 3.2times higher with recycling than without.
Figure 6 shows various treatment efficiencies. Thisfigure shows that the percentage increase in cyst load-ing to the filters is very dependent on settling effi-ciency but nearly independent of recycle ratio, aslong as continuous recycling takes place. Note that
(7) From Eq 7',
CA = lQCt + 0.2 Q (3.71Q)]/(Q + 0.2Q)
CA= 1.45Q
or the slug loading to the plant with the recycledflow that is 20 percent of the raw flow is about 1.5times the level without recycling and compares to1.08 times with continuous recycling. At 30 percenttreatment efficiency,
CR = 0.7 (3.2Q) [(Q + 0.03 Q)/0.03 Q]
= 76.9lCi
and
= [QCf + 0.2 Q (76.91C0/(Q + 0.2Q)
Figure 7 shows the significant effect that treat-ment of the recycle stream had on intermittent recy-cling operations. As treatment of the spent-filter back-wash water was reduced, tremendous cyst loadingto the filters could result.
Therefore, this research showed that waste streamscan contain significant concentrations of Giardia andCryptosporidium cysts. Particle counts in the size rangeof these cysts were correspondingly elevated. With-out any removal of these particles from the waste
SS JOURNAL AWWA
Total SolubleMn Mn
Round 1 109 0,32Round 2 0,09 0,07
Recycle
stream prior to recycling, theincreased loading to the plantcould be very high. Plain sed-imentation of the spent-filterbackwash water, particularlyin the range of typical over-flow rate design, may be veryinefficient in removing thecysts. A plant removing only20 percent of the particlesprior to recycling and operat-ing with an intermittent 20percent recycle ratio couldload the plant at more than15 times the cyst concentra-tion present in the originalsource water. Obviously, if adisruption in plant treatmentoccurs during a period of highcyst concentrations, then aninefficient or poorly operatedrecycle system can contributeto the situation. The impor-tant factors in reducing theloading are first to equalizethe recycle rate so that it iscontinuous rather than inter-mittent and second to prop-erly treat the waste streamsfor cyst removal prior torecycling. With continuousrecycling and 80 percenttreatment efficiency, theincreased loading to the plantwould only be -1.2 times thesource loading, which wouldprobably be acceptable formost plants.
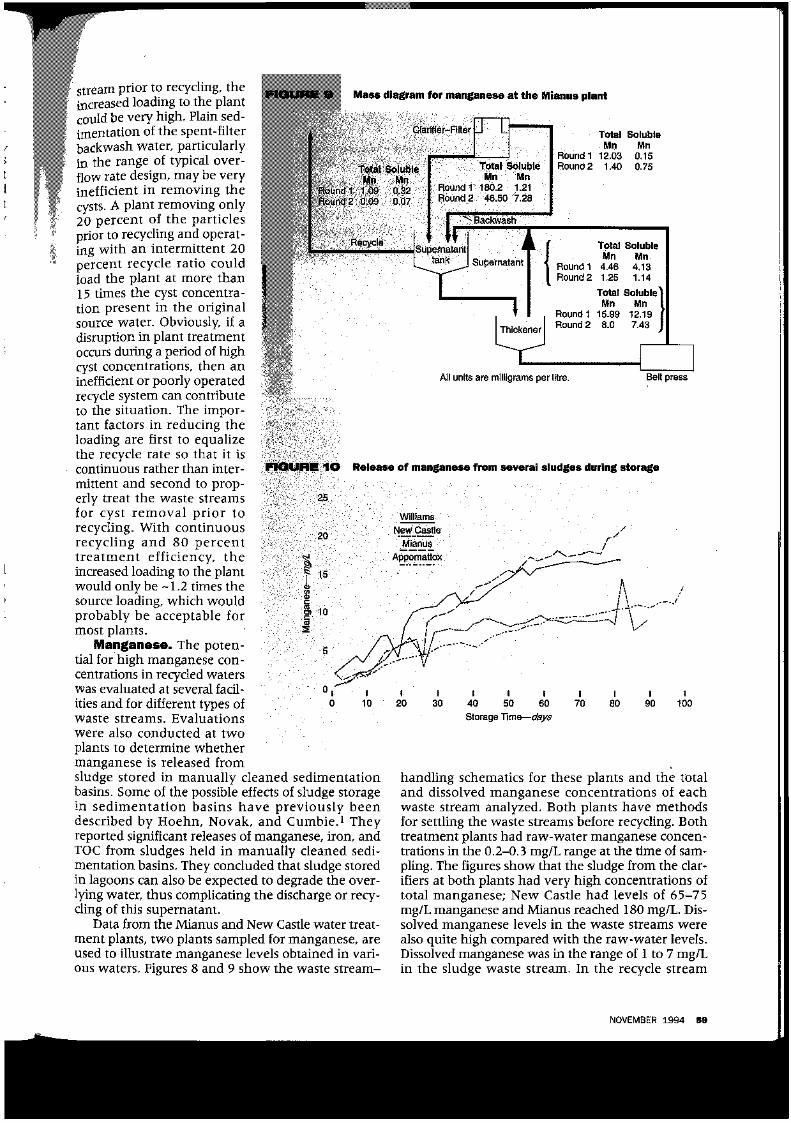
The poten-tial for high manganese con-centrations in recycled waterswas evaluated at several facil-ities and for different types ofwaste streams. Evaluationswere also conducted at twoplants to determine whethermanganese is released fromsludge stored in manually cleaned sedimentationbasins. Some of the possible effects of sludge storagein sedimentation basins have previously beendescribed by Hoehn, Novak, and Cumbie.1 Theyreported significant releases of manganese, iron, andTOG from sludges held in manually cleaned sedi-mentation basins. They concluded that sludge storedin lagoons can also be expected to degrade the over-lying water, thus complicating the discharge or recy-cling of this supernatant.
Data from the Mianus and New Castle water treat-ment plants, two plants sampled for manganese, areused to illustrate manganese levels obtained in vari-ous waters. Figures 8 and 9 show the waste stream-
fl ; diagram for manganese at the Mianus p9atif
Clarifier-Rlter
Round 1Round 2
Total SolubleWin Mn
180,2 1,2146,50 7,28
^ Backwash
Round 1Round 2
Total SolubleMn Mn
12,03 0.151,40 0,75
Supernatanttank Supernatant Round 1
Round 2
Round 1Round 2
Total SolubleMn Mn
4.46 4.131,25 1.14
Total Soluble]Mn Mn |
15.99 12.198.0 7.43
All units are milligrams per litre. Belt press
FIGURE 1O Release of manganese from several sludges during storage
25
20
Williams
10 50 60Storage Time—days
handling schematics for these plants and the totaland dissolved manganese concentrations of eachwaste stream analyzed. Both plants have methodsfor settling the waste streams before recycling. Bothtreatment plants had raw-water manganese concen-trations in the 0.2-0.3 mg/L range at the time of sam-pling. The figures show that the sludge from the clar-ifiers at both plants had very high concentrations oftotal manganese; New Castle had levels of 65-75mg/L manganese and Mianus reached 180 mg/L. Dis-solved manganese levels in the waste streams werealso quite high compared with the raw-water levels.Dissolved manganese was in the range of 1 to 7 mg/Lin the sludge waste stream. In the recycle stream
NOVEMBER 1994 Si
of at River plant
0,06
0,05
0.04
0-03
0.02
0,01
Basin Influent
Effluent of manually cleaned basin
Effluent of mechanically cleaned basin
06 1 . 2 3 4 5
Time—weeks
*Sample taken just after basin was cleaned
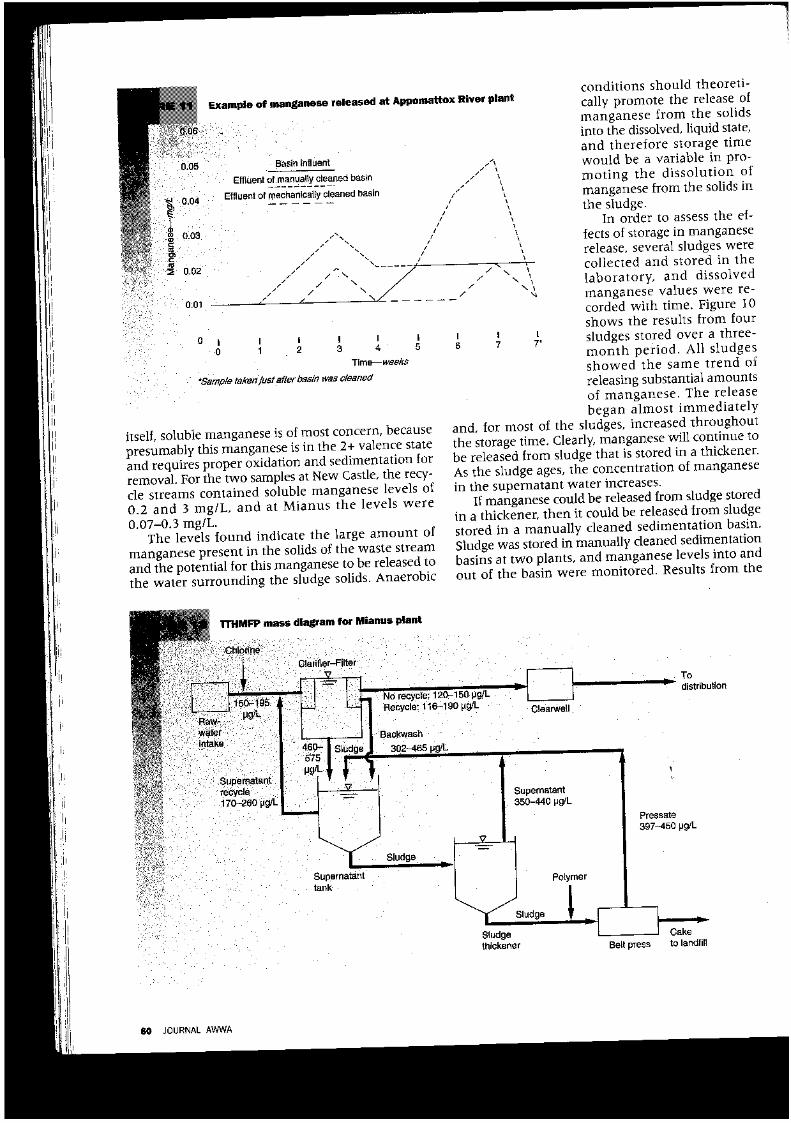
itself, soluble manganese is of most concern, becausepresumably this manganese is in the 2+ valence stateand requires proper oxidation and sedimentation forremoval. For the two samples at New Castle, the recy-cle streams contained soluble manganese levels of0.2 and 3 mg/L, and at Mianus the levels were0.07-0.3 mg/L.
The levels found indicate the large amount olmanganese present in the solids of the waste stream
conditions should theoreti-cally promote the release ofmanganese from the solidsinto the dissolved, liquid state,and therefore storage timewould be a variable in pro-moting the dissolution ofmanganese from the solids inthe sludge.
In order to assess the ef-fects of storage in manganeserelease, several sludges werecollected and stored in thelaboratory, and dissolvedmanganese values were re-corded with time. Figure 10shows the results from four
i ' '* sludges stored over a three-6 7 T month period. All sludges
showed the same trend ofreleasing substantial amountsof manganese. The releasebegan almost immediately
and for most of the sludges, increased throughoutthe storage time. Clearly, manganese will continue tobe released from sludge that is stored in a thickener.As the sludge ages, the concentration of manganesein the supernatant water increases.
If manganese could be released from sludge storedin a thickener, then it could be released from sludgestored in a manually cleaned sedimentation basin.Sludge was stored in manually cleaned sedimentation
: levels into andthe
for
Chlorine
^ Todistribution
No recycle: 120-150 ug/LRecycle:116-190ug/L
Supernatantrecycle170-260 ug/L
Sludgethickener
_ CakeBelt press to landfill
JOURNAL AWWA
Appomattox River watertreatment plant are shown inFigure 11. The data show thatthe dissolved manganese con-centration leaving the sedi-mentation basin containingaccumulated sludge was con-tinually rising and consistentlyhigher than the manganeseconcentrations leaving thecontinuously cleaned basin.In fact, the dissolved man-ganese level leaving the man-ually cleaned basin was higherthan the level entering thebasin, indicating a releasefrom the stored sludge intothe basin effluent.
From these data it wasconcluded that sludge con-tained in sludge thickeners orstored in sedimentation basinsfrom manganese removalplants is characterized by lowdissolved oxygen and highconcentrations of dissolvedmanganese in the water sur-rounding the sludge solids.The manganese concentrationin the sludge water willincrease with storage time asmore manganese is releasedfrom the solids. Some man-ganese will therefore be re-leased to the thickener over-flow and recycled to the headof the plant or will be releasedin the sedimentation basin andincrease the applied filtermanganese concentrations.Normally the manganese con-centrations are low and con-trollable if properly monitoredand treated, as was the case atthe plants investigated in thisresearch. However, if thesludge accumulation was al-lowed to occupy a significantportion of the thickener or basin, or if a hydraulicdisruption occurred, then a situation could develop inwhich the large concentrations of manganese pre-sent in the sludge water could be flushed into therecycle stream or the sedimentation basin effluent.Plants should carefully monitor sludge blanket levelsand manganese concentrations, and basins shouldbe cleaned as often as possible. Careful considerationshould be given to the use of manually cleaned sed-imentation basins.
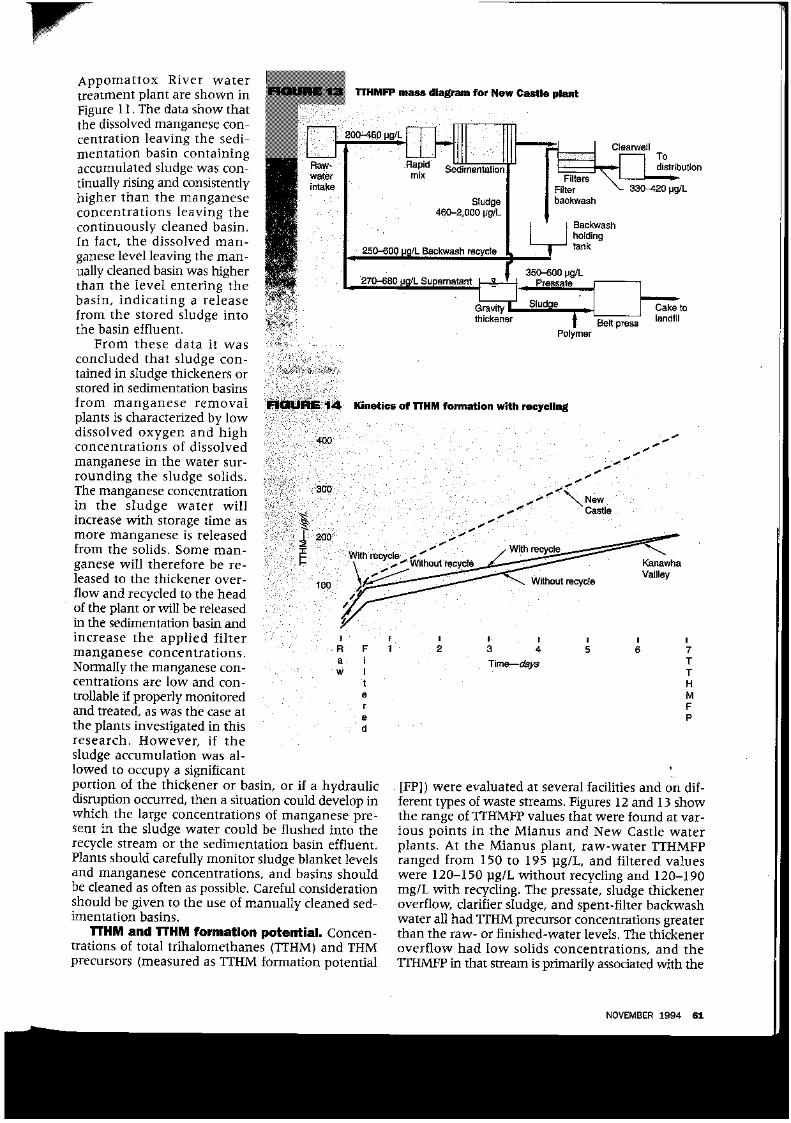
and Concen-trations of total trihalomethanes (TTHM) and THMprecursors (measured as TTHM formation potential
lit TTHMFP mass diagram for New Castle plant
2GQ-48Q |jg/L
Raw-waterintake
Rapid sedimentationmix
Sludge460-2,000 ug/L
250-600 fjg/L Backwash recycle
270-680 fjp/L Supernatant
Ctl
i?
Gravitylickene
Filters \Filterbackwash
Backwashholding
J iarm
350-600 ug/L— Pressate
f Slud?e
learwellTodistribution
^ 330-420 ug/L
Cake tor f Belt press landTlt
Polymer
Kinetics ©f TTHM with
400
300
200
"̂ Castle
With recycle
/ [FP]) were evaluated at several facilities and on dif-ferent types of waste streams. Figures 12 and 13 showthe range of TTHMFP values that were found at var-ious points in the Mianus and New Castle waterplants. At the Mianus plant, raw-water TTHMFPranged from 150 to 195 pg/L, and filtered valueswere 120-150 pg/L without recycling and 120-190mg/L with recycling. The pressate, sludge thickeneroverflow, clarifier sludge, and spent-filter backwashwater all had TTHM precursor concentrations greaterthan the raw- or finished-water levels. The thickeneroverflow had low solids concentrations, and theTTHMFP in that stream is primarily associated with the
NOVEMBER 1994 61
$ f$ stream concentrations at
800
600
0 400
739
528
200 152iRaw Backwash Lagoon Overflow Clarifier Backwash
Supernatant Sludge Sludge
> FIGURE It* ©f waste stream &@C concentrations at New
3,000
2,500
2,000
O 1,500
1,000
500
2,441
117 102
Raw Water During Mixing Settled Spent PressateSludge Backwash
liquid phase. Because theTTHMFP was higher in thesestreams than in the rawwater, it appears that someprecursors were released fromthe solids into the thickeneroverflow. The excess TTHMFPassociated with the clarifierflush and the spent-filterbackwash appears to be asso-ciated with the solids with lit-tle release to the liquid phase,because settling of thesewastes resulted in TTHMFPlevels almost the same as inthe raw or filtered water.Recycling of settled wastestreams had very little, if any,effect on filtered TTHMFP.The New Castle plant showedvery similar results. The wastestreams with solids containedhigh TTHMFP, but settledstreams had TTHMFP levelsnear that of the raw water.However, at New Castle oneround of sampling did showelevated levels of TTHMFP inthe recycle stream.
The recycle streams con-tained TTHM, which can formin the waste tanks as a resultof the use of chlorinatedbackwash water. When therecycled water is mixed withthe raw water, the net TTHMconcentration in the plantinfluent will increase by therecycle ratios.
FIGURE 17 Example ©f A0C concentrations at New with and without
recycling
800
600
B 400
200
309.8
32.0 26.0
Raw Water BeforeFiltration
During Recycle ThickenerFiltration Backwash Recycle
TTHMm = [TTHMR QR (9)
+ TTHMiQ]/QR+Q
Given this relationship,the influent water TTHM con-centration will increase and,depending on formationkinetics, the finished-waterTTHM level may also behigher. Figure 14 showsexamples found at two of theplants studied. At the Ka-nawha Valley water treat-ment plant, the influentwater TTHM concentrationincreased from 14 to 29 jig/Lwith the introduction of spentbackwash water. This approx-imately 20-yg/L differentialwas carried through the plantsuch that the filtered water
62 JOURNAL AWWA
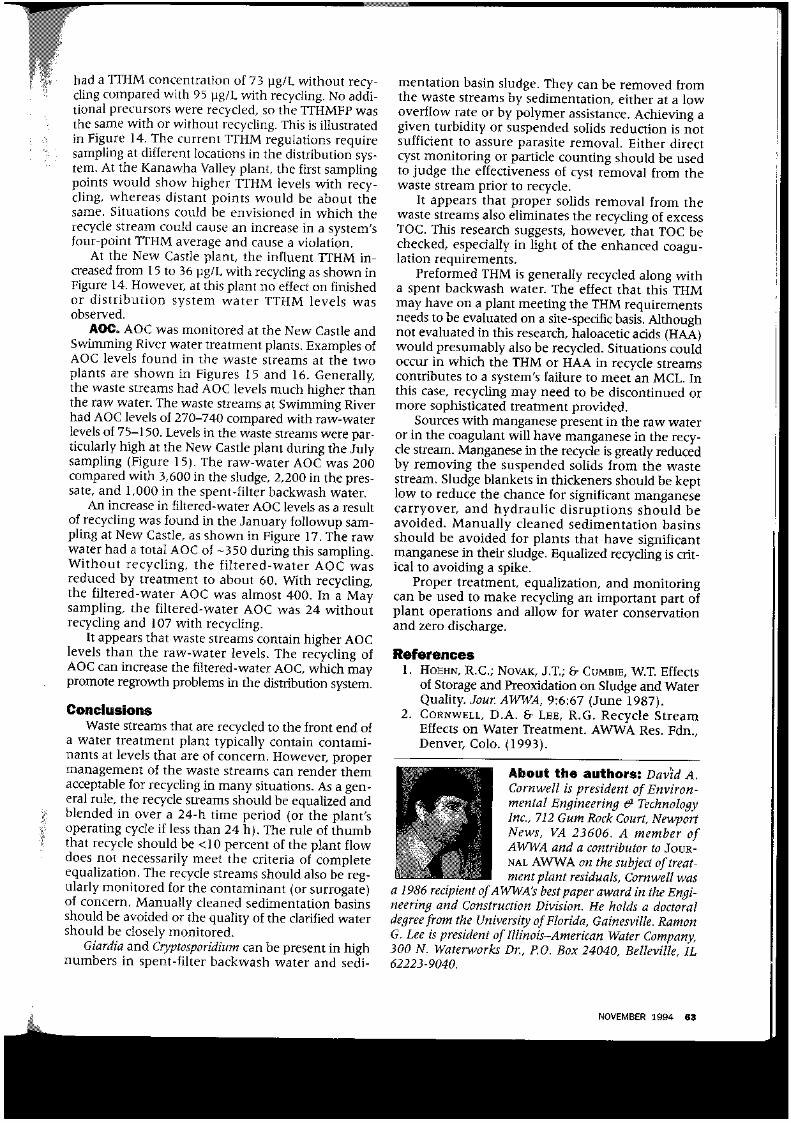
had a TTHM concentration of 73 pg/L without recy-cling compared with 95 pg/L with recycling. No addi-tional precursors were recycled, so the TTHMFP wasthe same with or without recycling. This is illustratedin Figure 14. The current TTHM regulations requiresampling at different locations in the distribution sys-tem. At the Kanawha Valley plant, the first samplingpoints would show higher TTHM levels with recy-cling, whereas distant points would be about thesame. Situations could be envisioned in which therecycle stream could cause an increase in a system'sfour-point TTHM average and cause a violation.
At the New Castle plant, the influent TTHM in-creased from 15 to 36 pg/L with recycling as shown inFigure 14. However, at this plant no effect on finishedor distribution system water TTHM levels wasobserved.
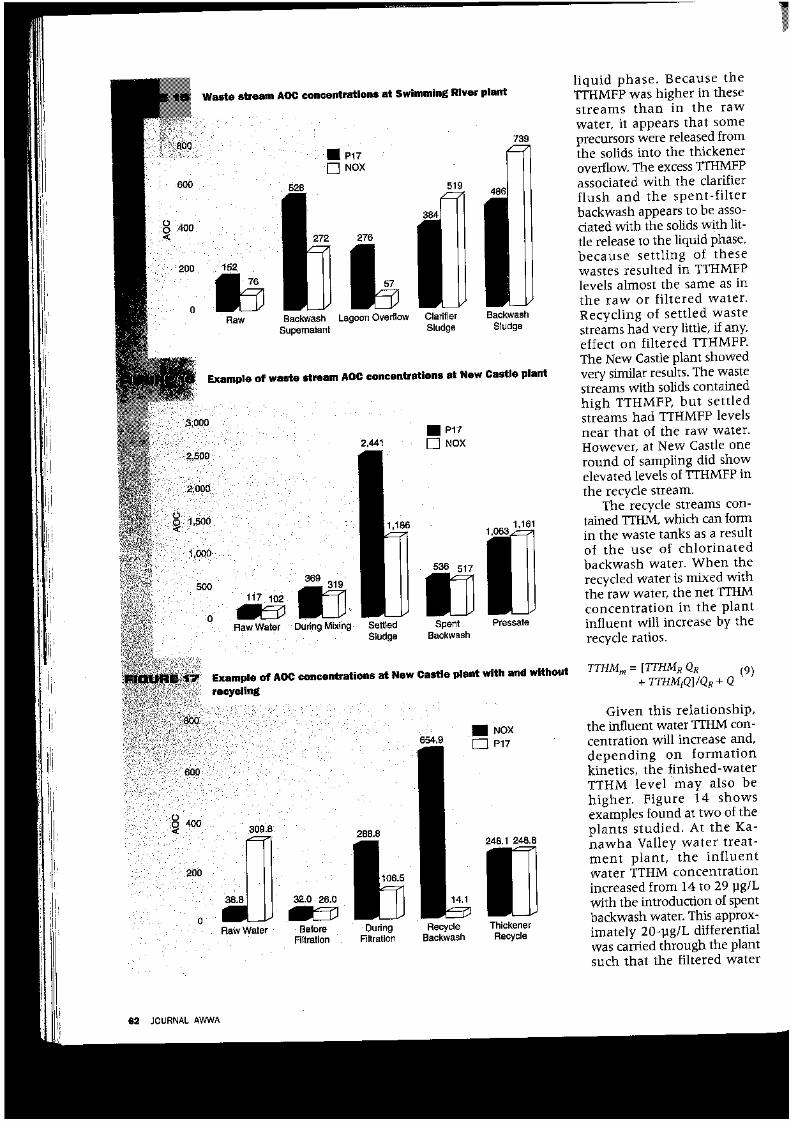
AOC was monitored at the New Castle andSwimming River water treatment plants. Examples ofAOC levels found in the waste streams at the twoplants are shown in Figures 15 and 16. Generally,the waste streams had AOC levels much higher thanthe raw water. The waste streams at Swimming Riverhad AOC levels of 270-740 compared with raw-waterlevels of 75-150. Levels in the waste streams were par-ticularly high at the New Castle plant during the Julysampling (Figure 15). The raw-water AOC was 200compared with 3,600 in the sludge, 2,200 in the pres-sate, and 1,000 in the spent-filter backwash water.
An increase in filtered-water AOC levels as a resultof recycling was found in the January followup sam-pling at New Castle, as shown in Figure 17. The rawwater had a total AOC of -350 during this sampling.Without recycling, the filtered-water AOC wasreduced by treatment to about 60. With recycling,the filtered-water AOC was almost 400. In a Maysampling, the filtered-water AOC was 24 withoutrecycling and 107 with recycling.
It appears that waste streams contain higher AOClevels than the raw-water levels. The recycling ofAOC can increase the filtered-water AOC, which maypromote regrowth problems in the distribution system.
ConclusionsWaste streams that are recycled to the front end of
a water treatment plant typically contain contami-nants at levels that are of concern. However, propermanagement of the waste streams can render themacceptable for recycling in many situations. As a gen-eral rule, the recycle streams should be equalized andblended in over a 24-h time period (or the plant'soperating cycle if less than 24 h). The rule of thumbthat recycle should be <10 percent of the plant flowdoes not necessarily meet the criteria of completeequalization. The recycle streams should also be reg-ularly monitored for the contaminant (or surrogate)of concern. Manually cleaned sedimentation basinsshould be avoided or the quality of the clarified watershould be closely monitored.
Giardia and Cryptosporidium can be present in highnumbers in spent-filter backwash water and sedi-
mentation basin sludge. They can be removed fromthe waste streams by sedimentation, either at a lowoverflow rate or by polymer assistance. Achieving agiven turbidity or suspended solids reduction is notsufficient to assure parasite removal. Either directcyst monitoring or particle counting should be usedto judge the effectiveness of cyst removal from thewaste stream prior to recycle.
It appears that proper solids removal from thewaste streams also eliminates the recycling of excessTOC. This research suggests, however, that TOC bechecked, especially in light of the enhanced coagu-lation requirements.
Preformed THM is generally recycled along witha spent backwash water. The effect that this THMmay have on a plant meeting the THM requirementsneeds to be evaluated on a site-specific basis. Althoughnot evaluated in this research, haloacetic acids (HAA)would presumably also be recycled. Situations couldoccur in which the THM or HAA in recycle streamscontributes to a system's failure to meet an MCL. Inthis case, recycling may need to be discontinued ormore sophisticated treatment provided.
Sources with manganese present in the raw wateror in the coagulant will have manganese in the recy-cle stream. Manganese in the recycle is greatly reducedby removing the suspended solids from the wastestream. Sludge blankets in thickeners should be keptlow to reduce the chance for significant manganesecarryover, and hydraulic disruptions should beavoided. Manually cleaned sedimentation basinsshould be avoided for plants that have significantmanganese in their sludge. Equalized recycling is crit-ical to avoiding a spike.
Proper treatment, equalization, and monitoringcan be used to make recycling an important part ofplant operations and allow for water conservationand zero discharge.
References1. HOEHN, R.C.; NOVAK, J.T.; & CUMBIE, W.T. Effects
of Storage and Preoxidation on Sludge and WaterQuality. Jour. AWWA, 9:6:67 (June 1987).
2. CORNWELL, D.A. & LEE, R.G. Recycle StreamEffects on Water Treatment. AWWA Res. Fdn.,Denver, Colo. (1993).
the David A.Cornwell is president of Environ-mental Engineering & TechnologyInc., 712 Gum Rock Court, NewportNews, VA 23606. A member ofAWWA and a contributor to JOUR-NAL AWWA on the subject of treat-ment plant residuals, Cornwell was
a 1986 recipient of AWWAs best paper award in the Engi-neering and Construction Division. He holds a doctoraldegree from the University of Florida, Gainesville. RamonG. Lee is president of Illinois-American Water Company,300 N. Waterworks Dr., P.O. Box 24040, Belleville, IL62223-9040.
NOVEMBER 1994 ©3