Embed Size (px)
Citation preview

Marketing Solar for Agricultural Uses
It Don’t Mean a Thing Without Good Marketing!!

2
MY AGENDA
Survey of agricultural uses
Economics – case studies
Marketing solar in Minnesota
3
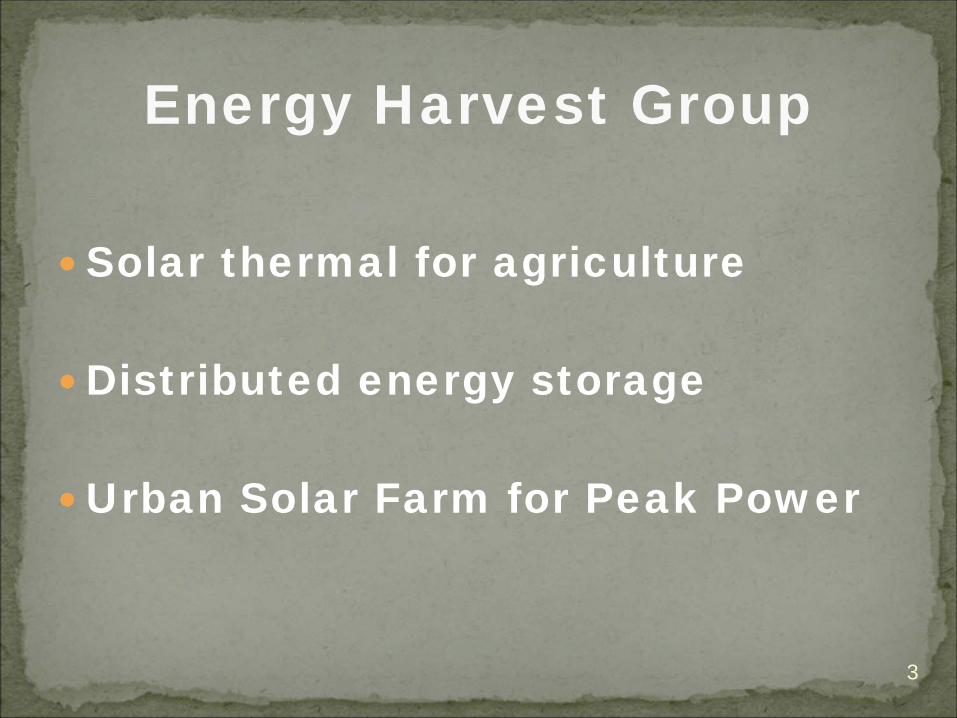
Energy Harvest Group
Solar thermal for agriculture
Distributed energy storage
Urban Solar Farm for Peak Power
4
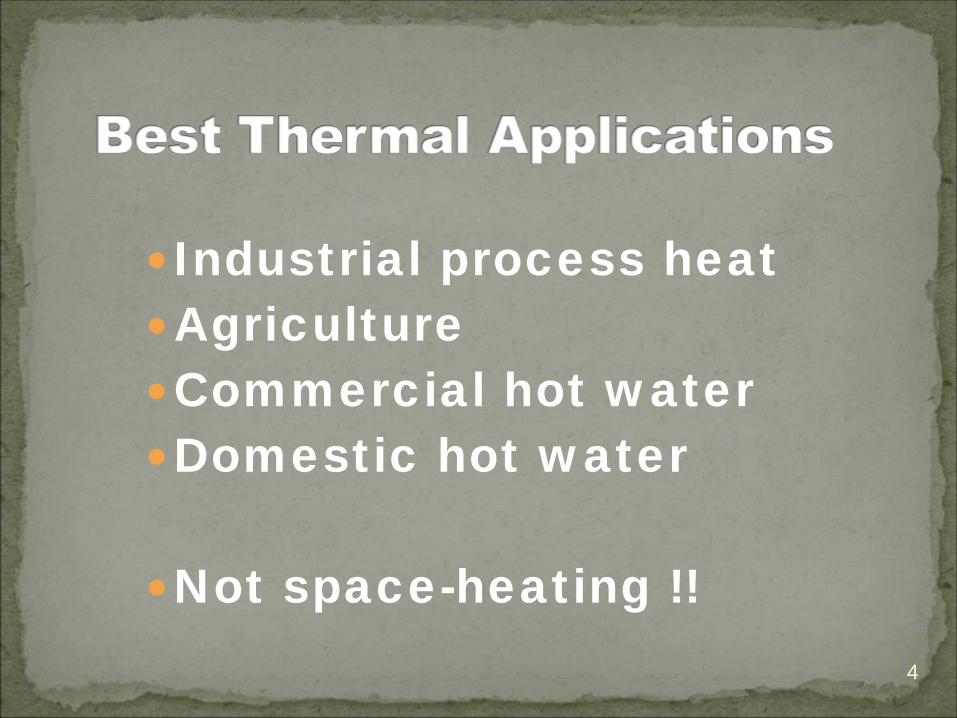
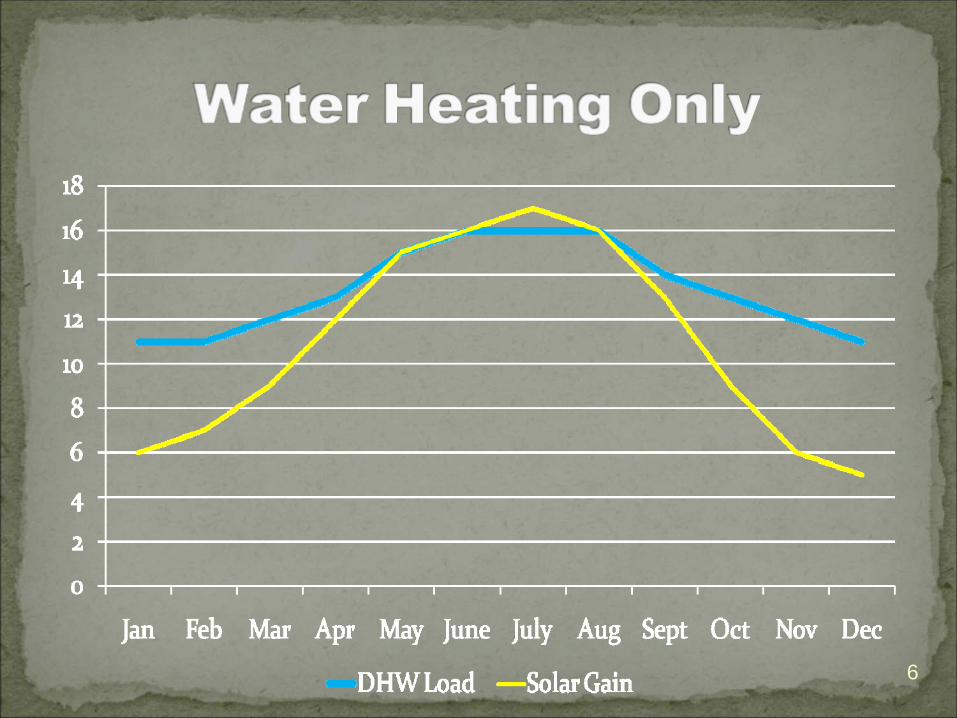
Industrial process heatAgricultureCommercial hot waterDomestic hot water
Not space-heating !!
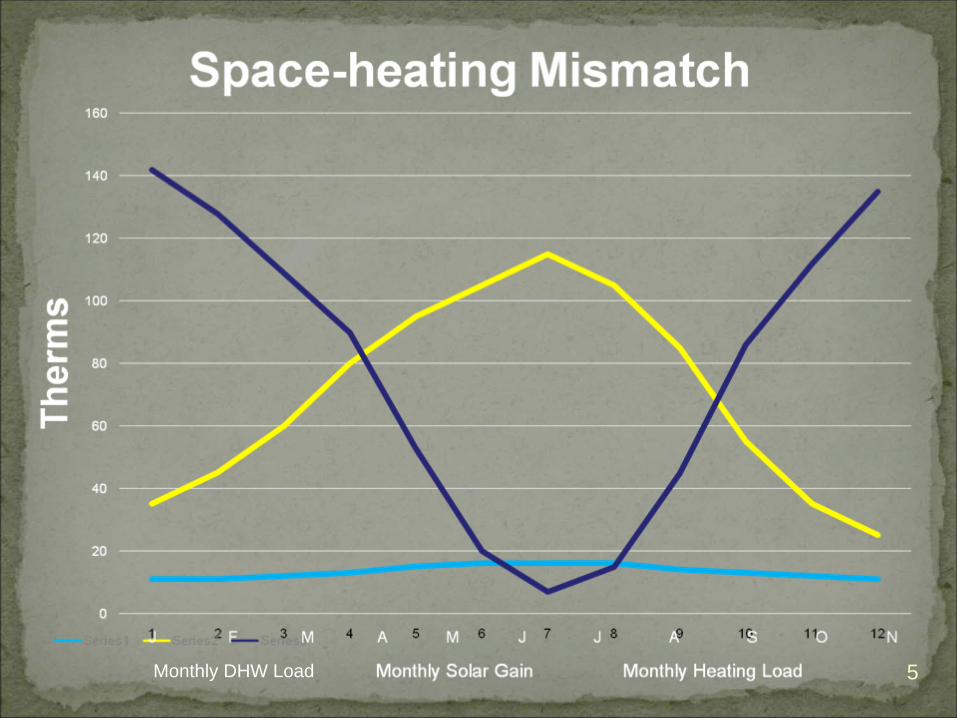
5Monthly DHW Load
6
7
Stock wateringElectric fencingEmergency powerElectric grid support
8
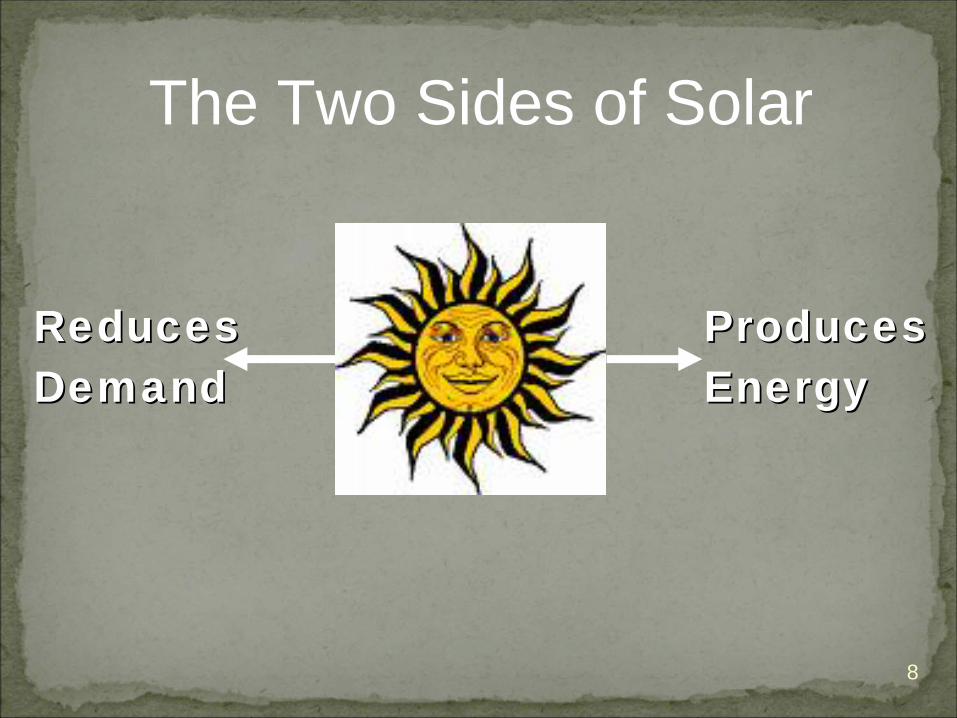
The Two Sides of Solar
ReducesReducesDemandDemand
ProducesProducesEnergyEnergy
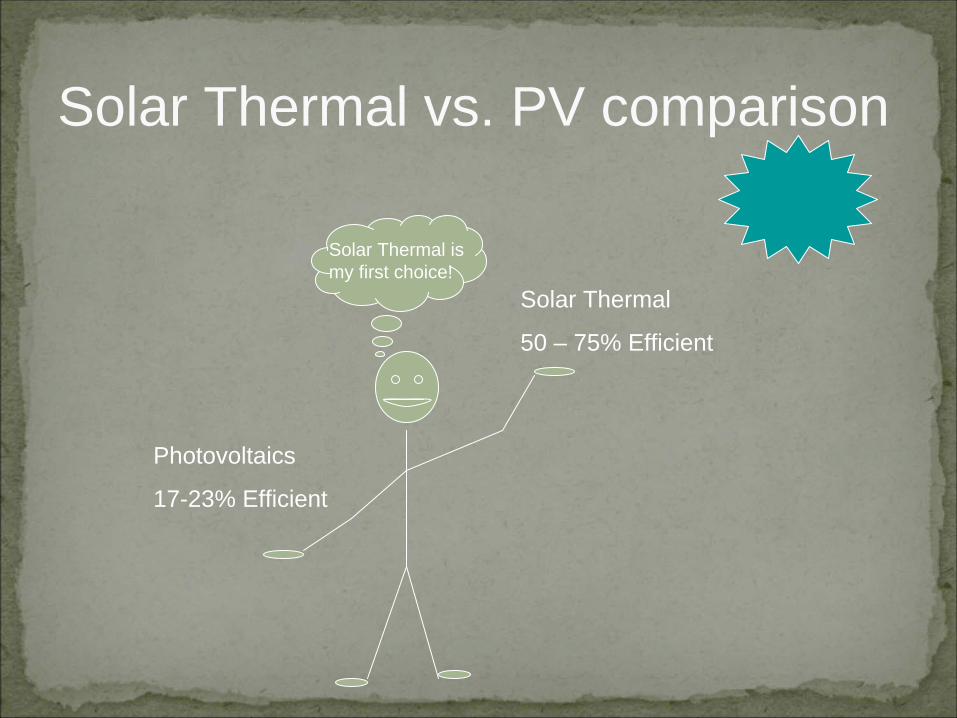
Solar Thermal vs. PV comparison
Solar Thermal
50 – 75% Efficient
Photovoltaics
17-23% Efficient
Solar Thermal is my first choice!
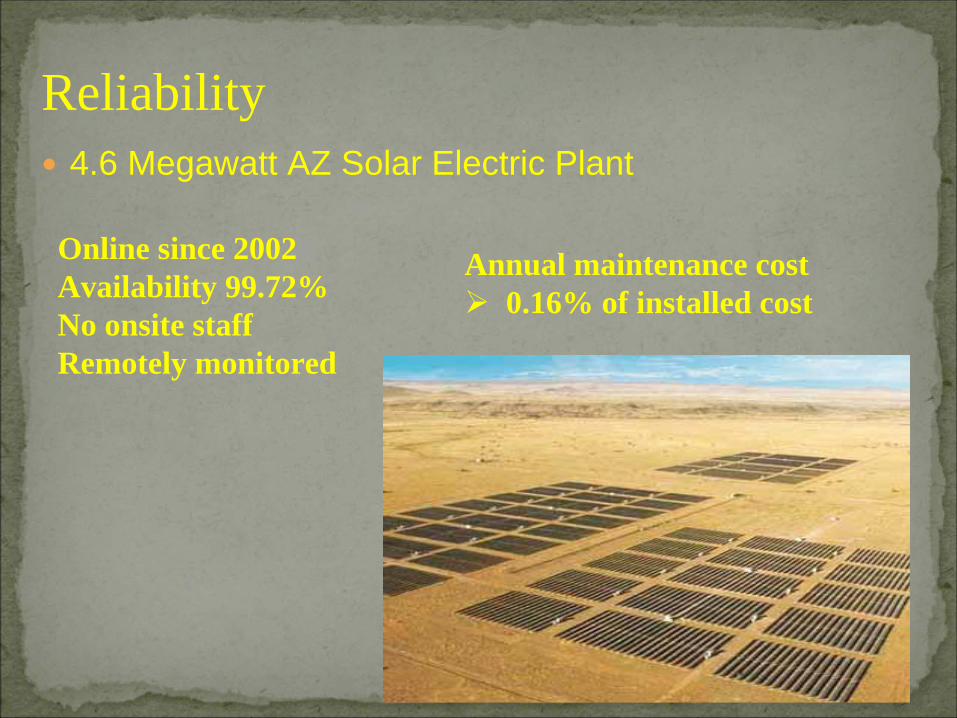
Reliability
4.6 Megawatt AZ Solar Electric Plant
Online since 2002Availability 99.72%No onsite staffRemotely monitored
Annual maintenance cost 0.16% of installed cost
11
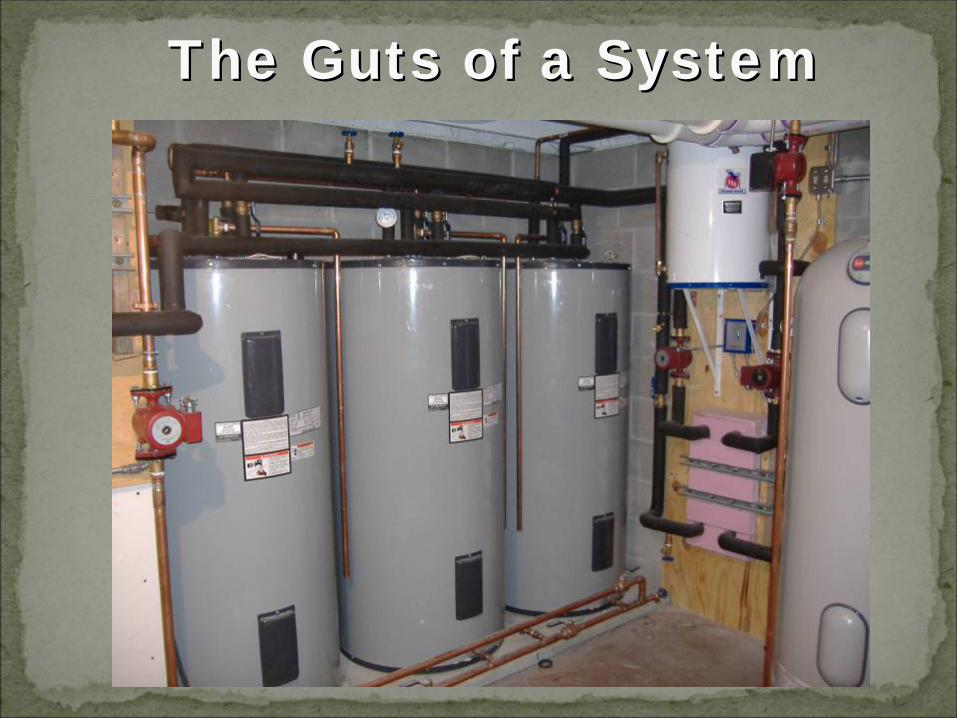
The Guts of a SystemThe Guts of a System
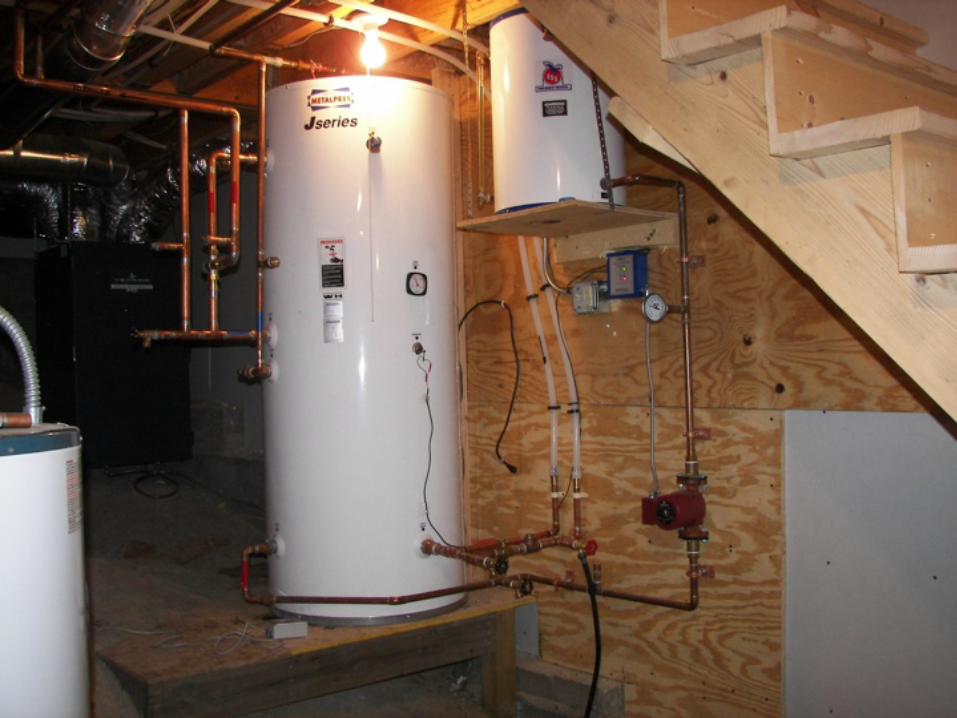
13
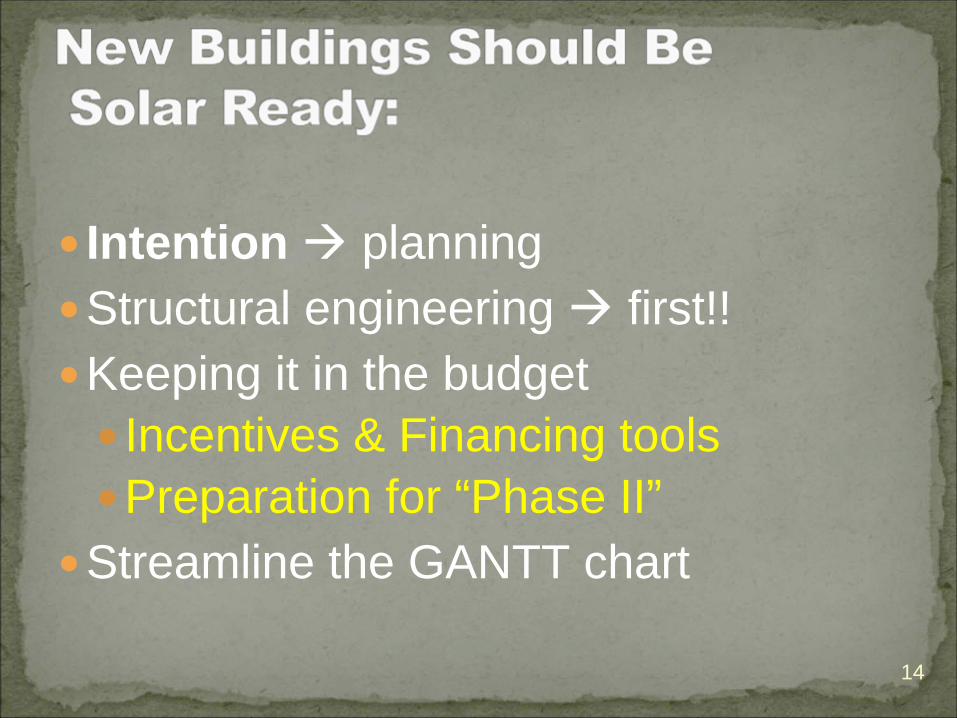
14
Intention planningStructural engineering first!!Keeping it in the budget Incentives & Financing toolsPreparation for “Phase II”
Streamline the GANTT chart
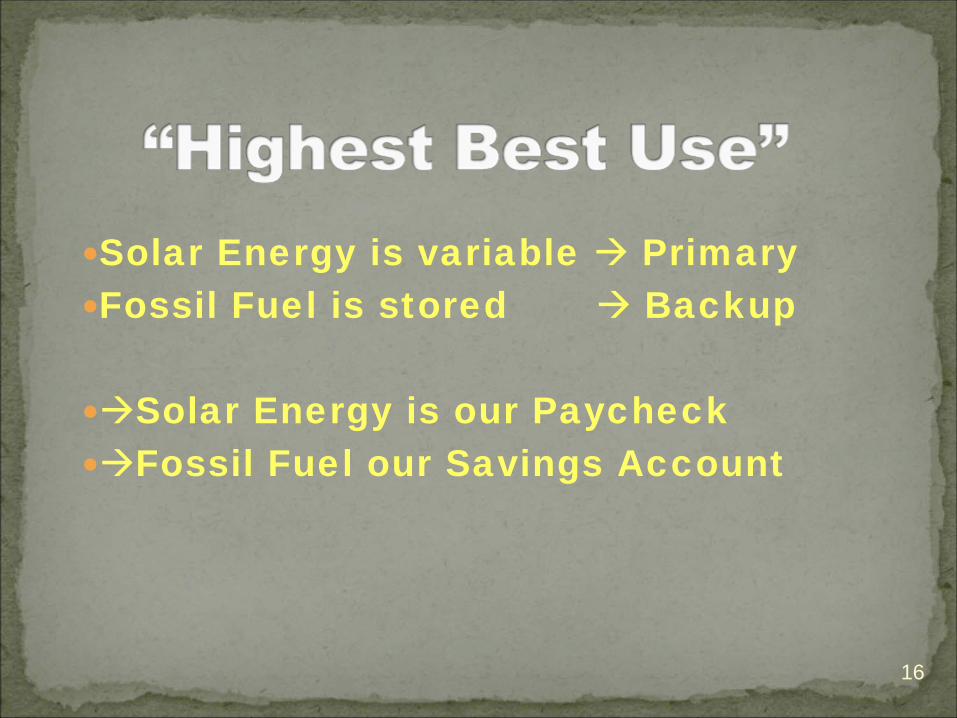
16
Solar Energy is variable
PrimaryFossil Fuel is stored
Backup
Solar Energy is our PaycheckFossil Fuel our Savings Account
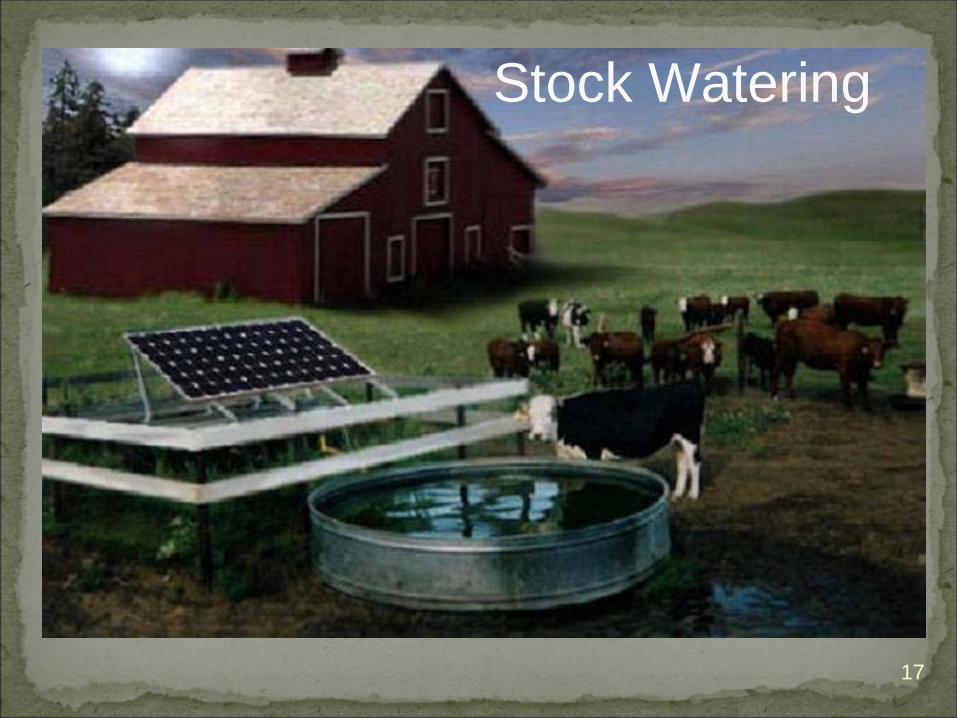
Stock Watering
17
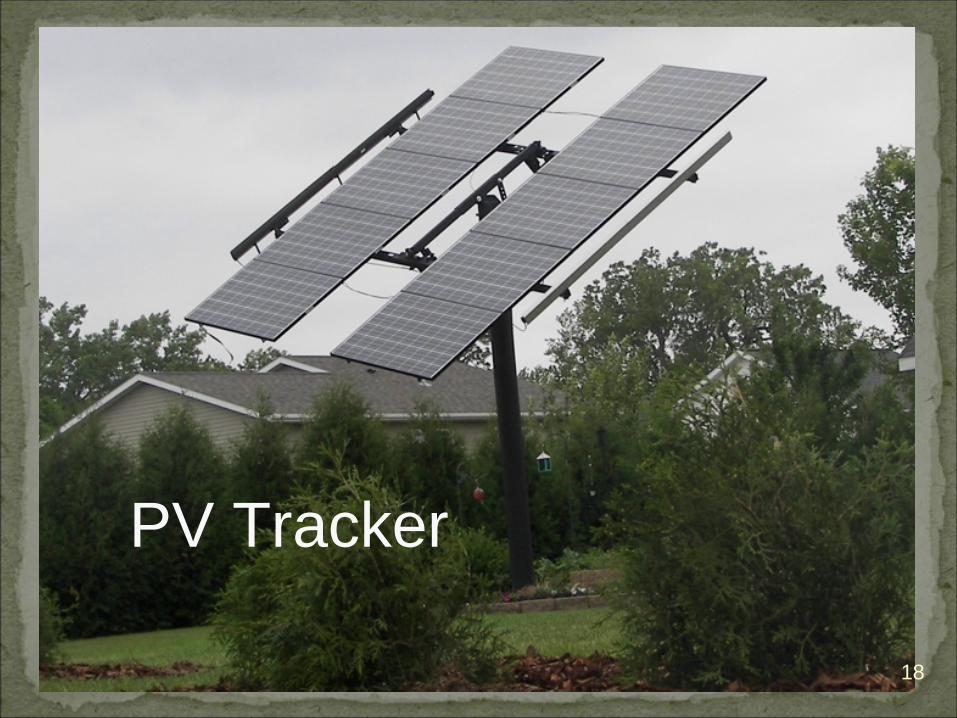
PV Tracker
18
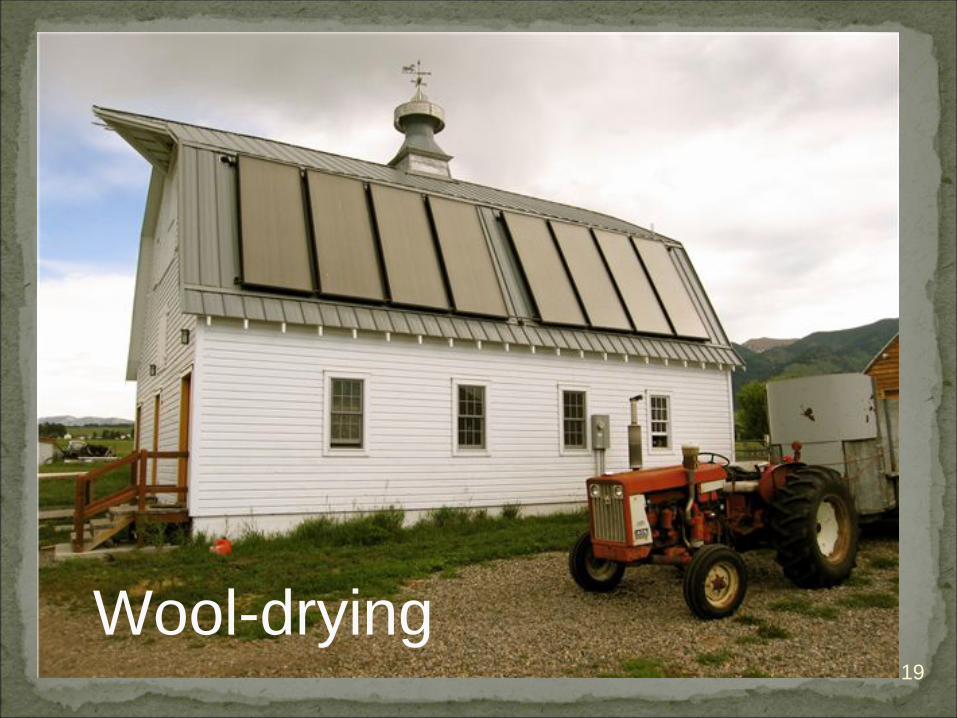
Wool-drying19
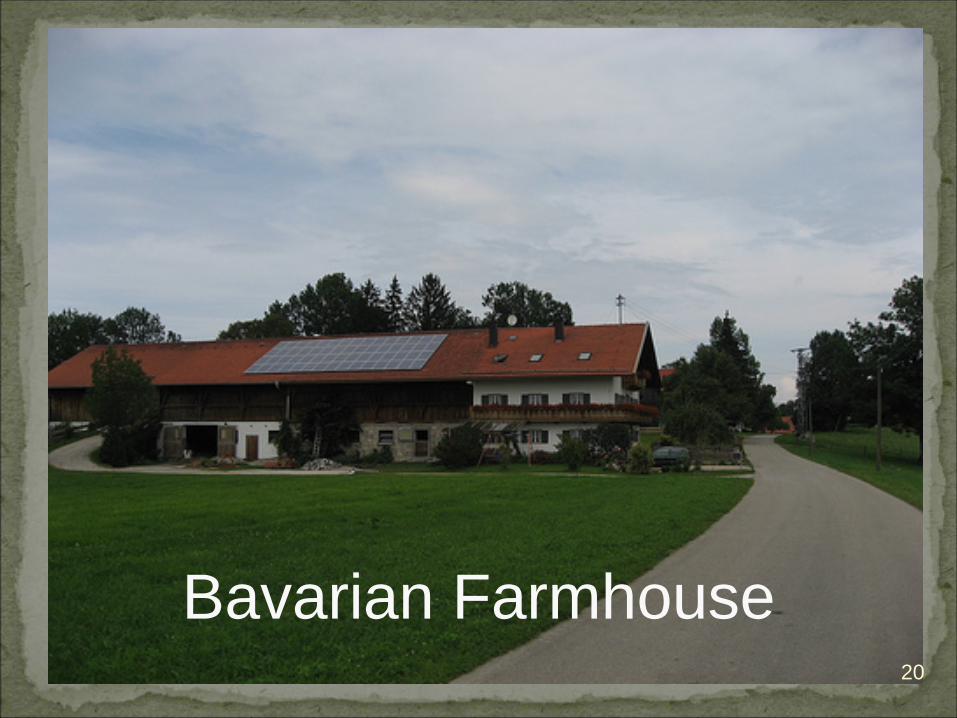
Bavarian Farmhouse20
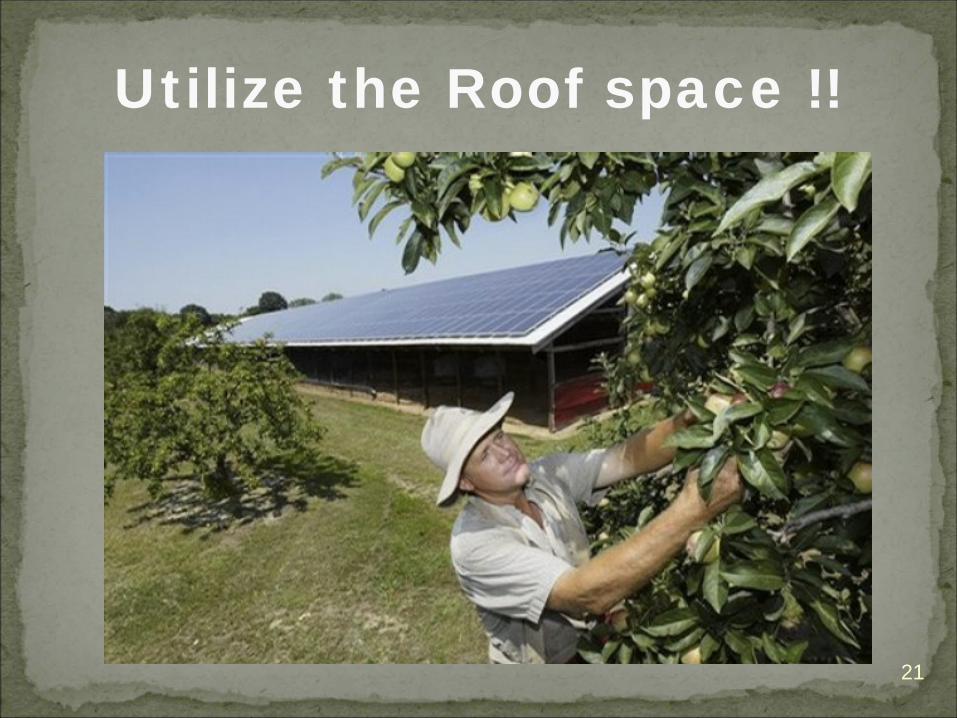
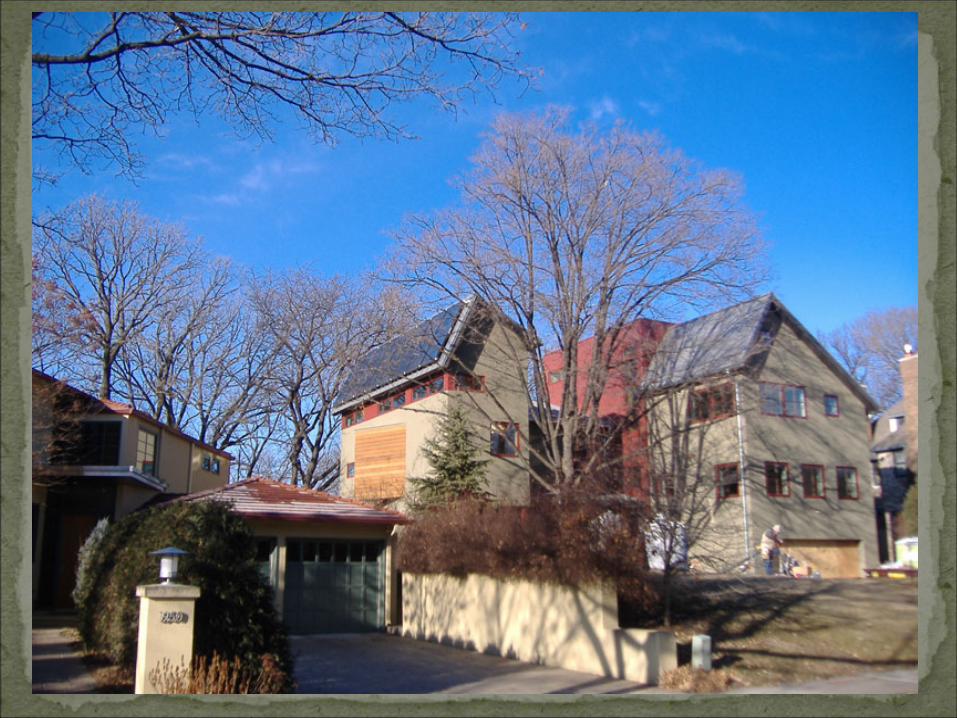
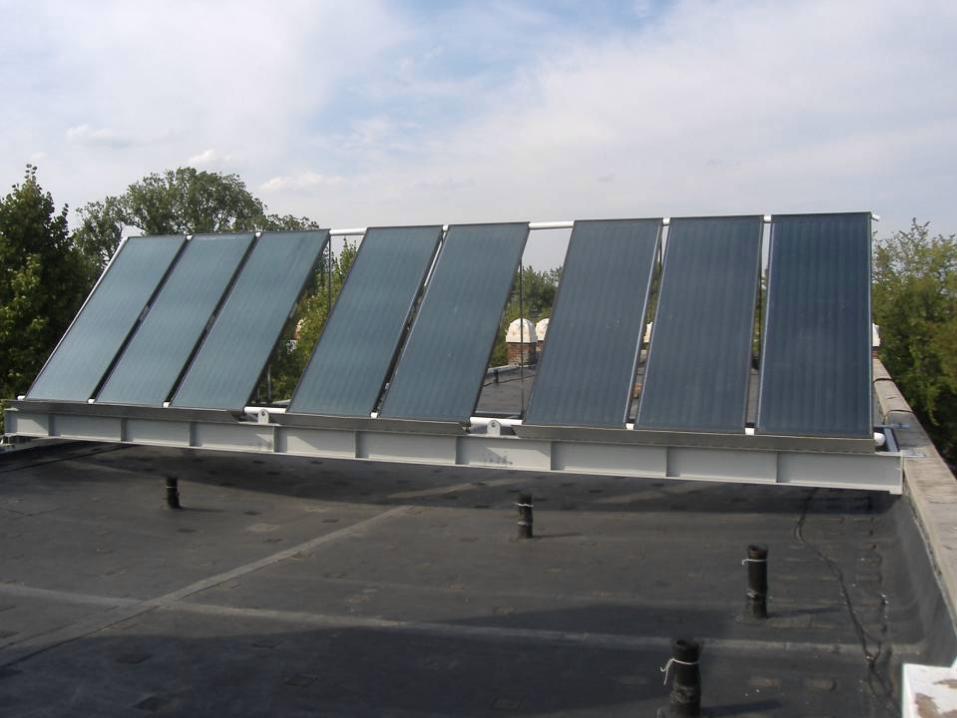
Utilize the Roof space !!
21
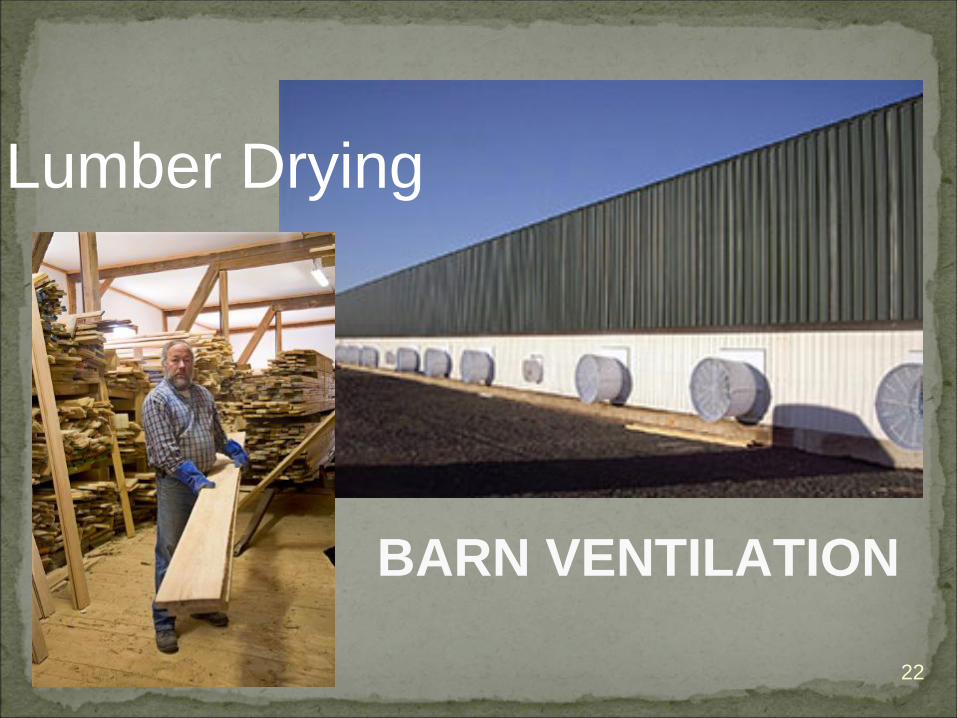
BARN VENTILATION
Lumber Drying
22
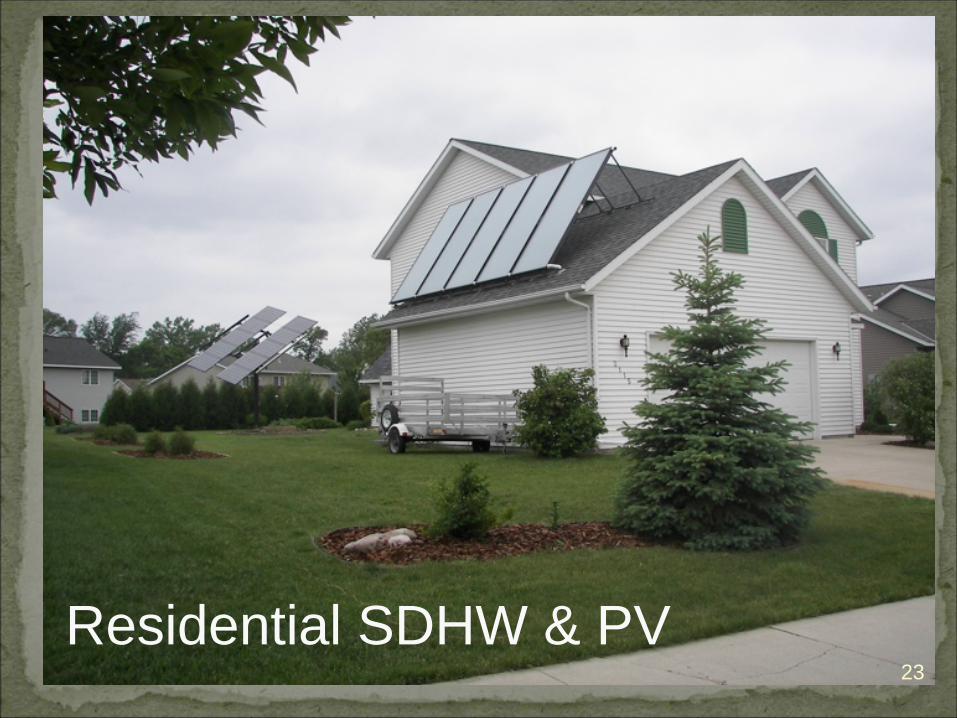
23Residential SDHW & PV
26
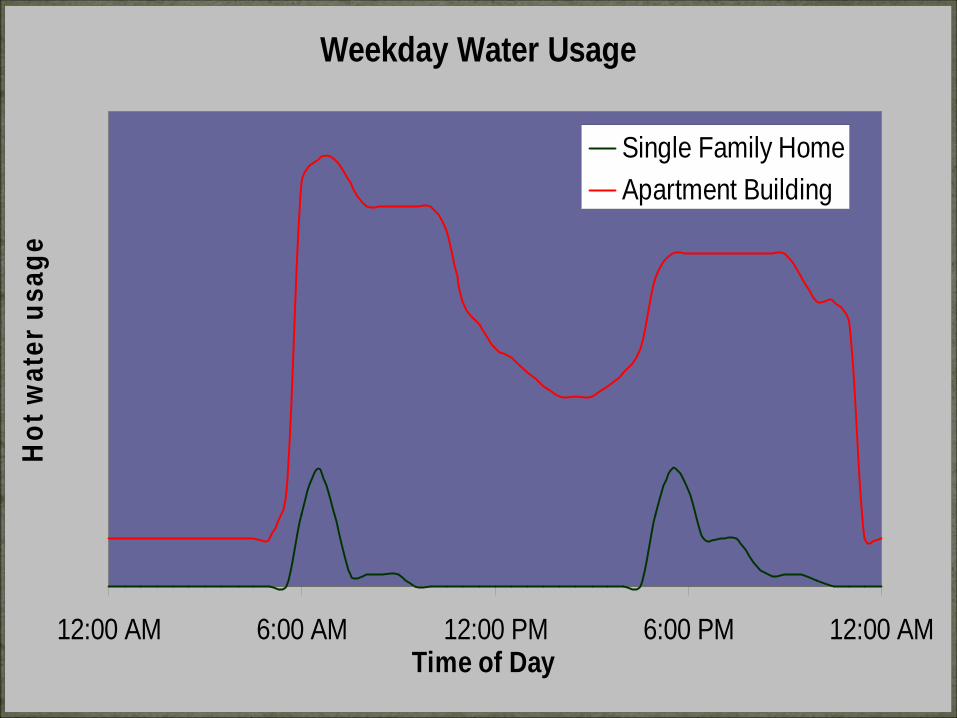
Weekday Water Usage
12:00 AM 6:00 AM 12:00 PM 6:00 PM 12:00 AMTime of Day
Hot
wat
er u
sage
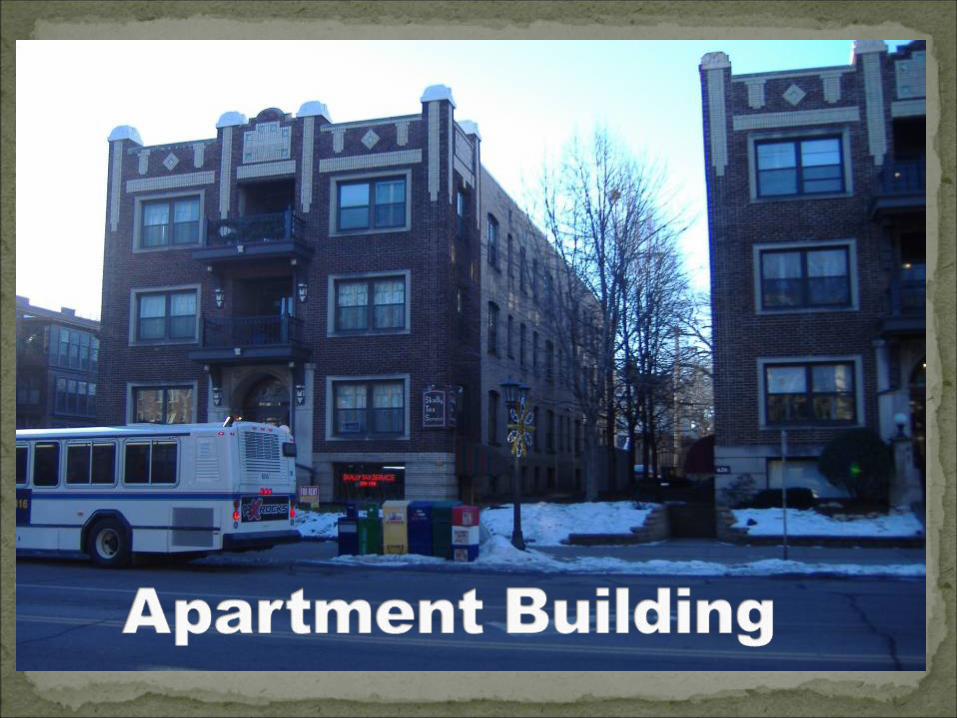
Single Family HomeApartment Building
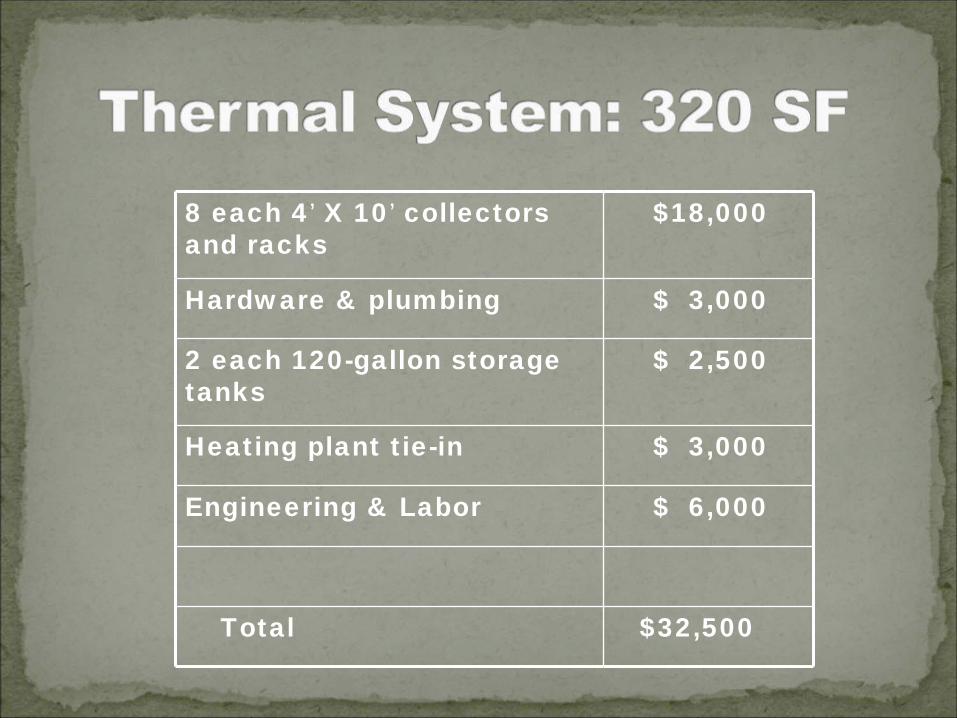
8 each 4’ X 10’ collectors and racks
$18,000
Hardware & plumbing $ 3,000
2 each 120-gallon storage tanks
$ 2,500
Heating plant tie-in $ 3,000
Engineering & Labor $ 6,000
Total $32,500
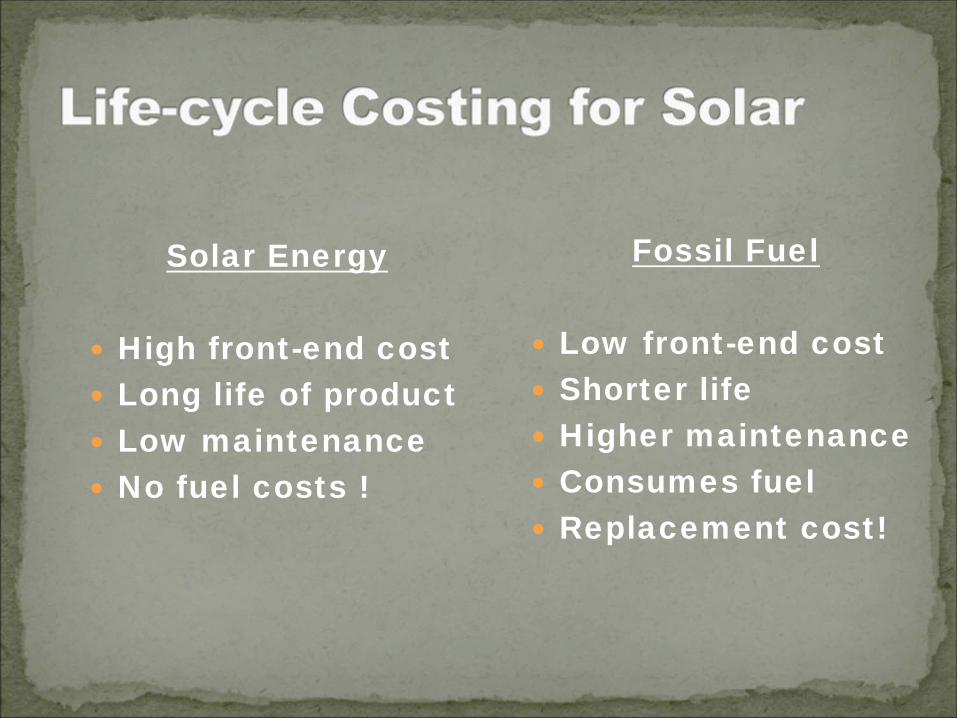
Solar Energy
High front-end cost
Long life of product
Low maintenance
No fuel costs !
Fossil Fuel
Low front-end cost
Shorter life
Higher maintenance
Consumes fuel
Replacement cost!
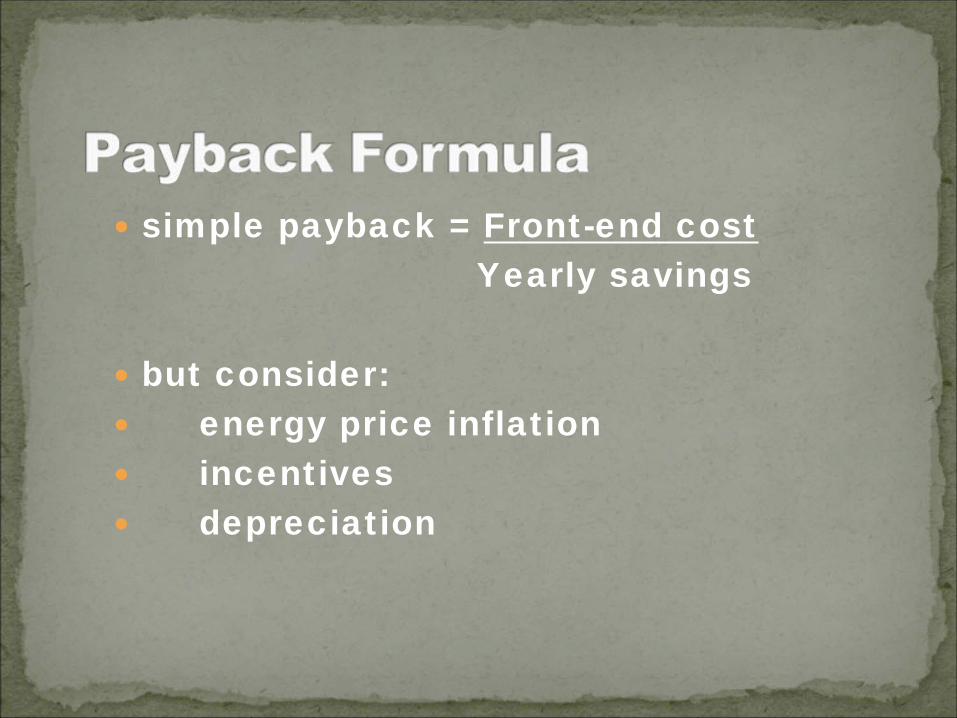
simple payback = Front-end cost
Yearly savings
but consider:
energy price inflation
incentives
depreciation
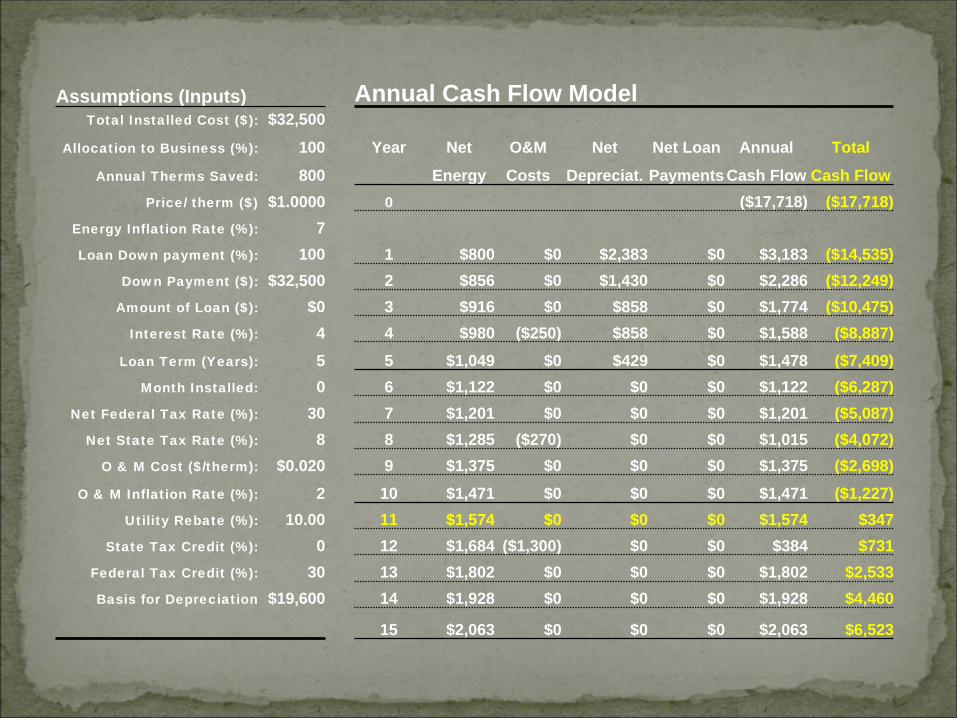
Assumptions (Inputs) Annual Cash Flow ModelTotal Installed Cost ($): $32,500
Allocation to Business (%): 100 Year Net O&M Net Net Loan Annual Total
Annual Therms Saved: 800 Energy Costs Depreciat. Payments Cash Flow Cash FlowPrice/ therm ($) $1.0000 0 ($17,718) ($17,718)
Energy Inflation Rate (%): 7Loan Down payment (%): 100 1 $800 $0 $2,383 $0 $3,183 ($14,535)
Down Payment ($): $32,500 2 $856 $0 $1,430 $0 $2,286 ($12,249)Amount of Loan ($): $0 3 $916 $0 $858 $0 $1,774 ($10,475)
Interest Rate (%): 4 4 $980 ($250) $858 $0 $1,588 ($8,887)Loan Term (Years): 5 5 $1,049 $0 $429 $0 $1,478 ($7,409)
Month Installed: 0 6 $1,122 $0 $0 $0 $1,122 ($6,287)Net Federal Tax Rate (%): 30 7 $1,201 $0 $0 $0 $1,201 ($5,087)
Net State Tax Rate (%): 8 8 $1,285 ($270) $0 $0 $1,015 ($4,072)O & M Cost ($/therm): $0.020 9 $1,375 $0 $0 $0 $1,375 ($2,698)
O & M Inflation Rate (%): 2 10 $1,471 $0 $0 $0 $1,471 ($1,227)Utility Rebate (%): 10.00 11 $1,574 $0 $0 $0 $1,574 $347
State Tax Credit (%): 0 12 $1,684 ($1,300) $0 $0 $384 $731Federal Tax Credit (%): 30 13 $1,802 $0 $0 $0 $1,802 $2,533 Basis for Depreciation $19,600 14 $1,928 $0 $0 $0 $1,928 $4,460
15 $2,063 $0 $0 $0 $2,063 $6,523
31
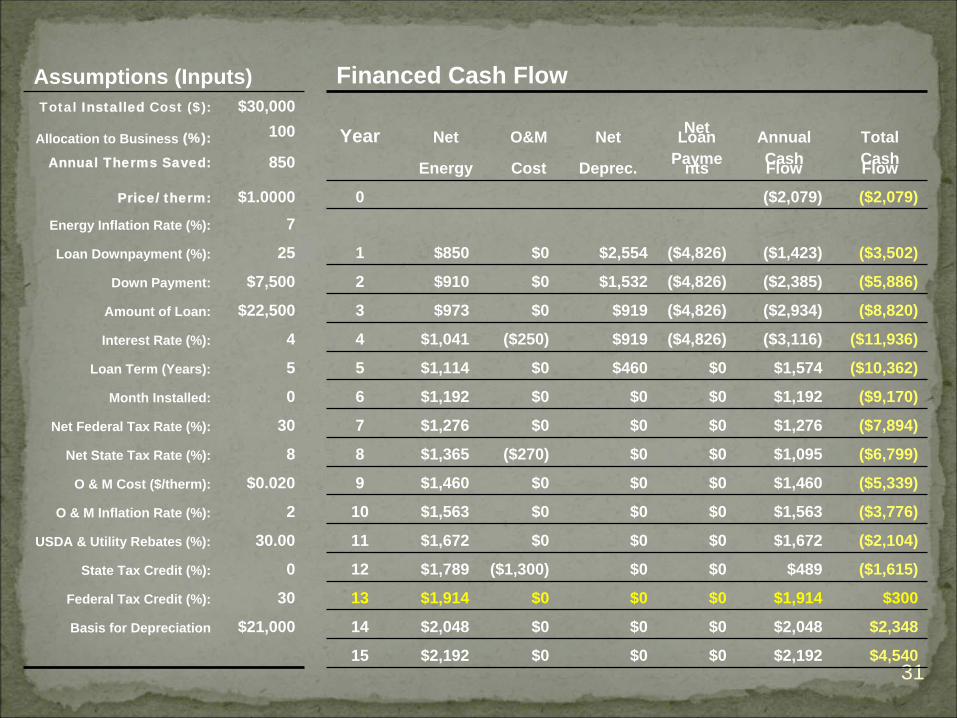
Assumptions (Inputs) Financed Cash FlowTotal Installed Cost ($): $30,000
Allocation to Business (%): 100 Year Net O&M Net Net Loan Annual TotalAnnual Therms Saved: 850 Energy Cost Deprec. Payments Cash Flow Cash Flow
Price/ therm: $1.0000 0 ($2,079) ($2,079)Energy Inflation Rate (%): 7
Loan Downpayment (%): 25 1 $850 $0 $2,554 ($4,826) ($1,423) ($3,502)
Down Payment: $7,500 2 $910 $0 $1,532 ($4,826) ($2,385) ($5,886)
Amount of Loan: $22,500 3 $973 $0 $919 ($4,826) ($2,934) ($8,820)
Interest Rate (%): 4 4 $1,041 ($250) $919 ($4,826) ($3,116) ($11,936)
Loan Term (Years): 5 5 $1,114 $0 $460 $0 $1,574 ($10,362)
Month Installed: 0 6 $1,192 $0 $0 $0 $1,192 ($9,170)
Net Federal Tax Rate (%): 30 7 $1,276 $0 $0 $0 $1,276 ($7,894)
Net State Tax Rate (%): 8 8 $1,365 ($270) $0 $0 $1,095 ($6,799)
O & M Cost ($/therm): $0.020 9 $1,460 $0 $0 $0 $1,460 ($5,339)
O & M Inflation Rate (%): 2 10 $1,563 $0 $0 $0 $1,563 ($3,776)
USDA & Utility Rebates (%): 30.00 11 $1,672 $0 $0 $0 $1,672 ($2,104)
State Tax Credit (%): 0 12 $1,789 ($1,300) $0 $0 $489 ($1,615)
Federal Tax Credit (%): 30 13 $1,914 $0 $0 $0 $1,914 $300
Basis for Depreciation $21,000 14 $2,048 $0 $0 $0 $2,048 $2,348
15 $2,192 $0 $0 $0 $2,192 $4,540
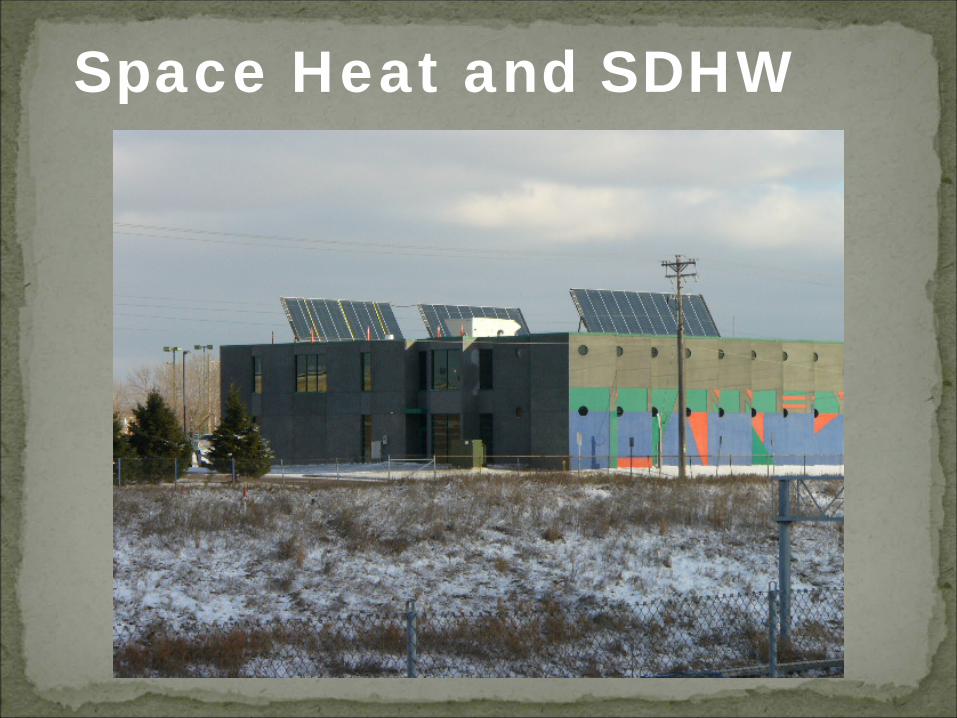
Space Heat and SDHW
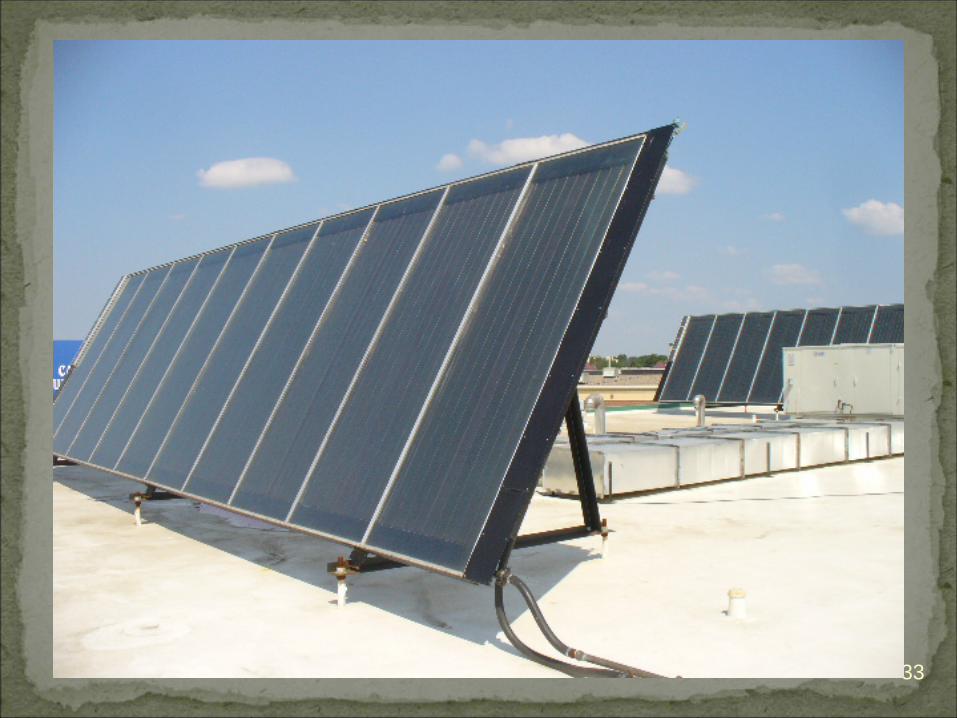
33
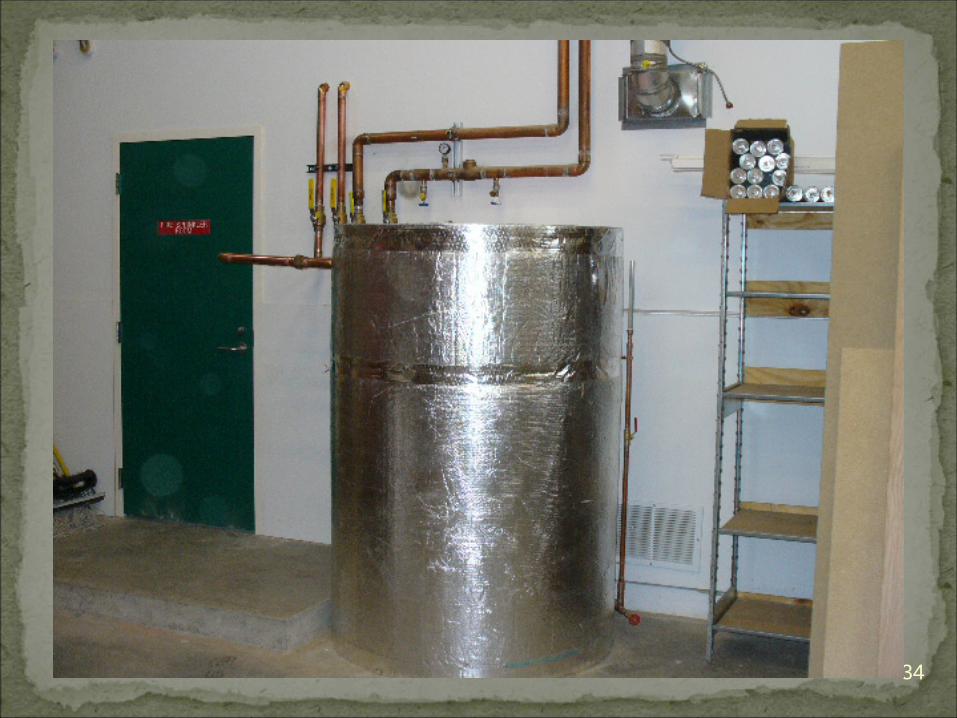
34
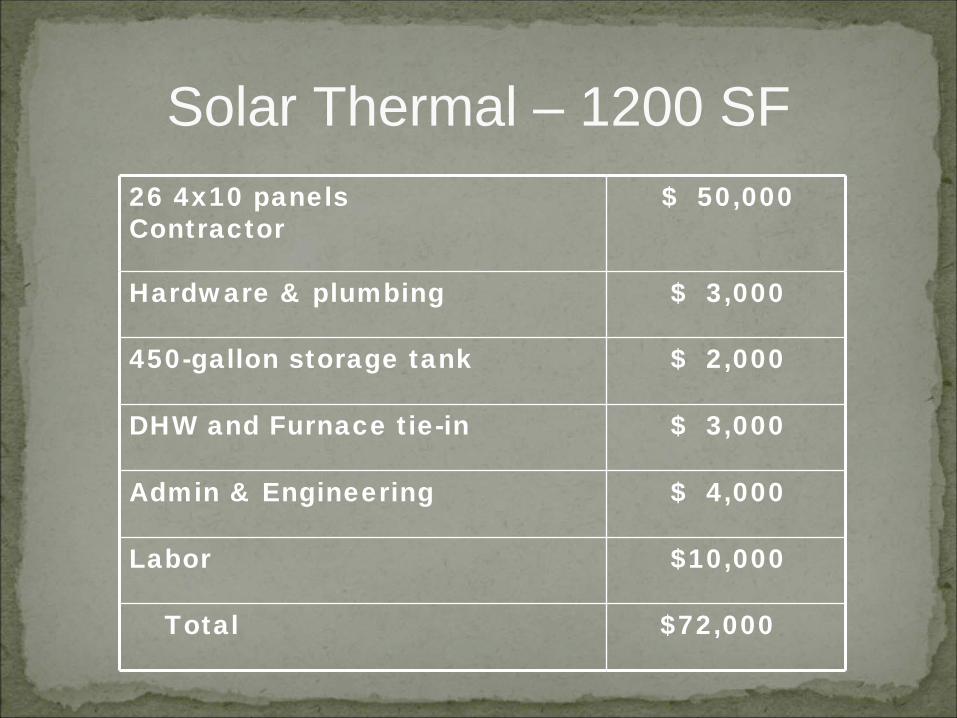
26 4x10 panelsContractor
$ 50,000
Hardware & plumbing $ 3,000
450-gallon storage tank $ 2,000
DHW and Furnace tie-in $ 3,000
Admin & Engineering $ 4,000
Labor $10,000
Total $72,000
Solar Thermal – 1200 SF
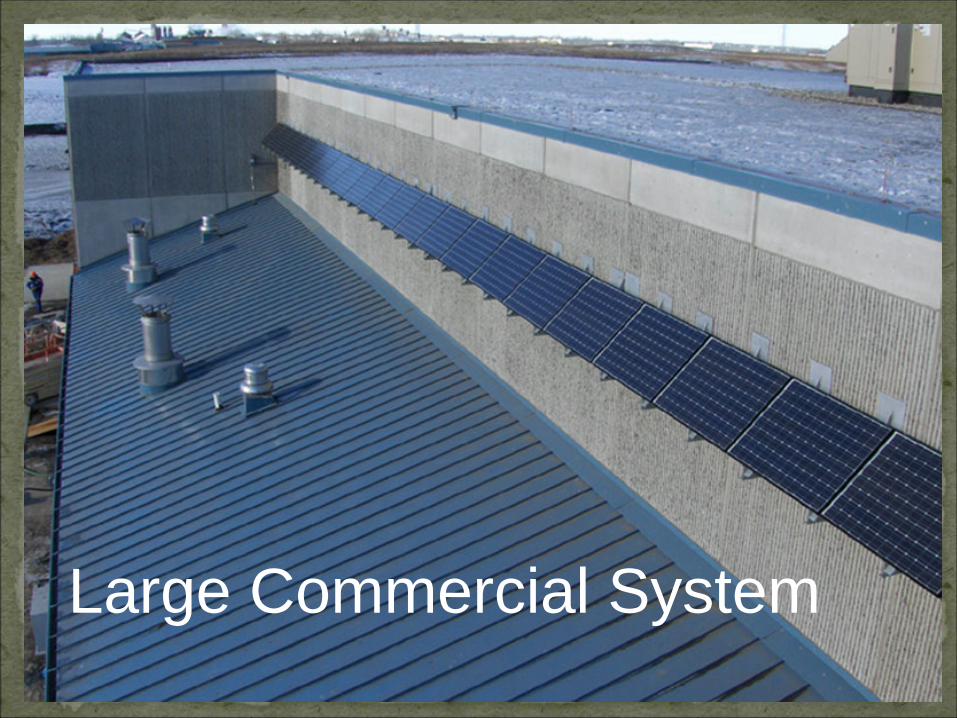
Large Commercial System
37
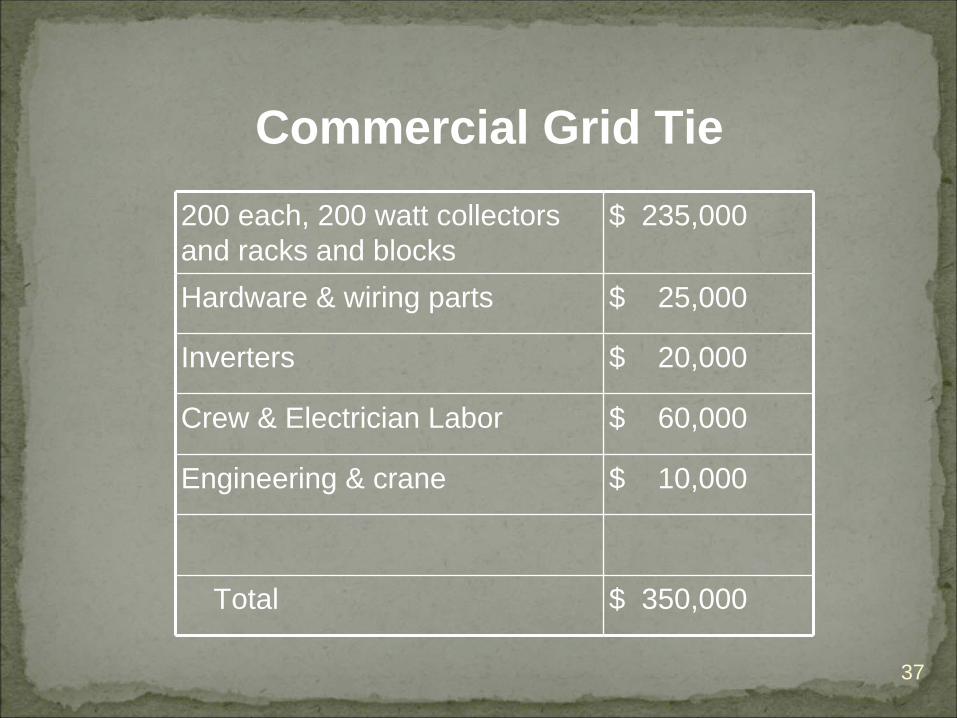
Commercial Grid Tie200 each, 200 watt collectors and racks and blocks
$ 235,000
Hardware & wiring parts $ 25,000
Inverters $ 20,000
Crew & Electrician Labor $ 60,000
Engineering & crane $ 10,000
Total $ 350,000
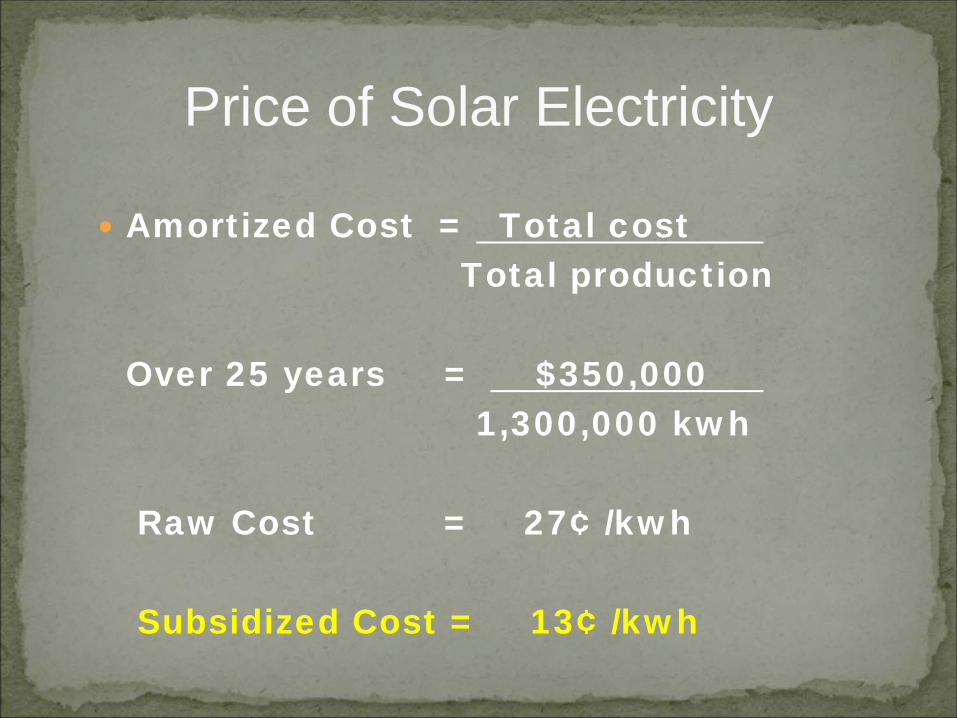
Price of Solar Electricity
Amortized Cost = Total cost
Total production
Over 25 years = $350,0001,300,000 kwh
Raw Cost = 27¢ /kwh
Subsidized Cost = 13¢ /kwh
41
Product or service
Local manufacturing !!
Market researchLook for Opportunities Improve the economics
Government support
Utility support
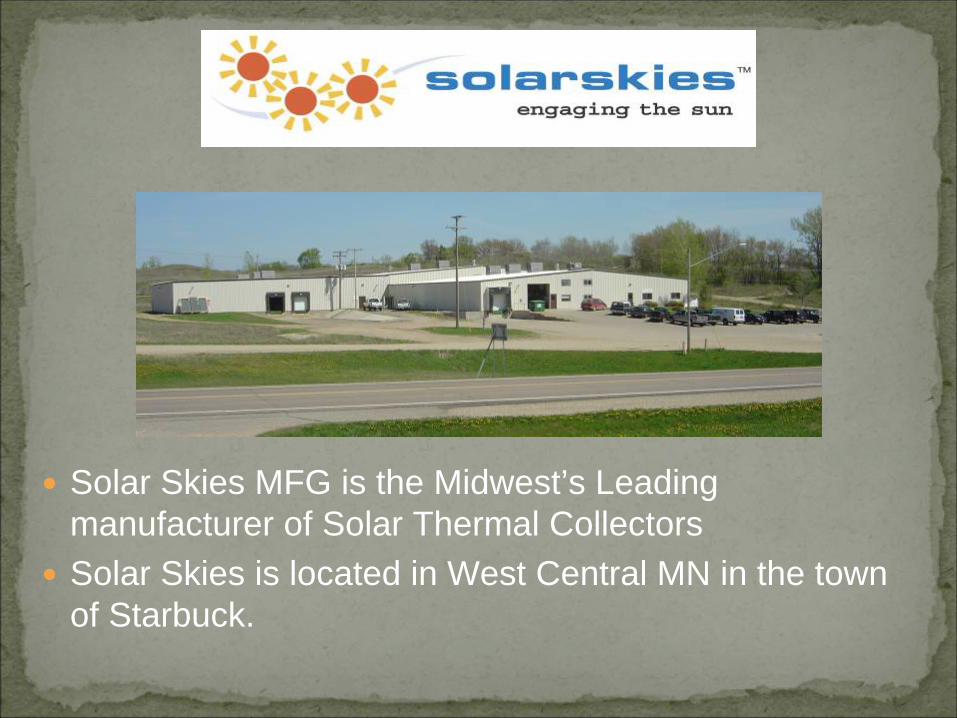
Solar Skies MFG is the Midwest’s Leading manufacturer of Solar Thermal Collectors
Solar Skies is located in West Central MN in the town of Starbuck.
43
Farmers & ranchersFood industryAnimal handlersBankersHVAC contractorsElectrical contractors

44
Build awareness
RE on Schools
Contractor trainingMinimize risk for banksLocal expertiseBuild business modelsCreate green jobsLocal vs. International

Contact Us At:Minnesota Renewable Energy Society2928 5th Avenue SouthMinneapolis, MN 55408
Phone: (612) 308-4757General Info E-mail: [email protected]: www.MNRenewables.org