Embed Size (px)
Citation preview

It Could Have Been (Much) Worse
THE STATE OF THE REGION | HAMPTON ROADS 20134
IT COULD HAVE BEEN (MUCH) WORSE
Readers who are parents or grandparents may know the book “It Could Have Been Worse,” written by the prolific A.H. Benjamin, who tells the story of the
unexpected and unfortunate things that afflict a little mouse traveling on its way home. The mouse falls into puddles and gets stuck by thorns. Even so, much
worse things could have happened to the mouse, including what could have turned out to be a fatal run-in with the neighborhood cat. Our mouse, however,
successfully avoided such calamities, blissfully some of which it did not even know existed.
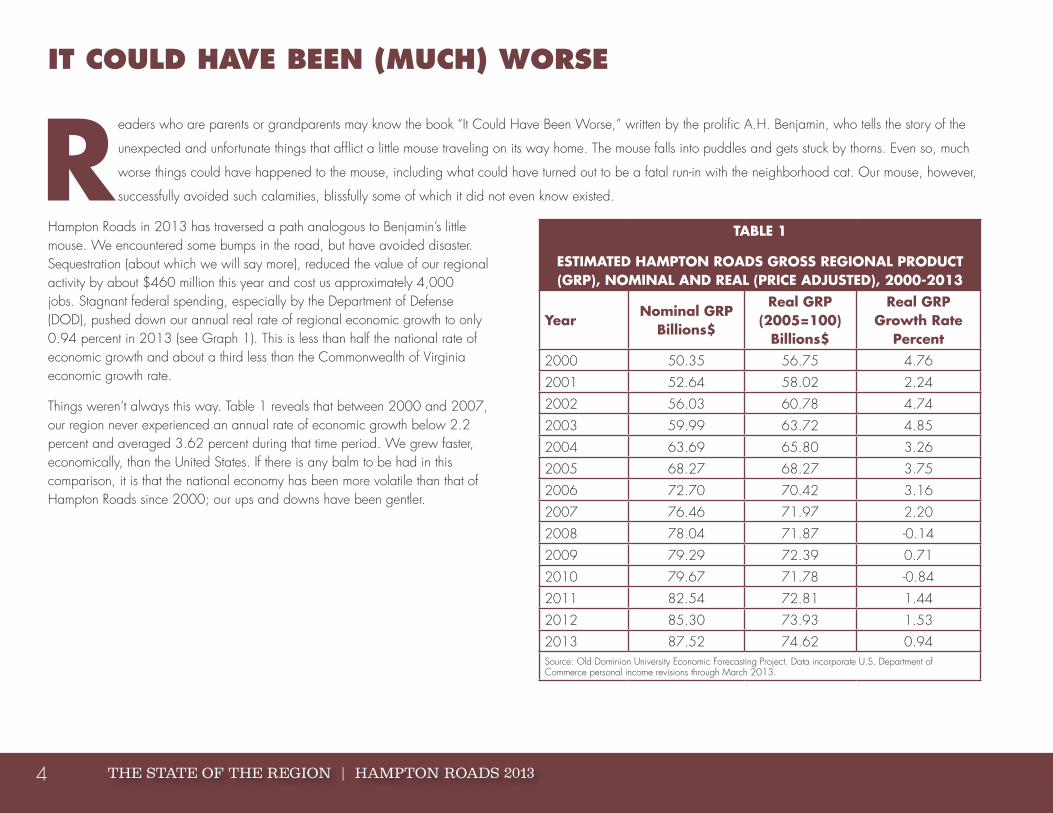
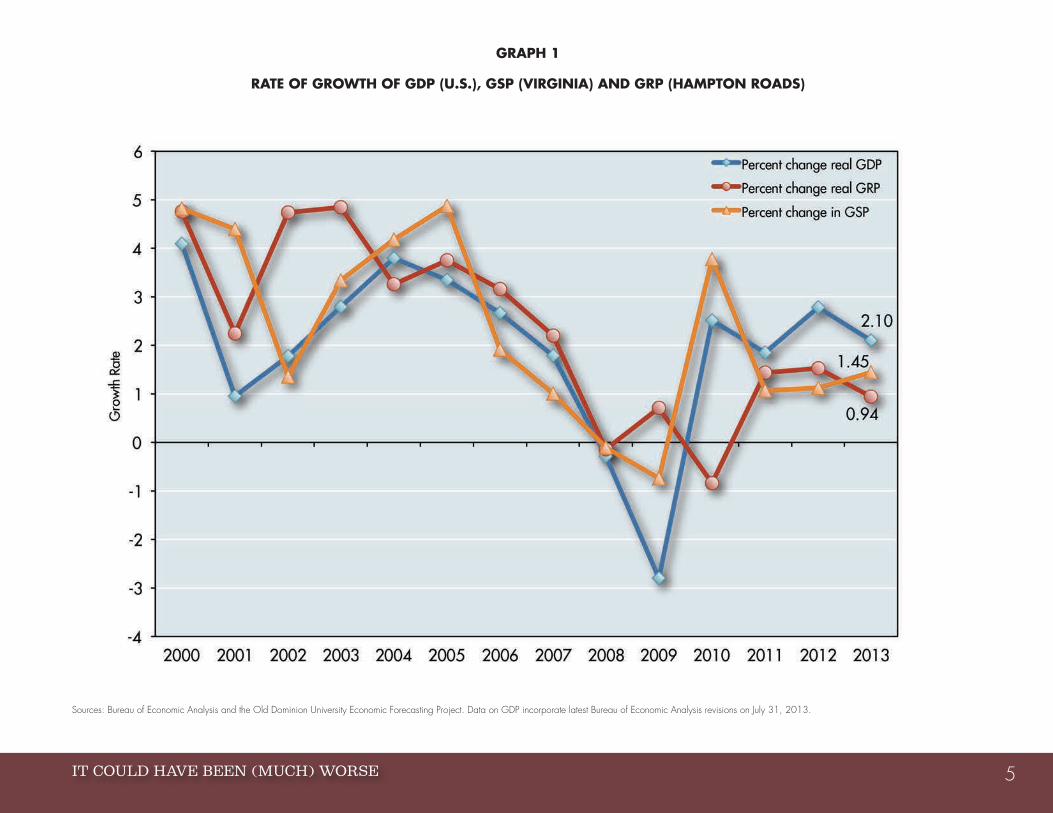
Hampton Roads in 2013 has traversed a path analogous to Benjamin’s little mouse. We encountered some bumps in the road, but have avoided disaster. Sequestration (about which we will say more), reduced the value of our regional activity by about $460 million this year and cost us approximately 4,000 jobs. Stagnant federal spending, especially by the Department of Defense (DOD), pushed down our annual real rate of regional economic growth to only 0.94 percent in 2013 (see Graph 1). This is less than half the national rate of economic growth and about a third less than the Commonwealth of Virginia economic growth rate.
Things weren’t always this way. Table 1 reveals that between 2000 and 2007, our region never experienced an annual rate of economic growth below 2.2 percent and averaged 3.62 percent during that time period. We grew faster, economically, than the United States. If there is any balm to be had in this comparison, it is that the national economy has been more volatile than that of Hampton Roads since 2000; our ups and downs have been gentler.
TABLE 1
ESTIMATED HAMPTON ROADS GROSS REGIONAL PRODUCT (GRP), NOMINAL AND REAL (PRICE ADJUSTED), 2000-2013
YearNominal GRP
Billions$
Real GRP (2005=100)
Billions$
Real GRP Growth Rate
Percent2000 50.35 56.75 4.76
2001 52.64 58.02 2.24
2002 56.03 60.78 4.74
2003 59.99 63.72 4.85
2004 63.69 65.80 3.26
2005 68.27 68.27 3.75
2006 72.70 70.42 3.16
2007 76.46 71.97 2.20
2008 78.04 71.87 -0.14
2009 79.29 72.39 0.71
2010 79.67 71.78 -0.84
2011 82.54 72.81 1.44
2012 85.30 73.93 1.53
2013 87.52 74.62 0.94Source: Old Dominion University Economic Forecasting Project. Data incorporate U.S. Department of Commerce personal income revisions through March 2013.
IT COULD HAVE BEEN (MUCH) WORSE 5
GRAPH 1
RATE OF GROWTH OF GDP (U.S.), GSP (VIRGINIA) AND GRP (HAMPTON ROADS)
Sources: Bureau of Economic Analysis and the Old Dominion University Economic Forecasting Project. Data on GDP incorporate latest Bureau of Economic Analysis revisions on July 31, 2013.
THE STATE OF THE REGION | HAMPTON ROADS 20136
The Great Recession, Defense Spending And SequestrationTHIS ECONOMIC SLOWDOWN HAS BEEN DEEP AND LONG
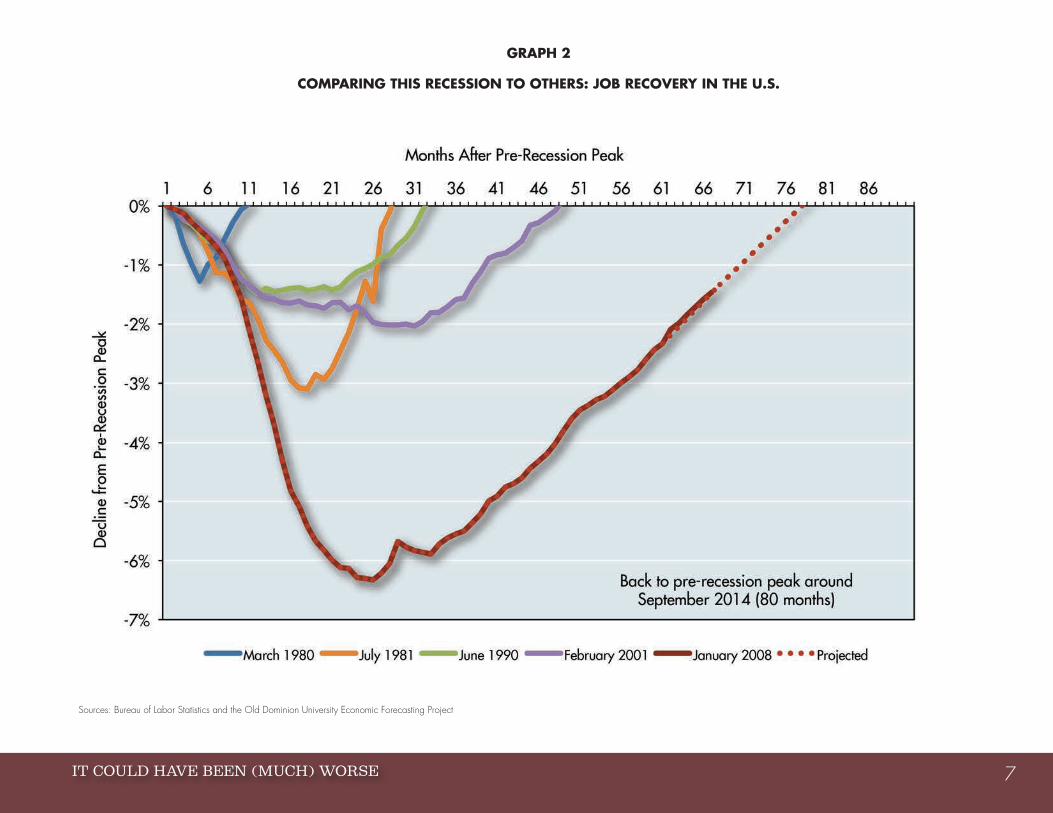
The Great Recession that began in December 2007 (according to the National Bureau of Economic Research) has been the deepest and longest economic slowdown the U.S. has experienced since the Depression of the 1930s. Graph 2 illustrates this by focusing on employment and jobs lost. One can see that the current economic malaise cost the country more jobs than any other major post-World War II recession, but also is lasting longer. At the current rate of U.S. job recovery, it will be September 2014 (80 months from the beginning of the recession) before we, as a country, will have recovered all of the jobs we lost between 2008 and 2010.
Why has this recession been so deep and the subsequent recovery so “job free”? Economists Kenneth Rogoff and Carmen Reinhardt have explored these topics in “This Time Is Different.” They point out that economic contractions caused by crises in a country’s financial system (at the very least, a contributing factor in the U.S. recession) destroy consumer and investor confidence and threaten the fundamental stability that is so critical to hiring and purchasing decisions. Economic actors pull in their horns and it takes them a long time to change their behavior. Hence, recessions with a strong financial component take much longer to iron out than recessions caused by simple cyclical reductions in demand.
When thinking about our jobless recovery, it is also important to understand that we live in an era in which accelerating technological change often is labor saving in nature. Machines and computers are substituted for people. Caterpillar, for example, now produces about triple the physical output it did 20 years ago, but does so with about half the number of workers. Over the long run, this is a desirable development. Our collective standard of living increases
when workers and resources can be saved and shifted to other pursuits. In the short run (and this is at least several years in length), however, workers lose their jobs and often find it difficult to land new jobs, especially if they are not well educated, or are anchored to a given location, perhaps because they own a house that is financially underwater.
In the short run, job recovery also has been retarded by the increasing globalization of economic activity. Barbers and hairstylists in Portsmouth or Newport News don’t have to worry about competition from barbers and hairstylists in Shanghai or Jakarta. However, employees at firms such as Stihl or Smithfield Foods do have to worry about Shanghai and Jakarta because they produce tradable goods whose prices are set in international markets. Employees working at such firms must compete head-to-head with workers around the world. Literally, these workers must prove their cost-effectiveness on a daily basis, or they will see their jobs disappear.
There are encouraging signs that the terms of international trade are moving in the favor of the United States. American workers continue to become more productive; U.S. firms are benefiting from the lower costs of important inputs such as natural gas; the cost advantages of competitors such as China are being eroded by rapidly rising wages there and increasing transportation costs; and the value of the dollar has declined over time, making U.S. goods less expensive in the eyes of foreign consumers. These developments, however, are gradual in nature and competition in tradable goods continues to make some U.S. firms reluctant to hire new workers, especially when uncertainties exist about the cost of these employees because of health care and other factors.
IT COULD HAVE BEEN (MUCH) WORSE 7
GRAPH 2
COMPARING THIS RECESSION TO OTHERS: JOB RECOVERY IN THE U.S.
Sources: Bureau of Labor Statistics and the Old Dominion University Economic Forecasting Project
THE STATE OF THE REGION | HAMPTON ROADS 20138
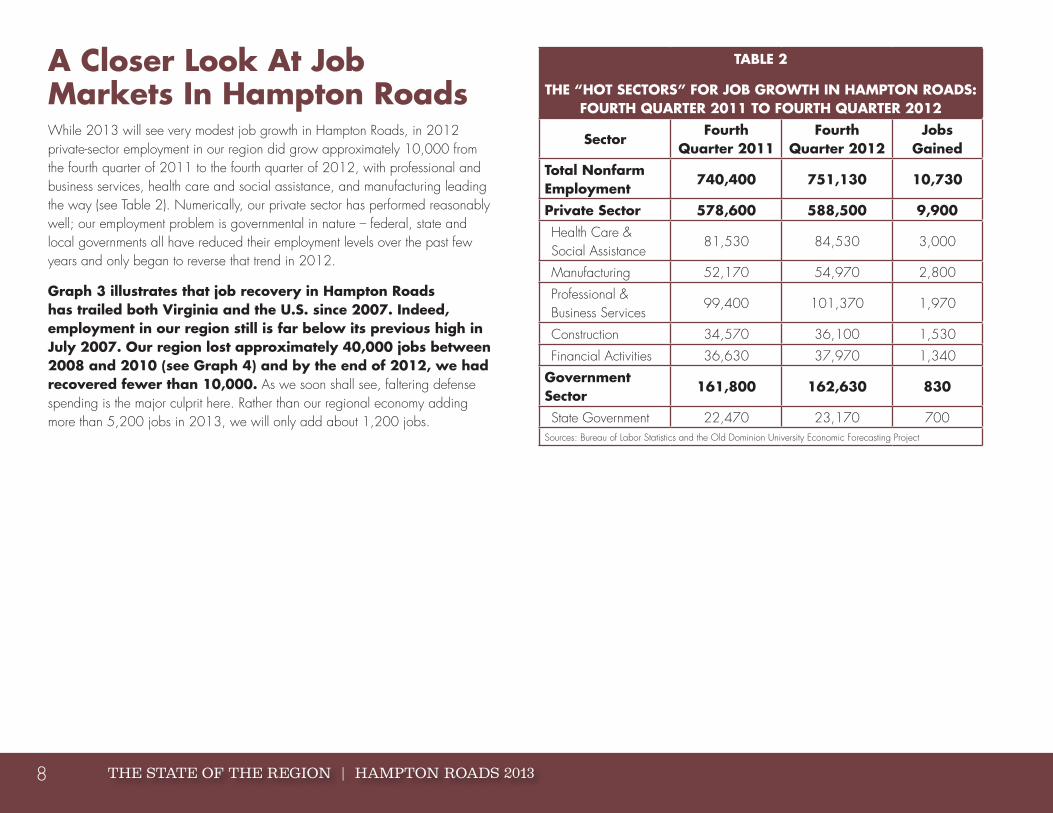
A Closer Look At Job Markets In Hampton RoadsWhile 2013 will see very modest job growth in Hampton Roads, in 2012 private-sector employment in our region did grow approximately 10,000 from the fourth quarter of 2011 to the fourth quarter of 2012, with professional and business services, health care and social assistance, and manufacturing leading the way (see Table 2). Numerically, our private sector has performed reasonably well; our employment problem is governmental in nature – federal, state and local governments all have reduced their employment levels over the past few years and only began to reverse that trend in 2012.
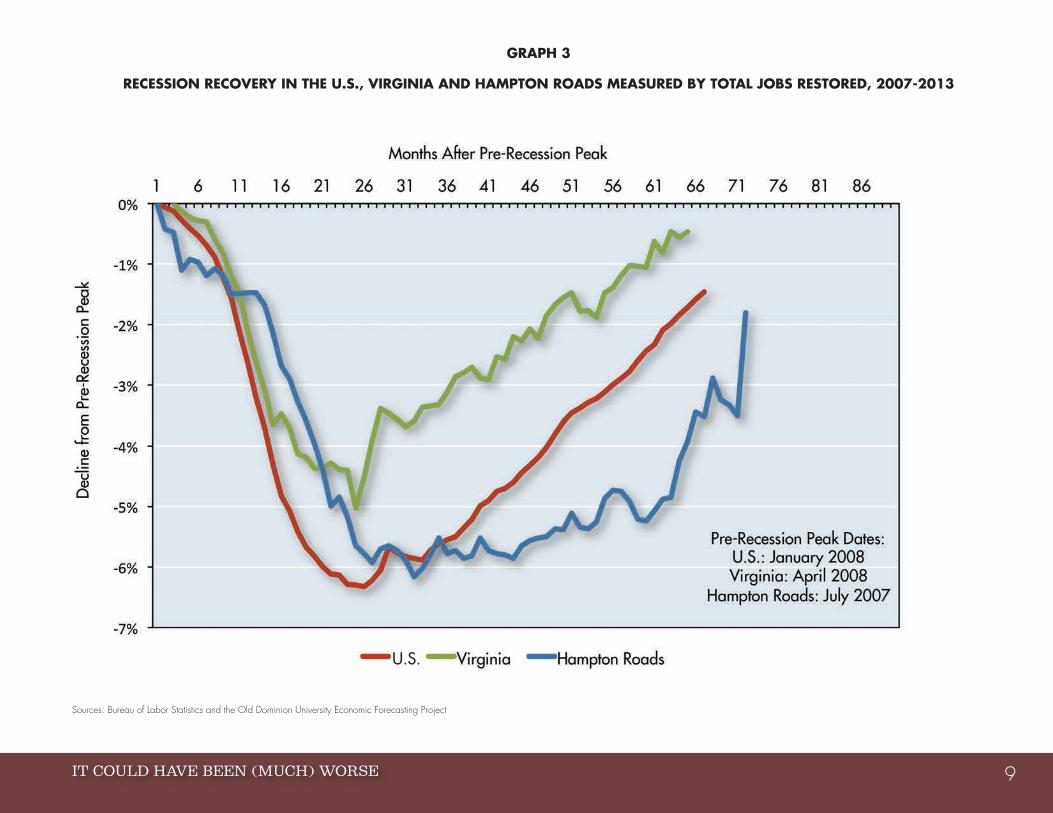
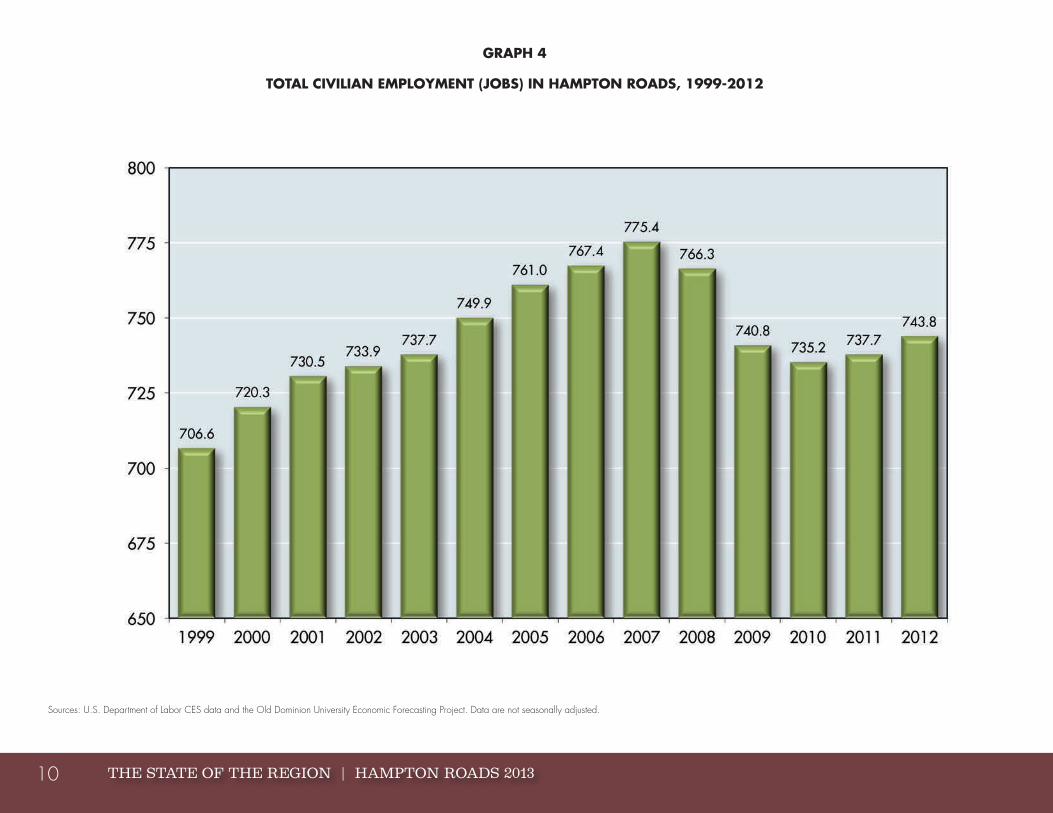
Graph 3 illustrates that job recovery in Hampton Roads has trailed both Virginia and the U.S. since 2007. Indeed, employment in our region still is far below its previous high in July 2007. Our region lost approximately 40,000 jobs between 2008 and 2010 (see Graph 4) and by the end of 2012, we had recovered fewer than 10,000. As we soon shall see, faltering defense spending is the major culprit here. Rather than our regional economy adding more than 5,200 jobs in 2013, we will only add about 1,200 jobs.
TABLE 2
THE “HOT SECTORS” FOR JOB GROWTH IN HAMPTON ROADS: FOURTH QUARTER 2011 TO FOURTH QUARTER 2012
SectorFourth
Quarter 2011Fourth
Quarter 2012Jobs
GainedTotal Nonfarm Employment
740,400 751,130 10,730
Private Sector 578,600 588,500 9,900Health Care & Social Assistance
81,530 84,530 3,000
Manufacturing 52,170 54,970 2,800
Professional & Business Services
99,400 101,370 1,970
Construction 34,570 36,100 1,530
Financial Activities 36,630 37,970 1,340
Government Sector
161,800 162,630 830
State Government 22,470 23,170 700Sources: Bureau of Labor Statistics and the Old Dominion University Economic Forecasting Project
IT COULD HAVE BEEN (MUCH) WORSE 9
GRAPH 3
RECESSION RECOVERY IN THE U.S., VIRGINIA AND HAMPTON ROADS MEASURED BY TOTAL JOBS RESTORED, 2007-2013
Sources: Bureau of Labor Statistics and the Old Dominion University Economic Forecasting Project
U.S.
THE STATE OF THE REGION | HAMPTON ROADS 201310
GRAPH 4
TOTAL CIVILIAN EMPLOYMENT (JOBS) IN HAMPTON ROADS, 1999-2012
Sources: U.S. Department of Labor CES data and the Old Dominion University Economic Forecasting Project. Data are not seasonally adjusted.
IT COULD HAVE BEEN (MUCH) WORSE 11
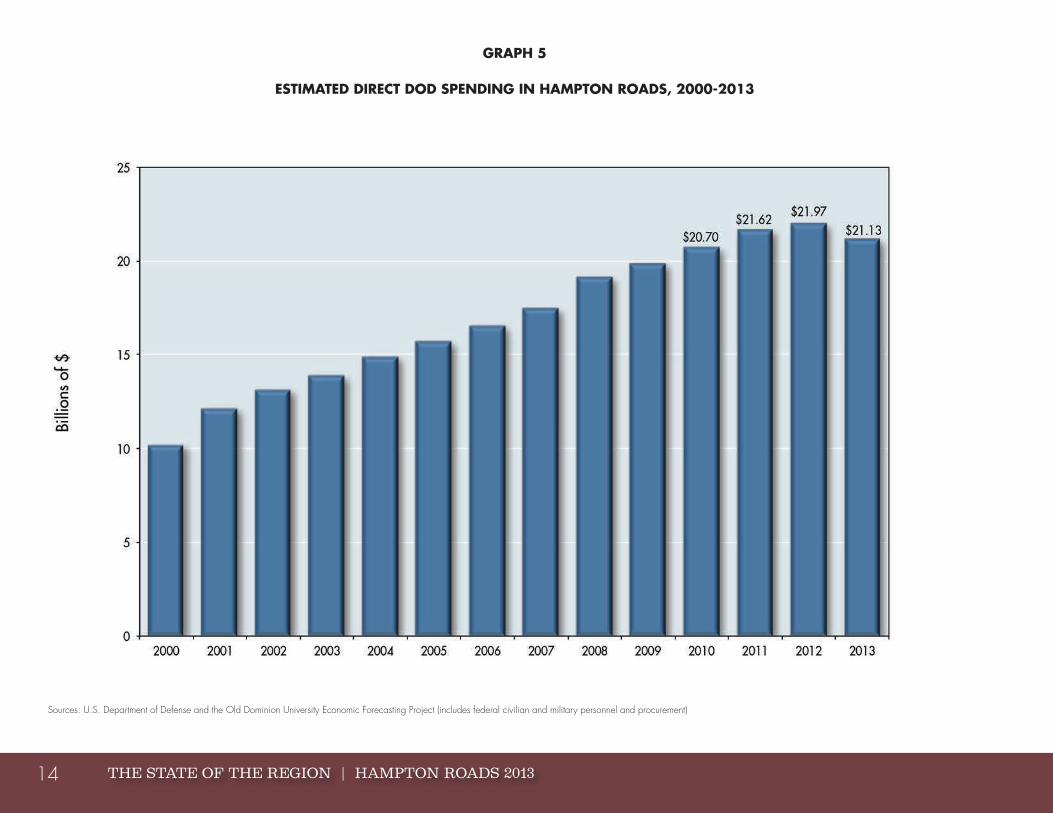
Defense SpendingThe “Big Three” sectors in the economy of Hampton Roads are defense spending, the Port of Virginia and hotels/tourism. Of these three, defense spending easily is the most important and in 2013 will account for $21.13 billion in direct spending in our region. This is down slightly from the all-time high of $21.97 billion in 2012 (see Graph 5).
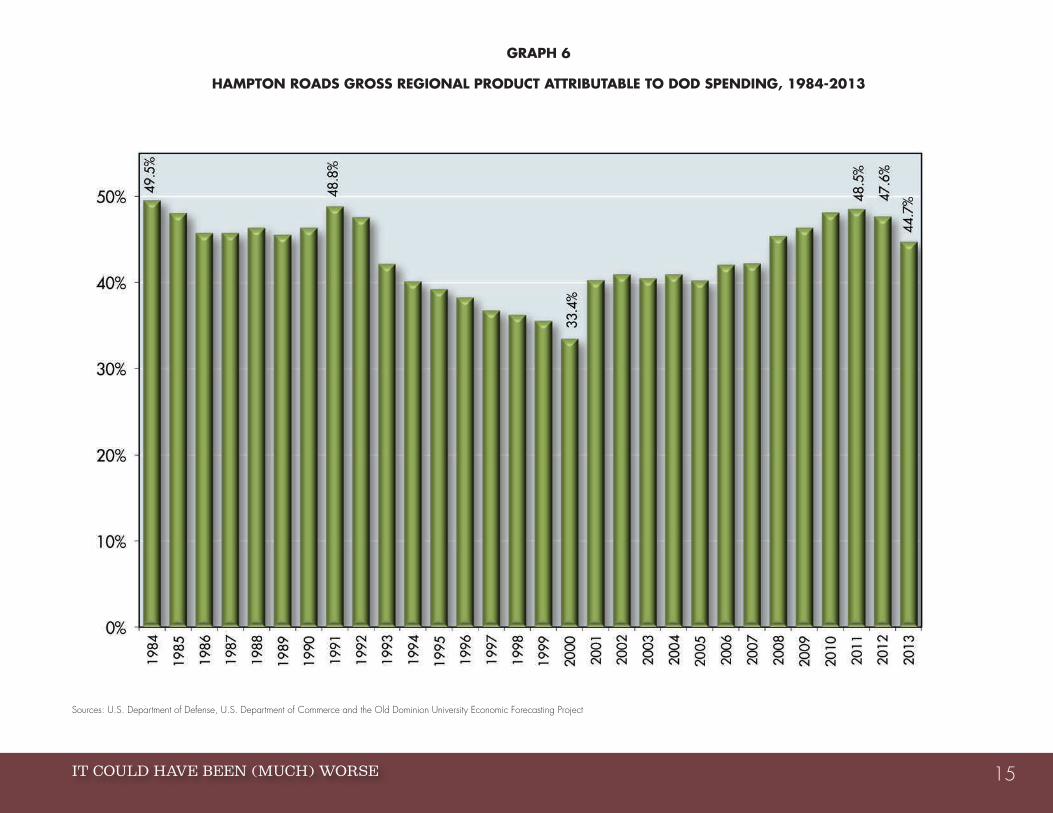
In the first State of the Region report, produced in 2001, we noted that the Hampton Roads economy was heavily dependent on defense spending and we needed to diversify our economic base. We’ve said much the same thing every year since then and now can report (see Graph 6) that over the past two years, we’ve become slightly less dependent on defense spending than we were in the past.
Alas, this is occurring mostly for the wrong reasons. In 2013, defense spending accounted for 44.7 percent of our gross regional product, down from 48.5 percent in 2011. Nevertheless, the major reason for this is that defense spending in Hampton Roads actually declined in 2013. It isn’t that our private sector has been growing by leaps and bounds (though it has been growing). Instead, the decreasing relative importance of defense spending primarily reflects fewer DOD dollars being spent in Hampton Roads. We’ve diversified, but not under the scenario we’d prefer.
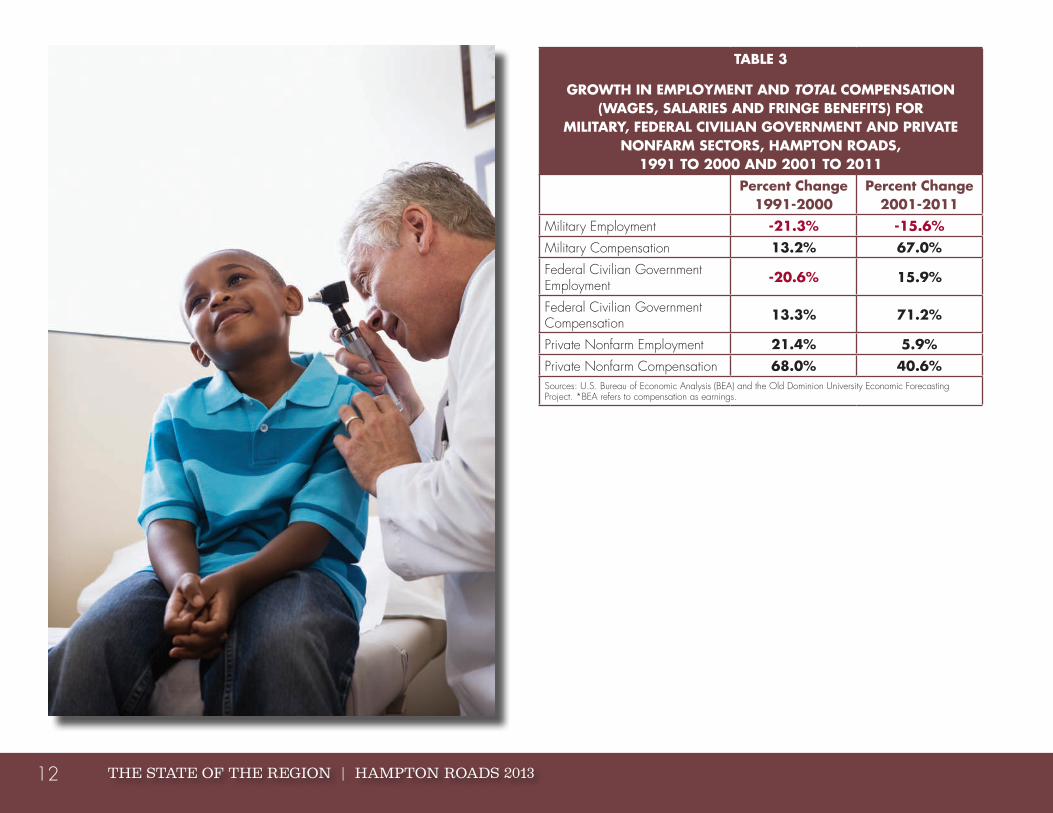
While our region maintains its reputation as a military town, Table 3 demonstrates the reality that military employment has declined significantly over the past two decades. We now have approximately 93,000 active-duty military personnel in Hampton Roads (down about 35 percent from our high of about 143,000 in 1989) and approximately 35,600 DOD civilian employees (down about 15 percent from our high of about 42,000 in 1990).
Nevertheless, we haven’t felt as much of a negative economic impact from these reduced employment numbers as one might expect because the compensation of those people who kept their jobs increased significantly. Table 3 shows how and why. Between 2001 and 2011, total military compensation
paid in Hampton Roads rose 67 percent and total federal government civilian employee compensation rose 71.2 percent, compared to only a 40.6 percent growth in total private nonfarm compensation.
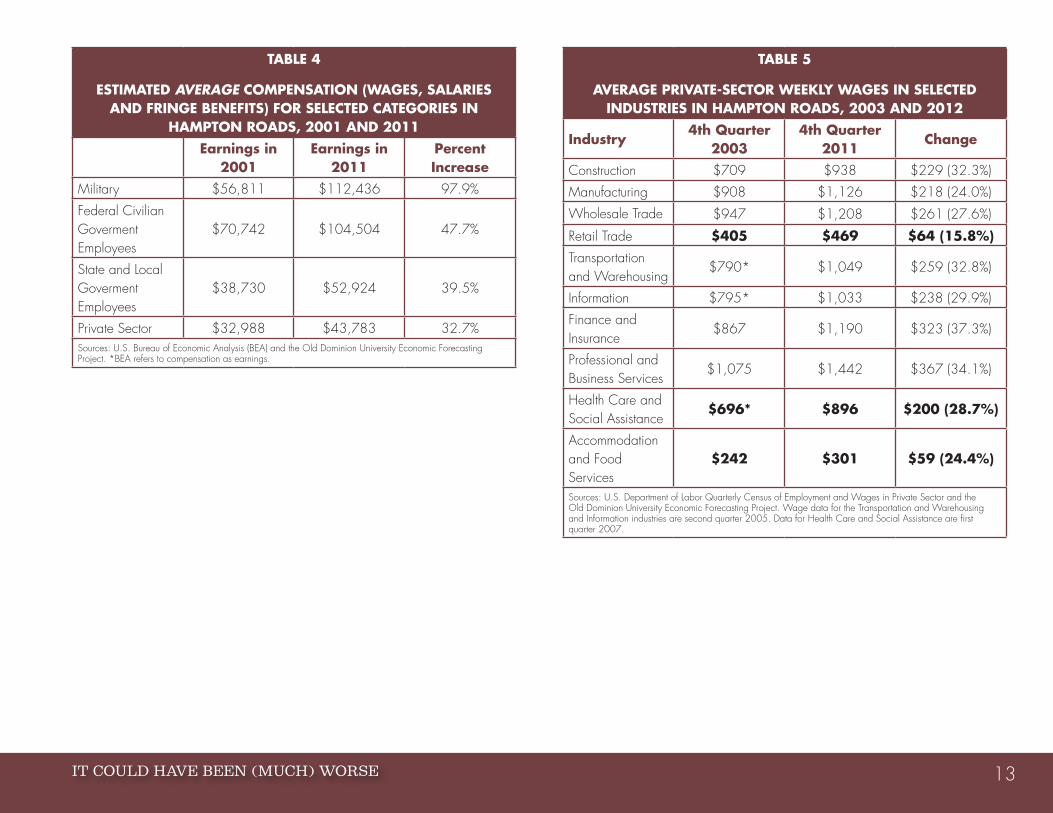
In a nutshell, fewer government employees (military and civilian) have been paid much more for their work in recent years. Table 4 reports average compensation per active-duty military person during the same time period; one can see it rose 97.9 percent, compared to 32.7 percent in the private sector. Average compensation here includes all fringe benefits, including housing allowances, and reflects the need for the military to attract and retain personnel in the absence of a military draft.
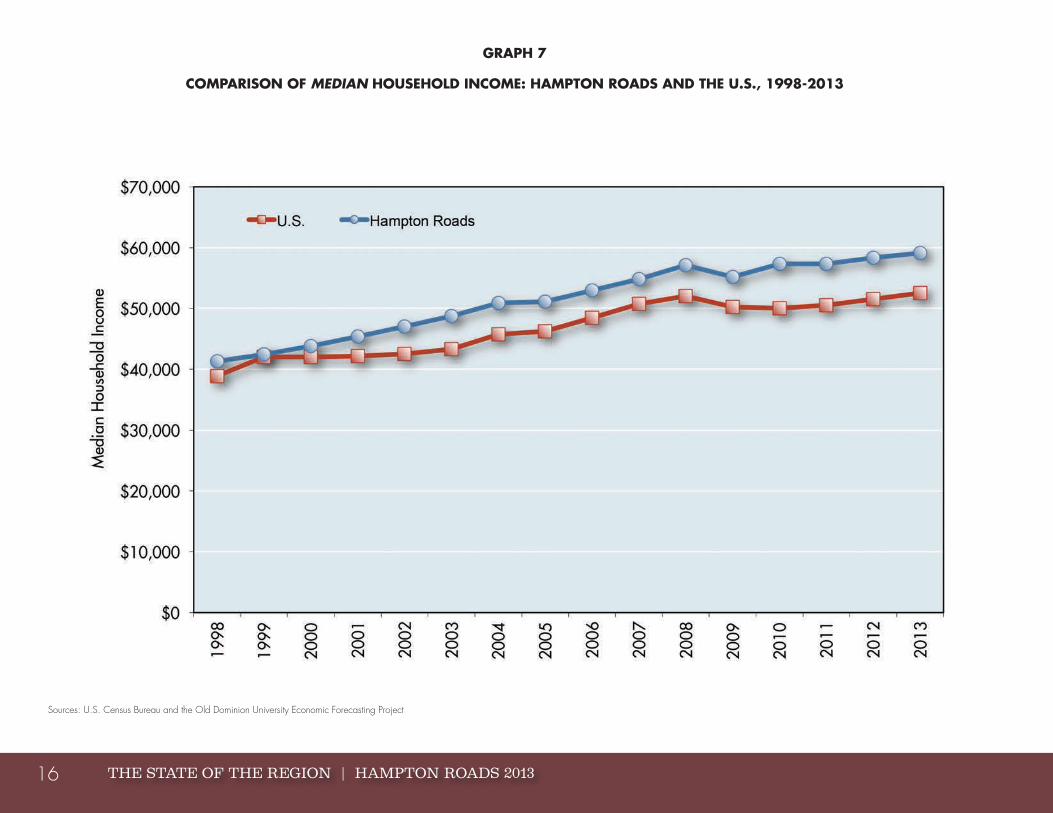
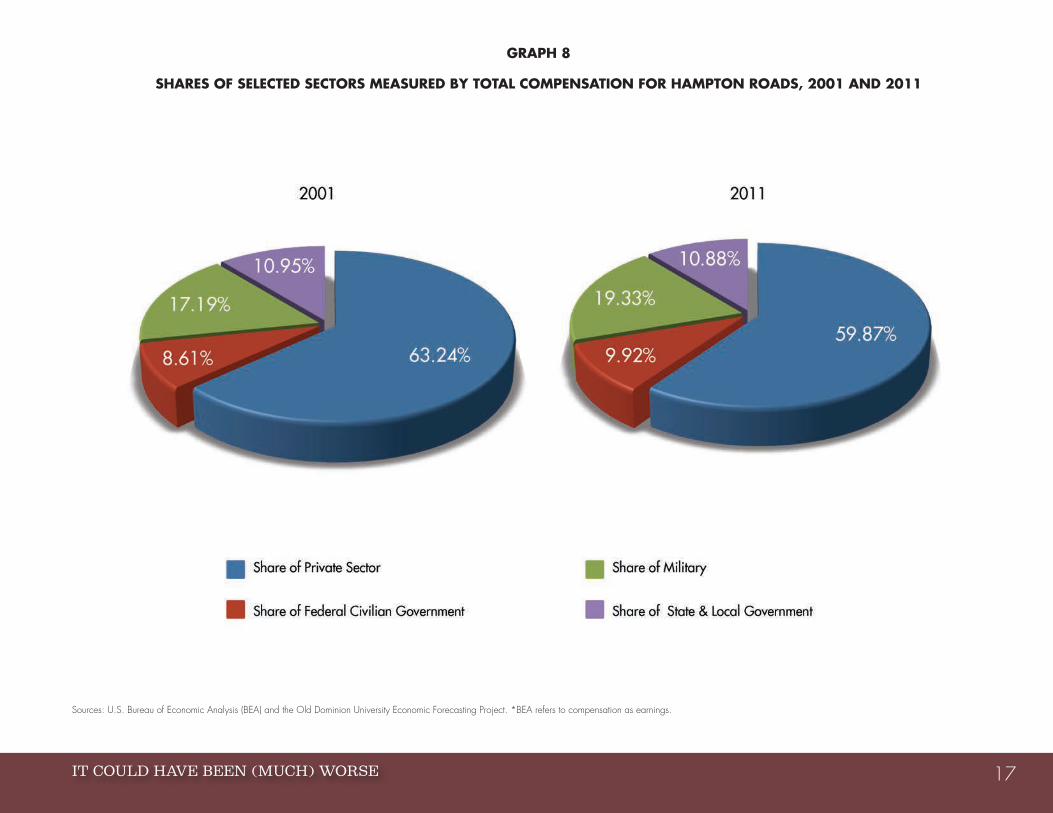
This helps explain why median household income in Hampton Roads increased faster than median household income in the United States in the 15 years between 1998 and 2013 (see Graph 7). The primary engine for this development was the significant increase in compensation received by DOD personnel in our region. That’s why the share of total compensation received by private-sector employees in Hampton Roads actually decreased between 2001 and 2011 (as Graph 8 confirms). Put simply, DOD employees fared much better in terms of compensation than the typical private-sector employee in our region over that decade.
Table 5 provides wage data (if this were compensation, the reported percentages in this table would increase by perhaps one-fourth) for specific sectors of the Hampton Roads economy between the fourth quarter of 2003 and the fourth quarter of 2012. Private-sector wage growth in Hampton Roads trailed that of DOD employees in every major employment classification, and in retail trade was strikingly low (only 15.8 percent over nine years). To provide context, consider that the CPI-U (Consumer Price Index for all urban consumers) rose 24.6 percent during the same period. Thus, the wages of many workers in Hampton Roads did not keep up with inflation.
THE STATE OF THE REGION | HAMPTON ROADS 201312
TABLE 3
GROWTH IN EMPLOYMENT AND TOTAL COMPENSATION (WAGES, SALARIES AND FRINGE BENEFITS) FOR
MILITARY, FEDERAL CIVILIAN GOVERNMENT AND PRIVATE NONFARM SECTORS, HAMPTON ROADS,
1991 TO 2000 AND 2001 TO 2011 Percent Change
1991-2000Percent Change
2001-2011Military Employment -21.3% -15.6%Military Compensation 13.2% 67.0%Federal Civilian Government Employment -20.6% 15.9%
Federal Civilian Government Compensation 13.3% 71.2%
Private Nonfarm Employment 21.4% 5.9%Private Nonfarm Compensation 68.0% 40.6%Sources: U.S. Bureau of Economic Analysis (BEA) and the Old Dominion University Economic Forecasting Project. *BEA refers to compensation as earnings.
IT COULD HAVE BEEN (MUCH) WORSE 13
TABLE 4
ESTIMATED AVERAGE COMPENSATION (WAGES, SALARIES AND FRINGE BENEFITS) FOR SELECTED CATEGORIES IN
HAMPTON ROADS, 2001 AND 2011Earnings in
2001Earnings in
2011Percent Increase
Military $56,811 $112,436 97.9%
Federal Civilian Goverment Employees
$70,742 $104,504 47.7%
State and Local Goverment Employees
$38,730 $52,924 39.5%
Private Sector $32,988 $43,783 32.7%Sources: U.S. Bureau of Economic Analysis (BEA) and the Old Dominion University Economic Forecasting Project. *BEA refers to compensation as earnings.
TABLE 5
AVERAGE PRIVATE-SECTOR WEEKLY WAGES IN SELECTED INDUSTRIES IN HAMPTON ROADS, 2003 AND 2012
Industry4th Quarter
20034th Quarter
2011Change
Construction $709 $938 $229 (32.3%)
Manufacturing $908 $1,126 $218 (24.0%)
Wholesale Trade $947 $1,208 $261 (27.6%)
Retail Trade $405 $469 $64 (15.8%)Transportation and Warehousing
$790* $1,049 $259 (32.8%)
Information $795* $1,033 $238 (29.9%)
Finance and Insurance
$867 $1,190 $323 (37.3%)
Professional and Business Services
$1,075 $1,442 $367 (34.1%)
Health Care and Social Assistance
$696* $896 $200 (28.7%)
Accommodation and Food Services
$242 $301 $59 (24.4%)
Sources: U.S. Department of Labor Quarterly Census of Employment and Wages in Private Sector and the Old Dominion University Economic Forecasting Project. Wage data for the Transportation and Warehousing and Information industries are second quarter 2005. Data for Health Care and Social Assistance are first quarter 2007.
THE STATE OF THE REGION | HAMPTON ROADS 201314
GRAPH 5
ESTIMATED DIRECT DOD SPENDING IN HAMPTON ROADS, 2000-2013
Sources: U.S. Department of Defense and the Old Dominion University Economic Forecasting Project (includes federal civilian and military personnel and procurement)
IT COULD HAVE BEEN (MUCH) WORSE 15
GRAPH 6
HAMPTON ROADS GROSS REGIONAL PRODUCT ATTRIBUTABLE TO DOD SPENDING, 1984-2013
Sources: U.S. Department of Defense, U.S. Department of Commerce and the Old Dominion University Economic Forecasting Project
THE STATE OF THE REGION | HAMPTON ROADS 201316
GRAPH 7
COMPARISON OF MEDIAN HOUSEHOLD INCOME: HAMPTON ROADS AND THE U.S., 1998-2013
Sources: U.S. Census Bureau and the Old Dominion University Economic Forecasting Project
IT COULD HAVE BEEN (MUCH) WORSE 17
GRAPH 8
SHARES OF SELECTED SECTORS MEASURED BY TOTAL COMPENSATION FOR HAMPTON ROADS, 2001 AND 2011
Sources: U.S. Bureau of Economic Analysis (BEA) and the Old Dominion University Economic Forecasting Project. *BEA refers to compensation as earnings.
THE STATE OF THE REGION | HAMPTON ROADS 201318
SEQUESTRATION AND THE FUTURE
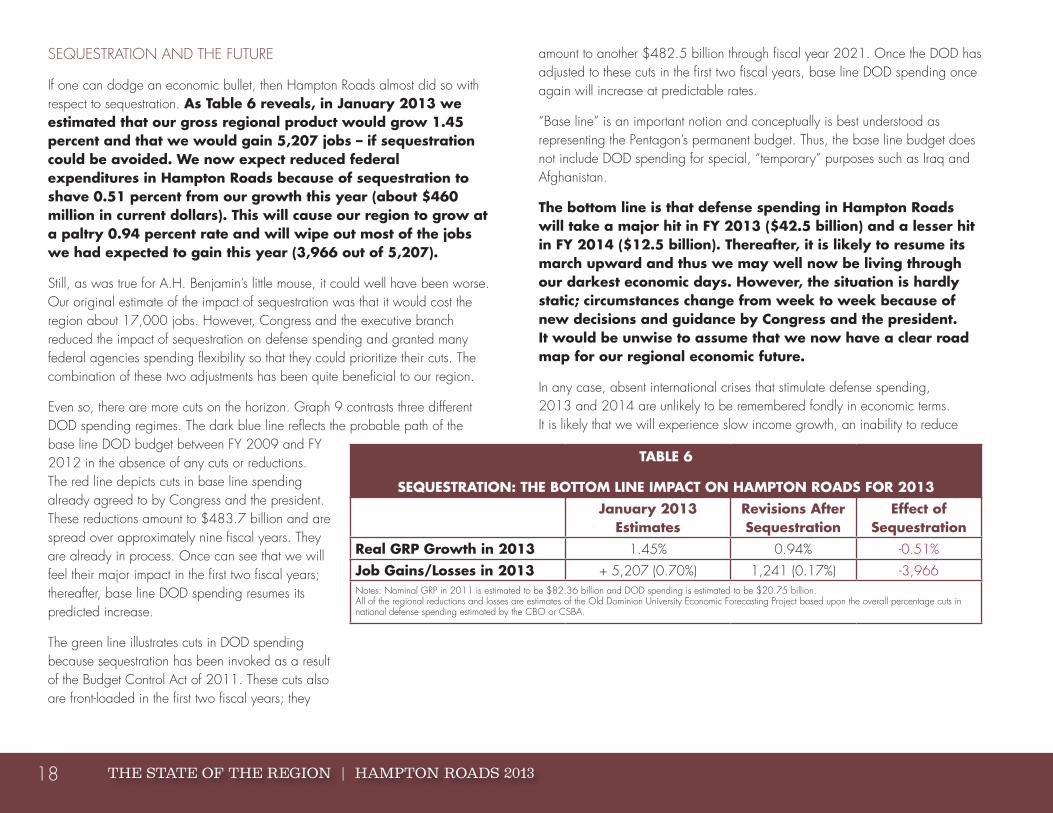
If one can dodge an economic bullet, then Hampton Roads almost did so with respect to sequestration. As Table 6 reveals, in January 2013 we estimated that our gross regional product would grow 1.45 percent and that we would gain 5,207 jobs – if sequestration could be avoided. We now expect reduced federal expenditures in Hampton Roads because of sequestration to shave 0.51 percent from our growth this year (about $460 million in current dollars). This will cause our region to grow at a paltry 0.94 percent rate and will wipe out most of the jobs we had expected to gain this year (3,966 out of 5,207).
Still, as was true for A.H. Benjamin’s little mouse, it could well have been worse. Our original estimate of the impact of sequestration was that it would cost the region about 17,000 jobs. However, Congress and the executive branch reduced the impact of sequestration on defense spending and granted many federal agencies spending flexibility so that they could prioritize their cuts. The combination of these two adjustments has been quite beneficial to our region.
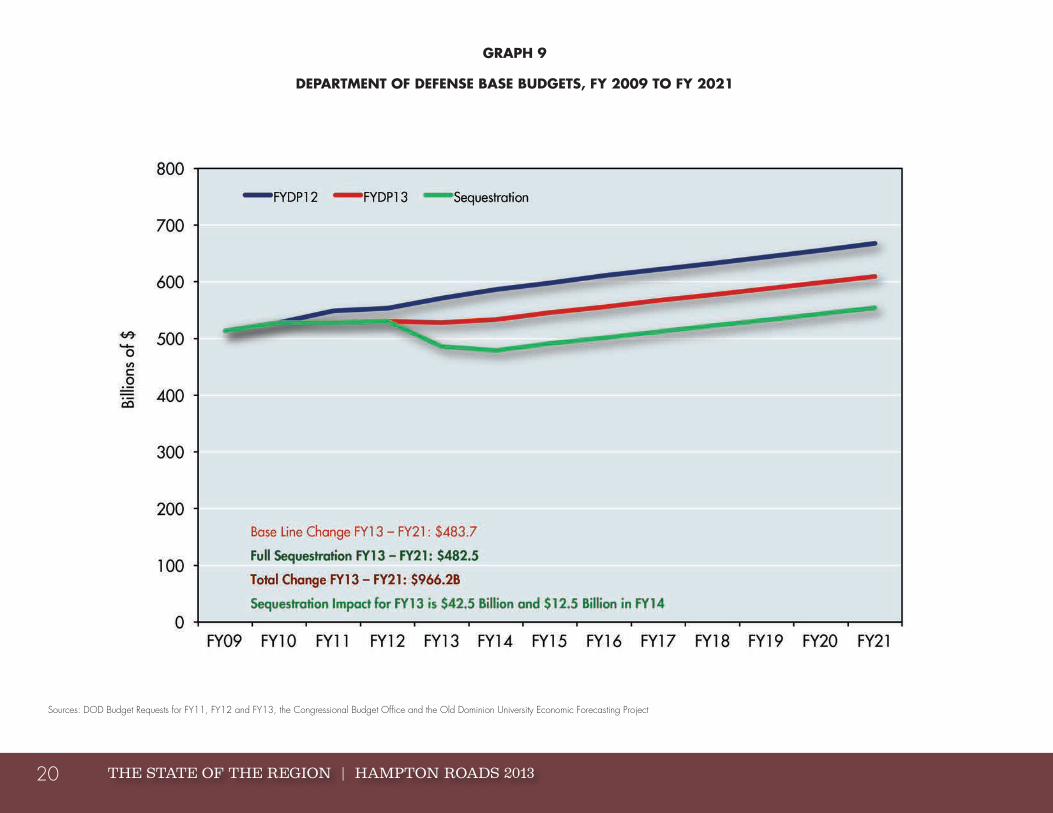
Even so, there are more cuts on the horizon. Graph 9 contrasts three different DOD spending regimes. The dark blue line reflects the probable path of the base line DOD budget between FY 2009 and FY 2012 in the absence of any cuts or reductions. The red line depicts cuts in base line spending already agreed to by Congress and the president. These reductions amount to $483.7 billion and are spread over approximately nine fiscal years. They are already in process. Once can see that we will feel their major impact in the first two fiscal years; thereafter, base line DOD spending resumes its predicted increase.
The green line illustrates cuts in DOD spending because sequestration has been invoked as a result of the Budget Control Act of 2011. These cuts also are front-loaded in the first two fiscal years; they
amount to another $482.5 billion through fiscal year 2021. Once the DOD has adjusted to these cuts in the first two fiscal years, base line DOD spending once again will increase at predictable rates.
“Base line” is an important notion and conceptually is best understood as representing the Pentagon’s permanent budget. Thus, the base line budget does not include DOD spending for special, “temporary” purposes such as Iraq and Afghanistan.
The bottom line is that defense spending in Hampton Roads will take a major hit in FY 2013 ($42.5 billion) and a lesser hit in FY 2014 ($12.5 billion). Thereafter, it is likely to resume its march upward and thus we may well now be living through our darkest economic days. However, the situation is hardly static; circumstances change from week to week because of new decisions and guidance by Congress and the president. It would be unwise to assume that we now have a clear road map for our regional economic future.
In any case, absent international crises that stimulate defense spending, 2013 and 2014 are unlikely to be remembered fondly in economic terms. It is likely that we will experience slow income growth, an inability to reduce
TABLE 6
SEQUESTRATION: THE BOTTOM LINE IMPACT ON HAMPTON ROADS FOR 2013January 2013
EstimatesRevisions After Sequestration
Effect of Sequestration
Real GRP Growth in 2013 1.45% 0.94% -0.51%
Job Gains/Losses in 2013 + 5,207 (0.70%) 1,241 (0.17%) -3,966Notes: Nominal GRP in 2011 is estimated to be $82.36 billion and DOD spending is estimated to be $20.75 billion. All of the regional reductions and losses are estimates of the Old Dominion University Economic Forecasting Project based upon the overall percentage cuts in national defense spending estimated by the CBO or CSBA.

IT COULD HAVE BEEN (MUCH) WORSE 19
unemployment rates, stagnant retail sales and only moderate increases in housing prices.
However, it is not only the absolute level of DOD spending in Hampton Roads that should be of concern to us, but also the mix of those expenditures. The need of the DOD to curtail expenditures significantly could lead it to consider “big-ticket” expenditure cuts.
Here are some of our potential regional vulnerabilities over this decade:
• Congress invokes another BRAC process designed to close or downgrade military facilities and programs.
• The number of aircraft carrier groups is permanently reduced by one or two.
• One aircraft carrier group is transferred to the Pacific (former Secretary of Defense Leon Panetta did not disclose such a move, but did specifically indicate a refocusing of naval assets in the Pacific).
• Naval construction and repair in the region are delayed or reduced.
• The number of aircraft at Oceana Naval Air Station is reduced.
• Annual military compensation increases fall significantly as salary increases become smaller, and personnel are required to pay for larger proportions of their medical expenses.
• The DOD concludes that major floating assets such as aircraft carriers no longer are as useful and defensible as they once were, and this leads the DOD to focus its expenditures elsewhere.
• Rapid increases in the prices of significant military assets (ships, airplanes, etc.) continue and simply make it impossible for the DOD to purchase and maintain as many as before. This leads to fewer homeported ships, smaller numbers of airplanes located in Hampton Roads and reduced construction and repair activity.
• Rising sea levels in Hampton Roads prompt the U.S. Navy to give much stronger consideration to relocating its assets.
This is a long list and may appear to some to resemble a Chicken Little, “the sky is falling” inventory of unlikely circumstances. We should hope this is the case; if it is not, then our region is in for bad economic times.
THE STATE OF THE REGION | HAMPTON ROADS 201320
GRAPH 9
DEPARTMENT OF DEFENSE BASE BUDGETS, FY 2009 TO FY 2021
Sources: DOD Budget Requests for FY11, FY12 and FY13, the Congressional Budget Office and the Old Dominion University Economic Forecasting Project
IT COULD HAVE BEEN (MUCH) WORSE 21
REDUCTIONS IN DEFENSE SPENDING TRANSLATE TO SLOWER
ECONOMIC GROWTH AND FEWER JOBS
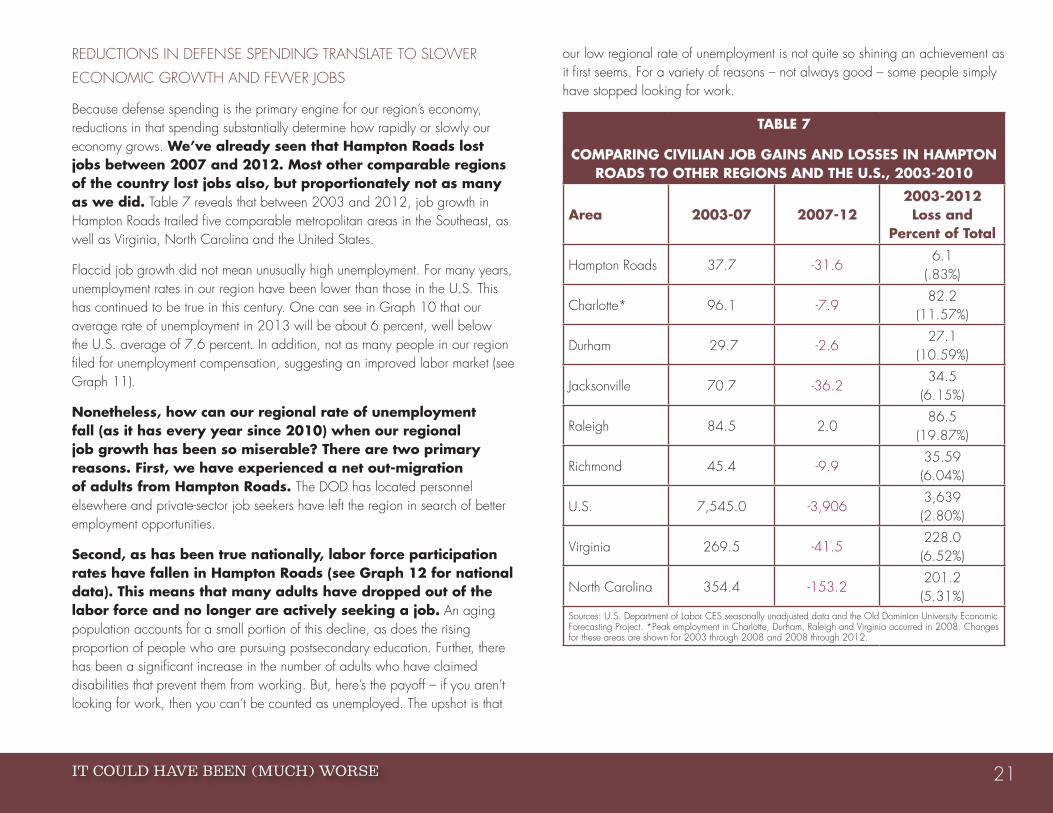
Because defense spending is the primary engine for our region’s economy, reductions in that spending substantially determine how rapidly or slowly our economy grows. We’ve already seen that Hampton Roads lost jobs between 2007 and 2012. Most other comparable regions of the country lost jobs also, but proportionately not as many as we did. Table 7 reveals that between 2003 and 2012, job growth in Hampton Roads trailed five comparable metropolitan areas in the Southeast, as well as Virginia, North Carolina and the United States.
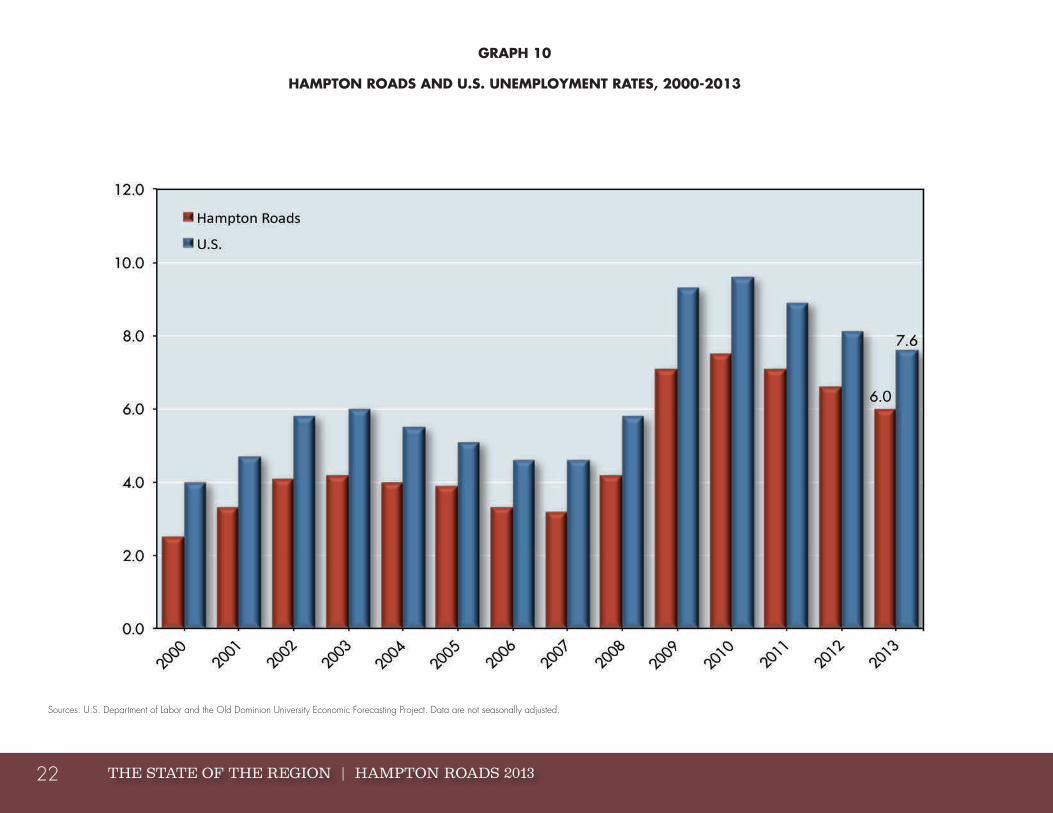
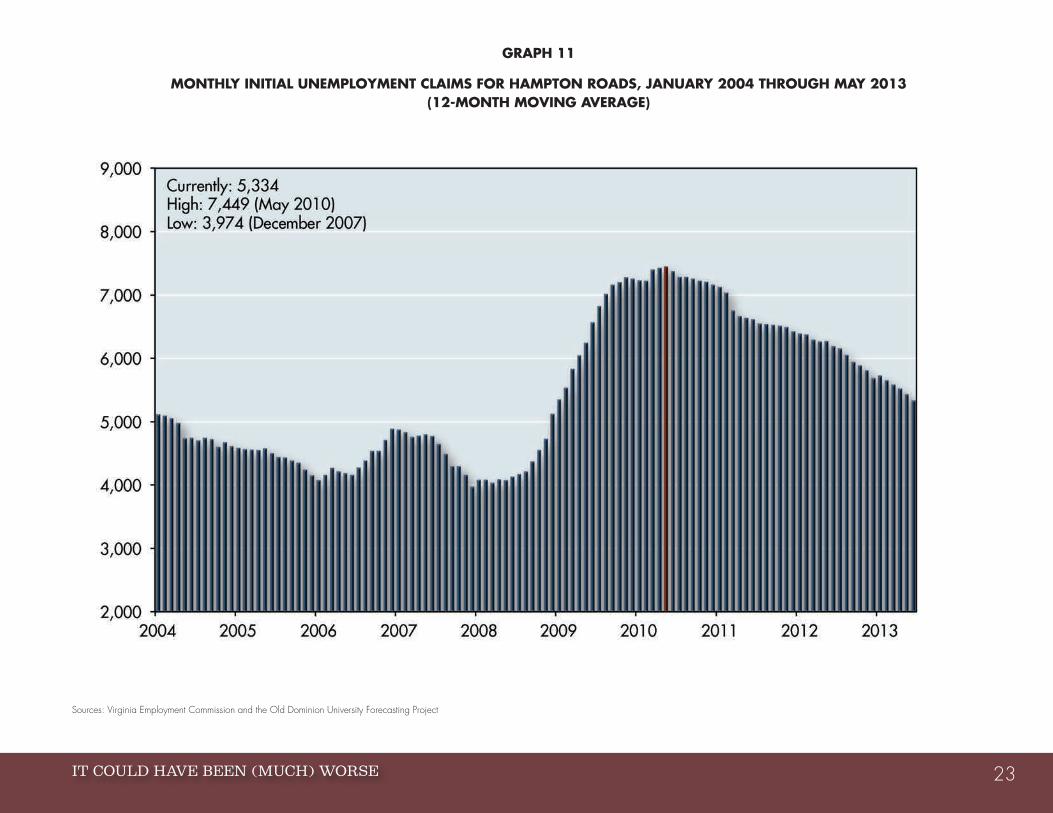
Flaccid job growth did not mean unusually high unemployment. For many years, unemployment rates in our region have been lower than those in the U.S. This has continued to be true in this century. One can see in Graph 10 that our average rate of unemployment in 2013 will be about 6 percent, well below the U.S. average of 7.6 percent. In addition, not as many people in our region filed for unemployment compensation, suggesting an improved labor market (see Graph 11).
Nonetheless, how can our regional rate of unemployment fall (as it has every year since 2010) when our regional job growth has been so miserable? There are two primary reasons. First, we have experienced a net out-migration of adults from Hampton Roads. The DOD has located personnel elsewhere and private-sector job seekers have left the region in search of better employment opportunities.
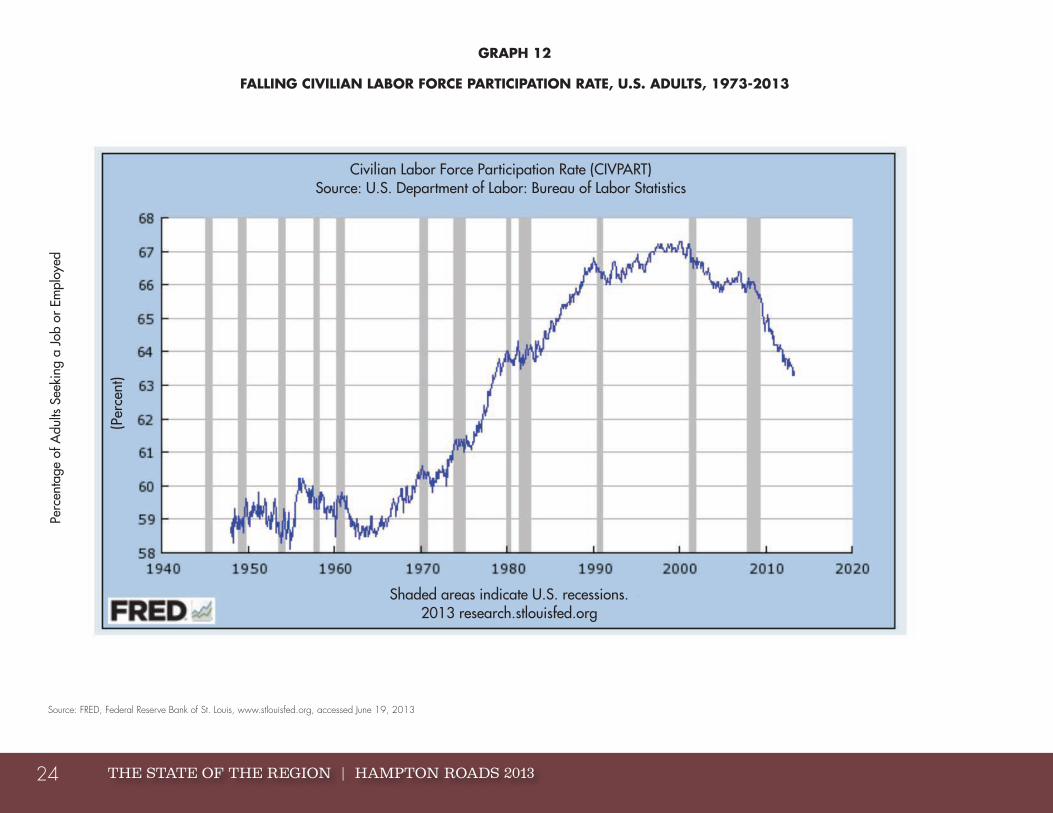
Second, as has been true nationally, labor force participation rates have fallen in Hampton Roads (see Graph 12 for national data). This means that many adults have dropped out of the labor force and no longer are actively seeking a job. An aging population accounts for a small portion of this decline, as does the rising proportion of people who are pursuing postsecondary education. Further, there has been a significant increase in the number of adults who have claimed disabilities that prevent them from working. But, here’s the payoff – if you aren’t looking for work, then you can’t be counted as unemployed. The upshot is that
our low regional rate of unemployment is not quite so shining an achievement as it first seems. For a variety of reasons – not always good – some people simply have stopped looking for work.
TABLE 7
COMPARING CIVILIAN JOB GAINS AND LOSSES IN HAMPTON ROADS TO OTHER REGIONS AND THE U.S., 2003-2010
Area 2003-07 2007-122003-2012 Loss and
Percent of Total
Hampton Roads 37.7 -31.66.1
(.83%)
Charlotte* 96.1 -7.982.2
(11.57%)
Durham 29.7 -2.627.1
(10.59%)
Jacksonville 70.7 -36.234.5
(6.15%)
Raleigh 84.5 2.086.5
(19.87%)
Richmond 45.4 -9.935.59 (6.04%)
U.S. 7,545.0 -3,9063,639 (2.80%)
Virginia 269.5 -41.5228.0 (6.52%)
North Carolina 354.4 -153.2201.2 (5.31%)
Sources: U.S. Department of Labor CES seasonally unadjusted data and the Old Dominion University Economic Forecasting Project. *Peak employment in Charlotte, Durham, Raleigh and Virginia occurred in 2008. Changes for these areas are shown for 2003 through 2008 and 2008 through 2012.
THE STATE OF THE REGION | HAMPTON ROADS 201322
GRAPH 10
HAMPTON ROADS AND U.S. UNEMPLOYMENT RATES, 2000-2013
Sources: U.S. Department of Labor and the Old Dominion University Economic Forecasting Project. Data are not seasonally adjusted.
IT COULD HAVE BEEN (MUCH) WORSE 23
GRAPH 11
MONTHLY INITIAL UNEMPLOYMENT CLAIMS FOR HAMPTON ROADS, JANUARY 2004 THROUGH MAY 2013 (12-MONTH MOVING AVERAGE)
Sources: Virginia Employment Commission and the Old Dominion University Forecasting Project
THE STATE OF THE REGION | HAMPTON ROADS 201324
GRAPH 12
FALLING CIVILIAN LABOR FORCE PARTICIPATION RATE, U.S. ADULTS, 1973-2013
Source: FRED, Federal Reserve Bank of St. Louis, www.stlouisfed.org, accessed June 19, 2013
Perc
enta
ge o
f Adu
lts S
eeki
ng a
Job
or
Empl
oyed
Shaded areas indicate U.S. recessions. 2013 research.stlouisfed.org
Civilian Labor Force Participation Rate (CIVPART) Source: U.S. Department of Labor: Bureau of Labor Statistics
(Per
cent
)
IT COULD HAVE BEEN (MUCH) WORSE 25
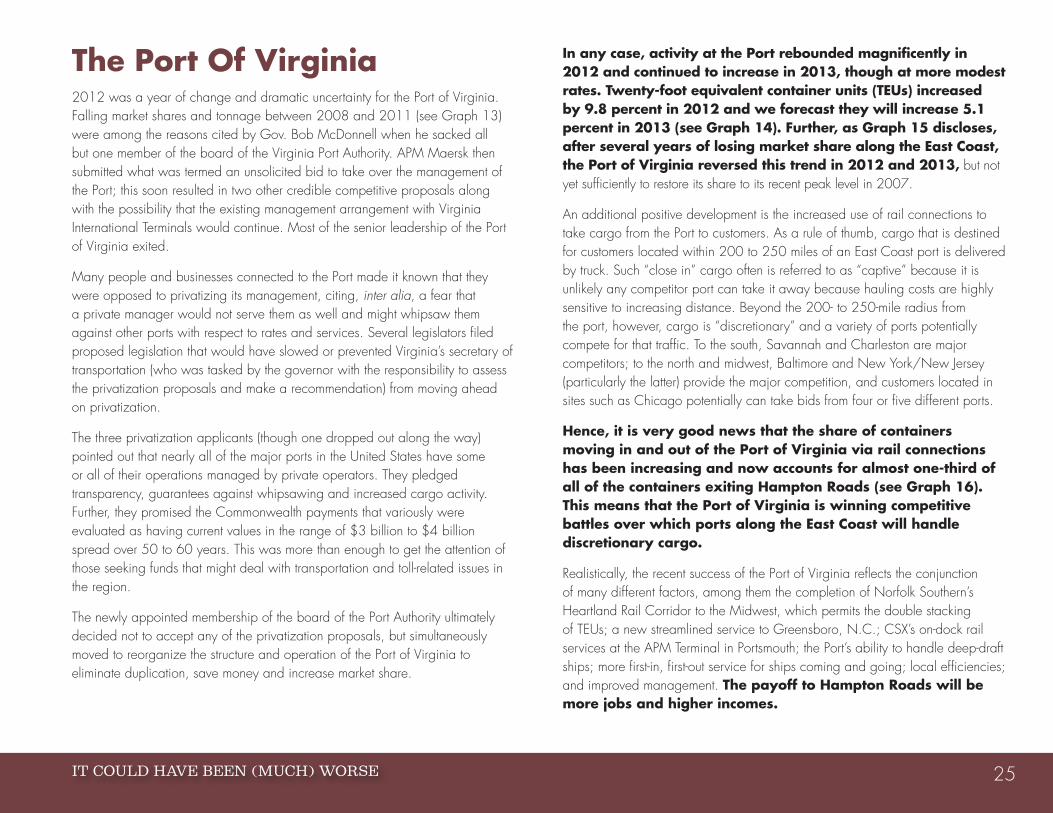
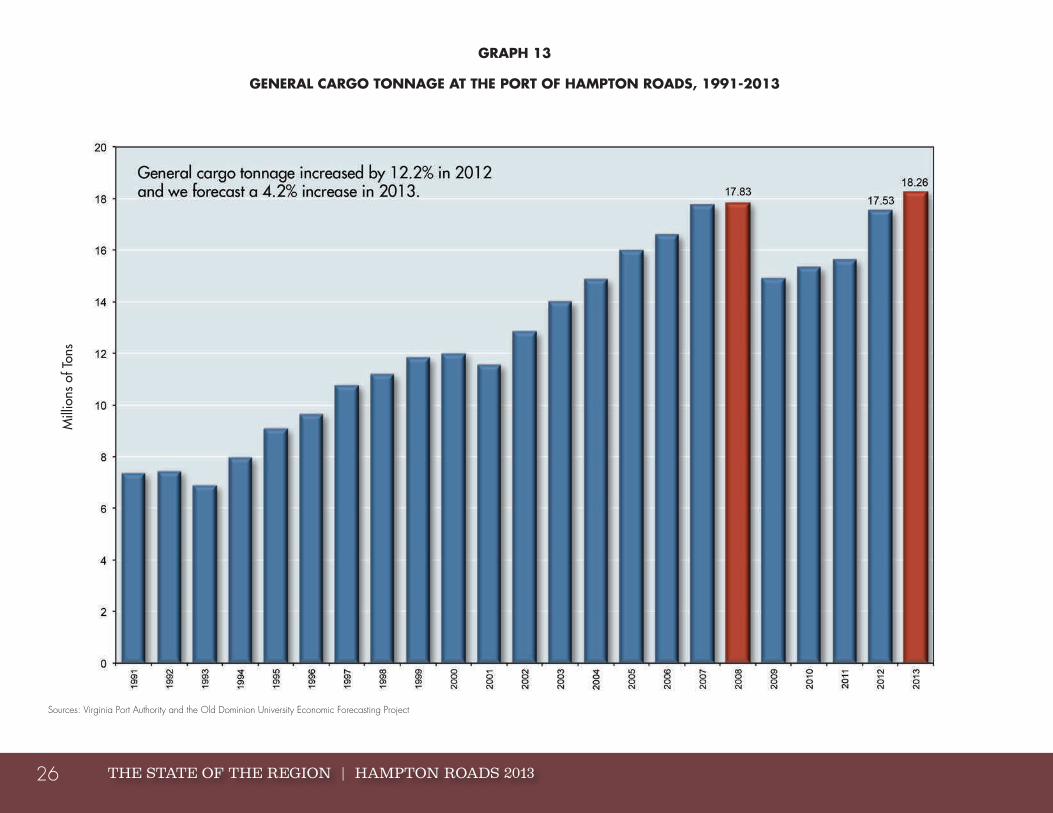
The Port Of Virginia2012 was a year of change and dramatic uncertainty for the Port of Virginia. Falling market shares and tonnage between 2008 and 2011 (see Graph 13) were among the reasons cited by Gov. Bob McDonnell when he sacked all but one member of the board of the Virginia Port Authority. APM Maersk then submitted what was termed an unsolicited bid to take over the management of the Port; this soon resulted in two other credible competitive proposals along with the possibility that the existing management arrangement with Virginia International Terminals would continue. Most of the senior leadership of the Port of Virginia exited.
Many people and businesses connected to the Port made it known that they were opposed to privatizing its management, citing, inter alia, a fear that a private manager would not serve them as well and might whipsaw them against other ports with respect to rates and services. Several legislators filed proposed legislation that would have slowed or prevented Virginia’s secretary of transportation (who was tasked by the governor with the responsibility to assess the privatization proposals and make a recommendation) from moving ahead on privatization.
The three privatization applicants (though one dropped out along the way) pointed out that nearly all of the major ports in the United States have some or all of their operations managed by private operators. They pledged transparency, guarantees against whipsawing and increased cargo activity. Further, they promised the Commonwealth payments that variously were evaluated as having current values in the range of $3 billion to $4 billion spread over 50 to 60 years. This was more than enough to get the attention of those seeking funds that might deal with transportation and toll-related issues in the region.
The newly appointed membership of the board of the Port Authority ultimately decided not to accept any of the privatization proposals, but simultaneously moved to reorganize the structure and operation of the Port of Virginia to eliminate duplication, save money and increase market share.
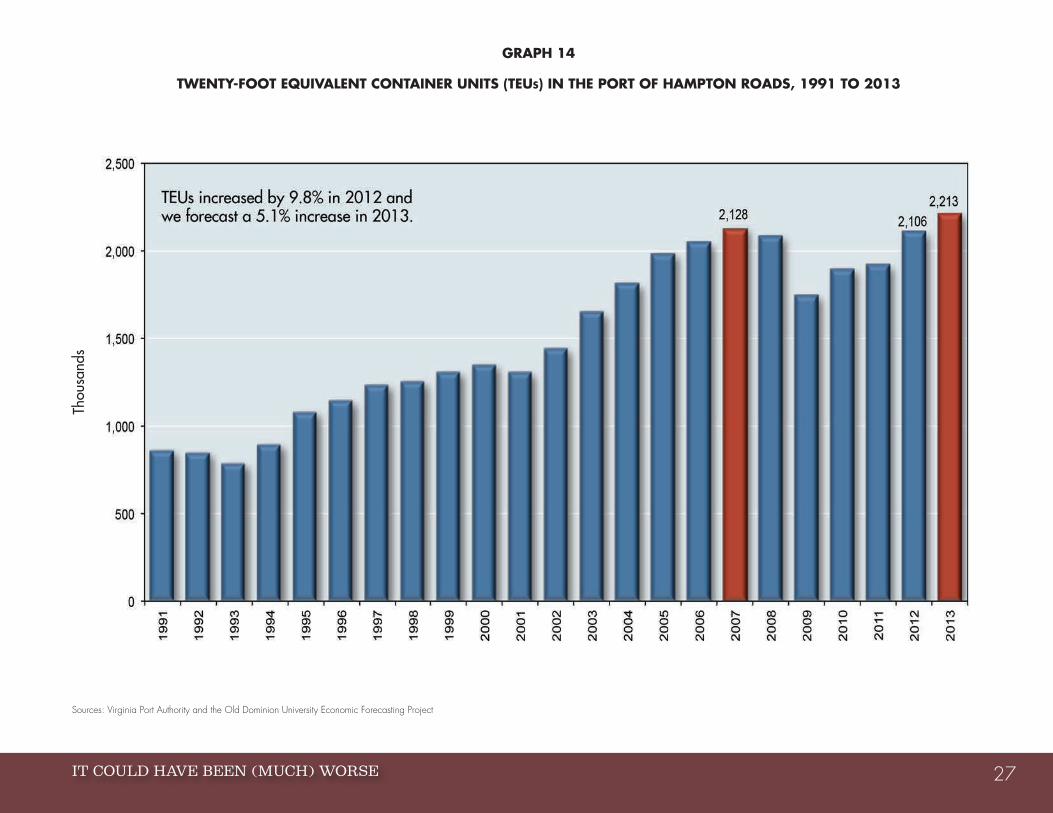
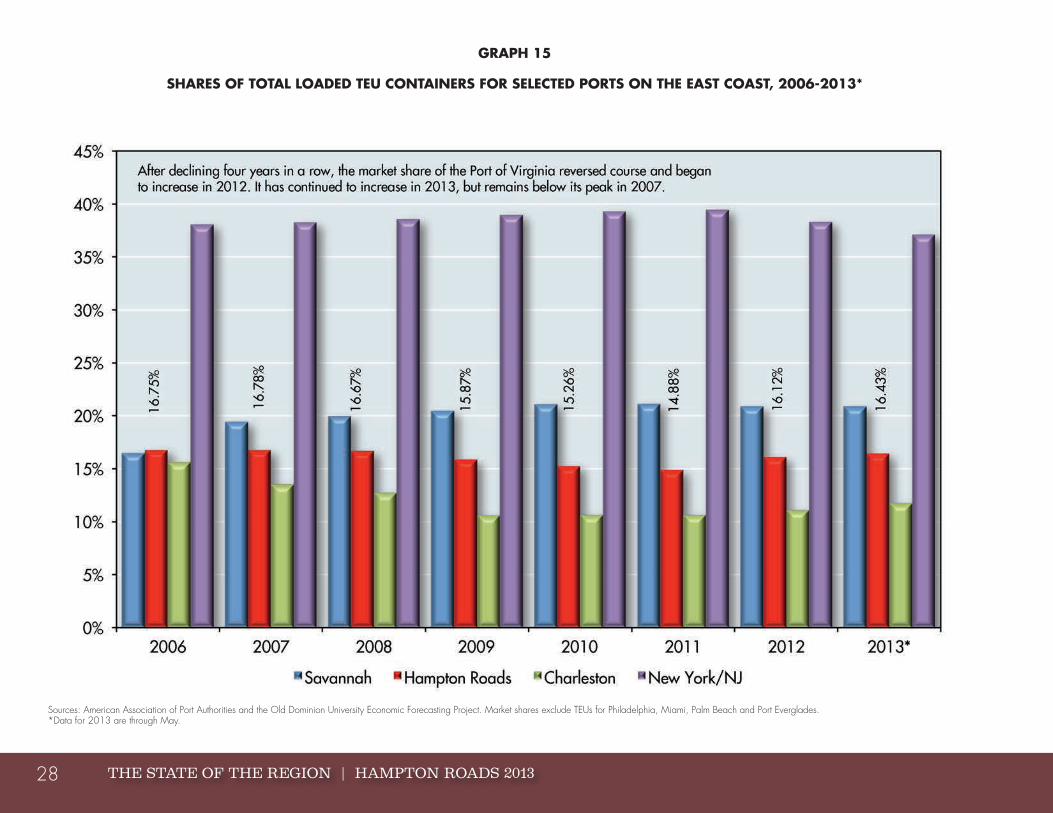
In any case, activity at the Port rebounded magnificently in 2012 and continued to increase in 2013, though at more modest rates. Twenty-foot equivalent container units (TEUs) increased by 9.8 percent in 2012 and we forecast they will increase 5.1 percent in 2013 (see Graph 14). Further, as Graph 15 discloses, after several years of losing market share along the East Coast, the Port of Virginia reversed this trend in 2012 and 2013, but not yet sufficiently to restore its share to its recent peak level in 2007.
An additional positive development is the increased use of rail connections to take cargo from the Port to customers. As a rule of thumb, cargo that is destined for customers located within 200 to 250 miles of an East Coast port is delivered by truck. Such “close in” cargo often is referred to as “captive” because it is unlikely any competitor port can take it away because hauling costs are highly sensitive to increasing distance. Beyond the 200- to 250-mile radius from the port, however, cargo is “discretionary” and a variety of ports potentially compete for that traffic. To the south, Savannah and Charleston are major competitors; to the north and midwest, Baltimore and New York/New Jersey (particularly the latter) provide the major competition, and customers located in sites such as Chicago potentially can take bids from four or five different ports.
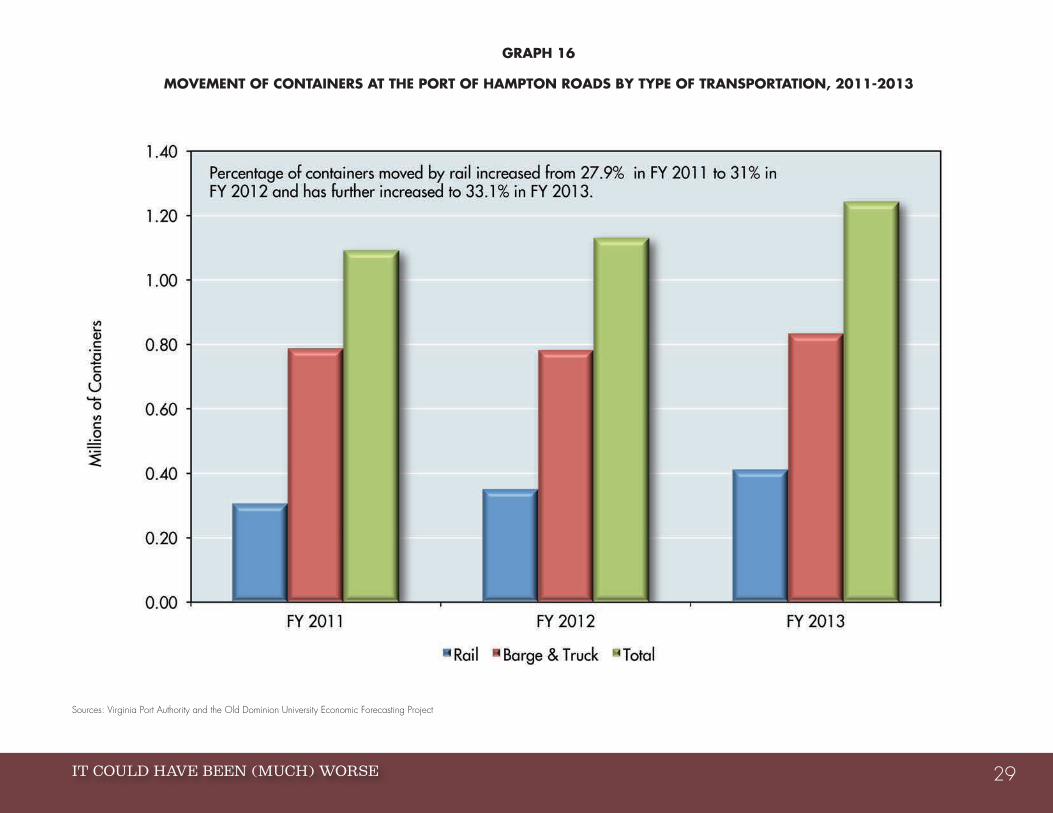
Hence, it is very good news that the share of containers moving in and out of the Port of Virginia via rail connections has been increasing and now accounts for almost one-third of all of the containers exiting Hampton Roads (see Graph 16). This means that the Port of Virginia is winning competitive battles over which ports along the East Coast will handle discretionary cargo.
Realistically, the recent success of the Port of Virginia reflects the conjunction of many different factors, among them the completion of Norfolk Southern’s Heartland Rail Corridor to the Midwest, which permits the double stacking of TEUs; a new streamlined service to Greensboro, N.C.; CSX’s on-dock rail services at the APM Terminal in Portsmouth; the Port’s ability to handle deep-draft ships; more first-in, first-out service for ships coming and going; local efficiencies; and improved management. The payoff to Hampton Roads will be more jobs and higher incomes.
THE STATE OF THE REGION | HAMPTON ROADS 201326
GRAPH 13
GENERAL CARGO TONNAGE AT THE PORT OF HAMPTON ROADS, 1991-2013
Sources: Virginia Port Authority and the Old Dominion University Economic Forecasting Project
Mill
ions
of T
ons
IT COULD HAVE BEEN (MUCH) WORSE 27
GRAPH 14
TWENTY-FOOT EQUIVALENT CONTAINER UNITS (TEUs) IN THE PORT OF HAMPTON ROADS, 1991 TO 2013
Sources: Virginia Port Authority and the Old Dominion University Economic Forecasting Project
Thou
sand
s
THE STATE OF THE REGION | HAMPTON ROADS 201328
GRAPH 15
SHARES OF TOTAL LOADED TEU CONTAINERS FOR SELECTED PORTS ON THE EAST COAST, 2006-2013*
Sources: American Association of Port Authorities and the Old Dominion University Economic Forecasting Project. Market shares exclude TEUs for Philadelphia, Miami, Palm Beach and Port Everglades. *Data for 2013 are through May.
IT COULD HAVE BEEN (MUCH) WORSE 29
GRAPH 16
MOVEMENT OF CONTAINERS AT THE PORT OF HAMPTON ROADS BY TYPE OF TRANSPORTATION, 2011-2013
Sources: Virginia Port Authority and the Old Dominion University Economic Forecasting Project
THE STATE OF THE REGION | HAMPTON ROADS 201330
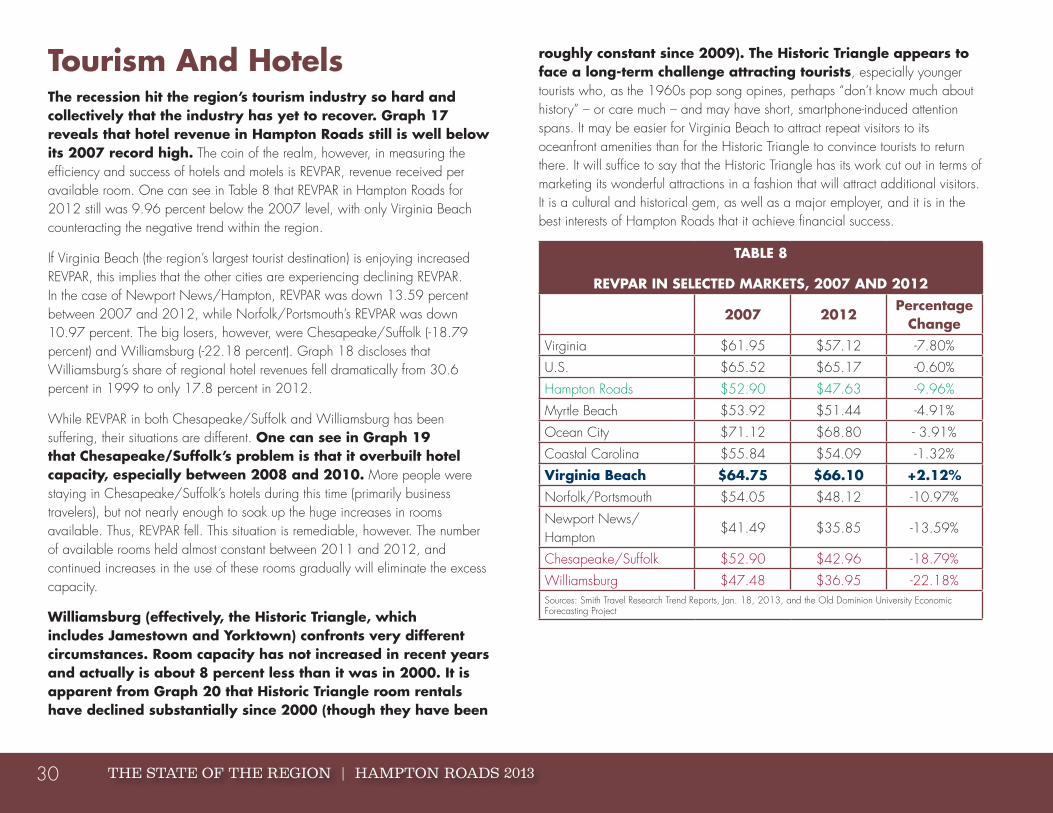
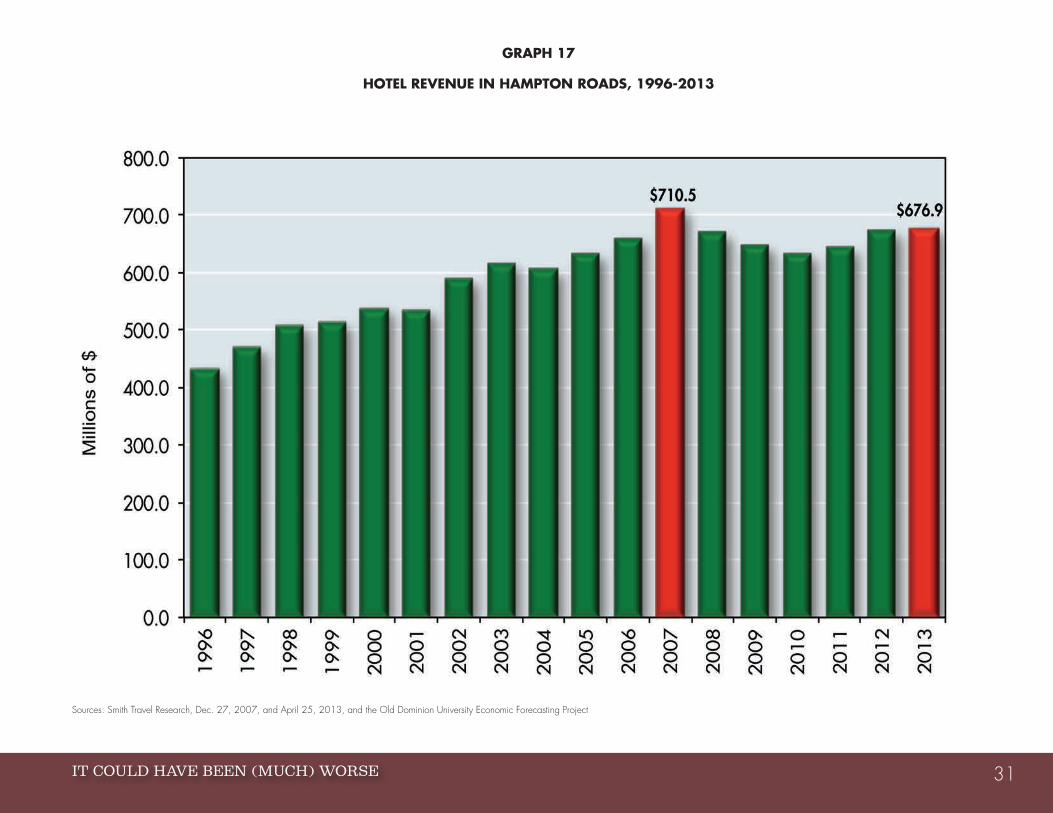
Tourism And HotelsThe recession hit the region’s tourism industry so hard and collectively that the industry has yet to recover. Graph 17 reveals that hotel revenue in Hampton Roads still is well below its 2007 record high. The coin of the realm, however, in measuring the efficiency and success of hotels and motels is REVPAR, revenue received per available room. One can see in Table 8 that REVPAR in Hampton Roads for 2012 still was 9.96 percent below the 2007 level, with only Virginia Beach counteracting the negative trend within the region.
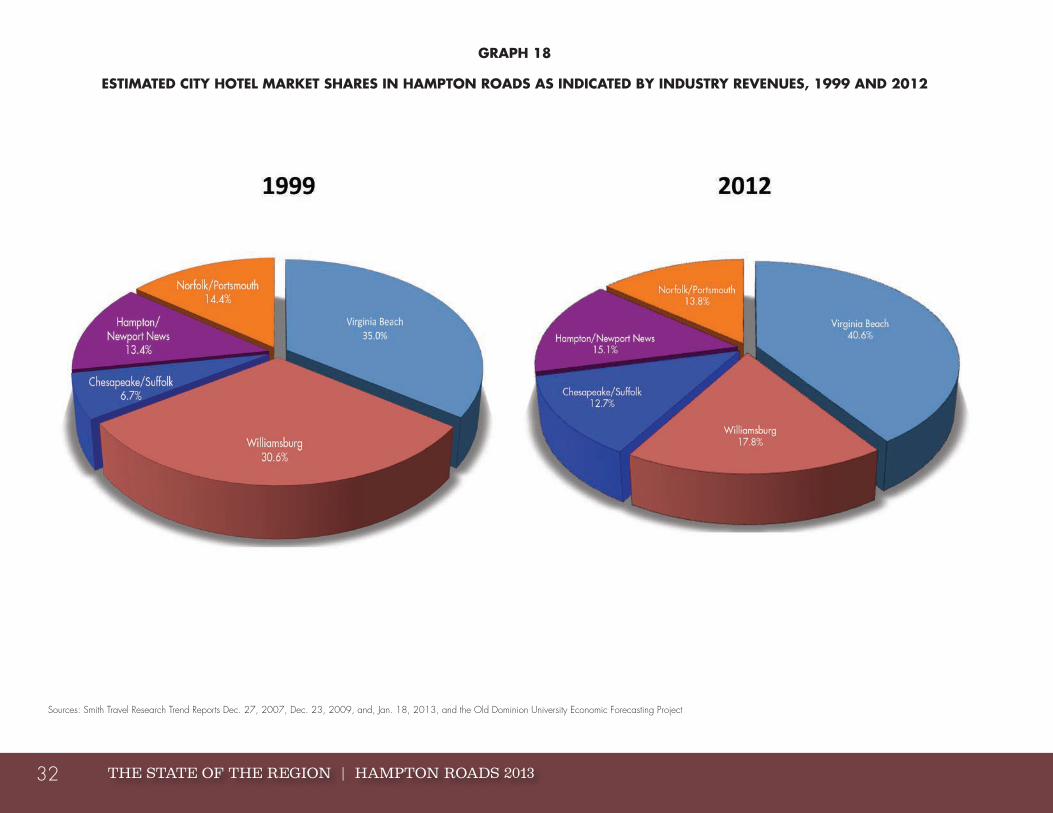
If Virginia Beach (the region’s largest tourist destination) is enjoying increased REVPAR, this implies that the other cities are experiencing declining REVPAR. In the case of Newport News/Hampton, REVPAR was down 13.59 percent between 2007 and 2012, while Norfolk/Portsmouth’s REVPAR was down 10.97 percent. The big losers, however, were Chesapeake/Suffolk (-18.79 percent) and Williamsburg (-22.18 percent). Graph 18 discloses that Williamsburg’s share of regional hotel revenues fell dramatically from 30.6 percent in 1999 to only 17.8 percent in 2012.
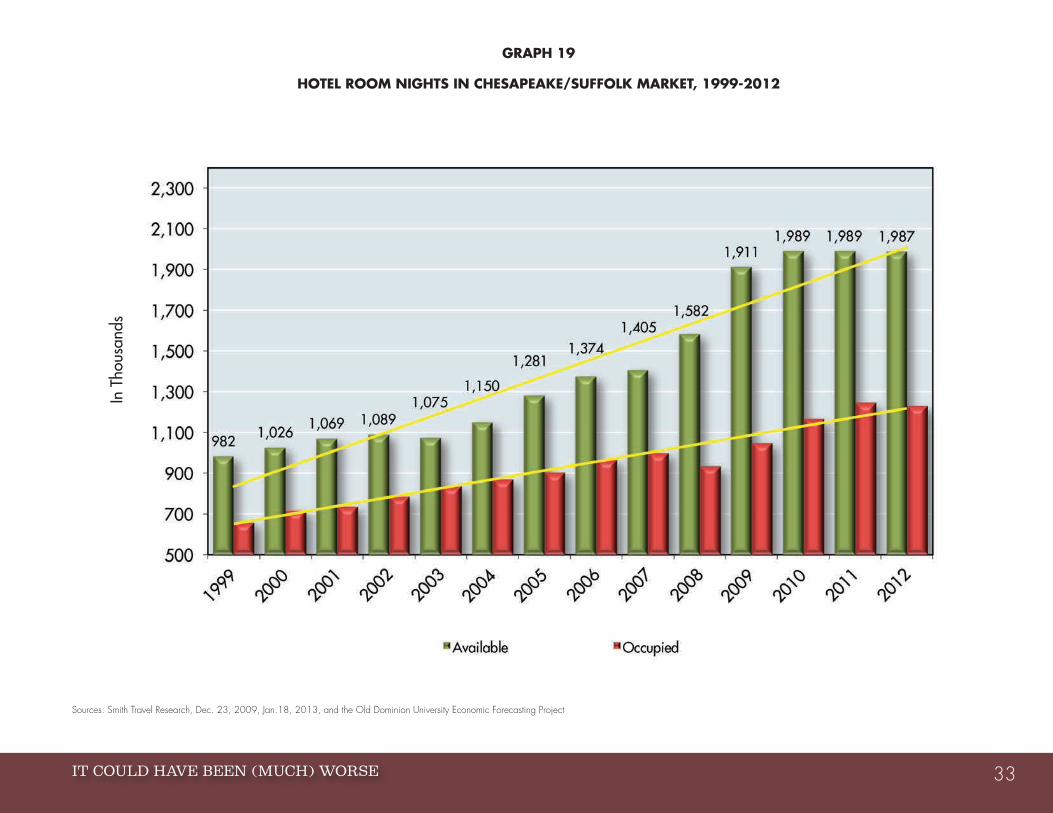
While REVPAR in both Chesapeake/Suffolk and Williamsburg has been suffering, their situations are different. One can see in Graph 19 that Chesapeake/Suffolk’s problem is that it overbuilt hotel capacity, especially between 2008 and 2010. More people were staying in Chesapeake/Suffolk’s hotels during this time (primarily business travelers), but not nearly enough to soak up the huge increases in rooms available. Thus, REVPAR fell. This situation is remediable, however. The number of available rooms held almost constant between 2011 and 2012, and continued increases in the use of these rooms gradually will eliminate the excess capacity.
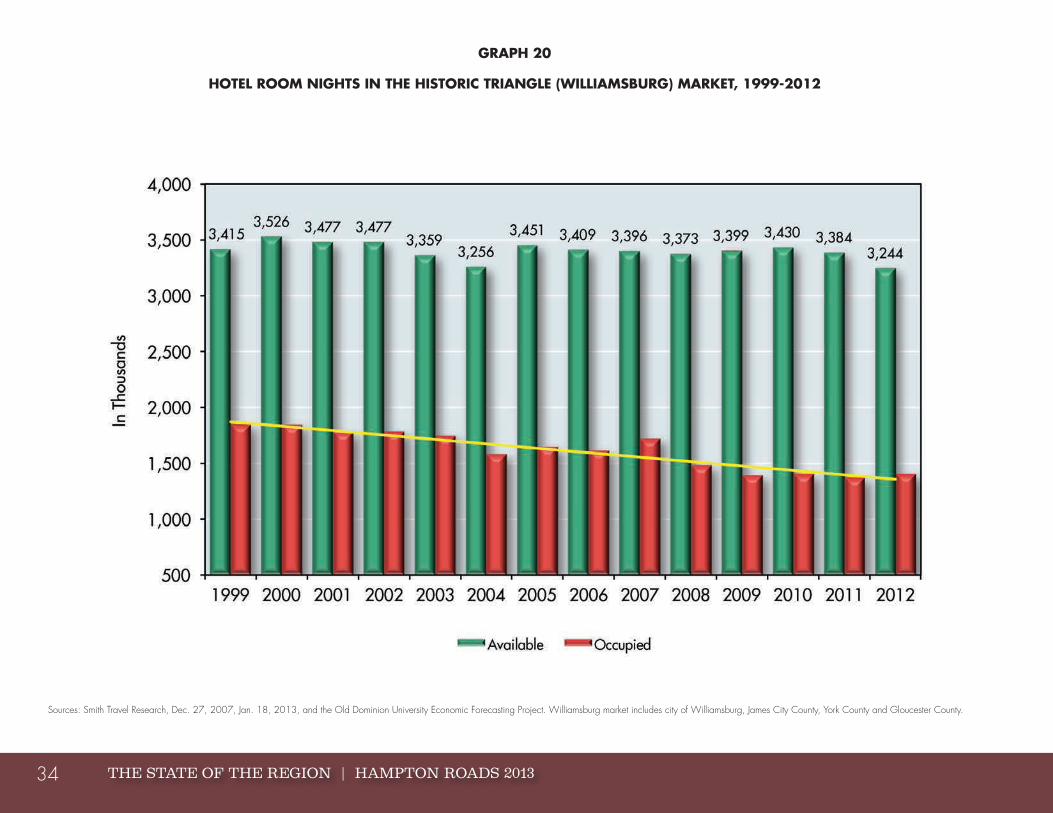
Williamsburg (effectively, the Historic Triangle, which includes Jamestown and Yorktown) confronts very different circumstances. Room capacity has not increased in recent years and actually is about 8 percent less than it was in 2000. It is apparent from Graph 20 that Historic Triangle room rentals have declined substantially since 2000 (though they have been
roughly constant since 2009). The Historic Triangle appears to face a long-term challenge attracting tourists, especially younger tourists who, as the 1960s pop song opines, perhaps “don’t know much about history” – or care much – and may have short, smartphone-induced attention spans. It may be easier for Virginia Beach to attract repeat visitors to its oceanfront amenities than for the Historic Triangle to convince tourists to return there. It will suffice to say that the Historic Triangle has its work cut out in terms of marketing its wonderful attractions in a fashion that will attract additional visitors. It is a cultural and historical gem, as well as a major employer, and it is in the best interests of Hampton Roads that it achieve financial success.
TABLE 8
REVPAR IN SELECTED MARKETS, 2007 AND 2012
2007 2012Percentage
ChangeVirginia $61.95 $57.12 -7.80%
U.S. $65.52 $65.17 -0.60%
Hampton Roads $52.90 $47.63 -9.96%
Myrtle Beach $53.92 $51.44 -4.91%
Ocean City $71.12 $68.80 - 3.91%
Coastal Carolina $55.84 $54.09 -1.32%
Virginia Beach $64.75 $66.10 +2.12%Norfolk/Portsmouth $54.05 $48.12 -10.97%
Newport News/Hampton
$41.49 $35.85 -13.59%
Chesapeake/Suffolk $52.90 $42.96 -18.79%
Williamsburg $47.48 $36.95 -22.18%Sources: Smith Travel Research Trend Reports, Jan. 18, 2013, and the Old Dominion University Economic Forecasting Project
IT COULD HAVE BEEN (MUCH) WORSE 31
GRAPH 17
HOTEL REVENUE IN HAMPTON ROADS, 1996-2013
Sources: Smith Travel Research, Dec. 27, 2007, and April 25, 2013, and the Old Dominion University Economic Forecasting Project
THE STATE OF THE REGION | HAMPTON ROADS 201332
GRAPH 18
ESTIMATED CITY HOTEL MARKET SHARES IN HAMPTON ROADS AS INDICATED BY INDUSTRY REVENUES, 1999 AND 2012
Sources: Smith Travel Research Trend Reports Dec. 27, 2007, Dec. 23, 2009, and, Jan. 18, 2013, and the Old Dominion University Economic Forecasting Project
IT COULD HAVE BEEN (MUCH) WORSE 33
GRAPH 19
HOTEL ROOM NIGHTS IN CHESAPEAKE/SUFFOLK MARKET, 1999-2012
Sources: Smith Travel Research, Dec. 23, 2009, Jan.18, 2013, and the Old Dominion University Economic Forecasting Project
In T
hous
ands
THE STATE OF THE REGION | HAMPTON ROADS 201334
GRAPH 20
HOTEL ROOM NIGHTS IN THE HISTORIC TRIANGLE (WILLIAMSBURG) MARKET, 1999-2012
Sources: Smith Travel Research, Dec. 27, 2007, Jan. 18, 2013, and the Old Dominion University Economic Forecasting Project. Williamsburg market includes city of Williamsburg, James City County, York County and Gloucester County.

IT COULD HAVE BEEN (MUCH) WORSE 35
Summing It UpYes, 2013 was not a great year, but it really could have been worse. We were able to vault over federal budget sequestration and achieve modestly respectable private-sector economic growth. Bright spots included the Port of Virginia and tourism in Virginia Beach. And, as we will see in the next chapter, the regional housing market has turned the corner and despite still hefty levels of distressed, bank-owned homes and homes being auctioned, is healthier than it has been for half a decade.