Embed Size (px)
Citation preview

1
JUNE, 2016
IT Barometer 2016Kosovo
South-East Europe IT Industry Barometer(SEE ITIB) 2016

2
THIS REPORT SHOWS RESULTS FOR KOSOVO ONLY AND IS PART OF THE SOUTH EAST EUROPE IT INDUSTRY BAROMETER 2016 WHICH CAN BE FOUND AT WWW.STIKK.ORG.
“THE BEST WAY TO PREDICT THE FUTURE IS TO INVENT IT” - ALAN KAY

1. ABBREVIATIONS 4
2. EXECUTIVE SUMMARY 4-5
2. INTRODUCTION 6
3. PROJECT METHODOLOGY 7
CHAPTER 1: RECENT ICT TRENDS IN KOSOVO 8-9
CHAPTER 2: SEE ITIB 2016 COMPARATIVE ANALYSIS 10-35
Ch2.1. General information about the companies 11
Ch2.2. Export 18
Ch2.3. Statistics 22
Ch2.4. Human resources 26
Ch2.5. Forecasts 32
5. CONCLUSIONS 36-37
6. ANNEXES 38-46
6.1. Annex 1 38-39
6.2. Annex 2 40-43
6.3. Annex 3 44-46
7. REFERENCES 47
8. ANNEX 4: Questionnaire 48-62
CONTENTS
4
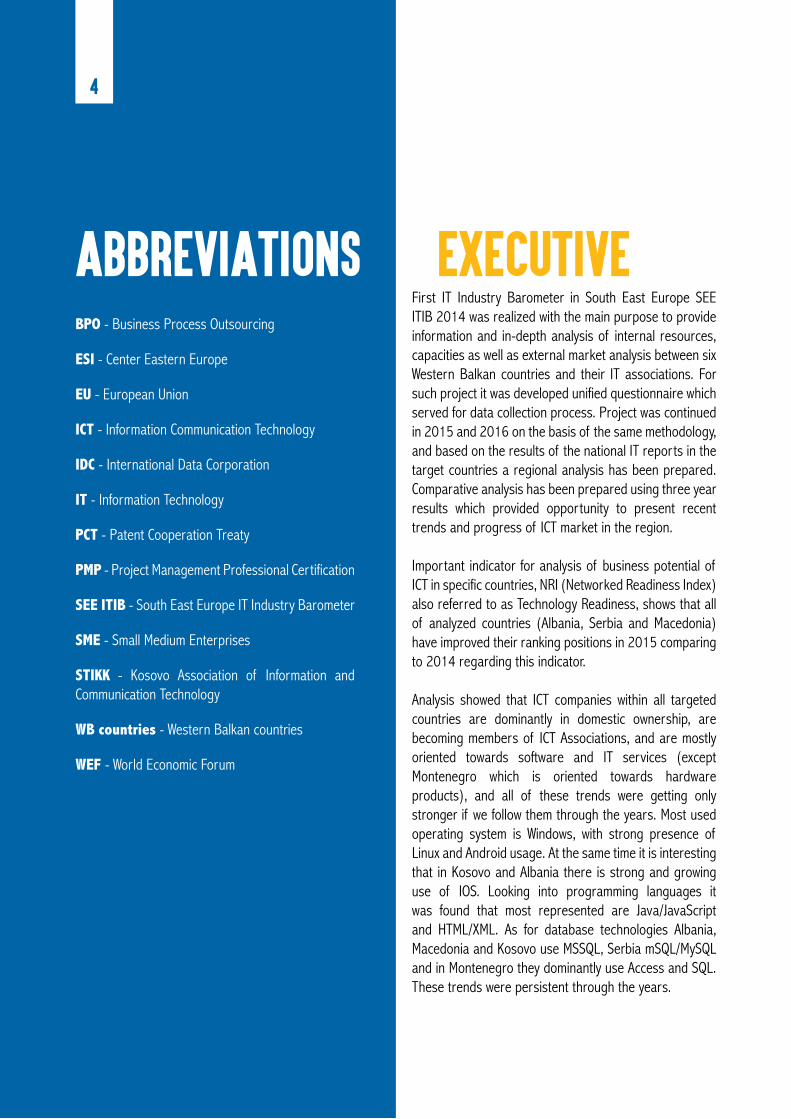
First IT Industry Barometer in South East Europe SEE ITIB 2014 was realized with the main purpose to provide information and in-depth analysis of internal resources, capacities as well as external market analysis between six Western Balkan countries and their IT associations. For such project it was developed unified questionnaire which served for data collection process. Project was continued in 2015 and 2016 on the basis of the same methodology, and based on the results of the national IT reports in the target countries a regional analysis has been prepared. Comparative analysis has been prepared using three year results which provided opportunity to present recent trends and progress of ICT market in the region.
Important indicator for analysis of business potential of ICT in specific countries, NRI (Networked Readiness Index) also referred to as Technology Readiness, shows that all of analyzed countries (Albania, Serbia and Macedonia) have improved their ranking positions in 2015 comparing to 2014 regarding this indicator.
Analysis showed that ICT companies within all targeted countries are dominantly in domestic ownership, are becoming members of ICT Associations, and are mostly oriented towards software and IT services (except Montenegro which is oriented towards hardware products), and all of these trends were getting only stronger if we follow them through the years. Most used operating system is Windows, with strong presence of Linux and Android usage. At the same time it is interesting that in Kosovo and Albania there is strong and growing use of IOS. Looking into programming languages it was found that most represented are Java/JavaScript and HTML/XML. As for database technologies Albania, Macedonia and Kosovo use MSSQL, Serbia mSQL/MySQL and in Montenegro they dominantly use Access and SQL. These trends were persistent through the years.
EXECUTIVEBPO - Business Process Outsourcing
ESI - Center Eastern Europe
EU - European Union
ICT - Information Communication Technology
IDC - International Data Corporation
IT - Information Technology
PCT - Patent Cooperation Treaty
PMP - Project Management Professional Certification
SEE ITIB - South East Europe IT Industry Barometer
SME - Small Medium Enterprises
STIKK - Kosovo Association of Information and Communication Technology
WB countries - Western Balkan countries
WEF - World Economic Forum
ABBREVIATIONS
5
Analysis showed that technical certification of employees in ICT companies became more important through the years in all of the targeted countries, and most present certificates are Microsoft and Agile/Scrum.
Most of the companies in targeted countries do business for international clients within their countries. That number is the highest in Albania and it is the lowest in Montenegro. In terms of export most active are companies from Serbia, but in terms of export most active are companies from Serbia and least active are those from Montenegro. Analysis has shown that in average companies see their core competitive advantage in price, quality and technical know-how.
Looking into company’s view of potential interesting foreign markets there were a lot of differences between countries, and not only that, there is a lot of changes in views looking through the years. For Montenegro regional market is most interesting and it stayed through the years, Serbian companies share that view but through the years they have put more emphasize on potential in North American, Scandinavian and Western Europe market. Macedonia also saw potential in North American market, but it changed to Scandinavian and Central and Eastern Europe market. Kosovo and Albania has seen, and still see, greatest potential in German market, but they are now also focusing on Scandinavian and Austrian markets.
Sales analysis 2013, 2014 and 2015 has shown that, there was an increase of percentage of companies having sales turnover up to 1 million euro in most of the countries. Only exception was Montenegro, where this category is almost nonexistent with huge growth of category of sales more than 10 million. At the same time there was an increase of companies in categories of sales 1 to 5 million euro in Serbia and Kosovo.
Very important subject for every company business and strategies are its employees, and that also applies for ICT companies. Analysis shows some positive trends in all targeted countries. Most of companies are planning their expansion in terms of employing additional people and also they see possibility of increase of salaries. At the same time they are very aware of strong trend of high (10%-25%) turnover of people within one year period, and more difficulties to replace them in short period of time. At earlier times 3 months adjustment period is something that company had to expect, in that process of replacement, now it is more 6 months.
Last part of analysis has shown that among highest paid jobs are Business Developer Management, Project Managers and System Administrators. Also in almost all countries (Montenegro is exception) planned increases of number of employees in average is 10% to 25%. While doing projections and plans these companies as major negative impact see national economic situation, and as major positive impact intensified competition. Also majority see negative influence of „brain drain“ at their business, becoming stronger.
SUMMARY
6
The importance of Information and Communication Technology (ICT) for European economies has been increasingly recognized over the last two decades (EC, 2014; van Ark, 2014a; EIB, 2011). The role of ICT is significant in the process of economic development as it acts as a vehicle to improve productivity and results in added value. Additional characteristic of ICT is that it represents an important driver for innovation and knowledge-based activities, which in turn further increases economic growth. As a direct result of current economic necessities and ongoing technological developments the ICT industry is undergoing a number of fundamental challenges. In order to remain relevant to their clients and customers, it is increasingly important for businesses to monitor developments closely, adapting essential products and services to meet new marketplace demands.
The project “South East Europe IT industry barometer” (SEE ITIB) represents the annual project realized since 2014, and its main goals are to support the export capacity of ICT companies in South East Europe. The project aims to collect basic information on ICT companies in the Western Balkan region and to provide an insight into the value of the national ICT market as well as their competitiveness.
SEE ITIB2015 is realized on the basis of the methodology of the first IT Industry Barometer in South East Europe that was conducted in 2014. This study is providing information and in-depth analysis of internal resources, capacities as well as external market analysis between five Western Balkan countries and their IT associations. Project included 126 enterprises - 50 enterprises from Montenegro, 40 from Kosovo, 20 from Serbia, 7 from Macedonia and 9 from Albania.
SEE ITIB 2016 is also realized on the same basis of the methodology of the SEE ITIB 2014. As in previous years SEE ITIB 2016 is providing information and in-depth analysis of internal resources, capacities as well as external market analysis between five Western Balkan countries and their IT associations – Montenegro, Serbia, Albania, Macedonia and Kosovo.
SEE ITIB 2016 will result with SEE ITIB 2016 Report which will represents regional analysis based on the data that are previously collected in five targeted countries and contains following:
• General state overview on IT development in the region based on previous national IT analysis in each targeted country and its national characteristics and trends;
• Comparative analysis for five targeted countries;• Recent export trends between targeted countries(export potential, export activities, international cooperation,
export barriers);• Analysis of Human Resources;• Qualitative analysis on recent trends in IT industry with recommendations.
Additionally, SEE ITIB report is providing qualitative analysis on recent trends in ICT within targeted countries with main conclusions and recommendations for its further development in the future.
INTRODUCTION

7
The report contains comparative analysis of the recent trends in ICT sector among five targeted countries with the special focus on their export capacities and practices. In order to reach project goals it was done comparative analysis that is providing in-depth analysis of the development level of the IT industry between the targeted countries. Comparative analysis (benchmarking) represents a method used in qualitative analysis based on cross-national research on specific area (IT industry) and represents a method that is ‘connecting’ quantitative and qualitative analysis on targeted topic. Comparative analysis is based on the quantitative analysis of variable presented within the questionnaire and desk analysis on recent ICT trends for 2016.
Quantitative analysis was realized based on the survey conducted among that targeted enterprises in five targeted state. The survey SEE ITIB 2016 included 108 enterprises precisely 50 enterprises from Montenegro, 19 from Kosovo, 21 from Serbia, 12 from Macedonia and 6 from Albania. Because of relatively small sample for Serbia, Macedonia and Albania survey results for those countries might be considered as biased. Sample of ICT companies from Montenegro is representative and defines real status of Montenegrin ICT market. Survey has been realized by pre-defined online questionnaire except in case of Montenegro where has been realized through direct interviews.
The questionnaire consisted of 35 questions divided into five different sections:
Section 1: General information about the company;Section 2: Export;Section 3: Statistics;Section 4: Human Resources;Section 5: Projections.
Project results are prepared in the form of the report that contains qualitative and comparative analysis of recent IT industry trends in 2016 between five Western Balkan countries by presenting their state-of-art in the field of ICT and export as well as by providing key recommendations for its further development.
PROJECT METHODOLOGY
8
“ICT plays a crucial role in boosting innovation, creativity and competitiveness of all industry and service sectors. We are entering a new phase of development that will drive growth and sustainable development for the coming decades. ICT also acts as a impeller of social development and transformation through improvement of access to basic services, enhancement of connectivity, and creation of employment opportunities. In these ways ICTs affect how people live, communicate, interact, and engage among themselves and with their governments.”
ICT market in Kosovo, albeit smaller than that of the countries in the region, has been reported to register continuous growth which is higher than that in the surrounding countries. ICT businesses expect to grow mostly locally, in areas such as Internet Service Providing, Software development /programming, maintenance and repair, vendor sales, engineering services, training/certification, information services and web development.
But, for any significant growth to happen, a number of conditions must be met, the most pressing being the creation of a favorable business climate for ICT by bringing tax and customs fees in par with that of the neighboring countries, and establishing other incentive schemes for ICT. A targeted policy intervention and investment could produce big impact both to the Kosovo ICT industry and to non-ICT businesses.
Most of the Kosovo ICT companies (88%) are r domestic, 2% have Kosovar majority ownership, 3% have equal ownership by Kosovar and foreign owners, and 8 % are foreign-owned companies. It is important to note than there are more ICT companies of mixed Kosovo-foreign ownership and whole foreign ownership than non-ICT companies which are almost entirely locally owned. Worth noting is also that the ICT sector is well organized, where over half of the ICT companies are members of an industry or professional association, while 80% of non-ICT companies are not.
Vast majority of ICT companies (87%) have their clients located in Kosovo, with a small number of businesses (13%) having clients located abroad (up from 3.3% in 2010). The main industry currently targeted by most ICT companies in Kosovo is Telecommunications (66%), followed by Government, Police and Emergency Services (46%) and Financial sector (45%). Other targeted industries are retail, wholesale, professional, scientific and technical services, education and training, etc.
CHAPTER 1RECENT ICT TRENDS IN Kosovo
9
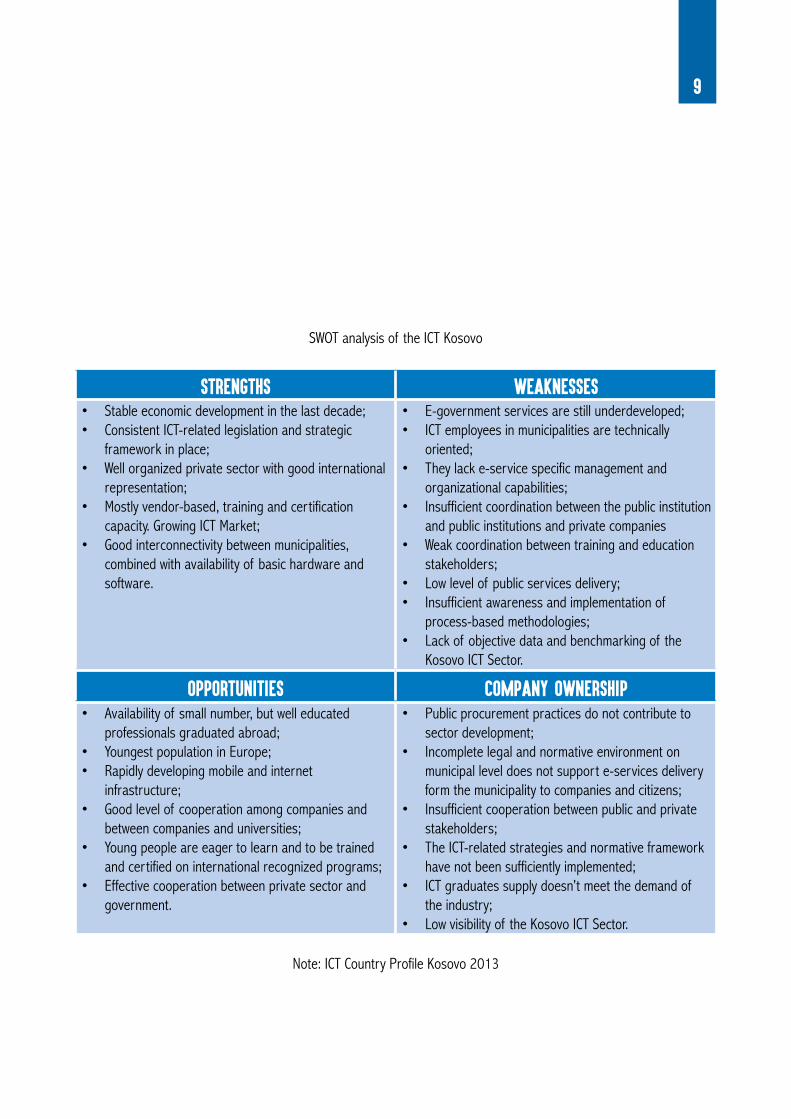
SWOT analysis of the ICT Kosovo
Strengths Weaknesses• Stable economic development in the last decade;• Consistent ICT-related legislation and strategic
framework in place;• Well organized private sector with good international
representation;• Mostly vendor-based, training and certification
capacity. Growing ICT Market;• Good interconnectivity between municipalities,
combined with availability of basic hardware and software.
• E-government services are still underdeveloped;• ICT employees in municipalities are technically
oriented;• They lack e-service specific management and
organizational capabilities;• Insufficient coordination between the public institution
and public institutions and private companies• Weak coordination between training and education
stakeholders;• Low level of public services delivery;• Insufficient awareness and implementation of
process-based methodologies;• Lack of objective data and benchmarking of the
Kosovo ICT Sector.
Opportunities Company ownership• Availability of small number, but well educated
professionals graduated abroad;• Youngest population in Europe;• Rapidly developing mobile and internet
infrastructure;• Good level of cooperation among companies and
between companies and universities;• Young people are eager to learn and to be trained
and certified on international recognized programs;• Effective cooperation between private sector and
government.
• Public procurement practices do not contribute to sector development;
• Incomplete legal and normative environment on municipal level does not support e-services delivery form the municipality to companies and citizens;
• Insufficient cooperation between public and private stakeholders;
• The ICT-related strategies and normative framework have not been sufficiently implemented;
• ICT graduates supply doesn’t meet the demand of the industry;
• Low visibility of the Kosovo ICT Sector.
Note: ICT Country Profile Kosovo 2013

10
CHAPTER 2SEE ITIB 2015 COMPARATIVE ANALYSIS

11
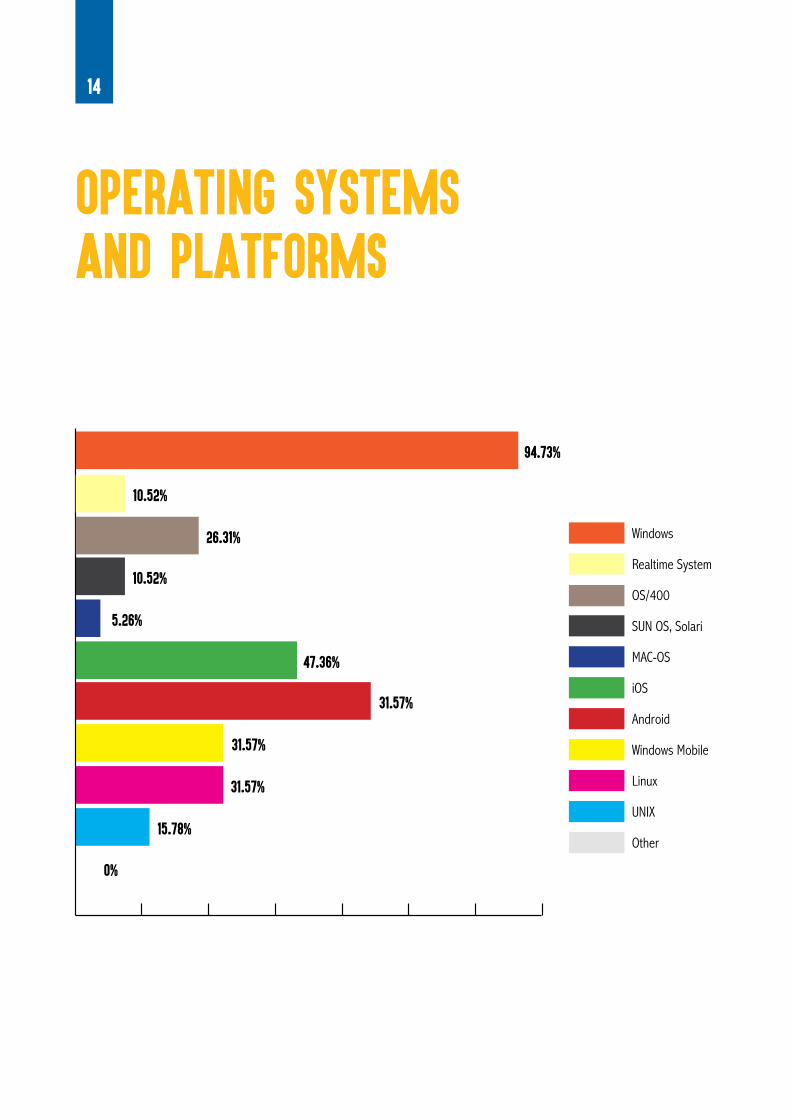
94.73% used Windows in 2016 which is for 14.73% increase comparing to 2015.
Operating Systems and Platforms
ICT companies from Kosovo are represented by newly established companies, because 58.8% is established within the period after 2010.
Year of foundation
In Kosovo 94.73% of ICT companies in 2016 are members of STIKK, which is significant improvement from 70% membership in 2015. While in 2015 there was one more association active in Kosovo, AITA (7.5%).
Memberships in ICT Associations
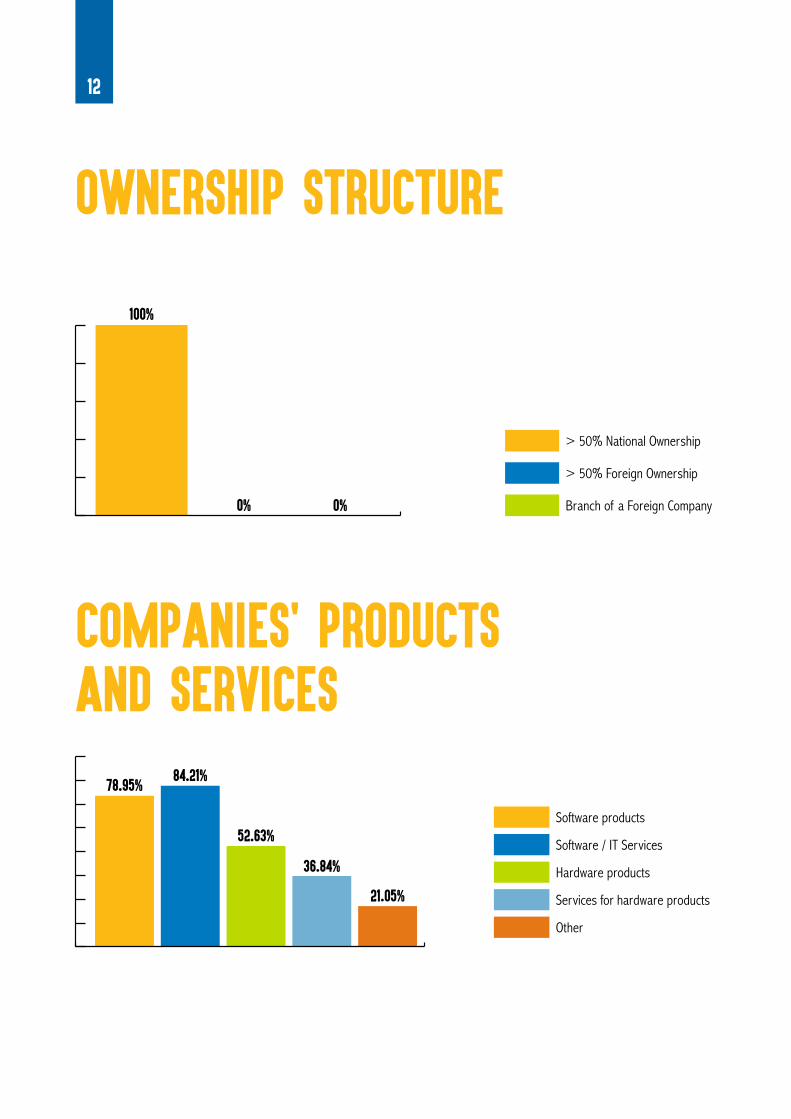
Majority (84.21%) of the companies are providing Software / IT services, which is for 16.71% higher compared to 2015.
Companies' products and services
100% of ICT companies have dominant domestic ownership.
Ownership structure2.1.General information about the companies
12
21.05%
36.84%
52.63%
84.21%78.95%
Other
Services for hardware products
Hardware products
Software / IT Services
Software products
COMPANIES' PRODUCTS AND SERVICES
100%
0% 0%
> 50% National Ownership
> 50% Foreign Ownership
Branch of a Foreign Company
OWNERSHIP STRUCTURE

13
YEAR OF FOUNDATION
After 2010
From 2000 to 2010
From 1990 to 2000
27.8%27.8%
44.%
OTHER
5.27%Kosovo ICT Association (STIKK)
94.73%
MEMBERSHIPS IN ICT ASSOCIATIONS
14
94.73%
26.31%
10.52%
10.52%
5.26%
47.36%
31.57%
31.57%
31.57%
15.78%
Windows
Realtime System
OS/400
SUN OS, Solari
MAC-OS
iOS
Android
Windows Mobile
Linux
UNIX
OPERATING SYSTEMS AND PLATFORMS
0%
Other
15
No. Programming Languages and Development Tools Percentage1 ABAP42 Assembler3 Visual Basic, VBA etc.4 Basic - Visual Basic, VBA etc. 31.585 Basic - C 15.796 Basic - C++ 26.327 Basic - Clipper8 CL/400 - AS/400 Control Language9 Delphi 5.26
10 Cobol11 dBase12 Fortran13 Foxpro14 ESQL/C15 HTML, XML 63.1616 Java, JavaScript 52.6317 Lips18 JCL 5.2619 Macro Languages - others20 Lotus Notes Script 5.2621 .NET 57.8922 .Objective C 26.3223 Pascal24 Perl25 PHP 52.6326 PL/SQL 31.5827 PL/128 Powerbuilder29 Python 10.5330 SAS31 Script Languages - others 10.5332 Shell, K-Shell, Bourne-Shell 5.2633 Smalltalk34 Tcl/Tk35 Visual Objects 5.2636 4gl37 Other 10.52
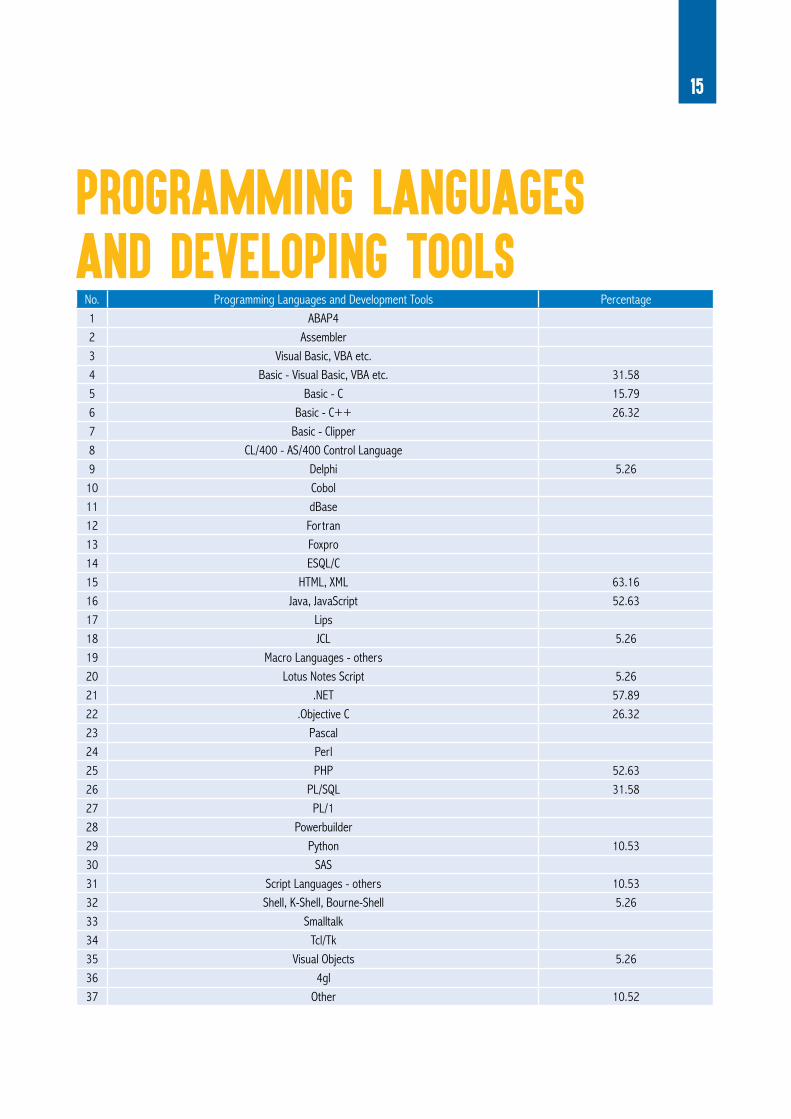
PROGRAMMING LANGUAGES AND DEVELOPING TOOLS
16
No. Database Technologies Percentage
1 Access 36.84
2 Adabas
3 BTrieve
4 DAO
5 DB2
6 DB/400
7 IDMS
8 Informix
9 Interbase
10 ISAM
11 JDBC
12 Lotus Notes 5.26
13 MS SQL Server
14 mSQL / mySQL
15 Object Store
16 ODBC 10.52
17 Oracle 26.31
18 Paradox 5.26
19 Progress
20 RDB
21 SAS
22 SQL 57.89
23 VSAM
24 xBase - dBase, FoxPro, Clipper
25 Sybase
26 Base - dBase, FoxPro, Clipper
27 Other
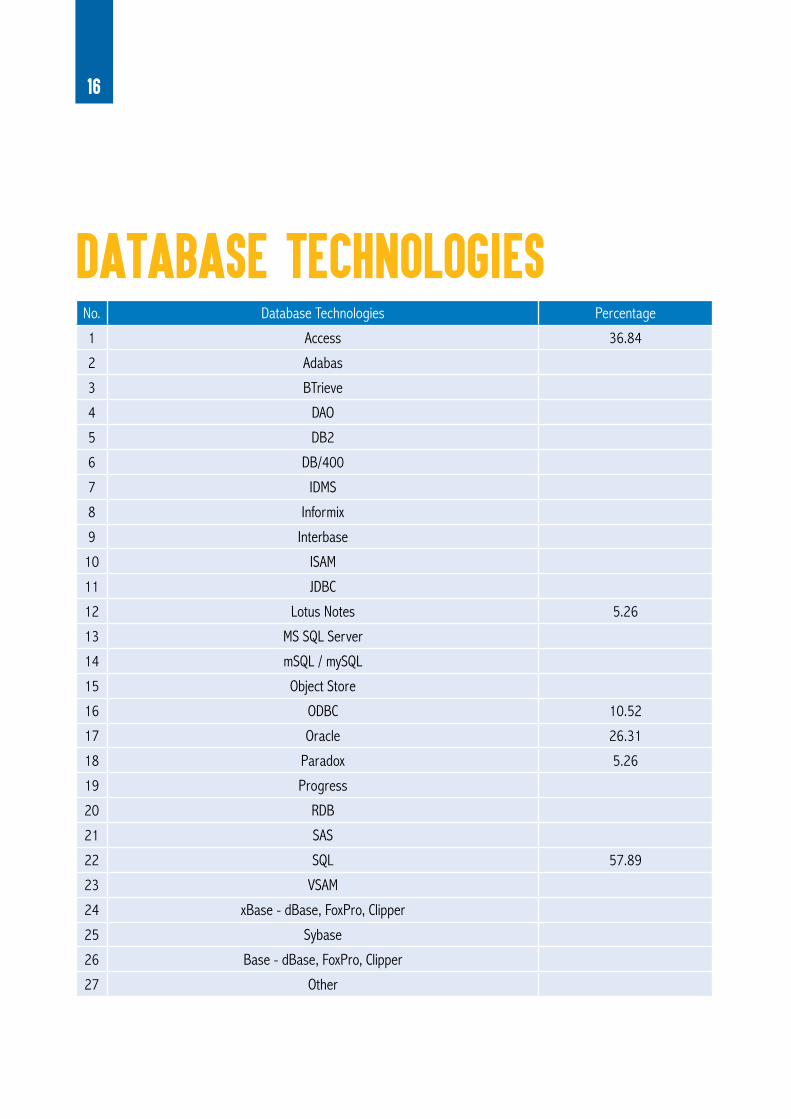
DATABASE TECHNOLOGIES
17
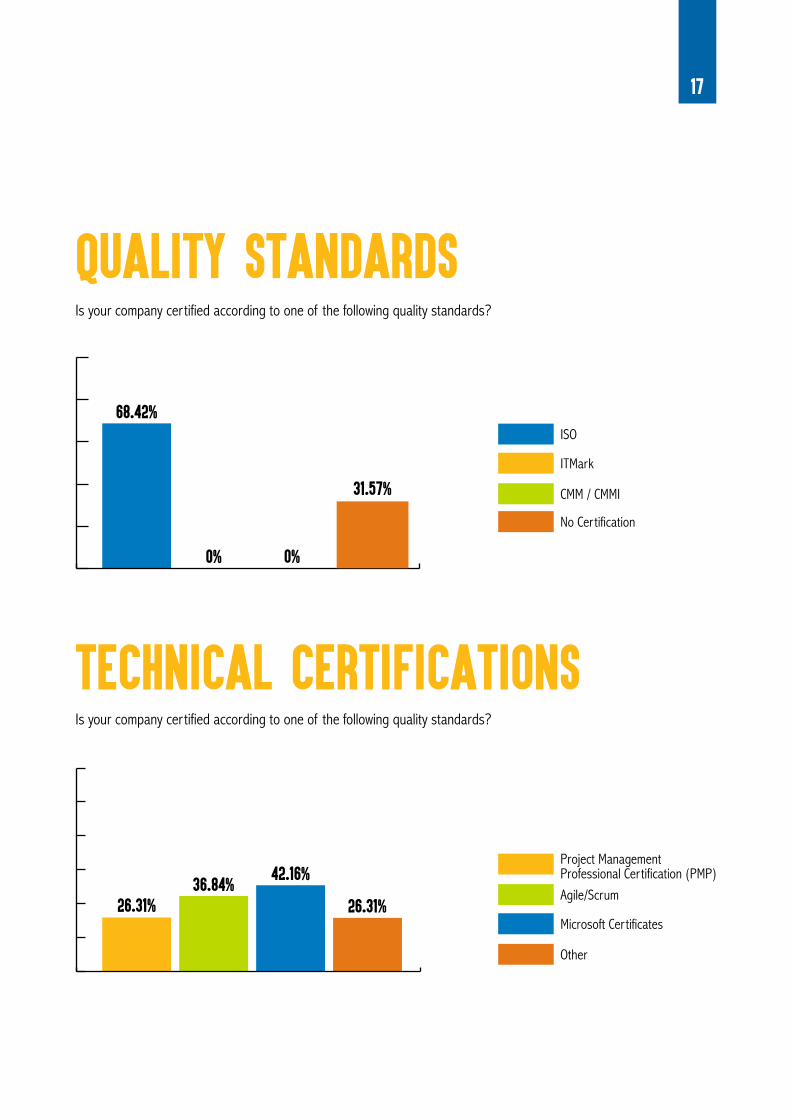
26.31%
42.16%36.84%
26.31%
Other
Microsoft Certificates
Agile/Scrum
Project Management Professional Certification (PMP)
Is your company certified according to one of the following quality standards?
TECHNICAL CERTIFICATIONS
31.57%
0%0%
68.42%
No Certification
CMM / CMMI
ITMark
ISO
Is your company certified according to one of the following quality standards?
QUALITY STANDARDS
18
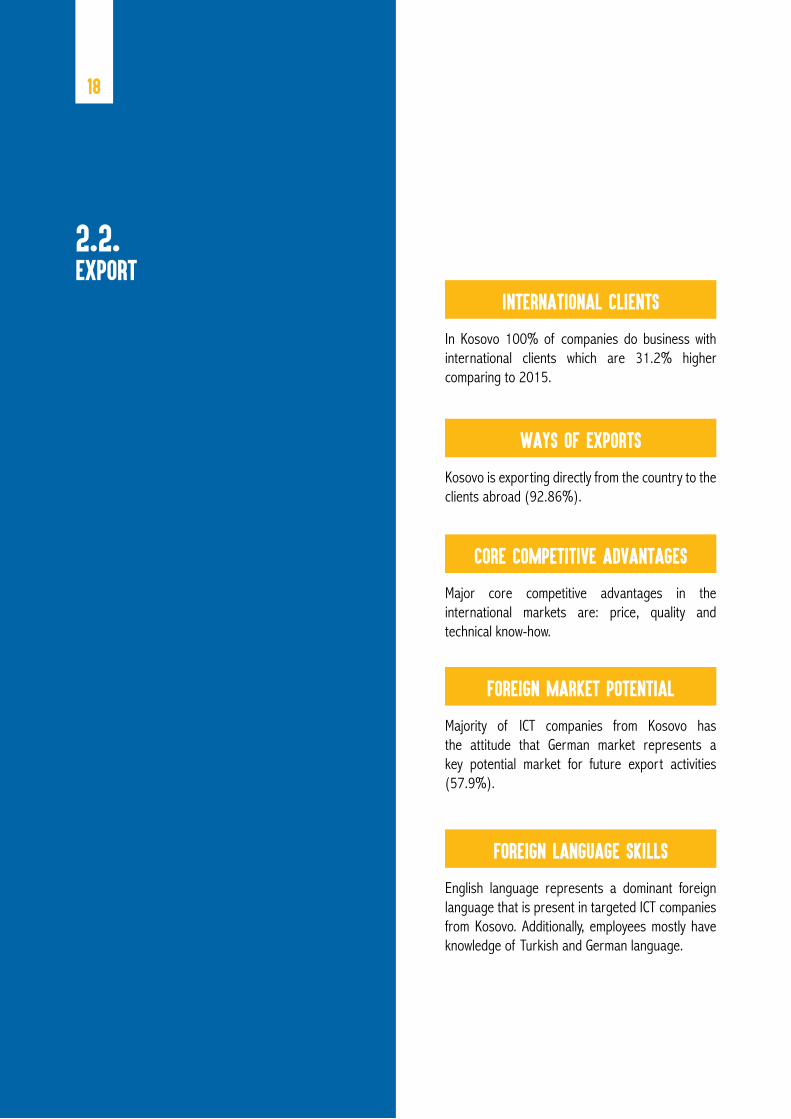
English language represents a dominant foreign language that is present in targeted ICT companies from Kosovo. Additionally, employees mostly have knowledge of Turkish and German language.
Foreign language skills
Majority of ICT companies from Kosovo has the attitude that German market represents a key potential market for future export activities (57.9%).
Foreign market potential
Major core competitive advantages in the international markets are: price, quality and technical know-how.
Core competitive advantages
Kosovo is exporting directly from the country to the clients abroad (92.86%).
Ways of Exports
In Kosovo 100% of companies do business with international clients which are 31.2% higher comparing to 2015.
International Clients
2.2.Export

19
22.2%
77.8%
Does your company conduct export activities?
EXPORT ACTIVITIES
0%
100%
No
No
Yes
Yes
Does your company work for international clients in your country?
INTERNATIONAL CLIENTS
20
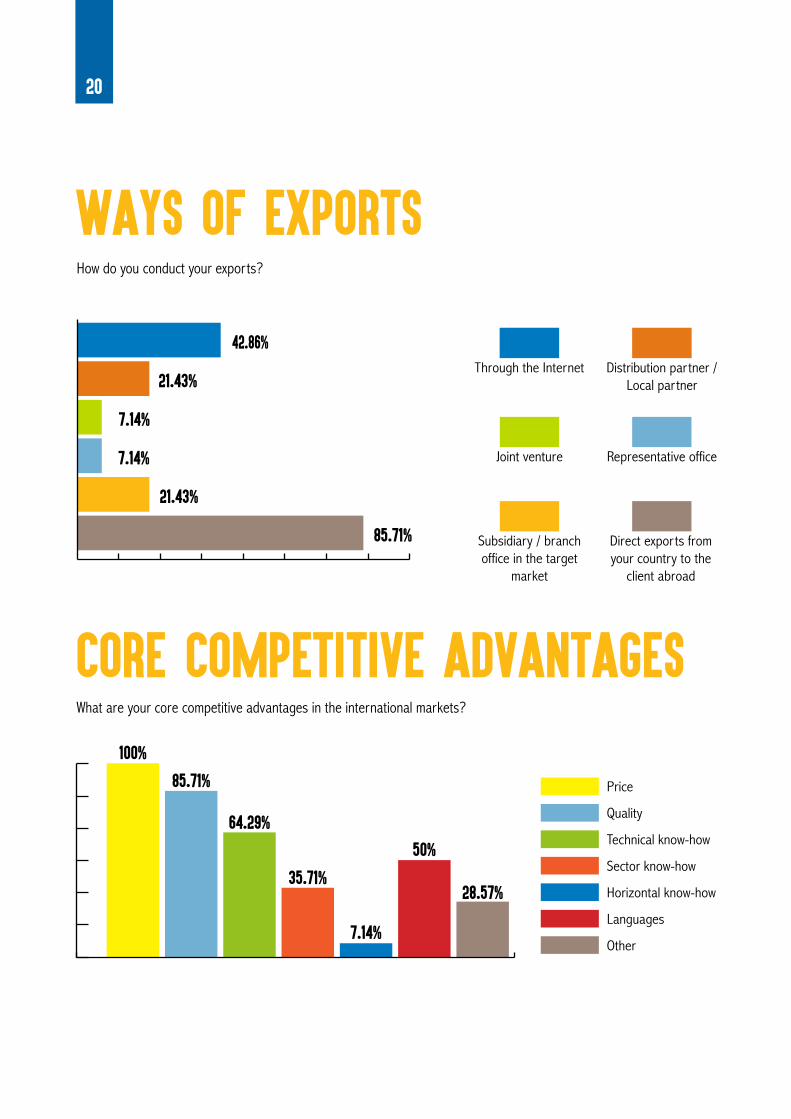
100%
85.71%
64.29%
35.71%
7.14%
50%
28.57%
Quality
Technical know-how
Sector know-how
Horizontal know-how
Languages
Other
Price
What are your core competitive advantages in the international markets?
CORE COMPETITIVE ADVANTAGES
42.86%
21.43%
7.14%
7.14%
21.43%
85.71% Direct exports from your country to the
client abroad
Subsidiary / branch office in the target
market
Representative officeJoint venture
Distribution partner / Local partner
Through the Internet
How do you conduct your exports?
WAYS OF EXPORTS
21
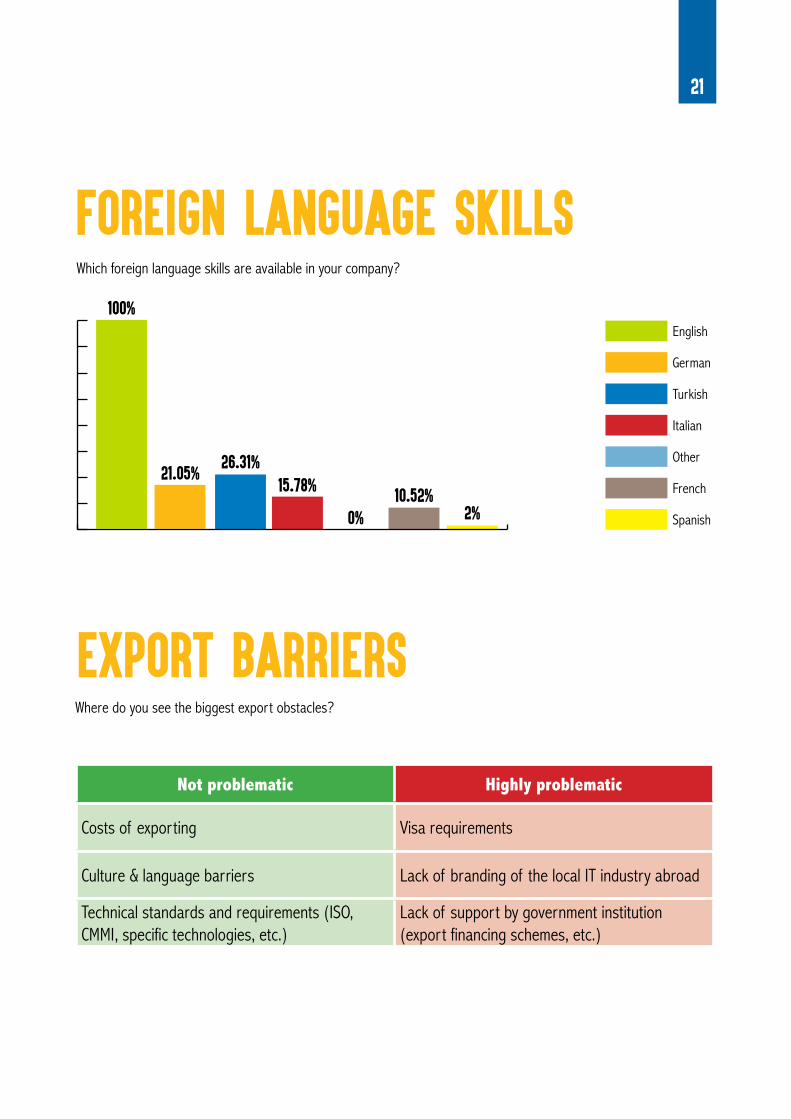
Not problematic Highly problematic
Costs of exporting Visa requirements
Culture & language barriers Lack of branding of the local IT industry abroad
Technical standards and requirements (ISO, CMMI, specific technologies, etc.)
Lack of support by government institution (export financing schemes, etc.)
EXPORT BARRIERS
100%
21.05%26.31%
15.78%
0%10.52%
2% Spanish
French
Other
Italian
Turkish
German
English
Which foreign language skills are available in your company?
FOREIGN LANGUAGE SKILLS
Where do you see the biggest export obstacles?
22
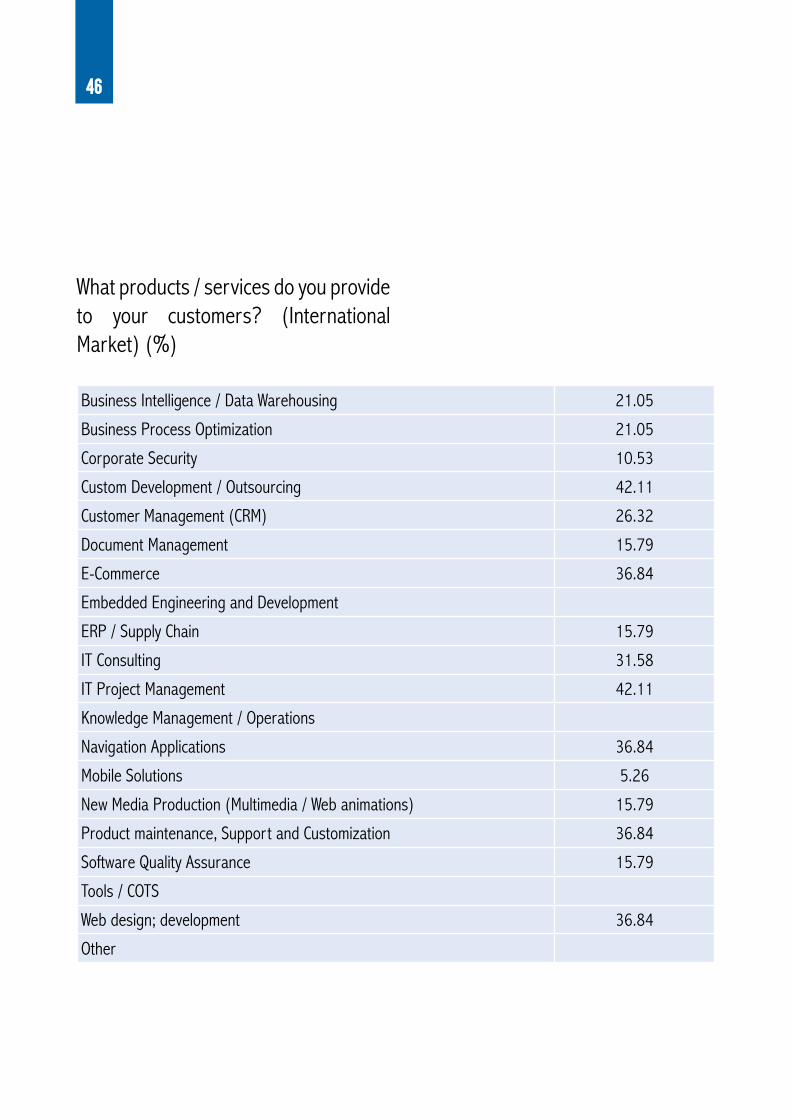
ICT companies from Kosovo are mostly providing following services to their international clients: Custom Development / Outsourcing (42.11%) as well as IT Project Management (42.11%).(ANNEX 3)
Products/Services for theInternational Clients
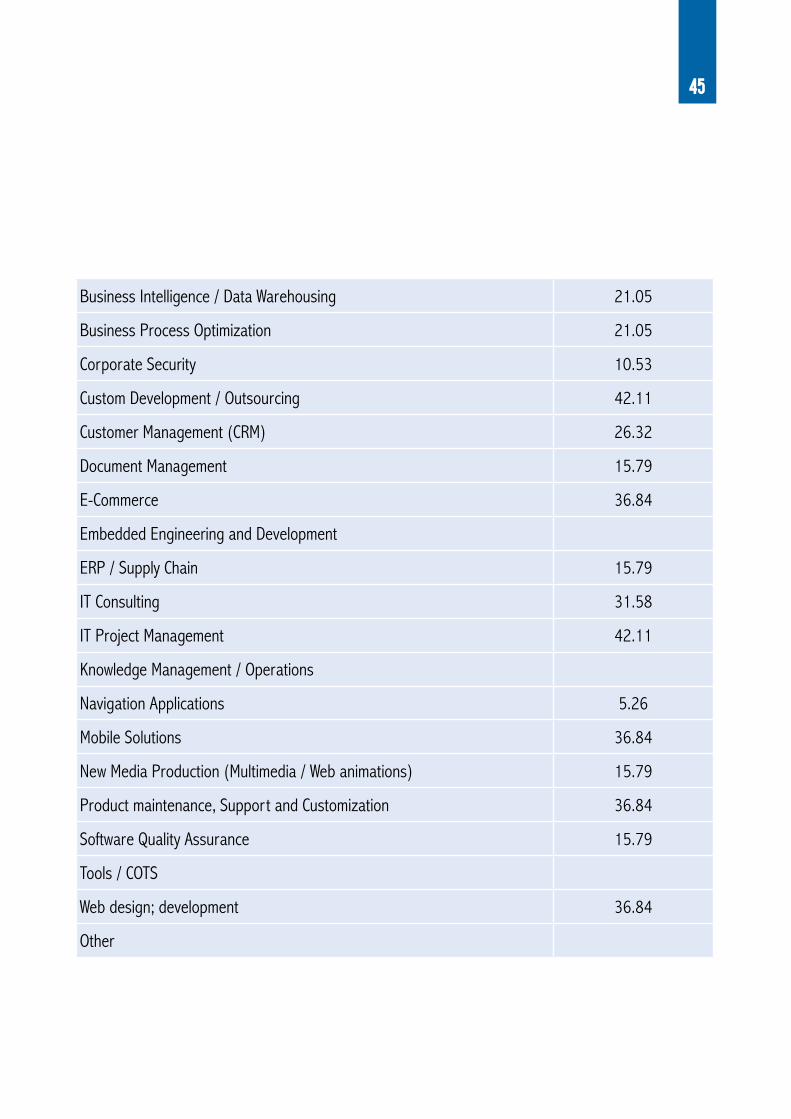
The majority of ICT companies are providing Custom Development / Outsourcing (62.11%), IT Project Management (42.11%). (ANNEX 3)
Products/Services for the Domestic Clients
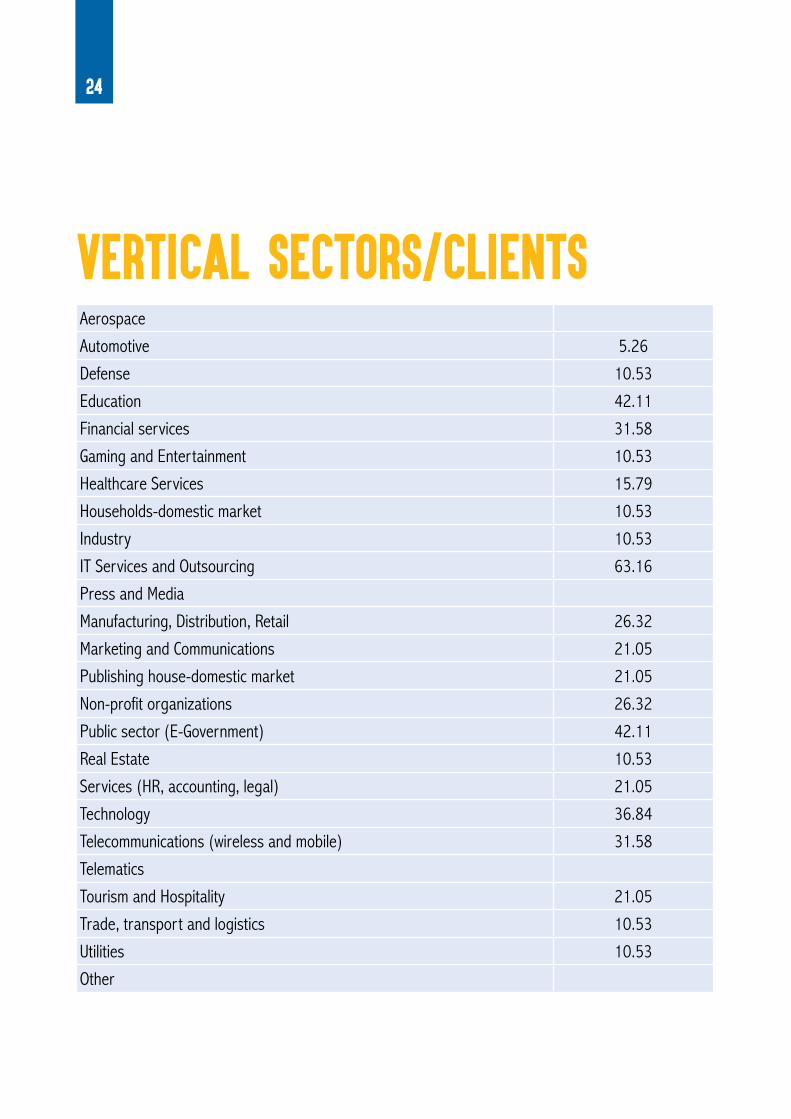
ICT companies from Kosovo have their main clients from the sector of IT Services and Outsourcing (63.16%).
Vertical sectors/Clients
2.3.Statistics
23
60%
33.3%
0%6.7%
More than 10,000,000
From 5,000,000 to 10,000,000
From 1,000,000 to 5,000,000
Up to 1,000,000
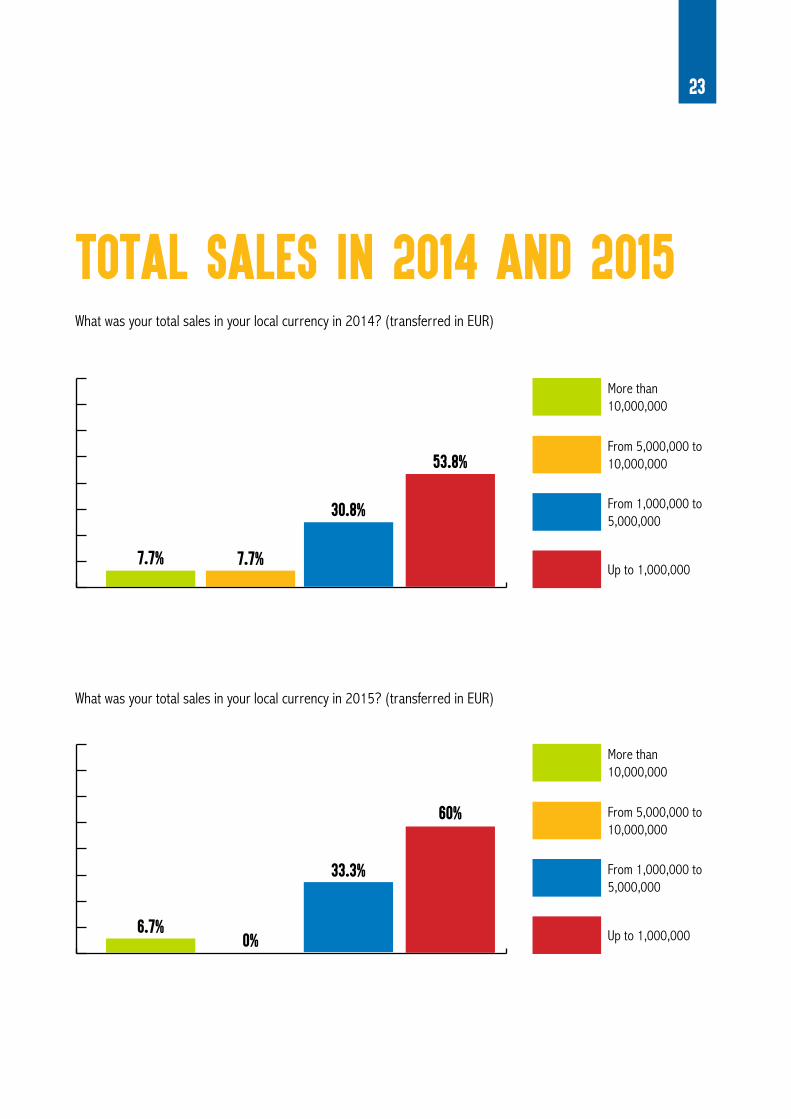
What was your total sales in your local currency in 2015? (transferred in EUR)
53.8%
30.8%
7.7%7.7%
More than 10,000,000
From 5,000,000 to 10,000,000
From 1,000,000 to 5,000,000
Up to 1,000,000
What was your total sales in your local currency in 2014? (transferred in EUR)
TOTAL SALES IN 2014 AND 2015
24
Aerospace
Automotive 5.26
Defense 10.53
Education 42.11
Financial services 31.58
Gaming and Entertainment 10.53
Healthcare Services 15.79
Households-domestic market 10.53
Industry 10.53
IT Services and Outsourcing 63.16
Press and Media
Manufacturing, Distribution, Retail 26.32
Marketing and Communications 21.05
Publishing house-domestic market 21.05
Non-profit organizations 26.32
Public sector (E-Government) 42.11
Real Estate 10.53
Services (HR, accounting, legal) 21.05
Technology 36.84
Telecommunications (wireless and mobile) 31.58
Telematics
Tourism and Hospitality 21.05
Trade, transport and logistics 10.53
Utilities 10.53
Other
VERTICAL SECTORS/CLIENTS

26
Comparing average monthly salaries for different positions in ICT sector, System Administrators have had the highest average, while Graphic Designers have had the lowest.
Average monthly salaries in 2014 and 2015
Number of employees who left the companies on the annual basis is 25%.
Employees who left companies
In 2014, the majority of Kosovo ICT companies had more than 20 employees and associates, 36.4%. Whereas, 31.8% of ICT companies with less than 5 employees and associates.
Employees and associates for 2014 and 2015
2.4.Human resources

27
10.5%15%
47.4%
26.3%
More than 20
From 10 to 20
From 5 to 10
Up to 5
What is the total number of your employees and associates-2015?
31.8%
18.2%
36.4%
13.6%
More than 20
From 10 to 20
From 5 to 10
Up to 5
What is the total number of your employees and associates-2014?
EMPLOYEES AND ASSOCIATES2014 AND 2015

28
28.6%
71.4%
0%
More than 25%
10-25%
Up to 10%
Specify the number of employees who leave the company on an annual basis 2015
0%
100%
0%
More than 25%
10-25%
Up to 10%
Specify the number of employees who leave the company on an annual basis 2016
EMPLOYEES WHO LEFT COMPANIES

29
22.2%
77.8%
0%
More than 6 months
3-6 months
Up to 3 months
What is the average length of time required for a change of employees who leave the company 2015?
0%
100%
0%
More than 6 months
3-6 months
Up to 3 months
What is the average length of time required for a change of employees who leave the company 2016?

30
533.57
762.86
907.14
950
778.57
781.25
614.29
829.17 Developers
Graphic Designers
Database Administrators
System Administrator
Business Developer Management
Project Managers
Marketing / Sales
Administration
Average monthly salary in 2015 (eur)
AVERAGE MONTHLY SALARIES IN 2014 AND 2015
750 Other

31
760.7
708.3
864.3
623.1
645.5
Average monthly salary in 2014 (eur)
660.71
Developers
Graphic Designers
Database Administrators
System Administrator
Business Developer Management
Project Managers
Marketing / Sales
Administration
1,396
666.7
32
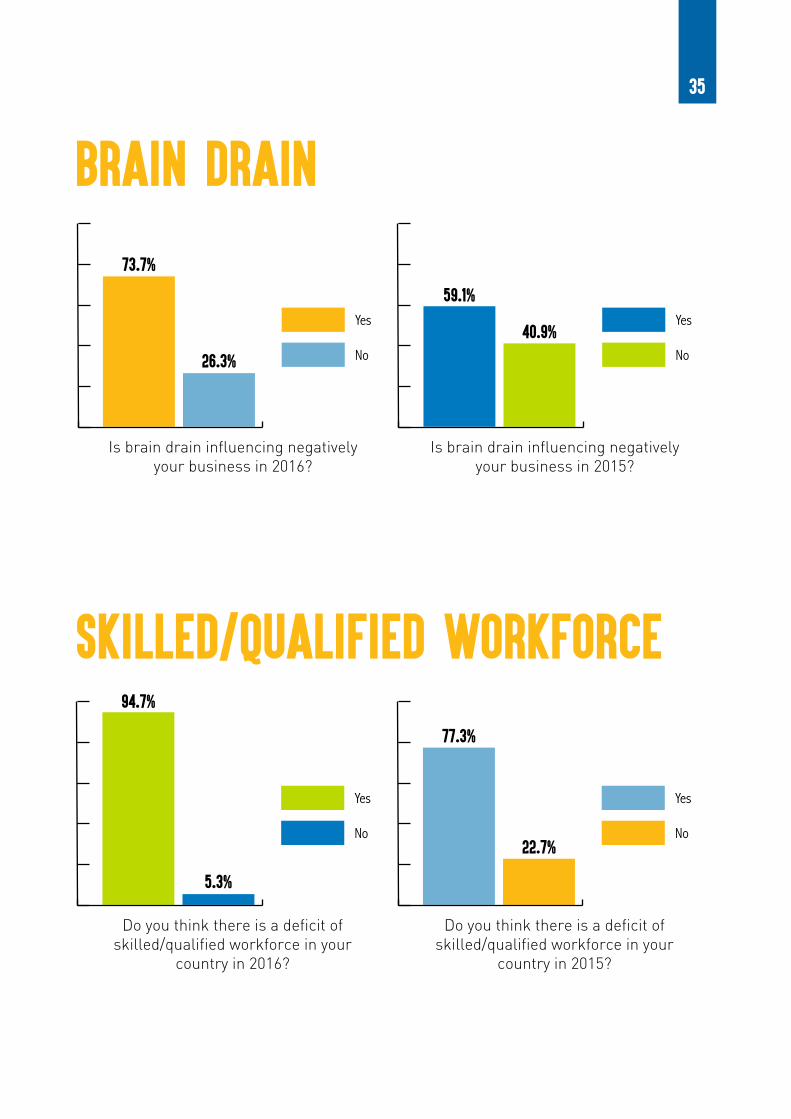
73.7% of ICT companies think that brain drain has negative influence on their business activities.
Brain drain
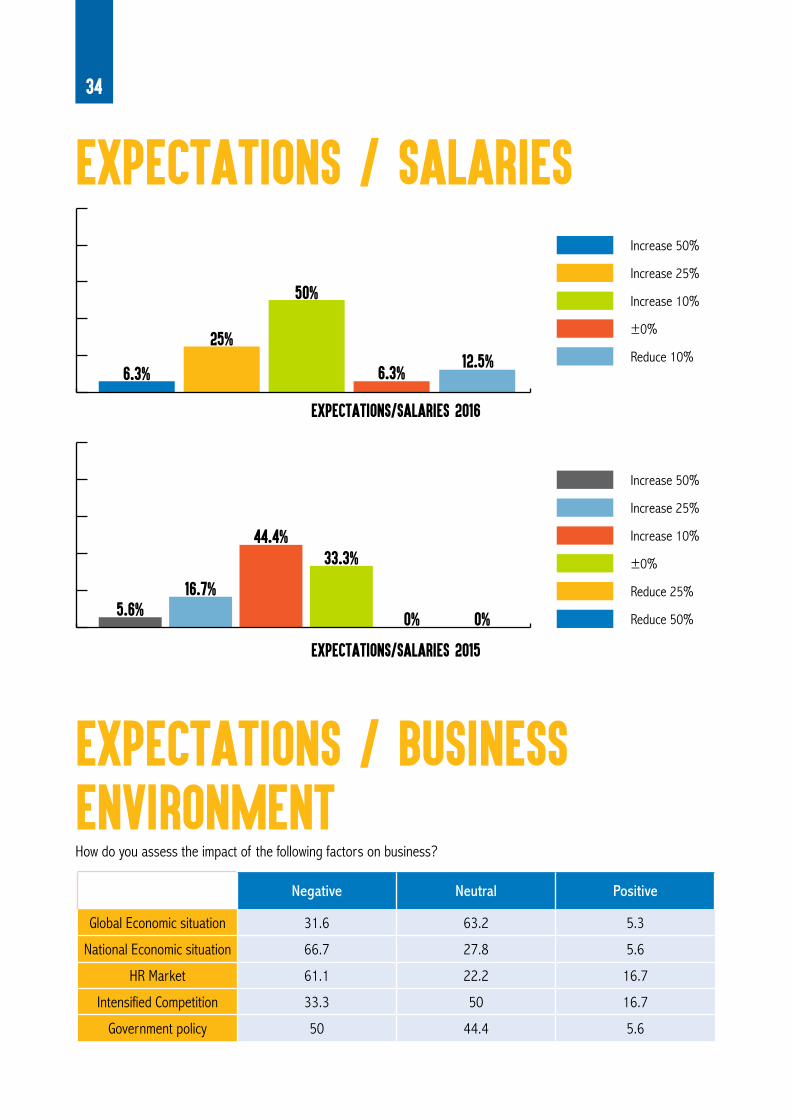
66.7% of ICT companies consider national economic situation as major negative impact on business.
Expectations/Business environment
50% of ICT companies expect salaries to increase for 10% in future period.
Expectations/Salaries
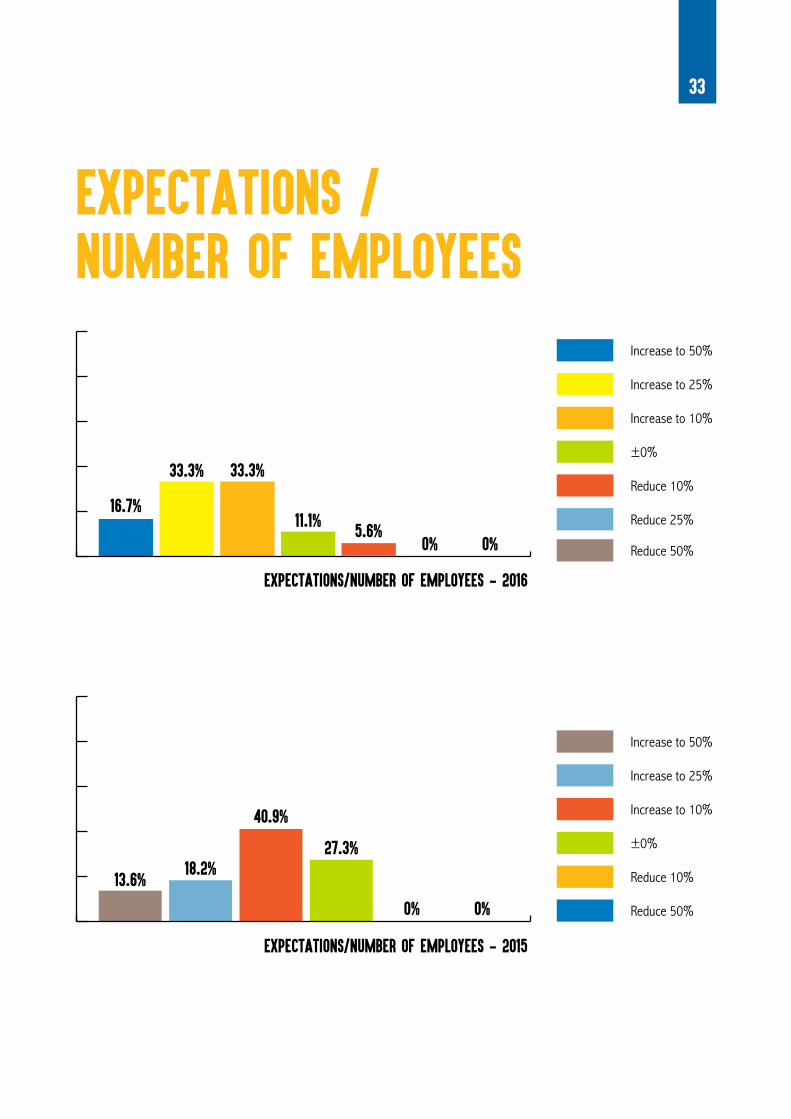
ICT companies from Kosovo expect an increase of up to 10-25% of their employee number.
Expectations/Number of employees
2.5.Forecasts
94.7% of Kosovo ICT companies believe that the lack of skilled/qualified workforce is a key barrier for the business operations.
Skilled/qualified workforce
33
5.6%0% 0%
11.1%
33.3%33.3%
16.7%
Increase to 50%
Increase to 25%
Increase to 10%
±0%
Reduce 10%
Reduce 25%
EXPECTATIONS / NUMBER OF EMPLOYEES
0%0%
27.3%
40.9%
18.2%13.6%
Increase to 50%
Increase to 25%
Increase to 10%
±0%
Reduce 10%
Reduce 50%
Expectations/Number of employees - 2016
Expectations/Number of employees - 2015
Reduce 50%
34
Negative Neutral Positive
Global Economic situation 31.6 63.2 5.3
National Economic situation 66.7 27.8 5.6
HR Market 61.1 22.2 16.7
Intensified Competition 33.3 50 16.7
Government policy 50 44.4 5.6
EXPECTATIONS / BUSINESS ENVIRONMENTHow do you assess the impact of the following factors on business?
12.5%6.3%
50%
25%
6.3%
Increase 50%
Increase 25%
Increase 10%
±0%
Reduce 10%
EXPECTATIONS / SALARIES
0%0%
33.3%44.4%
16.7%5.6%
Increase 50%
Increase 25%
Increase 10%
±0%
Reduce 25%
Reduce 50%
Expectations/Salaries 2016
Expectations/Salaries 2015
35
26.3%
73.7%
No
Yes
BRAIN DRAIN
Is brain drain influencing negatively your business in 2016?
40.9%
59.1%
No
Yes
Is brain drain influencing negatively your business in 2015?
SKILLED/QUALIFIED WORKFORCE
5.3%
94.7%
No
Yes
Do you think there is a deficit of skilled/qualified workforce in your
country in 2016?
22.7%
77.3%
No
Yes
Do you think there is a deficit of skilled/qualified workforce in your
country in 2015?
36
“South East Europe IT industry barometer” main goals are to support the export capacity of ICT companies in South East Europe. Project aims to collect basic information on ICT companies in the Western Balkan region and to provide an insight into the value of the national ICT markets as well as their competitiveness.
Comparative analysis is done following trends through the years and based on:
• General information about companies;• Export data and trends;• Statistics considering sales and clients;• Human Resources – the number of employees,
and the company structure;• Projections – plans of expansion, pro and
cons of the current market, and influence of those on projected plans.
CONCLUSIONS
37
Analysis has shown that companies in all targeted countries have similar trends of development, products, projections, and general structure. Most used operating system is Windows, but with growing importance of IOS in Kosovo. There are persistent trends in programming languages used (Java/JavaScript and HTML/XML) and database technologies (MSSQL, mSQL/MySQL and SQL).
At the same time, when analyzing data about export and trends in that area it can be seen some differences. Even if almost all companies in Kosovo have clients from abroad, they cooperate with those within their countries not by exporting products. Export is mainly done through direct contact with client abroad, but in the last year there is growth of export done through the internet.
Regional analysis shows few different trends considering domestic clients of companies in targeted countries. Through the years, most dominant clients in Serbia and Kosovo were from sector of IT services and outsourcing, while in Albania they come from sector of education. In Macedonia and Montenegro there are changing, and divided trends. Very important aspect for export and strengthening export capacity are core competitive advantages of companies, or to be precise what are things that can give them additional recognition on international market. Companies from targeted countries on average they considered those are price, quality and technical know-how. Additionally, there is trend that as the country becomes more active in terms of export, it put more emphasize on quality of service (technical know-how) as its strongest point.
Major issues for companies to overcome are barriers for their business, including export barriers. For ICT companies in targeted countries most important barriers for building their export capacities, through the years were: lack of branding of the local IT industry abroad, lack of business contacts in target markets, as well as lack of market information. But there are also some more basic barriers: visa requirements or culture and language barriers or even costs of exporting and experienced staff to conduct that kind of activities. All these are problems that have not been solved yet, and that need to be faced in the near future, so that these companies can use full potential of one of the most profitable industries.Looking into the plans and projections of ICT companies in targeted countries shows that they have growth plans, and that they are seriously looking into their strengths and weaknesses. They all recognize “brain drain” as one of most important problems for additional development and major negative impact on their business, and what it is worrisome that this is seen as growing problem for them. It is very important for “brain drain” to be faced not only on local but on state level, and to develop efficient policies to at least lower it.
Positive trend that analysis has shown, and this was growing through the years, is that within their expansion plans companies project additional employment of IT experts as well as raise of salaries for those employees. Also, there is very strong trend of growth of revenues for ICT companies in almost all the targeted countries. This additionally confirms underlying potential of ICT industry and growing demand for its services, which can significantly influence employment levels, but at the same time they see national economic situation as important setback for their development.
Finally, analysis has shown that ICT companies are very ambitious and they have expansion plans, but there is still highly unused export potential. They have growing focus on different foreign markets, but still most of their business is done by cooperation with international clients within domestic market not by exporting their services and products. Considering export, and promotion of export, they are faced with significant barriers which should be targeted on the country level by specific strategies and special policies.

38
How would you evaluate the potential of the following markets for your company’s export activities? (%)
ANNEX 1

39
No potential
Very lowpotential
Lowpotential
PotentialHigh
potentialVery highpotential
Germany 15.8 5.3 21.1 26.3 31.6
Austria 16.7 5.6 5.6 27.8 16.7 27.8
Switzerland 21.1 5.3 26.3 15.8 31.6
United Kingdom 15.8 10.5 26.3 26.3 21.1
France 23.5 5.9 17.6 23.5 23.5 5.9
BeNeLux (Belgium, The Netherlands, Luxemburg)
22.2 5.6 16.7 27.8 16.7 11.1
Scandinavian countries 22.2 5.6 11.1 27.8 5.6 27.8
Southern Europe (Italy, Spain, Portugal)
22.2 11.1 33.3 16.7 11.1 5.6
Regional (Albania, Bosnia and Herzegovina, Bulgaria, Croatia, Greece, Montenegro, Romania, Serbia, Slovenia)
10.5 15.8 26.3 31.6 15.8
Central and Eastern Europe 23.5 17.6 17.6 17.6 11.8 11.8
North America (USA, Canada) 33.3 5.6 5.6 5.6 11.1 38.9
Middle East and Africa 50 16.7 11.1 5.6 5.6 11.1
East Asia 66.7 11.1 5.6 5.6 11.1

40
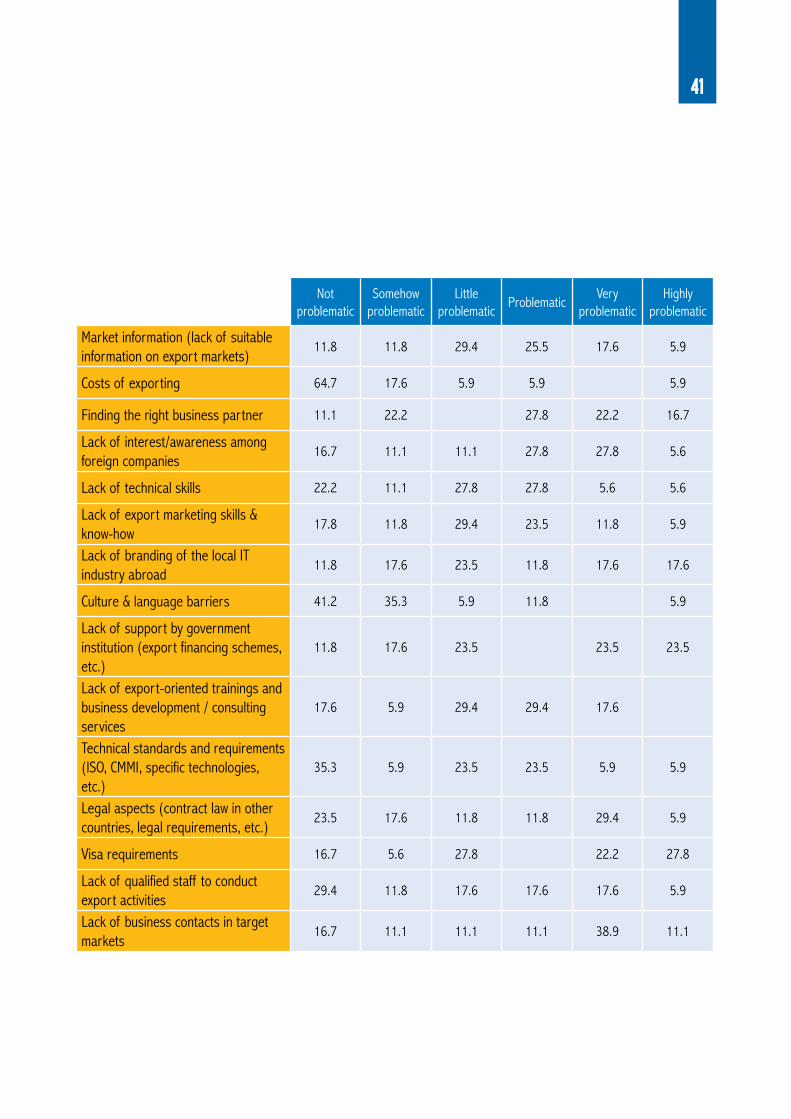
Where do you see the biggest export obstacles? (%)
ANNEX 2
41
Not problematic
Somehow problematic
Little problematic
ProblematicVery
problematicHighly
problematic
Market information (lack of suitable information on export markets)
11.8 11.8 29.4 25.5 17.6 5.9
Costs of exporting 64.7 17.6 5.9 5.9 5.9
Finding the right business partner 11.1 22.2 27.8 22.2 16.7
Lack of interest/awareness among foreign companies
16.7 11.1 11.1 27.8 27.8 5.6
Lack of technical skills 22.2 11.1 27.8 27.8 5.6 5.6
Lack of export marketing skills & know-how
17.8 11.8 29.4 23.5 11.8 5.9
Lack of branding of the local IT industry abroad
11.8 17.6 23.5 11.8 17.6 17.6
Culture & language barriers 41.2 35.3 5.9 11.8 5.9
Lack of support by government institution (export financing schemes, etc.)
11.8 17.6 23.5 23.5 23.5
Lack of export-oriented trainings and business development / consulting services
17.6 5.9 29.4 29.4 17.6
Technical standards and requirements (ISO, CMMI, specific technologies, etc.)
35.3 5.9 23.5 23.5 5.9 5.9
Legal aspects (contract law in other countries, legal requirements, etc.)
23.5 17.6 11.8 11.8 29.4 5.9
Visa requirements 16.7 5.6 27.8 22.2 27.8
Lack of qualified staff to conduct export activities
29.4 11.8 17.6 17.6 17.6 5.9
Lack of business contacts in target markets
16.7 11.1 11.1 11.1 38.9 11.1
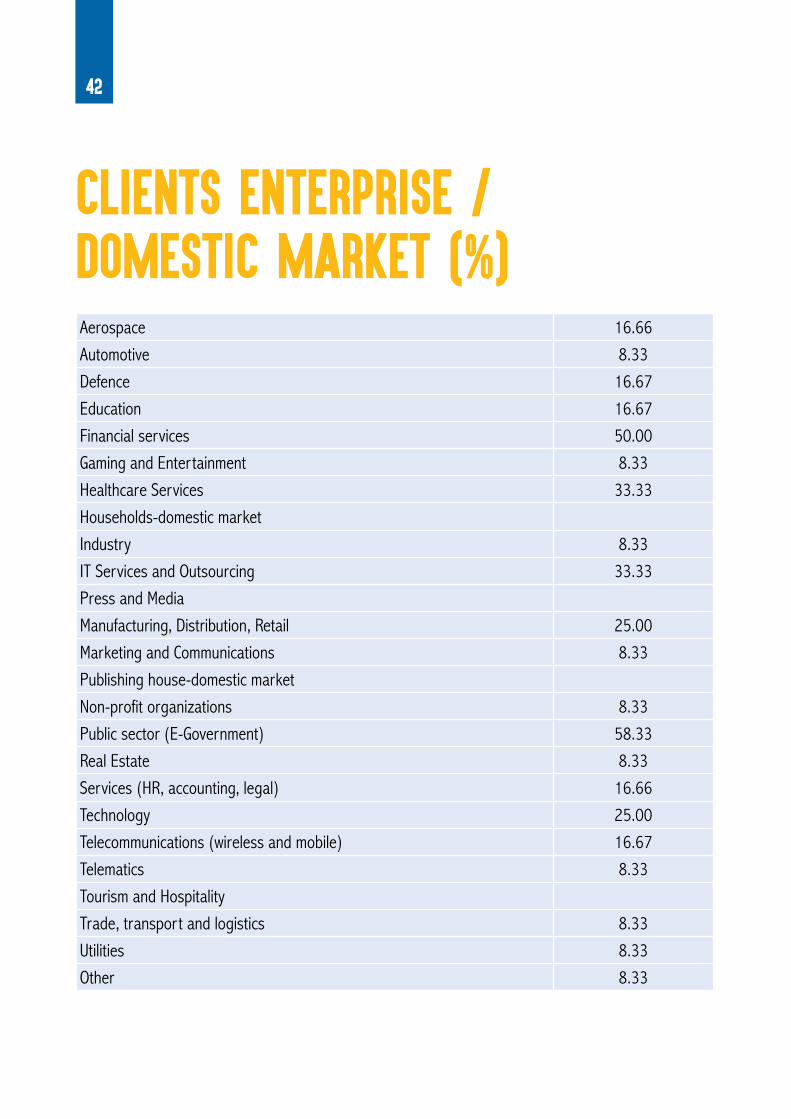
42
Aerospace 16.66
Automotive 8.33
Defence 16.67
Education 16.67
Financial services 50.00
Gaming and Entertainment 8.33
Healthcare Services 33.33
Households-domestic market
Industry 8.33
IT Services and Outsourcing 33.33
Press and Media
Manufacturing, Distribution, Retail 25.00
Marketing and Communications 8.33
Publishing house-domestic market
Non-profit organizations 8.33
Public sector (E-Government) 58.33
Real Estate 8.33
Services (HR, accounting, legal) 16.66
Technology 25.00
Telecommunications (wireless and mobile) 16.67
Telematics 8.33
Tourism and Hospitality
Trade, transport and logistics 8.33
Utilities 8.33
Other 8.33
CLIENTS ENTERPRISE / DOMESTIC MARKET (%)
43
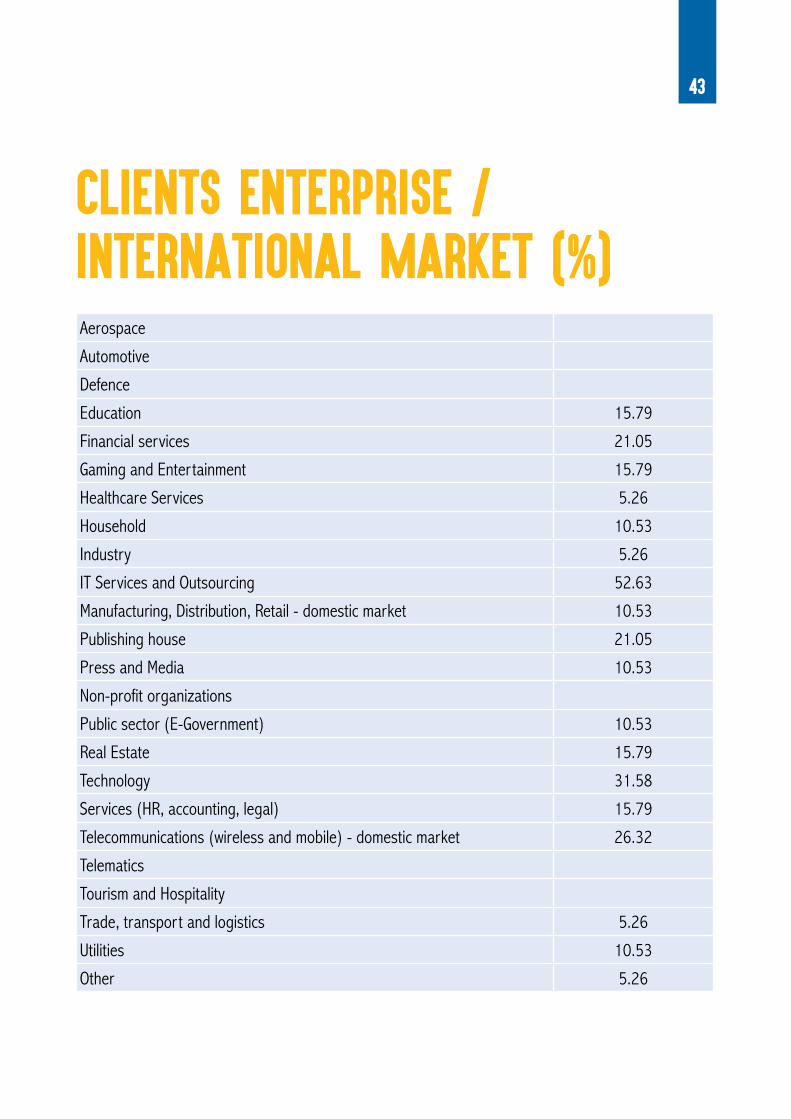
Aerospace
Automotive
Defence
Education 15.79
Financial services 21.05
Gaming and Entertainment 15.79
Healthcare Services 5.26
Household 10.53
Industry 5.26
IT Services and Outsourcing 52.63
Manufacturing, Distribution, Retail - domestic market 10.53
Publishing house 21.05
Press and Media 10.53
Non-profit organizations
Public sector (E-Government) 10.53
Real Estate 15.79
Technology 31.58
Services (HR, accounting, legal) 15.79
Telecommunications (wireless and mobile) - domestic market 26.32
Telematics
Tourism and Hospitality
Trade, transport and logistics 5.26
Utilities 10.53
Other 5.26
CLIENTS ENTERPRISE / INTERNATIONAL MARKET (%)
44
What products / services do you provide to your customers? (Domestic Market) (%)
ANNEX 3
45
Business Intelligence / Data Warehousing 21.05
Business Process Optimization 21.05
Corporate Security 10.53
Custom Development / Outsourcing 42.11
Customer Management (CRM) 26.32
Document Management 15.79
E-Commerce 36.84
Embedded Engineering and Development
ERP / Supply Chain 15.79
IT Consulting 31.58
IT Project Management 42.11
Knowledge Management / Operations
Navigation Applications 5.26
Mobile Solutions 36.84
New Media Production (Multimedia / Web animations) 15.79
Product maintenance, Support and Customization 36.84
Software Quality Assurance 15.79
Tools / COTS
Web design; development 36.84
Other
46
Business Intelligence / Data Warehousing 21.05
Business Process Optimization 21.05
Corporate Security 10.53
Custom Development / Outsourcing 42.11
Customer Management (CRM) 26.32
Document Management 15.79
E-Commerce 36.84
Embedded Engineering and Development
ERP / Supply Chain 15.79
IT Consulting 31.58
IT Project Management 42.11
Knowledge Management / Operations
Navigation Applications 36.84
Mobile Solutions 5.26
New Media Production (Multimedia / Web animations) 15.79
Product maintenance, Support and Customization 36.84
Software Quality Assurance 15.79
Tools / COTS
Web design; development 36.84
Other
What products / services do you provide to your customers? (International Market) (%)

47
1. Shaipi, K.: ICT in Kosovo – A sector decoded. STIKK, 2010.
2. US Department of State, 2011, Bureau of European and Eurasian Affairs, Background Note: Kosovo.
3. Fazliu, A, 2013: Internet Penetration and Usage in Kosovo. STIKK
4. World Economic Forum, 2015: Global Information Technology Report. Online.
5. ESI Center Eastern Europe, 2013, ICT country profile-Macedonia 2013, Regional competiveness initiative
6. Shaipi, K. 2012: Public Procurement for ICT in the period June 2009-June 2012 – Findings Report. STIKK
References

48
QuestionnaireANNEX 4
49
General Information
1. In which country is your company located? (If in many, which is the main location in the listed countries.)• Albania• Bosnia-Herzegovina• Kosovo• Macedonia• Montenegro• Serbia
2. Do you want to provide your company name and contact information?• Yes, I will provide company name and contact information.• No, I want to answer the questionnaire anonymously.
3. Company
Name
URL
4. Contact Person
Name
Function / Position
Direct Email
50
Type of company
Ownership
5. What is the ownership structure of the company?• > 50% national ownership• > 50% foreign ownership• Branch of a foreign company(If the company works only for the parent company or for other companies belonging to
the group)
Product / Services
6. What type of products and/or services your company provides?• Software products• Software / IT services• Hardware products• Services for hardware products• Other: ______________________________
ICT Association membership
7. Your company is a member of:• Albania: AITA• Bosnia-Herzegovina: BIT Alliance• Kosovo: STIKK• Macedonia: MASIT• Montenegro: IT Cluster• Serbia: ICT Network• No ICT association membership• Other(s): ______________________________
51
Technical Profile of the Company
9. Please provide us with information on your company’s technical expertise/offering concerning Operating Systems and Platforms, Programming Languages and Development Tools as well as Database Technologies.
a) Operating Systems and Platforms(Please tick the appropriate fields.)
• Windows• Realtime Systems• MAC-OS• OS/400• SUN OS, Solaris• iOS• Android• Windows Mobile• Linux• UNIX• Others:
• 1985• 1986• 1987• 1988• 1989• 1990• 1991• 1992
• 1993• 1994• 1995• 1996• 1997• 1998• 1999• 2000
• 2001• 2002• 2003• 2004• 2005• 2006• 2007• 2008
• 2009• 2010• 2011• 2012• 2013• 2014
Year of Foundation
8. Which was the year of foundation of the company in the country?
52
• ABAP4 • Assembler • Basic - Visual Basic, VBA
etc.• C • C++ • Clipper • CList • CL/400 - AS/400 Control
Language• Cobol • CORBA IDL • dBase • Delphi • Eiffel
• ESQL/C • Fortran • Foxpro • Gupta, Centura • HTML, XML• ILE/400 • Java, JavaScript • JCL • Lisp • Lotus Notes Script • Macro Languages–
others• Natural • .NET• Objective C
• Pascal • Perl • PHP • PL/SQL • PL/1 • Powerbuilder • Python • QMF• Rexx• RPG • SAS • Script Languages –
others • Shell - C-Shell,K-
Shell,Bourne-Shell
• Smalltalk • Tcl/Tk • Visual Objects • VRML • Xt, Motif • yacc/lex • 4gl• Other
• Access • Adabas • BTrieve • DAO • DB2 • DB/400 • DL/1 • Gupta, Centura • IDMS
• IMS • Informix • Ingres • Interbase • ISAM • JDBC • Lotus Notes • MS SQL Server • mSQL / mySQL
• Object Store • ODBC • Oracle • Paradox • POET • Progress • RDB • SAS • SESAM
• SQL • Sybase • UDS/IDMS • VSAM • xBase - dBase, FoxPro,
Clipper...• 4th Dimension• Other
b) Programming Languages and Development Tools (Please tick the appropriate fields.)
c) Database Technologies (Please tick the appropriate fields.)
53
d) Have you been asked to have one of the following quality standards? (multiple answers permitted)
• ISO 27001• ISO 20000• ISO9001• CMM / CMMI• ITMark• SPICE• Other(s):
e) Do your employees have some of the following technical certifications?
• Project management professional certification (PMP)• Agile/Scrum• Microsoft certificates• Other(s):
Export Related Questions
10. Does your company work for international clients in your country?• Yes• No
11. Does your company conduct export activities?• Yes• No
54
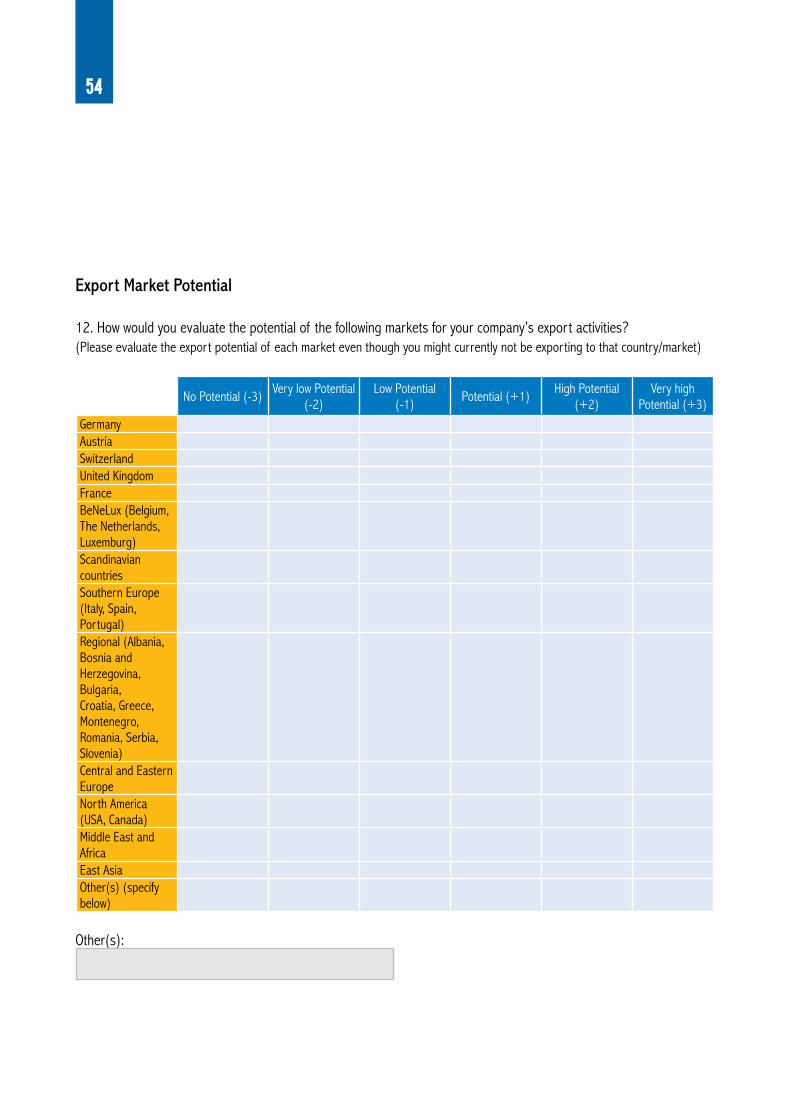
Export Market Potential
12. How would you evaluate the potential of the following markets for your company’s export activities?(Please evaluate the export potential of each market even though you might currently not be exporting to that country/market)
No Potential (-3) Very low Potential (-2)
Low Potential (-1) Potential (+1) High Potential
(+2)Very high
Potential (+3)GermanyAustriaSwitzerlandUnited KingdomFranceBeNeLux (Belgium, The Netherlands, Luxemburg)Scandinavian countries Southern Europe (Italy, Spain, Portugal)Regional (Albania, Bosnia and Herzegovina, Bulgaria, Croatia, Greece, Montenegro, Romania, Serbia, Slovenia)Central and Eastern EuropeNorth America (USA, Canada)Middle East and AfricaEast AsiaOther(s) (specify below)
Other(s):
55
Competitive Advantages
13. What are your core competitive advantages in the international markets?
• Price• Quality• Technical know-how• Sector Know-how• Horizontal know-how• (human) Languages• Cultural closeness• Other(s):
14. Which foreign language skills are available in your company?
• English• German• Turkish• Italian• Spanish• French• Other(s):
15. How do you conduct your exports? (Please indicate your export channels)
• Direct exports from your country to the client abroad• Subsidiary / branch office in the target market• Representative office• Joint venture• Distribution partner / Local Partner (sales agent, sales representative, sole distributor, etc.)• Through the Internet• Other(s):
56
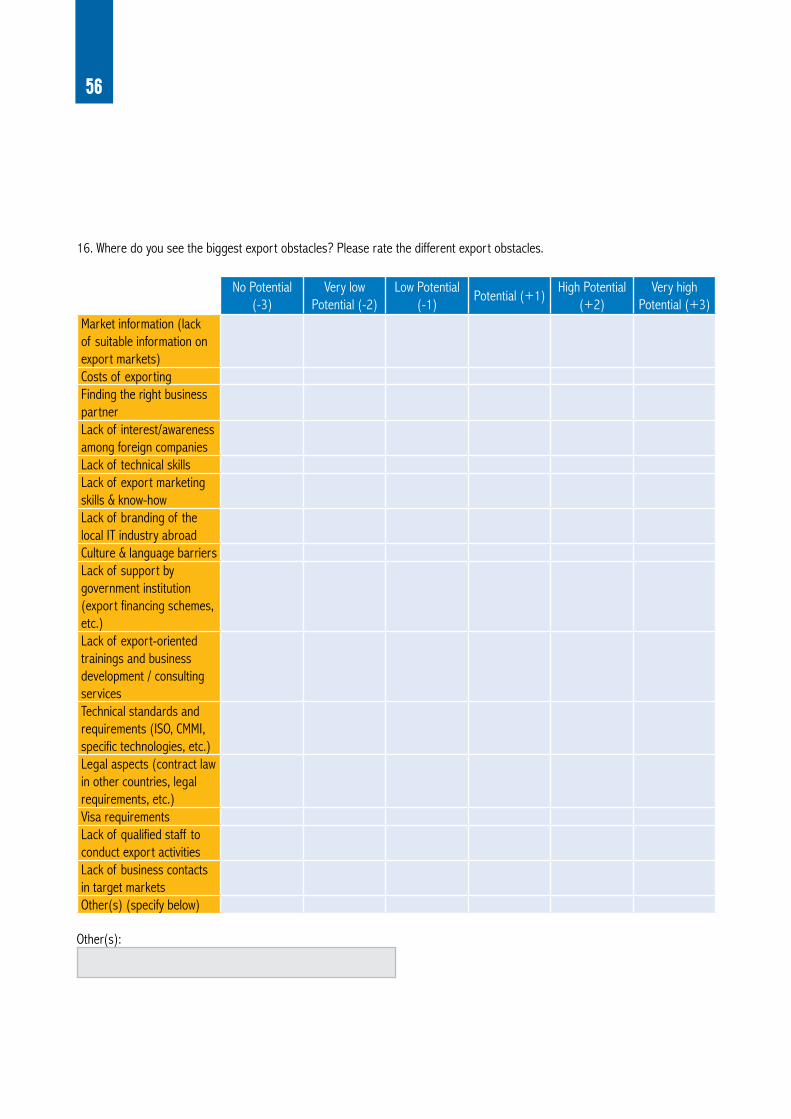
16. Where do you see the biggest export obstacles? Please rate the different export obstacles.
No Potential (-3)
Very low Potential (-2)
Low Potential (-1)
Potential (+1)High Potential
(+2)Very high
Potential (+3)Market information (lack of suitable information on export markets)Costs of exportingFinding the right business partnerLack of interest/awareness among foreign companiesLack of technical skillsLack of export marketing skills & know-howLack of branding of the local IT industry abroadCulture & language barriersLack of support by government institution (export financing schemes, etc.)Lack of export-oriented trainings and business development / consulting servicesTechnical standards and requirements (ISO, CMMI, specific technologies, etc.)Legal aspects (contract law in other countries, legal requirements, etc.)Visa requirementsLack of qualified staff to conduct export activitiesLack of business contacts in target marketsOther(s) (specify below)
Other(s):
57
Statistics
17. What was your annual revenue in your local currency? Please provide a forecast for 2015.
2013
2014
2015 (forecast)
18. Please fill in the table the information about your total export expressed in % or amount. Please provide a forecast for 2015.
Total export (% or amount) % of export in EU
201320142015 (forecast)
Product / Services
19. What was the percentage of your exports between products and IT services?If you did not have exports in a certain year please enter 100 in “Not Applicable” (N/A).(Sum of each line/year must be 100)
IT Services Products
201320142015 (forecast)
58
ClientsSector
20.In which sector do you have business expertise? Please separate domestic market from export.
Domestic Market ExportAerospaceAutomotiveDefenceEducation (E-Learning)Financial ServicesGaming and EntertainmentHealthcare ServicesHome AutomationIndustry Application and AutomationIT Services and OutsourcingManufacturing, Distribution, RetailMarketing and CommunicationsMedia and PublishingNon-profit organizationsPublic sector (E-Government)Real EstateServices (HR, Accounting, Legal)TechnologyTelecommunications (Wireless and Mobile)TelematicsTourism and HospitalityTrade, Transportation and LogisticsUtilitiesOther 1 (specify below)Other 2 (specify below)
Other(s):
59
ClientsHorizontal
21. In which horizontal markets do you provide products and / or IT services to your clients? Please separate domestic market from export.
Domestic Market Export
Business Intelligence/Data Warehousing
Business Process Optimization
Corporate Security
Custom Development/Outsourcing
Customer Management (CRM)
Document Management
E-commerce
Embedded Engineering and Development
ERP/Supply Chain
IT Consulting
IT Project Management
Knowledge Management/Operations
Mobile Solutions
Navigation ApplicationsNew Media Production (Multimedia/Web animations)Product maintenance, Support and CustomizationSoftware Quality Assurance
Tools/COTS
Web design; development
Other 1 (specify below)
Other 2 (specify below)
Other(s):
60
Human ResourcesEmployees
22. What is the total number of your employees and associates?
2014
2015 (forecast)
23. Please provide the number of employees that leave the company on yearly basis.• >10%• 10 -25%• < 25%
24. What is the average time needed to replace the employees that leave the company?• > 3 months• 3-6 mounts• < 6 mounths• Other: _______________________
Salaries
25. What are the average monthly salaries (as per labor contract) for the following positions?
2014
Developers Graphic Designers Database AdministratorsSystem administratorBusiness Developer ManagementProject Managers Marketing / SalesAdministrationOthers

61
Rates
26. What is the average billable rate for the following staff categories?Please provide rates per person in your local currency per hour (VAT excluded). (If you don’t have the rates, just leave zero.)
Developers
Graphic Designers
Database Administrators
System administrator
Business Developer Management
Project Managers
27. Blended Rate(Blended Rate is the rate that you would quote your services to a client, should you have to provide one number for that.)
28. Do you expect the total number of employees in your company to:(Please, include full-time and part-time/free-lance employees in your calculation.)
-50%|------- -25% Decrease
-10%-------| ±0% +10%|-------
+25% Increase
+50%-------|
Number of Staff

62
29. Do you expect the salary level to:
-50%|------- -25% Decrease
-10%-------| ±0% +10%|------- +25% Increase
+50%-------|
IT SpecialistsOthers
Current Issues and Remarks, CommentsImpact of external factors
30. Considering the current situation of your business, how do you evaluate the influence of the following factors on the development of your business?
-50%|------- -25% Decrease -10%-------|Global Economic situation National Economic situationHR MarketIntensified CompetitionGovernment policy
Current Issue31. Is brain drain influencing negatively your business?• Yes• No
32. Do you think there is a deficit of skilled/qualified workforce in your country?• Yes• No• Comment: ______________________________________
Remarks, SuggestionsUse the space below to give your comments and suggestions on the subjects that you evaluate as important for your company. Consider the work being performed in the IT sector, the supporters, the associations, the government etc. Comments, remarks, suggestions are also welcome.

THANK YOUFOR YOUR TIME!
64