Embed Size (px)
DESCRIPTION
IT 456-01 System Administration Lesson 2. Dr Jeffrey A Robinson. Overview of Course. Week 1 – Introduction Week 2 – Installation of SQL and management Tools Week 3 - Creating and Using a Database Week 4 - Using the SQL Server Agent Service Week 5 - Disaster Recovery - PowerPoint PPT Presentation
Citation preview

IT 456-01IT 456-01System AdministrationSystem Administration
Lesson 2Lesson 2
Dr Jeffrey A RobinsonDr Jeffrey A Robinson
Overview of CourseOverview of Course
Week 1 – IntroductionWeek 1 – IntroductionWeek 2 – Installation of SQL and management Tools Week 2 – Installation of SQL and management Tools Week 3 - Creating and Using a DatabaseWeek 3 - Creating and Using a DatabaseWeek 4 - Using the SQL Server Agent Service Week 4 - Using the SQL Server Agent Service Week 5 - Disaster RecoveryWeek 5 - Disaster RecoveryWeek 6 - SQL Server SecurityWeek 6 - SQL Server SecurityWeek 7 - Performance MonitoringWeek 7 - Performance MonitoringWeek 8 - Performance OptimizationWeek 8 - Performance OptimizationWeek 9 - High AvailabilityWeek 9 - High Availability

Unit 2Unit 2
Chapter 1 introduces SQL Server 2008, Chapter 1 introduces SQL Server 2008, listing the components, services, and listing the components, services, and editions of SQL Server 2008. It also editions of SQL Server 2008. It also describes how to plan and perform a SQL describes how to plan and perform a SQL Server 2008 installation. Hardware and Server 2008 installation. Hardware and software prerequisites, server and security software prerequisites, server and security considerations, and the installation considerations, and the installation process are describedprocess are described

SQL Server major componentsSQL Server major componentsThe five SQL Server 2008 editions available for use in The five SQL Server 2008 editions available for use in production environment are production environment are – SQL Server 2008 Enterprise editionSQL Server 2008 Enterprise edition– SQL Server 2008 Standard editionSQL Server 2008 Standard edition– SQL Server 2008 Mobile editionSQL Server 2008 Mobile edition– SQL Server 2008 Workgroup editionSQL Server 2008 Workgroup edition– SQL Server 2008 Web editionSQL Server 2008 Web edition
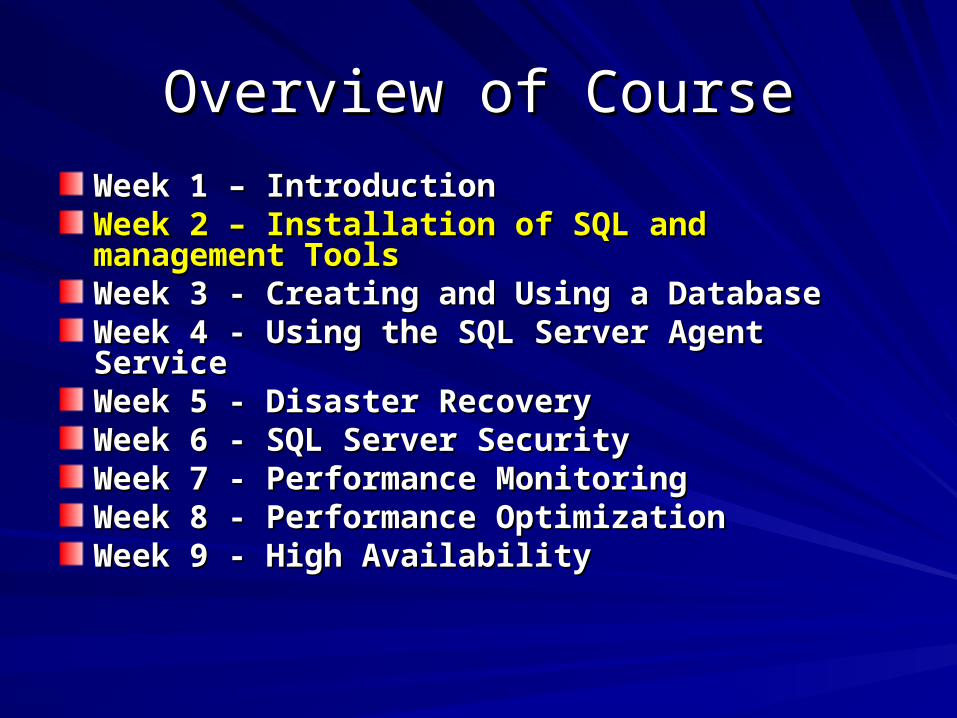
SQL Server major componentsSQL Server major componentsInstructions in DocShare folderInstructions in DocShare folder– IT456_-_Installing_a_Default_Instance_of_SQL_Server_20058IT456_-_Installing_a_Default_Instance_of_SQL_Server_20058
SQL Server 2008SQL Server 2008SQL Server Management Studio (SSMS)SQL Server Management Studio (SSMS)SQL Server Business Intelligence Development Studio !!!SQL Server Business Intelligence Development Studio !!!Databases (AdventureWorks Northwnd Pubs NW Databases (AdventureWorks Northwnd Pubs NW Traders)Traders)ServicesServices– Analysis ServicesAnalysis Services– Notification ServicesNotification Services– Integration Services (need XP Pro or Vista Ultimate)Integration Services (need XP Pro or Vista Ultimate)
NOT Home or Business versionsNOT Home or Business versions
Books online !!!Books online !!!
DM databases and Excel DM extentionsDM databases and Excel DM extentions

Unit 2 assignmentUnit 2 assignment
200–300 word - Describe the requirements 200–300 word - Describe the requirements of MS SQL Server 2008 and the process of MS SQL Server 2008 and the process you must follow prior to the installation of you must follow prior to the installation of MS SQL Server 2008. (Hint - Before MS SQL Server 2008. (Hint - Before installing MS SQL Server 2008 an installing MS SQL Server 2008 an installation plan should be created…. )installation plan should be created…. )

Unit 2 assignment (cont)Unit 2 assignment (cont)
Project – Install a default instance of SQL Project – Install a default instance of SQL Server 2008. Server 2008. – a. For directions, see Chapter 1. a. For directions, see Chapter 1. – b. Create the NWTraders Database using b. Create the NWTraders Database using
instructions in the file in Doc Sharing called instructions in the file in Doc Sharing called "Create NWTraders Database "Create NWTraders Database
– c. Run the scripts from the file in DocSharing c. Run the scripts from the file in DocSharing called “Create NWTraders Objects and Data.” called “Create NWTraders Objects and Data.”
Unit 3 assignmentUnit 3 assignment
Write a 200–300 word response to each of Write a 200–300 word response to each of the following topics. the following topics.
1. 10 points. Define five options used 1. 10 points. Define five options used when creating a database and identify the when creating a database and identify the importance of each option. importance of each option.
2. 10 points. Define the options for the 2. 10 points. Define the options for the recovery method available when creating recovery method available when creating a database. Identify the strengths and a database. Identify the strengths and weaknesses of each option.weaknesses of each option.

Unit 3 assignment (cont)Unit 3 assignment (cont)
For this Unit's Project you will: For this Unit's Project you will: – Develop a stored procedure within the Develop a stored procedure within the
NWTraders database to evaluate characteristics NWTraders database to evaluate characteristics of a customer and his/her purchases or of a customer and his/her purchases or employee and the purchases he/she have been employee and the purchases he/she have been involved in the procurement. Examples include involved in the procurement. Examples include the evaluation of purchases by customer by the evaluation of purchases by customer by region, zip code with items or evaluation of region, zip code with items or evaluation of employees by title, birthdate, region or zipcode. employees by title, birthdate, region or zipcode.
–
Next weekNext week
Week 3 - SQL Server Configuration and Internals
Important stuff on TLOGs

Additional backup SlidesAdditional backup Slides

Excel - Add insExcel - Add insTo enable the full resources of Excel you need to be sure that the To enable the full resources of Excel you need to be sure that the appropriate Add-in are enables in excelappropriate Add-in are enables in excel
In Office 2007 this is done by clicking on the In Office 2007 this is done by clicking on the Office icon in the upper left of the Excel windowOffice icon in the upper left of the Excel window
Then select the Excel Options Then select the Excel Options button on the bottom of thebutton on the bottom of thePopup menuPopup menu
Click n Add-Ins on the leftClick n Add-Ins on the leftNavigation bar and OK on theNavigation bar and OK on theNext pop-up menuNext pop-up menu
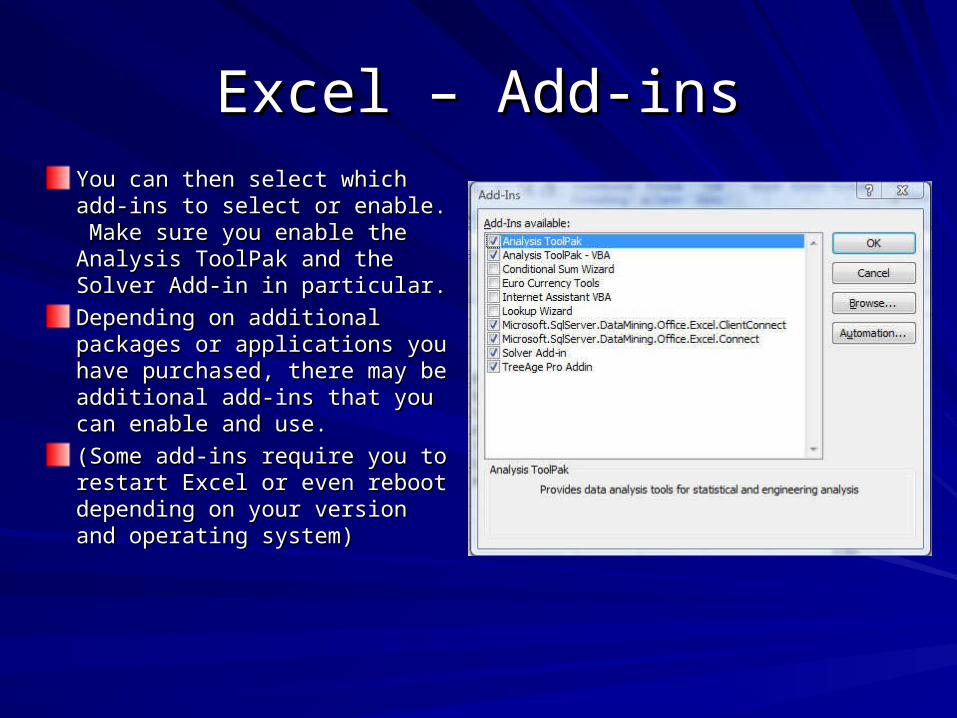
Excel – Add-insExcel – Add-insYou can then select which add-You can then select which add-ins to select or enable. Make ins to select or enable. Make sure you enable the Analysis sure you enable the Analysis ToolPak and the Solver Add-in ToolPak and the Solver Add-in in particular.in particular.
Depending on additional Depending on additional packages or applications you packages or applications you have purchased, there may be have purchased, there may be additional add-ins that you can additional add-ins that you can enable and use.enable and use.
(Some add-ins require you to (Some add-ins require you to restart Excel or even reboot restart Excel or even reboot depending on your version and depending on your version and operating system)operating system)

Excel Statistical Add-insExcel Statistical Add-ins
Once installed these new utilities will show up on the Once installed these new utilities will show up on the Excel toolbar ribbon under the Data TabExcel toolbar ribbon under the Data Tab
Third party add-ins may show up as new tabs on the Third party add-ins may show up as new tabs on the toolbar ribbon or be listed under the Add-In tabtoolbar ribbon or be listed under the Add-In tab
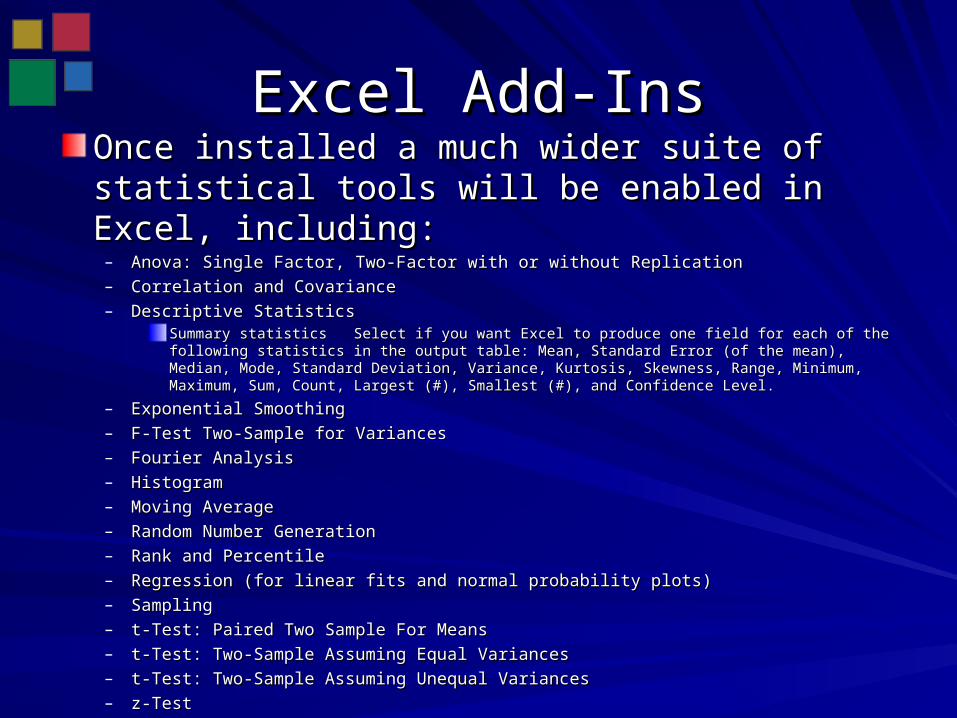
Excel Add-InsExcel Add-InsOnce installed a much wider suite of statistical Once installed a much wider suite of statistical tools will be enabled in Excel, including:tools will be enabled in Excel, including:– Anova: Single Factor, Two-Factor with or without Replication Anova: Single Factor, Two-Factor with or without Replication
– Correlation and CovarianceCorrelation and Covariance
– Descriptive StatisticsDescriptive StatisticsSummary statistics Select if you want Excel to produce one field for each of the following statistics in Summary statistics Select if you want Excel to produce one field for each of the following statistics in the output table: Mean, Standard Error (of the mean), Median, Mode, Standard Deviation, Variance, the output table: Mean, Standard Error (of the mean), Median, Mode, Standard Deviation, Variance, Kurtosis, Skewness, Range, Minimum, Maximum, Sum, Count, Largest (#), Smallest (#), and Kurtosis, Skewness, Range, Minimum, Maximum, Sum, Count, Largest (#), Smallest (#), and Confidence Level.Confidence Level.
– Exponential SmoothingExponential Smoothing
– F-Test Two-Sample for VariancesF-Test Two-Sample for Variances
– Fourier AnalysisFourier Analysis
– HistogramHistogram
– Moving AverageMoving Average
– Random Number GenerationRandom Number Generation
– Rank and PercentileRank and Percentile
– Regression (for linear fits and normal probability plots)Regression (for linear fits and normal probability plots)
– SamplingSampling
– t-Test: Paired Two Sample For Meanst-Test: Paired Two Sample For Means
– t-Test: Two-Sample Assuming Equal Variancest-Test: Two-Sample Assuming Equal Variances
– t-Test: Two-Sample Assuming Unequal Variancest-Test: Two-Sample Assuming Unequal Variances
– z-Testz-Test

Excel 2007 changesExcel 2007 changesExcel has undergone a number of changes in the 2007 Office version. Excel has undergone a number of changes in the 2007 Office version. While we have discussed a few, here is a partial list of some more important While we have discussed a few, here is a partial list of some more important changes.changes.

Excel Analyze tools Add-inExcel Analyze tools Add-in
The Excel Add-in comes with a number of excellent analysis features. The Excel Add-in comes with a number of excellent analysis features. Coupled with the Analysis Services add-in Excel becomes a powerful Coupled with the Analysis Services add-in Excel becomes a powerful entry level data analysis tool.entry level data analysis tool.
Additionally, under the ANALYZE tab, there are features such as:Additionally, under the ANALYZE tab, there are features such as:
- Analyze Key Influencers- Analyze Key Influencers
- Detect categories- Detect categories
- Fill from Example- Fill from Example
- Forecast- Forecast
- Highlight Exceptions- Highlight Exceptions
- and Scenario Analysis- and Scenario Analysis

Excel AnalyzeExcel Analyze
Once you are connected, the following Once you are connected, the following features will be enabled in the ANALYZE features will be enabled in the ANALYZE tab of your Excel workbooktab of your Excel workbook

Excel Analyze Add-inExcel Analyze Add-in
The The Analyze Key Influencers Analyze Key Influencers tool lets you select a column that contains a tool lets you select a column that contains a desired outcome or target value, and then analyze the patterns in a data set desired outcome or target value, and then analyze the patterns in a data set to determine which factors had the strongest influence on the outcome. For to determine which factors had the strongest influence on the outcome. For example, if you have a customer list that includes a column that shows the example, if you have a customer list that includes a column that shows the total purchases for each customer over the past year, you could analyze the total purchases for each customer over the past year, you could analyze the table to determine the customer demographics for your top purchasers.table to determine the customer demographics for your top purchasers.
The tool also lets you select a pair of possible outcomes and compare The tool also lets you select a pair of possible outcomes and compare them. If the column that you are predicting contains discrete values such as them. If the column that you are predicting contains discrete values such as "Purchase = Yes", "Purchase = No", or "Purchase = Yes but not now", you "Purchase = Yes", "Purchase = No", or "Purchase = Yes but not now", you can compare the consumers who purchase immediately against those who can compare the consumers who purchase immediately against those who purchase later, and those who purchase later against those who never purchase later, and those who purchase later against those who never purchase. purchase.
This helps determine possible decision-making factors.This helps determine possible decision-making factors.

Excel Analyze Add-inExcel Analyze Add-in
The The Detect Categories Detect Categories tool automatically tool automatically finds rows in a table that have similar finds rows in a table that have similar characteristics. characteristics.
When the tool finishes, it creates a report When the tool finishes, it creates a report that lists the categories it found, together with that lists the categories it found, together with their distinguishing characteristics. By default their distinguishing characteristics. By default it adds a new column to the data table that it adds a new column to the data table that contains the proposed category. You can contains the proposed category. You can then review the categories and rename them.then review the categories and rename them.

Excel DM Add-inExcel DM Add-inThe features of the Excel DM add-in suite include:The features of the Excel DM add-in suite include:
- Explore data- Explore data
- Partition Data- Partition Data
- Clean data- Clean data
- Estimate- Estimate
- Cluster- Cluster
- Associate- Associate
- Forecast- Forecast
We will examine some of these in more detail in labs following this We will examine some of these in more detail in labs following this lecture.lecture.
Excel DM Add-inExcel DM Add-in
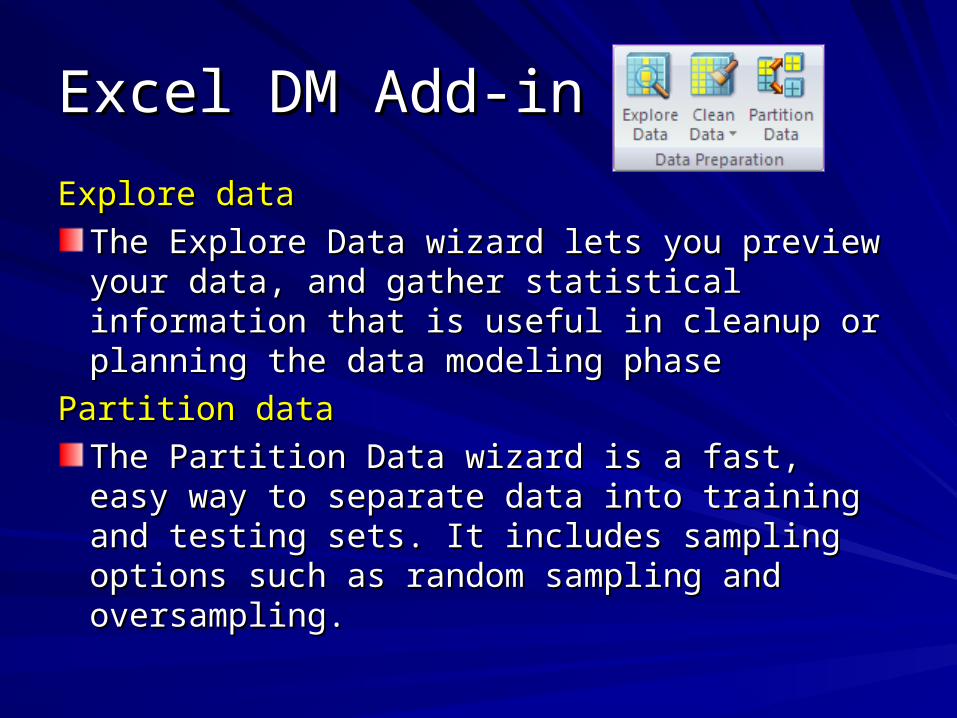
Explore dataExplore data
The Explore Data wizard lets you preview your The Explore Data wizard lets you preview your data, and gather statistical information that is data, and gather statistical information that is useful in cleanup or planning the data modeling useful in cleanup or planning the data modeling phasephase
Partition dataPartition data
The Partition Data wizard is a fast, easy way to The Partition Data wizard is a fast, easy way to separate data into training and testing sets. It separate data into training and testing sets. It includes sampling options such as random includes sampling options such as random sampling and oversampling. sampling and oversampling.

Excel DM Add-inExcel DM Add-in
Clean dataClean data
There are two Clean Data wizards, the Outliers wizard and the Relabel There are two Clean Data wizards, the Outliers wizard and the Relabel wizard. These wizards help simplify data cleaning prior to data mining.wizard. These wizards help simplify data cleaning prior to data mining.
Another tool that is useful in data cleaning is the Another tool that is useful in data cleaning is the Fill From ExampleFill From Example tool, tool, in the Table Analysis Tools for Excel. This tool detects missing values and in the Table Analysis Tools for Excel. This tool detects missing values and lets you either remove them or replace them with a mean, null, or other lets you either remove them or replace them with a mean, null, or other value.value.
The The Remove Outliers Remove Outliers wizard graphs the distribution of values in your data wizard graphs the distribution of values in your data and lets you remove extreme values.and lets you remove extreme values.
The The Relabel Data Relabel Data wizard lets you work with the data values to make them wizard lets you work with the data values to make them easier to read and understand. For example, you can replace numeric easier to read and understand. For example, you can replace numeric values with text labels, or assign a group label to continuous data ranges.values with text labels, or assign a group label to continuous data ranges.
Excel DM Add-inExcel DM Add-in
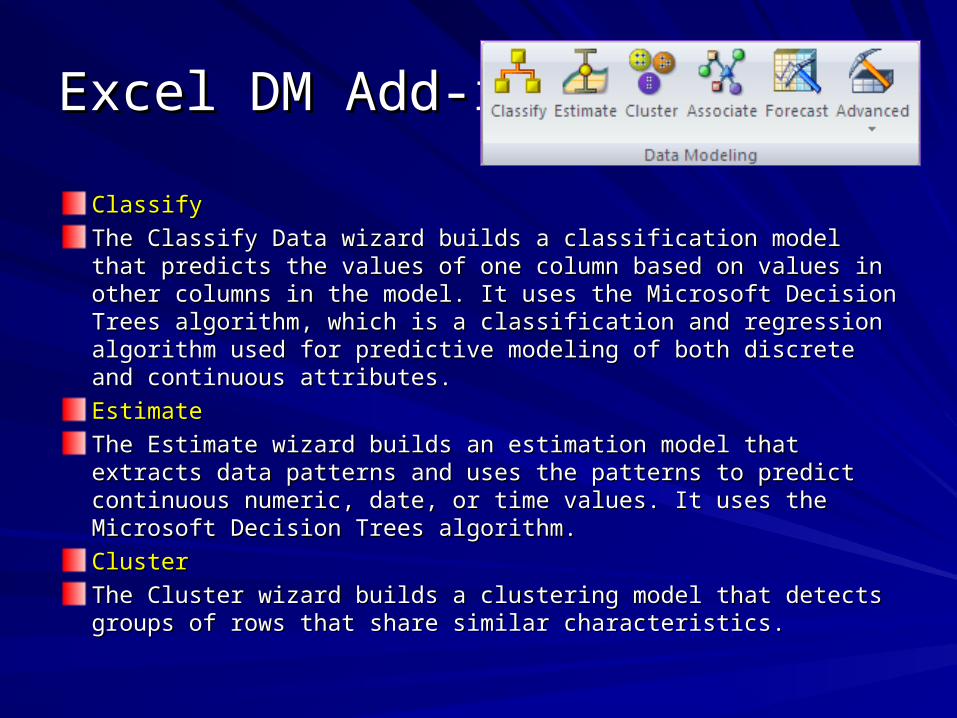
ClassifyClassify
The Classify Data wizard builds a classification model that predicts The Classify Data wizard builds a classification model that predicts the values of one column based on values in other columns in the the values of one column based on values in other columns in the model. It uses the Microsoft Decision Trees algorithm, which is a model. It uses the Microsoft Decision Trees algorithm, which is a classification and regression algorithm used for predictive modeling classification and regression algorithm used for predictive modeling of both discrete and continuous attributes.of both discrete and continuous attributes.
EstimateEstimate
The Estimate wizard builds an estimation model that extracts data The Estimate wizard builds an estimation model that extracts data patterns and uses the patterns to predict continuous numeric, date, patterns and uses the patterns to predict continuous numeric, date, or time values. It uses the Microsoft Decision Trees algorithm.or time values. It uses the Microsoft Decision Trees algorithm.
ClusterCluster
The Cluster wizard builds a clustering model that detects groups of The Cluster wizard builds a clustering model that detects groups of rows that share similar characteristics.rows that share similar characteristics.

Excel DM Add-inExcel DM Add-in
AssociateAssociate
The Associate wizard builds an association model that The Associate wizard builds an association model that detects associations between items that appear in multiple detects associations between items that appear in multiple transactions: for example, in market basket analysis.transactions: for example, in market basket analysis.
ForecastForecast
The Forecast wizard builds a forecasting model that The Forecast wizard builds a forecasting model that detects patterns in a detects patterns in a series of cells, and then forecasts series of cells, and then forecasts additional values.additional values.
AdvancedAdvanced
Create mining ModelCreate mining Model
Add Model to StructureAdd Model to Structure
Accuracy and ValidationAccuracy and Validation
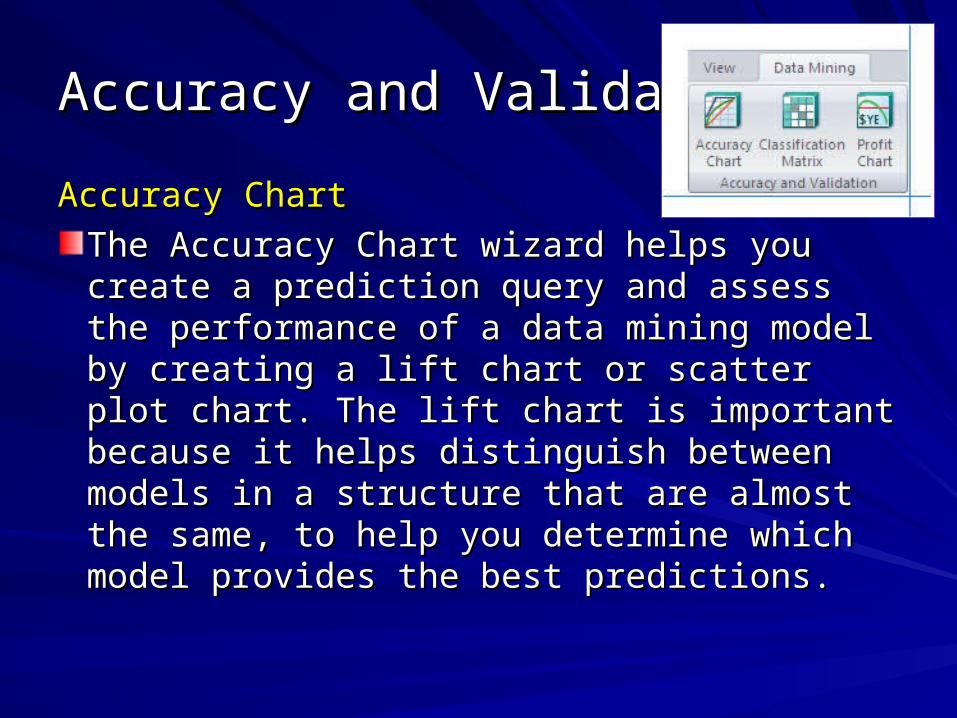
Accuracy ChartAccuracy Chart
The Accuracy Chart wizard helps you create a The Accuracy Chart wizard helps you create a prediction query and assess the performance prediction query and assess the performance of a data mining model by creating a lift chart of a data mining model by creating a lift chart or scatter plot chart. The lift chart is important or scatter plot chart. The lift chart is important because it helps distinguish between models because it helps distinguish between models in a structure that are almost the same, to help in a structure that are almost the same, to help you determine which model provides the best you determine which model provides the best predictions.predictions.
Accuracy and ValidationAccuracy and Validation
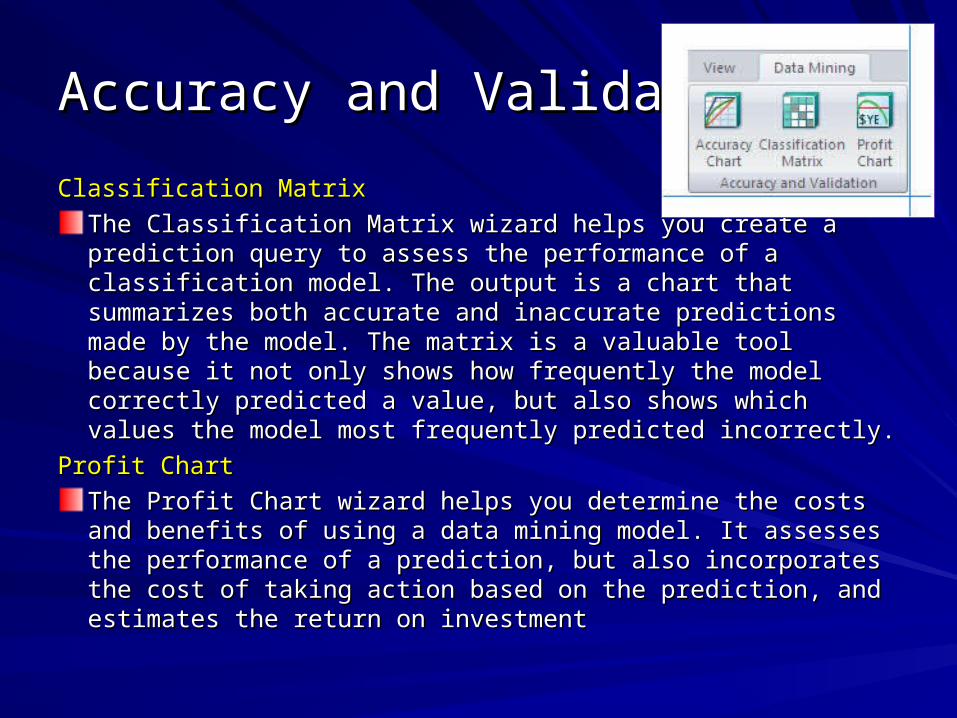
Classification MatrixClassification Matrix
The Classification Matrix wizard helps you create a prediction The Classification Matrix wizard helps you create a prediction query to assess the performance of a classification model. The query to assess the performance of a classification model. The output is a chart that summarizes both accurate and inaccurate output is a chart that summarizes both accurate and inaccurate predictions made by the model. The matrix is a valuable tool predictions made by the model. The matrix is a valuable tool because it not only shows how frequently the model correctly because it not only shows how frequently the model correctly predicted a value, but also shows which values the model most predicted a value, but also shows which values the model most frequently predicted incorrectly. frequently predicted incorrectly.
Profit ChartProfit Chart
The Profit Chart wizard helps you determine the costs and benefits The Profit Chart wizard helps you determine the costs and benefits of using a data mining model. It assesses the performance of a of using a data mining model. It assesses the performance of a prediction, but also incorporates the cost of taking action based on prediction, but also incorporates the cost of taking action based on the prediction, and estimates the return on investmentthe prediction, and estimates the return on investment
Enabling the Excel DM SuiteEnabling the Excel DM Suite
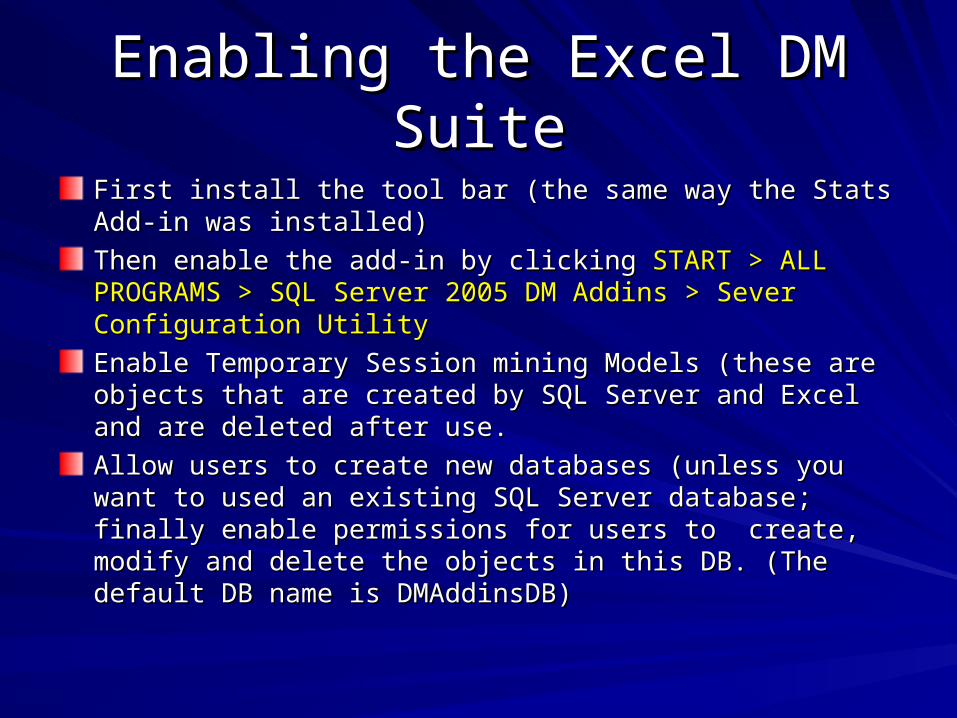
First install the tool bar (the same way the Stats Add-in was First install the tool bar (the same way the Stats Add-in was installed)installed)
Then enable the add-in by clicking Then enable the add-in by clicking START > ALL PROGRAMS > START > ALL PROGRAMS > SQL Server 2005 DM Addins > Sever Configuration UtilitySQL Server 2005 DM Addins > Sever Configuration Utility
Enable Temporary Session mining Models (these are objects that Enable Temporary Session mining Models (these are objects that are created by SQL Server and Excel and are deleted after use.are created by SQL Server and Excel and are deleted after use.
Allow users to create new databases (unless you want to used an Allow users to create new databases (unless you want to used an existing SQL Server database; finally enable permissions for users existing SQL Server database; finally enable permissions for users to create, modify and delete the objects in this DB. (The default DB to create, modify and delete the objects in this DB. (The default DB name is DMAddinsDB)name is DMAddinsDB)

Excel DM SuiteExcel DM Suite
Setting up Data Analysis tablesSetting up Data Analysis tables
Once SQL server is configured to enable Excel DM add-ins, open Once SQL server is configured to enable Excel DM add-ins, open your Excel workbook.your Excel workbook.
Select a worksheet and highlight the data you want to convert to an Select a worksheet and highlight the data you want to convert to an Excel table (as shown on the previous slides on Excel tablesExcel table (as shown on the previous slides on Excel tables; ; HOME > STYLES > FORMAT AS TABLE)HOME > STYLES > FORMAT AS TABLE)
Next, connect to the server and database that you previously Next, connect to the server and database that you previously enabled. (On the ribbonenabled. (On the ribbon: ANALYZE > CONNECTION > Add New : ANALYZE > CONNECTION > Add New ConnectionConnection) Enter the server name and the local database that you ) Enter the server name and the local database that you specified when running the configuration utility. The connection specified when running the configuration utility. The connection to to the SQL Server Analysis Services Utilitiesthe SQL Server Analysis Services Utilities will be displayed in the will be displayed in the Excel RibbonExcel Ribbon

Excel DM - AddinsExcel DM - Addins
However, with DM features enabled, you also get the However, with DM features enabled, you also get the following new tools, as well. (Under the Data Mining Tab)following new tools, as well. (Under the Data Mining Tab)
Notice: there are now many tools are your disposal.Notice: there are now many tools are your disposal.
However, you must first indicate the data you want to However, you must first indicate the data you want to analyze. The method for selecting data is the same for analyze. The method for selecting data is the same for all the DM tools, but I will use the classify tool as an all the DM tools, but I will use the classify tool as an example.example.

Excel DM - AddinsExcel DM - Addins
Click on the classify data icon to access the Classify data Wizard. Click on the classify data icon to access the Classify data Wizard. The defaults are the Excel tables in your workbook or you and enterThe defaults are the Excel tables in your workbook or you and entera range of data a range of data within a table.within a table.
You can, however You can, however link directly to link directly to existing SQL existing SQL Server databasesServer databasesto access tables,to access tables,columns and rowscolumns and rowsof data in existingof data in existingrelational relational databasesdatabases

Excel DM - AddinsExcel DM - AddinsTo link to an analysis services data source you need to To link to an analysis services data source you need to enter the Data Source name, Server name and catalog enter the Data Source name, Server name and catalog name.name.
Once entered, you will Once entered, you will be able to access allbe able to access allof the data in thatof the data in thatdata source by simplydata source by simplyclicking on the fieldclicking on the fieldor columns that you or columns that you want to import to want to import to Excel.Excel.

Excel DM - AddinsExcel DM - AddinsThe Data Source Editor will automatically generate an The Data Source Editor will automatically generate an SQL query to pull the specified data from the SQL Server SQL query to pull the specified data from the SQL Server database for use.database for use.
You can accept the defaultYou can accept the defaultSQL Query or edit it SQL Query or edit it manually, if you wish.manually, if you wish.
Once loaded you can use theOnce loaded you can use thevarious DM tools, but thesevarious DM tools, but thesetools will only work if thetools will only work if thedata has already been data has already been imported to excel.imported to excel.
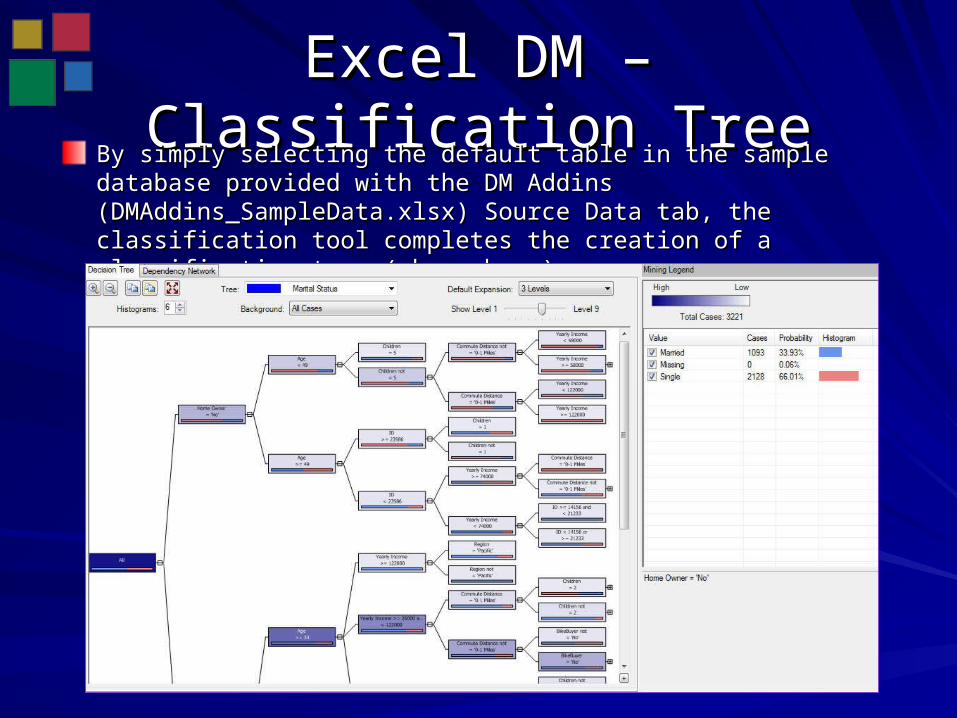
Excel DM – Classification TreeExcel DM – Classification TreeBy simply selecting the default table in the sample database provided with By simply selecting the default table in the sample database provided with the DM Addins (DMAddins_SampleData.xlsx) Source Data tab, the the DM Addins (DMAddins_SampleData.xlsx) Source Data tab, the classification tool completes the creation of a classification tree (shown classification tool completes the creation of a classification tree (shown here)here)
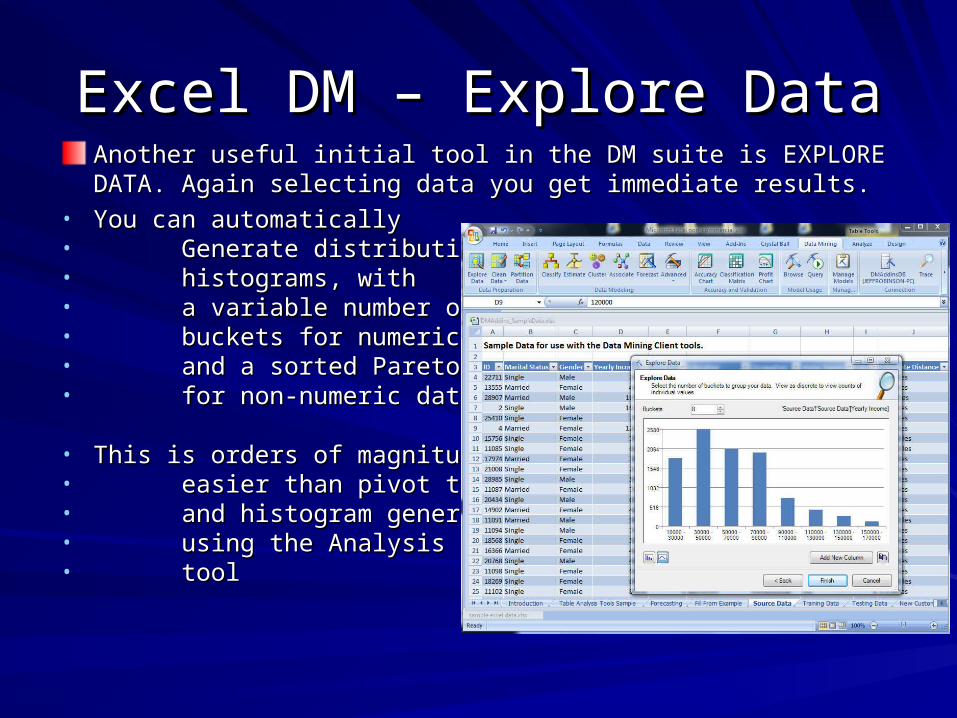
Excel DM – Explore DataExcel DM – Explore DataAnother useful initial tool in the DM suite is EXPLORE DATA. Again Another useful initial tool in the DM suite is EXPLORE DATA. Again selecting data you get immediate results.selecting data you get immediate results.
• You can automaticallyYou can automatically• Generate distribution Generate distribution • histograms, with histograms, with • a variable number of a variable number of • buckets for numeric databuckets for numeric data• and a sorted Pareto chartand a sorted Pareto chart• for non-numeric data.for non-numeric data.
• This is orders of magnitudeThis is orders of magnitude• easier than pivot tableseasier than pivot tables• and histogram generationand histogram generation• using the Analysis add-in using the Analysis add-in • tool tool


![Welcome to DrRacket, version 6.1 [3m]. Language: slideshow ...richter/11-7-2014.pdfNov 07, 2014 · 123 456 789 4 2 123 456 789 5 123 456 789 9 123 456 789 7 7 123 456 789 1 456 789](https://img.pdfslide.us/doc/110x75/5fd9df3a07c10b0ee2107e89/welcome-to-drracket-version-61-3m-language-slideshow-richter11-7-2014pdf.jpg)

![Untitled 2 [] · /01-!." *23-!." 456-!." *+,-!7" /01-!7" *23-!7" 456-!7" *+,-#!" /01-#!" *23-#!" 456-#!" *+,-##" /01-##" *23-##" 456-##" *+,-#$" /01-#$" *23-#$" 456-#$" *+,-#%" /01](https://img.pdfslide.us/doc/110x75/5f2f2b6ad0823628e27434f2/untitled-2-01-23-456-7-01-7.jpg)