Embed Size (px)
Citation preview
MARCH 19, 2013
ENROLLMENT MANAGEMENT,MARKETING AND COMMUNICATIONS
ISU Recruiting Strategy
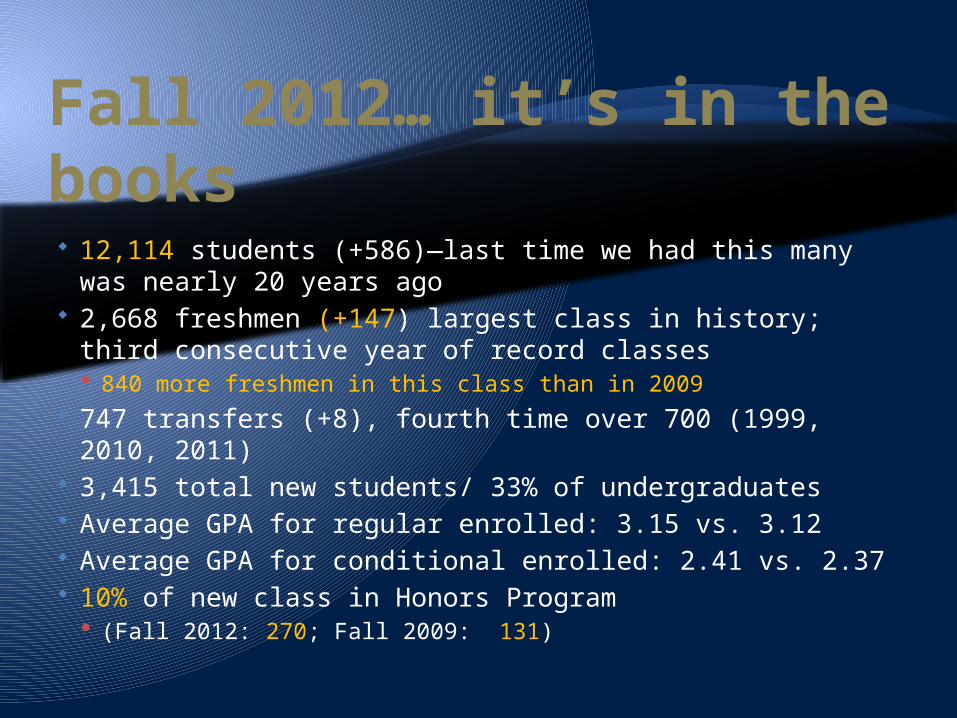
Fall 2012… it’s in the books 12,114 students (+586)—last time we had this many was
nearly 20 years ago 2,668 freshmen (+147) largest class in history; third
consecutive year of record classes 840 more freshmen in this class than in 2009
747 transfers (+8), fourth time over 700 (1999, 2010, 2011)
3,415 total new students/ 33% of undergraduates Average GPA for regular enrolled: 3.15 vs. 3.12 Average GPA for conditional enrolled: 2.41 vs. 2.37 10% of new class in Honors Program
(Fall 2012: 270; Fall 2009: 131)
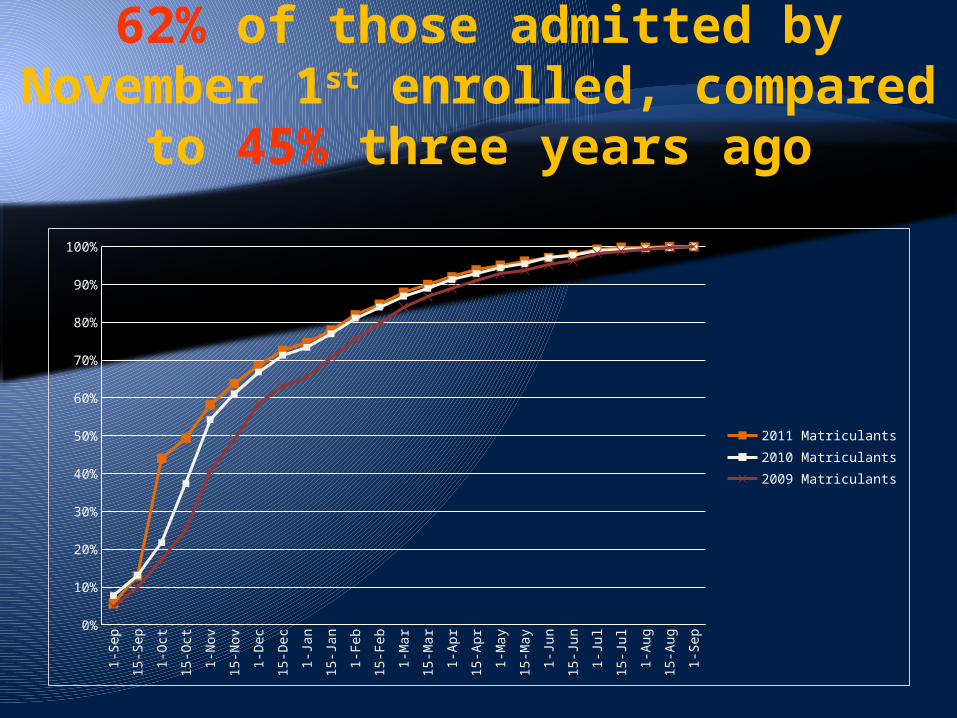
62% of those admitted by November 1st enrolled, compared
to 45% three years ago1-S
ep
15-S
ep
1-O
ct
15-O
ct
1-N
ov
15-N
ov
1-D
ec
15-D
ec
1-J
an
15-J
an
1-F
eb
15-F
eb
1-M
ar
15-M
ar
1-A
pr
15-A
pr
1-M
ay
15-M
ay
1-J
un
15-J
un
1-J
ul
15-J
ul
1-A
ug
15-A
ug
1-S
ep0%
10%
20%
30%
40%
50%
60%
70%
80%
90%
100%
2011 Matriculants2010 Matriculants2009 Matriculants
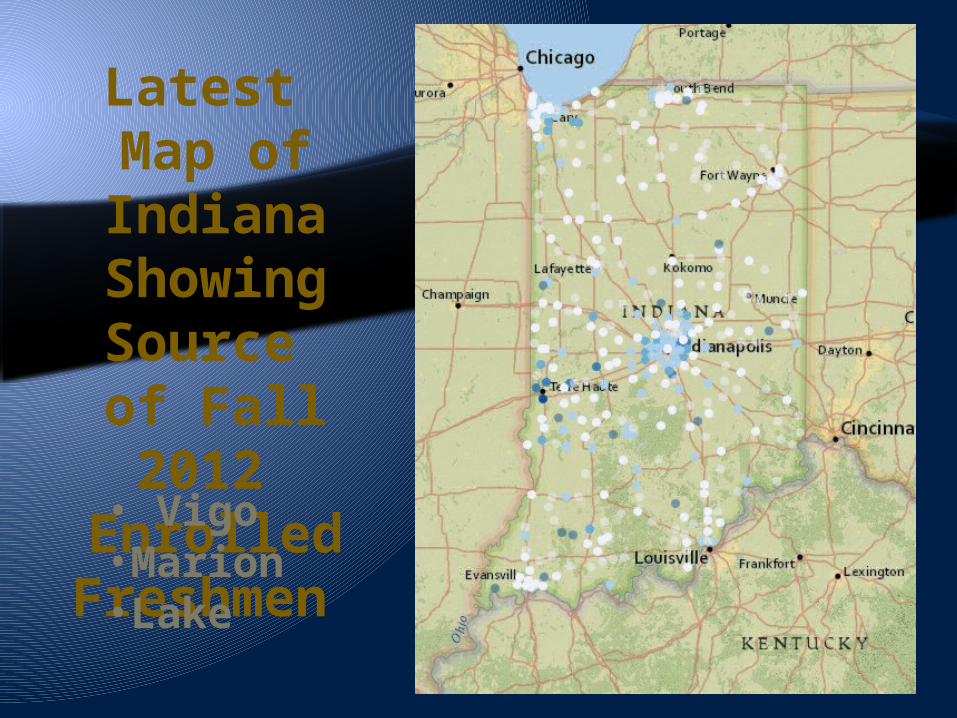
Latest Map of Indiana Showing Source
of Fall 2012 Enrolled
Freshmen • Vigo•Marion•Lake
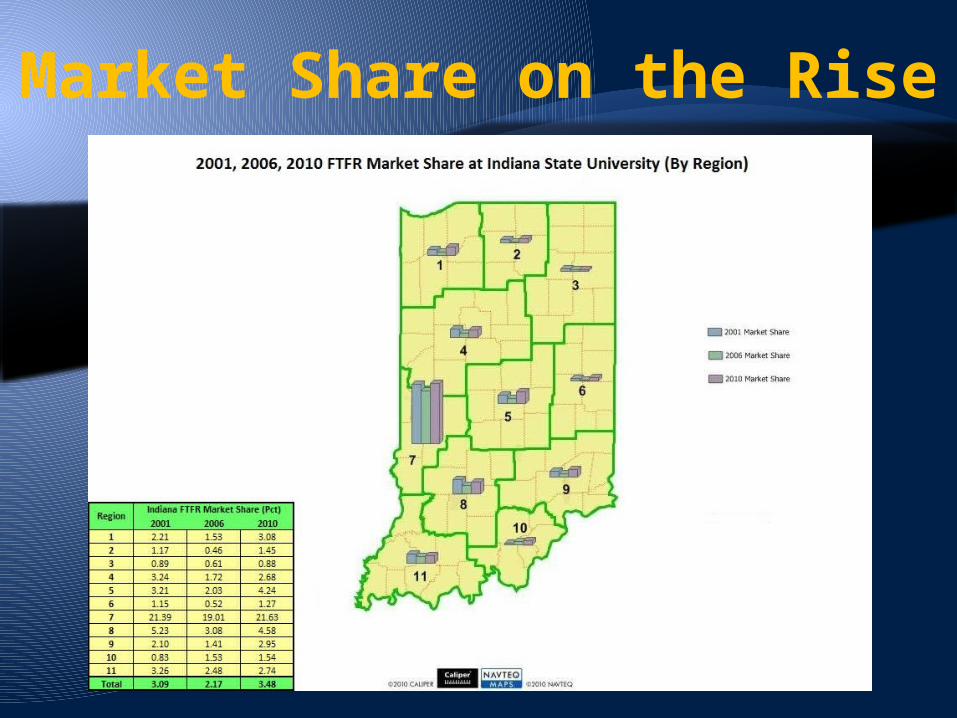
Market Share on the Rise
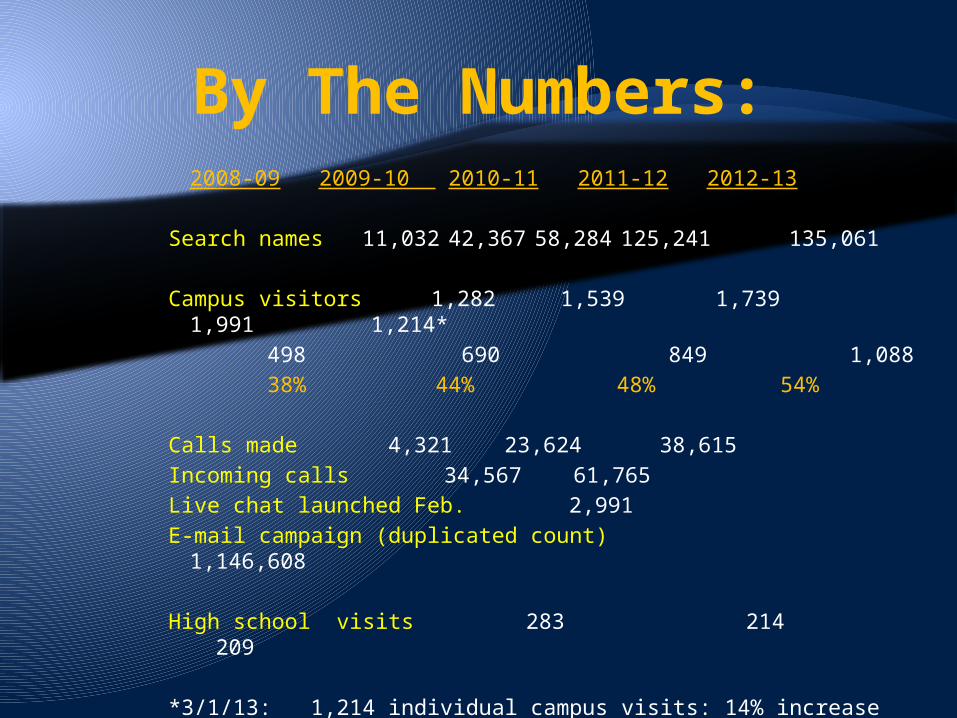
By The Numbers:2008-09 2009-10 2010-11
2011-12 2012-13
Search names 11,032 42,367 58,284 125,241 135,061
Campus visitors 1,282 1,539 1,739 1,991 1,214*
498 690 849 1,088
38% 44% 48% 54%
Calls made 4,321 23,624 38,615Incoming calls 34,567 61,765Live chat launched Feb. 2,991E-mail campaign (duplicated count) 1,146,608
High school visits 283 214 209
*3/1/13: 1,214 individual campus visits: 14% increase compared to last year
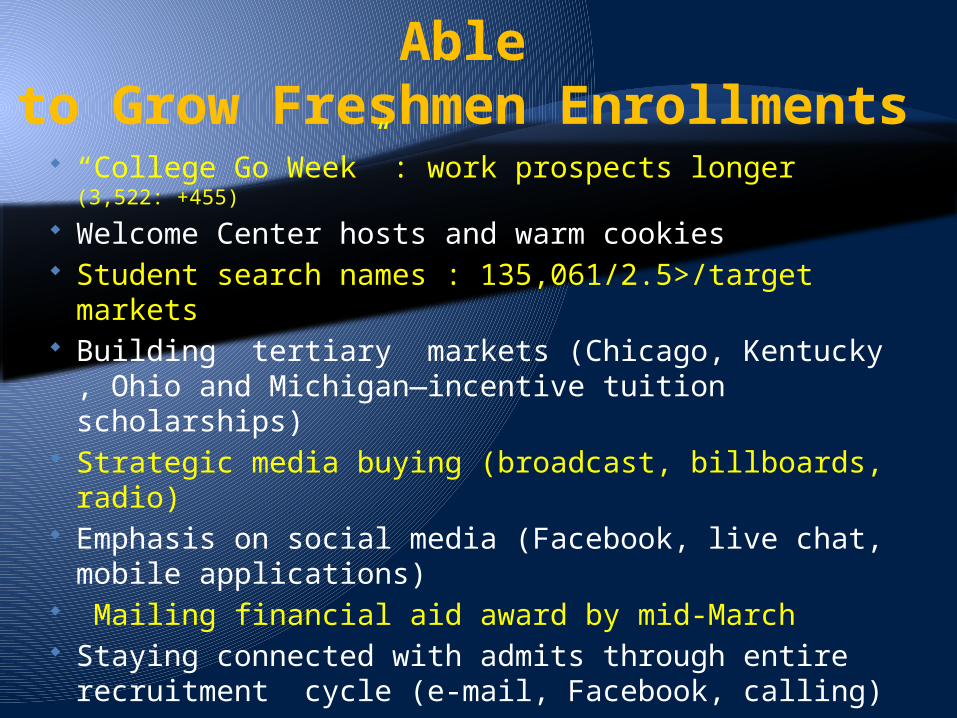
Some Reasons We Have Been Able
to Grow Freshmen Enrollments “College Go Week” : work prospects longer (3,522:
+455)
Welcome Center hosts and warm cookies Student search names : 135,061/2.5>/target
markets Building tertiary markets (Chicago, Kentucky ,
Ohio and Michigan—incentive tuition scholarships) Strategic media buying (broadcast, billboards,
radio) Emphasis on social media (Facebook, live chat,
mobile applications) Mailing financial aid award by mid-March Staying connected with admits through entire
recruitment cycle (e-mail, Facebook, calling)
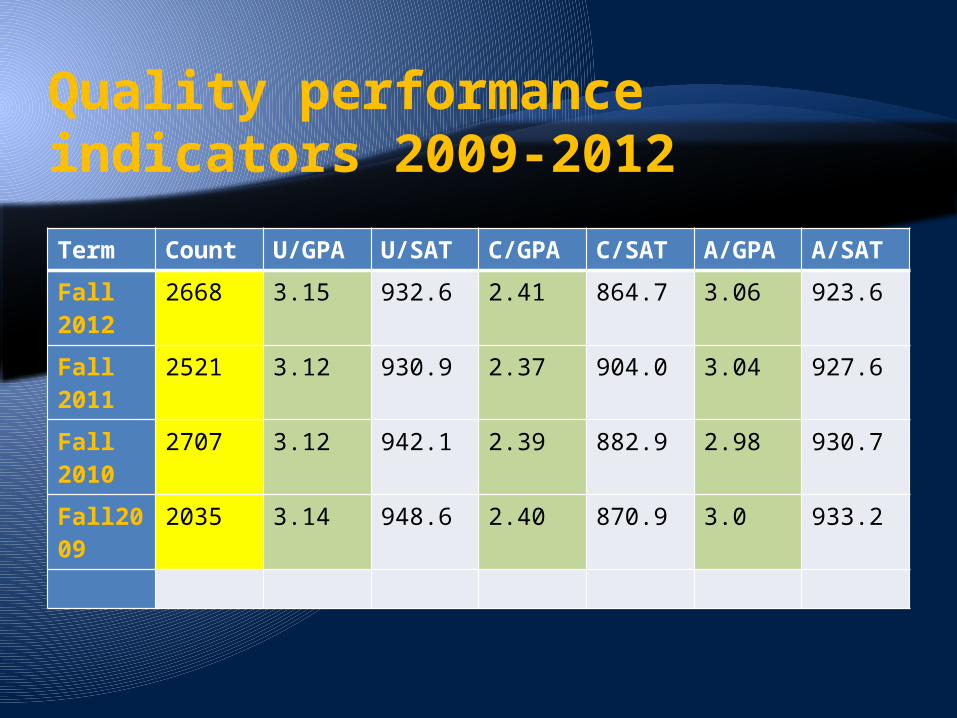
Quality performance indicators 2009-2012
Term Count U/GPA U/SAT C/GPA C/SAT A/GPA A/SAT
Fall 2012
2668 3.15 932.6 2.41 864.7 3.06 923.6
Fall 2011
2521 3.12 930.9 2.37 904.0 3.04 927.6
Fall 2010
2707 3.12 942.1 2.39 882.9 2.98 930.7
Fall2009
2035 3.14 948.6 2.40 870.9 3.0 933.2
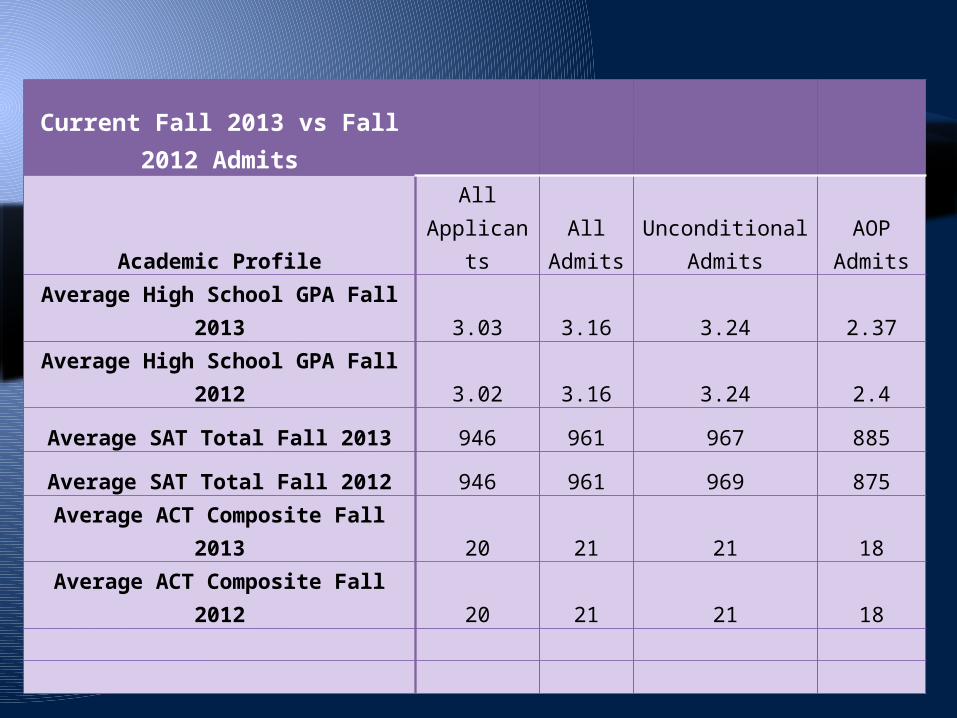
Current Fall 2013 vs Fall 2012 Admits
Academic Profile
All Applicant
sAll
AdmitsUnconditional
AdmitsAOP
AdmitsAverage High School GPA Fall
2013 3.03 3.16 3.24 2.37Average High School GPA Fall
2012 3.02 3.16 3.24 2.4
Average SAT Total Fall 2013 946 961 967 885
Average SAT Total Fall 2012 946 961 969 875Average ACT Composite Fall
2013 20 21 21 18Average ACT Composite Fall
2012 20 21 21 18
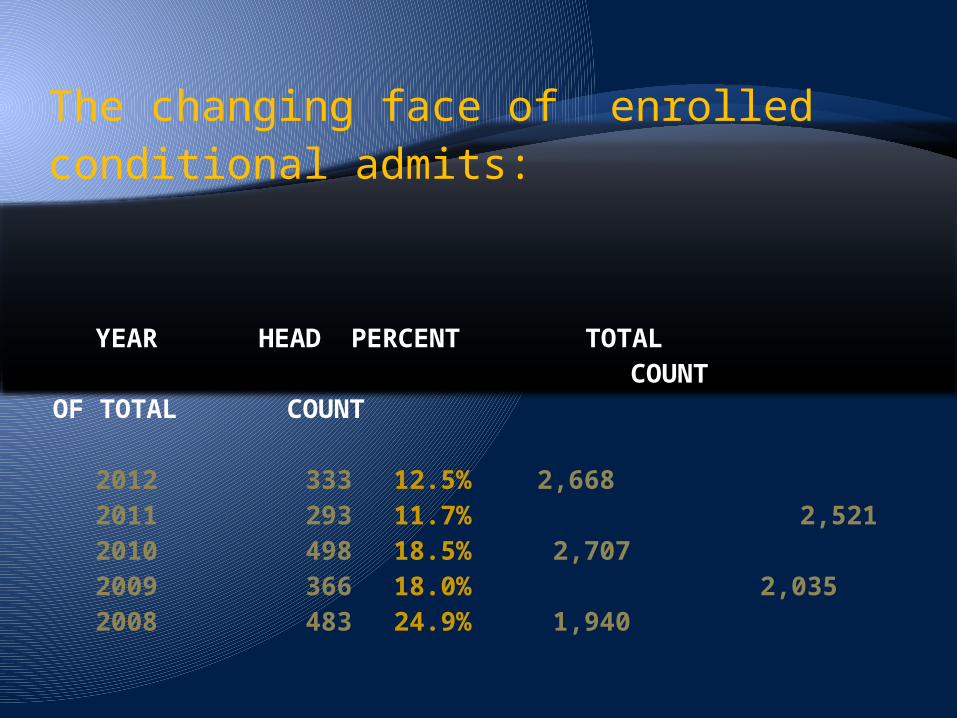
YEAR HEAD PERCENT TOTAL COUNT OF TOTAL COUNT
2012 333 12.5% 2,6682011 293 11.7% 2,5212010 498 18.5% 2,7072009 366 18.0% 2,0352008 483 24.9% 1,940
The changing face of enrolled conditional admits:
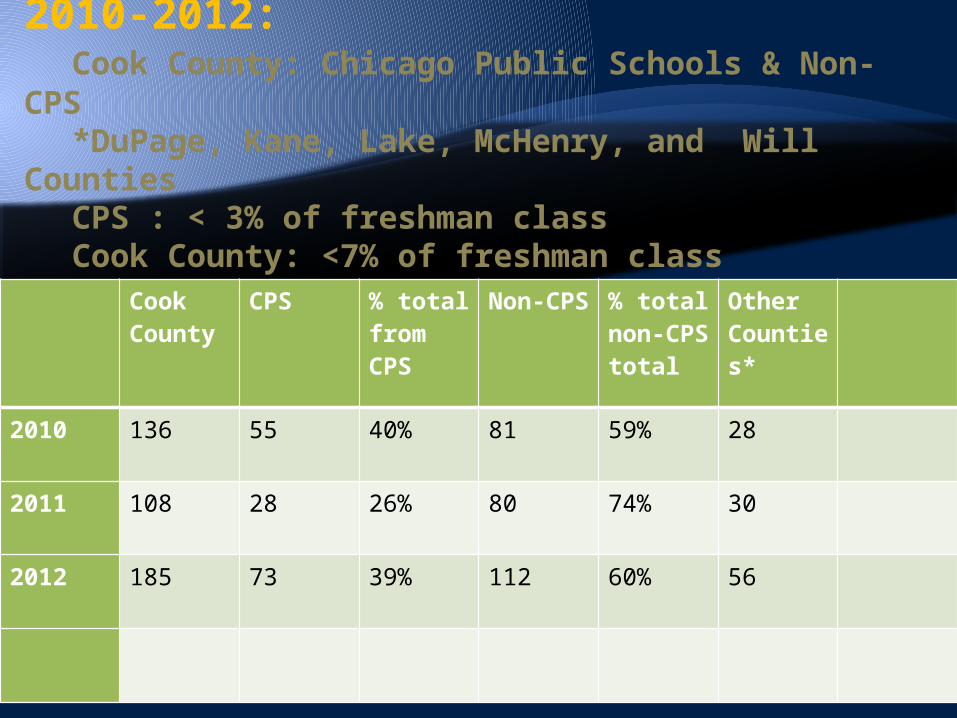
Chicago metro enrolled students 2010-2012:
Cook County: Chicago Public Schools & Non-CPS
*DuPage, Kane, Lake, McHenry, and Will Counties
CPS : < 3% of freshman classCook County: <7% of freshman classCookCounty
CPS % total from CPS
Non-CPS
% total non-CPS total
Other Counties*
2010 136 55 40% 81 59% 28
2011 108 28 26% 80 74% 30
2012 185 73 39% 112 60% 56
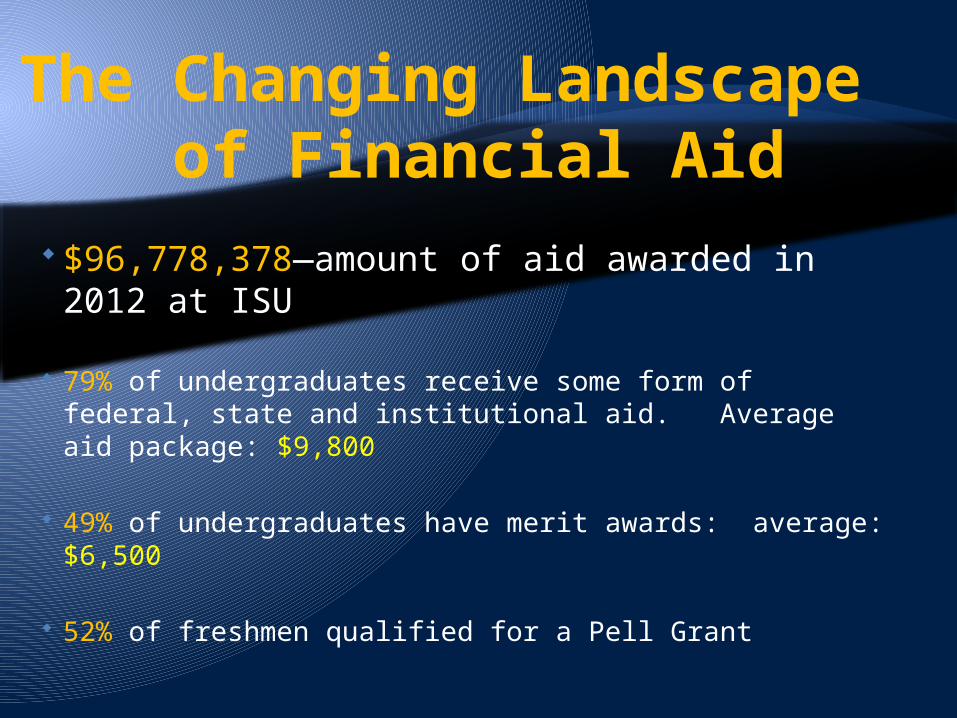
The Changing Landscape of Financial Aid
$96,778,378—amount of aid awarded in 2012 at ISU
79% of undergraduates receive some form of federal, state and institutional aid. Average aid package: $9,800
49% of undergraduates have merit awards: average: $6,500
52% of freshmen qualified for a Pell Grant
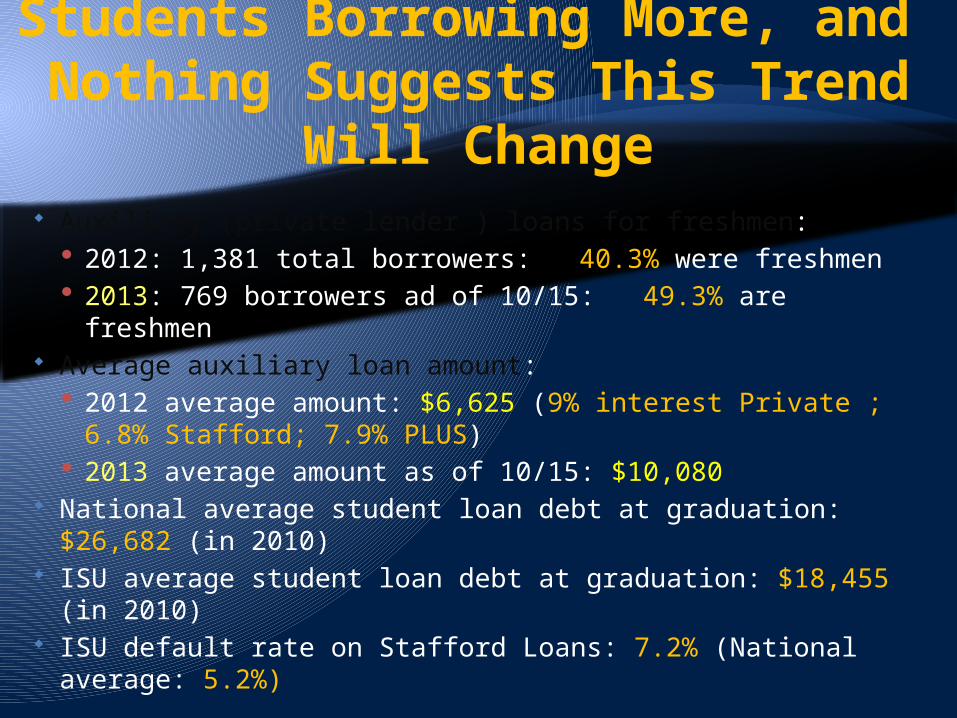
Students Borrowing More, and Nothing Suggests This Trend
Will Change Auxiliary (private lender ) loans for freshmen:
2012: 1,381 total borrowers: 40.3% were freshmen 2013: 769 borrowers ad of 10/15: 49.3% are freshmen
Average auxiliary loan amount: 2012 average amount: $6,625 (9% interest Private ;
6.8% Stafford; 7.9% PLUS) 2013 average amount as of 10/15: $10,080
National average student loan debt at graduation: $26,682 (in 2010)
ISU average student loan debt at graduation: $18,455 (in 2010)
ISU default rate on Stafford Loans: 7.2% (National average: 5.2%)
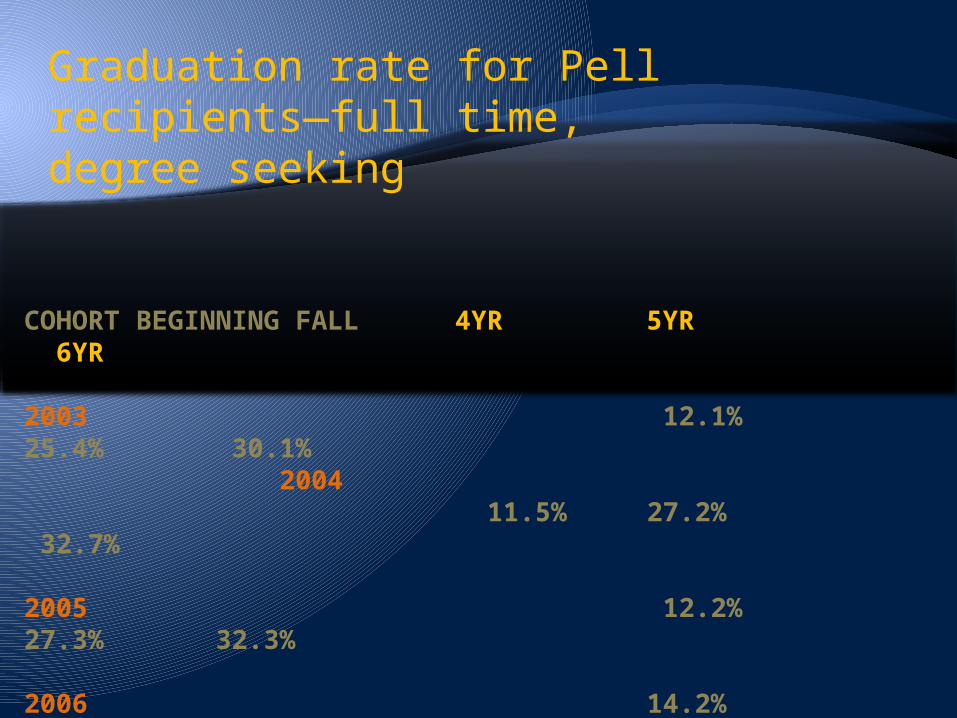
COHORT BEGINNING FALL 4YR 5YR 6YR 2003 12.1% 25.4% 30.1% 2004 11.5% 27.2% 32.7% 2005 12.2% 27.3% 32.3% 2006 14.2% 28.3% 33.8%
Graduation rate for Pell recipients—full time, degree seeking
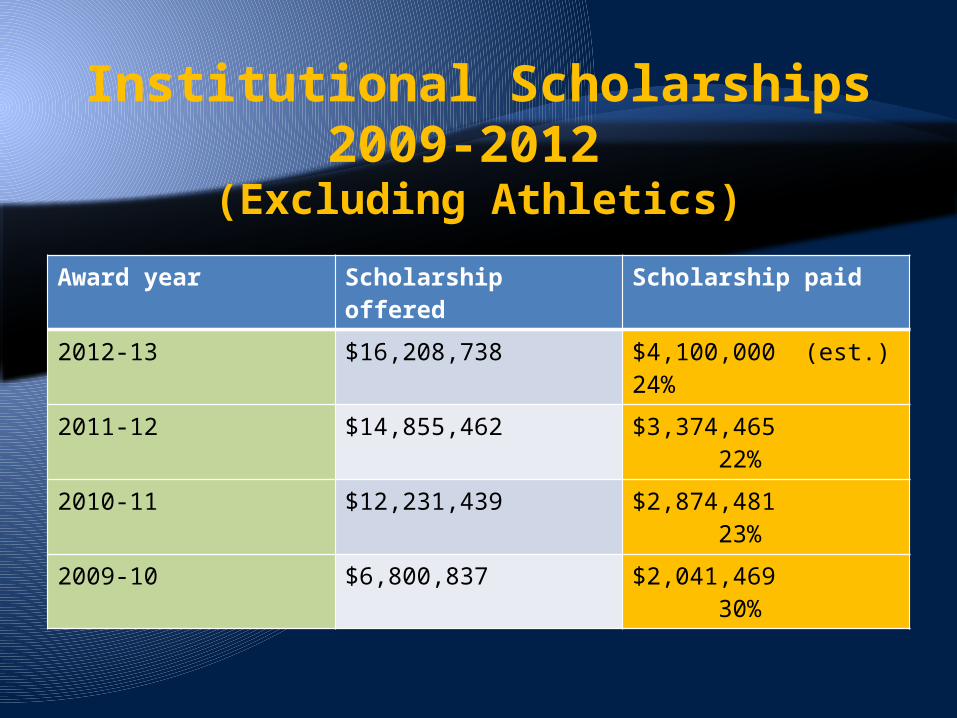
Institutional Scholarships2009-2012
(Excluding Athletics)
Award year Scholarship offered Scholarship paid
2012-13 $16,208,738 $4,100,000 (est.) 24%
2011-12 $14,855,462 $3,374,465 22%
2010-11 $12,231,439 $2,874,481 23%
2009-10 $6,800,837 $2,041,469 30%
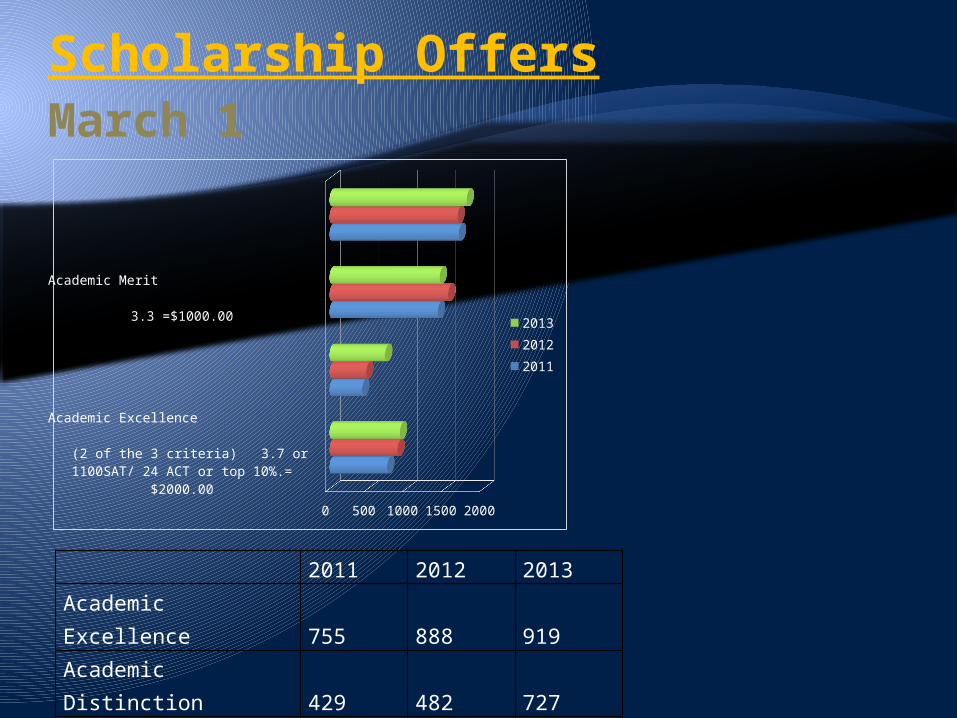
Scholarship OffersMarch 1
Academic Excellence (2 of the 3 criteria) 3.7 or 1100SAT/
24 ACT or top 10%.= $2000.00
Academic Distinction 3.5, 1000 SAT or 22 ACT=$1500.00
Academic Merit 3.3 =$1000.00
Academic Achievement 3.0 =$500.00
0 500 100015002000
201320122011
2011 2012 2013Academic Excellence 755 888 919Academic Distinction 429 482 727Academic Merit 1413 1548 1437Academic Achievement 1685 1669 1788
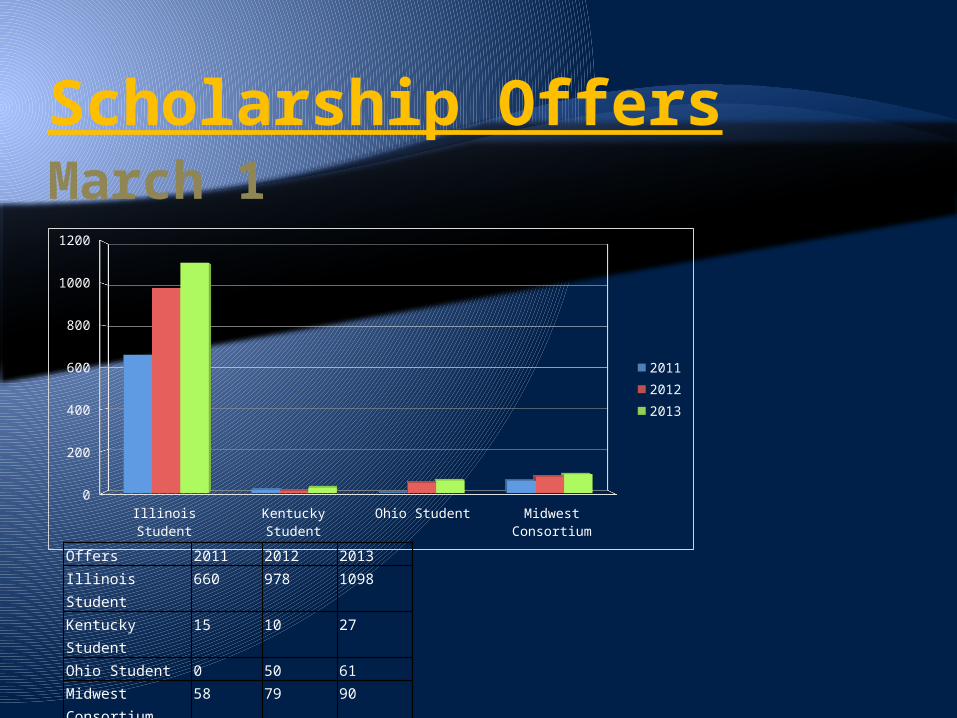
Scholarship OffersMarch 1
Illinois Student Kentucky Student Ohio Student Midwest Consortium0
200
400
600
800
1000
1200
201120122013
Offers 2011 2012 2013Illinois Student 660 978 1098Kentucky Student
15 10 27
Ohio Student 0 50 61Midwest Consortium
58 79 90
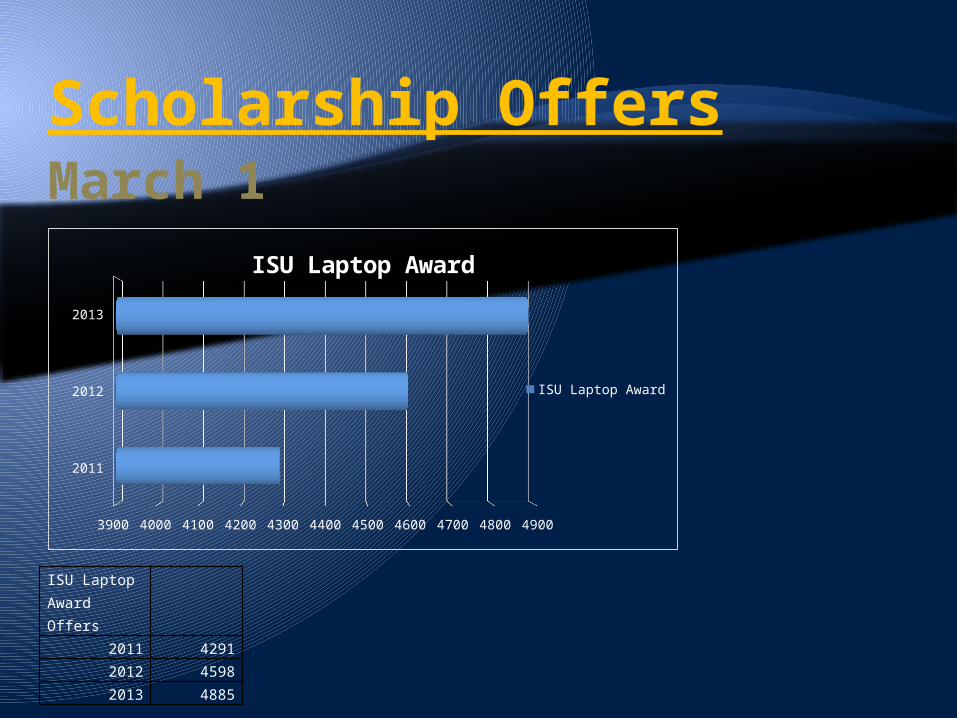
Scholarship OffersMarch 1
2011
2012
2013
3900 4000 4100 4200 4300 4400 4500 4600 4700 4800 4900
ISU Laptop Award
ISU Laptop Award
ISU Laptop Award Offers
2011 4291
2012 4598
2013 4885
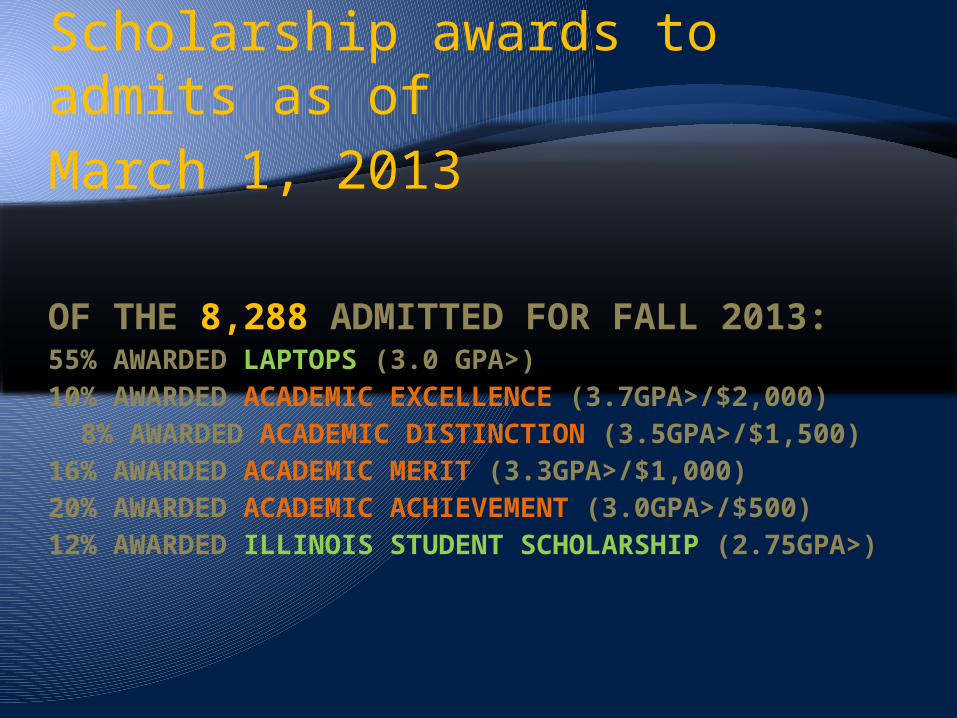
OF THE 8,288 ADMITTED FOR FALL 2013:55% AWARDED LAPTOPS (3.0 GPA>)10% AWARDED ACADEMIC EXCELLENCE (3.7GPA>/$2,000) 8% AWARDED ACADEMIC DISTINCTION (3.5GPA>/$1,500)16% AWARDED ACADEMIC MERIT (3.3GPA>/$1,000)20% AWARDED ACADEMIC ACHIEVEMENT (3.0GPA>/$500)12% AWARDED ILLINOIS STUDENT SCHOLARSHIP (2.75GPA>)
Scholarship awards to admits as of March 1, 2013
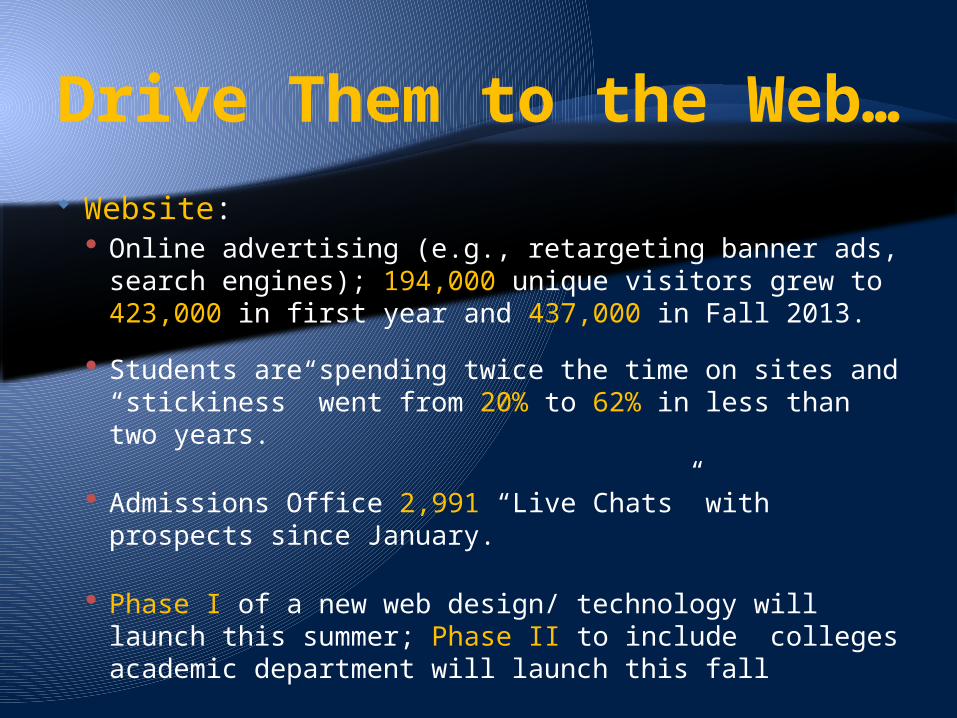
Drive Them to the Web… Website:
Online advertising (e.g., retargeting banner ads, search engines); 194,000 unique visitors grew to 423,000 in first year and 437,000 in Fall 2013.
Students are spending twice the time on sites and “stickiness” went from 20% to 62% in less than two years.
Admissions Office 2,991 “Live Chats” with prospects since January.
Phase I of a new web design/ technology will launch this summer; Phase II to include colleges academic department will launch this fall
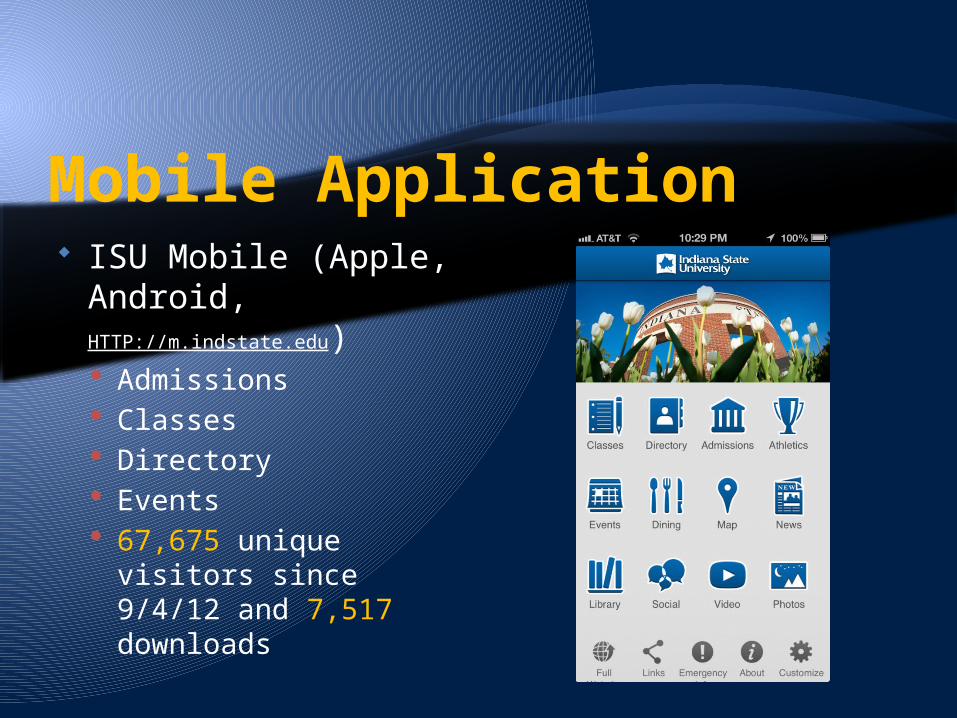
Mobile Application ISU Mobile (Apple,
Android, HTTP://m.indstate.edu) Admissions Classes Directory Events 67,675 unique
visitors since 9/4/12 and 7,517 downloads
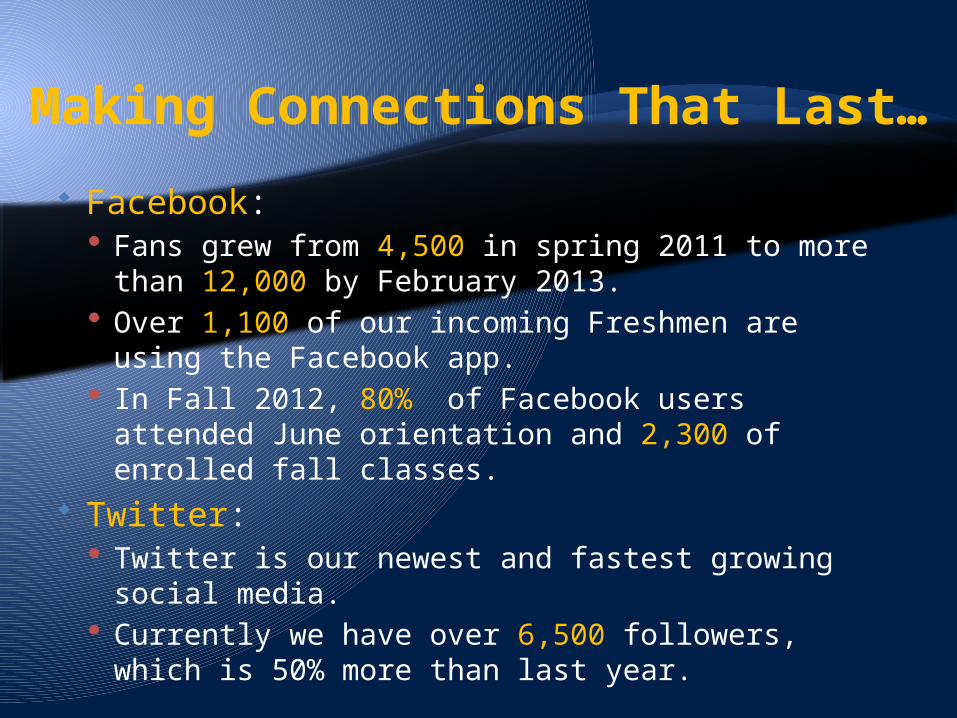
Making Connections That Last…
Facebook: Fans grew from 4,500 in spring 2011 to more than
12,000 by February 2013. Over 1,100 of our incoming Freshmen are using
the Facebook app. In Fall 2012, 80% of Facebook users attended
June orientation and 2,300 of enrolled fall classes. Twitter:
Twitter is our newest and fastest growing social media.
Currently we have over 6,500 followers, which is 50% more than last year.
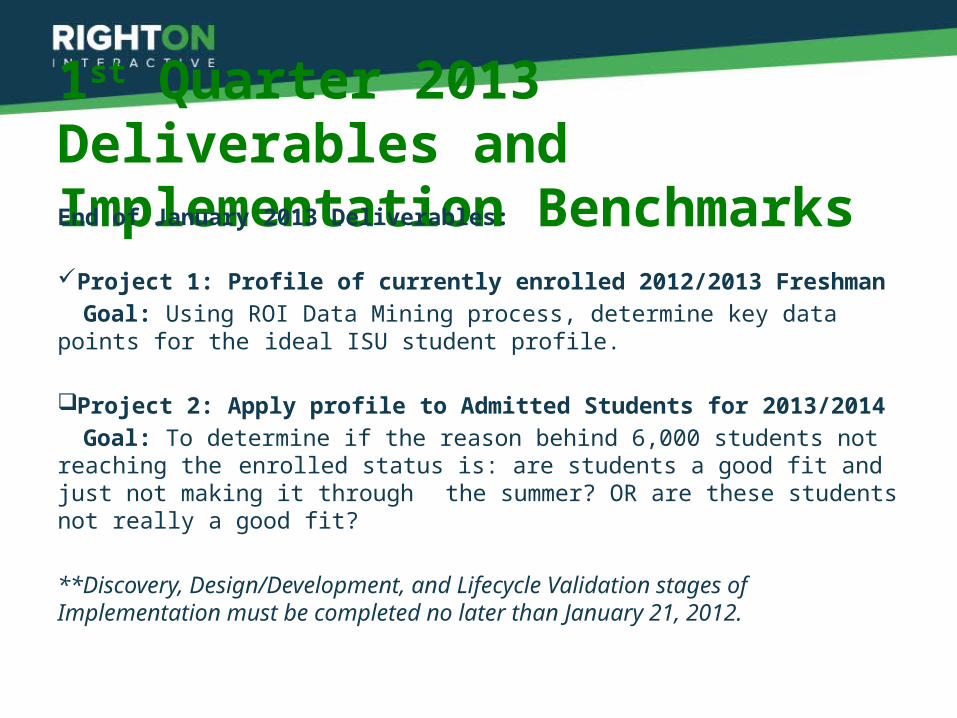
1st Quarter 2013 Deliverables and Implementation Benchmarks End of January 2013 Deliverables: Project 1: Profile of currently enrolled 2012/2013 Freshman
Goal: Using ROI Data Mining process, determine key data points for the ideal ISU student profile. Project 2: Apply profile to Admitted Students for 2013/2014
Goal: To determine if the reason behind 6,000 students not reaching the enrolled status is: are students a good fit and just not making it through the summer? OR are these students not really a good fit?
**Discovery, Design/Development, and Lifecycle Validation stages of Implementation must be completed no later than January 21, 2012.
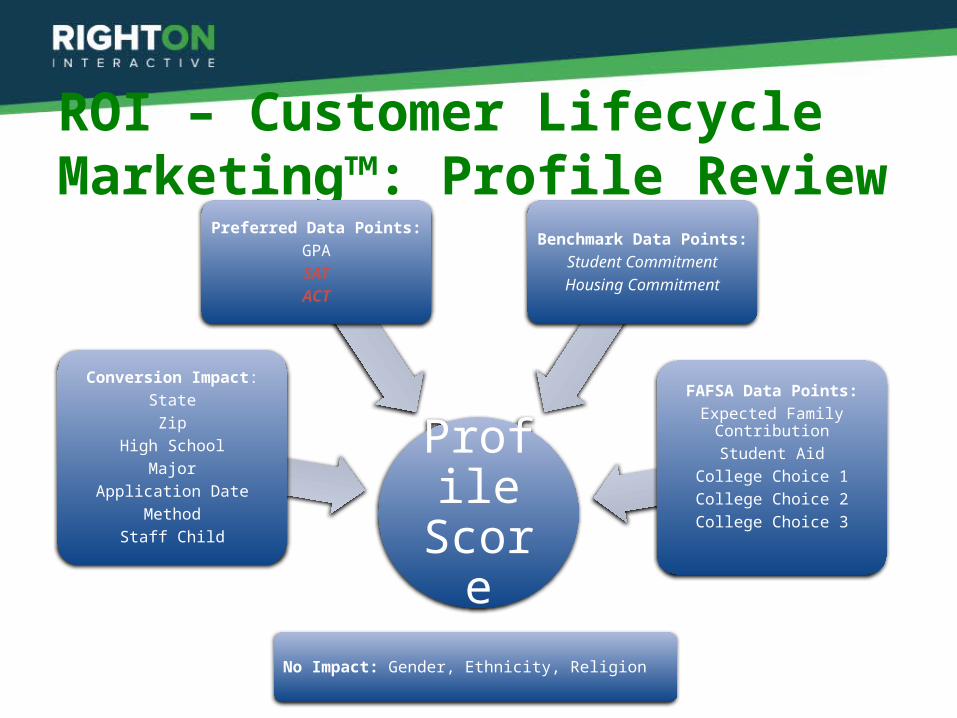
ROI – Customer Lifecycle Marketing™: Profile Review
Profile Score
No Impact: Gender, Ethnicity, Religion
Conversion Impact:StateZip
High SchoolMajor
Application DateMethod
Staff Child
Preferred Data Points:GPASATACT
Benchmark Data Points:
Student CommitmentHousing Commitment
FAFSA Data Points:Expected Family
ContributionStudent Aid
College Choice 1College Choice 2College Choice 3
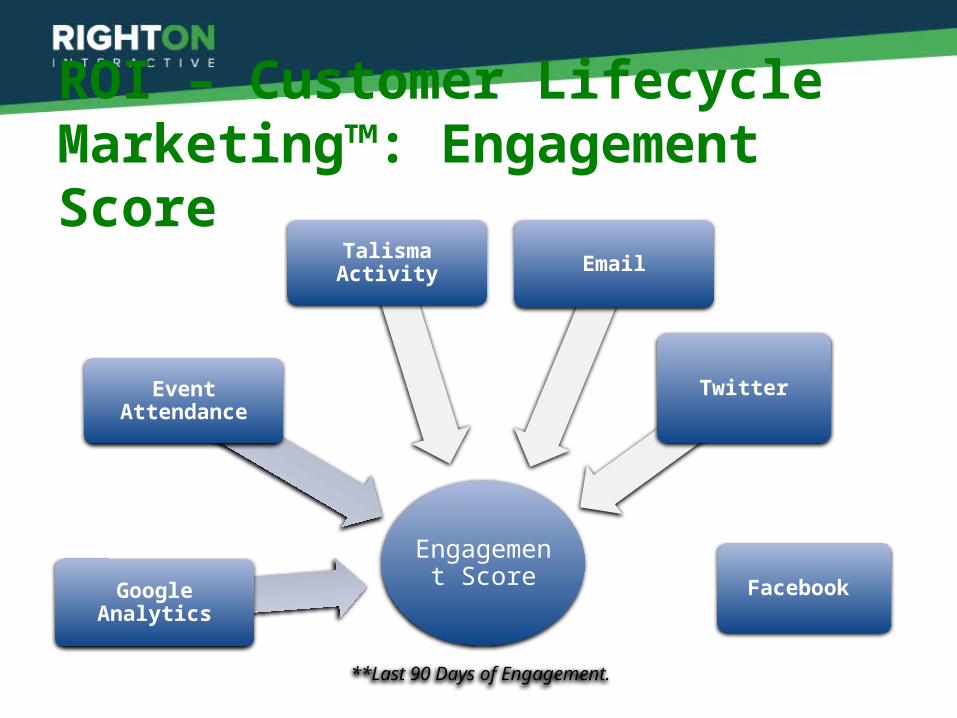
ROI – Customer Lifecycle Marketing™: Engagement Score
Engagement Score
**Last 90 Days of Engagement.
Google Analytics
Event Attendance
Talisma Activity Email
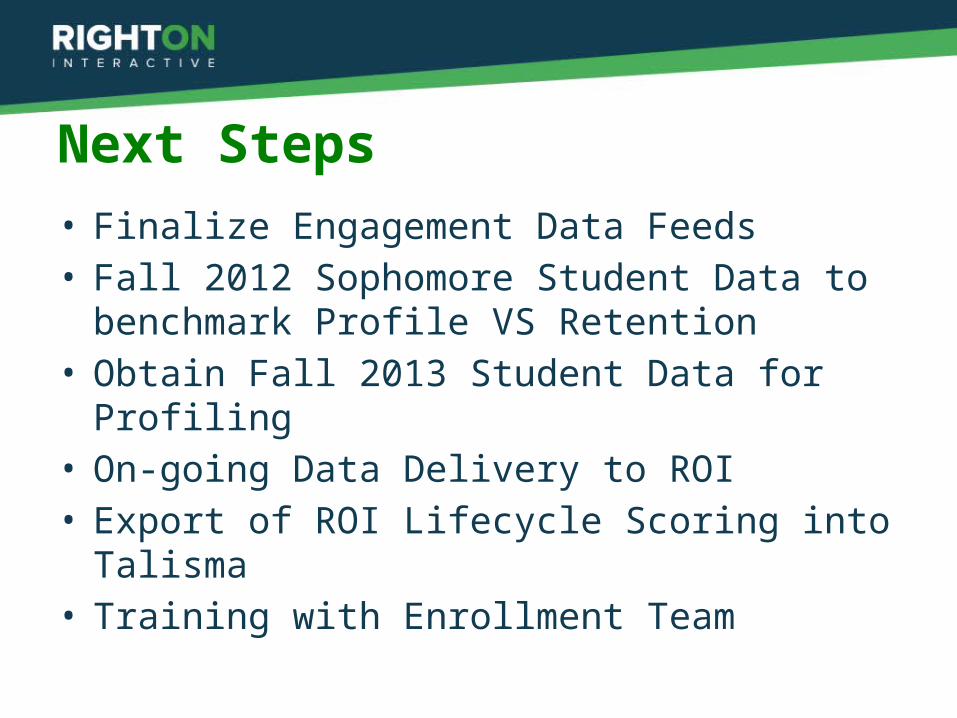
Next Steps• Finalize Engagement Data Feeds• Fall 2012 Sophomore Student Data to benchmark Profile VS Retention
• Obtain Fall 2013 Student Data for Profiling• On-going Data Delivery to ROI• Export of ROI Lifecycle Scoring into Talisma• Training with Enrollment Team

Conversation…
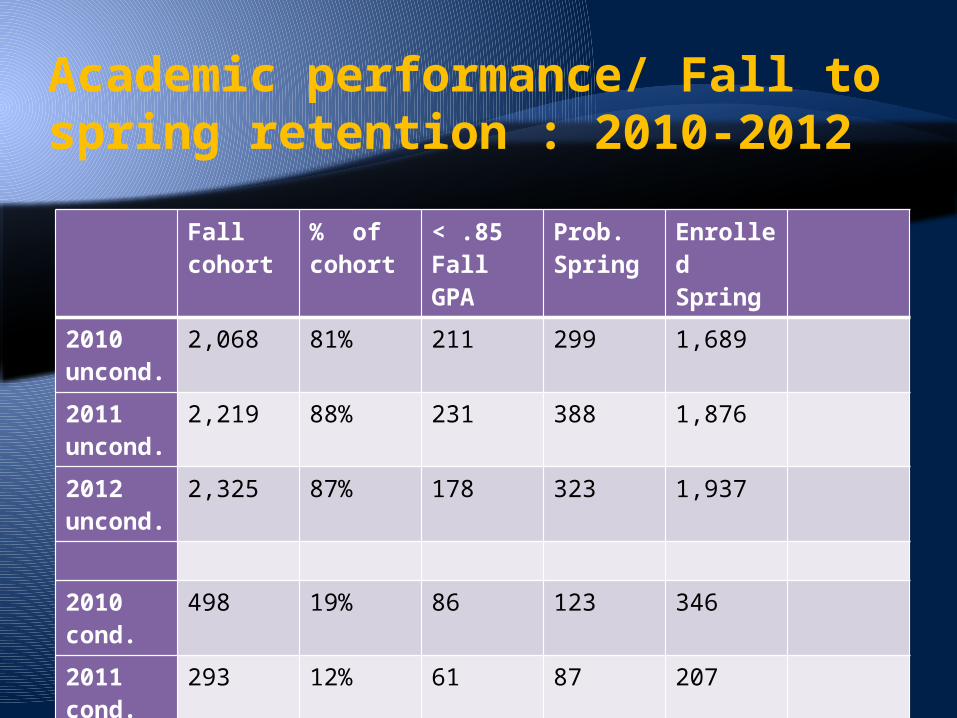
Academic performance/ Fall to spring retention : 2010-2012
Fall cohort
% of cohort
< .85 Fall GPA
Prob. Spring
Enrolled Spring
2010 uncond.
2,068 81% 211 299 1,689
2011 uncond.
2,219 88% 231 388 1,876
2012 uncond.
2,325 87% 178 323 1,937
2010 cond.
498 19% 86 123 346
2011 cond.
293 12% 61 87 207
2012 cond.
333 13% 34 93 265