Embed Size (px)
Citation preview
EFFECTS OF ANTIBIOTICS AND HORMONES ON ELECTRICITY
GENERATION USING MICROBIAL FUEL CELLS
Ph.D. Thesis by
Sevil AKTAN
JUNE 2011
ISTANBUL TECHNICAL UNIVERSITY INSTITUTE OF SCIENCE AND TECHNOLOGY
Department : Environmental Engineering
Programme : Environmental Biotechnology


EFFECTS OF ANTIBIOTICS AND HORMONES ON ELECTRICITY
GENERATION USING MICROBIAL FUEL CELLS
Ph.D. Thesis by
Sevil AKTAN
(501042802)
Date of Submision : 9 February 2011
Date of Defence Examination : 3 June 2011
Thesis Supervisor :
Co-Supervisor :
Prof. Dr. Emine UBAY ÇOKGÖR (ITU)
Prof. Dr. Fahrettin GÜCĠN (FU)
Members of the Examining Committee : Prof. Dr. Orhan ĠNCE (ITU)
Prof. Dr. Ġzzet ÖZTÜRK (ITU)
Yrd. Doç. Dr. M. Burcu IRMAK
YAZICIOĞLU (HU)
Doç. Dr. Bülent MERTOĞLU (MU)
Yrd. Doç. Dr. Mahmut ALTINBAġ (ITU)
JUNE 2011
ISTANBUL TECHNICAL UNIVERSITY INSTITUTE OF SCIENCE AND TECHNOLOGY


ĠSTANBUL TEKNĠK ÜNĠVERSĠTESĠ FEN BĠLĠMLERĠ ENSTĠTÜSÜ
MĠKROBĠYAL YAKIT HÜCRELERĠNDE KULLANILAN ANTĠBĠYOTĠK
VE HORMONLARIN ELEKTRĠK ÜRETĠMĠ ÜZERĠNE ETKĠLERĠ
DOKTORA TEZĠ
Sevil AKTAN
(501042802)
Tezin Enstitüye Verildiği Tarih : 9 ġubat 2011
Tezin Savunulduğu Tarih : 3 Haziran 2011
Tez DanıĢmanı:
EĢ DanıĢman :
Prof. Dr. Emine UBAY ÇOKGÖR (ĠTÜ)
Prof. Dr. Fahrettin GÜCĠN (FÜ)
Diğer Jüri Üyeleri : Prof. Dr. Orhan ĠNCE (ĠTÜ)
Prof. Dr. Ġzzet ÖZTÜRK (ĠTÜ)
Yrd. Doç. Dr. M. Burcu IRMAK
YAZICIOĞLU (HÜ)
Doç. Dr. Bülent MERTOĞLU (MÜ)
Yrd. Doç. Dr. Mahmut ALTINBAġ (ĠTÜ)
HAZĠRAN 2011


v
FOREWORD
I would like to express my deep appreciation to my dissertation advisor, Prof. Dr.
Emine Ubay Çokgör. I would like to thank to her for the scientific guidance and
encouragement. I would also like to thank to her for making me feel free to call every
time. I would like to thank my co-advisor, Prof. Dr. Fahrettin Gücin. I will always
grateful to him for his support, understanding and guidance during the project.
Many thanks to committee members, Prof. Dr. Orhan İnce and Prof Dr. İzzet Öztürk,
Asistant Prof. Dr. Burcu Irmak Yazıcıoğlu, Associate Prof. Dr. Bülent Mertoğlu and
Asistant Prof. Dr. Mahmut Altınbaş for their contributions and for their time spent to
read the reports and thesis. Thanks to Prof. Dr. Ayhan Bozkurt and Associate Prof.
Dr. Nurullah Arslan for their guidance and help during this study. I would like to
thank Prof Dr. Ali Ata (Gebze Institute of Technology) for provide electrodes.
I would like to express my deep appreciation to Associate Prof. Dr. Barış Çallı for
his scientific guidance and help. I am also grateful to Assistant Prof. Dr. İrem Uzonur
and Assistant Prof. Dr. Ayşe İnci İşli for her help and friendship. Special thanks to
Elif Banu Gençsoy, Cemile Ümran Ceylan, Işılay Ulusoy, Pelin Çavdar and Elif
Yılmaz for their help during the thesis.
The financial support of this study by the Turkish State Planning Organization
(DPT), ITU Scientific Research Project Unit and Fatih University Scientific
Research Project Unit was gratefully acknowledged.
I am greateful to my all family, especially my mother and father, my brothers and
their wifes and chidren, my aunts for their love, patience, pray and supporting me
during this study.
I dedicate this thesis to my dear mother and my nephews Yavuz Selim Aktan,
Mehmet Akif Aktan and my niece Serra Aktan.
3 JUNE 2011
Sevil AKTAN
Environmental Biotechnology

vi
vii
TABLE OF CONTENTS Page
FOREWORD .............................................................................................................. v TABLE OF CONTENTS ......................................................................................... vii
ABBREVIATIONS .................................................................................................. xi LIST OF TABLES .................................................................................................. xiii
LIST OF FIGURE ................................................................................................... xv
1. INTRODUCTION .................................................................................................. 1 1.1 Meaning and Significance of the Thesis .......................................................................... 1 1.2 Aim and scope .................................................................................................................... 1
2. LITERATURE SURVEY ...................................................................................... 3 2.1 Definition of microbial fuel cell ........................................................................................ 3
2.2 Mediator Microbial Fuel Cell ........................................................................................... 4 2.3 Mediator-less Microbial Fuel Cell .................................................................................... 5
2.4 How do Microbial Fuel Cells work? ................................................................................ 6 2.5 Types of Microbial Fuel Cell (MFC) ............................................................................... 8
2.5.1 Two-chambered MFC ................................................................................. 8
2.5.2 Single Chambered MFC (SCMFC) ............................................................. 9
2.5.3 Stacked Microbial Fuel Cell ...................................................................... 11
2.6 Factors of performance of Microbial Fuel Cell ............................................................. 12
2.6.1 Effects of electrode materials .................................................................... 12
2.6.1.1 Anode materials .................................................................................. 13
2.6.1.2 Cathode materials ............................................................................... 13
2.6.2 Effects of operating conditions ................................................................. 14
2.6.2.1 Anodic chamber ................................................................................. 14
2.6.2.2 Cathodic chamber ............................................................................... 14
2.6.2.3 Effects of PEM (Proton Exchange Membrane) .................................. 15
2.6.2.4 Effects of ionic strength, anode-cathode distance and temperature ....... 15
2.7 Fundamentals of voltage generation .............................................................................. 16 2.7.1 Anode potential ......................................................................................... 20
2.7.2 Cathode Potential ...................................................................................... 20
2.8 Fundamentals of power generation ................................................................................ 21 2.8.1 Power output normalized by surface area ................................................. 22
2.8.2 Power output normalized by volume ........................................................ 22
2.9 Coulombic Efficiency ...................................................................................................... 22 2.10 Ohmic, activation, bacterial metabolic and mass trasport losses of MFCs .............. 23 2.11 Properties of genus Shewanella .................................................................................... 25 2.12 Performance of the MFCs ............................................................................................. 28 2.13 Uses of microbial fuel cells ........................................................................................... 32

viii
2.13.1 Electricity generation............................................................................... 32
2.13.2 Wastewater treatment .............................................................................. 33
2.13.3 Biosensor ................................................................................................. 34
2.14 Xenobiotics in aquatic environment ............................................................................ 35
2.14.1 Antibiotics in Aquatic Environment ........................................................ 37
2.14.1.1 Source ............................................................................................... 37
2.14.1.2 Modes of Action ............................................................................... 38
2.14.1.3 Occurence ......................................................................................... 41
2.14.1.4 Elimination (Fate) ............................................................................. 42
2.14.1.5 Effects ............................................................................................... 44
2.14.2 Estrogens (Hormones) in Aquatic Environment ..................................... 47
2.14.2.1 Sources ............................................................................................. 48
2.14.2.2 Occurence and elimination (fate) ..................................................... 49
2.14.2.3 Effects ............................................................................................... 56
3. MATERIALS AND METHODS ......................................................................... 59 3.1 Pure culture (Shewanella Putrefaciens) and two chambered MFC experiments ..... 59
3.1.1 Two chambered MFC ................................................................................ 59
3.1.2 Electrode Materials For Two Chambered MFC ........................................ 59
3.1.3 Medium for Aerobic and Anoxic Growth of Shewanella Putrefaciens .... 59
3.2 Mixed culture in Single Chambered Microbial Fuel Cell ............................................ 63
3.2.1 Construction of Single Chambered Flat-1-Microbial Fuel Cell (SCF-1-
MFC) ..................................................................................................... 63
3.2.2 Construction of Single Chambered Tubular MFC (SCTMFC) ................. 63
3.2.3 Construction of Single Chambered Flat-2-Microbial Fuel Cell (SCF-2-
MFC) ..................................................................................................... 64
3.3 Inoculum of SCF-1-MFC, SCTMFC and SCF-2-MFC. ............................................. 65
3.4 Medium of SCF-1-MFC, SCTMFC and SCF-2-MFC ............................................... 66
3.5 Antibiotics and hormones ................................................................................................ 67
3.6 Electrochemical Measurement (Voltage and Current Measurements of the MFC) .. 67 3.7 Calculation of current and coulombic efficiency for experiments of antibiotics and
hormones. .................................................................................................................... 68 3.8 Chemical Analysis ........................................................................................................... 68
3.8.1 Sampling and COD analysis ...................................................................... 68
3.8.2 pH measurement ........................................................................................ 68
3.9 Scanning electron micrograph (SEM) Analysis ............................................................ 68
4. RESULTS AND DISCUSSION ........................................................................... 69 4.1 Experiments with Shewanella Putrefaciens .................................................................. 69
4.1.1 Growth curves of Shewanella Putrefaciens .............................................. 69
4.1.2 Open circuit voltage of anoxically grown Shewanella putrefaciens in two
chambered MFC .................................................................................... 73
4.1.3 Open circuit voltage of aerobically grown Shewanella Putrefaciens ....... 76
4.1.4 Power generation of two chambered MFC ............................................... 77

ix
4.1.5 Open circuit voltage from two chambered MFC (addition influent
wastewater of brewery industry using S.putrefaciens) ......................... 77
4.2 Experiments with mixed culture using single chambered flat-1-MFC ....................... 77
4.2.1 Comparison of currents using different external resistance in single
chambered flat-1- MFC ........................................................................ 77
4.3 Scanning electron micrograph (SEM) analysis ............................................................. 80
4.4 Voltage measurement using mixed culture microorganisms for single chambered
flat-2-MFC ................................................................................................................... 81 4.4.1 Carbon cloth cathode containing 1 mg/cm2 platinum .............................. 81
4.4.2 Activated carbon cloth cathode ................................................................. 82
4.5 Antibiotic and Hormone Experiments for SCF-2-MFC .............................................. 83 4.5.1 Acetate only feeding .................................................................................. 83
4.5.2 Antibiotics ................................................................................................. 83
4.5.2.1 Erytromicin (ERY) Antibiotic ............................................................ 84
4.5.2.2 Sulfamethoxazole (SMX) Antibiotic ................................................. 86
4.5.2.3 Tetracycline (TC or TETRA) antibiotic ............................................. 89
4.5.3 Estrogens (Hormones) ............................................................................... 93
4.5.3.1 Estrone (E1) Hormone ....................................................................... 93
4.5.3.2 17 β-Estradiol (E2) hormone .............................................................. 96
4.5.3.3 Estriol (E3) hormone .......................................................................... 99
4.5.3.4 17-α Ethinylestradiol(EE2) .............................................................. 102
5. CONCLUSION ................................................................................................... 105 REFERENCES ....................................................................................................... 109
CURRICULUM VITAE ........................................................................................ 119

x

xi
ABBREVIATIONS
A : Ampere
be : The number of electrons exchanged per mole of oxygen
BOD : Biochemical Oxygen Demand (mg/L)
C : Coulomb which is determined by the number of electron exchange in
the reaction
CE : Coulombic Efficiency (%)
CEM : Cation Exchange Membrane
COD : Chemical Oxygen Demand (mg/L)
DO : Dissolved Oxygen concentration (mg/L)
E0
: The standard cell electromotive force(Volt)
Ecell : Cell Voltage(Volt)
Eemf : : The maximum Electromotive Force(Volt)
E1 : Estrone
E2 : 17 β-Estradiol
E3 : Estriol
EE2 : 17-α Ethinylestradiol
ERY : Erytromycin
F : Faraday’s constant(C/mol)
G : Gibbs Free Energy
I : Current (ampere)
IUPAC : International Union of Pure and Applied Chemistry
M : The molecular weight (g/mol)
mA : Milliamper
mL : Milliliter
mM : Milimolar
MFC : Microbial Fuel Cell
n : The number of electrons per reaction mol
NHE : Normal Hydrogen Electrode
OCV : Open-Circuit Voltage (Volt)
P : Power (Watt)
Pt : Platinum
PC : Polarization Curve
PEM : Proton Exchange Membrane
R : The universal gas constant (Joule/ rnol / K )
Rex : External Resistance(ohm,)
Rin : Internal Resistance (ohm, )
RVC : Reticulated Vitreous Carbon
SCF-1-MFC : Single Chamber Flat-1-Microbial Fuel Cell
SCF-2-MFC : Single Chamber Flat-2-Microbial Fuel Cell
SCT-MFC : Single Chamber Tubular Microbial Fuel Cell
SMX : Sulfamethoxazole
SHE : Standart Hydrogen Electrode
TC : Tetracycline

xii
TCMFC :Two chambered microbial fuel cells
V : Voltage (Volt)
L : mikroliter

xiii
LIST OF TABLES Page
Table 2.1: Anode and Cathode potentials for different anodic and cathodic reactions.
E/ or E
0/ values are adjusted for pH=7 at 298 K except as indicated ......... 19
Table 2.2: The measure of current and power generation for different pure cultures,
compound, electrodes, with or without mediator in literature ................... 25 Table 2.3: Different substrates used in MFCs and the maximum current produced . 30
Table 2.4: MSDS table for erythromycin, sulfomethoxazole and tetracycline ......... 40 Table 4.1: MFC performance by ERY addition ........................................................ 85 Table 4.2: MFC performance by SMX addition ....................................................... 87 Table 4.3: MFC performance by TC addition ........................................................... 90 Table 4.4: MFC performance by E1 addition ........................................................... 94
Table 4.5: MFC performance by E2 addition ........................................................... 97 Table 4.6: MFC performance by E3 addition ......................................................... 100 Table 4.7: MFC performance by EE2 addition ....................................................... 103

xiv
xv
LIST OF FIGURE Page
Figure 2.1: Schematic diagram of a typical two-chambered (A) and single-
chambered (B) microbial fuel cells ........................................................... 4 Figure 2.2: Model for various compounds serving as electron shuttles between a
bioelectrochemically active microorganism and the anode ...................... 5 Figure 2.3: Summary of components proposed to be involved in the electron
transport from cells to the anode in MFCs using metal reducing
microorganisms (Geobacter species) (Figure drawn with modifications
after Lovley et al., 2004). .......................................................................... 6 Figure 2.4: Respiratory chain shows how the voltage that could be recovered in a
microbial fuel cell (MFC) is dependent on where electrons exit the chain
of respiratory enzymes (Logan and Regan, 2006) .................................... 8 Figure 2.5: Example of an H-type microbial fuel cell ................................................ 9 Figure 2.6: Schematics of a cylindrical SC-MFC containing eight graphite rods as an
anode in a concentric arrangement surrounding a single cathode. ((A)
drawn with modifications after Liu et al., 2004. (B) drawn to illustrate a
photo in Liu et al., 2004.) (C) Photo of laboratory-scale prototype of the
SCMFC used to generate electricity from wastewater ............................ 10
Figure 2.7: (a) A schematic and (b) a photograph of a single-chamber microbial fuel
cell. The cathode is exposed to air on one side and the solution
containing the biodegradable substrate is on the other side. The anode
chamber containing the exoelectrogenic bacteria is sealed off from
oxygen (Logan and Regan 2006) ............................................................ 11 Figure 2.8: Stacked MFCs consisting of six individual units with granular graphite
anode (They are joined in one reactor block ( drawn to illustrate a photo
in Aelterman et al.,2006). ........................................................................ 12 Figure 2.9: Pathway of environmental exposure to drugs consumed in human and
veterinary medicine (illustrated from Diaz-Cruz et al., 2003) ................ 37 Figure 2.10: Modes of action of some antibiotics ..................................................... 39
Figure 2.11: The structure of a)17 beta Estradiol b)Estrone c)17 alpha
Ethynylestradiol d) Estriol ...................................................................... 48
Figure 3.1: Sartorios Certomat IS cooling rotary shaker .......................................... 60 Figure 3.2: Controlled Atmosphere Chamber(PLAS LABS USA) .......................... 60 Figure 3.3: Anoxically growth of S.putrefaciens in Atmosphere Controlled
Chamber .................................................................................................. 61 Figure 3.4: Hettich Rotina 420 R Centrifuge ............................................................ 61
Figure 3.5: Used two chambered MFC in this study ................................................ 62 Figure 3.6: Used single chambered Flat-1-MFC in this study .................................. 63 Figure 3.7: Single Chambered Tubular MFC ........................................................... 64 Figure 3.8: Photographs of anode side (front), cathode side (back) and side of SCF-2-
MFC ......................................................................................................... 65
Figure 3.9: Photograph of SCF-2-MFC connecting multimeter system ................... 65
Figure 4.1: Aerobic Growth Curve of S.putrefaciens ............................................... 69 Figure 4.2: Photograph of S.putrefaciens colonies at different dilution on LB agar 70

xvi
Figure 4.3: Viability Curve of S.putrefaciens ........................................................... 70 Figure 4.4: Comparison of S.putrefaciens Growth Curve in single-double-triple
strenght LB(MILLER) broth ................................................................... 71 Figure 4.5: Comparison of S.putrefacience Viability Curve in single-double-triple
strenght LB (MILLER) broth ................................................................. 72 Figure 4.6: Comparison of S.putrefaciens growth curve in different amount of pure
culture ...................................................................................................... 72 Figure 4.7: Comparison of S.putrefacience viability curve in single-double amount
of pure culture ......................................................................................... 72
Figure 4.8: Open Circuit Voltage (OCV) from two chambered MFC containing
S.putrefaciens (addition of 10 mM acetate and 1250 ml S.putrefaciens)
................................................................................................................. 73
Figure 4.9: Open Circuit Voltage (OCV) from two chambered MFC containing
S.putrefaciens (addition of 10 mM acetate-3750 ml S.putrefaciens) ...... 73 Figure 4.10: Open Circuit Voltage (OCV) development from two chambered MFC
containing S.putrefaciens (addition of 10mM glucose-2500 ml culture)
................................................................................................................. 74 Figure 4.11: Open Circuit Potential (OCP) development from two chambered MFC
containing S.putrefaciens (addition of 10mM glucose for 800 ml.culture
................................................................................................................. 74
Figure 4.12: Open Circuit Voltage (OCV) from two chambered MFC containing
S.putrefaciens (addition of 10mM glucose for 1250 ml culture). .......... 75
Figure 4.13: Open Circuit Voltage (OCV) from two chambered MFC containing
S.putrefaciens (addition of 10 mM ethanol) ........................................... 75
Figure 4.14: Open Circuit Potential (OCP) development from two chambered MFC
containing S.putrefaciens (addition of 1 mM propionic acid). ............... 76
Figure 4.15: Potential development from two chambered MFC containing
aerobically growth of S.putrefaciens (addition of 10mM glucose) ......... 76 Figure 4.16: Potential development from two chambered MFC containing influent
ww from brewery industry containing 1250 ml S.putrefaciens .............. 77 Figure 4.17: Current versus time graphic taken from confectionery and 2000 mg/L
acetate using 5100 ohm external resistance at SCF-1-MFC. .................. 78
Figure 4.18: Current versus time graphic taken from confectionery and 2000 mg/L
acetate using 2200 ohm external resistance at SCF-1-MFC ................... 79
Figure 4.19: Current versus time graphic taken from confectionary and 2000 mg/L
acetate using 100 ohm external resistance at SCF-1-MFC. Arrows
indicate the replacement of the substrate with a fresh substrate. ............ 79 Figure 4.20: A scanning electron micrograph (SEM) for anode of SCF-1-MFC ..... 80 Figure 4.21: Voltage versus time graph for SCF-2-MFC using 300 ohm external
resistance and batchly feeding with 200 mg/L acetate . Arrows indicate
the replecament of the substrate with a fresh substrate. .......................... 81
Figure 4.22: Voltage versus time graph for SCF-2-MFC for activated carbon cloth
cathode ..................................................................................................... 82 Figure 4.23: Voltage generation from NaAc only for 12 representative cycles at 300
Ω external resistance. Arrows indicate the replacement of consumed
solution with a fresh solution. ................................................................. 83
Figure 4.24: Voltage generation from NaAc only and NaAc with ERY antibiotic at
300 Ω external resistance. Arrows indicate the replacement of consumed
solution with a fresh solution. ................................................................. 84

xvii
Figure 4.25: Current for per cycle hour from NaAc only and NaAc with ERY
antibiotic at 300 Ω external resistance. ................................................... 85 Figure 4.26: Coulombic efficiency for per cycle hour from NaAc only and NaAc
with ERY antibiotic at 300 Ω external resistance. .................................. 86
Figure 4.27: COD removal for per cycle hour from NaAc only and NaAc with ERY
antibiotic at 300 Ω external resistance. ................................................... 86 Figure 4.28: Voltage generation from NaAc only and NaAc with SMX antibiotic at
300 Ω external resistance. Arrows indicate the replacement of consumed
solution with a fresh solution. ................................................................. 87
Figure 4.29: Current for per cycle hour from NaAc only and NaAc with SMX
antibiotic at 300 Ω external resistance. ................................................... 88 Figure 4.30: Coulombic efficiency for per cycle hour from NaAc only and NaAc
with SMX antibiotic at 300 Ω external resistance. ................................. 88 Figure 4.31: COD removal for per cycle hour from NaAc only and NaAc with SMX
antibiotic at 300 Ω external resistance. ................................................... 89 Figure 4.32: Voltage generation from NaAc only and NaAc with TC antibiotic at
300 Ω external resistance. Arrows indicate the replacement of consumed
solution with a fresh solution. ................................................................. 90 Figure 4.33: Current for per cycle hour from NaAc only and NaAc with TETRA
antibiotic at 300 Ω external resistance. ................................................... 91
Figure 4.34: Coulombic efficiency for per cycle hour from NaAc only and NaAc
with TC antibiotic at 300 Ω external resistance. ..................................... 91
Figure 4.35: COD efficiency for per cycle hour from NaAc only and NaAc with TC
antibiotic at 300 Ω external resistance. ................................................... 92
Figure 4.36: Voltage generation from NaAc only and NaAc with E1 hormone at
300 Ω external resistance. Arrows indicate the replacement of consumed
solution with a fresh solution. ................................................................. 94 Figure 4.37: Current for per cycle hour from NaAc only and NaAc with E1
hormone at 300 Ω external resistance. .................................................... 95
Figure 4.38: Coulombic efficiency for per cycle hour from NaAc only and NaAc
with E1 hormone at 300 Ω external resistance........................................ 95
Figure 4.39: COD removal for per cycle hour from NaAc only and NaAc with E1
hormone at 300 Ω external resistance. ................................................... 96 Figure 4.40: Voltage generation from NaAc only and NaAc with E2 hormone at
300 Ω external resistance. Arrows indicate the replacement of consumed
solution with a fresh solution. ................................................................. 97
Figure 4.41: Current for per cycle hour from NaAc only and NaAc with E2
hormone at 300 Ω external resistance. .................................................... 98 Figure 4.42: Coulombic efficiency for per cycle hour from NaAc only and NaAc
with E2 hormone at 300 Ω external resistance........................................ 98 Figure 4.43: COD removal for per cycle hour from NaAc only and NaAc with E2
hormone at 300 Ω external resistance. ................................................... 99 Figure 4.44: Voltage generation from NaAc only and NaAc with E3 hormone at
300 Ω external resistance. Arrows indicate the replacement of consumed
solution with a fresh solution. ................................................................. 99 Figure 4.45: Current for per cycle hour from NaAc only and NaAc with E3
hormone at 300 Ω external resistance ................................................... 100 Figure 4.46: Coulombic efficiency for per cycle hour from NaAc only and NaAc
with E3 hormone at 300 Ω external resistance...................................... 101

xviii
Figure 4.47: COD removal for per cycle hour from NaAc only and NaAc with E3
hormone at 300 Ω external resistance. ................................................. 101 Figure 4.48: Voltage generation from NaAc only and NaAc with EE2 hormone at
300 Ω external resistance. Arrows indicate the replacement of consumed
solution with a fresh solution. ............................................................... 102 Figure 4.49: . Current for per cycle hour from NaAc only and NaAc with EE2
hormone at 300 Ω external resistance. .................................................. 103 Figure 4.50: Coulombic efficiency for per cycle hour from NaAc only and NaAc
with EE2 hormone at 300 Ω external resistance ................................... 103
Figure 4.51: COD removal for per cycle hour from NaAc only and NaAc with EE2
hormone at 300 Ω external resistance. ................................................. 104

xix
EFFECTS OF ANTIBIOTICS AND HORMONES ON ELECTRICITY
GENERATION USING MICROBIAL FUEL CELLS
SUMMARY
A microbial fuel cell (MFC) is a bioreactor that directly converts chemical energy
occurring as a result of oxidation of organic compounds to electrical energy through
catalytic reactions of microorganisms under anaerobic conditions. In recent years,
since electricity generation from a microbial fuel cell by using fermentation products
and different wastewaters as fuel draws researchers’ attention, lots of investigations
have been made and well documented. Apart from electricity generation, these
systems have a great potential for practical applications in the future due to
wastewater treatment. The other purpose of MFC usage is a biosensor. The
electricity efficiencies obtained recently in MFCs are far away from those required
for commercial application and lots of fundamental works have to be done in order to
develop usable technologies with low cost.
This thesis consists of two stages in general. Firstly, it is purposed to generate
electricity from different organic compounds by using two chambered MFC and pure
culture Shewanella putrefaciens. After optimization experiments, cultivated cells are
transferred to the two chambered MFC. Shewanella putrefaciens is
bioelectrochemically active and can form a biofilm on the anode surface and transfer
electrons directly (without mediator) by conductance through the membrane. When
they are used, the anode acts as the final electron acceptor in the dissimilatory
respiratory chain of the microbes in the biofilm. Thus, it is avoided from toxicity and
instability of synthetic mediators. Because of poor power density of the system (0.8
mW/m2), it is continued with mixed culture.
In the second phase of this study, by using acclimated mixed culture microorganisms
in single chambered MFC, electricity generation, current, chemical oxygen demand
(COD) removal, coulombic efficiency (CE) values were measured for the system fed
with sodium acetate as carbon source. In single chambered MFC, 4 different
estrogens (hormones) which are estrone, 17β-estradiol, estriol ve 17α-ethinylestradiol
and 3 different antibiotics (erythromycin, sulfamethoxazole, tetracycline) are used. It
is investigated inhibition responses of these matters in MFC system. During
antibiotic experiments, one cycle is only acetate, following cycle is antibiotic plus
acetate and it continues in this way. When the values of current and CE change after
antibiotic plus acetate, the system is fed with only acetate repeatedly to recover to its
original value. The concentrations of antibiotics are 50, 100 ve 200 mg/L and they
are given to the system together with acetate. On the other hand, the concentrations
of hormones are 0,1, 0,5 ve 1 mg/L and the same procedure is carried out. Each set
is compared with only the sets in which acetate is used and differences in the current,
CE and COD removal values are observed. Therefore, the MFC system is used in a
way as a biosensor in this study. In literature, studies that show the effects of
inhibitory matters on electrogen microorganisms are too limited. Thus, making a
comparison is not quite possible and also the originality of our study gains an

xx
importance. Erythromycin (ERY), sulfamethoxazole (SMX) and tetracycline (TC)
are chosen because they are widely used in Turkey and around the world. On the
other hand, since it is observed by the researchers that widely usage of synthetic
hormones in recent times has negative effects on fish, it is proved in this study that
they show diversity in terms of electricity current of electrogen bacteria.
xxi
MĠKROBĠYAL YAKIT HÜCRELERĠNDE KULLANILAN ANTĠBĠYOTĠK
VE HORMONLARIN ELEKTRĠK ÜRETĠMĠ ÜZERĠNE ETKĠLERĠ
ÖZET
Mikrobiyal yakıt hücreleri (MYH) oksijensiz ortamda mikroorganizmaları katalizör
olarak kullanarak organik maddelerin oksidasyonu sonucu oluşan kimyasal enerjiyi
doğrudan elektrik enerjisine çeviren sistemlerdir. Son yıllarda fermentasyon
ürünlerini ve çeşitli atıksuları kullanarak elektrik üretimi araştırmacıların ilgisini
çektiğinden bu konuda pek çok çalışma yapılmıştır. Elektrik üretiminin yanında bu
sistemler atıksuyu arıttığından gelecekte pratik kullanımlar için potansiyel
taşımaktadır. Mikrobiyal yakıt hücrelerinin diğer bir kullanım alanı ise biosensör
olarak çalıştırılmalarıdır. Bu sistemlerin bugüne kadar yapılan araştırmalar sonucu
elde edilen elektrik verimleri ticari olarak kullanımdan oldukça uzaktır. Kullanılabilir
ve düşük maliyetli teknolojilerin geliştirilmesi için önümüzdeki yıllarda birçok temel
araştırmalar yapılmalıdır.
Bu çalışma temel olarak iki kısımdan oluşmaktadır. Birincisi iki hazneli microbiyal
yakıt hücresinde saf kültür Shewanella putrefaciens kullanılarak farklı organik
maddelerden elektrik üretimi olup, optimizasyon çalışmalarından sonra kültür
edilmiş hücreler iki hazneli MYH’ne transfer edilmiştir. Shewanella putrefaciens
elektrokimyasal olarak aktif, anot yüzeyine biyofilm yapabilme özelliğine sahip olup
organik maddelerden elde edilen elektronları anot yüzeyine aracı bir medyatör
kullanmadan verme özelliğine sahiptir. Böylece sentetik medyatörlerin toksik etkisi
ve yenilenme gereği ortadan kaldırılmıştır. Deneyler sonunda elde edilen düşük
güç yoğunluğu sebebiyle (0.8 mW/m2) çalışmaya karışık kültür bakteriler ile devam
edilmiştir.
Çalışmanın ikinci kısmında, tek hazneli mikrobiyal yakıt hücresinde aklime edilmiş
karışık kültür mikroorganizmalar kullanılarak sodyum asetat ile beslenen sistem için
elektrik üretimi, KOİ giderimi, Colombus verimliliği bulunmuştur. Sodyum asetat ile
beslenen tek hazneli microbiyal yakıt hücresi ile elektrik üretimi üzerine farklı
konsantrasyonlarda dört farklı hormon (estrone, 17β-estradiol, estriol ve 17α-
ethinylestradiol) ile üç farklı antibiyotik (erythromycin, sulfamethoxazole,
tetracycline) maddesi eklenerek bu maddelerin olası inhibisyon etkileri
araştırılmıştır. Antibiyotikler 50, 100 ve 200 mg/L konsantrasyonlarında hazırlanıp
asetat ile beraber sisteme verilmiştir. Öte yandan hormonlar ise 0,1, 0,5 ve 1 mg/L
konsantrasyonlarda uygulanmıştır. Bu setlerin her biri sadece asetat kullanılan
setlerle karşılaştırılmış ve akım, colombus verimliliği ve KOİ gideriminde farklılıklar
değerlendirilmiştir. Böylece MYH sistemi bir nevi biyosensör olarak kullanılmıştır.
Literatürde bu inhibitor maddelerin elektrojen (elektrik üreten) bakteriler üzerine
etkisini gösteren benzer çalışmalara rastlamak pek mümkün olmadığından kıyaslama
yapılamamakla beraber çalışmamızın orjinalliği açısından önem taşımaktadır.
İncelenen antibiyotikler dünyada ve ülkemizde en fazla tüketilen ana gruplardan
olması nedeniyle seçilmiştir. Sentetik hormonlar da son yıllarda yoğun kullanımı ile
canlılar üzerinde olumsuz etkileri araştırmacılar tarafından gözlemlendiğinden bu

xxii
çalışmada bakteriler üzerinde elektrik üretimi açısından değerlendirilmesi
yapılmıştır.

1
1. INTRODUCTION
1.1 Meaning and Significance of the Thesis
It has been known for many years that it is possible to directly generate electricity
using bacteria while accomplishing wastewater treatment in processes based on
microbial fuel cell (MFC) technologies (Logan, 2008). This technology has
generated significant interest among researchers in recent years (Allen and Bennetto,
1993, Moon et al., 2006). Especially, rapid advances have been occurred in MFC
system and lots of journal publications has increased in a few years because of
interest among academic researchers. Logan et al. (2006a) reviewed MFC designs,
performances and characterization, while Rabaey and Verstraete (2005) reviewed
microbial metabolisms in MFCs. Pant et al., 2010 reviewed substrates used in MFCs.
Although microbial fuel cells became of more interest, some experiments that were
conducted required the use of chemical mediators which could carry electrons from
inside the cell to exogenous electrodes. The breakthrough in MFCs occurred in 1999
when it was recognized that mediators did not need to be added (Kim et al. 1999c;
Kim et al. 1999d). A significant amount of information has been obtained studying
exoelectrogens from metal reducing genera (Shewanella and Geobacter). Likewise,
the mechanisms of electron transfer to extracellular electron acceptors are poorly
understood (Myers and Myers, 2002).
Apart from the production of electricity and wastewater treatment applications,
another potential application of the MFC technology is to use it as a sensor for
pollutant analysis and in situ process monitoring and control (Chang et al., 2004,
2005).
1.2 Aim and scope
The aim of this thesis is to determine and evaluate electricity generation of microbial
fuel cell (MFC). It was studied both pure culture and mixed culture. Firstly,
synthetic wastewater containing sodium acetate, glucose, ethanol and propionic acid
mixture as a carbon source is fed in two chambered MFC with pure culture

2
Shewanella putrefaciens and electricity generation is observed and evaluated for
initial different amount of Shewanella putrefaciens in MFC.
Secondly, it is studied with single chambered MFC using mixed culture and sodium
acetate as a sole carbon source. Current, coulombic efficiency (CE) and chemical
oxygen demand (COD) removal efficiencies are measured and evaluated
with/without inhibitory matters (antibiotics and hormones)
The thesis is composed of five chapters.
In the first chapter, introduction part and aim and scope of the thesis are
presented.
In the second chapter, it is rewieved configurations, performances,
applications and important parameters of MFC in literature. It is also
rewieved source, fate, effects of some antibiotics and hormones in aquatic
environment and on biota.
In the third chapter, materials and methods used in experimental studies are
given.
In the fourth chapter, experimental result and discussion parts are presented.
In the last chapter, in conclusion, a general evaluation of the experimental
studies is provided.

3
2. LITERATURE SURVEY
2.1 Definition of microbial fuel cell
Microbial fuel cells (MFCs) are devices which use bacteria as the catalysts to oxidize
organic and inorganic matter and generate current (Logan et al., 2006). A technology
using microbial fuel cells (MFCs) that convert the energy stored in chemical bonds in
organic compounds to electrical energy attained through the catalytic reactions by
microorganisms has produced a great deal of interest among academic researchers in
recent years (Moon et al., 2006). While accomplishing the biodegradation of organic
matters or wastes, bacteria can be used in MFCs to generate electricity (Oh and
Logan., 2005a). Fig. 2.1 shows a schematic diagram of a typical two-chambered and
single-chambered MFC for producing electricity. It consists of anodic and cathodic
chambers which are divided by a proton exchange membrane (PEM). A bacterium in
the anode compartment transfers electrons acquired from an electron donor (glucose)
to the anode electrode. This occurs either through direct contact, nanowires, or
mobile electron shuttles (small spheres represent the final membrane associated
shuttle). During electron production, protons are also produced excessively. These
protons move through the cation exchange membrane (CEM) into the cathode
chamber. The electrons flow from the anode through an external resistance (or load)
to the cathode where they react with the final electron acceptor (oxygen) and protons
(Gil et al., 2003).
In a microbial fuel cell (MFC), power can be generated from the oxidation of organic
matter by bacteria at the anode, with reduction of oxygen at the cathode. Proton
exchange membranes used in MFCs are permeable to oxygen, leading to the
diffusion of oxygen into the anode chamber (Logan et al., 2005). Electrons which are
produced from these substrates by the bacteria are transferred to the anode (negative
terminal) and flow to the cathode (positive terminal) linked by a conductive material
including a resistor, or operated under a load (i.e., producing electricity that runs a
device) (Logan et al., 2006). Electron mediators or shuttles can transfer electrons to
the anode (Rabaey and Verstraete, 2005).

4
Figure 2.1: Schematic diagram of a typical two-chambered (A) and single-
chambered (B) microbial fuel cells (Pant et al., 2009).
2.2 Mediator Microbial Fuel Cell
Mediators have a significant role in electron transport for microbes which are unable
to transfer the electrons to the anode. Basic processes are presented as follows (Fig.
2.2) (Lovley et al., 1996). Humic acids, anthraquinone, the oxyanions of sulphur
(sulphate and thiosulphate) all have the ability to transfer electrons from inside the
cell membrane to the anode (Lovley, 1993). Mediators shuttle between the anode and
the bacteria transferring the electrons. They take up the electrons from microbes and
discharge them at the surface of the anode. Actinobacillus succinogenes,
Desulfovibrio desulfuricans, E. coli, Proteus mirabilis, Proteus vulgaris,
Pseudomonas fluorescens need extraneous mediators, while some microbes can
provide their own. For instance, Pseudomonas aeruginosa produces pyocyanin
molecules as electron shuttles (Du et al., 2007)

5
Figure 2.2: Model for various compounds serving as electron shuttles between a
bioelectrochemically active bacteria and the anode (Du et al., 2007).
2.3 Mediator-less Microbial Fuel Cell
If no exogenous mediators are added to the system, the MFC is categorized as a
mediator-less MFC although the mechanism of electron transfer may not be known
(Logan, 2004). Applications of synthetic mediators in MFCs are limitted by their
toxicity and instability. Some microbes can use naturally occurring compounds
including microbial metabolites (endogenous mediators) as mediators. A real
breakthrough was made when some microbes were discovered to transfer electrons
directly to the anode (Kim et al., 1999a, Chaudhuri and Lovley, 2003). These
microbes are operationally stable and yield a high Coulombic effectiveness
(Chaudhuri and Lovley, 2003; Scholz and Schroder, 2003). Shewanella putrefaciens
(Kim et al., 2002), Geobacteraceae sulferreducens (Bond and Lovley, 2003),
Geobacter metallireducens (Min et al., 2005a) and Rhodoferax ferrireducens
(Chaudhuri and Lovley, 2003) are all bioelectrochemically active and can form a
biofilm on the anode surface and transfer electrons directly by conductance through
the membrane. When they are used, the anode acts as the final electron acceptor in
the dissimilatory respiratory chain of the microbes in the biofilm.
Geobacter belongs to dissimilatory metal reducing microorganisms, which produce
biologically useful energy in the form of ATP during the dissimilatory reduction of
metal oxides under anaerobic conditions in soils and sediments. The electrons are
transferred to the final electron acceptor such as Fe2O3 mainly by a direct contact of
mineral oxides and the metal reducing microorganisms (Vargas et al., 1998). The
anodic reaction in mediator-less MFCs which is constructed with metal reducing
bacteria belonging primarily to the families of Shewanella, Rhodoferax, and

6
Geobacter is similar to that in this process since the anode acts as the final electron
acceptor just like the solid mineral oxides. Fig. 2.3 demonstrates the chemical
compounds proposed to be involved in the electron transportation from electron
carriers in the intracellular matrix to the solid-state final electron acceptor (anode) in
dissimilatory metal reducing microorganisms (Lovley et al., 2004; Vargas et al.,
1998; Holmes et al., 2004). S. putrefaciens, G. sulferreducens, G. metallireducens
and R. Ferrireducens transfer electrons to the solid electrode (anode) by using this
system.
Since the cost of a mediator is eliminated, mediator-less MFCs are advantageous in
wastewater treatment and power generation (Ieropoulos et al., 2005).
Figure 2.3: Summary of components proposed to be involved in the electron
transport from cells to the anode in MFCs using metal reducing
microorganisms (Geobacter species) (Figure drawn with modifications
after Lovley et al., 2004).
2.4 How do Microbial Fuel Cells work?
In order to understand how an MFC generates electricity, we must understand how
bacteria capture and process energy. Bacteria grow by catalyzing chemical reactions
and harnessing and storing energy in the form of adenosine triphosphate (ATP). In
some bacteria, reduced substrates are oxidized and electrons are transferred to
respiratory enzymes by NADH, the reduced form of nicotinamide adenine
dinucleotide (NAD). These electrons flow down a respiratory chain (a series of
enzymes that function to move protons across an internal membrane) creating a

7
proton gradient. The protons flow back into the cell through the enzyme ATPase,
creating 1 ATP molecule from 1 adenosine diphosphate for every 3–4 protons. The
electrons are finally released to a soluble terminal electron acceptor, such as nitrate,
sulfate, or oxygen (Logan and Regan, 2006b).
Microbes in the anodic chamber of an MFC oxidize added substrates and generate
electrons and protons in the process. Carbon dioxide is produced as an oxidation
product. Nevertheless, there is no net carbon emission since the carbon dioxide in the
renewable biomass originally comes from the atmosphere in the photosynthesis
process. Unlike in a direct combustion process, the anode absorbs the electrons and
they are transported to the cathode through an external circuit. After crossing a PEM
or a salt bridge, the protons enter the cathodic chamber where they combine with
oxygen to form water. Microbes in the anodic chamber extract electrons and protons
in the dissimilative process of oxidizing organic substrates (Rabaey and Verstraete,
2005). Electric current generation is made possible by keeping microbes separated
from oxygen or any other end terminal acceptor other than the anode and this
requires an anaerobic anodic chamber. In the case presented at Figure 2.4, bacteria
could derive energy from the potential between NADH (the reduced form of
nicotinamide adenine dinucleotide) and cytochrome c, while the MFC could be used
to recover energy from the potential between cytochrome c and oxygen. Actual
potentials depend on concentrations and potentials of specific enzymes and electron
acceptors (Logan and Regan, 2006b)
Using acetate as substrate, typical electrode reactions are demonstrated below:
Anodic reaction :
CH3COO - + 2H2O 2CO2 + 7H
+ + 8e
-
Cathodic reaction :
O2 + 4H+ + 4e
- →2H2O
The overall reaction is the break down of the substrate to carbon dioxide and water
with a concomitant production of electricity as a by-product. Based on the electrode
reaction pair above, an MFC bioreactor can produce electricity from the electron
flow from the anode to cathode in the external circuit.(Du et al., 2007)

8
Figure 2.4: Respiratory chain shows how the voltage that could be recovered in a
microbial fuel cell (MFC) is dependent on where electrons exit the
chain of respiratory enzymes (Logan and Regan, 2006).
In other words, electrons are released to a terminal electron acceptor (i.e. oxygen,
nitrate, sulfate etc.) and becomes reduced. The electron acceptor readily diffuse into
the bacteria cell where they accept electrons forming products which can diffuse out
of the cell. Some bacteria can transfer electrons exogeneously to a terminal electron
acceptor such as metal anode. These bacteria called exoelectrogens. These method of
electron generating process is called electrogenesis while the bacteria is called
exoelectogens and in the reactor microbial fuel cell.
2.5 Types of Microbial Fuel Cell (MFC)
Many various configurations are possible for MFCs. A typical two-chambered MFC
consists of an anodic chamber and a cathodic chamber. A single-compartment MFC
eliminates the need for the cathodic chamber by exposing the cathode directly to the
air. MFCs can be stacked with the systems that are shaped as a series of flat plates or
linked together in series in order to increase the overall system voltage (Logan et al.,
2006; Du et al., 2007)
2.5.1 Two-chambered MFC
A typical two compartment MFC has an anodic chamber and a cathodic chamber
connected by a Proton Exchange Membrane (PEM), or sometimes a salt bridge, to let

9
protons move across to the cathode while blocking the diffusion of oxygen into the
anode (Du et al., 2007). The anode chamber includes the bacteria, and it is tightly
sealed to prevent oxygen diffusion into the chamber. The headspace can be flushed
with nitrogen gas to exclude air from the chamber. The cathode is submerged in
water, and the water is bubbled with air (a typical aquarium air pump works well in
the laboratory for this purpose). The ionic strength of the solutions in the two
chambers should be matched. The anode chamber should include nutrients (nitrogen,
phosphorus and trace minerals) and biodegradable substrate (Logan, 2005). Figure
2.5 demonstrates two-chamber H-type system showing anode and cathode chambers
equipped for gas sparging. Schematic demonstration of the anode where bacteria
form a biofilm on the surface (with a gas sparger to remove air in the bottle) and a
cathode, which is exposed to dissolved oxygen. A proton-exchange membrane
(PEM), which in an ideal way allows the exchange of protons through the electrolyte
(water) and not through oxygen or the substrate, separates the two chambers. Figure
2.5b demonstrates an example of a simple two-chamber system with the PEM
clamped between the ends of two tubes, each joined to a bottle (Logan and Regan,
2006b).
Figure 2.5: Example of an H-type microbial fuel cell (Logan and Regan, 2006).
2.5.2 Single Chambered MFC (SCMFC)
A simpler and more efficient MFC can be made by 1999 by eliminating the cathode
chamber and placing the cathode electrode directly onto the PEM. This set up avoids
the need to aerate water since the oxygen in air can be directly transferred to the

10
cathode. In the first design used in Prof. Logan's laboratory at Penn State University,
used to demonstrate electricity production from wastewater, the cathode was placed
in the center of a cylinder, so that the anode chamber formed a concentric cylinder
around the cathode (Liu et al., 2004) Graphite rods were placed inside the anode
chamber, and these rods extended outside of the anode chamber and were connected
to the cathode via an external circuit containing a resistor. Air was able to passively
flow through the center tube so that it could react at the cathode. The Nafion
membrane was hot-pressed onto the cathode, which was wrapped around a
perforated plastic tube to provide support, with the membrane in contact with the
solution in the anode chamber. Scheme and photoraph of laboratory-scale prototype
of the SCMFC were presented Figure 2.6.
Figure 2.6: Schematics of a cylindrical SC-MFC containing eight graphite rods as an
anode in a concentric arrangement surrounding a single cathode. ((A)
drawn with modifications after Liu et al., (2004b). (B) drawn to illustrate
a photo in Liu et al., (2004.) (C) Photo of laboratory-scale prototype of
the SCMFC used to generate electricity from wastewater.
It is not necessary to place the cathode in water or in a separate chamber when using
oxygen at the cathode. The cathode can be placed in direct contact with air (Liu and
Logan, 2004). Much larger power densities have been attained by using oxygen as
C

11
the electron acceptor when aqueous-cathodes are replaced with air-cathodes. The
second type of SCMFC was a single tube, with the two circular electrodes placed on
opposite ends of the tube (small SCMFC; Liu and Logan, 2004). The end containing
the anode is capped in order to prevent oxygen diffusion into the chamber, while the
other end is open so that one side of the cathode faces air, while the other is bonded
to the PEM and faces the solution in the anode chamber. Two platinum wires extend
from the top for electrical connections (Figure 2.7).
Figure 2.7: (a) A schematic and (b) a photograph of a single-chamber microbial fuel
cell. The cathode is exposed to air on one side and the solution
containing the biodegradable substrate is on the other side. The anode
chamber containing the exoelectrogenic bacteria is sealed off from
oxygen (Logan and Regan 2006).
2.5.3 Stacked Microbial Fuel Cell
A stacked MFC for the analysis of performances of several MFCs connected in series
and in parallel (Aelterman et al., 2006). Enhanced voltage or current output can be
attained by connecting several MFCs in series or in parallel. Stacked MFC with the
systems shaped as a series of flat plates or linked together in series (Figure 2.8). No

12
apparent adverse effect on the maximum power output per MFC unit was noticed.
Coulombic efficiencies differred greatly in the two arrangements with the parallel
connection giving about an efficiency six times higher when both the series were
operated at the same volumetric flow rate. The parallel-connected stack has higher
short circuit current than the series connected stack, which means that higher
maximum bioelectrochemical reaction rate is allowed in the connection of MFCs in
parallel than in series. Thus, if the MFC units are not independently operated, a
parallel connection is preferred in order to maximize chemical oxygen demand
(COD) removal (Aelterman et al., 2006).
Figure 2.8: Stacked MFCs consisting of six individual units with granular graphite
anode (They are joined in one reactor block ( drawn to illustrate a photo
in Aelterman et al.,2006).
2.6 Factors of performance of Microbial Fuel Cell
2.6.1 Effects of electrode materials
The electrodes can be made of any conducting, non-corrosive material (Logan 2005).

13
2.6.1.1 Anode materials
Metal anodes which consist of noncorrosive stainless steel mesh can be utilized,
however, copper is not useful owing to the toxicity of even trace copper ions to
bacteria. The most versatile electrode material is carbon, available as compact
graphite plates, rods, or granules, as fibrous material (felt, cloth, paper, fibers, foam),
reticulated vitreous carbon (RVC) and as glassy carbon (Logan et al, 2006, Du et al,
2007)
The simplest materials for anode electrodes are graphite plates or rods (inexpensive),
which are easy to handle, and have a defined surface area. Much larger surface areas
are achieved with graphite felt electrodes which can have high surface areas.
Nevertheless, not all the indicated surface area will necessarily be available to
bacteria. Carbon fiber, paper, graphite felt, reticulated vitreous carbon (RVC) and
cloth (Toray) have been extensively used as electrodes(Logan et al., 2006, Du et al,
2007). Graphite fiber brush elektrodes have been also used because of the highest
specific areas and porosities (Logan et al, 2007)
Using better performing electrode materials can improve the performance of an MFC
since different anode materials lead to different activation polarization losses. Pt and
Pt black electrodes are superior to graphite, graphite felt and carbon-cloth electrodes
for both anode and cathode constructions, however, their costs are much higher (Du
et al., 2007).
2.6.1.2 Cathode materials
The cathode must contain a catalyst for producing water from the protons, electrons
and oxygen, and typically Pt is used and held on the carbon surface by using a
binder. Oxygen is the most suitable electron acceptor for an MFC owing to its high
oxidation potential, availability, low cost (it is free), sustainability, and the lack of a
chemical waste product (water is formed as the only endproduct). When the cathode
material is chosen, it greatly affects performance, and is varied based on application.
For sediment fuel cells, plain graphite disk electrodes which are immersed in the
seawater above the sediment have been used. In seawater, oxygen reduction on
carbon cathodes has been shown to be microbially supported. Such microbially
assisted reduction has also been observed for stainless steel cathodes which rapidly
reduces oxygen when aided by a bacterial biofilm. Pt catalysts are usually used for

14
dissolved oxygen or open-air (gas diffusion) cathodes in order to increase the rate of
oxygen reduction. The Pt load can be kept as low as 0.1 mg/cm2
in order to decrease
the costs for the MFC. The long term stability of Pt needs a more fully investigation,
and there remains a need for new types of inexpensive catalysts (Logan et al., 2006).
The electrodes can be connected by any type of wire if the wire is not exposed to
bacteria. Pt wire is the best choice, however, it is expensive, thus, copper wire is
frequently used with all surfaces coated with a non-conductive epoxy. Even if coated
in this way, copper wire can be expected to eventually fail in the system. In order to
avoid wires inside the chambers, the carbon electrodes can be extended outside the
chamber and then a regular wire and clip can be placed on the electrode (Logan,
2005).
2.6.2 Effects of operating conditions
2.6.2.1 Anodic chamber
Fuel type, concentration and rate are significant factors that impact the performance
of an MFC. With a given microbe or microbial consortium, power density varies
greatly using different fuels. Many systems have proved that electricity generation
depends on fuel concentration both in batch and continuous-flow mode MFCs.
Usually a higher fuel concentration yields a higher power output in a wide
concentration range. A higher current level was attained with lactate (fuel)
concentration increased until it was in excess at 200mM in a single-compartment
MFC inoculated with S. putrefaciens (Park and Zeikus, 2002). Increased fuel
concentration has an effect on the performance of MFC (Moon et al. 2006). The
current increased with a wastewater concentration up to 50 mgCOD/L in their MFC
(Gil et al, 2003). In an interesting way, the electricity generation in an MFC often
peaks at a relatively low level of feed rate before heading downward. This may be
because a high feed rate promoted the growth of fermentative bacteria faster than
those of the electrochemically active bacteria in a mixed culture (Moon et al., 2006;
Kim et al., 2004; Rabaey et al., 2003).
2.6.2.2 Cathodic chamber
Oxygen is the most commonly used electron acceptor in MFCs for the cathodic
reaction. Power output of an MFC is strongly dependent on the concentration level of
electron acceptors. Several studies showed that DO was a major limiting factor when

15
it remained below the air-saturated level (Oh et al., 2004; Pham et al., 2004;Gil et al.,
2003). Surprisingly, a catholyte sparged with pure oxygen that gave 38 mg/L DO did
not further increase the power output compared to that of the air-saturated water (at
7.9 mg/L DO) (Oh et al., 2004; Min and Logan, 2004; Pham et al., 2004). Rate of
oxygen diffusion toward the anode chamber goes up with the DO concentration.
Therefore, part of the substrate is consumed directly by the oxygen instead of
transferring the electrons through the electrode and the circuit (Pham et al., 2004).
Power output is much greater using ferricyanide as the electron acceptor in the
cathodic chamber. Ferricyanide (K3[Fe(CN)6) is very popular as an experimental
electron acceptor in MFCs. The greatest advantage of ferricyanide is the low
overpotential using a plain carbon cathode, resulting in a cathode working potential
close to its open circuit potential. Reported cases with very high power outputs such
as 7200 mW/m2, 4310 mW/m
2 and 3600 mW/m
2 all used ferricyanide in the cathodic
chamber (Schroder et al. 2003, Oh et al., 2004 2003; Rabaey et al., 2004), while less
than 1000 mW/m2 was reported in studies using DO regardless of the electrode
material. This is likely due to the greater mass transfer rate and lower activation
energy for the cathodic reaction which is offered by ferricyanide (Oh et al., 2004).
On the other hand, the greatest disadvantage is the insuffîcient reoxidation by
oxygen, which requires the catholyte to be regularly replaced (Rabaey et al., 2003).
Additionaly, the long term performance of the system can be affected by diffusion of
ferricyanide across the PEM and into the anode chamber (Logan et al., 2006).
2.6.2.3 Effects of PEM (Proton Exchange Membrane)
Proton exchange system can affect an MFC system's internal resistance and
concentration polarization loss and in turn, they influence the power output of the
MFC. Nafion (DuPont Co., ABD) is the most popular due to its highly selective
permeability of protons. In spite of the attempts by researchers to look for less
expensive and more durable substitutes, Nafion is still the best choice. Ultrex,
polyethylene.poly (styrene-co-divinylbenzene); salt bridge, porcelain septum, or
solely electrolyte can be also used as PEM in MFC (Du et al, 2007).
2.6.2.4 Effects of ionic strength, anode-cathode distance and temperature
Increasing the solution ionic strength by adding NaCl increased power output. Power
generation was also increased by decreasing the distance between the anode and

16
cathode from 4 to 2 cm (Liu et al., 2005). The power increases due to ionic strength
and electrode spacing resulted from a decrease in the internal resistance. Power
output was also increased by replacing the cathode with carbon cloth cathode
containing the same Pt loading. The performance of conventional anaerobic
treatment processes, such as anaerobic digestion, are adversely affected by
temperatures below 30 °C. Nevertheless, decreasing the temperature from 32 to 20
°C reduced power output by only 9%, primarily as a result of the reduction of the
cathode potential. These results, which show that power densities can be increased to
over 1 W/m2 by changing the operating conditions or electrode spacing, should lead
to further improvements in power generation and energy recovery in single-chamber,
air-cathode MFCs. (Liu et.al. 2005)
Certainly, changing operating conditions can improve the power output level of the
MFCs. Nonetheless, it is not a revolutionary method to upgrade the MFCs from low
power system to an applicable energy source at the very present. The bottleneck lies
in the low rate of metabolism of the microbes in the MFCs. Even at their fastest
growth rate, microbes are comparatively slow transformers. The biotransformation
rate of substrates to electrons has a fixed ceiling which is inherently slow. Effort
should be focused on how to break the inherent metabolic limitation of the microbes
for the MFC application. High temperature can accelerate almost all kinds of
reactions including chemical and biological ones. Use of thermophilic species might
benefit for improving rates of electron production, nevertheless, to the best of our
knowledge, no such investigation is reported in the literature. Thus, this is probably
another scope of improvement for the MFC technology from the laboratory research
to a real applica ble energy source. (Du et al, 2007)
2.7 Fundamentals of voltage generation
MFCs commonly achieve a maximum working voltage of 0.7 V. The voltage is a
function of the external resistance (Rex), or load on the circuit, and the current, I.
The relationship between these variables is the well-known equation:
E =I x Rex (2.1)
where E is used for the cell potential. V is also used for voltage, though the symbol
V and the units V = Volts can lead to confusion.
17
The current produced from a single MFC is small, so that when a small MFC is
constructed in the laboratory the current is not measured, however, instead it is
calculated from the measured voltage drop across the resistor as I = E/Rex. The
highest voltage produced in an MFC is the open circuit voltage, OCV, which can be
measured with the circuit disconnected (infinite resistance, zero current).
When the resistances are decreased, the voltage decreases. The power at any time is
calculated as
P = IxE (2.2)
The voltage generated by an MFC is far more complex to understand or predict than
that of a chemical fuel cell. In an MFC, it takes time for the bacteria to colonize the
electrode and manufacture enzymes or structures which are needed to transfer
electrons outside the cell. In mixed cultures, different bacteria can grow, setting
different potentials. As discussed below, the potential even for a pure culture cannot
be predicted. Nonetheless, there are limits to the maximum voltages that can be
generated based on thermodynamic relationships for the electron donors (substrates)
and acceptors (oxidizers).
The maximum electromotive force, Eemf that can be developed in any type of
battery or fuel is given by
ln0
nF
RTEEemf (2.3)
where E0 is the standard cell electromotive force, R = 8.31447 J/mol-K the gas
constant, T the absolute temperature (K), n the number of electrons transferred, and
F = 96,485 C/mol is Faraday’s constant. The reaction quotient is the ratio of the
activities of the products that are divided by the reactants raised to their respective
stoichiometric coefficients, or
r
p
reactants
product (2.4)
By the IUPAC convention, all reactions are written in the direction of chemical
reduction, so that the products are always the reduced species, and the reactants are
the oxidized species (oxidized species + e- + reduced species). At the same time, by
IUPAC convention, we take as standard conditions a temperature of 298 K, and

18
chemical concentrations of 1 M for liquids and 1 bar for gases (1 bar = 0.9869 atm =
100 kPa). All values of E0
are calculated with respect to that of hydrogen under
standard conditions, which is defined to be E0
(H2)=0, referred to as the normal
hydrogen electrode (NHE). Therefore, the standard potentials for all chemicals is
obtained with =1 relative to a hydrogen electrode.
In biological systems the reported potentials are usually pre-adjusted to neutral pH,
since the cytoplasm of most cells is at pH=7. For hydrogen, with 2H+ + 2e
- H2,
this means that the adjusted potential at 298 K is
0ln
2
20/0 H
H
nF
RTEE
V
M
bar
molC
KmolKJ414.0
10
1ln
/1065.92
15.298/31.8274
(2.5)
where the / on E is used to denote the pH-adjusted standard condition commonly
used by microbiologists. Thus, in most calculations, the hydrogen potential is not
zero as a result of the assumption of all species being present in a pH = 7 solution.
These potentials need to be adjusted for other temperatures or pressures, or pH if
different from 7.
For hydrogen (H+/H2), chemicals which will be oxidized by H
+ have more negative
potentials, whereas those that are reduced by H2 have more positive potentials. For
instance, H2 is oxidized by oxygen. The half reaction for oxygen is
21 O2 + 2 H
+ + 2e
- H20 and E
0(O2)= 1.229 V, so the adjusted value for oxygen at
pH = 7 is
221
2
0/0 1ln
HOnF
RTEE ……...(2.6)
229.1/0E
VMmolC
KmolKJ805.0
102.0
1ln
/1065.92
15.298/31.8272
14
The activity of a pure liquid or a solid is constant, so here the activity of water is
unity. Because E0/
(O2)> E0/
(H2) oxygen is reduced by hydrogen. When the voltage is
positive, the reaction is exothermic. The calculations can also be expressed in terms
of the change in Gibbs free energy, Gr0 [J], as
E0
= - nF
Gr
0 ……(2.7)

19
Note here that the reaction is exothermic when Gr0; is negative.
The total potential that can be produced by any fuel cell is the difference in the anode and
cathode potentials, or Eemf= Ecat - Ean. For the adjusted standard conditions of pH=7, this is
Eemf= E0/
cat - E0/
an …………(2.8)
For this case at the given conditions (298 K, 1 bar, pH = 7), this is
E0/
emf = 0.805 V - (-0.414 V) = 1.219 V.
Table 2.1: Anode and Cathode potentials for different anodic and cathodic reactions. E/ or
E0/
values are adjusted for pH=7 at 298 K except as indicated (Logan, 2008).
Anode-Cathode Reaction E0(V) Conditions E
/(V)
2H++2e
- H2
0.000 pH=7 -0.414
2HCO3-+9H
++8e
-
CH3COO-+4H2O
0.187 HCO3- =5mM,
CH3COO- = 16.9,
pH=7
-0.300
CO2+HCO3-+8H
++8e
-
CH3COO-+3H2O
0.130 pH=7
-0.284
6CO2+24H++24e
-
C6H12O6+6H2O
0.014 pH=7
-0.428
O2+4H++4e
- H2O
1.229 pO2=0.2, pH=7 0.805
O2+2H++2e
- H2O2 0.695 pO2=0.2,
H2O2=5mM, pH=7
0.328
Fe(CN)63-
+e-
Fe(CN)64-
0.361 Fe(CN)63-
=Fe(CN)64-
0.361
MnO2(s) +4H++2e
-
Mn2+
+ H2O
1.229 Mn2+
=5mM, pH=7 0.470
MnO4- +4H
++3e
-
MnO2 + 2H2O
1.70 MnO4-=10mM,
pH=3.5
1.385
Fe3+
+e-
Fe3+
(low
0.77 pH)
0.77 Fe3+
= Fe2+,
T= 303 K(low pH)
0.78

20
While it is useful to express all potentials relative to a normal hydrogen electrode
(NHE) or standart hydrogen electrode (SHE), most experiments are conducted using
Ag/AgCl reference electrodes. For converting voltages obtained with a Ag/AgCl
electrode to NHE, it depends on the specific solution in the probe, but typically to get
NHE add 0.195 V (Liu and Logan, 2004) or 0.205 V (ter Heijne et al., 2006).
2.7.1 Anode potential
If thermodynamics limits overall power production, it can be expected that the
measured anode potential will approach that of the calculated maximum potential (i.
e., the potential set by substrate oxidation). As noted above, the maximum voltage is
produced in open-circuit mode, that’s why the maximum potential should be close to
that of the open-circuit potential (OCP). Most MFCs operating on a variety of
substrates produce an OCP approaching -0.3 V (vs. NHE). For acetate, we have the
HCO3-/Ac couple expressed as a reduction as:
OHCOOCHeHHCO 233 489
For acetate E0= 0.187 V, with a concentration of 1 g/L (16.9 mM) and under
conditions of neutral pH = 7 and an alkalinity set by the bicarbonate concentration of
mMHCO 53 , we have
187.0anE
V
MmolC
KmolKJ300.0
10005.0
0169.0ln
/1065.98
15.298/31.89724
(2.9)
2.7.2 Cathode Potential
For an MFC using oxygen, the cathode potential is a maximum of E0/
cat = 0.805 V.
Therefore, for an air-cathode MFC with 1 g/L of acetate (16.9 mM) as substrate
( mMHCO 53 , pH = 7), the maximum cell potential is E/cell, = 0.805 V - (-0.300 V)
= 1.105 V. Nevertheless, the cathode potential with oxygen is much less in practice
than predicted here. Typically, the OCP of an air cathode is approximately 0.4 V,
with a working potential of nearly 0.25 V even with a Pt catalyst. In one set of tests
the OCPcat of an MFC lacking a CEM was 0.425 V (0.230 V vs. Ag/AgCl) (Liu and
Logan 2004). Hot pressing a CEM (NafionTM
) to the cathode substantially reduced
the cathode potential to OCPcat = 0.226 V. The anode OCP was -0.275 V, with a
working anode potential of ca. -0.205 V (-0.400 V vs. Ag/AgCI), either in the
presence or absence of the CEM.
21
The most commonly used chemical catholytes in MFC fuel cells next to oxygen are
ferricyanide, or hexacyanoferrate, Fe(CN)63-
. It has a standard potential of 0.361 V, is
highly soluble in water, and it does not require a precious metal on the cathode such
as Pt. Tests using ferricyanide indicate much greater power generation than those
with oxygen owing to the fact that there is little polarization of the cathode so that
the cathode potential achieved is quite close to that calculated for standard conditions
(ter Heijne et al. 2006; You et al. 2006). Therefore, while oxygen is predicted to have
a higher cathode potential than ferricyanide, in practice the potentials which are
achieved by using oxygen are much lower than theoretical values. In two-chamber
MFC tests, Oh and Logan (2006) discovered that replacing the aqueous cathode
using oxygen with ferricyanide increased power by 1.5 to 1.8 times though power
densities produced in this system were low owing to the high internal resistance of
the system. Rabaey et al. (2004) achieved one of the highest power densities yet
produced in an MFC using a ferricyanide catholyte (4.1 W/m2 of anode surface
area), however, they did not report on power production in that system with
dissolved oxygen. Nonetheless, power generation with ferricyanide is not
sustainable. Ferricyanide must be externally regenerated, and can be lost over time.
2.8 Fundamentals of power generation
To make MFCs useful as a method to generate power, it is essential to optimize the
system for power production. Power is calculated from a voltage and current as
P = IxE. The power output by an MFC is calculated from the measured voltage,
EMFC, across the load and the current as
MFCEIP (2.10)
The current produced by a laboratory-scale MFC is calculated by measuring the
potential across the load (i.e. , the external resistor, Rext), and using
ext
MFC
R
EI …….(2.11)
Therefore, we can calculate power output as
ext
MFC
R
EP
2
…….(2.12)
Based on the relationship ext
MFC
R
EI , we can alternatively express power output in
terms of the calculated current as
extRIP 2 ……...(2.13)

22
2.8.1 Power output normalized by surface area
Knowing how much power is generated by an MFC does not sufficiently describe
how efficiently that power is generated by the specific system architecture. For
instance, the amount of anode surface area available for microbes to grow on can
affect the amount of power generated. Therefore, it is common to normalize power
production by the surface area of the anode, Aan, so that the power density which is
produced by the MFC is
extan
MFC
RA
EP
2
…….(2.14)
The surface area used for calculating anA is not the same in all studies. In reactors
where the anode is suspended in water, for instance, the area is defined as a projected
or geometric surface area based on both sides of the electrode, i.e., anan wlA 2
where anl and anw are the length and width, respectively, of a rectangular shaped
electrode (Min et al. 2005a). Nevertheless, when the anode is pressed onto a surface,
only one side of the anode may be used (Liu et al. 2005; Liu and Logan 2004).
2.8.2 Power output normalized by volume
As MFCs are designed to maximize total system power, ultimately the most
important factor is the power production on the basis of the total reactor volume.
This is calculated as
ext
MFC
Rv
EP
2
…….(2.15)
where vP is the volumetric power (W/m3) and v is the total reactor volume. The
reactor liquid volume can also be used, however, the convention in environmental
engineering is to use the total reactor volume.
2.9 Coulombic Efficiency
While generating power is a main goal of MFC operation, we also seek to extract as
much of the electrons stored in the biomass as possible as current, and to recover as
much energy as possible from the system. The recovery of electrons is referred to as
Coulombic efficiency, defined as the fraction (or percent) of electrons recovered as
current versus that in the starting organic matter. The oxidation of a substrate occurs

23
with the removal of electrons, with the moles of electrons defined for each substrate
(be) based on writing out a half reaction. For acetate, complete oxidation requires
be = 8 mol e-/mol, while for glucose it is be = 24 mol e
-/mol. Coulombic efficiency,
CE, is defined as CE =Coulombs recovered / Total coulombs in substrate. An ampere
is defined as the transfer of 1 Coulomb of charge per second, or 1A = 1C/s.
Therefore, if we integrate the current obtained over time, we acquire the total
Coulombs transferred in our system. The CE can therefore be calculated for a fed-
batch system as (Cheng et al. 2006; Logan et al. 2006).
cvbF
IdtMC
Anes
tb
sE
0 …….(2.16)
Where c is the substrate concentration change over the batch cycle (which is
usually assumed to go from 0c , the starting concentration, to completion for defined
substrates such as acetate, or 000 0 ccccc ) over a time = bt , sM , is the
molecular weight of the substrate, F = Faraday’s constant, and Anv is the volume of
liquid in the anode compartment. For complex substrates, it is more convenient to
use COD as a measure of substrate concentration, and thus, the CE becomes
CODvF
IdtC
An
tb
E
08
…….(2.17)
where 8 is a constant used for COD, based on 20M = 32 for the molecular weight of
oxygen and esb = 4 for the number of electrons exchanged per mole of oxygen.
2.10 Ohmic, activation, bacterial metabolic and mass trasport losses of MFCs
The ideal performance of an MFC is dependent on the electrochemical reactions that
occur between the organic substrate at a low potential such as glucose and the final
electron acceptor with a high potential, such as oxygen (Rabaey and Verstrate, 2005).
Nonetheless, its ideal cell voltage is uncertain since the electrons are transferred to
the anode from the organic substrate through a complex respiratory chain which
varies from microbe to microbe and even for the same microbe when growth
conditions differ. The actual cell potential is always lower than its equilibrium
potential due to irreversible losses. These losses can be classified as ohmic losses,
activation losses, bacterial metabolic losses and mass transport or concentration
losses.

24
First of all, Logan et al. (2006) determined the ohmic losses in MFC that both the
resistance to the flow of electrons through the electrodes (anode and cathode) and
interconnections, and the resistance to the flow of ions through the PEM (if present)
and the anodic and cathodic electrolytes. Ohmic losses can be reduced by checking
thoroughly all contacts, minimizing the electrode spacing and using a membrane
with a low resistivity.
Secondly, due to the activation energy needed for an oxidation/reduction reaction,
activation losses (charge transfer resistance) occur during the transfer of electrons
from or to a compound reacting at the electrode surface. This compound can exist at
the bacterial surface, as a mediator in the solution, or as the final electron acceptor
reacting at the cathode. Activation losses often demonstrate a strong increase at low
currents and steadily increase when current density increases. Low activation losses
can be achieved by increasing the electrode surface area, improving electrode
catalysis, increasing the operating temperature, and through the establishment of an
enriched biofilm on the electrode (Logan et al., 2006).
Thirdly, in order to generate metabolic energy, bacteria transport electrons from a
substrate at a low potential through the electron transport chain to the final electron
acceptor (such as oxygen or nitrate) at a higher potential. In an MFC, the anode is
the final electron acceptor and its potential determines the energy gain for the
bacteria. The higher the difference between the redox potential of the substrate and
the anode potential, the higher the possible metabolic energy gain for the bacteria,
but the lower the maximum reachable MFC voltage. The potential of the anode
should be kept as low (negative) as possible in order to maximize the MFC voltage.
Nevertheless, electron transport will be inhibited and fermentation of the substrate (if
possible) may provide greater energy for the microorganisms if the anode potential
becomes too low (Logan et al, 2006).
Lastly, concentration losses (or concentration polarization) occur when the rate of
mass transport of a species to or from the electrode limits current production.
Concentration losses occur mainly at high current densities owing to limited mass
transfer of chemical species by diffusion to the electrode surface. Either a limited
discharge of oxidized species from the electrode surface or a limited supply of
reduced species toward the electrode causes concentration losses at the anode. This
increases the ratio between the oxidized and the reduced species at the electrode

25
surface which can produce an increase in the electrode potential. At the cathode side,
the reverse may occur, causing a drop in cathode potential (Logan et al., 2006).
It is difficult from literature to compare MFC performance, due to different operating
conditions, surface area and type of electrodes and different organisms involved.
Moreover, different researchers use different units to indicate the performance of a
MFC (Pant et al, 2009). One of the most common unit is current density, which is
either represented as the current generated per unit area of the anode surface area
(mA/cm2 or mA/m
2) or current generated per unit volume of the cell (mA/m
3).
Table 2.2 shows the measure of current and power generation for different pure
cultures, substrates, materials of electrodes, and with or without mediator in MFC in
literature.
Table 2.2: The measure of current and power generation for different pure cultures,
compound, electrodes, with or without mediator in literature.
Pure Cultures Substrate Anode
material
Redox
Mediated
I
(Current,
mA)
P
(Power,
mW/m2)
References
Proteus vulgaris Glucose Glassy
carbon
X 0.7 85 Choi et al. (2003)
Shewanella
putrefaciens IR
Lactate Graphite
felt
0.04 0.6 Kim et al. (2002)
Shewanella
putrefaciens
lactate woven
graphite
0.031 0.19 Kim et al.(2002)
Geobacter
sulfurreducens
Acetate Plain
graphite
0.4 13 Bond and Lowley
(2003)
Rhodoferax
ferrireducens
Glucose Plain
graphite
0.2 8 Chaudhuri and
Lovley(2003)
Woven
graphite
0.57 17 Chaudhuri and
Lovley(2003)
Graphite
foam
0.4514 33 Chaudhuri and
Lovley(2003)
Pseudomonas
aeruginosa
Glucose Plain
graphite
0.1 88 Rabaey et al (2004)
Escherichia coli Lactate Woven
graphite
X 3.3 1.2 Park and Zeikus
(2003)
Plain
graphite
X 2.6 91 Park and Zeikus
(2003
2.11 Properties of genus Shewanella
Genus Shewanella are a type of gram-negative, facultative anaerobic bacteria mostly
found in aquatic and marine environments and can often be isolated from spoiling
fish. Usually, Shewanella are known to be the members of the γ-subclass of the
Proteobacteria that are rods, 0.4 – 0.7 μm in diameter, 2–3 μm in length, and motile
by a single polar flagellum (Venkateswaran et al., 1999). Many types of Shewanella
are grown in the laboratory with general growth media following enhancement from

26
environmental samples (Croal et., 2004)) with a range of salt concentrations,
temperatures, and barometric pressures and have distinct roles from food spoilage
organisms to symbionts, epibionts, and opportunistic pathogens. (Hau and Gralnick,
2007)
In the absence of oxygen, Shewanella is able to carry out anaerobic respiration by
using a broad range of final electron acceptors. This feature not only enables the
members of the genus Shewanella to survive in various environments with the
capacity of growing naturally almost anywhere, but also to be utilized for
bioremediation of contaminated environments by reducing some certain metals and
compounds in an altered state (Myers and Myers, 2002).
The isolation of the first Shewanella was performed in 1931 as one of various
contaminating microorganisms in charge of butter putrefaction (Nealson, 2002). In
1985, Shewanella putrefaciens was isolated, and no more reclassifications at the
genus level have been made up to date. Approximately 40 species are assigned to the
genus Shewanella based primarily on DNA at present: DNA hybridization and 16S
rRNA sequences.
As a genus, Shewanella are the most diverse respiratory organisms described so far.
There are roughly twenty inorganic and organic compounds that can be respired by
Shewanella and these have several insoluble metals and toxic elements. A partial list
are as follows:
Trimethylamine-N-oxide (TMAO) → Trimethylamine (Me3N),
Fe (III) Chelate and Fe (III) Oxide → Soluble Fe (II),
Mn (III and IV) Chelates and Mn (III and IV) oxides → Soluble Mn (II),
Sulfur/polysulfide → H2S, Sulfite → H2S, Thiosulfate→ H2S,
Dimethyl sulfoxide (DMSO) → Dimethylsulfide,
Arsenate → Arsenite, Fumarate, and Succinate.
The respiratory diversity of Shewanella is one of their greatest benefits in terms of
survival in the environment. The fact that all isolates seem to be facultative
anaerobes and the anaerobic electron acceptors are various, suggests these organisms
are normally localized in both oxic and anoxic environments. Oxygen can be limiting
in sediments, in intestinal tracts of higher organisms, and in organic-rich flocculates
such as marine snow and fecal pellets. Some aquatic systems are permanently or

27
temporarily stratified, allowing the formation of large anoxic zones. The respiratory
diversity of Shewanella allows them to breath almost anywhere. In anoxic
environments, Shewanella are likely to respire one if not several compounds. In
organic-rich flocculates the electron acceptor may be TMAO or DMSO. In
sedimentary environments, the electron acceptors may be insoluble iron or
manganese oxide minerals. The mechanism of anaerobic respiration in these
organisms is implicit at the genetic level for some compounds (Fumarate, DMSO,
TMAO, As, V, Fe, and Mn). Many of these compounds are reduced by terminal
reductases located outside of the cell, and reviews have recently concentrated on the
molecular details of this process (Croal et al, 2004, Weber et al., 2006). Additionally,
it is likely that the list of known substrates respired by Shewanella is not yet
complete. Most Shewanella strains are nonfermenters, but colonization with
fermenters would allow them to employ products of fermentation (lactate, formate,
hydrogen, and some amino acids) for anaerobic respiration (Nealson et al., 2005).
With a diverse group of electron acceptors, genus Shewanella have able to respire
and have shown an adaption to the life in extreme and different environments.
Shewanella can easily grow in the lab conditions and are open to genetic
manipulation. So, Shewanella have potential to remediate environmental pollutants
and in microbial fuel cells (MFCs), where their metabolism have capacity to
produce electricity (Gorby et al., 2006, Kim et al., 2002 Logan and Regan 2006a,
Logan and Regan 2006b)
Shewanella are superior candidates for potential use in pollutant bioremediation
among dissimilatory metal-reducing bacteria due to their intrinsic ability to respire
using a wide range of electron acceptors (Nealson et al, 2005). The solubility and
mobility of elements in soils, sediments, and water can be influenced with their
oxidation states. Microorganisms display one means by which changes in oxidation
states are catalyzed so that transport into rivers and groundwater can be blocked and
cleanup facilitated (Nealson et al, 2005, Tiedje, 2002). Applications might contain ex
situ remediation strategies and in situ bioremediation in storage tanks or areas of
environmental contamination (Nealson et al, 2005). As a result, understanding the
role of Shewanella, as well as other microorganisms in the oxidation of target
compounds and the results in varying these oxidation reactions are precursor factors
to optimize cleanup strategies. Bioremediation strategies consisting Shewanella can

28
be only applied in the laboratory and have not been used outside the lab yet. The
future applications of Shewanella in bioremediation strategies consist of cleanup of
contaminated global environments and groundwater. Since Shewanella mainly lives
in aqua, further studies will be focused on how Shewanella behave in soil and
contaminated groundwater environments (Hau and Gralnick, 2007).
2.12 Performance of the MFCs
In the initial years, simple substrates were commonly used in MFC system. In this
system, glucose (Park and Zeikus, 2000; Park and Zeikus, 1999; Rabaey 2004),
Acetate (Pham et al. 2003; Min et al., 2005; Bond and Lovley, 2003; Bond et al.,
2002), Starch, lactate, molasses (Niessen et al. (2004), Sucrose (Ieropoulos et al.,
2005; Lactate, (Kim et al., 1999d), pyruvate, (Kim et al., 1999c) was used as
substrate in literature.
In most of the MFC studies so far, acetate has been the substrate of choice for
electricity generation. The recalcitrance of many types of wastewater makes them
more difficult to be utilized as compared to acetate (Sun et al., 2009). Acetate is a
simple substrate and it is widely used as carbon source to induce electroactive
bacteria (Bond et al., 2002). In order to benchmark new MFC components, reactor
designs or operational conditions, acetate is commonly used as a substrate owing to
its inertness towards alternative microbial conversions (fermentations and
methanogenesis) at room temperature (Aelterman, 2009). Furthermore, acetate is the
end product of several metabolic pathways for higher order carbon sources (Biffinger
et al., 2008). Using a single-chambered MFC, Liu et al. (2005) reported that the
power generated with acetate (506 mW/m2, 800 mg/L) was up to 66% higher than
that produced with butyrate (305 mW/m2, 1000 mg/L). Very recently, Chae et al.
(2009) compared the performance of four different substrates in terms of CE and
power output.
Acetate-fed MFC showed the highest CE (72.3%), followed by butyrate (43.0%),
propionate (36.0%) and glucose (15.0%). At the same time, when acetate was
compared with a protein-rich wastewater as substrate in MFC, the MFC based on
acetate-induced consortia achieved more than 2-fold maximum electric power, and
one half of optimal external load resistance compared to the MFC based on consortia
induced by a protein-rich wastewater (Liu et al., 2009). Nonetheless, the protein-rich

29
wastewater being a complex substrate provides the possibility of enriching more
diverse microbial community than acetate. Having a more diverse microbial
community helps to use various substrates or to convert complex organics to simpler
compounds such as acetate that is used as electron donor for current production. Pant
et al., (2009) prepared a table which compares lots of different substrates used in
MFC and maximum current values ( Table 2.3).
The current, power density, CE and pollutants removal efficiencies differ between
the various studies according to the experimental conditions (initial wastewater
composition, concentration, and MFC set up conditions). Table 2.3 demonstrates the
current density (mA/cm2) at maximum power density (W/m2) achieved by using
various substrates in MFCs. With similar designs of MFC, 506 mW/m2 was
produced with acetate (Liu et al., 2005), but 261 mW/m2 with swine wastewater
(Min et al., 2005) and 146 mW/m2 with domestic wastewater (Liu and Logan, 2004).
The maximum power density which is produced appears to be related to the
complexity of the substrate (i.e. single compound versus several compounds).
Heilmann and Logan (2006) reported that with substrates like peptone and meat
processing wastewater containing many different amino acids and proteins, lower
power was produced than achieved using single compound like bovine serum
albumin (BSA). The power generation measured using xylose as substrate was lower
than studies with other fuels such as acetate or glucose (Huang et al., 2008).
Nevertheless, the fact that xylose bioconversion in MFCs takes place at room
temperature and relatively low substrate concentration levels, whereas anaerobic
digestion generally fails because of low reaction rates, may make the MFC a
complementary technology to the anaerobic digestion for celluloses and its
hydrolytes (Pham et al., 2006). Recently, while evaluating the potential of various
eco-systems in harnessing bioelectricity through benthic fuel cells, Venkata Mohan
et al. (2009) reported that the substrate concentration of the water body showed
significant influence on the power generation as they act as carbon source (electron
donor) for the benthic metabolic activity. Water bodies containing higher organic
matter were able to generate higher power output.

30
Table 2.3: Different substrates used in MFCs and the maximum current produced
Type of
substrate
Concentration Source
inoculum
Type of MFC (with
electrode surface
area and/or cell
volume)
Current
density
(mA/cm2)
at
Maximum
power
Reference
Acetate 1 g/L Pre-acclimated
bacteria from
MFC
Cube shaped one-
chamber MFC with
graphite fiber brush
anode (7170 m2/m3
brush volume)
0.8 Logan et al.
(2007)
Arabitol 1220 mg/L Pre-acclimated
bacteria from
MFC
One-chamber air-
cathode MFC (12 mL)
with nonwet
proofed carbon cloth as
anode (2 cm2) and
wet proofed carbon cloth
as cathode (7 cm2)
0.68 Catal et al.
(2008)
Corn stover
biomass
1 g/L COD Domestic
wastewater
One-chamber
membrane-less air-
cathode MFC
with carbon paper anode
(7.1 cm2) and carbon
cloth cathode
0.15 Zuo et al.
(2006)
Farm manure 3 kg in water
(20% w/v)
Self build up of
anaerobic
environment
One reactor vessel of
manure with anode at the
bottom and cathode
above the manure;
carbon
cloth electrodes (256
cm2)
0.004 Scott and
Murano
(2007)
Landfill
leachate
6000 mg/L Leachate and
sludge
Two-chambered MFC
with carbon veil
electrode
(30 cm2)
0.0004 Greenman
et al.
(2009)
Phenol 400 mg/L Mixed aerobic
activated sludge
and anaerobic
sludge (1:1, v/v)
Two-chambered MFC
with aqueous air
cathode,
carbon paper electrode
(25 cm2)
0.1
Luo et al.
(2009)
Artificial
wastewater
with
glucose and
glutamate
300 mg/L Anaerobic
sludge
Membrane-less MFC
with anode (465 cm2) at
bottom and cathode (89
cm2) at top of cylinder;
graphite felt as both
electrode
0.02 Jang et al.
(2004)
Brewery
wastewater
2240 mg/L Full strength
brewery
wastewater
One-chamber air-
cathode MFC with non-
wet
proofed carbon cloth as
anode (7 cm2) and wet
proofed carbon cloth
containing Pt as cathode
0.2
Feng et al.
(2008)
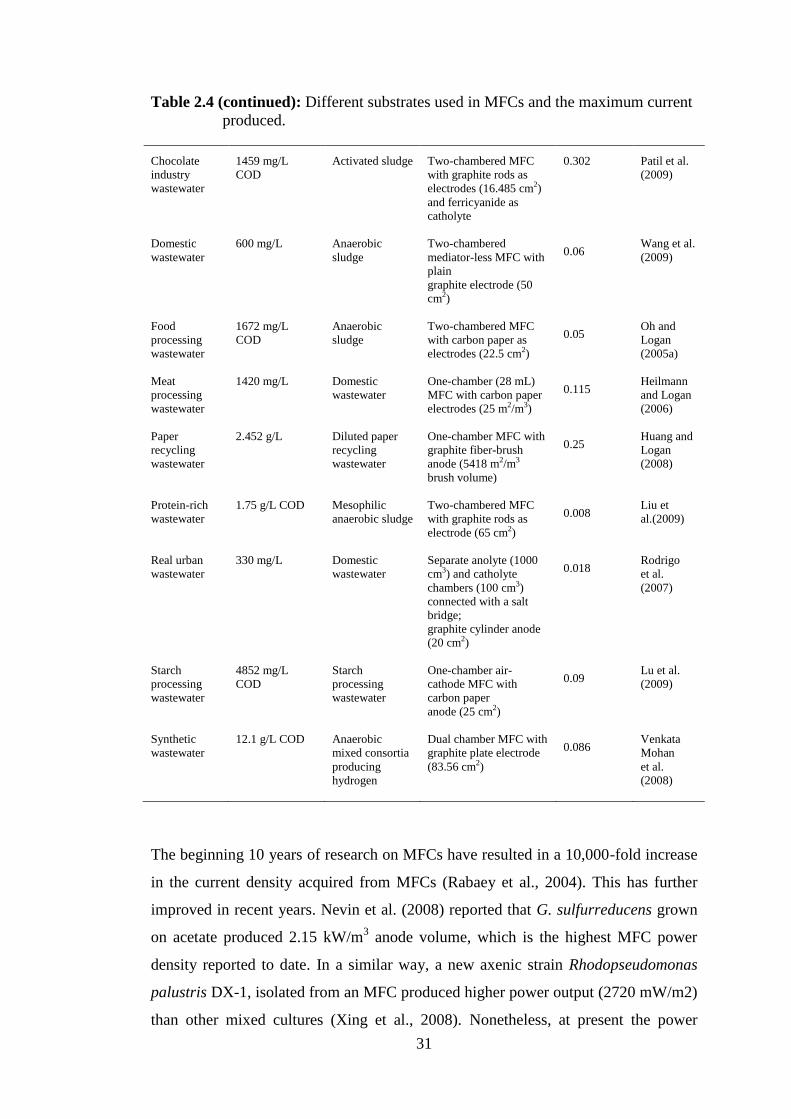
31
Table 2.4 (continued): Different substrates used in MFCs and the maximum current
produced.
Chocolate
industry
wastewater
1459 mg/L
COD
Activated sludge Two-chambered MFC
with graphite rods as
electrodes (16.485 cm2)
and ferricyanide as
catholyte
0.302 Patil et al.
(2009)
Domestic
wastewater
600 mg/L Anaerobic
sludge
Two-chambered
mediator-less MFC with
plain
graphite electrode (50
cm2)
0.06 Wang et al.
(2009)
Food
processing
wastewater
1672 mg/L
COD
Anaerobic
sludge
Two-chambered MFC
with carbon paper as
electrodes (22.5 cm2)
0.05 Oh and
Logan
(2005a)
Meat
processing
wastewater
1420 mg/L Domestic
wastewater
One-chamber (28 mL)
MFC with carbon paper
electrodes (25 m2/m3)
0.115 Heilmann
and Logan
(2006)
Paper
recycling
wastewater
2.452 g/L Diluted paper
recycling
wastewater
One-chamber MFC with
graphite fiber-brush
anode (5418 m2/m3
brush volume)
0.25 Huang and
Logan
(2008)
Protein-rich
wastewater
1.75 g/L COD Mesophilic
anaerobic sludge
Two-chambered MFC
with graphite rods as
electrode (65 cm2)
0.008
Liu et
al.(2009)
Real urban
wastewater
330 mg/L Domestic
wastewater
Separate anolyte (1000
cm3) and catholyte
chambers (100 cm3)
connected with a salt
bridge;
graphite cylinder anode
(20 cm2)
0.018 Rodrigo
et al.
(2007)
Starch
processing
wastewater
4852 mg/L
COD
Starch
processing
wastewater
One-chamber air-
cathode MFC with
carbon paper
anode (25 cm2)
0.09
Lu et al.
(2009)
Synthetic
wastewater
12.1 g/L COD Anaerobic
mixed consortia
producing
hydrogen
Dual chamber MFC with
graphite plate electrode
(83.56 cm2)
0.086 Venkata
Mohan
et al.
(2008)
The beginning 10 years of research on MFCs have resulted in a 10,000-fold increase
in the current density acquired from MFCs (Rabaey et al., 2004). This has further
improved in recent years. Nevin et al. (2008) reported that G. sulfurreducens grown
on acetate produced 2.15 kW/m3 anode volume, which is the highest MFC power
density reported to date. In a similar way, a new axenic strain Rhodopseudomonas
palustris DX-1, isolated from an MFC produced higher power output (2720 mW/m2)
than other mixed cultures (Xing et al., 2008). Nonetheless, at present the power

32
generated by MFCs is low from the view of large-scale wastewater treatment. In fact,
the only MFC type which has been used for practical applications is sediment MFCs
that harvest power from sediment by embedding an anode in sediment and
connecting it via an electrical circuit to a cathode placed in the overlying aerobic
seawater, making it feasible to power on-site to sensors and telemetry devices in
remote oceanic areas (Tender et al., 2008). It is expected that with time, given the
continued interest and support for this research, the output will reach a usable level
for other applications as well.
2.13 Uses of microbial fuel cells
2.13.1 Electricity generation
As mentioned before, MFCs are capable of converting the chemical energy which is
stored in the chemical compounds in a biomass to electrical energy with the help of
microorganisms. Since chemical energy from the oxidization of fuel molecules is
converted directly into electricity instead of heat, the Carnot cycle with a limited
thermal efficiency is avoided and theoretically a much higher conversion efficiency
can be achieved (70%) just like conventional chemical fuel cells (Du et al., 2007).
Chaudhury and Lovley (2003) reported that R. ferrireducens could produce
electricity with an electron yield as high as 80%. Rabaey et al. (2003) also reported a
higher electron recovery as electricity of up to 89%. An extremely high Coulombic
efficiency of 97% was reported during the oxidation of formate with the catalysis of
Pt black (Rosenbaum et al., 2006). Nevertheless, MFC power generation is still very
low (Tender et al., 2002; Delong and Chandler, 2002), that is the rate of electron
abstraction is very low. One practicable way to solve this problem is to store the
electricity in rechargeable devices and then distribute the electricity to end-users
(Ieropoulos et al., 2003). Capacitors were used in their biologically inspired robots
named EcoBot I to accumulate the energy generated by the MFCs and worked in a
pulsed manner. MFCs are especially convenient for to power small telemetry
systems and wireless sensors which have only low power requirements to transmit
signals such as temperature to receivers in remote locations (Ieropoulos et al., 2005;
Shantaram et al., 2005). MFCs themselves can serve as distributed power systems for
local uses, especially in underdeveloped regions of the world. They are considered
by some researchers as a perfect energy supply candidate for Gastrobots by self-
feeding the biomass collected by themselves (Wilkinson, 2000). Realistic

33
energetically autonomous robots would probably be equipped with MFCs that utilize
different fuels like sugar, fruit, dead insects, grass and weed. The robot EcoBot-II
solely powers itself by MFCs to perform some behavior including motion, sensing,
computing and communication (Ieropoulos et al., 2003; Melhuish et al., 2006).
Locally supplied biomass can be used to provide renewable power for local
consumption. Applications of MFCs in a spaceship are also possible as they can
supply electricity while degrading wastes generated onboard. Some scientists
visualize that in the future, a miniature MFC can be implanted in a human body to
power an implantable medical device with the nutrients supplied by the human body
(Chai, 2002). The MFC technology is particularly favored for sustainable long-term
power applications. Nevertheless, only after potential health and safety issues
brought by the microorganisms in the MFC are thoroughly solved, it could be
applied for this purpose (Du et al, 2007).
2.13.2 Wastewater treatment
The MFCs were considered to be used for treating waste water early in 1991
(Habermann and Pommer, 1991). Municipal wastewater contains a multitude of
organic compounds that can fuel MFCs. The amount of power generated by MFCs in
the wastewater treatment process can potentially halve the electricity needed in a
conventional treatment process which consumes a lot of electric power aerating
activated sludges. MFCs yield 50–90% less solids to be disposed of (Holzman,
2005).
Moreover, organic molecules such as acetate, propionate, butyrate can be thoroughly
broken down to CO2 and H2O. A hybrid incorporating both electrophiles and
anodophiles are especially suitable for wastewater treatment since more organics can
be biodegraded by a variety of organics. MFCs using certain microbes have a special
ability to remove sulfides as required in wastewater treatment (Rabaey et al., 2006).
MFCs can enhance the growth of bioelectrochemically active microbes during
wastewater treatment, therefore, they have good operational stabilities. Continuous
flow and single-compartment MFCs and membrane-less MFCs are favored for
wastewater treatment due to concerns in scale-up (Jang et al., 2004; Moon et al.,
2005; He et al., 2005). Sanitary wastes, food processing wastewater, swine
wastewater and corn stover are all great biomass sources for MFCs since they are
rich in organic matters (Liu et al., 2004; Oh and Logan, 2005a; Min et al., 2005b;

34
Zuo et al., 2006). Up to 80% of the COD can be removed in some cases (Liu et al.,
2004; Min et al., 2005b) and a Coulombic efficiency as high as 80% has been
reported (Kim et al., 2005).
2.13.3 Biosensor
A biosensor consists of two components: a bioreceptor and a transducer. The
bioreceptor is a biomolecule that recognizes the target analyte, and the transducer
converts the recognition event into a measurable signal.
Another potential application of the MFC technology is to use it as a sensor for
pollutant analysis and in situ process monitoring and control (Chang et al., 2004,
2005). The proportional correlation between the Coulombic yield of MFCs and the
strength of the wastewater make MFCs possible biological oxygen demand (BOD)
sensors (Kim et al., 2003). An accurate method to measure the BOD value of a liquid
stream is to calculate its Coulombic yield. A number of works (Chang et al., 2004;
Kim et al., 2003) demonstrated a good linear relationship between the Coulombic
yield and the strength of the wastewater in a quite wide BOD concentration range.
Nonetheless, a high BOD concentration requires a long response time since the
Coulombic yield can be calculated only after the BOD has been depleted unless a
dilution mechanism is in place. Efforts have been made to improve the dynamic
responses in MFCs used as sensors (Moon et al., 2004). A low BOD sensor can also
show the BOD value based on the maximum current because the current values
increase with the BOD value linearly in an oligotroph-type MFC. During this stage,
the anodic reaction is limited by substrate concentration. This monitoring mode can
be applied to real-time BOD determinations for either surface water, secondary
effluents or diluted high BOD wastewater samples (Kang et al., 2003). MFC-type of
BOD sensors are advantageous over other types of BOD sensor since they have
excellent operational stability and good reproducibility and accuracy. An MFC-type
BOD sensor constructed with the microbes enriched with MFC can be kept
operational for over 5 years without extra maintenance (Kim et al., 2003), far longer
in service life span than other types of BOD sensors reported in the literature.
Kumblanghan et al. (2007) showed the development of a MFC sensor system for fast
estimation of easily biodegradable organic matter. The sensor system was operated
by integrating with an anaerobic bioreactor for continuous supply of stable anaerobic
consortium. Replacement of the biological recognition element was carried out for

35
each sample analysis. The system still gives stable measurement with a good
reproducibility. The sensor response time was estimated around 3–5 min and did not
have to wait for the metabolic recovery of anaerobic consortium in the anodic
compartment. This is considered as an advantage for this sensor system
configuration. Even though glucose was used as the only preliminary substrate in the
current study to evaluate the sensor performance under the well-controlled condition,
the MFC sensor system used mixed consortium originated from anaerobic sludge
should also be able to degrade other kinds of organic matter even in more complex
form. Nevertheless, the MFC sensor needs in its present configuration maintenance
in terms of regular membrane cleaning. The sensitivity and the detection limit of the
sensor system can definitely be improved even further by improving the efficiency of
ions transport in the electrolyte.
Furthermore, MFC-based biosensor can act as online toxicity sensor. Electrical
current is a direct linear measure for metabolic activity of electrochemically active
microorganisms. Microorganisms gain energy from anodic overpotential and current
is strongly dependent on anodic overpotential. Thus, control of anodic overpotential
is necessary to detect toxic events and prevent false positive alarms (Stein et al,
2010).
In the second part of this thesis, MFCs were used as biosensors. Some xenobiotics
(antibiotics and hormones) were tried as inhibitory matters in the this system and
detected of bacteria’s response.
2.14 Xenobiotics in aquatic environment
Xenobiotics (the term is derived from the Greek words xenos which means foreigner
or stranger and bios which means life) are chemicals found in an organism which,
however, are not normally produced (or expected to be present in it). Especially,
pharmaceuticals (medicines) such as antibiotics are xenobiotics in humans since the
human body does not produce them itself, nor are they part of a normal diet. Natural
compounds can also become xenobiotics if they are taken up by another organism,
such as the uptake of natural human hormones by fish found downstream of sewage
treatment plant outfalls, or the chemical defenses produced by some organisms as
protection against predators. Nonetheless, the term xenobiotics is very often used in
the context of pollutants such as dioxins and their effect on the biota since

36
xenobiotics are interpreted as substances foreign to an entire biological system, i.e.
artificial substances, which did not exist in nature before their synthesis by humans.
Less amount of human and animal medicines have been detected in many countries
in groundwater, drinking water, surface water, seawater and wastewater treatment
plant (WWTP) effluents. For some pharmaceuticals, effects on aquatic organisms
have been investigated in acute toxicity tests.
What kind of xenobiotics and what concentrations occur in the aquatic environment?
What is the fate in surface water and in Wastewater Treatment Plant (WWTP)? What
are the modes of action of these compounds in humans and are there similar targets
in lower animals? What acute and chronic ecotoxicological effects may be elicited by
pharmaceuticals and by mixtures? What are the effect concentrations and how do
they relate to environmental levels? (Fent et al, 2005)
Xenobiotics such as pharmaceticals that are not readily degraded in the wastewater
treatment plant (WWTP) are being discharged in treated effluents resulting in the
contamination of water sources such as rivers, lakes, estuaries, groundwater and
drinking water. When wastewater sludge is applied to agricultural fields, not only
contamination of soil, runoff into surface water but also drainage may occur. Figure
2.9 shows principal pathway of environmental exposure to drugs consumed in human
and veterinary medicine. It is significant that environmental concern is not
necessarily a high production volume of a certain pharmaceuticals by itself, but the
environmental persistence and critical biological activity (e.g. high toxicity, high
potency for effects on biological key functions such as reproduction) (Fent et al,
2005).

37
Figure 2.9: Pathway of environmental exposure to drugs consumed in human and
veterinary medicine (illustrated from Diaz-Cruz et al., 2003).
2.14.1 Antibiotics in Aquatic Environment
During last decades, although antibiotics have been used lots amount, until recently
the existence of these substances in the environment has received little notice. It is
only in recent years that a more complex investigation of antibiotic substances in
some countries has been undertaken in order to permit an assessment of the
environmental risks they may pose.
2.14.1.1 Source
Pharmaceuticals are discharged after application in their native form or as
metabolites and enter aquatic systems with different ways as mentioned before. The
main source from humans is ingestion following excretion and disposal via
wastewater. Therefore, municipal wastewater is the main route that brings human
pharmaceuticals after normal use and disposal of unused medicines into the
environment. Wastewaters comes from manufacturers, hospital and landfill leachates
(Holm et al., 1995) and may contain significant concentrations of pharmaceuticals.
Veterinary pharmaceuticals may also enter aquatic environment via manure
application to fields and after runoff. Furthermore, they may enter via direct
application in aquaculture such as fish farming.
38
An antibiotic is a chemotherapeutic agent that inhibits the growth of microorganisms,
such as bacteria, fungi, or protozoa. Chemotherapeutical refers to compounds used
for the treatment of disease that kill cells, specifically microorganisms. There are
more than 250 different chemical entities registered for use in medicine and
veterinary medicine (Kümmerer and Henninger, 2003).
2.14.1.2 Modes of Action
All antibiotics have different modes of action by which they act as therapeutic
agents. Some modes of action of different antibiotics are mentioned below:
Cell Wall Synthesis Inhibitors: Bacteria contain peptidoglycan (a polymer consisting
of sugars and aminoacids that forms a mesh-like layer outside the plasma membrane
of bacteria) which is highly essential in maintaining the cell wall structure. Cell wall
synthesis inhibitors such as beta-lactams, cephalosporins and glycopeptides block the
ability of microorganisms to synthesize their cell wall by inhibiting the synthesis of
peptidoglycan.
Interfering with Protein Synthesis: These classes of antibiotics inhibit the protein
synthesis in the cell. For instance, tetracyclines, erythromysin and aminoglycosides.
Cell Membrane Inhibitors: Antibiotics such as polymyxins disrupt the integrity and
structure of cell membranes, thereby killing them. These set of antibiotics are mostly
effective on gram negative bacteria since these are the bacteria that contain a definite
cell membrane.
Effect on nucleic acids: DNA and RNA are extremely essential nucleic acids present
in every living cell. Antibiotics such as quinolones and rifamycins bind to the
proteins which are required for the processing of DNA and RNA, thus blocking their
synthesis and thereby affecting the growth of the cells.
Competitive inhibitors: They are also named anti-metabolites, these are antibiotics
that competitively inhibit the significant metabolic pathways occurring inside the
bacterial cell. The important ones in this class are sulfonamides such as
sulfamethoxazole.
Figure 2.10 shows modes of action of some antibiotics.

39
Figure 2.10: Modes of action of some antibiotics (Url-1).
Antibiotics can be grouped according to either their chemical structure or mechanism
of action. They are a diverse group of chemicals that can be divided into different
sub-groups such as ß-lactams (e.g. amoxicillin), quinolones (e.g. ciprofloxacin),
tetracyclines (e.g. doxycycline), macrolides (e.g. erythromycin), sulphonamides (e.g.
sulfamethoxazole) and others.
In this study, three different antibiotics (erythromycin, sulfomethoxazole and
tetracycline) were used. Material Safety Data Sheet (MSDS) can be seen Table 2.4.
Wise (2002) estimated antibiotic consumption worldwide to lie between one hundred
thousand and two hundred thousand ton annually. In 1996, about ten-two hundred
ton of antibiotics were used in the EU, of which approximately 50% was applied in
veterinary medicine and as growth promoters. In 1999, there were a total of thirteen
thousand two hundred sixteen ton of antibiotics used in the European Union and
Switzerland, 65% of which was applied in human medicine, according to European
Federation of Animal Health (Kummerer, 2009). In the United States, one estimate is
that 50% of the twenty two thousand seven hundred metric tons of all antimicrobials
prescribed annually are for humans and 50% for use in animals, agriculture and
aquaculture.
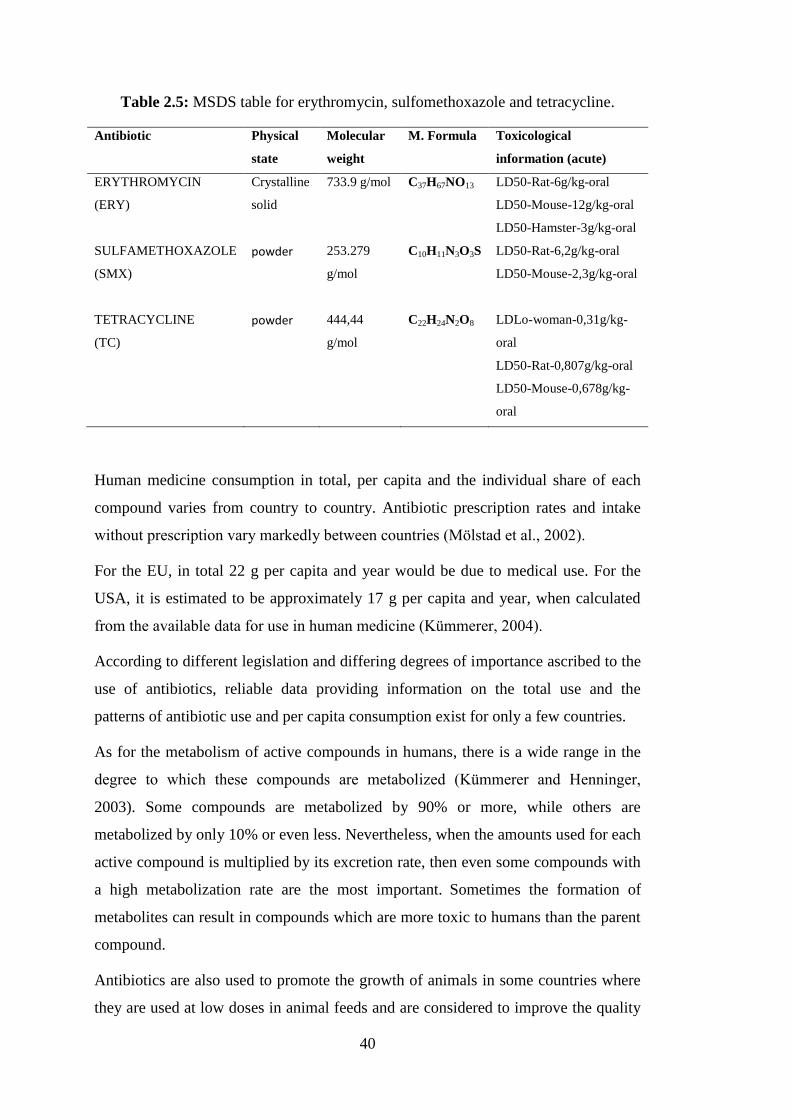
40
Table 2.5: MSDS table for erythromycin, sulfomethoxazole and tetracycline.
Antibiotic Physical
state
Molecular
weight
M. Formula Toxicological
information (acute)
ERYTHROMYCIN
(ERY)
Crystalline
solid
733.9 g/mol C37H67NO13 LD50-Rat-6g/kg-oral
LD50-Mouse-12g/kg-oral
LD50-Hamster-3g/kg-oral
SULFAMETHOXAZOLE
(SMX)
powder 253.279
g/mol
C10H11N3O3S LD50-Rat-6,2g/kg-oral
LD50-Mouse-2,3g/kg-oral
TETRACYCLINE
(TC)
powder 444,44
g/mol
C22H24N2O8 LDLo-woman-0,31g/kg-
oral
LD50-Rat-0,807g/kg-oral
LD50-Mouse-0,678g/kg-
oral
Human medicine consumption in total, per capita and the individual share of each
compound varies from country to country. Antibiotic prescription rates and intake
without prescription vary markedly between countries (Mölstad et al., 2002).
For the EU, in total 22 g per capita and year would be due to medical use. For the
USA, it is estimated to be approximately 17 g per capita and year, when calculated
from the available data for use in human medicine (Kümmerer, 2004).
According to different legislation and differing degrees of importance ascribed to the
use of antibiotics, reliable data providing information on the total use and the
patterns of antibiotic use and per capita consumption exist for only a few countries.
As for the metabolism of active compounds in humans, there is a wide range in the
degree to which these compounds are metabolized (Kümmerer and Henninger,
2003). Some compounds are metabolized by 90% or more, while others are
metabolized by only 10% or even less. Nevertheless, when the amounts used for each
active compound is multiplied by its excretion rate, then even some compounds with
a high metabolization rate are the most important. Sometimes the formation of
metabolites can result in compounds which are more toxic to humans than the parent
compound.
Antibiotics are also used to promote the growth of animals in some countries where
they are used at low doses in animal feeds and are considered to improve the quality
41
of the product, with a lower percentage of fat and higher protein content in the meat.
The use of even small amounts of antibiotics is associated with the selection of
resistance in pathogenic bacteria. Alternatives to improve the quality of the product
with a lower percentage of fat and a higher protein content in the meat without using
antibiotics are available. The use of antibiotics as growth promoters in animal
farming has been banned for the last several years in the European Union and some
other countries such as Sweden and Switzerland (Kummerer, 2009).
Since the 1950s, antibiotics have been used to control certain bacterial diseases of
fruit, vegetable, and ornamental trees. To be a viable candidate for disease control,
the antibiotic needed to: (i) be active on or inside of the plant; (ii) tolerate oxidation,
UV irradiation, rainfall, and high temperatures.
Aquaculture represents that farming of some aquatic organisms including fish,
molluscs, crustaceans and aquatic plants. Farming implies some sort of intervention
in the rearing process to enhance production, such as regular stocking, feeding and
protection from predators. In aquaculture, antibiotics have been used mainly for
therapeutic purposes and as prophylactic agents.
2.14.1.3 Occurence
Antibiotics are only partially eliminated in sewage treatment plants. If they are not
eliminated during the purification process, they pass through the sewage system and
may end up in the environment, mainly in the water compartment. Residual amounts
can reach surface waters, groundwater or sediments.
Active substances discharged with liquid manure can be washed off from the top soil
after rain. Moreover, direct discharge, especially from poultry processing, meat
processing, and aquaculture, as well as from pets (e.g. aquariums) is also possible
and can contribute towards an increase in the total concentration of antibiotics in
sewage and surface water.
Generally, concentrations were in the higher µg/Lrange in hospital effluent, in the
lower µg/L range in municipal waste water, and in the higher and lower µg/L range
in different surface waters, ground water and sea water in a harbour (Xu et al., 2007).
Antibiotics have also rarely been found in drinking water (Ye et al., 2007).
Examples of measured concentrations of antibiotics in aquatic environment may be

42
given in literature. Giger et al. (2003) analyzed that the concentration of
erythromycin-H2O was 287 nanogram/L in sewage treatment plant effluent. Farber
et al.(2002) found that 370 nanogram/L in sewage treatment plant effluent for
sulfamethoxazol and 20 nanogram/L for tetracycline . Sulfamethoxazol was detected
40 nanogram/L in surface water and 20 nanogram/L in ground water.
2.14.1.4 Elimination (Fate)
Elimination of organic compounds in the environment is the result of different
processes. These processes can be biotic ones, such as biodegradation by bacteria
and fungi. Non-biotic elimination processes are sorption, photolysis, hydrolysis,
oxidation and reduction.
In general, sorption of acidic pharmaceuticals to sludge is suggested to be not very
important for the elimination of pharmaceuticals from wastewater and surface water.
Thus, levels of pharmaceuticals in digested sludge and sediments are suggested to be
relatively low, as it was demonstrated in several monitoring studies (Ternes et al.,
2004; Urase and Kikuta, 2005).
The sorption behavior of antibiotics can be very complex and difficult to assess.
Binding to particles or the formation of complexes may cause a loss in detectability,
as well as a loss in antibacterial activity. The loss of antibacterial activity, for
instance, was demonstrated for an aquaculture antimicrobial in seawater driven by
the formation of complexes with the magnesium and calcium naturally present in
marine water. Tetracyclines are able to form complexes with double cations, such as
calcium or magnesium (Christian et al.,2003). Humic substances may alter the
surface properties and sites available for sorption and reactions. They can either
suppress or promote sorption of organic compounds to mineral surfaces. Limited
evidence in the literature points to the reduction in sorption of the antibiotic
tetracycline to clay minerals in the presence of humic substances. Gu and
Karthikeyan (2008) report strong interaction between humic acids, hydrous Al oxide
and the effect of this association on tetracycline sorption. The presence of humic
substances, in both dissolved and mineral-bound forms, is likely to increase the
environmental mobility of tetracycline compounds.
If a substance is light sensitive, photo-decomposition may be of major significance
in the elimination process. Some antibiotics are light sensitive (e.g. tetracyclines,

43
sulphonamides). Nonetheless, not all compounds are photo-degradable (Turiel et al.,
2005).
The significance and extent of direct and indirect photolysis of antibiotics in the
aquatic environment are different for each compound. Studies taking into
consideration indirect photolysis and interaction with dissolved organic matter such
as humic acids are rare (Sukul et al., 2008). Such data would be helpful in order to
comprehend better the fate of antibiotics in surface waters. Tetracyclines are
susceptible to photo-degradation. Samuelsen (1989) investigated the sensitivity of
oxytetracycline towards light in seawater as well as in sediments. The antibacterial
substance proved to be stable in sediments rather than in seawater.
Another significant pathway for the non-biotic elimination of organic substances in
the environment is hydrolysis. Some instability in water could be demonstrated for
some tetracycylines (Halling-Sørensen, 2000). In general, the hydrolysis rates for
oxytetracycline increase as the pH deviates from pH 7 and as temperature increases.
The half-lives of oxytetracycline under investigation varied due to differences in
temperature, light intensity and flow rate from one test tank to another. Nevertheless,
sulphonamides and quinolones are resistant to hydrolysis.
Antibiotic formulation effluents are well known for the difficulty of their elimination
by traditional bio-treatment methods and their important contribution to
environmental pollution is due to their fluctuating and recalcitrant nature. For
advanced effluent treatment, oxidation processes are usually applied. However,
ozonation will not work well for all types of molecules. The presence of carbon–
carbon double bonds, aromatic bonds or nitrogen is a necessary prerequisite.
Nonetheless, the presence of these structural elements does not guarantee the fast and
full degradation or even the mineralization of a molecule (Kummerer, 2009).
The effect of ozonation on the degradation of oxytetracycline in aqueous solution at
different pH values (3, 7 and 11) was investigated by Li et al. (2008). The results
show that ozonation as a partial step in a combined treatment concept is a potential
technique for biodegradability enhancement for effluents from pharmaceutical
industries containing high concentrations of oxytetracycline, provided that the
appropriate ozonation period is selected.
It has been shown that COD (chemical oxygen demand) removal rates increase with

44
the increasing of pH as a consequence of enhanced ozone decomposition rates at
elevated pH values. The results of bioluminescence data demonstrate that the initial
by-products after partial ozonation (5–30 min) of oxytetracycline were more toxic
than the parent compound (Li et al., 2008).
Sulfamethoxazole was efficiently degraded by ozonation (Dantas et al., 2007). The
complete sulfamethoxazole removal was achieved for an in photo-Fenton process
(González et al., 2007).
Most antibiotics which have been tested to date have not been biodegradable under
aerobic conditions. No evidence of biodegradation for tetracycline was observed
during a biodegradability test (sequence batch reactor), and sorption was found to be
the principal removal mechanism for tetracycline in activated sludge (Kim et al.,
2005).
2.14.1.5 Effects
If a substance is not eliminated in any way, it can reach the environment with the
potential of adversely affecting aquatic and terrestrial organisms. It might reach
humans again via drinking water. Until now, antibiotics have not yet been reported to
be present in drinking water, only certain pharmaceuticals and diagnostics such as
clofibric acid or amidotrizoic acid have been reported to date (Kümmerer, 2003).
The effects of antibiotics on human health have been reported in the medical
literature.
Tetracycylines should not be applied for young children owing to the negative
interaction of tetracyclines with their developing teeth. Due to their antimicrobial
activity, a negative interaction within the gut can happen within therapy.
Antibiotics are of particular interest since we currently do not know whether their
presence in natural waters contributes to the spread of antibiotic resistance in
microorganisms (Kümmerer, 2003). Generally, the effects of antibacterial agents on
bacteria and microalgae are found to be 2–3 orders of magnitude below the toxic
values for higher trophic levels (Brain et al., 2004, 2008; Robinson et al., 2005;
Yamashita et al., 2006). This differential sensitivity is likely dependent on
differences in metabolic potential as well as uptake kinetics (Brain et al., 2008).
Adverse impacts of antibiotics on higher aquatic organisms have been reported,

45
however, in most cases in which effects were detected the concentrations were
environmentally irrelevant. Nevertheless, secondary effects due to changes in the
natural balance are not negligible.
Acute tests seem to be inappropriate as a means of determining the effects of
antibiotics on bacteria. Antibiotics possess specific modes of operation and impacts
frequently become evident upon extending the incubation period. Toxicity tests with
bacteria have demonstrated that chronic exposure to antibiotics is critical rather than
acute (Backhaus and Grimme, 1999, 2000; Froehner et al., 2000; Kümmerer et al.,
2004). Thomulka and McGee (1993) determined the toxicity of a number of
antibiotics (e.g. novobiocin, tetracycline, chloramphenicol, ampicillin, streptomycin)
on Vibrio harveyi in two bioassay methods. Almost no toxic effects were found after
short incubation times when luminescence was used as an endpoint. Nonetheless, in
a long term assay using reproduction as an endpoint a toxic effect in environmentally
relevant concentrations could be detected for almost all the substances.
Thus, one should be aware that the results given for standard bacterial toxicity tests,
such as shortterm tests with the luminescent bacterium Vibrio fisheri and others, may
underestimate effects and risks.
Effectiveness may be modulated by environmental conditions e.g. if bio-availability
is redsulfomeuced by sorption or activity is affected by complexation. If a substance
is not eliminated in any way, it can reach the environment with the potential to
adversely affect the aquatic and terrestrial organisms.
Antibiotics have the potential to affect the microbial community in sewage systems.
The inhibition of waste water bacteria may seriously affect organic matter
degradation; thus, effects of antibacterial agents on the microbial population are of
great interest. A reduction in the number of bacteria together with alterations in
microbial populations were observed in a model sewage purification system when
different commonly applied antibiotics were added in concentrations that may occur
in hospital waste water (Kümmerer et al., 2000).
Several antibiotics proved to have low toxicity in relation to nitrifying bacteria in
acute tests. These substances showed no effects upon nitrification in concentrations
even higher than what might be environmentally expected (Kummerer, 2009).
Nevertheless, the time period of the test significantly influences the results

46
(Halling-Sørensen, 2000; Kümmerer et al., 2004). An antimicrobial was found to
require high concentrations in order to inhibit the nitrification process in a short term
test (2–4 h), however, a prolonged test period over 5 day showed effects one order of
magnitude below the inhibitory concentrations of the acute test (Kummerer, 2009).
In a study by Dokianakis et al. (2004), the effects caused by the presence of seven
different pharmaceuticals on a culture of nitrite-oxidizing bacteria isolated from
activated sludge were reported. For ofloxacin and sulfamathoxazole, significant
inhibition was observed.
Substances which are not or are only partly eliminated in the sewage treatment plant
will reach surface water where they may affect organisms of different trophic levels.
In a model aquatic system using synthetic fresh water, nitrifying bacteria were
remarkably affected by an aquaculture antibiotic. The disruption of the nitrification
process already occurred in concentrations likely to be found in fish treatment tanks
and sediments (Kummerer, 2009). The results of toxicity tests with bacteria point out
that adverse toxic effects on natural bacterial communities cannot be excluded. Blue–
green algae (cyanobacteria) seem to be sensitive to many antibiotics, for instance
amoxicillin, benzyl penicillin, tetracycline and tiamulin (Boxall et al., 2003). As
algae are the basis of the food chain, even slight decreases in the algal population
may affect the balance in an aquatic system.
In a study by Kim et al. (2007) sulfamethoxazole, sulphachlorpyridazine,
sulfathiazole, sulphamethazine, sulphadimethoxine, and trimethoprim were examined
for their acute aquatic toxicity by employing a marine bacterium (Vibrio fischeri), a
freshwater invertebrate (Daphnia magna), and the Japanese medaka fish (Oryzias
latipes). In this study, Daphnia was in general the most susceptible among the test
organisms. Predicted environmental concentrations (PECs) derived for the test
pharmaceuticals in Korea ranged between 0.14 and 16.5µg/L.
In another study (Park and Choi, 2008), eleven commonly used antibiotics including
sulphonamides, tetracyclines, aminoglycosides, fluoroquinolones, and ß-lactams
were evaluated for their acute and chronic aquatic toxicities using standard test
organisms e.g. Vibrio fischeri, Daphnia magna, Moina macrocopa, and Oryzias
latipes. Among the antibiotics tested for acute toxicity, neomycin was the most toxic
followed by trimethoprim, sulfamathoxazole and enrofloxacin. Sulphamethazine,
oxytetracycline, chlortetracycline, sulphadimethoxine and sulfathiazole were of

47
intermediate toxicity, whereas ampicillin and amoxicillin were the least toxic for the
test organisms. There were no trends in sensitivity among test organisms or among
the different classes of antibiotics.
2.14.2 Estrogens (Hormones) in Aquatic Environment
Environmental estrogens are chemical pollutants that can disrupt the endocrine
system of animals by binding to and activating the estrogen receptor(s). They include
both natural and synthetic steroid estrogens (Jobling et al., 2003).
Natural estrogens such as estrone (E1), 17β-estradiol (E2), estriol (E3), and the
particularly recalcitrant synthetic estrogen 17α-ethinylestradiol (EE2) used as oral
contraceptive accumulate in the environment and may cause health problems
(Cajthaml et al., 2009).
Natural estrogen is a steroid compound hormone which plays a central role in other
uniquely female functions, such as reproduction and lactation. Synthetic estrogen
that is hugely used as an oral contraceptive bind to the estrogen receptor and can
misregulate or interfere with normal biological responses (Soto et al., 1991).
A steroid is a type of organic compound which contains a specific arrangement of
four cycloalkane [alkanes are types of organic hydrocarbon compounds which have
only single chemical bonds in their chemical structure. Cycloalkanes consist of only
carbon (C) and hydrogen (H) atoms and are saturated since there are no multiple C-C
bonds to hydrogenate (add more hydrogen to).
A general chemical formula for cycloalkanes would be CnH2(n+1-g) where n = number
of C atoms and g = number of rings in the molecule] rings that are joined to each
other.
Chemical formula of natural and synthetic estrogens can be seen figure 2.11.

48
Figure 2.11: The structure of a)17 β Estradiol b)Estrone c)17 α Ethynylestradiol
d) Estriol (Url-2)
2.14.2.1 Sources
Synthetic steroid hormones in contraceptive pills, the annual production lies in a
couple of hundreds kilograms per year in the EU, is quite persistent in the
environment and shows estrogenic activity in fish at 1–4 ng/L, or lower. Hence,
pharmaceuticals having environmental relevance share the following properties:
often, but not always, high production volume combined with environmental
persistence and biological activity, mainly after long-term exposure (Fent et al,
2006).
Many researchers have found estrogenic compounds in streams, rivers, and lakes
throughout the world, as well as in the effluent of wastewater treatment plants in the
a)17-Estradiol Molecular Formula:C18H24O2 Molecular Weight:272.4
b)Estrone
Molecular Formula: C18H22O2 Molecular Weight: 270.4
c)17-Ethynylestradiol
Molecular Formula: C20H24O2 Molecular Weight: 296.4
d)Estriol
Molecular Formula: C18H24O3 Molecular Weight: 288.4
49
USA, Europe, Asia, South America, and Australia. These compounds generally come
from human extreta since wastewater treatment plants simply act as collectors that
funnel our waste, and the hormones or hormone mimics in that waste, into the
environment.
Synthetic estrogens from contraceptive pills, hormone-replacement therapy,
surfactants, and plasticizers, as well as natural estrogens discharged by people in
their urine, all end up in our wastewater and, from there, can be discharged into our
rivers and lakes. This discharge becomes a significant problem in areas with large
wastewater flows which can, in some instances, contribute the bulk of the water in a
stream. Additionally, some estrogenic compounds degrade poorly and remain in the
environment for long periods of time, where they can spend more time interacting
with fish. In addition to studies that have shown the widespread and global presence
of estrogenic compounds in lakes and rivers, other studies have reported the effects
of these compounds on wildlife. For instance, many studies have identified abnormal
sexual development in fish populations, which has been considered to be a result of
exposure to the effluent from nearby wastewater treatment plant (Jobling et al., 1998,
Vajda et., 2008). In perhaps the most striking and disturbing study to date, scientists
performed a seven-year-whole-lake experiment in northwestern Ontario, Canada, in
which very low levels of the active compound in contraceptive pills were added to a
lake by the scientists themselves. In addition to observing abnormal sexual
development of fathead minnows in the lake, investigators discovered that the
minnow population decreased to near the point of extinction (Kidd et al., 2007). In
the future, whole populations of fish can be at risk from estrogenic pollution, which
can produce dramatic ecological effects by altering whole food webs (Lundgren M.S.
and Novak, P.J., 2010).
2.14.2.2 Occurence and elimination (fate)
Steroidal hormones have been reported on in many reports. These steroids have been
found in numerous studies in many countries both in wastewater and surface water.
A survey in the U.S.A. demonstrated that maximal and median EE2 concentrations
were as high as 831 and 73 ng/L, respectively (Kolpin et al., 2002). They were
detectable in 16 and 10% of the streams sampled. Generally, median concentrations
are much lower being in the range of nondetectable up to 9 ng/L in treated
wastewater in several countries (Baronti et al., 2000). Typical wastewater effluent

50
concentrations are 0.5 ng/L and they are even lower in surface water. Nonetheless,
these concentrations must put into the perspective of their high biological activity
accounting for potential estrogenic effects on fish.
The processes participating in their removal from soil, wastewater, water sediments,
groundwater-aquifer material, and wastewater or sewage treatment plant effluents
may involve the action of bacterial and microbial consortia, and in some cases fungi
and algae.
To assess the role of bacterial degradation in the fate of estrogenic steroids in the
environment, the transformation of estrogens was studied under both aerobic and
anaerobic conditions. Czajka and Londry (2006) investigated the potential for
anaerobic biodegradation of EE2 and E2 using cultures established from lake water
and sediments. No anaerobic degradation of EE2 (5 mg/L) was observed in their
experiments. Even though E2 could be transformed to estrone, the complete
degradation of estrogens was minimal, suggesting that they accumulate in anoxic
environments. On the contrary, a rapid degradation of four estrogens, including EE2,
was observed in river water-sediments and groundwateraquifer material under
aerobic conditions (Sarmah and Northcott, 2008). The 90% dissipation time values
for all compounds ranged from 0.9 to 2.8 days under both conditions. Nevertheless,
under anaerobic conditions, the 90% dissipation time values for EE2 exceeded 1000
days. Anaerobic degradation of estrogenic compounds in this study was attributed to
the sulfate-, nitrate-, and iron-reducing conditions. It was also postulated that overall
degradation of the compounds was influenced by abiotic factors accounting for up to
40% degradation. The authors suggested that these abiotic factors could include
hydrolysis, chemical reduction, photolysis, irreversible sorption or volatilization.
Moreover, they stated that E2, EE2 can also undergo surfaced-induced abiotic
transformation due to the catalytic effect of various clay minerals.
In a similar way, Ying et al. (2003) reported an aerobic degradation of E2 and 4-n-
nonylphenol in the aquifer material with a half-life of the chemicals equal to 2 and 7
days. EE2 was degraded slowly with an estimated half-life of 81 days, with little or
no degradation of estrogens observed within 70 days under anaerobic conditions in
native groundwater. In another experiment, Ying et al. (2008a) described faster
degradation of EE2 under aerobic conditions in effluent supplemented or
unsupplemented aquifer material. EE2 had a half-life of 15 days compared with 26

51
days in the aquifer material and groundwater microcosm. Biodegradation was not
important under anoxic conditions. Higher resistance of EE2 to biodegradation, when
compared to E2, was proven also with microorganisms from water samples of
English and Japanese rivers (Jurgens et al., 2002; Matsuoka et al., 2005). Aerobic
degradation of endocrine disrupting compounds which are E2, EE2 in seawater
collected from the coastal area of South Australia showed that the chemicals could be
degraded by aerobes in seawater once the microbes in water became acclimated to
the chemicals (Ying and Kookana, 2003). The study demonstrated that EE2 (together
with bisphenol A and E2) was degraded in water within 56 days with a lag phase
preceding its fastest degradation. EE2 was also found to be degraded in the marine
sediment under aerobic conditions (t1/2 > 20 d), whereas under anaerobic conditions
no degradation was noted. In comparison with aquifer and marine environments,
relatively fast EE2 degradation was reported in agricultural soils and nitrifying
activated sludge (Vader et al., 2000; Colucci and Topp, 2001a,b). Shi et al. (2004)
showed the link between the ammonia oxidizing bacteria (AOB) from nitrifying
activated sludge and biodegradability of natural and synthetic estrogens, including
EE2. The addition of allylthiourea, an ammonia oxidation inhibitor, significantly
reduced the estrogen-degrading activity of activated sludge and inhibited the growth
of AOB. These results suggested that other microorganisms aside from AOB are also
involved in estrogen degradation by nitrifying activated sludge. The estrogen
degradation potential of AOB was further demonstrated with an isolated strain of
Nitrosomonas europaea when the strain was able to decompose 1 mg/L of EE2
within 96 h during a batch experiment. Its ability of estrogen degradation was also
inhibited by allylthiourea (Shi et al., 2004).
Recently, several studies characterized the estrogen degradation potential of various
isolated bacterial strains. The first E2 degrading bacterium Novosphingobium
tardaugens was isolated from activated sludge (Fujii et al., 2002). Nevertheless, not
all estrogen-degrading bacteria were shown to degrade recalcitrant EE2. Ke et al.
(2007) isolated three strains that belonged to genera Acinetobacter, Agromyces, and
Sphingomonas, and were able to degrade E1, E2, and E3 under both aerobic and
anoxic conditions. Nonetheless, EE2 remained stable during cultivation with all three
isolates. On the other hand, Rhodococcus zopfii and Rhodococcus equi isolated from
activated sludge of Japanese wastewater treatment plants were shown to degrade all
the four principal estrogens (E1, E2, E3 and EE2) (Yoshimoto et al., 2004). R. zopfii

52
Y50158 showing the strongest degradation activities removed completely 100 mg /L
of EE2 within 24 h in this study. Another EE2-degrading bacterium, which was
isolated from activated sludge of a wastewater treatment plant in China, was
identified as Sphingobacterium sp. JCR5 (Ren et al., 2007).
In the latest study, six strains of Proteobacteria were added to the list of strains
capable of EE2 transformation (Pauwels et al., 2008b). Bacterial strains isolated from
compost cometabolized (an enzyme produced by microbiological metabolism that
aids degradation of a contaminant) EE2 at low µg/L levels when metabolizing E1,
E2, or E3. No other metabolites beside E1, E2, E3 and EE2 were detected,
suggesting that total degradation and fission of aromatic rings occurred.
Generally it can be summarized that bacterial EE2 transformation is significantly
affected by oxygen with higher degradation efficiency under aerobic conditions.
Relatively fast bacterial degradation was recorded in agriculture soils and nitrifying
activated sludge. In this case, the key role in transformation process could be
attributed to AOB showing highest removal at high initial ammonia concentrations.
Even higher degradation efficiencies (tens mg/L of EE2) were recorded with
Rhodococcus and Sphingobacterium sp. isolated from activated sludges.
Mie`ge et al. (2009) studied that various WWTP processes were evaluated and it was
found that EE2 was highly removed (70%) in the dissolved aqueous phase by a fixed
biomass reactor with high sludge retention time and waste stabilisation ponds. The
processes using activated sludge with nitrogen treatment were substantially more
efficient than treatments. They also discovered a tendency between higher EE2
influent concentrations and removal extents.
Earlier, Johnson et al. (2005) compared 17 WWTPs in Europe based on the
concentrations of nonylphenol and steroid estrogens in effluents. Treatment
processes included primary chemical treatment only, submerged aerated filter,
oxidation ditch, activated sludge, and trickling filter combined with activated sludge.
The lowest estrogen removal was observed in the WWTP which only used primary
treatment. In this study, EE2 was detected only in effluents of two WWTPs.
In a similar way, Ying et al. (2008b) described the degradation of EE2 and other
estrogens in four South Australian WWTPs with different technologies. The removal
rates for the estrogens were variable but consistent with the plant performance
parameters such as biochemical oxygen demand, suspended solids and ammonia, and

53
the least efficient WWTP was that which consisted of a series of anaerobic and
aerobic lagoons. The study demonstrated that E1 and EE2 were more persistent
during the treatment than the other estrogens.
A poor EE2 removal was also detected in a WWTP with nitrifying activated sludge
system situated in England (Kanda and Churchley, 2008). The results of a 24-h
treatment experiment showed excellent removal for other estrogens and
nonylphenols (97–99%), and a 98% removal of estrogenicity. Nevertheless, the
removal of EE2 was only 3% which during the 7-day treatment period only increased
to a mere 5.6%.
Braga et al. (2005a) reported a poor removal in an enhanced primary WWTP
compared to an advanced WWTP in Australia. The difference between those two
plants was primarily linked to plant performance, however, the extent to which the
removal of steroid estrogens was due to bacterial metabolism rather than adsorption
to the bacterial biomass remained unclear. EE2 was not detected during the study
period in the influent or effluent of either WWTP. Concentrations at ng/g levels of
EE2 were detected in the waste activated sludge of the two WWTPs (Braga et al.,
2005b), but not in the raw sewage, suggesting that EE2 is resistant to biological
treatment and is primarily removed due to sorption to sludge biomass. This was in
agreement with previously reviewed data (Johnson and Sumpter, 2001). Muller et al.
(2008) surveyed E1, E2, EE2 and their conjugated forms throughout an advanced
WWTP. The authors quantified estrogen concentrations in water and sludge samples
and investigated also the estrogenic activity by using estrogen responsive reporter
cell lines. Estrogen concentrations and estrogenicity measured in the inlet and in
primary treated sewage showed a weak impact of primary treatment; nonetheless,
they observed a decrease of both estrogen concentration and estrogenicity during
biological treatment. The removal was >90% of original concentration ranging
between 200 and 500 ng/L. On the base of analysis of estrogens sorbed into the
sludge, they suggested that biodegradation was the main vehicle for estrogen
elimination.
Despite the application of very high initial concentrations (2.5X10⁻⁵
to 50 mg /L),
experiments using E2, and EE2, as well as activated and inactivated sludge, indicated
a high adsorption affinity of the compounds to the adsorbent (Clara et al., 2004). The
adsorption in this work was also found to depend on pH, where the authors observed
54
increasing solubility of adsorbed EE2 with elevated pH from 7 to 12. Correlation of
EE2 sorption to activated sludge biomass and temperature was described (Xu et al.,
2008).
The efficiency (>90%) of E1 and EE2 removal studied in municipal WWTPs under
various redox conditions, demonstrated the significance of aerobic conditions for the
removal of all estrogens (Joss et al., 2004). The importance of adaptation of
microbial populations for the removal of estrogens (mainly E2), was shown by
dramatic differences in mineralization of 14
C-labelled estrogenic compounds when
working with biosolids from four municipal treatment plants and one industrial plant
(Layton et al., 2000); in the municipal WWTP the mineralization was 70–80%
during the 24 h, whereas in the industrial WWTP it reached only 4%. The
mineralization of EE2 was 25–75-fold less than that of E2 and, additionally, it did
not reach completion in 24 h, with only 40% mineralized to 14
CO2. Changes in
temperature during the process significantly affected mineralization of E2 but had no
effect on the rate of EE2 metabolism (Layton et al., 2000).
Cao et al. (2008) reported a relationship between the equivalent biomass
concentration and the estrogen degradation in WWTPs. Under anaerobic conditions
E1 was reduced to E2, however, the extent of this reduction depended on the type of
inocula (Mes et al., 2008).
No significant loss of the sum of E1 and E2, or of EE2 was observed in activated
sludge during the experiment under strictly anaerobic conditions. Nevertheless, in the
effluent, there was still a large fraction of E1 and E2 (adsorption to sludge accounted
for a 32–35% loss from the liquid phase) but no EE2.
A work focused on potential relationship between the availability of oxygen,
nitrification rate, and estrogen removal showed that EE2 was persistent under anoxic
conditions in activated sludge (Dytczak et al., 2008). Under aerobic conditions, the
observed level of EE2 removal was 22% within 7 h. The higher removal of estrogens
was associated with higher nitrification rate, therefore, nitrifying biomass could be
responsible for their removal. The fate of E1, E2, and EE2 under different redox
settings was also analysed in two nitrite-accumulating sequencing batch reactors,
with different sludge ages operating under aerobic conditions and
anoxic/anaerobic/aerobic conditions (Pholchan et al., 2008).

55
The removal of EE2 under anaerobic conditions was considered to be mainly the
result of sorption, nonetheless, the binding of estrogens to the sludge was apparently
not as strong as the binding observed in the sludge under strictly aerobic conditions.
Probably owing to nitrite toxicity and the inhibition of the monooxygenase (AMO)
and the microbial population generally, EE2 removal was adversely affected when
the reactor operated with sludge retention time (SRT) shorter than 5.7 days and it
was significantly lower when SRT was longer than 7.5 days. In contrast, during
anaerobic digestion of estrogens by sewage sludge, no influence of temperature or
SRT on the process was seen (Carballa et al., 2007).
Estimations based on the measured sorption constants predict that about 50–75% of
steroid estrogens will be sorbed to activated sludge during activated sludge treatment
in a WWTP. Taking into consideration also the results of previous studies, the
scenario of EE2 removal under aerobic conditions could be more mixed. Ternes et al.
(1999) showed that E2 was oxidized and further eliminated by activated sludge from
WWTP in Germany, whereas EE2 was principally persistent under selected
conditions. In a similar way, Weber et al. (2005) reported persistency of EE2 in batch
experiments with activated sludge from two different types of WWTP.
Further culture enrichment and isolation led to a defined mixed culture consisting of
two strains, which were identified as Achromobacter xylosoxidans and Ralstonia sp.
The culture used E1 and E2 as growth substrates, but not the EE2. In contrast, Forrez
et al. (2009a) recorded 90% EE2 removal in an aerated nitrifying batch reactor and a
complete biological EE2 removal from the synthetic effluent in a fixed bed reactor.
They also showed that once established nitrifiers could maintain the EE2 degradative
activity, even without further addition of ammonium (Forrez et al., 2009a,b).
It has been reported that estrogens are efficiently removed in some sewage treatment
plants (STPs) which use an activated sludge process. Nevertheless, there are
tremendous differences in the degree of estrogen removal among them, and in some
cases, an increase in estrogenic activity or steroid estrogen concentration in the
effluent and/or excess sludge has been shown, compared with that of the influent
(Carballa et al., 2004)

56
2.14.2.3 Effects
Suspected xenoestrogens include a range of structurally diverse anthropogenic
chemicals which interact with estrogen receptors and may affect the metabolism,
synthesis, storage, release, transport and clearance of hormones in vertebrates (Hester
and Harrison,1999). Even though the amount of estrogens detected in treated
wastewater is at nanogram levels or even lower, many studies have revealed that the
presence of estrogens in treated wastewater is responsible for the feminization of
male fish and sexual disruption in many aquatic wildlife (JEA, 1998; IUPAC, 2003).
Furthermore, these hormones caused developmental abnormalities in reptiles and
invertebrates, and infertility in birds (Atienzar et al, 2001).
Endocrine-disrupting chemicals (EDCs) are at least partially responsible for
disruption of reproduction and development in some wildlife populations (Tyler et
al., 1998). The effects that are found include altered/abnormal blood hormone levels,
reduced fertility and fecundity, masculinization of females and feminisation of
males. Global efforts are now underway to develop a greater understanding of how
EDCs disrupt physiological function and to develop regulatory tests for EDCs which
are broadly applicable to a variety of wildlife species (Campbell et al., 1999;
Kavlock et al., 1996).
Nonetheless, information on the impacts of EDCs on wildlife populations is limited
to a few species in several vertebrate and invertebrate taxa. Moreover, the responses
and relative sensitivities of different animal species to EDCs have not been
comprehensively compared and may vary, both within and between taxa. In
consequence, there are fundamental shortfalls in our knowledge of the relative
significance of endocrine disruption in different wildlife taxa, and of the level of the
problem of endocrine disruption in wildlife relative to other environmental stressors
(Jobling et al., 2003).
In spite of the growing concern over the effects of environmental endocrine
disrupters on both human and wildlife populations, little research has been conducted
to determine the effects at the DNA level. This is surprising considering that
estrogens are known to induce DNA damage including for instance single strand
breaks, chromosomal damage, and diverse types of DNA adducts; consequently,
mutations may occur. Jobling et al.(1995) investigated whether exposing larval
barnacles (Elminius modestus) to 17β-estradiol (E2) and low concentrations of NP(4-

57
n-nonylphenol), both of which are thought to cause endocrine disruption, leads to
detectable DNA effects using the random amplified polymorphic DNA (RAPD).
DNA effects include DNA damage (e.g. DNA adducts, DNA breaks) as well as
mutations (i.e. point mutations and large rearrangements) and possibly other effects
at the DNA level which can be induced by chemical or physical agents that directly
and/or indirectly interact with genomic DNA (Atienzar et al., 2002).
Only little is known about ecotoxicological effects of pharmaceuticals on aquatic and
terrestrial organisms and wildlife, and a comprehensive review on ecotoxicological
effects is lacking. Aquatic organisms are particularly important targets since they are
exposed via wastewater residues over their whole life. Standard acute ecotoxicity
data have been reported for a number of pharmaceuticals, nevertheless, such data
alone may not be suitable for specifically addressing the question of environmental
effects, and subsequently in the hazard and risk assessment (Fent, 2003). The current
lack of knowledge holds in particular for chronic effects that have been only very
rarely investigated.

58

59
3. MATERIALS AND METHODS
3.1 Pure culture (Shewanella Putrefaciens) and two chambered MFC
experiments
In the first part of this study, Shewanella Putrefaciens and two-chambered MFC
were used.
3.1.1 Two chambered MFC
The two chambered microbial fuel cells (TCMFC) were constructed using two glass
bottles. Each bottle’s volumes were 100 ml. Each cell compartment had three ports
at the top, for electrode wire, addition and sampling of solutions, and gassing. Two
compartments were separated by a Proton exchange membrane (PEM) (Nafion 117
(Dupont Co., USA)). The anode compartment was loaded with freshly prepared
bacterial suspension (suspended in 50 mM Na-phosphate buffer (pH 7.0) containing
0.1 M NaCl), vitamin, mineral solution and substrate. The cathode compartment was
loaded with 50 mM Na-phosphate buffer (pH 7.0) containing 0.1 M NaCl. Nitrogen
and air were continuously purged through anode and cathode compartments to
maintain anoxic and aerobic conditions, respectively. (flow rate of nitrogen gas was
approximately 15 ml per min). The microbial fuel cell was immersed in a water bath
to maintain temperature (25°C) (Julabo FT 200 was used to supply for summer
conditions and Julabo heater was used to supply for winter conditions). The air
conditioner was also used to supply constant temperature.
3.1.2 Electrode Materials For Two Chambered MFC
Both anode and cathode materials of the TCMFC were platinum. Platinum wire was
welded with electrodes by the manufacturer (Altınyıldız, Kapalıçarşı, Istanbul).
3.1.3 Medium for Aerobic and Anoxic Growth of Shewanella Putrefaciens
S. putrefacience (ATCC 8071) was purchased and was grown on LB (MILLER)
broth. For aerobic growth, cultures of 100 ml in 250 ml flasks were shaken
continuously on a cooling rotary shaker-incubator at 160 rpm at 25C (Sartorious
Certomat IS) Figure 3.1.

60
Figure 3.1: Sartorius Certomat IS cooling rotary shaker.
For anoxic growth, S. putrefacience (ATCC 8071) was grown on anoxically prepared
1250 ml LB (MILLER) broth in Controlled Atmospheric Chamber (Plas By
Labs,USA) (Figure 3.2, Figure 3.3).
Figure 3.2: Controlled Atmosphere Chamber(PLAS LABS USA).

61
Figure 3.3: Anoxic growth of S.putrefaciens in Atmosphere Controlled Chamber.
LB (MILLER) broth in glass bottle was inoculated with 12.5 ml of an aerobically
grown overnight culture and incubated without agitation. After 96 hrs of growth, the
cells were harvested under anoxically conditions by a continuous centrifugation
system (Hettich Rotina 420 R Centrifuge) at 4800 rpm at 4°C (Figure 3.4)
Figure 3.4: Hettich Rotina 420 R Centrifuge.
The cell pellets were washed three times with a buffer (50 mM Na-phosphate buffer
(pH 7.0) containing 0.1 M NaCl). The washed cells were re-suspended in the buffer
and transfer to the two chambered MFC. This system can be seen in Figure 3.5.

62
Figure 3.5: Two chambered MFC used.

63
3.2 Mixed culture in Single Chambered Microbial Fuel Cell
3.2.1 Construction of Single Chambered Flat-1-Microbial Fuel Cell (SCF-1-
MFC)
Single chambered flat-1-MFC consisted of an anode and cathode placed on opposite
sides in a plastic (plexiglas) cylindrical chamber 1.6 cm long by 3 cm in diameter
(empty bed volume of 12 mL; anode surface area per volume of 62.5m2/m
3). The
anode electrodes were made of Ballart carbon paper (without wet proofing) and did
not contain platinum catalyst. The carbon electrode/PEM cathode (CE-PEM) was
manufactured by bonding the PEM directly onto a flexible carbon-cloth electrode
containing 0.4 mg/cm2 of Pt catalyst (Vulcan). The PEM (Nafion 115, Dupont) was
sequentially boiled in H2O2 (30%), deionized water, 1M H2SO4, and deionized water
(each time for 1 h). The PEM was then hot-pressed directly onto the cathode by
heating it to 100 °C at 100 bar for 4 minutes. The anode and cathode are placed on
either side of a tube, with the anode sealed against a flat plate and the cathode
exposed to air. When a membrane is used in this air-cathode system, it serves
primarily to keep water from leaking through the cathode, although it also reduces
oxygen diffusion into the anode chamber. SCF-1-MFC can be seen in Figure 3.6.
Figure 3.6: Used single chambered Flat-1-MFC in this study.
3.2.2 Construction of Single Chambered Tubular MFC (SCTMFC)
Single Chambered Tubular MFC consisted of a single cylindrical plexiglass chamber
(10cm long by 3cm outer diameter; 1 cm inner diameter , empty bed volume of
approximally 63 mL) containing stainless steel strap 150 cm long placed in the
cylindrical plexiglass chamber as anode electrode. The carbon electrode/PEM
cathode (CE-PEM) was also manufactured by bonding the PEM directly onto a

64
flexible carbon-cloth electrode containing 0.4 mg/cm2 of Pt catalyst (Vulcan). The
air-porous cathode consisted of a carbon/platinum catalyst/proton exchange
membrane (PEM) layer was placed onto a 1 cm diameter plexiglas tube containing 2
mm diameter pores at 2 mm intervals (cathode tube) (Figure 3.7). Air flow through
the tube was initially 5 mL/min but was changed to passive oxygen transfer (no
forced air flow). Silver or Platinum wire was used to connect the circuit containing a
100 external resistance.
Figure 3.7: Single Chambered Tubular MFC.
3.2.3 Construction of Single Chambered Flat-2-Microbial Fuel Cell (SCF-2-
MFC)
SCF-2-MFC having a 36 ml capacity anode chamber was made of plexiglass. Anode
and cathode electrodes, each having 36 cm2 surface area (6 x 6 cm), were 1,5 mm
carbon cloth (CC, LLC) and cathode was coated with 1 mg/cm2
platinum as catalyst.
Electrodes were separated by a non-conductive microfiber cloth (Scotch-Brite)
instead of PEM. A water impermeable layer (Tyvek, Dupont) was placed on cathode
side for breathing. An Ag/AgCl reference electrode (BASI, USA) which measures
+0,197 V more potential acconding to standard hydrogen electrode (SHE) was
located in the anode chamber and connected to the electrodes for the measurement of
anode and cathode potentials. Figure 3.8 and Figure 3.9 show the SCF-2-MFC and
multimeter system, respectively.
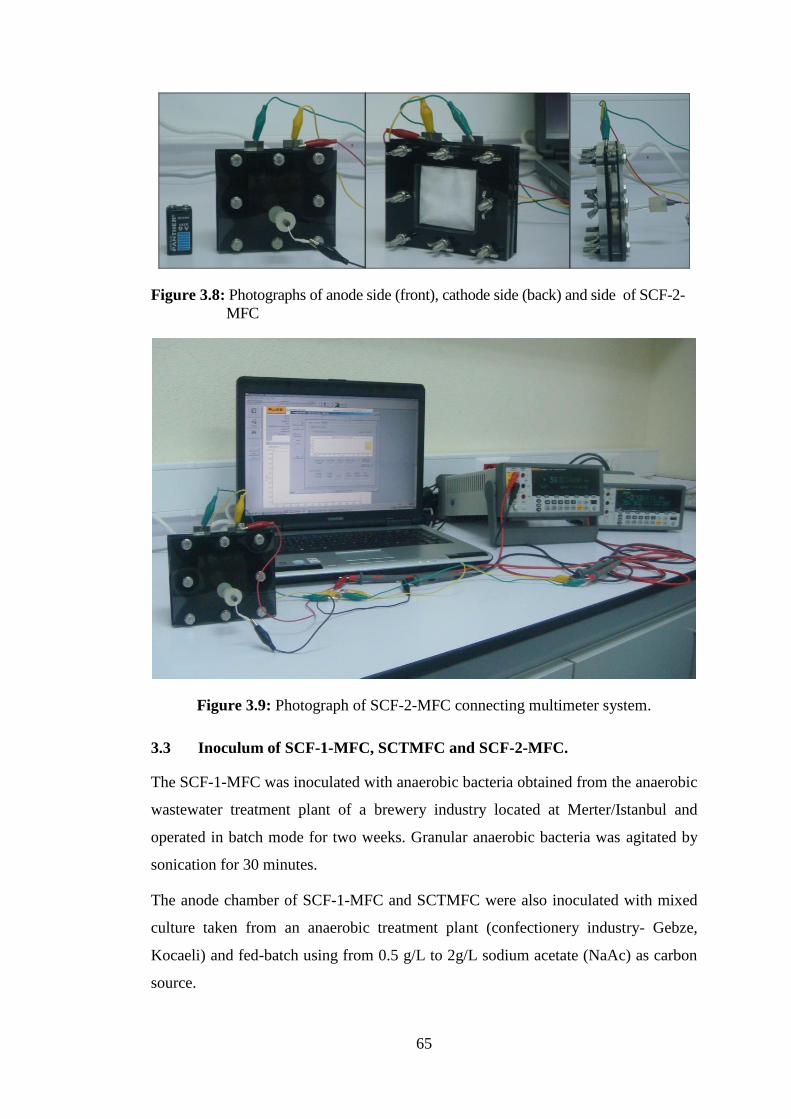
65
Figure 3.8: Photographs of anode side (front), cathode side (back) and side of SCF-2-
MFC
Figure 3.9: Photograph of SCF-2-MFC connecting multimeter system.
3.3 Inoculum of SCF-1-MFC, SCTMFC and SCF-2-MFC.
The SCF-1-MFC was inoculated with anaerobic bacteria obtained from the anaerobic
wastewater treatment plant of a brewery industry located at Merter/Istanbul and
operated in batch mode for two weeks. Granular anaerobic bacteria was agitated by
sonication for 30 minutes.
The anode chamber of SCF-1-MFC and SCTMFC were also inoculated with mixed
culture taken from an anaerobic treatment plant (confectionery industry- Gebze,
Kocaeli) and fed-batch using from 0.5 g/L to 2g/L sodium acetate (NaAc) as carbon
source.

66
The anode chamber of SCF-2-MFC was inoculated with mixed bacterial culture
from another MFC (taken from Marmara University Environmental Engineering
Department) that was originally enriched from a biological nutrient removal plant
(Pasaköy WWTP, Istanbul) and was fed continiously for over one year using sodium
acetate as carbon source. The anode chamber unit was selected as the inoculum
sampling point considering the VFA rich and oxygen free conditions that are
favorable for anophilic bacteria capable of oxidizing acetate anaerobically.
3.4 Medium of SCF-1-MFC, SCTMFC and SCF-2-MFC
To feed the anode compartment of SCF-1-MFC and SCTMFC, phosphate buffered
basal medium (PBBM) was used to provide minimal nutrients to support the growth
of anaerobic microorganisms. The basal medium is supplemented with solutions of
trace minerals and vitamins. Sodium acetate (NaAc) was used as a carbon source.
Phosphate buffered basal medium (PBBM) was used to provide minimal nutrients to
support the growth of anaerobic microorganisms. The basal medium is supplemented
with solutions of trace minerals and vitamins. PBBM medium consist of 0.9 g/L
NaCl, 0.2 g/L MgSO4.6H2O, 0.1 g/L CaCl2.2H2O, 1 g/L NH4CI, trace mineral
solution 10ml/L and Resazurin solution (%2) 1ml/L. Trace mineral solution consist
of 12.8 g/L nitrilotriacetic acid, 0.1g FeSO4.7H2O, 0.1 g/L MnCl2.4H2O, 0.17 g/L
CoCl2.6H2O, 0.1 g/L CaCl2.2H2O, 0,. g/L ZnCl2, 0.02 g/L CuCl2.2H2O, 0.01 g/L
H3BO3, 0.01 g/L Na2Mo4.2H2O, 1g/L NaCl, 0.017g/L Na2SeO3, 0.026 g/L
NiSO4.6H2O and 0.02 g/L SnCl2. 10 ml Phosphate buffer and 10 ml Vitamin solution
was added to autoclaved per liter PBBM medium. Vitamin solution consists of 0.002
g/L biotin, 0.002 folic acid, 0.01g/L B6 (pyridoxine) HCl, 0.005g/L B1 (triamine)
HCl, 0.005g/L B2 (riboflavin), 0.001g/L B12 crystalline (all chemicals were
purchased from Merck KGaA) (Anaerobic Microbiology, 1991) All experiments
were conducted in a temperature-controlled incubator set at 30 °C.
For SCF-2-MFC, the anode chambers were batch-fed with synthetic wastewater
(anolyte) containing 0.74 g/L KC1, 0.58 g/L NaCl, 0.68 g/L KH2PO4, 0.87 g/L
K2HPO4, 0.28 g/L NH4CI, 0.02 g/L yeast extract, 0.1 g/L MgSO4.7H20, 0.1 g/L
CaCl2.2H2O (Rozendal et al., 2006), and 1 mL of trace element solution (Rabaey et
al., 2005) containing per litre: 1g FeSO4.7H2O, 70 mg ZnCl2, 100 mg MnCl2.4H2O,

67
6 mg H3BO3, 130 mg CaCl2.6H2O, 2 mg CuCl2.2H2O, 24 mg NiC12.6H2O, 36 mg
Na2Mo4.2H2O, 238 mg CoCl2.6H2O (all chemicals were purcheased from Merck
KGaA).
The SCF-2-MFC system was fed with 600 mg/L acetate for every cycle. Synthetic
wastewater containing sodium acetate was stored at -20C before using. The overall
Coulombic efficiency was a function of substrate concentration and circuit
resistance. Coulombic efficiency decreased from 28.3 to 13.2% when the acetate
concentration increased from 80 to 800 mg/L (1000 Ω) (Liu et al, 2005).
3.5 Antibiotics and hormones
Antibiotics and hormones were studied on SCF-2-MFC. Incubator (Incucell) was
used to supply constant temperature (30ºC) throughout the study.
Four different steroid estrogens (hormones), such as estrone (E1)(Sigma-Aldrich),
17-β estradiol (E2) (Sigma-Aldrich), estriol (E3) (Sigma-Aldrich) and 17-α
ethinylestradiol (EE2) (Sigma-Aldrich) were used. These estrogens were prepared as
0.1, 0.5 and 1 mg/L concentartions for sequencing cycles. Estrogens were mixed
with 600 mg/L acetate (containing mineral solution) and filled into the MFC.
Then, three different antibiotics which erythromycin (Sigma), sulfomethoxazole
(Fluka) and tetracycline (Sigma) were used. These antibiotics were prepared as 50,
100 and 200 mg/L concentations representative to drug manufacture effluents (Lin
and Tsai, 2009, Larsson et al., 2007). Antibiotics were mixed with 600 mg/L acetate
(containing mineral solution) and filled into the MFC.
When MFC was filled with acetate only (or with antibiotics or with estrogen), the
potential was increased to approximately 200-250 mV and continued constantly for a
while, then potential decreased because substrate was comsumed (thereby one cycle
was completed). When potential decreased to 5 mV, the MFC was filled fresh
medium.
3.6 Electrochemical Measurement (Voltage and Current Measurements of
the MFC)
The Voltage (V) across a resistor (Rext) was measured by a data acquisition module
(Fluke 8846A Digit precision multimeter). Data was recorded to a personal computer
in every 15 minutes. Current(I) was determined by Ohm’s law (I=V/R), and power
68
density of the MFC was calculated as P=VI/A, where A was the surface area of
anode electrode.
3.7 Calculation of current and coulombic efficiency for experiments of
antibiotics and hormones.
Current (I) density was calculated for every sequential cycle as mA/cm2*hour using
integration to calculate coulombic efficiency. As it is mentioned in literature, CE
equation (eq.2.16 ) for batch-fed is used. Coulombic efficiency (CE) is critical
parameter to understand MFC performance.
3.8 Chemical Analysis
3.8.1 Sampling and COD analysis
Samples were taken from the anode chamber of the MFC and analysed. The sample
was taken before the feeding (end of the every cycle). Chemical oxygen demand
(COD) test kits (Merck) were used. COD kits were boiled in thermoreactor (WTW)
at 148 C for two hours. After that, the cooled samples were measured with COD
spectrophotometer (WTW).
3.8.2 pH measurement
A pH meter (WTW) was used to control pH. After preparation of substrate,
hormones and antibiotics solutions, pH has been adjusted to 7±0,05 with 1M and 0,1
M NaOH and 0.1 M and 1M H2SO4 before filling the anode compartment of the
MFC.
3.9 Scanning electron micrograph (SEM) Analysis
Bacteria on the anode were examined using a scanning electron microscope (SEM)
(Philips XL 305 FEG) at Gebze Institute of Science and Technology.

69
4. RESULTS AND DISCUSSION
4.1 Experiments with Shewanella Putrefaciens
4.1.1 Growth curves of Shewanella Putrefaciens
Shewanella putrefaciens pure culture was grown aerobically for 43 hrs. Figure 4.1
shows the Optical Dencity (OD) (660 nm) versus time graph for the bacteria. The
bacteria was grown aerobically in LB (MILLER) broth. 1 ml sample was taken at
one hour intervals and OD was measured. Stationary phase was observed after the
40th
hour on the graph.
0,00
0,20
0,40
0,60
0,80
1,00
1,20
1,40
1,60
1,80
2,00
0 10 20 30 40 50
She
wan
ella
pu
tre
faci
en
s O
D (
66
0 n
m)
Time (h)
Figure 4.1: Aerobic Growth Curve of S.putrefaciens.
Figure 4.2 shows the photograph of S.putrefaciens colonies at different dilution on
LB agar. Colonies have been counted and calculated using dilution factor to find the
number of bacteria per mililiter.
Figure.6.3 shows the viability of S. Putrefaciens during the 36 hrs and demonstrated
that maximum viability of the bacteria was at 19th
hour. At 3 hrs time intervals,
bacterial samples were diluted from 1/101-1/10
6, and 10L samples from dillutions
were plated on LB (MILLER) agar to count bacteria.
2.00
1.80
1.60
1.40
1.20
1.00
0.80
0.60
0.40
0.20
0.00

70
Figure 4.2: Photograph of S.putrefaciens colonies at different dilution on LB agar
Figure 4.3: Viability Curve of S.putrefaciens.

71
In order to understand whether the strength of media has an effect of viability of
S.putrefaciens, single (x) – double (2x) – triple (3x) strength were used (for constant
pure culture inoculation) and compared (aerobically). Maximum OD was observed
for 3x media. Minimum OD was observed for 2x. Figure 4.4 shows the
differentiation of growth curves.
Figure 4.4: Comparison of S.putrefaciens Growth Curve in single-double-triple
strength LB(MILLER) broth.
If the viability of these media was compared, it was observed that triple strength
(3x) media was higher viability than the others. Figure 4.5. illustrates these results.
On the other hand, the experiments were performed for different initial inoculum
concentrations of pure S. Putrefaciens culture. Single represents 10 ml, double
represents 20 ml inoculum culture. Figure 4.6 illustrates that the growth curves of
cultures were very close to each other.
In the comparison of single and double concentrations of culture for the viability,
single concentration was optimum. Figure 4.7 shows the results.
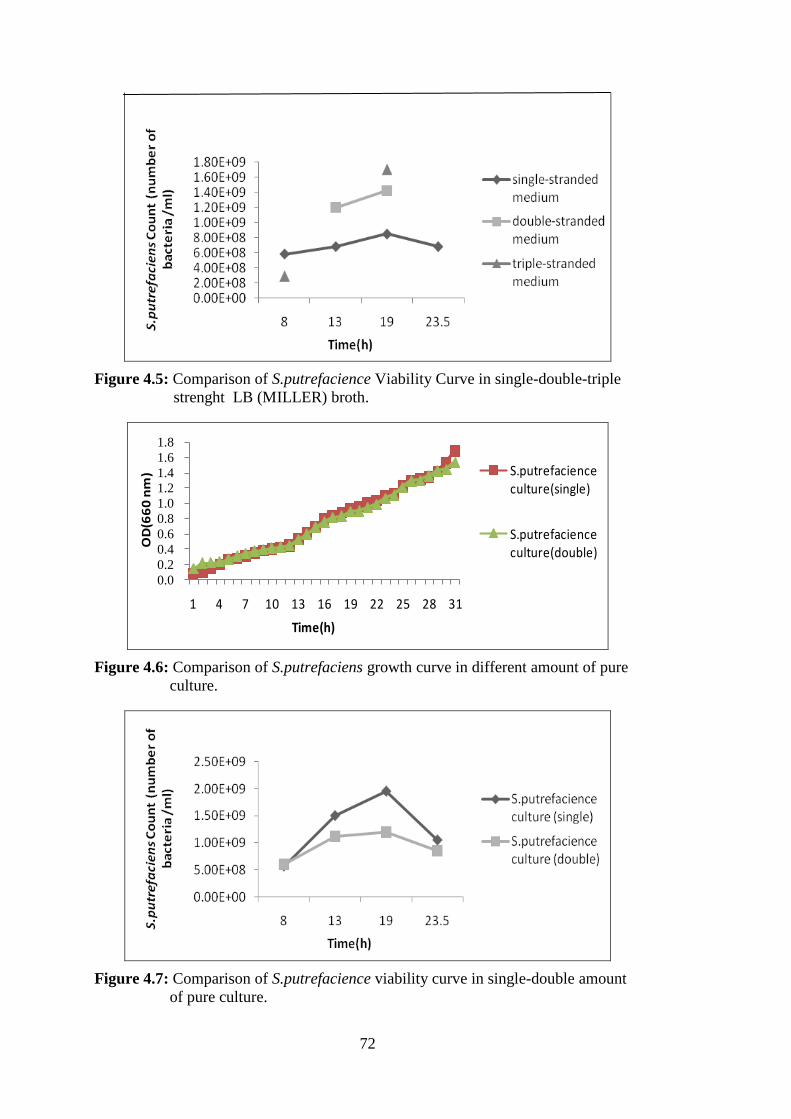
72
Figure 4.5: Comparison of S.putrefacience Viability Curve in single-double-triple
strenght LB (MILLER) broth.
00,20,40,60,8
11,21,41,61,8
1 4 7 10 13 16 19 22 25 28 31
OD
(66
0 n
m)
Time(h)
S.putrefacience culture(single)
S.putrefacience culture(double)
Figure 4.6: Comparison of S.putrefaciens growth curve in different amount of pure
culture.
Figure 4.7: Comparison of S.putrefacience viability curve in single-double amount
of pure culture.
1.8
1.6
1.4
1.2
1.0
0.8
0.6
0.4
0.2
0.0

73
4.1.2 Open circuit voltage of anoxically grown Shewanella putrefaciens in two
chambered MFC
Before the substrate (acetate as carbon source) was added, approximately 200mV
was observed from the microbial fuel cell containing suspensions of S. Putrefaciens.
Addition of acetate (10 mM) as the fuel resulted in a rapid increase in potential (max)
up to 880 mV for 1250 ml (pellet, centrifugated from 1250 ml) pure culture (Figure
4.8).
0
100
200
300
400
500
600
700
800
900
1000
0 10 20 30 40 50 60
Op
en
Cir
cuit
Vo
ltag
e (m
V)
Time (h)
Figure 4.8: Open Circuit Voltage (OCV) of two chambered MFC containing
S.putrefaciens (addition of 10 mM acetate and 1250 ml S.putrefaciens).
When the MFC was loaded with 10 mM acetate and 3750 ml pure culture ,
maximum potantial was up to 879 mV (Figure 4.9).
Figure 4.9: Open Circuit Voltage (OCV) from two chambered MFC containing
S.putrefaciens (addition of 10 mM acetate-3750 ml S.putrefaciens).

74
When the results of TCMFC were compared for acetate, OCV values were not
affected from amount of pure culture.
Experiments were repeated for 10 mM glucose and different volume of bacteria.
Figure 4.10 shows that 2500 ml pure culture resulted in a potential of 777 mV, while
figure 4.11 illustrates that 800ml pure culture resulted in a potential of 810mV,
respectively. Figure 4.12 shows that 1250 ml pure culture resulted in a potential of
832mV.
Figure 4.10: Open Circuit Voltage (OCV) development from two chambered MFC
containing S.putrefaciens (addition of 10mM glucose-2500 ml culture).
Figure 4.11: Open Circuit Potential (OCP) development from two chambered MFC
containing S.putrefaciens (addition of 10mM glucose for 800 ml culture.

75
Figure 4.12: Open Circuit Voltage (OCV) from two chambered MFC containing
S.putrefaciens (addition of 10mM glucose for 1250 ml culture).
When the results of TCMFC were compared for glucose, OCV values were close to
each other , so it was not affected from amount of pure culture, like acetate.
The experiments were also conducted with ethanol and propionic acid. Addition of
10 mM ethanol as the fuel resulted in potential up to 0.670 V (Figure 4.13) while
addition of 10 mM propionic acid resulted in a potential of 0.803 V (Figure 4.14).
Figure 4.13: Open Circuit Voltage (OCV) from two chambered MFC containing
S.putrefaciens (addition of 10 mM ethanol and 1250 ml pure culture)

76
Figure 4.14: Open Circuit Potential (OCP) development from two chambered MFC
containing S.putrefaciens (addition of 10 mM propionic acid and 1250
ml pure culture).
4.1.3 Open circuit voltage of aerobically grown Shewanella Putrefaciens
The anode compartment of fuel cells were loaded with freshly and aerobically
prepared S.putrefaciens (because this culture facultative) suspension to observe
potential development under open circuit conditions. The addition of glucose
(10mM) as the fuel resulted in a rapid increase in potential up to 0.456 V (Figure
4.15). Comparing OCV (maximum) of aerobically growth of culture with
anaerobically it was found that approximately %55 less than anaerobically.
0
50
100
150
200
250
300
350
400
450
500
0 20 40 60 80 100 120 140
Ope
n ci
rcui
t vo
ltag
e (m
V)
Time (h)
Figure 4.15: Potential development from two chambered MFC containing
aerobically grown of S.putrefaciens (addition of 10mM glucose)

77
4.1.4 Power generation of two chambered MFC
When the MFC inoculated with S.putrefaciens and was fed with 10 mM glucose, its
power density calculated as 0.8 mW/m2. The circuit was completed with a fixed load
of 5000 were used to determine the power generation as function of load. Current
(i) was observed 4A (average) during 20 hours. Potential(V)=iR, Power (P) was
calculated as P=iV.
P=i2.R=(4x10
-6)2.(5x10
3)=0.08 W/cm
2=0.8 mW/m
2
4.1.5 Open circuit voltage from two chambered MFC (addition influent
wastewater of brewery industry using S.putrefaciens)
The anode compartment of MFC were loaded with 1250 ml suspended S.
Putrefaciens and influent wastewater (contains 5855mg/L COD) from brewery
industry. Addition of fuel resulted in potential up to 0.630 V and this voltage
continued nearly constant from 9th
to 102th
and dropped (Figure 4.16).
Figure 4.16: Potential development from two chambered MFC containing influent
ww from brewery industry containing 1250 ml S.putrefaciens
4.2 Experiments with mixed culture using single chambered flat-1-MFC
4.2.1 Comparison of currents using different external resistance in single
chambered flat-1- MFC
It was reported that the electrochemically active mixed cultures are enriched from
activated sludge from wastewater treatment plants, sediments or the effluent of
primary clarifîers (Bond and Lovley 2003; Kim et al, 2004; Lee et al., 2003; Park et
al., 2001; Rabaey et al., 2004). In this study, the anode chamber of our single
chambered flat -1-MFC (SCF-1-MFC) were inoculated with the sludge taken from
the anaerobic unit of industrial wastewater of confectionery industry (located in
Gebze, Kocaeli) before being started-up. The anaerobic unit was selected as the

78
inoculum sampling point considering the oxygen-less and rich VFA conditions that
are favorable for bacteria capable of oxidizing acetate anaerobically. Sonicated
bacteria were inoculated in anode chamber of SCF-1-MFC and the system was fed
with synthetic wastewater containing of 2000 mg/L sodium acetate batchly. Different
external resistances were used and shown in Figure 4.17 for 5100 ohm, Figure 4.18
for 2200 ohm, Figure 4.19 for 100 ohm, respectively.
Figure 4.17. shows that maximum current was 23 A at 6th
.hour for 5100 ohm
external resistance . After the peak, this current was decreased slowly, during 42
hours. The current end value was 9.92 A.
Figure 4.17: Current versus time graph for 2000 mg/L acetate using 5100 ohm
external resistance at SCF-1-MFC.
Then, the external resistance was changed and current was measured. When 2200
ohm external resistance was applied, current peak value was 42.57 A at 5th
.hour for
2000 mg/L acetate. After the peak, this current was decreased slowly, during 43
hours. The current end value was 18.43A (Fig.4.18).

79
0
10
20
30
40
50
0 10 20 30 40 50 60
Curr
ent
(µA
)
Time (h)
Figure 4.18: Current versus time graph for 2000 mg/L acetate using 2200 ohm
external resistance at SCF-1-MFC.
When 100 ohm external resitance was applied, and 2000 mg/L aceatate was added to
the system, maximum current value was 168.75 A at 12th
hour and was decreased to
72.72A during 30 hours . When acetate was refreshed at 42th
hour, the current value
was reached 167.03A. Then, this value was decreased to 11.09 A during 92 hours.
(Figure 4.19).
0
20
40
60
80
100
120
140
160
180
0 20 40 60 80 100 120 140 160
Cu
rre
nt
(µA
)
Time (h)
Figure 4.19: Current versus time graph for 2000 mg/L acetate using 100 ohm
external resistance at SCF-1-MFC. Arrows indicate the replacement of
the substrate with a fresh substrate.
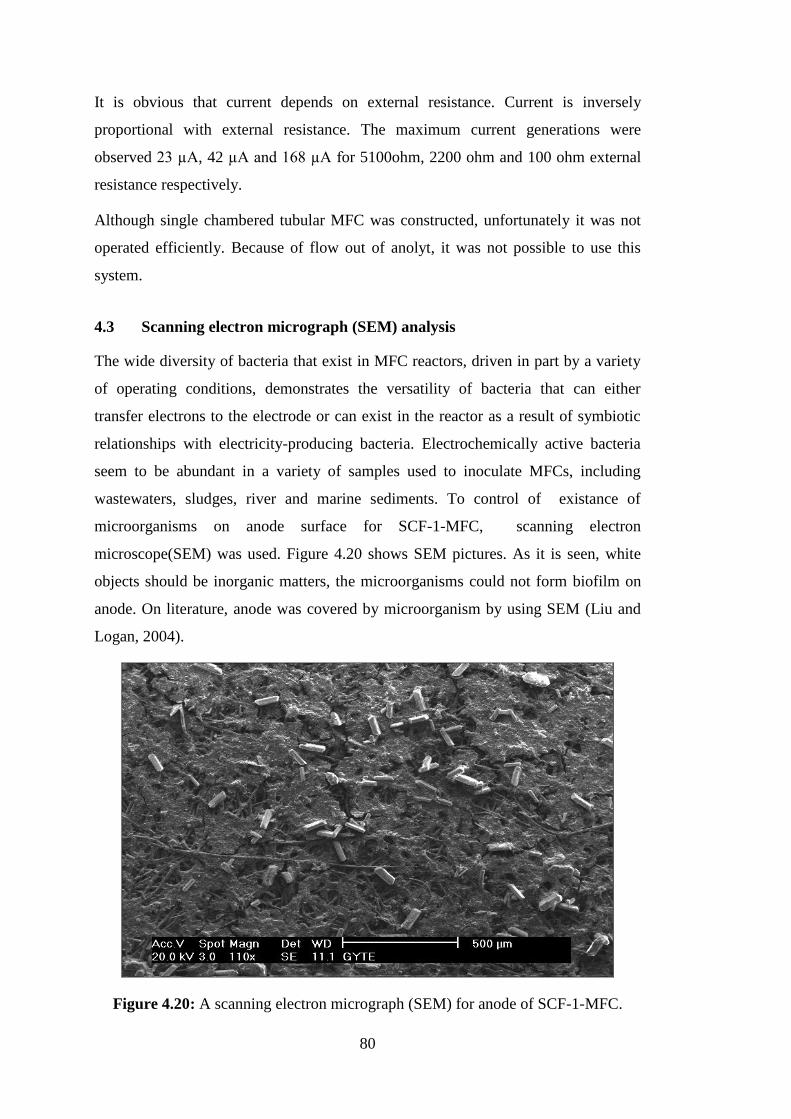
80
It is obvious that current depends on external resistance. Current is inversely
proportional with external resistance. The maximum current generations were
observed 23 µA, 42 µA and 168 µA for 5100ohm, 2200 ohm and 100 ohm external
resistance respectively.
Although single chambered tubular MFC was constructed, unfortunately it was not
operated efficiently. Because of flow out of anolyt, it was not possible to use this
system.
4.3 Scanning electron micrograph (SEM) analysis
The wide diversity of bacteria that exist in MFC reactors, driven in part by a variety
of operating conditions, demonstrates the versatility of bacteria that can either
transfer electrons to the electrode or can exist in the reactor as a result of symbiotic
relationships with electricity-producing bacteria. Electrochemically active bacteria
seem to be abundant in a variety of samples used to inoculate MFCs, including
wastewaters, sludges, river and marine sediments. To control of existance of
microorganisms on anode surface for SCF-1-MFC, scanning electron
microscope(SEM) was used. Figure 4.20 shows SEM pictures. As it is seen, white
objects should be inorganic matters, the microorganisms could not form biofilm on
anode. On literature, anode was covered by microorganism by using SEM (Liu and
Logan, 2004).
Figure 4.20: A scanning electron micrograph (SEM) for anode of SCF-1-MFC.

81
4.4 Voltage measurement using mixed culture microorganisms for single
chambered flat-2-MFC
4.4.1 Carbon cloth cathode containing 1 mg/cm2 platinum
The anode chamber of SCF-2-MFC was inoculated with a mixed bacterial culture of
another MFC (taken from Marmara University Environmental Engineering
Department) that was originally enriched from a biological nutrient removal plant
(Pasaköy WWTP, Istanbul) and was fed continuously for over one year using sodium
acetate as carbon source, as mentioned previous chapter.
Anode material was carbon cloth (CC, LLC), cathode material was carbon cloth
coated with 1 mg/cm2
platinum as catalyst. Electrodes were separated by a non-
conductive microfiber cloth (scotch-Brite) instead of PEM. A water impermeable
layer (Tyvek, Dupont) was placed on cathode side for breathing. 300 Ω external
resistance for during experiment.
The anode compartment was filled synthetic wastewater containing 200 mg/L acetate
and inoculated with the enriched culture. It was measured and Figure 4.21 was
drawn.
0
50
100
150
200
250
300
350
400
450
0 50 100 150 200 250 300 350
Vo
lta
ge
(m
V)
Time (h)
Figure 4.21: Voltage versus time graph for SCF-2-MFC using 300 ohm external
resistance and batchly feeding with 200 mg/L acetate . Arrows indicate
the replecament of the substrate with a fresh substrate.
Accoording to graph, acclimation time was 117 hour (after second feeding). After the
feeding, voltage increased to 162 mV, then the system was loaded with acetate 3 rd
time, the voltage rised rapidly to 412 mV at 175th
hour . Then, the voltage dropped to
320 mV and continued nearly constant during 73 hours. After that, fluctuating values
were recorded. Maximum current was calculated as 1.37 mA at 175th
hour and power

82
density was calculated as 156.78 mW/m2
(for 36 cm2
anode area). COD removal was
found 96±2 % .The power density value was much more than the previous studies
but it was not regular, however without adding fresh media, the voltage was not
dropped long time. It should be used stainless steel anode material by
microorganisms. It was observed when the MFC system has been demounted, the
anode material has been corroded.
4.4.2 Activated carbon cloth cathode
Some experiments was continued for SCF-2-MFC changing cathode material. Anode
material was carbon cloth, but cathode material was activated carbon cloth. The
reason of choosing this material is that it has much space area; therefore, more
microorganisms can attach on it.
The SCF-2-MFC was fed synthetic wastewater containing 200 mg/L acetate as a
carbon source. 468,5 ohm was used as external resistance. Feeding times were shown
on graph by arrows (Figure 4.22). 48 hours lasts for 1st loading, 120 hours lasts for
2nd
loading, 169 hours lasts for 3rd
loading, 219 hours lasts for 4st
loading,
respectively. After the second feeding, potential was reached to 326.61 mV, current
was calculated as 0,69 mA and power density was calculated as 64,39 mW/m2.
After the third feeding, voltage was reached to 432.71 mV, current was calculated as
0,90 mA and power density was 111.01 mW/m2. After the fourth feeding, potential
was reached to 420.95 mV, current was calculated as 0.89 mA and power density
was 105.06 mW/m2. COD removal was found 95±2 % .
0
50
100
150
200
250
300
350
400
450
500
0 50 100 150 200 250 300 350 400
Vo
ltag
e (
mV
)
Time (h)
Figure 4.22: Voltage versus time graph for SCF-2-MFC for activated carbon cloth
cathode.

83
Due to the fact that platinum is an expensive catalyst for cathode, activated carbon
cloth has been used alternatively in this study because it is cheap. Maybe, it can be
used alternatively at MFC studies in the future. However, it should be tried long
period of time to wide uses.
4.5 Antibiotic and Hormone Experiments for SCF-2-MFC
SCF-2-MFC used as a biosensor in this part of the thesis for inhibitor matters. To
compare inhibition response between asetate only feeding run and antibiotic (or
hormon) plus acetate feeding run, average the currents was calculated for only
asetate runs.
4.5.1 Acetate only feeding
In this study, 600 mg/L sodium acetate (NaAc) was used as carbon source. During all
experimental study, 28 control cycles (runs) were measured. Average current was
0.402±0.09 mAcm2/hour for all control cycles . 12 cycles of them were chosen as
representatives (Figure 4.23).
0
50
100
150
200
250
300
0 50 100 150 200 250 300 350
Vo
lta
ge
(m
V)
Time (h)
Figure 4.23: Voltage generation from NaAc only for 12 representative cycles at 300
Ω external resistance. Arrows indicate the replacement of consumed
solution with a fresh solution.
4.5.2 Antibiotics
In this study 3 different antibiotics (erythromycin, sulfamethoxazole, tetracycline)
were used as inhibitor substances. During experimental study, 600 mg/L acetate was
used as the carbon source and 300 Ω external resistance . All cycles were started with
acetate without antibiotic. When the potential (voltage) was decreased to 5 milivolt
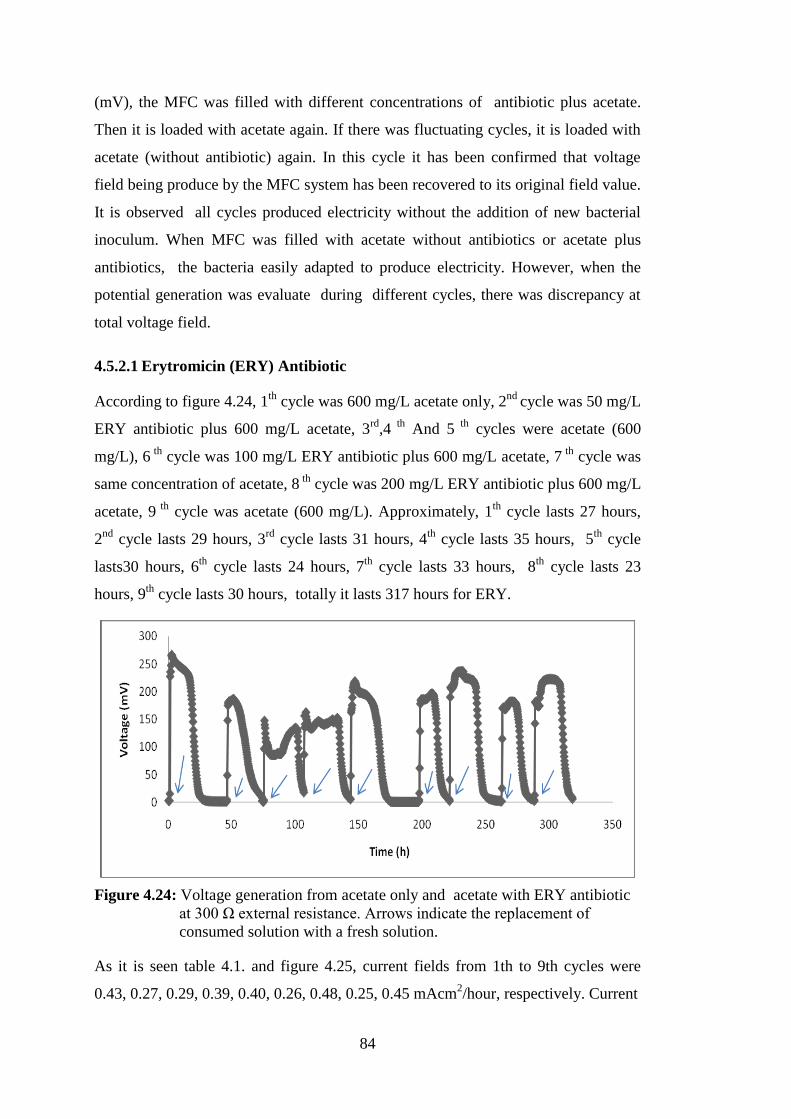
84
(mV), the MFC was filled with different concentrations of antibiotic plus acetate.
Then it is loaded with acetate again. If there was fluctuating cycles, it is loaded with
acetate (without antibiotic) again. In this cycle it has been confirmed that voltage
field being produce by the MFC system has been recovered to its original field value.
It is observed all cycles produced electricity without the addition of new bacterial
inoculum. When MFC was filled with acetate without antibiotics or acetate plus
antibiotics, the bacteria easily adapted to produce electricity. However, when the
potential generation was evaluate during different cycles, there was discrepancy at
total voltage field.
4.5.2.1 Erytromicin (ERY) Antibiotic
According to figure 4.24, 1th
cycle was 600 mg/L acetate only, 2nd
cycle was 50 mg/L
ERY antibiotic plus 600 mg/L acetate, 3rd
,4 th
And 5 th
cycles were acetate (600
mg/L), 6 th
cycle was 100 mg/L ERY antibiotic plus 600 mg/L acetate, 7 th
cycle was
same concentration of acetate, 8 th
cycle was 200 mg/L ERY antibiotic plus 600 mg/L
acetate, 9 th
cycle was acetate (600 mg/L). Approximately, 1th
cycle lasts 27 hours,
2nd
cycle lasts 29 hours, 3rd
cycle lasts 31 hours, 4th
cycle lasts 35 hours, 5th
cycle
lasts30 hours, 6th
cycle lasts 24 hours, 7th
cycle lasts 33 hours, 8th
cycle lasts 23
hours, 9th
cycle lasts 30 hours, totally it lasts 317 hours for ERY.
Figure 4.24: Voltage generation from acetate only and acetate with ERY antibiotic
at 300 Ω external resistance. Arrows indicate the replacement of
consumed solution with a fresh solution.
As it is seen table 4.1. and figure 4.25, current fields from 1th to 9th cycles were
0.43, 0.27, 0.29, 0.39, 0.40, 0.26, 0.48, 0.25, 0.45 mAcm2/hour, respectively. Current

85
was 0.27 mAcm2/hour, 0.26 mAcm2/hour and 0.25 mAcm
2/hour for 50 mg/L ERY,
100 mg/L ERY and 200 mg/L ERY respectively. According to these results, there
were no differences among them for current fields. But if it compare with acetate
only, there were discrepancy. So, this results demonstrated that inhibition occurred.
When the bacteria exposure to antibiotic firstly, could not return to original field
value easily. For second and third antibiotic loading, adapted bacteria return to
original value easily (only one cycle).
According to figure 4.26 for ERY, coulombic efficiency (CE) values were 0,20 for
1th
cycle, 0.12 for 2nd
cycle, 0.14 for 3rd
cycle, 0.19 for 4th
cycle, 0.19 for 5th
cycle,
0.12 for 6th
cycle, 0.23 for 7th
cycle, 0.12 for 8th
cycle and 0.21 for 9th
cycle
Table 4.1: MFC performance by ERY addition.
Runs
Acetate
addition
mg/L
ERY
addition
mg/L
Effluent
COD
mg/L
COD
efficiency
%
Integral
Current
(mA)
Current
(mA/cm2*hour)
Vmax
(mV) CE
1 600 0 15 98 61.68955 0.42831 266.1 0.2
2 600 50 56 91 38.40198 0.26662 186.45 0.12
3 600 0 25 96 41.29805 0.28648 133.94 0.14
4 600 0 21 97 57.28619 0.39752 162.36 0.19
5 600 0 15 98 58.69982 0.40752 218.22 0.19
6 600 100 124 83 37.95283 0.26345 195.96 0.12
7 600 0 16 97 68.99484 0.47905 235.69 0.23
8 600 200 270 71 35.65458 0.2475 181.56 0.12
9 600 0 16 97 64.69506 0.44918 222.39 0.21
0.0
0.1
0.2
0.3
0.4
0.5
Acetate 50mg/L ERY+
Acetate
Acetate Acetate Acetate 100mg/L ERY+
Acetate
Acetate 200mg/L ERY+
Acetate
Acetate
0.43
0.270.29
0.40 0.41
0.26
0.48
0.25
0.45
Curr
ent (
mA
/cm
2 *hou
r)
Figure 4.25: Current density per hour from acetate only and acetate with ERY
antibiotic at 300 Ω external resistance.

86
0.0
0.1
0.2
0.3
Acetate 50mg/L ERY+
Acetate
Acetate Acetate Acetate 100mg/L ERY+
Acetate
Acetate 200mg/L ERY+
Acetate
Acetate
0.20
0.120.14
0.19 0.19
0.12
0.23
0.12
0.21
Co
ulo
mb
ic e
ffic
ien
cy
Figure 4.26: Coulombic efficiency per cycle hour from acetate only and acetate
with ERY antibiotic at 300 Ω external resistance.
According to figure 4.27 for ERY, COD efficiency (%) values were 98% for 1th
cycle, 92% for 2nd
cycle, 96% for 3rd
cycle, 97% for 4th
cycle, 98% for 5th
cycle, 83%
for 6th
cycle, 97% for 7th
cycle, 68% for 8th
cycle and 97% for 9th
cycle.
0
10
20
30
40
50
60
70
80
90
100
Acetate 50mg/L ERY+
Acetate
Acetate Acetate Acetate 100mg/L ERY+
Acetate
Acetate 200mg/L ERY+
Acetate
Acetate
9892
96 97 98
83
97
68
97
CO
D r
em
ova
l (%
)
Figure 4.27: COD removal per cycle hour from acetate only and acetate with ERY
antibiotic at 300 Ω external resistance.
4.5.2.2 Sulfamethoxazole (SMX) Antibiotic
According to figure 4.28, 1th
cycle was 600 mg/L acetate only, 2nd
cycle was 50 mg/L
SMX antibiotic plus 600 mg/L acetate, 3rd
cycle was 600 mg/L acetate only, 4 th
cycle was 100 mg/L SMX antibiotic plus 600 mg/L NaAc, 5th
cycle was same
concentration of acetate, 6 th
cycle was 200 mg/L SMX antibiotic plus 600 mg/L
acetate and 7 th
cycle was acetate (600 mg/L). Approximately, 1th
cycle lasts 32
hours, 2nd
cycle lasts 24 hours, 3rd
cycle lasts 32 hours, 4th
cycle lasts 26 hours, 5th

87
cycle lasts 29 hours, 6th
cycle lasts 30 hours, 7th
cycle lasts 27 hours, totally it lasts
268 hours for SMX.
Figure 4.28: Voltage generation from acetate only and acetate with SMX antibiotic
at 300 Ω external resistance. Arrows indicate the replacement of
consumed solution with a fresh solution.
As it is seen table 4.2 and figure 4.29, current fields from 1th
to 7th
cycles were 0.36,
0.28, 0.37, 0.30, 0.38, 0.34, 0.37 mAcm2/hour, respectively. Currents were 0.28
mAcm2/hour, 0.30 mAcm
2/hour and 0.34 mAcm
2/hour for 50 mg/L SMX, 100
mg/L SMX and 200 mg/L SMX, respectively.
Table 4.2: MFC performance by SMX addition.
Runs
Acetate
addition
mg/L
SMX
addition
mg/L
Effluent
COD
mg/L
COD
efficiency
%
İntegraI
Current
(mA)
Current
(mA/cm2*hour)
Vmax
(mV) CE
1 600 0 12 98 51.2967 0.356156 199.96 0.17
2 600 50 32 95 39.6474 0.275248 205.47 0.12
3 600 0 5 99 52.9623 0.367718 211.89 0.17
4 600 100 60 91 43.1981 0.299437 199.82 0.13
5 600 0 24 96 54.2576 0.376713 198.58 0.18
6 600 200 170 78 48.8318 0.339019 195.47 0.16
7 600 0 12 98 53.2606 0.369795 218.17 0.17

88
0.0
0.1
0.2
0.3
0.4
Acetate 50mg/L SMX + Acetate
Acetate 100mg/L SMX + Acetate
Acetate 200mg/LSMX + Acetate
Acetate
0.36
0.28
0.37
0.30
0.38
0.34
0.37
Cu
rre
nt
(mA
/cm
2*
ho
ur)
Figure 4.29: Current density per hour from acetate only and acetate with SMX
antibiotic at 300 Ω external resistance.
According to figure 4.30 for SMX, coulombic efficiency (CE) values were 0,17 for
1th
cycle, 0,13 for 2nd
cycle, 0,17 for 3rd
cycle, 0,14 for 4th
cycle, 0,18 for 5th
cycle,
0,16 for 6th
cycle, 0,17 for 7th
cycle.
0.00
0.05
0.10
0.15
0.20
Acetate 50mg/L SMX + Acetate
Acetate 100mg/L SMX +
Acetate
Acetate 200mg/LSMX + Acetate
Acetate
0.17
0.13
0.17
0.14
0.18
0.160.17
Co
ulo
mb
ic e
ffic
ien
cy
Figure 4.30: Coulombic efficiency per cycle hour from acetate only and acetate
with SMX antibiotic at 300 Ω external resistance.
According to figure 4.31 for SMX, COD efficiency (%) values were 98% for 1th
cycle, 95% for 2nd
cycle, 99% for 3rd
cycle, 91% for 4th
cycle, 96% for 5th
cycle, 78%
for 6th
cycle and 98% for 7th
cycle.

89
0
20
40
60
80
100
Acetate 50mg/L SMX + Acetate
Acetate 100mg/L SMX+Acetate
Acetate 200mg/L SMX+ Acetate
Acetate
9895
99
9196
78
98
CO
D r
em
ov
al (
%)
Figure 4.31: COD removal per cycle hour from acetate only and acetate with SMX
antibiotic at 300 Ω external resistance.
4.5.2.3 Tetracycline (TC or TETRA) antibiotic
According to figure 4.32 for TC, 1th
cycle was 600 mg/L acetate only, 2nd
cycle was
50 mg/L TC antibiotic plus 600 mg/L acetate, 3rd
cycle was acetate (600 mg/L) only,
4th
cycle was 100 mg/L TC antibiotic plus 600 mg/L acetate, from 5 th
to 8 th
cycles
were same concentration of acetate, 9 th
cycle was 200 mg/L TC antibiotic plus 600
mg/L acetate, 10 th
cycle was acetate (600 mg/L). Approximately, 1th
cycle lasts 27
hours, 2nd
cycle lasts 28 hours, 3rd
cycle lasts 31 hours, 4th
cycle lasts 30 hours, 5th
cycle lasts 26 hours, 6th
cycle lasts 38 hours, 7th
cycle lasts 38 hours, 8th
cycle lasts
34 hours, 9th
cycle lasts 26 hours and 10th
cycle lasts 42 hours, totally it lasts 465
hours for TC.
As it is seen table 4.3 and figure 4.33, current fields from 1th
to 10th
cycles were 0.36,
0.30, 0.38, 0.27, 0.25, 0.31, 0.33, 0.39, 0.26 and 0.44 mAcm2/hour, respectively.
Currents were 0.30 mAcm2/hour, 0.27 mAcm
2/hour and 0.26 mAcm
2/hour for 50
mg/L TC, 100 mg/L TC and 200 mg/L TC, respectively.

90
0
50
100
150
200
250
0 50 100 150 200 250 300 350 400 450 500
Vo
lta
ge
(m
V)
Time (h)
Figure 4.32: Voltage generation from acetate only and acetate with TC antibiotic at
300 Ω external resistance. Arrows indicate the replacement of
consumed solution with a fresh solution.
Table 4.3: MFC performance by TC addition.
Runs
Acetate
addition
mg/L
TC
addition
mg/L
Effluent
COD
mg/L
COD
efficiency
%
İntegraI
Current
(mA)
Current
(mA/cm2*hour)
Vmax
(mV) CE
1 600 0 4 99 52.452273 0.364037 190.75 0.17
2 600 50 48 93 43.814774 0.304199 180.85 0.14
3 600 0 5 99 55.050569 0.382236 183.76 0.18
4 600 100 95 86 38.89252 0.270028 140.52 0.12
5 600 0 14 98 35.310034 0.245116 131.69 0.11
6 600 0 30 95 45.185865 0.313658 180.91 0.14
7 600 0 5 99 48.014575 0.333368 159,91 0.15
8 600 0 9 99 56.2322 0.39043 172,76 0.18
9 600 200 72 91 37.09454 0.25753 148 0.12
10 600 0 10 98 63.28172 0.43938 153.51 0.20

91
0.00
0.10
0.20
0.30
0.40
0.50
Acetate 50mg/LTC+ Aceatate
Acetate 100mg/LTC+ Acetate
Acetate Acetate Acetate Acetate 200mg/LTC+ Acetate
Acetate
0.36
0.30
0.38
0.270.25
0.310.33
0.39
0.26
0.44
Cu
rre
nt
(mA
/cm
2*
ho
ur)
Figure 4.33: Current for per cycle hour from acetate only and acetate with TC
antibiotic at 300 Ω external resistance.
According to figure 4.34 for TC, coulombic efficiency (CE) values were 0.17 for 1th
cycle, 0.14 for 2nd
cycle, 0.18 for 3rd
cycle, 0.12 for 4th
cycle, 0.11 for 5th
cycle, 0.14
for 6th
cycle, 0.15 for 7th
cycle, 0.18 for 8th
cycle, 0.12 for 9th
cycle, 0.20 10th
cycle.
0.00
0.05
0.10
0.15
0.20
0.25
Acetate 50mg/LTC+ Aceatate
Acetate 100mg/LTC+ Acetate
Acetate Acetate Acetate Acetate 200mg/LTC+ Acetate
Acetate
0.17
0.14
0.18
0.120.11
0.140.15
0.18
0.12
0.20
Co
ulo
mb
ic e
ffic
ien
cy
Figure 4.34: Coulombic efficiency for per cycle hour from acetate only and acetate
with TC antibiotic at 300 Ω external resistance.
According to figure 4.35 for TC, COD efficiency (%) values were 99% for 1th
cycle,
94% for 2nd
cycle, 99% for 3rd
cycle, 92% for 4th
cycle, 98% for 5th
cycle, 95% for 6th
cycle, 99% for 7th
and 8th
cycles, 91% for 9th
cycle and 98% for 10th
cycle.

92
0
20
40
60
80
100
Acetate 50mg/LTC+ Aceatate
Acetate 100mg/LTC+ Acetate
Acetate Acetate Acetate Acetate 200mg/LTC+ Acetate
Acetate
9994
9992
98 95 99 9991
98
CO
D r
em
ov
al (%
)
Figure 4.35: COD efficiency for per cycle hour from acetate only and acetate with
TC antibiotic at 300 Ω external resistance.
When the MFC was fed with 50 mgCOD/L ERY and compared with control run,
there is a significant decrease in the maximum voltage reached (30% ) and the
current (38%) and experiment time lasted 2 hours longer. The system’s recovery to
its original form took 3 runs of acetate only feeds. For 100 mgCOD/L ERY, voltage
and current values obtained were 10% and 35% respectively. For 200 mgCOD/L
ERY, voltage and current values obtained were 23% and 48% respectively. COD
removal efficiency values decrease 7%, 15% and 29% for 50, 100 and 200
mgCOD/ml ERY respectively and no removal of antibiotics was observed.
Coulombic efficiency values decreased approximately 40% for every cycle. In
general, 50-200 mg/L addition of ERY caused an inhibition in the system and also
the electricity production from acetate was affected negatively.
50mgCOD/L addition of SMX on acetate caused an inhibition in the system. Current
and CE values decreased 23% and 29% respectively. Although the SMX
concentrations increased, inhibition levels did not increase and the system reached to
original form (control run) quickly. Current values decreased 18% for 100mgCOD/L
SMX and 9% for 200mgCOD/L SMX, while CE values decreased 24% and 6%
respectively. In the first SMX addition, the system was affected negatively; later, the
system reached to original form even though increasing SMX concentrations were
added. Comparing control runs, COD removal efficiency values decreased 3%, 7%
and 20% for 50-100-200 mgCOD/L SMX respectively and it was understood that
some part of the antibiotic, which was added, was removed.

93
When the MFC was fed with 50 mgCOD/L TC and compared with control run, the
current decreased 17%. Then, current level reached to original value. With the
addition of 100 mgCOD/L TC in the MFC, current level decreased 29%. The
system’s recovery to its original form took 4 runs of acetate only feeds. When the
system was fed with 200 mgCOD/L TC, current decreased 34% but with the addition
of acetate, it reached original value quickly. When 200 mgCOD/L TC was added the
system, 66% TC removal was observed. CE value decreased 33% for 200 mgCOD/L
TC.
4.5.3 Estrogens (Hormones)
In this study, natural estrogens which estrone (E1), 17β-estradiol (E2), estriol (E3)
and synthetic estrogen 17α-ethinylestradiol (EE2) were used. During experimental
study, 600 mg/L acetate was used as the carbon source and 300 Ω external resistance.
All cycles were started with acetate without hormones. When the potential was
decreased to 5 mV, the MFC was filled with different concentration hormone plus
acetate. Then it is loaded with acetate again. It is observed all cycles produced
electricity without the addition of new bacterial inoculum. When MFC was filled
with acetate without hormone or acetate plus hormone, the bacteria easily adapted to
produce electricity. During sequential cycles, there have been observed that similar
voltage generation not a little discrepancy at total voltage field.
4.5.3.1 Estrone (E1) Hormone
According to figure 4.36, 1th
cycle was 600 mg/L acetate only, 2nd
cycle was 0,1
mg/L E1 hormone plus 600 mg/L acetate, 3rd
cycle was acetate (600 mg/L), 4th
cycle
was 0,5 mg/L E1 hormone plus 600 mg/L acetate, 5 th
cycle was acetate only, 6th
cycle was 1 mg/L E1 hormone plus 600 mg/L acetate, 7 th
cycle was acetate (600
mg/L). Approximately, 1th
cycle lasts 30 hours, 2nd
cycle lasts 24 hours, 3rd
cycle
lasts 27 hours, 4th
cycle lasts 21 hours, 5th
cycle lasts 25 hours, 6th
cycle lasts 29
hours, 7th
cycle lasts 23 hours, totally it lasts 183 hours for E1 hormone.

94
Figure 4.36: Voltage generation from acetate only and acetate with E1 hormone at 300Ω
external resistance. Arrows indicate the replacement of consumed solution
with a fresh solution.
As it is seen table 4.4 and figure 4.37, current fields from 1th
to 7th
cycles were 0.48,
0.35, 0.48, 0.35, 0.43, 0.28, 0.44 mAcm2/hour, respectively. Currents were 0,35
mAcm2/hour, 0,35 mAcm
2/hour and 0,27 mAcm
2/hour for 0,1 mg/L E1, 0,5 mg/L
E1 and 1 mg/L E1, respectively.
Table 4.4: MFC performance by E1 addition.
Runs
Acetate
addition
mg/L
E1
addition
mg/L
Effluent
COD
mg/L
COD
efficiency
%
Integral
Current
(mA)
Current
(mA/cm2*hour)
Vmax
(mV) CE
1 600 0 50 92 69.8369 0.484625 279.72 0.24
2 600 0.1 100 83 50.8887 0.352917 265.81 0.19
3 600 0 52 91 69.7262 0.483742 258.49 0.24
4 600 0.5 140 77 50.1137 0.34749 255.07 0.21
5 600 0 68 89 62.3054 0.432242 257.97 0.22
6 600 1 189 69 40.2623 0.278397 250.09 0.19
7 600 0 72 88 63.9401 0.443683 270.04 0.23

95
0.0
0.1
0.2
0.3
0.4
0.5
Acetate 0.1 mg/L E1+ Acetate
Acetate 0.5 mg/L E1+ Acetate
Acetate 1 mg/L E1 + Acetate
Acetate
0.48
0.35
0.48
0.35
0.43
0.28
0.44
Cu
rren
t (m
A/c
m2 *
hou
r)
Figure 4.37: Current for per cycle hour from acetate only and acetate with E1
hormone at 300 Ω external resistance.
According to figure 4.38 for E1, coulombic efficiency (CE) values were 0.24 for 1th
cycle, 0.19 for 2nd
cycle, 0.24 for 3rd
cycle, 0.21 for 4th
cycle, 0.22 for 5th
cycle, 0.19
for 6th
cycle, 0.23 for 7th
cycle.
Figure 4.38: Coulombic efficiency for per cycle hour from acetate only and acetate
with E1 hormone at 300 Ω external resistance.

96
According to figure 4.39 for E1, COD efficiency (%) values were 92% for 1th
cycle,
83% for 2nd
cycle, 91% for 3rd
cycle, 77% for 4th
cycle, 89% for 5th
cycle, 69% for 6th
cycle and 88% for 7th
cycle.
0
10
20
30
40
50
60
70
80
90
100
Acetate 0,1 mg/L E1+ Acetate
Acetate 0,5 mg/L E1+ Acetate
Acetate 1 mg/L E1+ Acetate
Acetate
9283
91
77
89
69
88
CO
D r
em
ov
al (%
)
Figure 4.39: COD removal for per cycle hour from acetate only and acetate with E1
hormone at 300 Ω external resistance.
4.5.3.2 17 β-Estradiol (E2) hormone
According to figure 4.40, 1th
cycle was 600 mg/L acetate only, 2nd
cycle was 0,1
mg/L E2 hormone plus 600 mg/L acetate, 3rd
cycle was acetate (600 mg/L), 4th
cycle
was 0,5 mg/L E2 hormone plus 600 mg/L acetate, 5 th
cycle was acetate only, 6th
cycle was 1 mg/L E2 hormone plus 600 mg/L acetate, 7 th
cycle was acetate (600
mg/L). Approximately, 1th
cycle lasts 25 hours, 2nd
cycle lasts 22 hours, 3rd
cycle
lasts 24 hours, 4th
cycle lasts 25 hours, 5th
cycle lasts 29 hours, 6th
cycle lasts 25
hours, 7th
cycle lasts 27 hours, totally it lasts 200 hours for E2 hormone.

97
Figure 4.40: Voltage generation from acetate only and acetate with E2 hormone at
300 Ω external resistance. Arrows indicate the replacement of
consumed solution with a fresh solution.
As it is seen table 4.5, .and figure 4.41 current fields from 1th
to 7th
cycles were 0.44,
0.33, 0.44, 0.39, 0.47, 0.39, 0.44 mAcm2/hour, respectively. Currents were 0.33
mAcm2/hour, 0.39 mAcm
2/hour and 0.39 mAcm
2/hour for 0.1 mg/L E2, 0.5 mg/L
E2 and 1 mg/L E2, respectively.
Table 4.5: MFC performance by E2 addition.
Runs
Acetate
addition
mg/L
E2
addition
mg/L
Effluent
COD
mg/L
COD
efficiency
%
Integral
Current
(mA)
Current
(mA/cm2*hour)
Vmax
(mV) CE
1 600 0 72 88 63.9401 0,443683 270.04 0.23
2 600 0.1 18 97 47.1948 0.327592 270.1 0.15
3 600 0 2 100 64.7697 0.449506 271.04 0.21
4 600 0.5 30 95 56.5186 0.391759 270.67 0.19
5 600 0 2 100 69.2831 0.478295 272.4 0.22
6 600 1 36 94 56.7786 0.393598 270.55 0.19
7 600 0 2 100 64.0083 0.444112 260.22 0.20

98
0.00
0.10
0.20
0.30
0.40
0.50
Acetate 0.1 mg/L E2+ Acetate
Acetate 0.5 mg/L E2+ Acetate
Acetate 1 mg/L E2 + Acetate
Acetate
0.44
0.33
0.45
0.39
0.48
0.390.44
Cu
rre
nt
(mA
/cm
2*h
ou
r)
Figure 4.41: Current for per cycle hour from acetate only and acetate with E2
hormone at 300 Ω external resistance.
According to figure 4.42 for E2, coulombic efficiency (CE) values were 0.23 for 1th
cycle, 0.15 for 2nd
cycle, 0.21 for 3rd
cycle, 0.19 for 4th
cycle, 0.22 for 5th
cycle, 0.19
for 6th
cycle, 0.20 for 7th
cycle.
Figure 4.42: Coulombic efficiency for per cycle hour from acetate only and acetate
with E2 hormone at 300 Ω external resistance.
According to figure 4.43 for E2, COD efficiency (%) values were 88% for 1th
cycle,
97% for 2nd
cycle, 100% for 3rd
cycle, 95% for 4th
cycle, 100% for 5th
cycle, 94% for
6th
cycle and 100% for 7th
cycle.
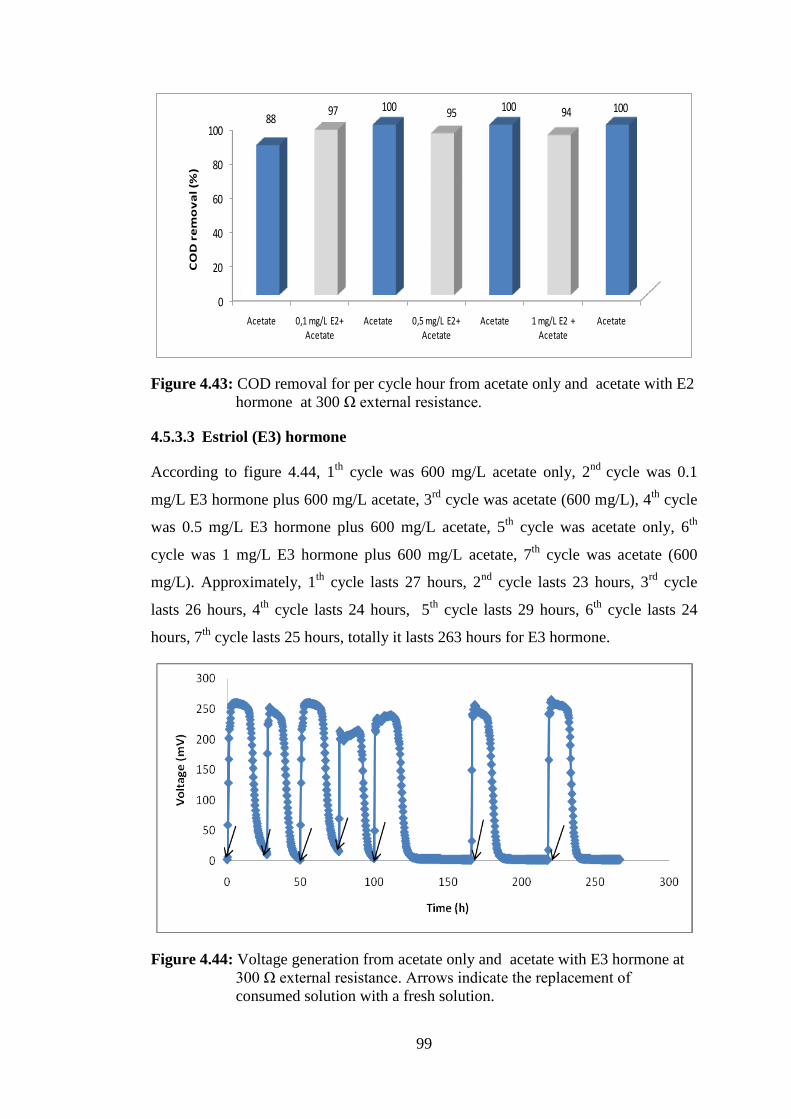
99
0
20
40
60
80
100
Acetate 0,1 mg/L E2+ Acetate
Acetate 0,5 mg/L E2+ Acetate
Acetate 1 mg/L E2 + Acetate
Acetate
8897 100 95 100 94 100
CO
D r
em
ov
al (%
)
Figure 4.43: COD removal for per cycle hour from acetate only and acetate with E2
hormone at 300 Ω external resistance.
4.5.3.3 Estriol (E3) hormone
According to figure 4.44, 1th
cycle was 600 mg/L acetate only, 2nd
cycle was 0.1
mg/L E3 hormone plus 600 mg/L acetate, 3rd
cycle was acetate (600 mg/L), 4th
cycle
was 0.5 mg/L E3 hormone plus 600 mg/L acetate, 5th
cycle was acetate only, 6th
cycle was 1 mg/L E3 hormone plus 600 mg/L acetate, 7th
cycle was acetate (600
mg/L). Approximately, 1th
cycle lasts 27 hours, 2nd
cycle lasts 23 hours, 3rd
cycle
lasts 26 hours, 4th
cycle lasts 24 hours, 5th
cycle lasts 29 hours, 6th
cycle lasts 24
hours, 7th
cycle lasts 25 hours, totally it lasts 263 hours for E3 hormone.
Figure 4.44: Voltage generation from acetate only and acetate with E3 hormone at
300 Ω external resistance. Arrows indicate the replacement of
consumed solution with a fresh solution.

100
As it is seen table 4.6 and figure 4.45, current fields from 1th
to 7th
cycles were 0.44,
0.30, 0.45, 0.33, 0.40, 0.32, 0.38 mAcm2/hour, respectively. Currents were 0.30
mAcm2/hour, 0.33 mAcm
2/hour and 0.32 mAcm
2/hour for 0.1 mg/L E3, 0.5 mg/L
E3 and 1 mg/L E3, respectively.
Table 4.6: MFC performance by E3 addition.
Runs
Acetate
addition
mg/L
E3
addition
mg/L
Effluent
COD
mg/L
COD
efficiency
%
IntegraI
Current
(mA)
Current
(mA/cm2*hour)
Vmax
(mV) CE
1 600 0 2 100 64.0083 0.44412 260.22 0.20
2 600 0.1 12 98 42.9826 0.29626 252.13 0.14
3 600 0 2 100 64.9358 0.45057 260.22 0.21
4 600 0.5 20 97 47.6424 0.33060 214.42 0.16
5 600 0 2 100 58.3042 0.40478 238.68 0.19
6 600 1 25 96 46.3055 0.32148 256.81 0.15
7 600 0 4 99 54.0793 0.37547 264.92 0.17
0.00
0.10
0.20
0.30
0.40
0.50
Acetate 0.1 mg/L E3 + Acetate
Acetate 0.5 mg/L E3 + Acetate
Acetate 1 mg/L E3 + Acetate
Acetate
0.44
0.30
0.45
0.33
0.40
0.32
0.38
Cu
rrre
nt
(mA
/cm
2*
ho
ur)
Figure 4.45: Current for per cycle hour from acetate only and acetate with E3
hormone at 300 Ω external resistance
According to figure 4.46 for E3, coulombic efficiency (CE) values were 0.20 for 1th
cycle, 0.14 for 2nd
cycle, 0.21 for 3rd
cycle, 0.16 for 4th
cycle, 0.19 for 5th
cycle, 0.15
for 6th
cycle, 0.17 for 7th
cycle.

101
0.00
0.05
0.10
0.15
0.20
0.25
Acetate 0.1 mg/L E3 + Acetate
Acetate 0.5 mg/L E3 + Acetate
Acetate 1 mg/L E3 + Acetate
Acetate
0.20
0.14
0.21
0.16
0.19
0.150.17
Co
ulo
mb
ic e
ffic
ien
cy
Figure 4.46: Coulombic efficiency for per cycle hour from acetate only and acetate
with E3 hormone at 300 Ω external resistance.
According to figure 4.47 for E3, COD efficiency (%) values were 100% for 1th
cycle,
98% for 2nd
cycle, 100% for 3rd
cycle, 97% for 4th
cycle, 100% for 5th
cycle, 96% for
6th
cycle and 99% for 7th
cycle.
0
20
40
60
80
100
Acetate 0,1 mg/L E3 + Acetate
Acetate 0,5 mg/L E3 + Acetate
Acetate 1 mg/L E3 + Acetate
Acetate
100 98 100 97 10096 99
CO
D r
em
ov
al (%
)
Figure 4.47: COD removal for per cycle hour from acetate only and acetate with E3
hormone at 300 Ω external resistance.
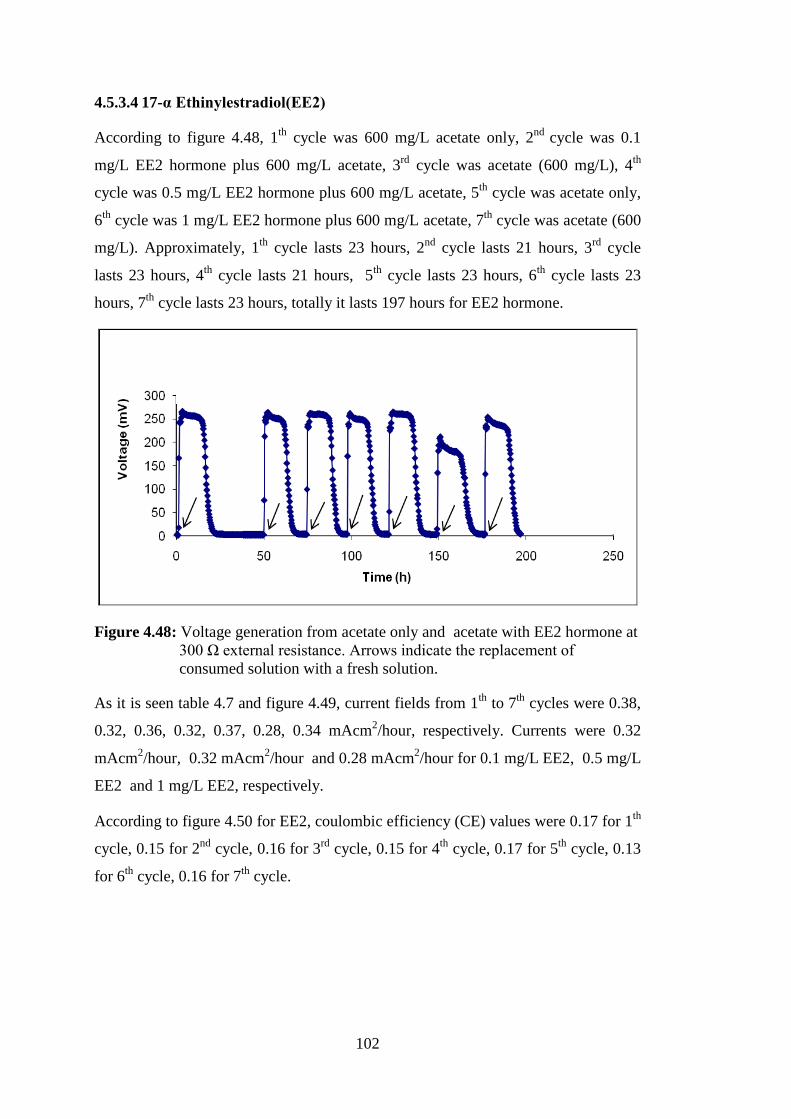
102
4.5.3.4 17-α Ethinylestradiol(EE2)
According to figure 4.48, 1th
cycle was 600 mg/L acetate only, 2nd
cycle was 0.1
mg/L EE2 hormone plus 600 mg/L acetate, 3rd
cycle was acetate (600 mg/L), 4th
cycle was 0.5 mg/L EE2 hormone plus 600 mg/L acetate, 5th
cycle was acetate only,
6th
cycle was 1 mg/L EE2 hormone plus 600 mg/L acetate, 7th
cycle was acetate (600
mg/L). Approximately, 1th
cycle lasts 23 hours, 2nd
cycle lasts 21 hours, 3rd
cycle
lasts 23 hours, 4th
cycle lasts 21 hours, 5th
cycle lasts 23 hours, 6th
cycle lasts 23
hours, 7th
cycle lasts 23 hours, totally it lasts 197 hours for EE2 hormone.
Figure 4.48: Voltage generation from acetate only and acetate with EE2 hormone at
300 Ω external resistance. Arrows indicate the replacement of
consumed solution with a fresh solution.
As it is seen table 4.7 and figure 4.49, current fields from 1th
to 7th
cycles were 0.38,
0.32, 0.36, 0.32, 0.37, 0.28, 0.34 mAcm2/hour, respectively. Currents were 0.32
mAcm2/hour, 0.32 mAcm
2/hour and 0.28 mAcm
2/hour for 0.1 mg/L EE2, 0.5 mg/L
EE2 and 1 mg/L EE2, respectively.
According to figure 4.50 for EE2, coulombic efficiency (CE) values were 0.17 for 1th
cycle, 0.15 for 2nd
cycle, 0.16 for 3rd
cycle, 0.15 for 4th
cycle, 0.17 for 5th
cycle, 0.13
for 6th
cycle, 0.16 for 7th
cycle.

103
Table 4.7: MFC performance by EE2 addition.
Runs
Acetate
addition
mg/L
EE2
addition
mg/L
Effluent
COD
mg/L
COD
efficiency
%
IntegraI
Current
(mA)
Current
(mA/cm2*hour)
Vmax
(mV) CE
1 600 0 4 99 54.0793 0.3754709 264.92 0.17
2 600 0.1 8 99 45.8060 0.318009 263.31 0.15
3 600 0 5 99 51.2563 0.35585606 259.75 0.16
4 600 0.5 9 99 45.8779 0.31849702 261.18 0.15
5 600 0 4 99 52.8175 0.36670039 260.14 0.17
6 600 1 8 99 40.4314 0.28065857 211.39 0.13
7 600 0 4 99 48.9406 0.33977702 252.62 0.16
0.00
0.10
0.20
0.30
0.40
Acetate 0.1 mg/L EE2 +Acetate
Acetate 0.5 mg/L EE2 + Acetate
Acetate 1 mg/L EE2 + Acetate
Acetate
0.38
0.320.36
0.32
0.37
0.28
0.34
Cu
rre
nt
(mA
/cm
2*h
ou
r)
Figure 4.49: . Current for per cycle hour from acetate only and acetate with EE2
hormone at 300 Ω external resistance.
0.00
0.04
0.08
0.12
0.16
0.20
Acetate 0.1 mg/L EE2
+Acetate
Acetate 0.5 mg/L EE2 +
Acetate
Acetate 1 mg/L EE2 +
Acetate
Acetate
0.17
0.150.16
0.150.17
0.13
0.16
Coul
ombi
c ef
ficie
ncy
Figure 4.50: Coulombic efficiency for per cycle hour from acetate only and acetate
with EE2 hormone at 300 Ω external resistance

104
According to figure 4.51 for EE2, COD efficiency (%) values were 99 % for all
cycles.
0
20
40
60
80
100
Acetate 0.1 mg/L EE2 +
Acetate
Acetate 0.5 mg/L EE2 +
Acetate
Acetate 1 mg/L EE2 +
Acetate
Acetate
99 99 99 99 99 99 99
COD
rem
oval
(%
)
Figure 4.51. COD removal for per cycle hour from acetate only and acetate with
EE2 hormone at 300 Ω external resistance.
When the MFC was fed with 0.1, 0.5 and 1 mg/L Estrone (E1) and compared with
control runs, currents decreased 27%, 27% and 36% respectively. After the addition
of 0,1, 0,5 ve 1 mg/L E1 to the system, it was observed that CE values decreased
approximately 21% for every cycle. COD removal efficiency values decreased 83%,
77% and 66%, respectively.
When the MFC was fed with 0.1, 0.5 and 1 mg/L 17 β-Estradiol (E2) and compared
with control runs, currents decreased 26%, 13% and 18% respectively. After the
addition of 0.1, 0.5 ve 1 mg/L E2 to the system it was observed that CE values
decreased 35%, 10% and 14% respectively. When the system was loaded with
acetate only after 0.1 mg/L E2, even 0.5 and 1 mg/L E2, the system reached to
original value quickly.
When the MFC was fed with 0.1, 0.5 and 1 mg/L Estriol (E3) and compared with
control runs, currents decreased 33%, 27% and 21% respectively. On the other hand,
CE values decreased 30, 24 and 25% respectively.
When the MFC was fed with 0.1, 0.5 and 1 mg/L 17-α Ethinylestradiol (EE2) and
compared with control runs, currents decreased 15%, 11% and 23% while CE values
decreased 12%, 12% and 24% respectively. When the system was loaded with 0,1
and 0,5 mg/L EE2, values of CE, Vmax and current reached to original form quickly.
On the other hand, CE, Vmax and current values affected negatively with the
addition of 1 mg/L EE2.

105
5. CONCLUSION
When it is considered in general, our thesis consists of two main subjects.
Firstly, it is purposed to generate electricity from organic compounds by using pure
culture in two chambered MFC. In order to carry out this study, the experiments are
achieved by creating a new laboratory substructure with the financial support taken
from Turkish State Planning Organization, Istanbul Technical University and Fatih
University. Long time optimization studies on this bacterium which is chosen for its
genetic feature and does not require an extra chemical mediator for the gain of
electrons are carried out. After the optimization, by using bacterium in the most
effective way and transferring it to MFC, open circuit potentials from different
organic compounds are taken. 0.8 mW/m2 power density is attained by connecting
5000 Ω external resistance to external circuit of MFC system and using 10 Mm
glucose and platinum electrodes. In his investigations, Kim et al. (2001) found that in
the studies of different species of the same pure culture, the power density was
0.19mW/m2
when woven graphite anode was used and the power density was 0.6
mW/m2 when graphite felt anode was used. Park and Zeikus (2002) achieved 1,6 ve
1.9 mW/m2 power density by using acetate and glucose in their studies. As it is
understood that since the power density values are quite low, later on we decide to
study with mixed culture bacteria in the thesis. In addition, it is decided to study with
single chambered MFC in order to try different MFC configurations while making
mixed culture experiments.
Different MFC system configurations are made by adapting from literature and are
started to operate. Three different configurations are made as a single chambered
MFC. These are named as SCF-1-MFC (single chambered flat-1-MFC), SCTMFC
(single chambered tubular MFC) and SCF-2-MFC (single chambered flat-2-MFC).
With SCF-1-MFC, current graphics are found and compared by changing external
resistance. However, in this type of SCF-1-MFC, low currents are achieved as well.
When the reason of it is analyzed, the first one is that not a good biofilm occurs on
the anode surface and it is understood through the image of SEM (Scanning Electron
Microscope). The other reason may be that the electrogen bacteria that will generate

106
electricity are not dominant on the system. Because in order to achieve electricity
current efficiently, acclimation of bacteria is needed by feeding continuously for a
long time.
Unfortunately, SCTMFC (Single Chambered Tubular MFC) system can not be
operated since it is not possible to cover the material used as cathode on the
perforated pipe and achieve the impermeability in this pipe-in-pipe system.
In the last stage of the thesis SCF-2-MFC (single chambered flat-2-MFC) is used.
This MFC is operated by using microorganisms acclimated more that one year. After
a short period of time system is operated, the electricity generation is started to be
observed. By using 600 mg/L acetate, control runs are made. Later, inhibition studies
are carried out by using different Xenobiotics (hormones and antibiotics). In other
words, by using SCF-2-MFC system as biosensor, the inhibition effects of these
xenobiotics on electrogen bacteria are compared with control runs which hormones
and antibiotics are not used and the results are noted.
According to these results, it is proved that both antibiotics and hormones have
inhibition effects on the system. 50-200 mg/L addition of ERY caused an inhibition
in the system and also the electricity production from acetate was affected
negatively. When the MFC was fed with 50 mgCOD/L ERY and compared with
control run, there was a significant decrease in the maximum voltage reached (30% )
and the current field reached (38%). For 100 mgCOD/L ERY, voltage and current
values obtained were 10% and 35% anf for 200 mgCOD/L ERY, voltage and current
values obtained were 23% and 48% respectively. COD removal efficiency values
decreased 7%, 15% and 29% for 50, 100 and 200 mgCOD/L ERY respectively and
no removal of antibiotics was observed. Coulombic efficiency values decreased
approximately 40% for every cycle.
Although the SMX concentrations increased, inhibition levels did not increase and
the system reached to original form (control run) quickly. Current values decreased
23% for 50 mgCOD/L SMX, 18% for 100mgCOD/L SMX and 9% for 200
mgCOD/L SMX, while CE values decreased 29%, 24% and 6% respectively. In the
first SMX addition, the system was affected negatively; later, the system reached to
original form even though increasing SMX concentrations were added. When
compared with control runs, COD removal efficiency values decreased 3%, 7% and

107
20% for 50-100-200 mgCOD/L SMX respectively and it was understood that some
part of the antibiotic, which was added, was removed.
With the addition of 100 mgCOD/L TC in the MFC, current level decreased 29%.
The system’s recovery to its original form took 4 runs of acetate only feeds. When
the system was fed with 200 mgCOD/L TC, current decreased 34% but with the
addition of acetate, it reached original value quickly. When 200 mgCOD/L TC was
added to the system, 66% TC removal was observed. CE value decreased 33% for
200 mgCOD/L TC.
When the MFC was fed with 0.1, 0.5 and 1 mg/L Estrone (E1) and compared with
control runs, currents decreased 27%, 27% and 36% respectively. CE values
decreased approximately 21% for every cycle. COD removal efficiency values
decreased 83%, 77% and 66%, respectively.
When the MFC was fed with 0.1, 0.5 and 1 mg/L 17 β-Estradiol (E2) and compared
with control runs, currents decreased 26%, 13% and 18% respectively. After the
addition of 0.1, 0.5 ve 1 mg/L E2 to the system it was observed that CE values
decreased 35%, 10% and 14% respectively. When the system was loaded with
acetate only after 0.1 mg/L E2, even 0.5 and 1 mg/L E2, the system reached to its
original value quickly.
When the MFC was fed with 0.1, 0.5 and 1 mg/L Estriol (E3) and compared with
control runs, currents decreased 33%, 27% and 21% respectively. On the other hand,
CE values decreased 30, 24 and 25% respectively.
When the MFC was fed with 0.1, 0.5 and 1 mg/L 17-α Ethinylestradiol (EE2) and
compared with control runs, currents decreased 15%, 11% and 23% while CE values
decreased 12%, 12% and 24% respectively. When the system was loaded with 0,1
and 0,5 mg/L EE2, values of CE, Vmax and current reached to original form quickly.
On the other hand, CE, Vmax and current values affected negatively with the
addition of 1 mg/L EE2.
If these results were evaluated in general, it was understood that ERY and TC
antibiotics had more inhibition effects on the current than SMX. When the
concentrations of ERY and TC antibiotics increased, their inhibition effects on
electrogen bacteria increased as well. However, a similar condition was not observed
in SMX.

108
When hormones were evaluated in general, the inhibition in the current value did not
increase although E2 and E3 concentrations were increased. On the other hand, it
was observed that the inhibition in the current value increased when the
concentrations in E1 and synthetic estrogen EE2 were increased.
In our experiments, the acute effects of the inhibitor materials are investigated and
reported. In order to reach more clear results for future perspective, the cronic effects
of the same materials have to be studied. Moreover, it is considered to find out how
using more different xenobiotics affects electrogens and in this way, we can make
contribution to science. The chosen antibiotics are widely used in Turkey and around
the world. On the other hand, since it is observed by the researchers that widely
usage of synthetic hormones in recent times has negative effects on fish, it is proved
in this study that they show diversity in terms of electricity current of electrogen
bacteria.
In the future, doing this kind of studies should be accelerated by drawing attention to
the protection of our water sources which have the contamination potential with the
uncontrolled medicine discharges.
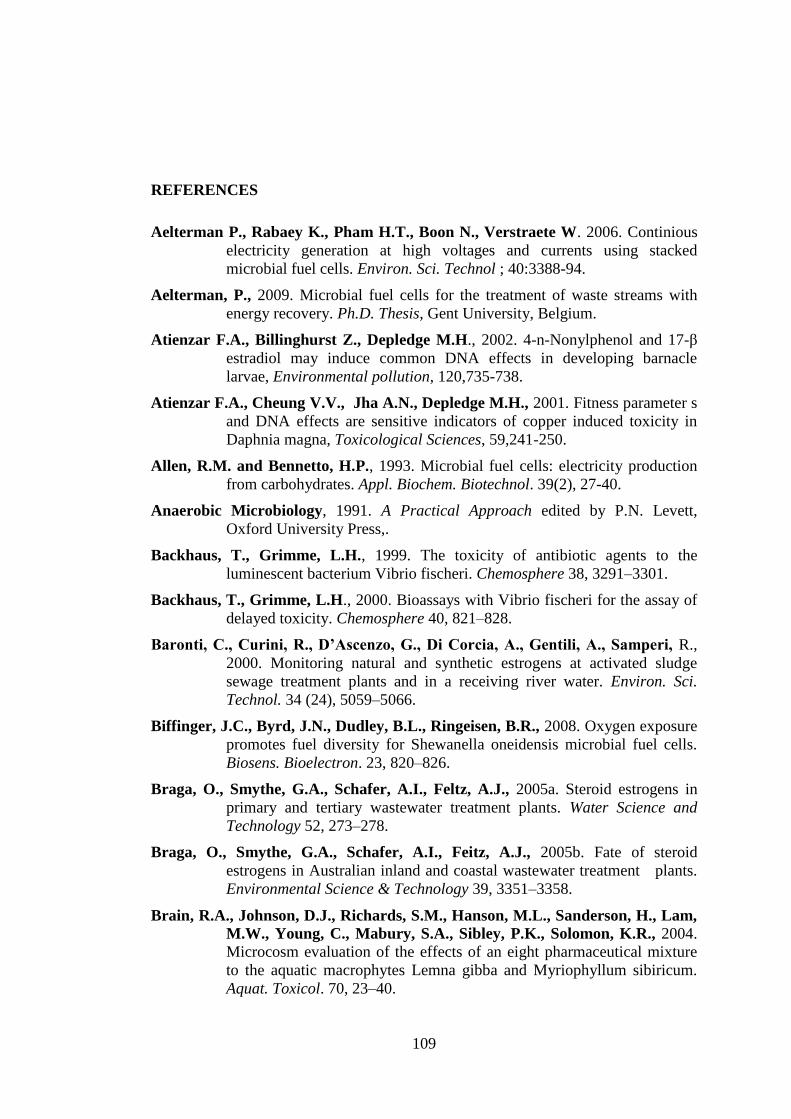
109
REFERENCES
Aelterman P., Rabaey K., Pham H.T., Boon N., Verstraete W. 2006. Continious
electricity generation at high voltages and currents using stacked
microbial fuel cells. Environ. Sci. Technol ; 40:3388-94.
Aelterman, P., 2009. Microbial fuel cells for the treatment of waste streams with
energy recovery. Ph.D. Thesis, Gent University, Belgium.
Atienzar F.A., Billinghurst Z., Depledge M.H., 2002. 4-n-Nonylphenol and 17-β
estradiol may induce common DNA effects in developing barnacle
larvae, Environmental pollution, 120,735-738.
Atienzar F.A., Cheung V.V., Jha A.N., Depledge M.H., 2001. Fitness parameter s
and DNA effects are sensitive indicators of copper induced toxicity in
Daphnia magna, Toxicological Sciences, 59,241-250.
Allen, R.M. and Bennetto, H.P., 1993. Microbial fuel cells: electricity production
from carbohydrates. Appl. Biochem. Biotechnol. 39(2), 27-40.
Anaerobic Microbiology, 1991. A Practical Approach edited by P.N. Levett,
Oxford University Press,.
Backhaus, T., Grimme, L.H., 1999. The toxicity of antibiotic agents to the
luminescent bacterium Vibrio fischeri. Chemosphere 38, 3291–3301.
Backhaus, T., Grimme, L.H., 2000. Bioassays with Vibrio fischeri for the assay of
delayed toxicity. Chemosphere 40, 821–828.
Baronti, C., Curini, R., D’Ascenzo, G., Di Corcia, A., Gentili, A., Samperi, R.,
2000. Monitoring natural and synthetic estrogens at activated sludge
sewage treatment plants and in a receiving river water. Environ. Sci.
Technol. 34 (24), 5059–5066.
Biffinger, J.C., Byrd, J.N., Dudley, B.L., Ringeisen, B.R., 2008. Oxygen exposure
promotes fuel diversity for Shewanella oneidensis microbial fuel cells.
Biosens. Bioelectron. 23, 820–826.
Braga, O., Smythe, G.A., Schafer, A.I., Feltz, A.J., 2005a. Steroid estrogens in
primary and tertiary wastewater treatment plants. Water Science and
Technology 52, 273–278.
Braga, O., Smythe, G.A., Schafer, A.I., Feitz, A.J., 2005b. Fate of steroid
estrogens in Australian inland and coastal wastewater treatment plants.
Environmental Science & Technology 39, 3351–3358.
Brain, R.A., Johnson, D.J., Richards, S.M., Hanson, M.L., Sanderson, H., Lam,
M.W., Young, C., Mabury, S.A., Sibley, P.K., Solomon, K.R., 2004.
Microcosm evaluation of the effects of an eight pharmaceutical mixture
to the aquatic macrophytes Lemna gibba and Myriophyllum sibiricum.
Aquat. Toxicol. 70, 23–40.

110
Brain, R.A., Hanson, M.L., Solomon, K.R., Brooks, B.W., 2008. Aquatic plants
exposed to pharmaceuticals: effects and risks. Rev. Environ. Contam. T
192, 67–115.
Bond, D. R.; Holmes, D. E.; Tender, L. M.; Lovley, D. R. 2002. Electrodereducing
microorganisms that harvest energy from marine sediments. Science
2002, 295, 483-485.
Bond DR, LovleyDR., 2003. Electricity production by Geobacter sulfurreducens
attached to electrodes. Appl Environ Microbiol., 69:1548–55.
Boxall, A.B.A., Fogg, L.A., Kay, P., Blackwell, P.A., Pemberton, E.J., Croxford,
A., 2003. Veterinary medicines in the environment. Rev. Environ.
Contam. T. 180, 1–91.
Cajthaml T, Křesinová Z., Svobodová K., Sigler K., Rezanka T., 2009. Microbial
transformation of synthetic estrogen 17α-ethinylestradiol. Environmental
Pollution 157, 3225-3335.
Campbell, P.J., Arnold, D.J.S., Brock, T.C.M., Grandy, N.J., Heger, W.,
Heimbach, F., Maund, S.J., Streloke, M., 1999. Guidance Document
on Higher-Tier Aquatic Risk Assessment for Pesticides SETAC-Europe,
Brussels.
Cao, Q., Yu, Q., Connell, D.W., 2008. Degradation rate constants of steroids in
sewage treatment works and receiving water. Environmental Technology
29,1321–1330.
Carballa, M., Omil, F., Ternes, T., Lema, J.M., 2007. Fate of pharmaceutical and
personal care products (PPCPs) during anaerobic digestion of sewage
sludge. Water Research 41, 2139–2150.
Catal, T., Xu, S., Li, K., Bermek, H., Liu, H., 2008. Electricity production from
polyalcohols in single-chamber microbial fuel cells. Biosens.
Bioelectron. 24, 855–860.
Catal, T., Xu, S., Li, K., Bermek, H., Liu, H., 2008. Electricity production from
polyalcohols in degradation in microbial fuel cells. Biotechnol. Bioeng.
100 (3), 413–422.
Chae, K.-J., Choi, M.-J., Lee, J.-W., Kim, K.-Y., Kim, I.S., 2009. Effect of
different substrates on the performance, bacterial diversity, and bacterial
viability in microbial fuel cells. Biores. Technol. 100, 3518–3525.
Clara, M., Strenn, B., Saracevic, E., Kreuzinger, N., 2004. Adsorption of
bisphenol-A, 17 beta-estradiole and 17a-ethinylestradiole to sewage
sludge. Chemosphere 56, 843–851.
Chia M. 2002. A miniaturized microbial fuel cell, Technical digest of solid state
sensors and actuators workshop,Hilton Head Island; 59–60.
Chang I.S., Jang J.K., Gil G.C., Kim M., Kim H.J., Cho B.W., 2004. Continuous
determination of biochemical oxygen demand using microbial fuel cell
type biosensor. BiosensBioelectron, 19, 607-613.
Chang IS, Moon H, Jang JK, Kim BH., 2005. Improvement of a microbial fuel cell
performance as a BOD sensor using respiratory inhibitors. Biosens
Bioelectron ;20:1856–9.

111
Chaudhuri SK, Lovley DR., 2003. Electricity generation by direct oxidation of
glucose in mediatorless microbial fuel cells. Nat Biotechnol
2003;21:1229–32.
Choi Y., Jung E., Kim S., Jeng S., 2003. Membran fluidity sensoring microbial fuel
cell. Bioelectrochemistry,59,121-127
Christian, T., Schneider, R.J., Färber, H.A., Skutlarek, D., Meyer, M.T.,
Goldbach, H.E., 2003. Determination of antibiotic residues in manure,
soil, and surface waters. Acta Hydroch. Hydrob. 31, 36–44.
Cheng, S.; Liu, H.; Logan, B. E., 2006. Increased Power Generation in a
Continuous Flow MFC with Advective Flow Through the Porous Anode
and Reduced Electrode Spacing. Environ. Sci. Technol. 2006, 40, 2426–
2432.
Colucci, M.S., Topp, E., 2001a. Persistence of estrogenic hormones in agricultural
soils: I. 17b-estradiol and estrone. Journal of Environmental Quality 30,
2070–2076.
Colucci, M.S., Topp, E., 2001b. Persistence of estrogenic hormones in agricultural
soils: II. 17a-ethynylestradiol. Journal of Environmental Quality 30,
2077–2080.
Czajka, C.P., Londry, K.L., 2006. Anaerobic biotransformation of estrogens.
Science of the Total Environment 367, 932–941.
Croal, L. R., Gralnick, J. A., Malasarn, D., Newman, D. K., 2004: The genetics of
geochemistry, Annu. Rev. Genet., Vol. 38, pp. 175–202.
Dantas, R.F., Contreras, S., Sans, C., Esplugas, S., 2007. Sulfamethoxazole
abatement by means of ozonation. J. Hazard Mater. 150, 790–794.
Delong EF, Chandler P., 2002. Power from the deep. Nat Biotechnol ;20:788–9.
Diaz-Cruz M.S., Lopez de Alda M.J., Barcelo D., 2003. Environmental behavior
and analysis of veterinary and human drugs in soils, sediments and
sludge. Trends Anal Chem, 22:340–351.
Dokianakis, S.N., Kornaros, M.E., Lyberatos, G., 2004. On the effect of
pharmaceuticals on bacterial nitrite oxidation. Water Sci. Technol. 50,
341–346.
Dytczak, M.A., Londry, K.L., Oleszkiewicz, J.A., 2008. Biotransformation of
estrogens in nitrifying activated sludge under aerobic and alternating
anoxic/aerobic conditions. Water Environment Research 80, 47–52.
Du Z, Li H, Gu T., 2007. A state of the art review on microbial fuel cells: A
promising technology for wastewater treatment and bioenergy
Biotechnology Advances 25, 2007 464–482.
Fent K., Weston A. A., Caminada D., 2006. Ecotoxicology of human
pharmaceuticals, Aquatic Toxicology, 76, 122-159.
Feng, Y., Wang, X., Logan, B.E., Lee, H., 2008. Brewery wastewater treatment
using air-cathode microbial fuel cells. Appl. Microbiol. Biotechnol. 78,
873–880.
Forrez, I., Carballa, M., Boon, N., Verstraete, W., 2009a. Biological removal of
17alphaethinylestradiol (EE2) in aerated nitrifying fixed bed reactor

112
during ammonium starvation. Journal of Chemical Technology and
Biotechnology 84, 119–125.
Forrez, I., Carballa, M., Noppe, H., De Brabander, H., Boon, N., Verstraete, W.,
2009b. Influence of manganese and ammonium oxidation on the removal
of 17alphaethinylestradiol (EE2). Water Research 43, 77–86.
Fujii, K., Kikuchi, S., Satomi, M., Ushio-Sata, N., Morita, N., 2002. Degradation
of 17 beta-estradiol by a gram-negative bacterium isolated from activated
sludge in a sewage treatment plant in Tokyo, Japan. Applied and
Environmental Microbiology 68, 2057–2060.
Froehner, K., Backhaus, T., Grimme, L.H., 2000. Bioassays with Vibrio fischeri
for the assessment of delayed toxicity. Chemosphere 40, 821–828.
Gregory KB, Bond DR, Lovley DR., 2004. Graphite electrodes as electron donors
for anaerobic respiration. EnvironMicrobiol., 6:596–604.
Greenman, J., Gálvez, A., Giusti, L., Ieropoulos, I., 2009. Electricity from landfill
leachate using microbial fuel cells: comparison with a biological aerated
filter. Enzyme Microb. Technol. 44, 112–119.
Giger, W., Alder, A.C., Golet, E.M., Kohler, H.P.E., McArdell, C.S., Molnar, E.,
Siegrist, H., Suter, M.J.F., 2003. Occurrence and fate of antibiotics as
trace contaminants in wastewaters, sewage sludges, and surface waters.
Chimia; 57, 485–491.
Gil GC, Chang IS, Kim BH, Kim M, Jang JY, Park HS, 2003. Operational
parameters affecting the performance of a mediatorless microbial fuel
cell. Biosens Bioelectron;18:327–34.
González, O., Sans, C., Esplugas, S., 2007. Sulfamethoxazole abatement by photo-
Fenton toxicity, inhibition and biodegradability assessment of
intermediates. J. Hazard. Mater. 146, 456–459.
Gorby, Y. A., Yanina, S., McLean, J. S., Rosso, K. M., Moyles, D., 2006.
Electrically conductive bacterial nanowires produced by Shewanella
oneidensis strain MR-1 and other microorganisms, Proc. Natl. Acad. Sci.
USA, Vol. 103, pp. 11358–63.
Gu, C., Karthikeyan, K.G., 2008. Sorption of the antibiotic tetracycline to humic
mineral complexes. J. Environ. Qual. 37, 704–711.
Hau, H. H. and Gralnick, J. A., 2007. Ecology and Biotechnology of the Genus
Shewanella, Annu. Rev. Microbiol., Vol. 61, pp. 237–58, 2007.
Habermann W., Pommer .E.H., 1991. Biological fuel cells with sulphide storage
capacity. Appl Microbiol Biotechnol;35:128–33.
Halling-Sørensen, B., 2000. Algal toxicity of antibacterial agents used in intensive
farming. Chemosphere, 40, 731–739.
He, Z.; Minteer, S. D.; Angenent, L. T. 2005. Electricity Generation from Artificial
Wastewater Using an Upflow Microbial Fuel Cell. Environ. Sci.
Technol., 39, 5262–5267.
Heilmann, J., Logan, B.E., 2006. Production of electricity from proteins using a
microbial fuel cell. Water Environ. Res. 78, 531–537.

113
Hester R.E., and Harrison R.M., 1999. Endocrine distrupting chemicals, Issius in
Environmental Science and Technology. Royal Society Chemistry.
Holmes DE, Bond DR, O’Neil RA, Reimers CE, Tender LR, Lovley DR. 2004.
Microbial communities associated with electrodes harvesting electricity
from a variety of aquatic sediments. Microbial Ecol 48:178–90.
Holzman D.C., 2005. Microbe power. Environ Health Persp, 113:A754–7.
Huang, L.P., Logan, B.E., 2008. Electricity generation and treatment of paper
recycling wastewater using a microbial fuel cell. Appl. Microbiol.
Biotechnol. 80, 349–355.
Ieropoulos I, Greenman J, Melhuish C. 2003. Imitation metabolism: energy
autonomy in biologically inspired robots. Proceedings of the 2nd
international symposium on imitation of animals and artifacts; 191–194.
Ieropoulos IA, Greenman J, Melhuish C, Hart J.,2005. Comparative study of
three types of microbial fuel cell. Enzyme Microb Tech 2005;37:238–45.
Jang, J.K., Pham, T.H., Chang, I.S., Kang, K.H., Moon, H., Cho, K.S., Kim,
B.H., 2004: Construction and operation of a novel mediator and
membrane-less microbial fuel cell, Biochem. 39, 1007–1012.
Jobling S, Casey D, Rogers-Gray T, Oehlmann J, Schulte-Oehlmann U,
Pawlowski S, Baunbeck T, Turner AP, Tyler CR., 2003. Comparative
responses of molluscs and fish to environmental estrogens and an
estrogenic effluent. Aquat Toxicol. , 65, 205-220.
Jobling, S., Nolan, M., Tyler, C.R., Brighty, G., Sumpter, J.P., 1998. Widespread
sexual disruption in wild fish. Environ. Sci. Technol. 32 (17), 2498–2506.
Jobling S., Reynolds T., White R., Parker M.G., Sumpter J.P., 1995. A variety of
environmentally persistent chemicals, including some phthalate
plasticizers, are weakly estrogenic., Environmental Health and
Perspectives, 103, 582-587.
Johnson, A.C., Sumpter, J.P., 2001. Removal of endocrine-disrupting chemicals in
activated sludge treatment works. Environmental Science & Technology
35, 4697–4703.
Johnson, A.C., Aerni, H.R., Gerritsen, A., Gibert, M., Giger,W., Hylland, K.,
Jurgens, M., Nakari, T., Pickering, A., Suter, M.J.F., Svenson, A.,
Wettstein, F.E., 2005. Comparing steroid estrogen, and nonylphenol
content across a range of European sewage plants with different
treatment and management practices.Water Research 39, 47–58.
Joss, A., Andersen, H., Ternes, T., Richle, P.R., Siegrist, H., 2004. Removal of
estrogens in municipal wastewater treatment under aerobic and anaerobic
conditions: consequences for plant optimization. Environmental Science
& Technology,38, 3047–3055.
Larsson, D.G.J., de Pedro, C., Paxeus N., 2007. Effluent from drug manufactures
contains extremely high levels of pharmaceceuticals. Journal of
Hazardous Material. 148, 751-755.
Lin, A.Y.C., Tsai, Y.T., 2009. Occurence of pharmaceuticals in Taiwans’s surface
waters: impact of waste streams from hospitals and pharmaceutical
production facilities. Science of the total Environment. 407, 3793-3802.

114
Jurgens, M.D., Holthaus, K.I.E., Johnson, A.C., Smith, J.J.L., Hetheridge, M.,
Williams, R.J., 2002. The potential for estradiol and ethinylestradiol
degradation in English rivers. Environmental Toxicology and Chemistry
21, 480–488.
Kanda, R., Churchley, J., 2008. Removal of endocrine disrupting compounds
during conventional wastewater treatment. Environmental Technology
29, 315–323.
Kang KH, Jang JK, PhamTH,Moon H, Chang IS,Kim BH. 2003. Amicrobial fuel
cell with improved cathode reaction as a low biochemical oxygen
demand sensor. Biotechnol Lett 2003;25:1357–61.
Kavlock, R.J., Daston, G.P., DeRosa, C., Fenner-Crisp, P., Gray, L.E., Kaattari,
S., Lucier, G., Luster, M., Mac, M.J., Maczka, C., Miller, R., Moore,
J., Roplland, R., Scott, G., Sheenen, D.M., Sinks, T., Tilson, H.A.,
1996. Research needs for the risk assessment of health and environmental
effects of endocrine disrupters: a report of the US EPA-sponsored
workshop. Environmental Health Perspectives 104-4, 715–741.
Ke, J.X., Zhuang, W.Q., Gin, K.Y.H., Reinhard, M., Hoon, L.T., Tay, J.H., 2007. Characterization of estrogen-degrading bacteria isolated from an
artificial sandy aquifer with ultrafiltered secondary effluent as the
medium. Applied Microbiology and Biotechnology 75, 1163–1171.
Kidd K. A., Blanchfield P.J., Mills K.H., Palace V.P., Evans R.E., Lazorchak
J.M., Flick R. W., 2007. Collapse of a Fish Population after Exposure to
a Synthetic Estrogen, Proceedings of the National Academy of Sciences
of the United States of America 104, 8897–8901.
Kim, B.-H., Ikeda, T., Park, H.-S., Kim, H.-J., Hyun, M.-S., Kano, K., Takagi,
K. and Tatsumi, H. 1999a. Electrochemical activity of an Fe(II1)-
reducing bacterium, Shewanella putrefaciens IR- I , in the presence of
alternative electron acceptors. Biotechnol. Techniques 13(7), 475-478.
Kim, B.H., Kim, H.-J., Hyun, M.-S. and Park, D.-H., 1999b. Direct electrode
reaction of Fe(lI1)-reducing bacterium, Shewanella putrefaciens. J.
Microbiol. Biotechnol. 9(2), 127- 13 1.
Kim, B.H., Park, D.H., Shin, P.K., Chang, I.S. and Kim, H.J. 1999c. Mediator-
less biofuel cell. U.S. Patent 5976719.
Kim, H.-J., Hyun, M.-S., Chang, I.S. and Kim, B.-H. 1999d A microbial fuel cell
type lactate biosensor using a metal-reducing bacterium, Shewanella
putrefaciens. J. Microbiol.Biotechnol. 9(3), 365-367.
Kim HJ, Park H.S., Hyun M.S., Chang I.S., Kim M., Kim B.H., 2002., A
mediatorless microbial fuel cell using a metal reducing bacterium,
Shewanella putrefaciens. Enzyme Microb Tech ;30:145–52.
Kim BH, Chang IS, Gil GC, Park HS, Kim HJ. 2003. Novel BOD (biological
oxygen demand) sensor using mediator-less microbial fuel cell.
Biotechnol Lett ;25:541–5.
Kim BH, Park HS, Kim HJ, Kim GT, Chang IS, Lee J, 2004. Enrichment of
microbial community generating electricity using a fuel-cell type
electrochemical cell. Appl Microbiol Biotechnol ;63:672–81.

115
Kim J.R, Min B, Logan B.E. 2005. Evaluation of procedures to acclimate a
microbial fuel cell for electricity production. Appl Microbiol Biotechnol,
68:23–30.
Kim, S., Eichhorn, P., Jensen, J.N., Weber, A.S., Aga, D.S., 2005. Removal of
antibiotics in wastewater: effect of hydraulic and solid retention timeson
the fate of tetracycline in the activated sludge process. Environ. Sci.
Technol. 39, 5816–5823.
Kim, S.C., Carlson, K., 2007. Temporal and spatial trends in the occurrence of
human and veterinary antibiotics in aqueous and river sediment matrices.
Environ. Sci. Technol. 41, 50–57.
Kolpin, D.W., Furlong, E.T., Meyer, M.T., Thurman, E.M., Zaugg, S.D.,
Barber, L.B., Buxton, H.T., 2002. Pharmaceuticals, hormones and
other organic wastewater contaminants in U.S. streams 1999–2000: a
national reconnaissance. Environ. Sci. Technol. 36 (6), 1202–1211.
Kumlanghan K. 2007. Microbial fuel cell-based biosensor for fast analysis of
biodegradable organic matter. Biosensors and Bioelectronics 22 2939–
2944.
Kümmerer, K, 2009. Antibiotics in the aquatic environment – A review – Part I,
Chemosphere, 75-417-434.
Kümmerer, K., 2004. Resistance in the environment. J. Antimicrob. Chemoth. 54,
311–320.
Kümmerer, K., Henninger, A., 2003. Promoting resistance by the emission of
antibiotics from hospitals and households into effluents. Clin. Microbiol.
Infec.9, 1203–1214.
Kümmerer, K., Al-Ahmad, A., Mersch-Sundermann, V., 2000. Biodegradability
of some antibiotics, elimination of the genotoxicity and affection of
wastewater bacteria in a simple test. Chemosphere 40, 701–710.
Layton, A.C., Gregory, B.W., Seward, J.R., Schultz, T.W., Sayler, G.S., 2000.
Mineralization of steroidal hormones by biosolids in wastewater
treatment systems in Tennessee USA. Environmental Science &
Technology 34, 3925–3931.
Li, K., Yediler, A., Yang, M., Schulte-Hostede, S., Wong, M.H., 2008. Ozonation
of oxytetracycline and toxicological assessment of its oxidation by-
products. Chemosphere 72, 473–478.
Liu, H.; Logan, B. E., 2004. Electricity Generation Using an Air-Cathode Single
Chamber Microbial Fuel Cell in the Presence and Absence of a Proton
Exchange Membrane. Environ. Sci. Technol., 38, 4040–4046.
Liu, H.; Ramnarayanan, R.; Logan, B. E., 2004. Production of electricity during
wastewater treatment using a single chamber microbial fuel cell. Environ.
Sci. Technol., 38, 2281-2285.
Liu, H., Cheng, S., Logan, B.E. 2005. Power generation in fedbatch microbial fuel
cells as function of ionic strength, temperature and reactor configuration.
Environ. Sci. Technol.; 39 (14), 5488–5493.

116
Liu Z.D., Lian J., Du Z.W., Li H.R., 2006. Construction of sugar-based microbial
fuel cells by dissimilatory metal reduction bacteria. Chin J Biotech
;21:131–7.
Liu, Z., Liu, J., Zhang, S., Su, Z., 2009. Study of operational performance and
electrical response on mediator-less microbial fuel cells fed with carbon-
and protein-rich substrates. Biochem. Eng. J. 45, 185–191.
Logan, B. E. 2004. Extracting hydrogen and electricity from renewable resources.
Environ. Sci. Technol., 38, 160a-167a.
Logan, B.E. 2005. Materials and configuration for scalable microbial fuel cells.
Provisional patent application, PST 2091 8, PSU 2006-3 173, Penn State
University.
Logan B.E., Murano C., Scott K., Gray N.D., Head I.M., 2005. Electricity
generation from cysteine in a microbial fuel cell. Water Research ,39:
942–952
Logan B.E., Hamelers B., Rozendal R., Schroder U., Keller J, Freguia S, 2006.
Microbial fuel cells: methodology and technology. Environ Sci
Technol;40, 5181–92.
Logan, B. E., Regan, J. M., 2006a. Electricity-producing bacterial communities in
microbial fuel cells, Trends. Microbiol., Vol. 14, pp. 512–18,
Logan B.E., Regan J.M., 2006b. Microbial Challenges and Fuel Cell Applications,
Environmental Science & Technology, 5172-5180
Logan, B.E., Cheng, S., Watson, V., Estadt, G., 2007. Graphite fiber brush anodes
for increased power production in air-cathode microbial fuel cells.
Environ. Sci. Technol. 41, 3341–3346.
Logan B.E., 2008., Microbial Fuel Cells, Wiley Interscience, A. John Wiley and
Sons, Inc, Publication
Lovley D.R. 1993. Dissimilatory metal reduction. Annu Rev Microbial ;47:263–90.
Lovley D.R., Coates J.D., Blunt-Harris E.L., Phillips E.J.P., Woodward J.C.,
1996. Humic substances as electron acceptors for microbial respiration.
Nature ;382:445–8.
Lovley D.R., Holmes D.E., Nevin K.P, 2004. Dissimilatory Fe(III) and Mn(IV)
reduction. Adv Microb Physiol;49:219–86.
Lovley, D.R., 2006. Bug juice: harvesting electricity with microorganisms. Nature
Rev. Microbiol., 4,497-508.
Lundgren M.S., Novak, P.J., 2009. Quantification of Phytoestrogens in Industrial
Waste Streams, Environmental Toxicology and Chemistry , 28,2318-
2323
Luo, H., Liu, G., Jin, S., 2009. Phenol degradation in microbial fuel cells. Chem.
Eng. J. 147, 259–264.
Madigan, M.T. and Martinko, J.M. 2006. Brock Biology of Microorganisms,
Pearson Education Inc., Upper Saddle River, NJ.
Melhunish C., Ieropoulos I., Greenman, J., Horsfield I., 2006. Energitically
autonomous robots:food for thougt. 21-187-198 .

117
Mes, T.Z.D.D., Kujawa-Roeleveld, K., Zeeman, G., Lettinga, G., 2008. Anaerobic
biodegradation of estrogens – hard to digest. Water Science and
Technology 57, 1177–1182.
Mie` ge, C., Choubert, J.M., Ribeiro, L., Euse` be, M., Coquery, M., 2009. Fate
of pharmaceuticals and personal care products in wastewater treatment
plants –conception of a database and first results. Environmental
Pollution 157, 1721–1726.
Min B., Logan B.E., 2004. Continuous electricity generation from
domesticwastewater and organic substrates in a flat plate microbial fuel
cell. Environ Sci Technol 2004;38:5809–14.
Min B, Cheng S, Logan B.E., 2005a. Electricity generation using membrane and
salt bridge microbial fuel cells. Water Res;39:1675–86.
Min B, Kim J.R., Oh S.E., Regan J.M., Logan B.E, 2005b. Electricity generation
from swine wastewater using microbial fuel cells. Water Res;39:4961–8.
Moon H., Chang I.S.,Kang K.H., Jang J.K.,Kim B.H., 2004. Improving the
dynamic response of a mediator-less microbial fuel cell as a biochemical
oxygen demand (BOD) sensor. Biotechnol Lett ,26:1717–21.
Moon H, Chang I.S., Kim B.H., 2006. Continuous electricity production from
artificial wastewater using a mediator-less microbial fuel cell.
Bioresource Technol ;97:621–7.
Mölstad, S., Lundborg, C.S., Karlsson, A.K., Cars, O., 2002. Antibiotic
prescription rates vary markedly between 13 European countries. Scand.
J. Infect. Dis. 34,366–371.
Muller, M., Rabenoelina, F., Balaguer, P., Patureau, D., Lemenach, K.,
Budzinsky, H., Barcelo, D., De Alda, M.L., Kuster, M., Delgenes,
J.P., Hernandez-Raquet, G., 2008. Chemical and biological analysis of
endocrine-disrupting hormones and estrogenic activity in an advanced
sewage treatment plants. Environmental Toxicology and Chemistry 27,
1649–1658.
Myers, C., R. and Myers, J., M., 2002. MtrB Is Required for Proper Incorporation
of the Cytochromes OmcA and OmcB into the Outer Membrane of
Shewanella putrefaciens MR-1, Applied and Environmental
Microbiology, 68, 5585–5594
Nealson, K. H., Scott, J., ed. Dworkin, M., 2005. Ecophysiology of the genus
Shewanella, In The Prokaryotes,. New York: Springer-Verlag,.
Niessen J, Schroder U, Scholz F., 2004. Exploiting complex carbohydrates for
microbial electricity generation — a bacterial fuel cell operating on
starch. Electrochem Commun;6:955–8.
Oh, S.-E., Min, B., Logan, B.E. 2004. Cathode performance as a factor in electricity
generation in microbial fuel cells. Environ. Sci. Technol. 2004: 38 (18),
4900–4904.
Oh S.E, Logan B.E. 2005a. Hydrogen and electricity production from a food
processing wastewater using fermentation and microbial fuel cell
technologies. Water Res;39:4673–82.

118
Oh, S.-E., Logan, B.E., 2005b. Proton exchange membrane and electrode surface
areas as factors that affect power generation in microbial fuel cells. Appl.
Microbiol. Biotechnol. submitted for publication, doi:10.1007/500253-
005-0066-y.
Oh, S. and Logan, B.E. 2006. Proton exchange membrane and electrode surface
areas as factors that affect power generation in microbial fuel cells. Appl.
Microbiol. Biotechnol. 70(2), 162-169.
Pant D., Bogaert G.V., Diels L., Vanbroekhoven K., 2009. A rewiev of the
substrates used in microbial fuel cells( MFCs) for sustainable energy
production, Biosource technology, 101, 1533-1543
Park, S., Choi, K., 2008. Hazard assessment of commonly used agricultural
antibiotics on aquatic ecosystems. Ecotoxicology , 17(6), 526-538.
Park, D. H.; Zeikus, J. G., 1999. Utilization of electrically reduced neutral red by
Actinobacillus succinogenes: physiological function of neutral red in
membrane-driven fumarate reduction and energy conservation. J.
Bacteriol., 181, 2403-2410.
Park D.H., Zeikus J.G., 2006. Electricity generation in microbial fuel cells using
neutral red as an electronophore. Appl Environ Microb 2000;66:1292–7.
Park D.H., Zeikus J.G., 2002. Impact of electrode composition on electricity
generation in a single-compartment fuel cells using Shewanella
putrefaciens. Appl Microbiol Biotechnol;59: 58–61.
Park D.H., Zeikus J.G., 2003. Improved fuel cell and electrode designs for
producing electricity from microbial degradation. Biotechnol Bioeng,
81,348-355.
Patil, S.A., Surakasi, V.P., Koul, S., Ijmulwar, S., Vivek, A., Shouche, Y.S.,
Kapadnis, B.P., 2009. Electricity generation using chocolate industry
wastewater and its treatment in activated sludge based microbial fuel cell
and analysis of developed microbial community in the anode chamber.
Biores. Technol. 100, 5132–5139.
Pauwels, B., Wille, K., Noppe, H., De Brabander, H., de Wiele, T.V., Verstraete,
W., Boon, N., 2008. 17α-ethinylestradiol cometabolism by bacteria
degrading estrone, 17β-estradiol and estriol. Biodegradation 19, 683–
693.
Pham C.A., Jung S.J., Phung N.T., Lee J., Chang I.S., Kim B.H., 2003. A novel
electrochemically active and Fe(III)-reducing bacterium phylogenetically
related to Aeromonas hydrophila, isolated from a microbial fuel cell.
FEMS Microbiol Lett ;223:129–34.
Pham T.H., Jang J.K., Chang I.S., Kim B.H., 2004. Improvement of cathode
reaction of a mediatorless microbial fuel cell. J Microbiol Biotechnol
;14:324–9.
Pham, T.H., Rabaey, K., Aelterman, P., Clauwaert, P., Schamphelaire, L.D.,
Boon, N., Verstraete, W., 2006. Microbial fuel cells in relation to
conventional anaerobic digestion technology. Eng. Life Sci. 6 (3), 285–
292.

119
Pholchan, P., Jones, M., Donnelly, T., Sallis, P.J., 2008. Fate of estrogens during
the biological treatment of synthetic wastewater in a nitrite-accumulating
sequencing batch reactor. Environmental Science & Technology 42,
6141–6147.
Rabaey K, Lissens G, Siciliano S, Verstraete W., 2003. A microbial fuel cell
capable of converting glucose to electricity at high rate and efficiency.
Biotechnol Lett 2003;25:1531–5
Rabaey K., Boon N., Siciliano S.D., Verhaege M., Verstraete W. 2004. Biofuel
cells select for microbial consortia that self-mediate electron transfer.
Appl Environ Microb;70:5373–82
Rabaey K and Verstraete W, 2005. Microbial fuel cells: novel biotechnology for
energy generation, Trends in Biotechnology,; 23 No:6: 291-298
Rabaey K., Van De Sompel K., Maignien L., Boon N., Aelterman P., Clauwaert
P., 2006. Microbial fuel cells for sulfide removal. Environ Sci Technol
;40:5218–24.
Ren, H.Y., Ji, S.L., Ahmad, N.U.D., Dao, W., Cui, C.W., 2007. Degradation
characteristics and metabolic pathway of 17a-ethynylestradiol by
Sphingobacterium sp.JCR5. Chemosphere 66, 340–346.
Rittmann, B.E. and McCarty, P.L., 2001. Environmental Biotechnology:
Principles and Applications, McGraw-Hill, Boston.
Robinson, A.A., Belden, J.B., Lydy, M.J., 2005. Toxicity of fluoroquinolone
antibiotics to aquatic organisms. Environ. Toxicol. Chem. 24, 423–430.
Rodrigo, M.A., Cañizares, P., Lobato, J., Paz, R., Sáez, C., Linares, J.J., 2007.
Production of electricity from the treatment of urban waste water using a
microbial fuel cell. J. Power Sources 169, 198–204.
Rosembaum, M., Schroder U.,Scholz F., 2006. Investigation of the electrocatalytic
oxidation of formate and ethanol at platinum black under microbial fuel
cell conditions, J Solid State Electrochem, 10,872-878.
Rozendal R. A., Hamellers H.V.M., Buisman j.N., 2006. Effects of Membrane
Cation Transport on pH and Microbial Fuel Cell Performance,
Environmental Science and Technology, 40, 5206-5211.
Sarmah, A.K., Northcott, G.L., 2008. Laboratory degradation studies of four
endocrine disruptors in two environmental media. Environmental
Toxicology and Chemistry 27, 819–827.
Samuelsen, O.B., 1989. Degradation of oxytetracycline in seawater at two different
temperatures and light intensities, and the persistence of oxytetracycline
in the sediment from a fish farm. Aquaculture 83, 7–16.
Schroder U, Nieben J, Scholz F. 2003. A generation of microbial fuel cells with
current outputs boosted by more than on e order of magnitude. Angew
Chem Int Ed ;42:2880–3.
Scott, K., Murano, C., 2007. A study of a microbial fuel cell battery using manure
sludge waste. J. Chem. Technol. Biotechnol. 82, 809–817.

120
Shi, J., Fujisawa, S., Nakai, S., Hosomi, M., 2004. Biodegradation of natural and
synthetic estrogens by nitrifying activated sludge and ammonia-oxidizing
bacterium Nitrosomonas europaea. Water Research 38, 2323–2330.
Shantaram A., Beyenal H., Veluchamy R.R.A., Lewandowski Z., 2005. Wireless
sensors powered by microbial fuel cells. Envron Sci. Technol, 39,5037-
5042.
Soto, A.M., Justicia, H., Wray, J.W., Sonnenschein, C., 1991. P-nonylphenol: an
estrogenic xenobiotic released from modified polystyrene. Environmental
Health Perspectives 92, 167–173.
Stein N. E., Keesman K.J., Hamelers H. V.M, Straten G, 2010. Kinetic models
for detection of toxicity in a microbial fuel cell based biosensor ,
Biosensors and bioelectronics, 26-7, 3115-3120
Sukul, P., Lamshöft, M., Zühlke, S., Spiteller, M., 2008. Photolysis of (14)
Csulfadiazine manure. Chemosphere 71, 717–725.
Sun, M., Sheng, G.-P., Mu, Z.-X., Liu, X.-W., Chen, Y.-Z., Wang, H.-L., Yu, H.-
Q., 2009. Manipulating the hydrogen production from acetate in a
microbial electrolysis cell-microbial fuel cell-coupled system. J. Power
Sources 191, 338–343.
Tender LM, Reimers CE, Stecher HA, Holmes DE, Bond DR, Lowy DA, 2002.
Harnessing microbially generated power on the seafloor. Nat Biotechnol
;20:821–5.
Tender, L.M., Gray, S.M., Groveman, E., Lowy, D.A., Kauffman, P., Melhado,
J., Tyce, R.C., Flynn, D., Petrecca, R., Dobarro, J., 2008. The first
demonstration of a microbial fuel cell as a viable power supply: powering
a meteorological buoy. J. Power Sources 179, 571–575.
Ter Heijne, A., Hamelers, H. V. M., De Wilde, V., Rozendal, R. A. & Buisman,
C. J. N. 2006. A bipolar membrane combined with ferric iron reduction
as an efficient cathode system in microbial fuel cells. Environ. Sci.
Technol. 40-17, 5200–5205.
Termes T., Jos A, Siegrist,H., 2004. Scrutinizing pharmaceutical and personal care
products in wastewater treatment. Environ.Sci.Technol, 393-399.
Ternes, T.A., Kreckel, P., Mueller, J., 1999. Behaviour and occurrence of
estrogens in municipal sewage treatment plants - II. Aerobic batch
experiments with activated sludge. Science of the Total Environment 225,
91–99.
Tiedje, J., 2002. Shewanella—the environmentally versatile genome, Nat.
Biotechnol., Vol. 20, pp. 1118–23, 2002.
Thomulka, K.W., McGee, D.J., 1993. Detection of biohazardous materials in water
by measuring bioluminescence reduction with the marine organism
Vibrio harveyi. J. Environ. Sci. Heal. A 28, 2153–2166.
Turiel, E., Bordin, G., Rodríguez, A.R., 2005. Study of the evolution and
degradation products of ciprofloxacin and oxolinic acid in river water
samples by HPLC–UV/MS/MS–MS. J. Environ. Monitor. 7, 189–195.

121
Tyler, C.R., Routledge, E.J., 1998. Oestrogenic effects in fish in English rivers with
evidence of their causation. Pure and Applied Chemistry 70, 1795–1804.
Urase, T., KikutaT., 2005. Seperate estimation of adsorbsion and degredation of
pharmaceutical substances and estrogens in the activated sludge process.
Water Res., 39-7, 1289-1300.
Url1http://www.wiley.com/college/pratt/0471393878/student/activities/bacterial_
drug_resistance/antibiotic_targets_web.gif accessed at 26.01.2011
Url2http://www.inchem.org/documents/jecfa/jecmono/v43jec03.gif, accessed at
03.02.2011.
Vader, J.S., van Ginkel, C.G., Sperling, F.M.G.M., de Jong, J., de Boer, W., de
Graaf, J.S., van der Most, M., Stokman, P.G.W., 2000. Degradation of
ethinyl estradiol by nitrifying activated sludge. Chemosphere 41, 1239–
1243.
Vajda A.M., Barber L.B, Gray J.L, Lopez E.M, Woodling J.D, Norris D.O.,
2008. Reproductive Disruption in Fish Downstream from an Estrogenic
Wastewater Effluent, Environmental Science and Technology 42, 3407–
3414.
Vargas M., Kashefi K,. Blunt-Harris E.L., Lovley D.R., 1998. Microbiological
evidence for Fe(III) reduction on early earth. Nature ;395:65–70.
Venkata Mohan, S., Mohanakrishna, G., Reddy, B.P., Saravanan, R., Sarma,
P.N., 2008. Bioelectricity generation from chemical wastewater
treatment in mediatorless (anode) microbial fuel cell (MFC) using
selectively enriched hydrogen producing mixed culture under
acidophilic microenvironment, Biochem. Eng. J. 39, 121–130.
Venkata Mohan, S., Srikanth, S., Veer Raghuvulu, S., Mohanakrishna, G.,
Kumar, A.K., Sarma, P.N., 2009. Evaluation of the potential of various
aquatic eco-systems in harnessing bioelectricity through benthic fuel cell:
effect of electrode assembly and water characteristics. Biores. Technol.
100, 2240–2246.
Venkateswaran, K., Moser D., Dollhopf M., Lies D., Saffarini D., 1999.
Polyphasic taxonomy of the genus Shewanella and description of
Shewanella oneidensis sp. nov. Int. J. Syst. Bacteril., Vol. 49, pp. 705–
24.
Wang, X., Feng, Y., Ren, N., Wang, H., Lee, H., Li, N., Zhao, Q., 2009.
Accelerated start-up of two-chambered microbial fuel cells: effect of
positive poised potential. Electrochem. Acta 54, 1109–1114.
Weber, K. A., Achenbach, L. A., Coates, J. D., 2006. Microorganisms pumping
iron: anaerobic microbial iron oxidation and reduction”, Nat. Rev.
Microbiol., Vol. 4, pp. 752–64.
Weber, S., Leuschner, P., Kampfer, P., Dott, W., Hollender, J., 2005.
Degradation of estradiol and ethinyl estradiol by activated sludge and by
a defined mixed culture. Applied Microbiology and Biotechnology 67,
106–112.

122
Wiatrowski, H. A., Ward, P. M., Barkay, T., 2006. Novel reduction of mercury
(II) by mercury sensitive dissimilatory metal reducing bacteria, Environ.
Sci. Technol., Vol. 40, pp. 6690– 96.
Wilkinson S., 2000. Gastrobots –benefits and challenges of microbial fuel cells in
food powered robot applications, Journal of Autonomous Robots 9,99-
111.
Wise, R., 2002. Antimicrobial resistance: priorities for action. J.
Antimicrob.Chemoth. 49, 585–586.
Xing, D.F., Zuo, Y., Cheng, S., Regan, J.M., Logan, B.E., 2008. Electricity
generation by Rhodopseudomonas palustris DX-1. Environ. Sci. Technol.
42, 4146–4151.
Xu, W.H., Zhang, G., Zou, S.C., Li, X.D., Liu, Y.C., 2007. Determination of
selected antibiotics in the Victoria Harbour and the Pearl River, South
China using highperformance liquid chromatography-electrospray
ionization tandem mass spectrometry. Environ. Pollut. 145, 672–679.
Xu, K., Harper Jr., W.F., Zhao, D., 2008. 17α-Ethinylestradiol sorption to
activated sludge biomass: thermodynamic properties and reaction
mechanism. Water Research 42, 3146–3152.
Yamashita, N., Yasojima, M., Nakada, N., Miyajima, K., Komori, K., Suzuki,
Y., Tanaka, H., 2006. Effects of antibacterial agents, levofloxacin and
clarithromycin, on aquatic organisms. Water Sci. Technol. 53, 65–72.
Ye, Z., Weinberg, H.S., Meyer, M.T., 2007. Trace analysis of trimethoprim and
sulfonamide, macrolide, quinolone, and tetracycline antibiotics in
chlorinated drinking water using liquid chromatography electrospray
tandem mass spectrometry. Anal. Chem. 79, 1135–1144
Ying, G.G., Kookana, R.S., Dillon, P., 2003. Sorption and degradation of selected
five endocrine disrupting chemicals in aquifer material. Water Research
37, 3785–3791.
Ying, G.G., Kookana, R.S., Kumar, A., 2008a. Fate of estrogens and
xenoestrogens in four sewage treatment plants with different
technologies. Environmental Toxicology and Chemistry 27, 87–94.
Ying, G.G., Toze, S., Hanna, J., Yu, X.Y., Dillon, P.J., Kookana, R.S., 2008b.
Decay of endocrine-disrupting chemicals in aerobic and anoxic
groundwater. Water Research 42, 1133–1141.
Yoshimoto, T.,Nagai, F., Fujimoto, J.,Watanabe, K., Mizukoshi, H., Makino,
T.,Kimura, K., Saino, H., Sawada, H., Omura, H., 2004. Degradation
of estrogens by Rhodococcus zopfii and Rhodococcus equi isolates from
activated sludge in wastewater treatment plants. Applied and
Environmental Microbiology 70, 5283–5289.
You S., Zhao Q., Zhang J., Jiang J., Zhao S., 2006. A microbial fuel cell using
permanganate as the cathodic electron acceptor. J Power Sources
162:1409–1415
Zuo, Y., Maness, P.-C., Logan, B.E., 2006. Electricity production from steam-
exploded corn stover biomass. Energy Fuels 20 (4), 1716–1721.

119
CURRICULUM VITAE
Candidate’s full name: Sevil AKTAN
Place and date of birth: Merzifon, 1969
Permanent Address: Fatih Üniversitesi, Çevre Mühendisliği Bölümü,
34500, Hadımköy, Istanbul-Türkiye
Universities and
Colleges attended:
2004-2011 : PhD. Institute of Science and Technology, Environmental
Biotechnology Program, Istanbul Technical University, Istanbul,
Turkey.
2001-2004 : M.Sc. Institute of Sciences and Engineering, Department of
Environmental Engineering, Fatih University, Istanbul, Turkey.
1988-1991 : B.Sc. Department of Environmental Engineering, Istanbul Technical
University, Istanbul, Turkey.
Professional Experience:
2007- :Lecturer, Fatih University, Department of Environmental
Engineering, Hadımköy, Istanbul, Turkey.
2001-2007 : Research Assistant, Fatih University, Department of Environmental
Engineering, Hadımköy, Istanbul, Turkey.
2000-2001 : Specialist, Fatih University, Department of Environmental
Engineering, Hadımköy, Istanbul, Turkey.
1994-1999 : Environmental Engineer, OYAK Construction Incorporated
Company, Ayazaga, Istanbul, Turkey.
PUBLICATIONS
Aktan S., Salih B., (2005), Fluorescent in situ hybridization (FISH) for the detection
of bacterial community in activated sludge from textile factories, Environmental
Technology, 27, 63-69

120
Aktan S., Çokgör E.U., Çalli B., Çavdar P., Gücin F.,(2011) Effects of antibiotics on
electricity generation in microbial fuel cells, The 8th
International IWA Symposium
on Waste Management Problems in Agro Industries, Ilıca, Çeşme, İzmir, Turkey,
Vol 1, 407-414.
Çavdar P., Yilmaz E., Aktan S., Çalli B., (2010), Bio-electricity production from
wastewater using membrane-less air cathode microbial fuel cell, 5th
International Ege
Symposium and Exhibition (IEESE-5), Pamukkale, Denizli, Turkey.
Aktan S, Ceylan C.U., Yazıcıoğlu M.B.I., Bozkurt A., Arslan N, Gücin F., Çokgör
E.U. (2008), Electricity generation by a mediator-less microbial fuel cell using
Shewanella putrefaciens, 4th International Conference on The Ecological Protection
of The Planet Earth-Environment, Maritime, Trabzon, Turkey.
Aktan S., Salih B. (2004), Tekstil Endüstrisi Aktif Çamurundaki Microorganizmaların
FISH Metoduyla Belirlenmesi, 9. Endüstriyel Kirlenme Kontrolü Sempozyumu EKK İTÜ
İnşaat Fakültesi Çevre Müh. Böl., 1,265-273
Aktan S., Şeker S, Başak B., İleri R. (2001), Tekstil Atıksularındaki Renk
Sorununun İleri Aktif Çamur (İLAÇ) Metodu ile Giderilebilirliği, Ulusal Çevre ve
Sanayi Sempozyumu ve Sergisi, Ulusal Çevre ve Sanayi Sempozyum ve Sergisi
Mersin Bildiri Kitabı, 1 , 77-85, Mersin-Türkiye.
PROJECTS
Aktan S., Bir mikrobiyal yakıt hücresinde hidrojen bakterileri Shewenella
putrefaciens tarafından organik atıklardan elektrik üretimi, DPT Project, Researcher,
2007-2010.


![Mudit [Recovered]](https://img.pdfslide.us/doc/110x75/55cf8557550346484b8cf2fd/mudit-recovered.jpg)
![Holes [recovered]](https://img.pdfslide.us/doc/110x75/55c04b2cbb61eb2d558b4839/holes-recovered.jpg)
![Respimicro [recovered]](https://img.pdfslide.us/doc/110x75/554b0df7b4c90562098b478a/respimicro-recovered.jpg)

![BIONICS.ppt [Recovered]](https://img.pdfslide.us/doc/110x75/5515c3cf4a7959f1028b52ce/bionicsppt-recovered.jpg)
![Yatra.ppt Recovered]](https://img.pdfslide.us/doc/110x75/5467820ab4af9f3a3f8b580c/yatrappt-recovered.jpg)


![poster [Recovered]](https://img.pdfslide.us/doc/110x75/58ec8ad11a28ab9e228b46d1/poster-recovered.jpg)
![Iridium.Ppt [Recovered]](https://img.pdfslide.us/doc/110x75/55d738b3bb61eb22708b45ad/iridiumppt-recovered.jpg)
![pptD [Recovered]](https://img.pdfslide.us/doc/110x75/549e5515ac7959504c8b4576/pptd-recovered.jpg)

![Govt Acctg Recovered] Recovered]](https://img.pdfslide.us/doc/110x75/577d26c61a28ab4e1ea2266a/govt-acctg-recovered-recovered.jpg)
![Poster_IIC [Recovered] [Recovered]](https://img.pdfslide.us/doc/110x75/568bf4721a28ab89339e0ba6/posteriic-recovered-recovered.jpg)
![Anglesinlife [Recovered]](https://img.pdfslide.us/doc/110x75/5592a5e61a28ab57798b46dd/anglesinlife-recovered.jpg)
![Volume.ppt [recovered]](https://img.pdfslide.us/doc/110x75/55631c69d8b42a81528b5342/volumeppt-recovered.jpg)


![Elmopresentation1 [recovered]](https://img.pdfslide.us/doc/110x75/556a8bcfd8b42ac9298b4952/elmopresentation1-recovered.jpg)