Embed Size (px)
Citation preview
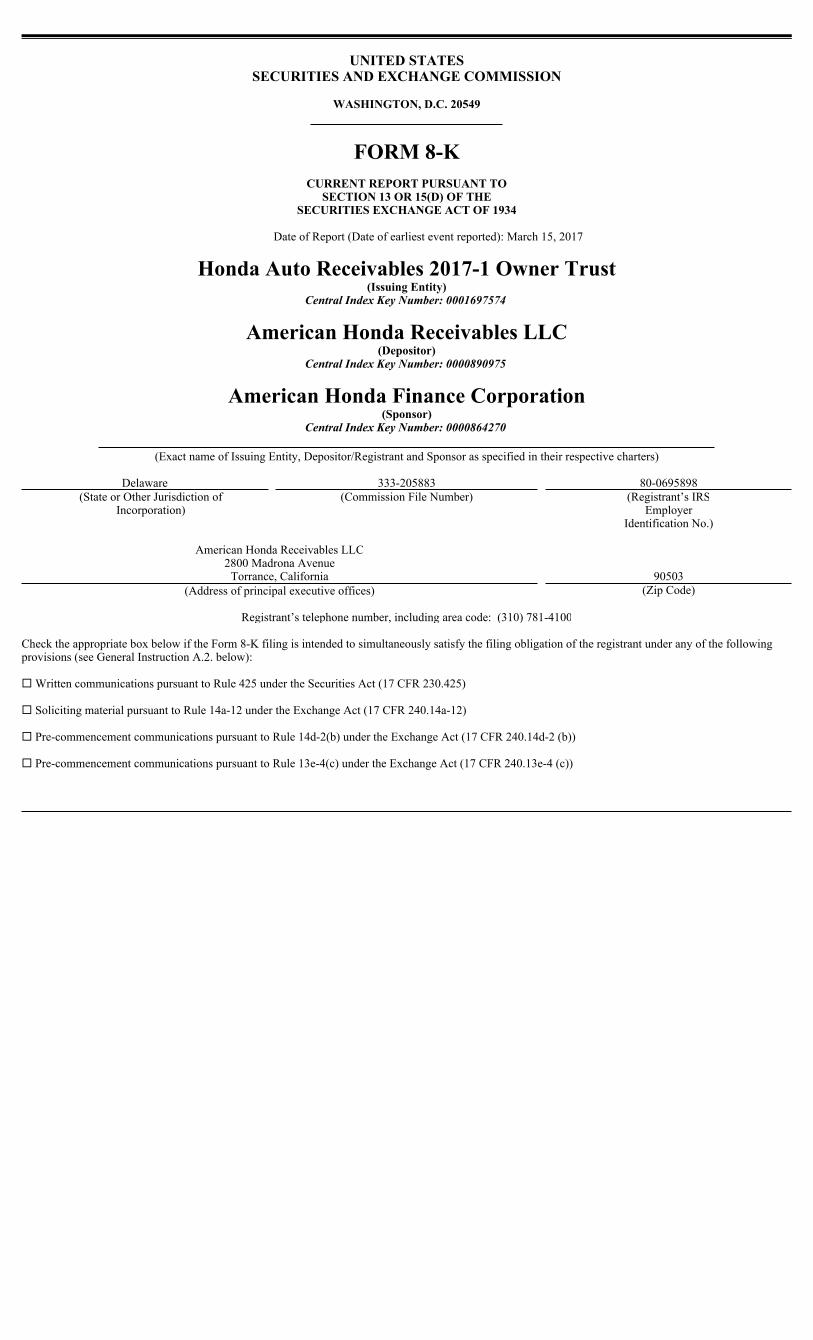
UNITED STATESSECURITIES AND EXCHANGE COMMISSION
WASHINGTON, D.C. 20549
FORM 8-KCURRENT REPORT PURSUANT TO
SECTION 13 OR 15(D) OF THESECURITIES EXCHANGE ACT OF 1934
Date of Report (Date of earliest event reported): March 15, 2017
Honda Auto Receivables 2017-1 Owner Trust(Issuing Entity)
Central Index Key Number: 0001697574
American Honda Receivables LLC(Depositor)
Central Index Key Number: 0000890975
American Honda Finance Corporation(Sponsor)
Central Index Key Number: 0000864270
(Exact name of Issuing Entity, Depositor/Registrant and Sponsor as specified in their respective charters)
Check the appropriate box below if the Form 8-K filing is intended to simultaneously satisfy the filing obligation of the registrant under any of the following provisions (see General Instruction A.2. below):
Written communications pursuant to Rule 425 under the Securities Act (17 CFR 230.425)
Soliciting material pursuant to Rule 14a-12 under the Exchange Act (17 CFR 240.14a-12)
Pre-commencement communications pursuant to Rule 14d-2(b) under the Exchange Act (17 CFR 240.14d-2 (b))
Pre-commencement communications pursuant to Rule 13e-4(c) under the Exchange Act (17 CFR 240.13e-4 (c))
Delaware 333-205883 80-0695898(State or Other Jurisdiction of
Incorporation)(Commission File Number) (Registrant’s IRS
EmployerIdentification No.)
American Honda Receivables LLC2800 Madrona Avenue
Torrance, California 90503(Address of principal executive offices) (Zip Code)
Registrant’s telephone number, including area code: (310) 781-4100
ITEM 6.01. ABS Informational and Computational Material.
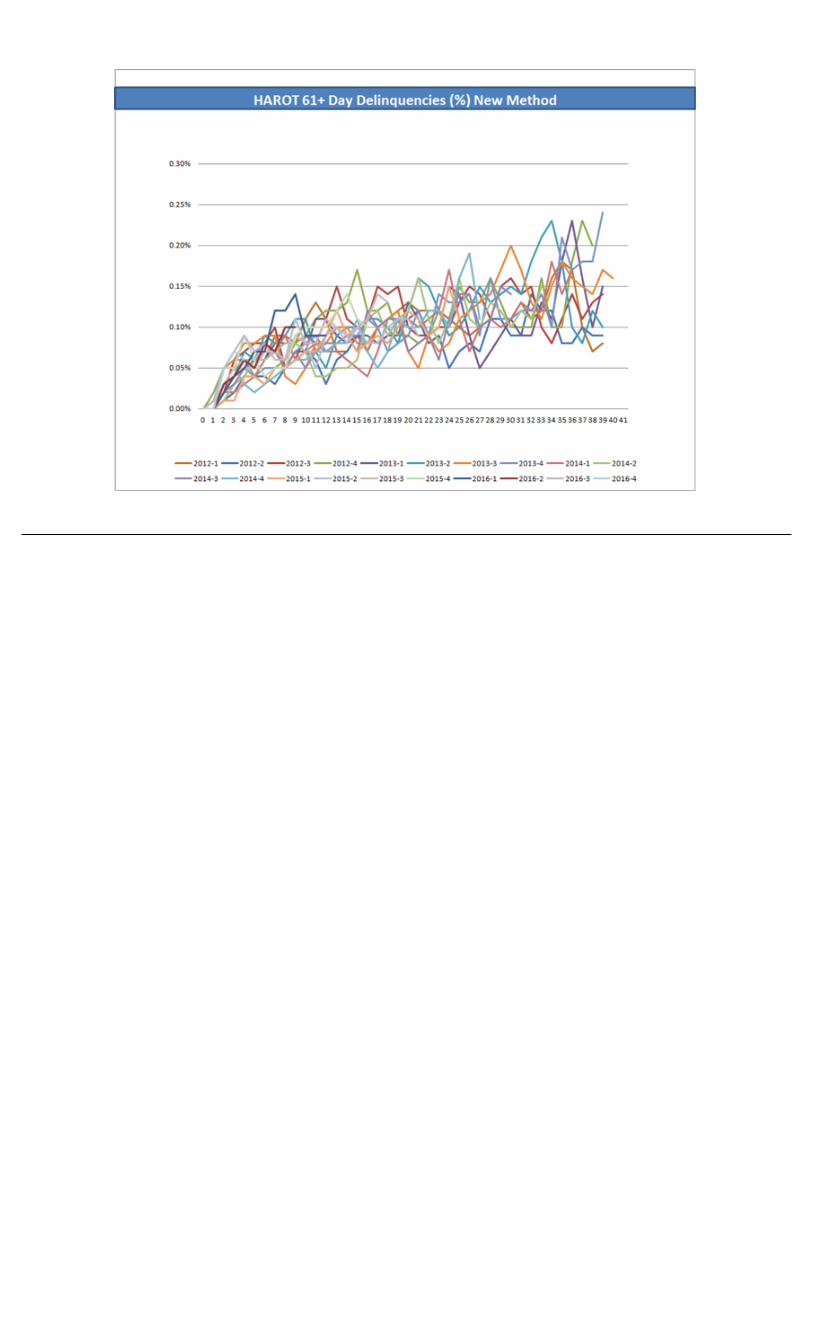
Information concerning the static pool data of previous similar loan securitizations of American Honda Finance Corporation, as sponsor, for the issuance period commencing January 1, 2011 and ending December 31, 2016 is attached hereto as Exhibit 99.1 pursuant to Item 1105 of Regulation AB. We caution you that the pool of receivables in your trust may not perform in a similar manner to the receivables in other trusts.
The information in Exhibit 99.1 consists of summary information about the original characteristics of the prior securitized pools, cumulative net losses, prepayments and delinquency data for the prior securitized pools and graphical presentation of the data. The characteristics of receivables included in Exhibit 99.1, as well as the social, economic and other conditions existing at the time when those receivables were originated and repaid, may vary materially from the characteristics of the receivables in other trusts and the social, economic and other conditions existing at the time when the receivables in a particular transaction are originated and those that will exist in the future when the receivables in a particular transaction are required to be repaid. As a result, there can be no assurance that the static pool data will correspond to or be an accurate predictor of the performance of any particular receivables securitization transaction.
American Honda Finance Corporation (“AHFC”) will continue to report delinquencies and cumulative net losses for its prior asset-backed securitizations to align with AHFC’s reporting for its entire portfolio of new and used Honda and Acura retail installment sale contracts (the “New Reporting Method”). Under the New Reporting Method, AHFC will report a receivable to be current (not delinquent) upon receipt of at least 90% of the sum of the current payment plus any overdue monthly payments. In static pool reports filed before the calendar year 2016, AHFC reported a receivable as delinquent if 100% of the current payment plus any overdue monthly payment was not made when due. Additionally, in pre-2016 static pool reports, AHFC reported a receivable as delinquent for the remaining life of a receivable if a contract extension was granted on that receivable. Under the New Reporting Method, AHFC will not report contract extensions as delinquent if payments are made pursuant to the terms of the contract extension. The New Reporting Method results in fewer receivables being reported as delinquent and fewer net losses being reported as compared to pre-2016 static pool reports. The New Reporting Method is consistent with how AHFC recognizes delinquencies and losses with respect to its entire managed portfolio.
For purposes of the following static pool information, calculations for the New Reporting Method are included, along with calculations under the prior system guidelines for comparison. Securitization transactions beginning with Honda Auto Receivables 2016-1 Owner Trust will only be reported under the New Reporting Method.
ITEM 9.01 Financial Statements and Exhibits
99.1 Static Pool Information

SIGNATURES
Pursuant to the requirements of the Securities Exchange Act of 1934, the Registrant has duly caused this report to be signed on behalf of the undersigned thereunto duly authorized.
Dated: March 15, 2017
AMERICAN HONDA RECEIVABLES LLC
By: /s/ Paul C. HondaName: Paul C. Honda Title: Treasurer
EXHIBIT INDEX
Exhibit No. Description
99.1 Static Pool Information

Exhibit 99.1Static Pool Information
Footnotes:
(1) Weighted averages are weighted by initial pool balance as of the cutoff date
(2) Percentage of initial pool balance
(3) Based on the address of the originating dealers
(4) Delinquency percentage is based off ending principal balances of the delinquent accounts at the end of the month
(5) Prepayments are measured in terms of Absolute Prepayment Speed (ABS)
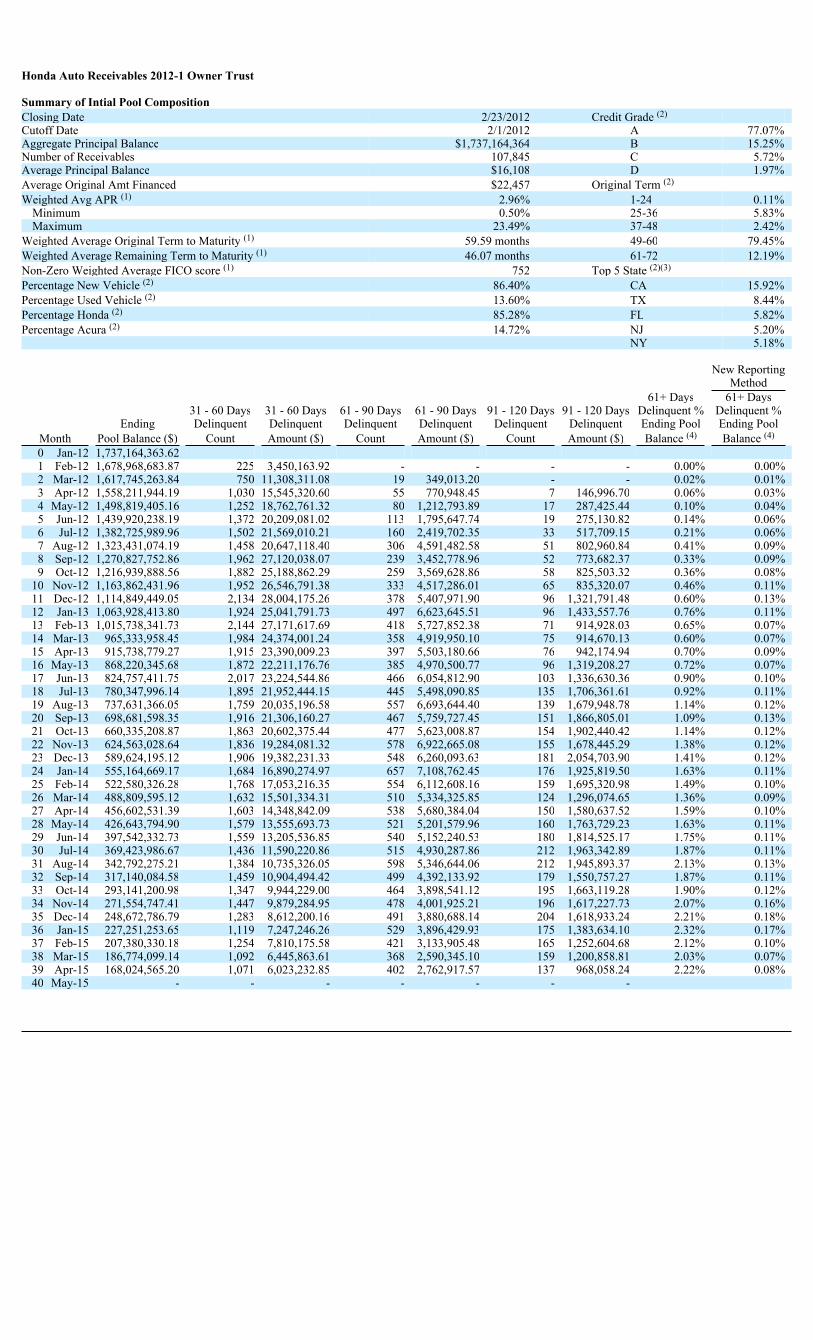
Honda Auto Receivables 2012-1 Owner Trust
Summary of Intial Pool CompositionClosing Date 2/23/2012 Credit Grade (2)
Cutoff Date 2/1/2012 A 77.07%Aggregate Principal Balance $1,737,164,364 B 15.25%Number of Receivables 107,845 C 5.72%Average Principal Balance $16,108 D 1.97%Average Original Amt Financed $22,457 Original Term (2)
Weighted Avg APR (1) 2.96% 1-24 0.11%Minimum 0.50% 25-36 5.83%Maximum 23.49% 37-48 2.42%
Weighted Average Original Term to Maturity (1) 59.59 months 49-60 79.45%Weighted Average Remaining Term to Maturity (1) 46.07 months 61-72 12.19%Non-Zero Weighted Average FICO score (1) 752 Top 5 State (2)(3)
Percentage New Vehicle (2) 86.40% CA 15.92%Percentage Used Vehicle (2) 13.60% TX 8.44%Percentage Honda (2) 85.28% FL 5.82%Percentage Acura (2) 14.72% NJ 5.20%
NY 5.18%
New ReportingMethod
61+ Days 61+ Days31 - 60 Days 31 - 60 Days 61 - 90 Days 61 - 90 Days 91 - 120 Days 91 - 120 Days Delinquent % Delinquent %
Ending Delinquent Delinquent Delinquent Delinquent Delinquent Delinquent Ending Pool Ending PoolMonth Pool Balance ($) Count Amount ($) Count Amount ($) Count Amount ($) Balance (4) Balance (4)
0 Jan-12 1,737,164,363.621 Feb-12 1,678,968,683.87 225 3,450,163.92 - - - - 0.00% 0.00%2 Mar-12 1,617,745,263.84 750 11,308,311.08 19 349,013.20 - - 0.02% 0.01%3 Apr-12 1,558,211,944.19 1,030 15,545,320.60 55 770,948.45 7 146,996.70 0.06% 0.03%4 May-12 1,498,819,405.16 1,252 18,762,761.32 80 1,212,793.89 17 287,425.44 0.10% 0.04%5 Jun-12 1,439,920,238.19 1,372 20,209,081.02 113 1,795,647.74 19 275,130.82 0.14% 0.06%6 Jul-12 1,382,725,989.96 1,502 21,569,010.21 160 2,419,702.35 33 517,709.15 0.21% 0.06%7 Aug-12 1,323,431,074.19 1,458 20,647,118.40 306 4,591,482.58 51 802,960.84 0.41% 0.09%8 Sep-12 1,270,827,752.86 1,962 27,120,038.07 239 3,452,778.96 52 773,682.37 0.33% 0.09%9 Oct-12 1,216,939,888.56 1,882 25,188,862.29 259 3,569,628.86 58 825,503.32 0.36% 0.08%
10 Nov-12 1,163,862,431.96 1,952 26,546,791.38 333 4,517,286.01 65 835,320.07 0.46% 0.11%11 Dec-12 1,114,849,449.05 2,134 28,004,175.26 378 5,407,971.90 96 1,321,791.48 0.60% 0.13%12 Jan-13 1,063,928,413.80 1,924 25,041,791.73 497 6,623,645.51 96 1,433,557.76 0.76% 0.11%13 Feb-13 1,015,738,341.73 2,144 27,171,617.69 418 5,727,852.38 71 914,928.03 0.65% 0.07%14 Mar-13 965,333,958.45 1,984 24,374,001.24 358 4,919,950.10 75 914,670.13 0.60% 0.07%15 Apr-13 915,738,779.27 1,915 23,390,009.23 397 5,503,180.66 76 942,174.94 0.70% 0.09%16 May-13 868,220,345.68 1,872 22,211,176.76 385 4,970,500.77 96 1,319,208.27 0.72% 0.07%17 Jun-13 824,757,411.75 2,017 23,224,544.86 466 6,054,812.90 103 1,336,630.36 0.90% 0.10%18 Jul-13 780,347,996.14 1,895 21,952,444.15 445 5,498,090.85 135 1,706,361.61 0.92% 0.11%19 Aug-13 737,631,366.05 1,759 20,035,196.58 557 6,693,644.40 139 1,679,948.78 1.14% 0.12%20 Sep-13 698,681,598.35 1,916 21,306,160.27 467 5,759,727.45 151 1,866,805.01 1.09% 0.13%21 Oct-13 660,335,208.87 1,863 20,602,375.44 477 5,623,008.87 154 1,902,440.42 1.14% 0.12%22 Nov-13 624,563,028.64 1,836 19,284,081.32 578 6,922,665.08 155 1,678,445.29 1.38% 0.12%23 Dec-13 589,624,195.12 1,906 19,382,231.33 548 6,260,093.63 181 2,054,703.90 1.41% 0.12%24 Jan-14 555,164,669.17 1,684 16,890,274.97 657 7,108,762.45 176 1,925,819.50 1.63% 0.11%25 Feb-14 522,580,326.28 1,768 17,053,216.35 554 6,112,608.16 159 1,695,320.98 1.49% 0.10%26 Mar-14 488,809,595.12 1,632 15,501,334.31 510 5,334,325.85 124 1,296,074.65 1.36% 0.09%27 Apr-14 456,602,531.39 1,603 14,348,842.09 538 5,680,384.04 150 1,580,637.52 1.59% 0.10%28 May-14 426,643,794.90 1,579 13,555,693.73 521 5,201,579.96 160 1,763,729.23 1.63% 0.11%29 Jun-14 397,542,332.73 1,559 13,205,536.85 540 5,152,240.53 180 1,814,525.17 1.75% 0.11%30 Jul-14 369,423,986.67 1,436 11,590,220.86 515 4,930,287.86 212 1,963,342.89 1.87% 0.11%31 Aug-14 342,792,275.21 1,384 10,735,326.05 598 5,346,644.06 212 1,945,893.37 2.13% 0.13%32 Sep-14 317,140,084.58 1,459 10,904,494.42 499 4,392,133.92 179 1,550,757.27 1.87% 0.11%33 Oct-14 293,141,200.98 1,347 9,944,229.00 464 3,898,541.12 195 1,663,119.28 1.90% 0.12%34 Nov-14 271,554,747.41 1,447 9,879,284.95 478 4,001,925.21 196 1,617,227.73 2.07% 0.16%35 Dec-14 248,672,786.79 1,283 8,612,200.16 491 3,880,688.14 204 1,618,933.24 2.21% 0.18%36 Jan-15 227,251,253.65 1,119 7,247,246.26 529 3,896,429.93 175 1,383,634.10 2.32% 0.17%37 Feb-15 207,380,330.18 1,254 7,810,175.58 421 3,133,905.48 165 1,252,604.68 2.12% 0.10%38 Mar-15 186,774,099.14 1,092 6,445,863.61 368 2,590,345.10 159 1,200,858.81 2.03% 0.07%39 Apr-15 168,024,565.20 1,071 6,023,232.85 402 2,762,917.57 137 968,058.24 2.22% 0.08%40 May-15 - - - - - - -
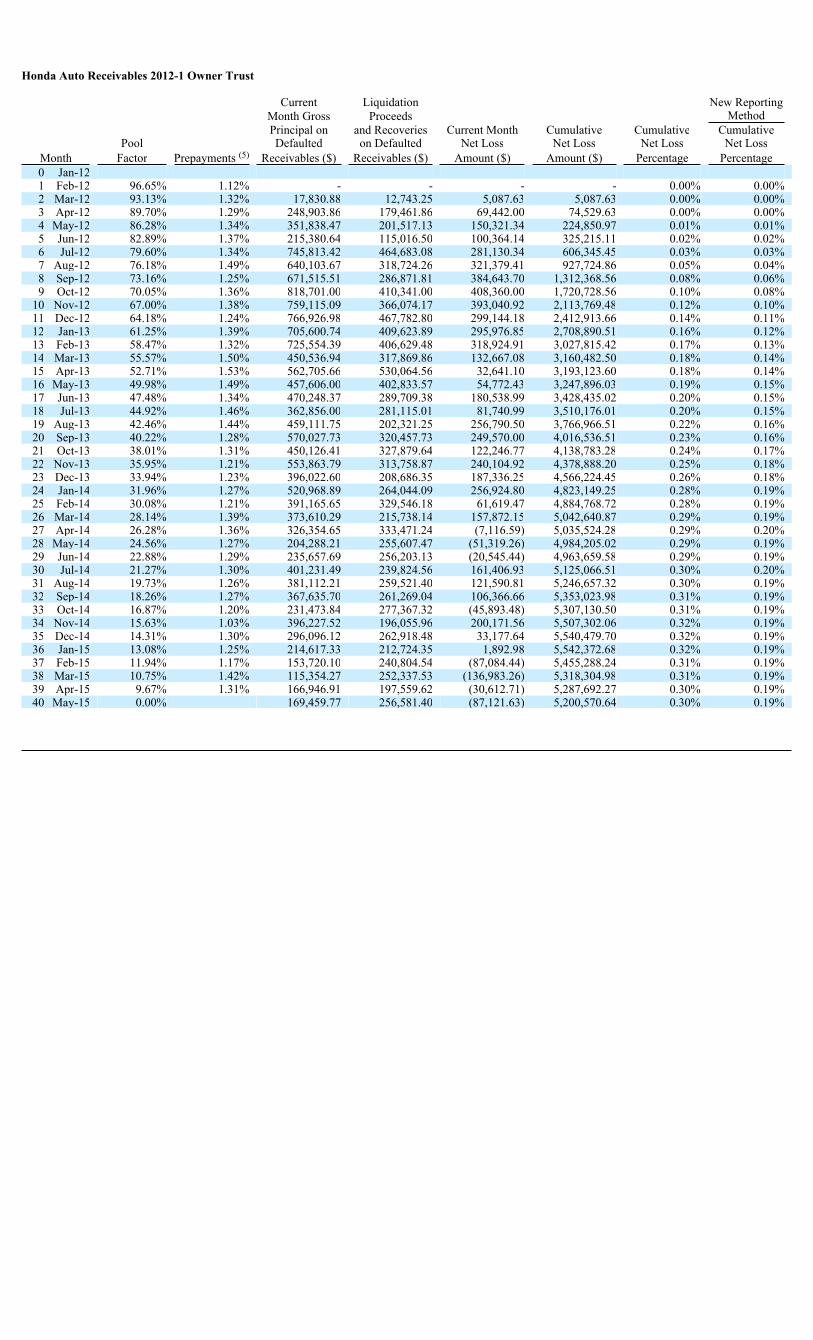
Honda Auto Receivables 2012-1 Owner Trust
Current Liquidation New ReportingMonth Gross Proceeds MethodPrincipal on and Recoveries Current Month Cumulative Cumulative Cumulative
Pool Defaulted on Defaulted Net Loss Net Loss Net Loss Net LossMonth Factor Prepayments (5) Receivables ($) Receivables ($) Amount ($) Amount ($) Percentage Percentage0 Jan-121 Feb-12 96.65% 1.12% - - - - 0.00% 0.00%2 Mar-12 93.13% 1.32% 17,830.88 12,743.25 5,087.63 5,087.63 0.00% 0.00%3 Apr-12 89.70% 1.29% 248,903.86 179,461.86 69,442.00 74,529.63 0.00% 0.00%4 May-12 86.28% 1.34% 351,838.47 201,517.13 150,321.34 224,850.97 0.01% 0.01%5 Jun-12 82.89% 1.37% 215,380.64 115,016.50 100,364.14 325,215.11 0.02% 0.02%6 Jul-12 79.60% 1.34% 745,813.42 464,683.08 281,130.34 606,345.45 0.03% 0.03%7 Aug-12 76.18% 1.49% 640,103.67 318,724.26 321,379.41 927,724.86 0.05% 0.04%8 Sep-12 73.16% 1.25% 671,515.51 286,871.81 384,643.70 1,312,368.56 0.08% 0.06%9 Oct-12 70.05% 1.36% 818,701.00 410,341.00 408,360.00 1,720,728.56 0.10% 0.08%
10 Nov-12 67.00% 1.38% 759,115.09 366,074.17 393,040.92 2,113,769.48 0.12% 0.10%11 Dec-12 64.18% 1.24% 766,926.98 467,782.80 299,144.18 2,412,913.66 0.14% 0.11%12 Jan-13 61.25% 1.39% 705,600.74 409,623.89 295,976.85 2,708,890.51 0.16% 0.12%13 Feb-13 58.47% 1.32% 725,554.39 406,629.48 318,924.91 3,027,815.42 0.17% 0.13%14 Mar-13 55.57% 1.50% 450,536.94 317,869.86 132,667.08 3,160,482.50 0.18% 0.14%15 Apr-13 52.71% 1.53% 562,705.66 530,064.56 32,641.10 3,193,123.60 0.18% 0.14%16 May-13 49.98% 1.49% 457,606.00 402,833.57 54,772.43 3,247,896.03 0.19% 0.15%17 Jun-13 47.48% 1.34% 470,248.37 289,709.38 180,538.99 3,428,435.02 0.20% 0.15%18 Jul-13 44.92% 1.46% 362,856.00 281,115.01 81,740.99 3,510,176.01 0.20% 0.15%19 Aug-13 42.46% 1.44% 459,111.75 202,321.25 256,790.50 3,766,966.51 0.22% 0.16%20 Sep-13 40.22% 1.28% 570,027.73 320,457.73 249,570.00 4,016,536.51 0.23% 0.16%21 Oct-13 38.01% 1.31% 450,126.41 327,879.64 122,246.77 4,138,783.28 0.24% 0.17%22 Nov-13 35.95% 1.21% 553,863.79 313,758.87 240,104.92 4,378,888.20 0.25% 0.18%23 Dec-13 33.94% 1.23% 396,022.60 208,686.35 187,336.25 4,566,224.45 0.26% 0.18%24 Jan-14 31.96% 1.27% 520,968.89 264,044.09 256,924.80 4,823,149.25 0.28% 0.19%25 Feb-14 30.08% 1.21% 391,165.65 329,546.18 61,619.47 4,884,768.72 0.28% 0.19%26 Mar-14 28.14% 1.39% 373,610.29 215,738.14 157,872.15 5,042,640.87 0.29% 0.19%27 Apr-14 26.28% 1.36% 326,354.65 333,471.24 (7,116.59) 5,035,524.28 0.29% 0.20%28 May-14 24.56% 1.27% 204,288.21 255,607.47 (51,319.26) 4,984,205.02 0.29% 0.19%29 Jun-14 22.88% 1.29% 235,657.69 256,203.13 (20,545.44) 4,963,659.58 0.29% 0.19%30 Jul-14 21.27% 1.30% 401,231.49 239,824.56 161,406.93 5,125,066.51 0.30% 0.20%31 Aug-14 19.73% 1.26% 381,112.21 259,521.40 121,590.81 5,246,657.32 0.30% 0.19%32 Sep-14 18.26% 1.27% 367,635.70 261,269.04 106,366.66 5,353,023.98 0.31% 0.19%33 Oct-14 16.87% 1.20% 231,473.84 277,367.32 (45,893.48) 5,307,130.50 0.31% 0.19%34 Nov-14 15.63% 1.03% 396,227.52 196,055.96 200,171.56 5,507,302.06 0.32% 0.19%35 Dec-14 14.31% 1.30% 296,096.12 262,918.48 33,177.64 5,540,479.70 0.32% 0.19%36 Jan-15 13.08% 1.25% 214,617.33 212,724.35 1,892.98 5,542,372.68 0.32% 0.19%37 Feb-15 11.94% 1.17% 153,720.10 240,804.54 (87,084.44) 5,455,288.24 0.31% 0.19%38 Mar-15 10.75% 1.42% 115,354.27 252,337.53 (136,983.26) 5,318,304.98 0.31% 0.19%39 Apr-15 9.67% 1.31% 166,946.91 197,559.62 (30,612.71) 5,287,692.27 0.30% 0.19%40 May-15 0.00% 169,459.77 256,581.40 (87,121.63) 5,200,570.64 0.30% 0.19%
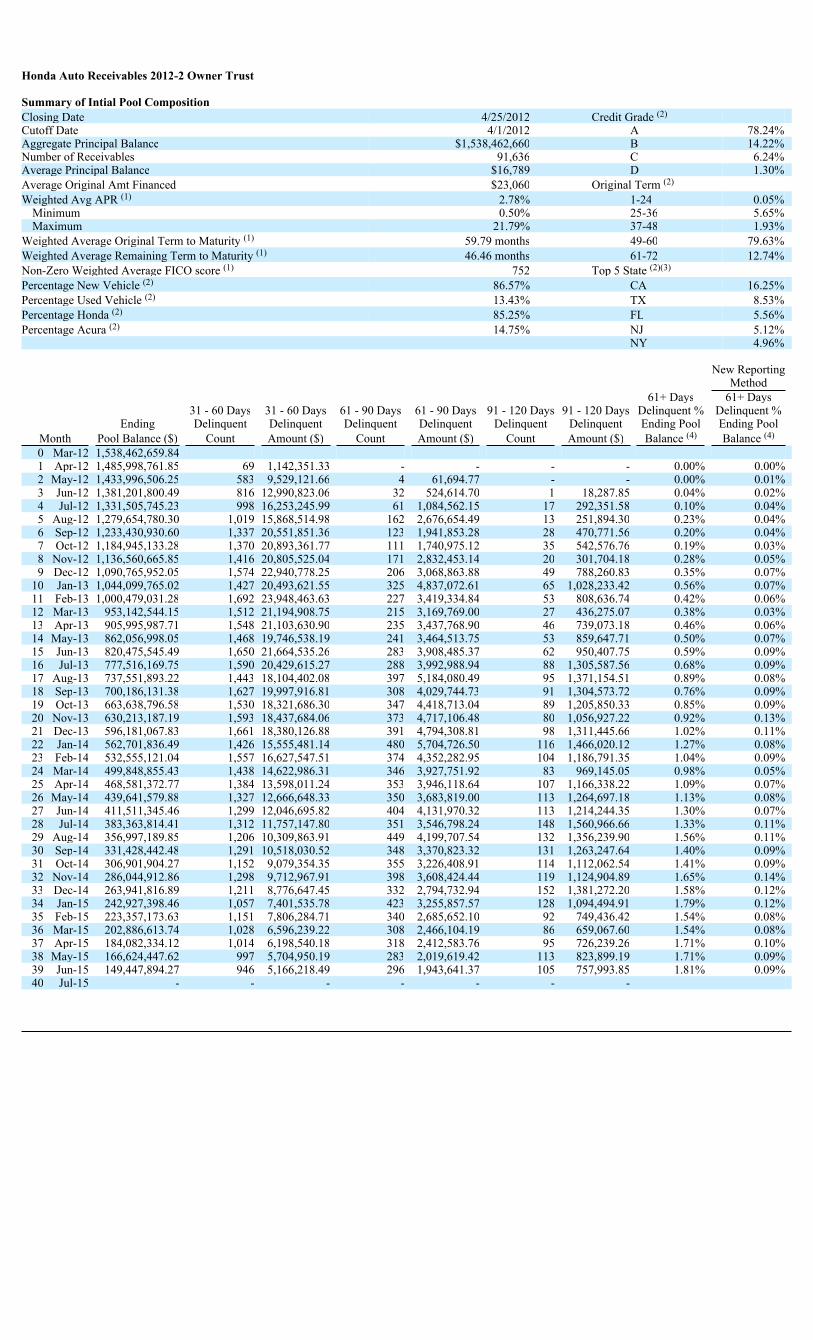
Honda Auto Receivables 2012-2 Owner Trust
Summary of Intial Pool CompositionClosing Date 4/25/2012 Credit Grade (2)
Cutoff Date 4/1/2012 A 78.24%Aggregate Principal Balance $1,538,462,660 B 14.22%Number of Receivables 91,636 C 6.24%Average Principal Balance $16,789 D 1.30%Average Original Amt Financed $23,060 Original Term (2)
Weighted Avg APR (1) 2.78% 1-24 0.05%Minimum 0.50% 25-36 5.65%Maximum 21.79% 37-48 1.93%
Weighted Average Original Term to Maturity (1) 59.79 months 49-60 79.63%Weighted Average Remaining Term to Maturity (1) 46.46 months 61-72 12.74%Non-Zero Weighted Average FICO score (1) 752 Top 5 State (2)(3)
Percentage New Vehicle (2) 86.57% CA 16.25%Percentage Used Vehicle (2) 13.43% TX 8.53%Percentage Honda (2) 85.25% FL 5.56%Percentage Acura (2) 14.75% NJ 5.12%
NY 4.96%
New ReportingMethod
61+ Days 61+ Days31 - 60 Days 31 - 60 Days 61 - 90 Days 61 - 90 Days 91 - 120 Days 91 - 120 Days Delinquent % Delinquent %
Ending Delinquent Delinquent Delinquent Delinquent Delinquent Delinquent Ending Pool Ending PoolMonth Pool Balance ($) Count Amount ($) Count Amount ($) Count Amount ($) Balance (4) Balance (4)
0 Mar-12 1,538,462,659.841 Apr-12 1,485,998,761.85 69 1,142,351.33 - - - - 0.00% 0.00%2 May-12 1,433,996,506.25 583 9,529,121.66 4 61,694.77 - - 0.00% 0.01%3 Jun-12 1,381,201,800.49 816 12,990,823.06 32 524,614.70 1 18,287.85 0.04% 0.02%4 Jul-12 1,331,505,745.23 998 16,253,245.99 61 1,084,562.15 17 292,351.58 0.10% 0.04%5 Aug-12 1,279,654,780.30 1,019 15,868,514.98 162 2,676,654.49 13 251,894.30 0.23% 0.04%6 Sep-12 1,233,430,930.60 1,337 20,551,851.36 123 1,941,853.28 28 470,771.56 0.20% 0.04%7 Oct-12 1,184,945,133.28 1,370 20,893,361.77 111 1,740,975.12 35 542,576.76 0.19% 0.03%8 Nov-12 1,136,560,665.85 1,416 20,805,525.04 171 2,832,453.14 20 301,704.18 0.28% 0.05%9 Dec-12 1,090,765,952.05 1,574 22,940,778.25 206 3,068,863.88 49 788,260.83 0.35% 0.07%
10 Jan-13 1,044,099,765.02 1,427 20,493,621.55 325 4,837,072.61 65 1,028,233.42 0.56% 0.07%11 Feb-13 1,000,479,031.28 1,692 23,948,463.63 227 3,419,334.84 53 808,636.74 0.42% 0.06%12 Mar-13 953,142,544.15 1,512 21,194,908.75 215 3,169,769.00 27 436,275.07 0.38% 0.03%13 Apr-13 905,995,987.71 1,548 21,103,630.90 235 3,437,768.90 46 739,073.18 0.46% 0.06%14 May-13 862,056,998.05 1,468 19,746,538.19 241 3,464,513.75 53 859,647.71 0.50% 0.07%15 Jun-13 820,475,545.49 1,650 21,664,535.26 283 3,908,485.37 62 950,407.75 0.59% 0.09%16 Jul-13 777,516,169.75 1,590 20,429,615.27 288 3,992,988.94 88 1,305,587.56 0.68% 0.09%17 Aug-13 737,551,893.22 1,443 18,104,402.08 397 5,184,080.49 95 1,371,154.51 0.89% 0.08%18 Sep-13 700,186,131.38 1,627 19,997,916.81 308 4,029,744.73 91 1,304,573.72 0.76% 0.09%19 Oct-13 663,638,796.58 1,530 18,321,686.30 347 4,418,713.04 89 1,205,850.33 0.85% 0.09%20 Nov-13 630,213,187.19 1,593 18,437,684.06 373 4,717,106.48 80 1,056,927.22 0.92% 0.13%21 Dec-13 596,181,067.83 1,661 18,380,126.88 391 4,794,308.81 98 1,311,445.66 1.02% 0.11%22 Jan-14 562,701,836.49 1,426 15,555,481.14 480 5,704,726.50 116 1,466,020.12 1.27% 0.08%23 Feb-14 532,555,121.04 1,557 16,627,547.51 374 4,352,282.95 104 1,186,791.35 1.04% 0.09%24 Mar-14 499,848,855.43 1,438 14,622,986.31 346 3,927,751.92 83 969,145.05 0.98% 0.05%25 Apr-14 468,581,372.77 1,384 13,598,011.24 353 3,946,118.64 107 1,166,338.22 1.09% 0.07%26 May-14 439,641,579.88 1,327 12,666,648.33 350 3,683,819.00 113 1,264,697.18 1.13% 0.08%27 Jun-14 411,511,345.46 1,299 12,046,695.82 404 4,131,970.32 113 1,214,244.35 1.30% 0.07%28 Jul-14 383,363,814.41 1,312 11,757,147.80 351 3,546,798.24 148 1,560,966.66 1.33% 0.11%29 Aug-14 356,997,189.85 1,206 10,309,863.91 449 4,199,707.54 132 1,356,239.90 1.56% 0.11%30 Sep-14 331,428,442.48 1,291 10,518,030.52 348 3,370,823.32 131 1,263,247.64 1.40% 0.09%31 Oct-14 306,901,904.27 1,152 9,079,354.35 355 3,226,408.91 114 1,112,062.54 1.41% 0.09%32 Nov-14 286,044,912.86 1,298 9,712,967.91 398 3,608,424.44 119 1,124,904.89 1.65% 0.14%33 Dec-14 263,941,816.89 1,211 8,776,647.45 332 2,794,732.94 152 1,381,272.20 1.58% 0.12%34 Jan-15 242,927,398.46 1,057 7,401,535.78 423 3,255,857.57 128 1,094,494.91 1.79% 0.12%35 Feb-15 223,357,173.63 1,151 7,806,284.71 340 2,685,652.10 92 749,436.42 1.54% 0.08%36 Mar-15 202,886,613.74 1,028 6,596,239.22 308 2,466,104.19 86 659,067.60 1.54% 0.08%37 Apr-15 184,082,334.12 1,014 6,198,540.18 318 2,412,583.76 95 726,239.26 1.71% 0.10%38 May-15 166,624,447.62 997 5,704,950.19 283 2,019,619.42 113 823,899.19 1.71% 0.09%39 Jun-15 149,447,894.27 946 5,166,218.49 296 1,943,641.37 105 757,993.85 1.81% 0.09%40 Jul-15 - - - - - - -
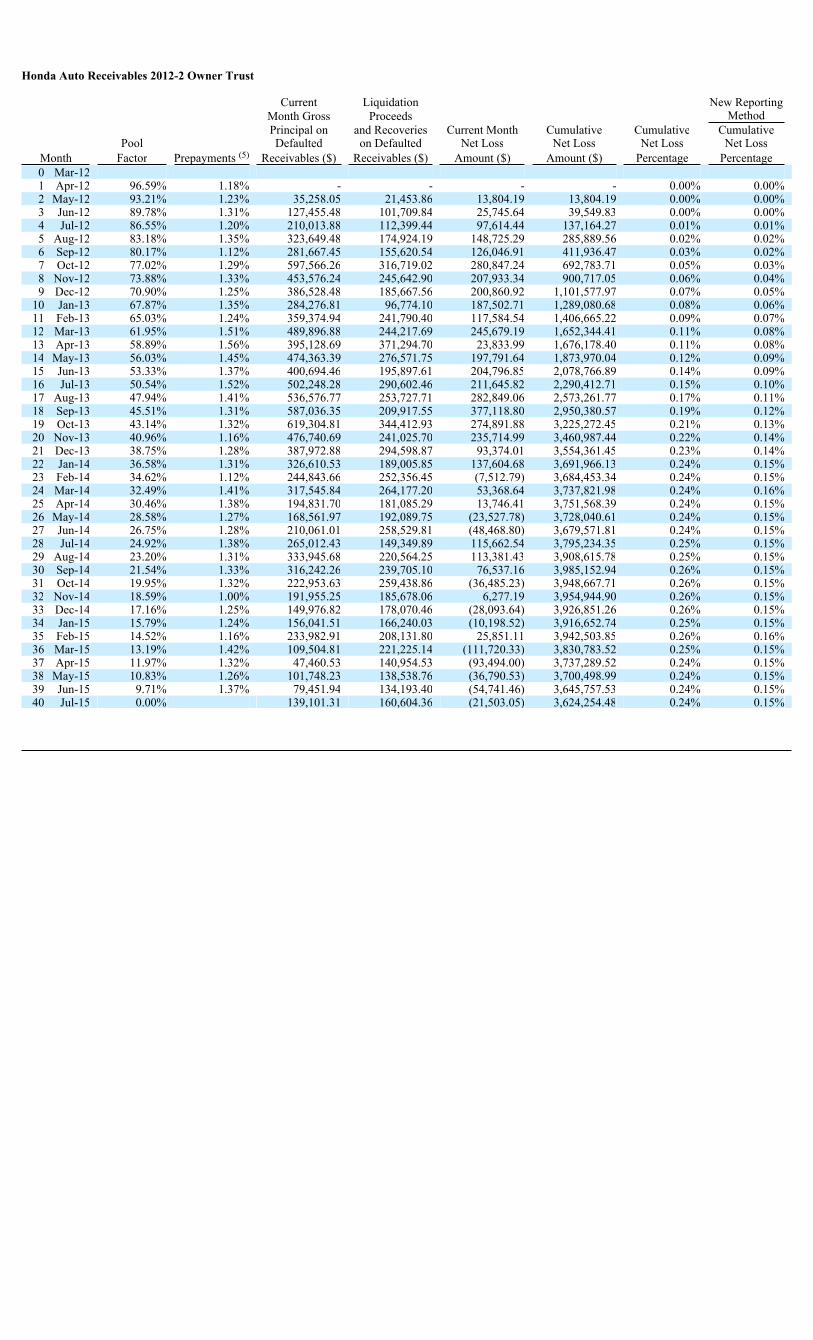
Honda Auto Receivables 2012-2 Owner Trust
Current Liquidation New ReportingMonth Gross Proceeds MethodPrincipal on and Recoveries Current Month Cumulative Cumulative Cumulative
Pool Defaulted on Defaulted Net Loss Net Loss Net Loss Net LossMonth Factor Prepayments (5) Receivables ($) Receivables ($) Amount ($) Amount ($) Percentage Percentage0 Mar-121 Apr-12 96.59% 1.18% - - - - 0.00% 0.00%2 May-12 93.21% 1.23% 35,258.05 21,453.86 13,804.19 13,804.19 0.00% 0.00%3 Jun-12 89.78% 1.31% 127,455.48 101,709.84 25,745.64 39,549.83 0.00% 0.00%4 Jul-12 86.55% 1.20% 210,013.88 112,399.44 97,614.44 137,164.27 0.01% 0.01%5 Aug-12 83.18% 1.35% 323,649.48 174,924.19 148,725.29 285,889.56 0.02% 0.02%6 Sep-12 80.17% 1.12% 281,667.45 155,620.54 126,046.91 411,936.47 0.03% 0.02%7 Oct-12 77.02% 1.29% 597,566.26 316,719.02 280,847.24 692,783.71 0.05% 0.03%8 Nov-12 73.88% 1.33% 453,576.24 245,642.90 207,933.34 900,717.05 0.06% 0.04%9 Dec-12 70.90% 1.25% 386,528.48 185,667.56 200,860.92 1,101,577.97 0.07% 0.05%
10 Jan-13 67.87% 1.35% 284,276.81 96,774.10 187,502.71 1,289,080.68 0.08% 0.06%11 Feb-13 65.03% 1.24% 359,374.94 241,790.40 117,584.54 1,406,665.22 0.09% 0.07%12 Mar-13 61.95% 1.51% 489,896.88 244,217.69 245,679.19 1,652,344.41 0.11% 0.08%13 Apr-13 58.89% 1.56% 395,128.69 371,294.70 23,833.99 1,676,178.40 0.11% 0.08%14 May-13 56.03% 1.45% 474,363.39 276,571.75 197,791.64 1,873,970.04 0.12% 0.09%15 Jun-13 53.33% 1.37% 400,694.46 195,897.61 204,796.85 2,078,766.89 0.14% 0.09%16 Jul-13 50.54% 1.52% 502,248.28 290,602.46 211,645.82 2,290,412.71 0.15% 0.10%17 Aug-13 47.94% 1.41% 536,576.77 253,727.71 282,849.06 2,573,261.77 0.17% 0.11%18 Sep-13 45.51% 1.31% 587,036.35 209,917.55 377,118.80 2,950,380.57 0.19% 0.12%19 Oct-13 43.14% 1.32% 619,304.81 344,412.93 274,891.88 3,225,272.45 0.21% 0.13%20 Nov-13 40.96% 1.16% 476,740.69 241,025.70 235,714.99 3,460,987.44 0.22% 0.14%21 Dec-13 38.75% 1.28% 387,972.88 294,598.87 93,374.01 3,554,361.45 0.23% 0.14%22 Jan-14 36.58% 1.31% 326,610.53 189,005.85 137,604.68 3,691,966.13 0.24% 0.15%23 Feb-14 34.62% 1.12% 244,843.66 252,356.45 (7,512.79) 3,684,453.34 0.24% 0.15%24 Mar-14 32.49% 1.41% 317,545.84 264,177.20 53,368.64 3,737,821.98 0.24% 0.16%25 Apr-14 30.46% 1.38% 194,831.70 181,085.29 13,746.41 3,751,568.39 0.24% 0.15%26 May-14 28.58% 1.27% 168,561.97 192,089.75 (23,527.78) 3,728,040.61 0.24% 0.15%27 Jun-14 26.75% 1.28% 210,061.01 258,529.81 (48,468.80) 3,679,571.81 0.24% 0.15%28 Jul-14 24.92% 1.38% 265,012.43 149,349.89 115,662.54 3,795,234.35 0.25% 0.15%29 Aug-14 23.20% 1.31% 333,945.68 220,564.25 113,381.43 3,908,615.78 0.25% 0.15%30 Sep-14 21.54% 1.33% 316,242.26 239,705.10 76,537.16 3,985,152.94 0.26% 0.15%31 Oct-14 19.95% 1.32% 222,953.63 259,438.86 (36,485.23) 3,948,667.71 0.26% 0.15%32 Nov-14 18.59% 1.00% 191,955.25 185,678.06 6,277.19 3,954,944.90 0.26% 0.15%33 Dec-14 17.16% 1.25% 149,976.82 178,070.46 (28,093.64) 3,926,851.26 0.26% 0.15%34 Jan-15 15.79% 1.24% 156,041.51 166,240.03 (10,198.52) 3,916,652.74 0.25% 0.15%35 Feb-15 14.52% 1.16% 233,982.91 208,131.80 25,851.11 3,942,503.85 0.26% 0.16%36 Mar-15 13.19% 1.42% 109,504.81 221,225.14 (111,720.33) 3,830,783.52 0.25% 0.15%37 Apr-15 11.97% 1.32% 47,460.53 140,954.53 (93,494.00) 3,737,289.52 0.24% 0.15%38 May-15 10.83% 1.26% 101,748.23 138,538.76 (36,790.53) 3,700,498.99 0.24% 0.15%39 Jun-15 9.71% 1.37% 79,451.94 134,193.40 (54,741.46) 3,645,757.53 0.24% 0.15%40 Jul-15 0.00% 139,101.31 160,604.36 (21,503.05) 3,624,254.48 0.24% 0.15%
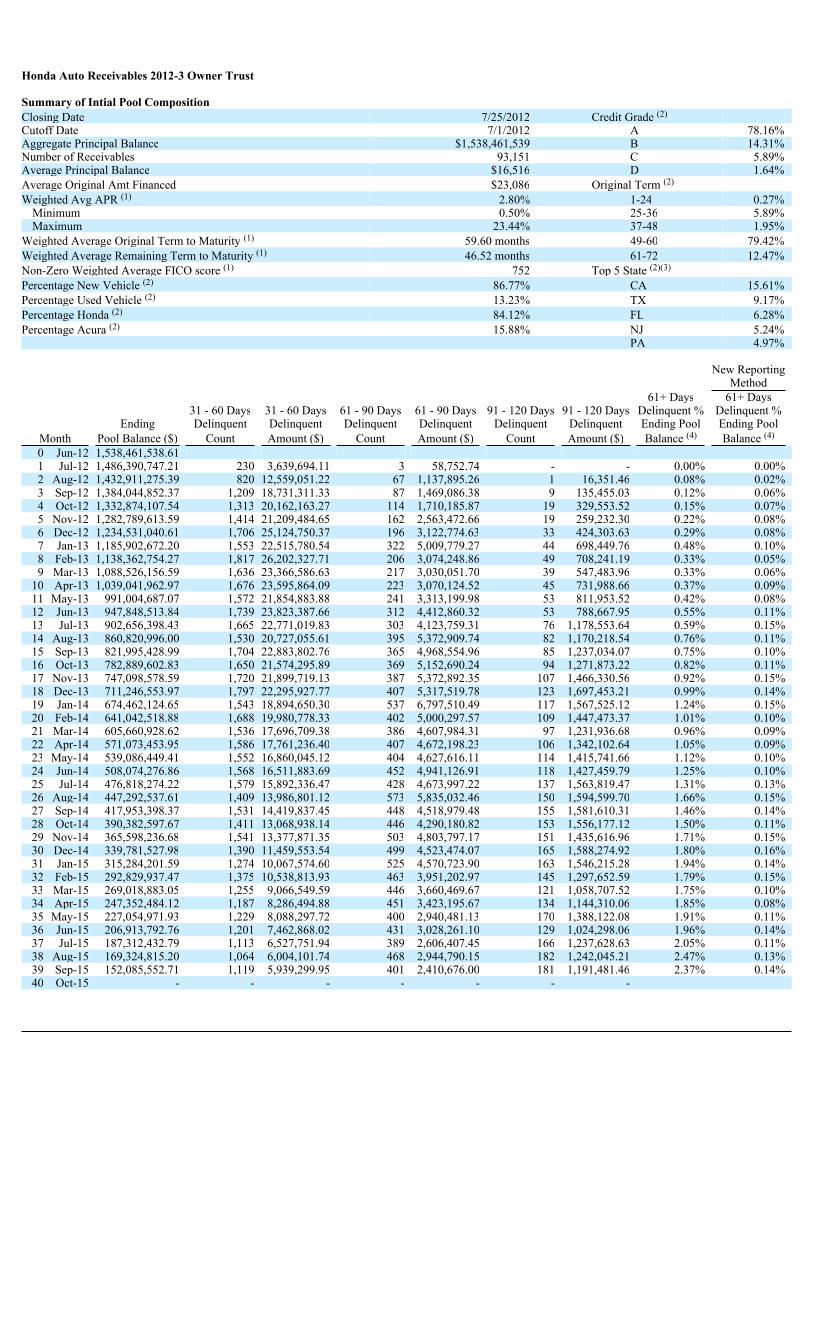
Honda Auto Receivables 2012-3 Owner Trust
Summary of Intial Pool CompositionClosing Date 7/25/2012 Credit Grade (2)
Cutoff Date 7/1/2012 A 78.16%Aggregate Principal Balance $1,538,461,539 B 14.31%Number of Receivables 93,151 C 5.89%Average Principal Balance $16,516 D 1.64%Average Original Amt Financed $23,086 Original Term (2)
Weighted Avg APR (1) 2.80% 1-24 0.27%Minimum 0.50% 25-36 5.89%Maximum 23.44% 37-48 1.95%
Weighted Average Original Term to Maturity (1) 59.60 months 49-60 79.42%Weighted Average Remaining Term to Maturity (1) 46.52 months 61-72 12.47%Non-Zero Weighted Average FICO score (1) 752 Top 5 State (2)(3)
Percentage New Vehicle (2) 86.77% CA 15.61%Percentage Used Vehicle (2) 13.23% TX 9.17%Percentage Honda (2) 84.12% FL 6.28%Percentage Acura (2) 15.88% NJ 5.24%
PA 4.97%
New ReportingMethod
61+ Days 61+ Days31 - 60 Days 31 - 60 Days 61 - 90 Days 61 - 90 Days 91 - 120 Days 91 - 120 Days Delinquent % Delinquent %
Ending Delinquent Delinquent Delinquent Delinquent Delinquent Delinquent Ending Pool Ending PoolMonth Pool Balance ($) Count Amount ($) Count Amount ($) Count Amount ($) Balance (4) Balance (4)
0 Jun-12 1,538,461,538.611 Jul-12 1,486,390,747.21 230 3,639,694.11 3 58,752.74 - - 0.00% 0.00%2 Aug-12 1,432,911,275.39 820 12,559,051.22 67 1,137,895.26 1 16,351.46 0.08% 0.02%3 Sep-12 1,384,044,852.37 1,209 18,731,311.33 87 1,469,086.38 9 135,455.03 0.12% 0.06%4 Oct-12 1,332,874,107.54 1,313 20,162,163.27 114 1,710,185.87 19 329,553.52 0.15% 0.07%5 Nov-12 1,282,789,613.59 1,414 21,209,484.65 162 2,563,472.66 19 259,232.30 0.22% 0.08%6 Dec-12 1,234,531,040.61 1,706 25,124,750.37 196 3,122,774.63 33 424,303.63 0.29% 0.08%7 Jan-13 1,185,902,672.20 1,553 22,515,780.54 322 5,009,779.27 44 698,449.76 0.48% 0.10%8 Feb-13 1,138,362,754.27 1,817 26,202,327.71 206 3,074,248.86 49 708,241.19 0.33% 0.05%9 Mar-13 1,088,526,156.59 1,636 23,366,586.63 217 3,030,051.70 39 547,483.96 0.33% 0.06%
10 Apr-13 1,039,041,962.97 1,676 23,595,864.09 223 3,070,124.52 45 731,988.66 0.37% 0.09%11 May-13 991,004,687.07 1,572 21,854,883.88 241 3,313,199.98 53 811,953.52 0.42% 0.08%12 Jun-13 947,848,513.84 1,739 23,823,387.66 312 4,412,860.32 53 788,667.95 0.55% 0.11%13 Jul-13 902,656,398.43 1,665 22,771,019.83 303 4,123,759.31 76 1,178,553.64 0.59% 0.15%14 Aug-13 860,820,996.00 1,530 20,727,055.61 395 5,372,909.74 82 1,170,218.54 0.76% 0.11%15 Sep-13 821,995,428.99 1,704 22,883,802.76 365 4,968,554.96 85 1,237,034.07 0.75% 0.10%16 Oct-13 782,889,602.83 1,650 21,574,295.89 369 5,152,690.24 94 1,271,873.22 0.82% 0.11%17 Nov-13 747,098,578.59 1,720 21,899,719.13 387 5,372,892.35 107 1,466,330.56 0.92% 0.15%18 Dec-13 711,246,553.97 1,797 22,295,927.77 407 5,317,519.78 123 1,697,453.21 0.99% 0.14%19 Jan-14 674,462,124.65 1,543 18,894,650.30 537 6,797,510.49 117 1,567,525.12 1.24% 0.15%20 Feb-14 641,042,518.88 1,688 19,980,778.33 402 5,000,297.57 109 1,447,473.37 1.01% 0.10%21 Mar-14 605,660,928.62 1,536 17,696,709.38 386 4,607,984.31 97 1,231,936.68 0.96% 0.09%22 Apr-14 571,073,453.95 1,586 17,761,236.40 407 4,672,198.23 106 1,342,102.64 1.05% 0.09%23 May-14 539,086,449.41 1,552 16,860,045.12 404 4,627,616.11 114 1,415,741.66 1.12% 0.10%24 Jun-14 508,074,276.86 1,568 16,511,883.69 452 4,941,126.91 118 1,427,459.79 1.25% 0.10%25 Jul-14 476,818,274.22 1,579 15,892,336.47 428 4,673,997.22 137 1,563,819.47 1.31% 0.13%26 Aug-14 447,292,537.61 1,409 13,986,801.12 573 5,835,032.46 150 1,594,599.70 1.66% 0.15%27 Sep-14 417,953,398.37 1,531 14,419,837.45 448 4,518,979.48 155 1,581,610.31 1.46% 0.14%28 Oct-14 390,382,597.67 1,411 13,068,938.14 446 4,290,180.82 153 1,556,177.12 1.50% 0.11%29 Nov-14 365,598,236.68 1,541 13,377,871.35 503 4,803,797.17 151 1,435,616.96 1.71% 0.15%30 Dec-14 339,781,527.98 1,390 11,459,553.54 499 4,523,474.07 165 1,588,274.92 1.80% 0.16%31 Jan-15 315,284,201.59 1,274 10,067,574.60 525 4,570,723.90 163 1,546,215.28 1.94% 0.14%32 Feb-15 292,829,937.47 1,375 10,538,813.93 463 3,951,202.97 145 1,297,652.59 1.79% 0.15%33 Mar-15 269,018,883.05 1,255 9,066,549.59 446 3,660,469.67 121 1,058,707.52 1.75% 0.10%34 Apr-15 247,352,484.12 1,187 8,286,494.88 451 3,423,195.67 134 1,144,310.06 1.85% 0.08%35 May-15 227,054,971.93 1,229 8,088,297.72 400 2,940,481.13 170 1,388,122.08 1.91% 0.11%36 Jun-15 206,913,792.76 1,201 7,462,868.02 431 3,028,261.10 129 1,024,298.06 1.96% 0.14%37 Jul-15 187,312,432.79 1,113 6,527,751.94 389 2,606,407.45 166 1,237,628.63 2.05% 0.11%38 Aug-15 169,324,815.20 1,064 6,004,101.74 468 2,944,790.15 182 1,242,045.21 2.47% 0.13%39 Sep-15 152,085,552.71 1,119 5,939,299.95 401 2,410,676.00 181 1,191,481.46 2.37% 0.14%40 Oct-15 - - - - - - -
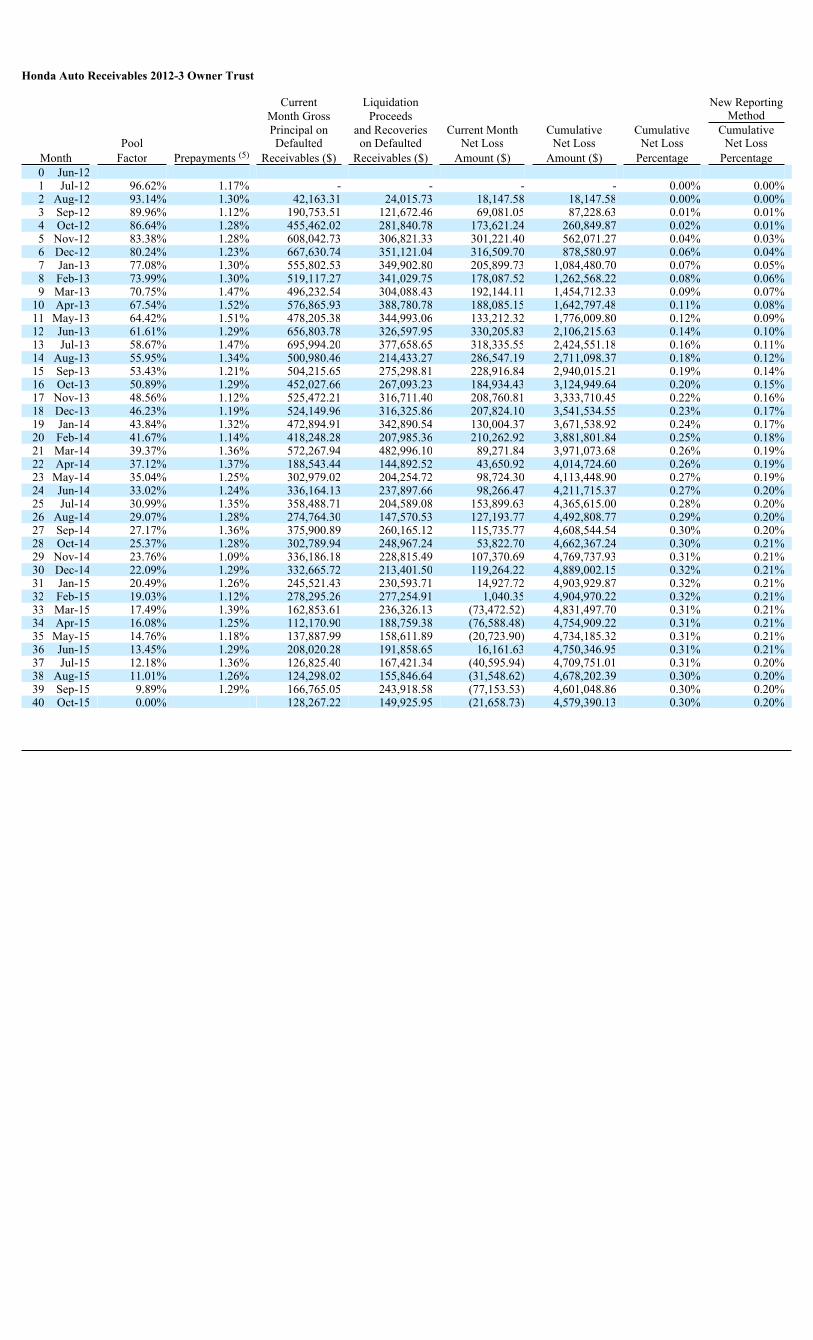
Honda Auto Receivables 2012-3 Owner Trust
Current Liquidation New ReportingMonth Gross Proceeds MethodPrincipal on and Recoveries Current Month Cumulative Cumulative Cumulative
Pool Defaulted on Defaulted Net Loss Net Loss Net Loss Net LossMonth Factor Prepayments (5) Receivables ($) Receivables ($) Amount ($) Amount ($) Percentage Percentage0 Jun-121 Jul-12 96.62% 1.17% - - - - 0.00% 0.00%2 Aug-12 93.14% 1.30% 42,163.31 24,015.73 18,147.58 18,147.58 0.00% 0.00%3 Sep-12 89.96% 1.12% 190,753.51 121,672.46 69,081.05 87,228.63 0.01% 0.01%4 Oct-12 86.64% 1.28% 455,462.02 281,840.78 173,621.24 260,849.87 0.02% 0.01%5 Nov-12 83.38% 1.28% 608,042.73 306,821.33 301,221.40 562,071.27 0.04% 0.03%6 Dec-12 80.24% 1.23% 667,630.74 351,121.04 316,509.70 878,580.97 0.06% 0.04%7 Jan-13 77.08% 1.30% 555,802.53 349,902.80 205,899.73 1,084,480.70 0.07% 0.05%8 Feb-13 73.99% 1.30% 519,117.27 341,029.75 178,087.52 1,262,568.22 0.08% 0.06%9 Mar-13 70.75% 1.47% 496,232.54 304,088.43 192,144.11 1,454,712.33 0.09% 0.07%
10 Apr-13 67.54% 1.52% 576,865.93 388,780.78 188,085.15 1,642,797.48 0.11% 0.08%11 May-13 64.42% 1.51% 478,205.38 344,993.06 133,212.32 1,776,009.80 0.12% 0.09%12 Jun-13 61.61% 1.29% 656,803.78 326,597.95 330,205.83 2,106,215.63 0.14% 0.10%13 Jul-13 58.67% 1.47% 695,994.20 377,658.65 318,335.55 2,424,551.18 0.16% 0.11%14 Aug-13 55.95% 1.34% 500,980.46 214,433.27 286,547.19 2,711,098.37 0.18% 0.12%15 Sep-13 53.43% 1.21% 504,215.65 275,298.81 228,916.84 2,940,015.21 0.19% 0.14%16 Oct-13 50.89% 1.29% 452,027.66 267,093.23 184,934.43 3,124,949.64 0.20% 0.15%17 Nov-13 48.56% 1.12% 525,472.21 316,711.40 208,760.81 3,333,710.45 0.22% 0.16%18 Dec-13 46.23% 1.19% 524,149.96 316,325.86 207,824.10 3,541,534.55 0.23% 0.17%19 Jan-14 43.84% 1.32% 472,894.91 342,890.54 130,004.37 3,671,538.92 0.24% 0.17%20 Feb-14 41.67% 1.14% 418,248.28 207,985.36 210,262.92 3,881,801.84 0.25% 0.18%21 Mar-14 39.37% 1.36% 572,267.94 482,996.10 89,271.84 3,971,073.68 0.26% 0.19%22 Apr-14 37.12% 1.37% 188,543.44 144,892.52 43,650.92 4,014,724.60 0.26% 0.19%23 May-14 35.04% 1.25% 302,979.02 204,254.72 98,724.30 4,113,448.90 0.27% 0.19%24 Jun-14 33.02% 1.24% 336,164.13 237,897.66 98,266.47 4,211,715.37 0.27% 0.20%25 Jul-14 30.99% 1.35% 358,488.71 204,589.08 153,899.63 4,365,615.00 0.28% 0.20%26 Aug-14 29.07% 1.28% 274,764.30 147,570.53 127,193.77 4,492,808.77 0.29% 0.20%27 Sep-14 27.17% 1.36% 375,900.89 260,165.12 115,735.77 4,608,544.54 0.30% 0.20%28 Oct-14 25.37% 1.28% 302,789.94 248,967.24 53,822.70 4,662,367.24 0.30% 0.21%29 Nov-14 23.76% 1.09% 336,186.18 228,815.49 107,370.69 4,769,737.93 0.31% 0.21%30 Dec-14 22.09% 1.29% 332,665.72 213,401.50 119,264.22 4,889,002.15 0.32% 0.21%31 Jan-15 20.49% 1.26% 245,521.43 230,593.71 14,927.72 4,903,929.87 0.32% 0.21%32 Feb-15 19.03% 1.12% 278,295.26 277,254.91 1,040.35 4,904,970.22 0.32% 0.21%33 Mar-15 17.49% 1.39% 162,853.61 236,326.13 (73,472.52) 4,831,497.70 0.31% 0.21%34 Apr-15 16.08% 1.25% 112,170.90 188,759.38 (76,588.48) 4,754,909.22 0.31% 0.21%35 May-15 14.76% 1.18% 137,887.99 158,611.89 (20,723.90) 4,734,185.32 0.31% 0.21%36 Jun-15 13.45% 1.29% 208,020.28 191,858.65 16,161.63 4,750,346.95 0.31% 0.21%37 Jul-15 12.18% 1.36% 126,825.40 167,421.34 (40,595.94) 4,709,751.01 0.31% 0.20%38 Aug-15 11.01% 1.26% 124,298.02 155,846.64 (31,548.62) 4,678,202.39 0.30% 0.20%39 Sep-15 9.89% 1.29% 166,765.05 243,918.58 (77,153.53) 4,601,048.86 0.30% 0.20%40 Oct-15 0.00% 128,267.22 149,925.95 (21,658.73) 4,579,390.13 0.30% 0.20%
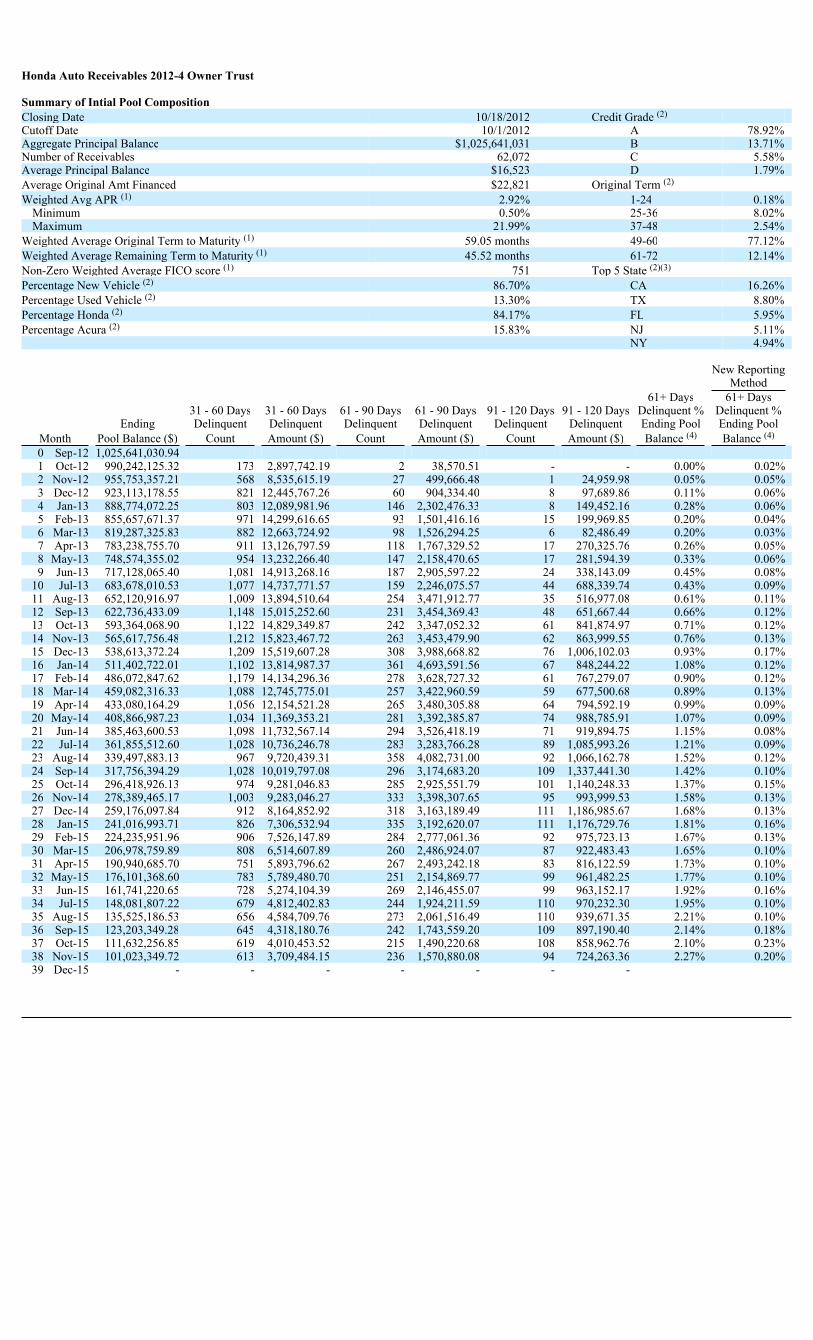
Honda Auto Receivables 2012-4 Owner Trust
Summary of Intial Pool CompositionClosing Date 10/18/2012 Credit Grade (2)
Cutoff Date 10/1/2012 A 78.92%Aggregate Principal Balance $1,025,641,031 B 13.71%Number of Receivables 62,072 C 5.58%Average Principal Balance $16,523 D 1.79%Average Original Amt Financed $22,821 Original Term (2)
Weighted Avg APR (1) 2.92% 1-24 0.18%Minimum 0.50% 25-36 8.02%Maximum 21.99% 37-48 2.54%
Weighted Average Original Term to Maturity (1) 59.05 months 49-60 77.12%Weighted Average Remaining Term to Maturity (1) 45.52 months 61-72 12.14%Non-Zero Weighted Average FICO score (1) 751 Top 5 State (2)(3)
Percentage New Vehicle (2) 86.70% CA 16.26%Percentage Used Vehicle (2) 13.30% TX 8.80%Percentage Honda (2) 84.17% FL 5.95%Percentage Acura (2) 15.83% NJ 5.11%
NY 4.94%
New ReportingMethod
61+ Days 61+ Days31 - 60 Days 31 - 60 Days 61 - 90 Days 61 - 90 Days 91 - 120 Days 91 - 120 Days Delinquent % Delinquent %
Ending Delinquent Delinquent Delinquent Delinquent Delinquent Delinquent Ending Pool Ending PoolMonth Pool Balance ($) Count Amount ($) Count Amount ($) Count Amount ($) Balance (4) Balance (4)
0 Sep-12 1,025,641,030.941 Oct-12 990,242,125.32 173 2,897,742.19 2 38,570.51 - - 0.00% 0.02%2 Nov-12 955,753,357.21 568 8,535,615.19 27 499,666.48 1 24,959.98 0.05% 0.05%3 Dec-12 923,113,178.55 821 12,445,767.26 60 904,334.40 8 97,689.86 0.11% 0.06%4 Jan-13 888,774,072.25 803 12,089,981.96 146 2,302,476.33 8 149,452.16 0.28% 0.06%5 Feb-13 855,657,671.37 971 14,299,616.65 93 1,501,416.16 15 199,969.85 0.20% 0.04%6 Mar-13 819,287,325.83 882 12,663,724.92 98 1,526,294.25 6 82,486.49 0.20% 0.03%7 Apr-13 783,238,755.70 911 13,126,797.59 118 1,767,329.52 17 270,325.76 0.26% 0.05%8 May-13 748,574,355.02 954 13,232,266.40 147 2,158,470.65 17 281,594.39 0.33% 0.06%9 Jun-13 717,128,065.40 1,081 14,913,268.16 187 2,905,597.22 24 338,143.09 0.45% 0.08%
10 Jul-13 683,678,010.53 1,077 14,737,771.57 159 2,246,075.57 44 688,339.74 0.43% 0.09%11 Aug-13 652,120,916.97 1,009 13,894,510.64 254 3,471,912.77 35 516,977.08 0.61% 0.11%12 Sep-13 622,736,433.09 1,148 15,015,252.60 231 3,454,369.43 48 651,667.44 0.66% 0.12%13 Oct-13 593,364,068.90 1,122 14,829,349.87 242 3,347,052.32 61 841,874.97 0.71% 0.12%14 Nov-13 565,617,756.48 1,212 15,823,467.72 263 3,453,479.90 62 863,999.55 0.76% 0.13%15 Dec-13 538,613,372.24 1,209 15,519,607.28 308 3,988,668.82 76 1,006,102.03 0.93% 0.17%16 Jan-14 511,402,722.01 1,102 13,814,987.37 361 4,693,591.56 67 848,244.22 1.08% 0.12%17 Feb-14 486,072,847.62 1,179 14,134,296.36 278 3,628,727.32 61 767,279.07 0.90% 0.12%18 Mar-14 459,082,316.33 1,088 12,745,775.01 257 3,422,960.59 59 677,500.68 0.89% 0.13%19 Apr-14 433,080,164.29 1,056 12,154,521.28 265 3,480,305.88 64 794,592.19 0.99% 0.09%20 May-14 408,866,987.23 1,034 11,369,353.21 281 3,392,385.87 74 988,785.91 1.07% 0.09%21 Jun-14 385,463,600.53 1,098 11,732,567.14 294 3,526,418.19 71 919,894.75 1.15% 0.08%22 Jul-14 361,855,512.60 1,028 10,736,246.78 283 3,283,766.28 89 1,085,993.26 1.21% 0.09%23 Aug-14 339,497,883.13 967 9,720,439.31 358 4,082,731.00 92 1,066,162.78 1.52% 0.12%24 Sep-14 317,756,394.29 1,028 10,019,797.08 296 3,174,683.20 109 1,337,441.30 1.42% 0.10%25 Oct-14 296,418,926.13 974 9,281,046.83 285 2,925,551.79 101 1,140,248.33 1.37% 0.15%26 Nov-14 278,389,465.17 1,003 9,283,046.27 333 3,398,307.65 95 993,999.53 1.58% 0.13%27 Dec-14 259,176,097.84 912 8,164,852.92 318 3,163,189.49 111 1,186,985.67 1.68% 0.13%28 Jan-15 241,016,993.71 826 7,306,532.94 335 3,192,620.07 111 1,176,729.76 1.81% 0.16%29 Feb-15 224,235,951.96 906 7,526,147.89 284 2,777,061.36 92 975,723.13 1.67% 0.13%30 Mar-15 206,978,759.89 808 6,514,607.89 260 2,486,924.07 87 922,483.43 1.65% 0.10%31 Apr-15 190,940,685.70 751 5,893,796.62 267 2,493,242.18 83 816,122.59 1.73% 0.10%32 May-15 176,101,368.60 783 5,789,480.70 251 2,154,869.77 99 961,482.25 1.77% 0.10%33 Jun-15 161,741,220.65 728 5,274,104.39 269 2,146,455.07 99 963,152.17 1.92% 0.16%34 Jul-15 148,081,807.22 679 4,812,402.83 244 1,924,211.59 110 970,232.30 1.95% 0.10%35 Aug-15 135,525,186.53 656 4,584,709.76 273 2,061,516.49 110 939,671.35 2.21% 0.10%36 Sep-15 123,203,349.28 645 4,318,180.76 242 1,743,559.20 109 897,190.40 2.14% 0.18%37 Oct-15 111,632,256.85 619 4,010,453.52 215 1,490,220.68 108 858,962.76 2.10% 0.23%38 Nov-15 101,023,349.72 613 3,709,484.15 236 1,570,880.08 94 724,263.36 2.27% 0.20%39 Dec-15 - - - - - - -
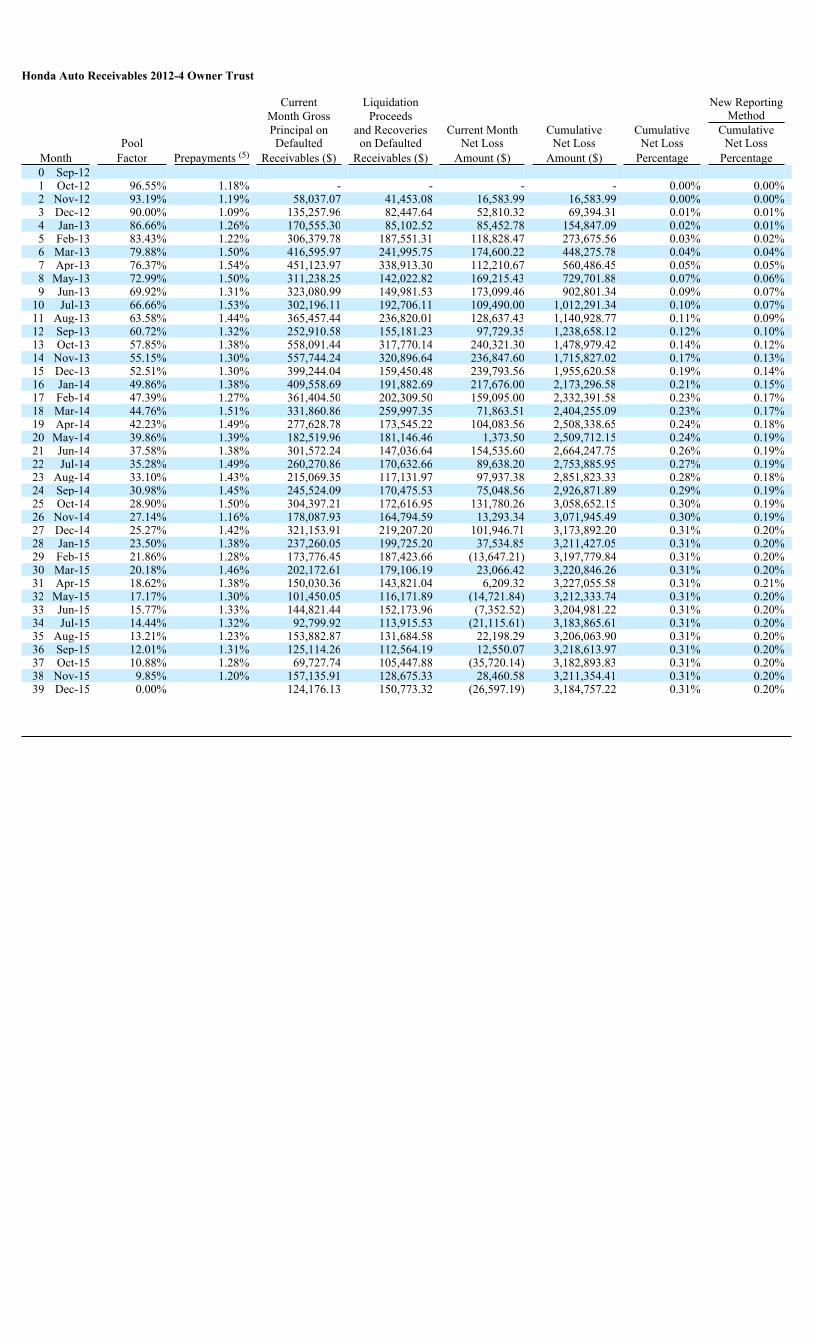
Honda Auto Receivables 2012-4 Owner Trust
Current Liquidation New ReportingMonth Gross Proceeds MethodPrincipal on and Recoveries Current Month Cumulative Cumulative Cumulative
Pool Defaulted on Defaulted Net Loss Net Loss Net Loss Net LossMonth Factor Prepayments (5) Receivables ($) Receivables ($) Amount ($) Amount ($) Percentage Percentage0 Sep-121 Oct-12 96.55% 1.18% - - - - 0.00% 0.00%2 Nov-12 93.19% 1.19% 58,037.07 41,453.08 16,583.99 16,583.99 0.00% 0.00%3 Dec-12 90.00% 1.09% 135,257.96 82,447.64 52,810.32 69,394.31 0.01% 0.01%4 Jan-13 86.66% 1.26% 170,555.30 85,102.52 85,452.78 154,847.09 0.02% 0.01%5 Feb-13 83.43% 1.22% 306,379.78 187,551.31 118,828.47 273,675.56 0.03% 0.02%6 Mar-13 79.88% 1.50% 416,595.97 241,995.75 174,600.22 448,275.78 0.04% 0.04%7 Apr-13 76.37% 1.54% 451,123.97 338,913.30 112,210.67 560,486.45 0.05% 0.05%8 May-13 72.99% 1.50% 311,238.25 142,022.82 169,215.43 729,701.88 0.07% 0.06%9 Jun-13 69.92% 1.31% 323,080.99 149,981.53 173,099.46 902,801.34 0.09% 0.07%
10 Jul-13 66.66% 1.53% 302,196.11 192,706.11 109,490.00 1,012,291.34 0.10% 0.07%11 Aug-13 63.58% 1.44% 365,457.44 236,820.01 128,637.43 1,140,928.77 0.11% 0.09%12 Sep-13 60.72% 1.32% 252,910.58 155,181.23 97,729.35 1,238,658.12 0.12% 0.10%13 Oct-13 57.85% 1.38% 558,091.44 317,770.14 240,321.30 1,478,979.42 0.14% 0.12%14 Nov-13 55.15% 1.30% 557,744.24 320,896.64 236,847.60 1,715,827.02 0.17% 0.13%15 Dec-13 52.51% 1.30% 399,244.04 159,450.48 239,793.56 1,955,620.58 0.19% 0.14%16 Jan-14 49.86% 1.38% 409,558.69 191,882.69 217,676.00 2,173,296.58 0.21% 0.15%17 Feb-14 47.39% 1.27% 361,404.50 202,309.50 159,095.00 2,332,391.58 0.23% 0.17%18 Mar-14 44.76% 1.51% 331,860.86 259,997.35 71,863.51 2,404,255.09 0.23% 0.17%19 Apr-14 42.23% 1.49% 277,628.78 173,545.22 104,083.56 2,508,338.65 0.24% 0.18%20 May-14 39.86% 1.39% 182,519.96 181,146.46 1,373.50 2,509,712.15 0.24% 0.19%21 Jun-14 37.58% 1.38% 301,572.24 147,036.64 154,535.60 2,664,247.75 0.26% 0.19%22 Jul-14 35.28% 1.49% 260,270.86 170,632.66 89,638.20 2,753,885.95 0.27% 0.19%23 Aug-14 33.10% 1.43% 215,069.35 117,131.97 97,937.38 2,851,823.33 0.28% 0.18%24 Sep-14 30.98% 1.45% 245,524.09 170,475.53 75,048.56 2,926,871.89 0.29% 0.19%25 Oct-14 28.90% 1.50% 304,397.21 172,616.95 131,780.26 3,058,652.15 0.30% 0.19%26 Nov-14 27.14% 1.16% 178,087.93 164,794.59 13,293.34 3,071,945.49 0.30% 0.19%27 Dec-14 25.27% 1.42% 321,153.91 219,207.20 101,946.71 3,173,892.20 0.31% 0.20%28 Jan-15 23.50% 1.38% 237,260.05 199,725.20 37,534.85 3,211,427.05 0.31% 0.20%29 Feb-15 21.86% 1.28% 173,776.45 187,423.66 (13,647.21) 3,197,779.84 0.31% 0.20%30 Mar-15 20.18% 1.46% 202,172.61 179,106.19 23,066.42 3,220,846.26 0.31% 0.20%31 Apr-15 18.62% 1.38% 150,030.36 143,821.04 6,209.32 3,227,055.58 0.31% 0.21%32 May-15 17.17% 1.30% 101,450.05 116,171.89 (14,721.84) 3,212,333.74 0.31% 0.20%33 Jun-15 15.77% 1.33% 144,821.44 152,173.96 (7,352.52) 3,204,981.22 0.31% 0.20%34 Jul-15 14.44% 1.32% 92,799.92 113,915.53 (21,115.61) 3,183,865.61 0.31% 0.20%35 Aug-15 13.21% 1.23% 153,882.87 131,684.58 22,198.29 3,206,063.90 0.31% 0.20%36 Sep-15 12.01% 1.31% 125,114.26 112,564.19 12,550.07 3,218,613.97 0.31% 0.20%37 Oct-15 10.88% 1.28% 69,727.74 105,447.88 (35,720.14) 3,182,893.83 0.31% 0.20%38 Nov-15 9.85% 1.20% 157,135.91 128,675.33 28,460.58 3,211,354.41 0.31% 0.20%39 Dec-15 0.00% 124,176.13 150,773.32 (26,597.19) 3,184,757.22 0.31% 0.20%
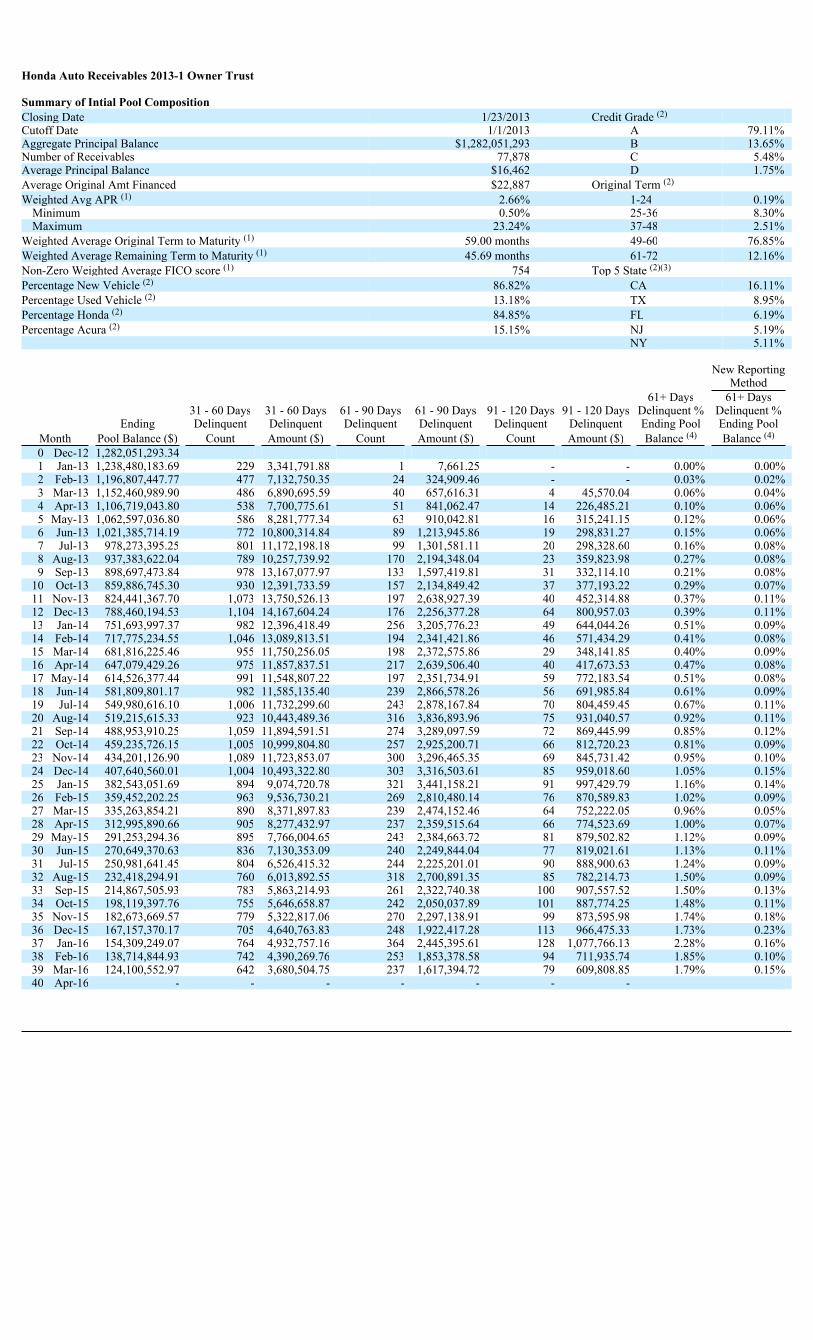
Honda Auto Receivables 2013-1 Owner Trust
Summary of Intial Pool CompositionClosing Date 1/23/2013 Credit Grade (2)
Cutoff Date 1/1/2013 A 79.11%Aggregate Principal Balance $1,282,051,293 B 13.65%Number of Receivables 77,878 C 5.48%Average Principal Balance $16,462 D 1.75%Average Original Amt Financed $22,887 Original Term (2)
Weighted Avg APR (1) 2.66% 1-24 0.19%Minimum 0.50% 25-36 8.30%Maximum 23.24% 37-48 2.51%
Weighted Average Original Term to Maturity (1) 59.00 months 49-60 76.85%Weighted Average Remaining Term to Maturity (1) 45.69 months 61-72 12.16%Non-Zero Weighted Average FICO score (1) 754 Top 5 State (2)(3)
Percentage New Vehicle (2) 86.82% CA 16.11%Percentage Used Vehicle (2) 13.18% TX 8.95%Percentage Honda (2) 84.85% FL 6.19%Percentage Acura (2) 15.15% NJ 5.19%
NY 5.11%
New ReportingMethod
61+ Days 61+ Days31 - 60 Days 31 - 60 Days 61 - 90 Days 61 - 90 Days 91 - 120 Days 91 - 120 Days Delinquent % Delinquent %
Ending Delinquent Delinquent Delinquent Delinquent Delinquent Delinquent Ending Pool Ending PoolMonth Pool Balance ($) Count Amount ($) Count Amount ($) Count Amount ($) Balance (4) Balance (4)
0 Dec-12 1,282,051,293.341 Jan-13 1,238,480,183.69 229 3,341,791.88 1 7,661.25 - - 0.00% 0.00%2 Feb-13 1,196,807,447.77 477 7,132,750.35 24 324,909.46 - - 0.03% 0.02%3 Mar-13 1,152,460,989.90 486 6,890,695.59 40 657,616.31 4 45,570.04 0.06% 0.04%4 Apr-13 1,106,719,043.80 538 7,700,775.61 51 841,062.47 14 226,485.21 0.10% 0.06%5 May-13 1,062,597,036.80 586 8,281,777.34 63 910,042.81 16 315,241.15 0.12% 0.06%6 Jun-13 1,021,385,714.19 772 10,800,314.84 89 1,213,945.86 19 298,831.27 0.15% 0.06%7 Jul-13 978,273,395.25 801 11,172,198.18 99 1,301,581.11 20 298,328.60 0.16% 0.08%8 Aug-13 937,383,622.04 789 10,257,739.92 170 2,194,348.04 23 359,823.98 0.27% 0.08%9 Sep-13 898,697,473.84 978 13,167,077.97 133 1,597,419.81 31 332,114.10 0.21% 0.08%
10 Oct-13 859,886,745.30 930 12,391,733.59 157 2,134,849.42 37 377,193.22 0.29% 0.07%11 Nov-13 824,441,367.70 1,073 13,750,526.13 197 2,638,927.39 40 452,314.88 0.37% 0.11%12 Dec-13 788,460,194.53 1,104 14,167,604.24 176 2,256,377.28 64 800,957.03 0.39% 0.11%13 Jan-14 751,693,997.37 982 12,396,418.49 256 3,205,776.23 49 644,044.26 0.51% 0.09%14 Feb-14 717,775,234.55 1,046 13,089,813.51 194 2,341,421.86 46 571,434.29 0.41% 0.08%15 Mar-14 681,816,225.46 955 11,750,256.05 198 2,372,575.86 29 348,141.85 0.40% 0.09%16 Apr-14 647,079,429.26 975 11,857,837.51 217 2,639,506.40 40 417,673.53 0.47% 0.08%17 May-14 614,526,377.44 991 11,548,807.22 197 2,351,734.91 59 772,183.54 0.51% 0.08%18 Jun-14 581,809,801.17 982 11,585,135.40 239 2,866,578.26 56 691,985.84 0.61% 0.09%19 Jul-14 549,980,616.10 1,006 11,732,299.60 243 2,878,167.84 70 804,459.45 0.67% 0.11%20 Aug-14 519,215,615.33 923 10,443,489.36 316 3,836,893.96 75 931,040.57 0.92% 0.11%21 Sep-14 488,953,910.25 1,059 11,894,591.51 274 3,289,097.59 72 869,445.99 0.85% 0.12%22 Oct-14 459,235,726.15 1,005 10,999,804.80 257 2,925,200.71 66 812,720.23 0.81% 0.09%23 Nov-14 434,201,126.90 1,089 11,723,853.07 300 3,296,465.35 69 845,731.42 0.95% 0.10%24 Dec-14 407,640,560.01 1,004 10,493,322.80 303 3,316,503.61 85 959,018.60 1.05% 0.15%25 Jan-15 382,543,051.69 894 9,074,720.78 321 3,441,158.21 91 997,429.79 1.16% 0.14%26 Feb-15 359,452,202.25 963 9,536,730.21 269 2,810,480.14 76 870,589.83 1.02% 0.09%27 Mar-15 335,263,854.21 890 8,371,897.83 239 2,474,152.46 64 752,222.05 0.96% 0.05%28 Apr-15 312,995,890.66 905 8,277,432.97 237 2,359,515.64 66 774,523.69 1.00% 0.07%29 May-15 291,253,294.36 895 7,766,004.65 243 2,384,663.72 81 879,502.82 1.12% 0.09%30 Jun-15 270,649,370.63 836 7,130,353.09 240 2,249,844.04 77 819,021.61 1.13% 0.11%31 Jul-15 250,981,641.45 804 6,526,415.32 244 2,225,201.01 90 888,900.63 1.24% 0.09%32 Aug-15 232,418,294.91 760 6,013,892.55 318 2,700,891.35 85 782,214.73 1.50% 0.09%33 Sep-15 214,867,505.93 783 5,863,214.93 261 2,322,740.38 100 907,557.52 1.50% 0.13%34 Oct-15 198,119,397.76 755 5,646,658.87 242 2,050,037.89 101 887,774.25 1.48% 0.11%35 Nov-15 182,673,669.57 779 5,322,817.06 270 2,297,138.91 99 873,595.98 1.74% 0.18%36 Dec-15 167,157,370.17 705 4,640,763.83 248 1,922,417.28 113 966,475.33 1.73% 0.23%37 Jan-16 154,309,249.07 764 4,932,757.16 364 2,445,395.61 128 1,077,766.13 2.28% 0.16%38 Feb-16 138,714,844.93 742 4,390,269.76 253 1,853,378.58 94 711,935.74 1.85% 0.10%39 Mar-16 124,100,552.97 642 3,680,504.75 237 1,617,394.72 79 609,808.85 1.79% 0.15%40 Apr-16 - - - - - - -
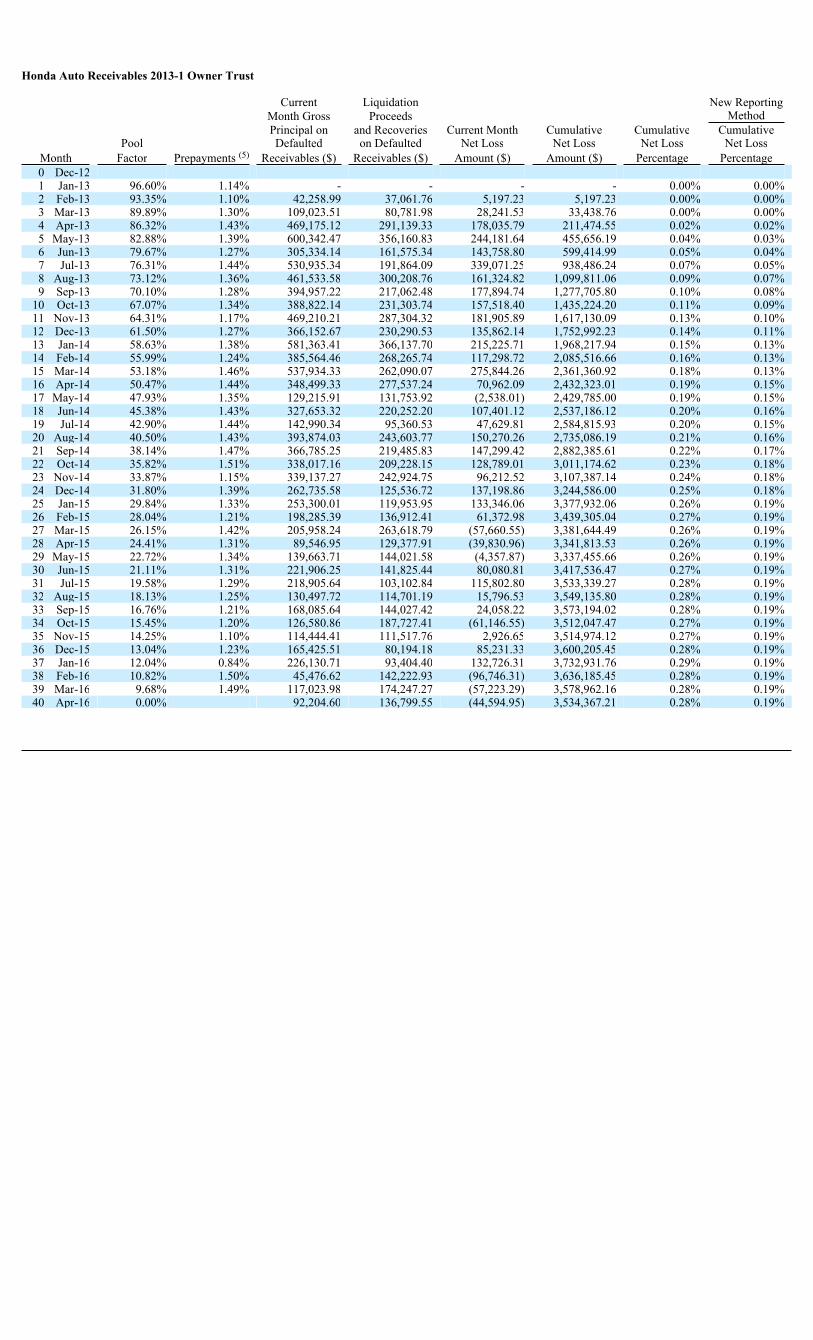
Honda Auto Receivables 2013-1 Owner Trust
Current Liquidation New ReportingMonth Gross Proceeds MethodPrincipal on and Recoveries Current Month Cumulative Cumulative Cumulative
Pool Defaulted on Defaulted Net Loss Net Loss Net Loss Net LossMonth Factor Prepayments (5) Receivables ($) Receivables ($) Amount ($) Amount ($) Percentage Percentage0 Dec-121 Jan-13 96.60% 1.14% - - - - 0.00% 0.00%2 Feb-13 93.35% 1.10% 42,258.99 37,061.76 5,197.23 5,197.23 0.00% 0.00%3 Mar-13 89.89% 1.30% 109,023.51 80,781.98 28,241.53 33,438.76 0.00% 0.00%4 Apr-13 86.32% 1.43% 469,175.12 291,139.33 178,035.79 211,474.55 0.02% 0.02%5 May-13 82.88% 1.39% 600,342.47 356,160.83 244,181.64 455,656.19 0.04% 0.03%6 Jun-13 79.67% 1.27% 305,334.14 161,575.34 143,758.80 599,414.99 0.05% 0.04%7 Jul-13 76.31% 1.44% 530,935.34 191,864.09 339,071.25 938,486.24 0.07% 0.05%8 Aug-13 73.12% 1.36% 461,533.58 300,208.76 161,324.82 1,099,811.06 0.09% 0.07%9 Sep-13 70.10% 1.28% 394,957.22 217,062.48 177,894.74 1,277,705.80 0.10% 0.08%
10 Oct-13 67.07% 1.34% 388,822.14 231,303.74 157,518.40 1,435,224.20 0.11% 0.09%11 Nov-13 64.31% 1.17% 469,210.21 287,304.32 181,905.89 1,617,130.09 0.13% 0.10%12 Dec-13 61.50% 1.27% 366,152.67 230,290.53 135,862.14 1,752,992.23 0.14% 0.11%13 Jan-14 58.63% 1.38% 581,363.41 366,137.70 215,225.71 1,968,217.94 0.15% 0.13%14 Feb-14 55.99% 1.24% 385,564.46 268,265.74 117,298.72 2,085,516.66 0.16% 0.13%15 Mar-14 53.18% 1.46% 537,934.33 262,090.07 275,844.26 2,361,360.92 0.18% 0.13%16 Apr-14 50.47% 1.44% 348,499.33 277,537.24 70,962.09 2,432,323.01 0.19% 0.15%17 May-14 47.93% 1.35% 129,215.91 131,753.92 (2,538.01) 2,429,785.00 0.19% 0.15%18 Jun-14 45.38% 1.43% 327,653.32 220,252.20 107,401.12 2,537,186.12 0.20% 0.16%19 Jul-14 42.90% 1.44% 142,990.34 95,360.53 47,629.81 2,584,815.93 0.20% 0.15%20 Aug-14 40.50% 1.43% 393,874.03 243,603.77 150,270.26 2,735,086.19 0.21% 0.16%21 Sep-14 38.14% 1.47% 366,785.25 219,485.83 147,299.42 2,882,385.61 0.22% 0.17%22 Oct-14 35.82% 1.51% 338,017.16 209,228.15 128,789.01 3,011,174.62 0.23% 0.18%23 Nov-14 33.87% 1.15% 339,137.27 242,924.75 96,212.52 3,107,387.14 0.24% 0.18%24 Dec-14 31.80% 1.39% 262,735.58 125,536.72 137,198.86 3,244,586.00 0.25% 0.18%25 Jan-15 29.84% 1.33% 253,300.01 119,953.95 133,346.06 3,377,932.06 0.26% 0.19%26 Feb-15 28.04% 1.21% 198,285.39 136,912.41 61,372.98 3,439,305.04 0.27% 0.19%27 Mar-15 26.15% 1.42% 205,958.24 263,618.79 (57,660.55) 3,381,644.49 0.26% 0.19%28 Apr-15 24.41% 1.31% 89,546.95 129,377.91 (39,830.96) 3,341,813.53 0.26% 0.19%29 May-15 22.72% 1.34% 139,663.71 144,021.58 (4,357.87) 3,337,455.66 0.26% 0.19%30 Jun-15 21.11% 1.31% 221,906.25 141,825.44 80,080.81 3,417,536.47 0.27% 0.19%31 Jul-15 19.58% 1.29% 218,905.64 103,102.84 115,802.80 3,533,339.27 0.28% 0.19%32 Aug-15 18.13% 1.25% 130,497.72 114,701.19 15,796.53 3,549,135.80 0.28% 0.19%33 Sep-15 16.76% 1.21% 168,085.64 144,027.42 24,058.22 3,573,194.02 0.28% 0.19%34 Oct-15 15.45% 1.20% 126,580.86 187,727.41 (61,146.55) 3,512,047.47 0.27% 0.19%35 Nov-15 14.25% 1.10% 114,444.41 111,517.76 2,926.65 3,514,974.12 0.27% 0.19%36 Dec-15 13.04% 1.23% 165,425.51 80,194.18 85,231.33 3,600,205.45 0.28% 0.19%37 Jan-16 12.04% 0.84% 226,130.71 93,404.40 132,726.31 3,732,931.76 0.29% 0.19%38 Feb-16 10.82% 1.50% 45,476.62 142,222.93 (96,746.31) 3,636,185.45 0.28% 0.19%39 Mar-16 9.68% 1.49% 117,023.98 174,247.27 (57,223.29) 3,578,962.16 0.28% 0.19%40 Apr-16 0.00% 92,204.60 136,799.55 (44,594.95) 3,534,367.21 0.28% 0.19%
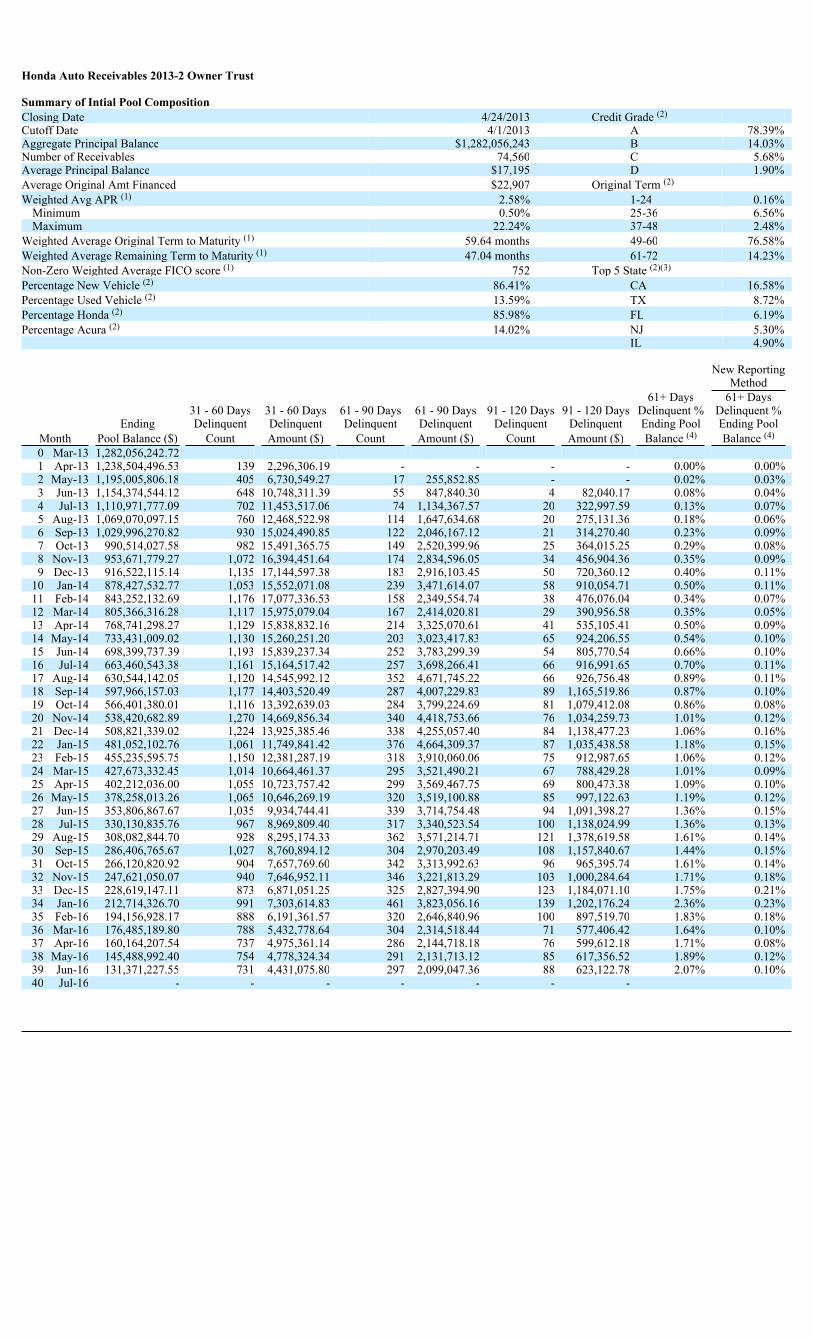
Honda Auto Receivables 2013-2 Owner Trust
Summary of Intial Pool CompositionClosing Date 4/24/2013 Credit Grade (2)
Cutoff Date 4/1/2013 A 78.39%Aggregate Principal Balance $1,282,056,243 B 14.03%Number of Receivables 74,560 C 5.68%Average Principal Balance $17,195 D 1.90%Average Original Amt Financed $22,907 Original Term (2)
Weighted Avg APR (1) 2.58% 1-24 0.16%Minimum 0.50% 25-36 6.56%Maximum 22.24% 37-48 2.48%
Weighted Average Original Term to Maturity (1) 59.64 months 49-60 76.58%Weighted Average Remaining Term to Maturity (1) 47.04 months 61-72 14.23%Non-Zero Weighted Average FICO score (1) 752 Top 5 State (2)(3)
Percentage New Vehicle (2) 86.41% CA 16.58%Percentage Used Vehicle (2) 13.59% TX 8.72%Percentage Honda (2) 85.98% FL 6.19%Percentage Acura (2) 14.02% NJ 5.30%
IL 4.90%
New ReportingMethod
61+ Days 61+ Days31 - 60 Days 31 - 60 Days 61 - 90 Days 61 - 90 Days 91 - 120 Days 91 - 120 Days Delinquent % Delinquent %
Ending Delinquent Delinquent Delinquent Delinquent Delinquent Delinquent Ending Pool Ending PoolMonth Pool Balance ($) Count Amount ($) Count Amount ($) Count Amount ($) Balance (4) Balance (4)
0 Mar-13 1,282,056,242.721 Apr-13 1,238,504,496.53 139 2,296,306.19 - - - - 0.00% 0.00%2 May-13 1,195,005,806.18 405 6,730,549.27 17 255,852.85 - - 0.02% 0.03%3 Jun-13 1,154,374,544.12 648 10,748,311.39 55 847,840.30 4 82,040.17 0.08% 0.04%4 Jul-13 1,110,971,777.09 702 11,453,517.06 74 1,134,367.57 20 322,997.59 0.13% 0.07%5 Aug-13 1,069,070,097.15 760 12,468,522.98 114 1,647,634.68 20 275,131.36 0.18% 0.06%6 Sep-13 1,029,996,270.82 930 15,024,490.85 122 2,046,167.12 21 314,270.40 0.23% 0.09%7 Oct-13 990,514,027.58 982 15,491,365.75 149 2,520,399.96 25 364,015.25 0.29% 0.08%8 Nov-13 953,671,779.27 1,072 16,394,451.64 174 2,834,596.05 34 456,904.36 0.35% 0.09%9 Dec-13 916,522,115.14 1,135 17,144,597.38 183 2,916,103.45 50 720,360.12 0.40% 0.11%
10 Jan-14 878,427,532.77 1,053 15,552,071.08 239 3,471,614.07 58 910,054.71 0.50% 0.11%11 Feb-14 843,252,132.69 1,176 17,077,336.53 158 2,349,554.74 38 476,076.04 0.34% 0.07%12 Mar-14 805,366,316.28 1,117 15,975,079.04 167 2,414,020.81 29 390,956.58 0.35% 0.05%13 Apr-14 768,741,298.27 1,129 15,838,832.16 214 3,325,070.61 41 535,105.41 0.50% 0.09%14 May-14 733,431,009.02 1,130 15,260,251.20 203 3,023,417.83 65 924,206.55 0.54% 0.10%15 Jun-14 698,399,737.39 1,193 15,839,237.34 252 3,783,299.39 54 805,770.54 0.66% 0.10%16 Jul-14 663,460,543.38 1,161 15,164,517.42 257 3,698,266.41 66 916,991.65 0.70% 0.11%17 Aug-14 630,544,142.05 1,120 14,545,992.12 352 4,671,745.22 66 926,756.48 0.89% 0.11%18 Sep-14 597,966,157.03 1,177 14,403,520.49 287 4,007,229.83 89 1,165,519.86 0.87% 0.10%19 Oct-14 566,401,380.01 1,116 13,392,639.03 284 3,799,224.69 81 1,079,412.08 0.86% 0.08%20 Nov-14 538,420,682.89 1,270 14,669,856.34 340 4,418,753.66 76 1,034,259.73 1.01% 0.12%21 Dec-14 508,821,339.02 1,224 13,925,385.46 338 4,255,057.40 84 1,138,477.23 1.06% 0.16%22 Jan-15 481,052,102.76 1,061 11,749,841.42 376 4,664,309.37 87 1,035,438.58 1.18% 0.15%23 Feb-15 455,235,595.75 1,150 12,381,287.19 318 3,910,060.06 75 912,987.65 1.06% 0.12%24 Mar-15 427,673,332.45 1,014 10,664,461.37 295 3,521,490.21 67 788,429.28 1.01% 0.09%25 Apr-15 402,212,036.00 1,055 10,723,757.42 299 3,569,467.75 69 800,473.38 1.09% 0.10%26 May-15 378,258,013.26 1,065 10,646,269.19 320 3,519,100.88 85 997,122.63 1.19% 0.12%27 Jun-15 353,806,867.67 1,035 9,934,744.41 339 3,714,754.48 94 1,091,398.27 1.36% 0.15%28 Jul-15 330,130,835.76 967 8,969,809.40 317 3,340,523.54 100 1,138,024.99 1.36% 0.13%29 Aug-15 308,082,844.70 928 8,295,174.33 362 3,571,214.71 121 1,378,619.58 1.61% 0.14%30 Sep-15 286,406,765.67 1,027 8,760,894.12 304 2,970,203.49 108 1,157,840.67 1.44% 0.15%31 Oct-15 266,120,820.92 904 7,657,769.60 342 3,313,992.63 96 965,395.74 1.61% 0.14%32 Nov-15 247,621,050.07 940 7,646,952.11 346 3,221,813.29 103 1,000,284.64 1.71% 0.18%33 Dec-15 228,619,147.11 873 6,871,051.25 325 2,827,394.90 123 1,184,071.10 1.75% 0.21%34 Jan-16 212,714,326.70 991 7,303,614.83 461 3,823,056.16 139 1,202,176.24 2.36% 0.23%35 Feb-16 194,156,928.17 888 6,191,361.57 320 2,646,840.96 100 897,519.70 1.83% 0.18%36 Mar-16 176,485,189.80 788 5,432,778.64 304 2,314,518.44 71 577,406.42 1.64% 0.10%37 Apr-16 160,164,207.54 737 4,975,361.14 286 2,144,718.18 76 599,612.18 1.71% 0.08%38 May-16 145,488,992.40 754 4,778,324.34 291 2,131,713.12 85 617,356.52 1.89% 0.12%39 Jun-16 131,371,227.55 731 4,431,075.80 297 2,099,047.36 88 623,122.78 2.07% 0.10%40 Jul-16 - - - - - - -
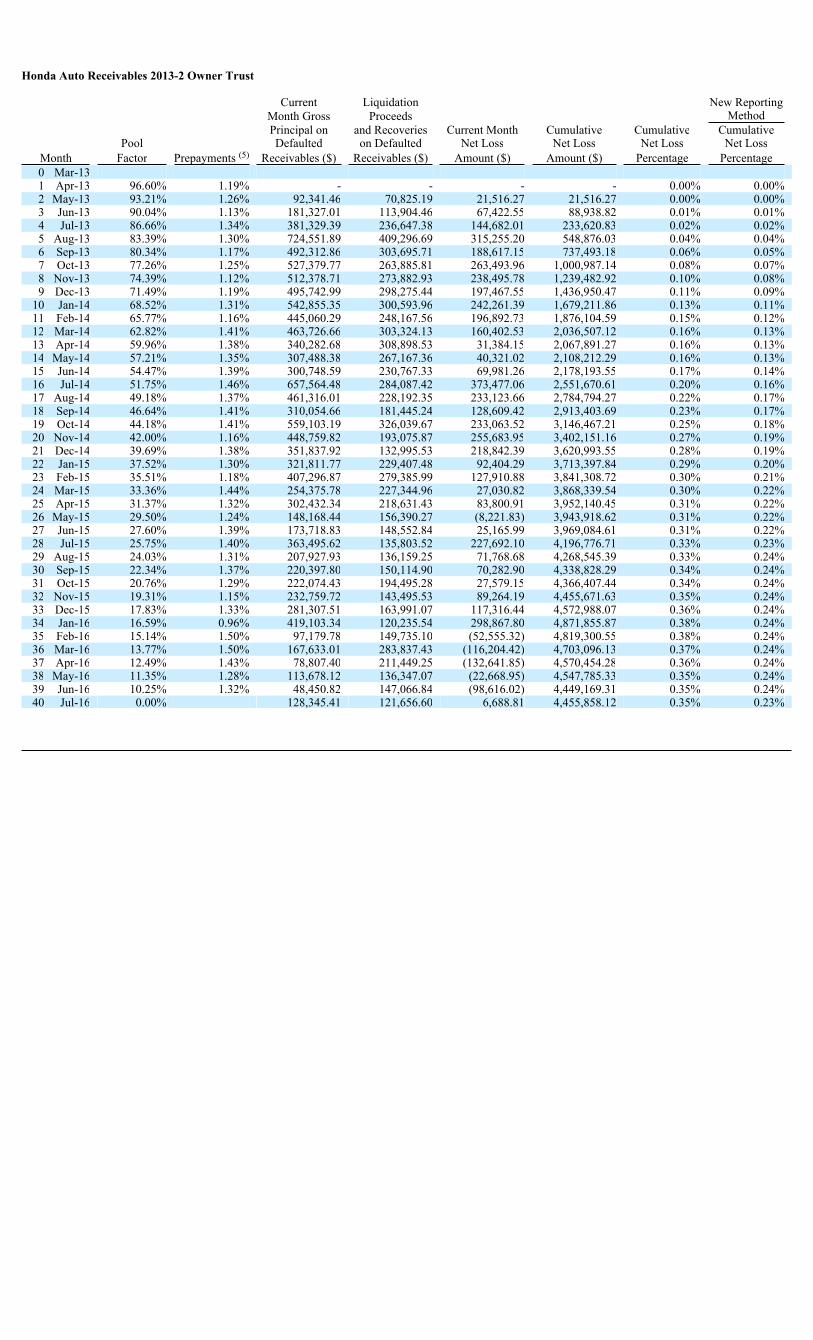
Honda Auto Receivables 2013-2 Owner Trust
Current Liquidation New ReportingMonth Gross Proceeds MethodPrincipal on and Recoveries Current Month Cumulative Cumulative Cumulative
Pool Defaulted on Defaulted Net Loss Net Loss Net Loss Net LossMonth Factor Prepayments (5) Receivables ($) Receivables ($) Amount ($) Amount ($) Percentage Percentage0 Mar-131 Apr-13 96.60% 1.19% - - - - 0.00% 0.00%2 May-13 93.21% 1.26% 92,341.46 70,825.19 21,516.27 21,516.27 0.00% 0.00%3 Jun-13 90.04% 1.13% 181,327.01 113,904.46 67,422.55 88,938.82 0.01% 0.01%4 Jul-13 86.66% 1.34% 381,329.39 236,647.38 144,682.01 233,620.83 0.02% 0.02%5 Aug-13 83.39% 1.30% 724,551.89 409,296.69 315,255.20 548,876.03 0.04% 0.04%6 Sep-13 80.34% 1.17% 492,312.86 303,695.71 188,617.15 737,493.18 0.06% 0.05%7 Oct-13 77.26% 1.25% 527,379.77 263,885.81 263,493.96 1,000,987.14 0.08% 0.07%8 Nov-13 74.39% 1.12% 512,378.71 273,882.93 238,495.78 1,239,482.92 0.10% 0.08%9 Dec-13 71.49% 1.19% 495,742.99 298,275.44 197,467.55 1,436,950.47 0.11% 0.09%
10 Jan-14 68.52% 1.31% 542,855.35 300,593.96 242,261.39 1,679,211.86 0.13% 0.11%11 Feb-14 65.77% 1.16% 445,060.29 248,167.56 196,892.73 1,876,104.59 0.15% 0.12%12 Mar-14 62.82% 1.41% 463,726.66 303,324.13 160,402.53 2,036,507.12 0.16% 0.13%13 Apr-14 59.96% 1.38% 340,282.68 308,898.53 31,384.15 2,067,891.27 0.16% 0.13%14 May-14 57.21% 1.35% 307,488.38 267,167.36 40,321.02 2,108,212.29 0.16% 0.13%15 Jun-14 54.47% 1.39% 300,748.59 230,767.33 69,981.26 2,178,193.55 0.17% 0.14%16 Jul-14 51.75% 1.46% 657,564.48 284,087.42 373,477.06 2,551,670.61 0.20% 0.16%17 Aug-14 49.18% 1.37% 461,316.01 228,192.35 233,123.66 2,784,794.27 0.22% 0.17%18 Sep-14 46.64% 1.41% 310,054.66 181,445.24 128,609.42 2,913,403.69 0.23% 0.17%19 Oct-14 44.18% 1.41% 559,103.19 326,039.67 233,063.52 3,146,467.21 0.25% 0.18%20 Nov-14 42.00% 1.16% 448,759.82 193,075.87 255,683.95 3,402,151.16 0.27% 0.19%21 Dec-14 39.69% 1.38% 351,837.92 132,995.53 218,842.39 3,620,993.55 0.28% 0.19%22 Jan-15 37.52% 1.30% 321,811.77 229,407.48 92,404.29 3,713,397.84 0.29% 0.20%23 Feb-15 35.51% 1.18% 407,296.87 279,385.99 127,910.88 3,841,308.72 0.30% 0.21%24 Mar-15 33.36% 1.44% 254,375.78 227,344.96 27,030.82 3,868,339.54 0.30% 0.22%25 Apr-15 31.37% 1.32% 302,432.34 218,631.43 83,800.91 3,952,140.45 0.31% 0.22%26 May-15 29.50% 1.24% 148,168.44 156,390.27 (8,221.83) 3,943,918.62 0.31% 0.22%27 Jun-15 27.60% 1.39% 173,718.83 148,552.84 25,165.99 3,969,084.61 0.31% 0.22%28 Jul-15 25.75% 1.40% 363,495.62 135,803.52 227,692.10 4,196,776.71 0.33% 0.23%29 Aug-15 24.03% 1.31% 207,927.93 136,159.25 71,768.68 4,268,545.39 0.33% 0.24%30 Sep-15 22.34% 1.37% 220,397.80 150,114.90 70,282.90 4,338,828.29 0.34% 0.24%31 Oct-15 20.76% 1.29% 222,074.43 194,495.28 27,579.15 4,366,407.44 0.34% 0.24%32 Nov-15 19.31% 1.15% 232,759.72 143,495.53 89,264.19 4,455,671.63 0.35% 0.24%33 Dec-15 17.83% 1.33% 281,307.51 163,991.07 117,316.44 4,572,988.07 0.36% 0.24%34 Jan-16 16.59% 0.96% 419,103.34 120,235.54 298,867.80 4,871,855.87 0.38% 0.24%35 Feb-16 15.14% 1.50% 97,179.78 149,735.10 (52,555.32) 4,819,300.55 0.38% 0.24%36 Mar-16 13.77% 1.50% 167,633.01 283,837.43 (116,204.42) 4,703,096.13 0.37% 0.24%37 Apr-16 12.49% 1.43% 78,807.40 211,449.25 (132,641.85) 4,570,454.28 0.36% 0.24%38 May-16 11.35% 1.28% 113,678.12 136,347.07 (22,668.95) 4,547,785.33 0.35% 0.24%39 Jun-16 10.25% 1.32% 48,450.82 147,066.84 (98,616.02) 4,449,169.31 0.35% 0.24%40 Jul-16 0.00% 128,345.41 121,656.60 6,688.81 4,455,858.12 0.35% 0.23%
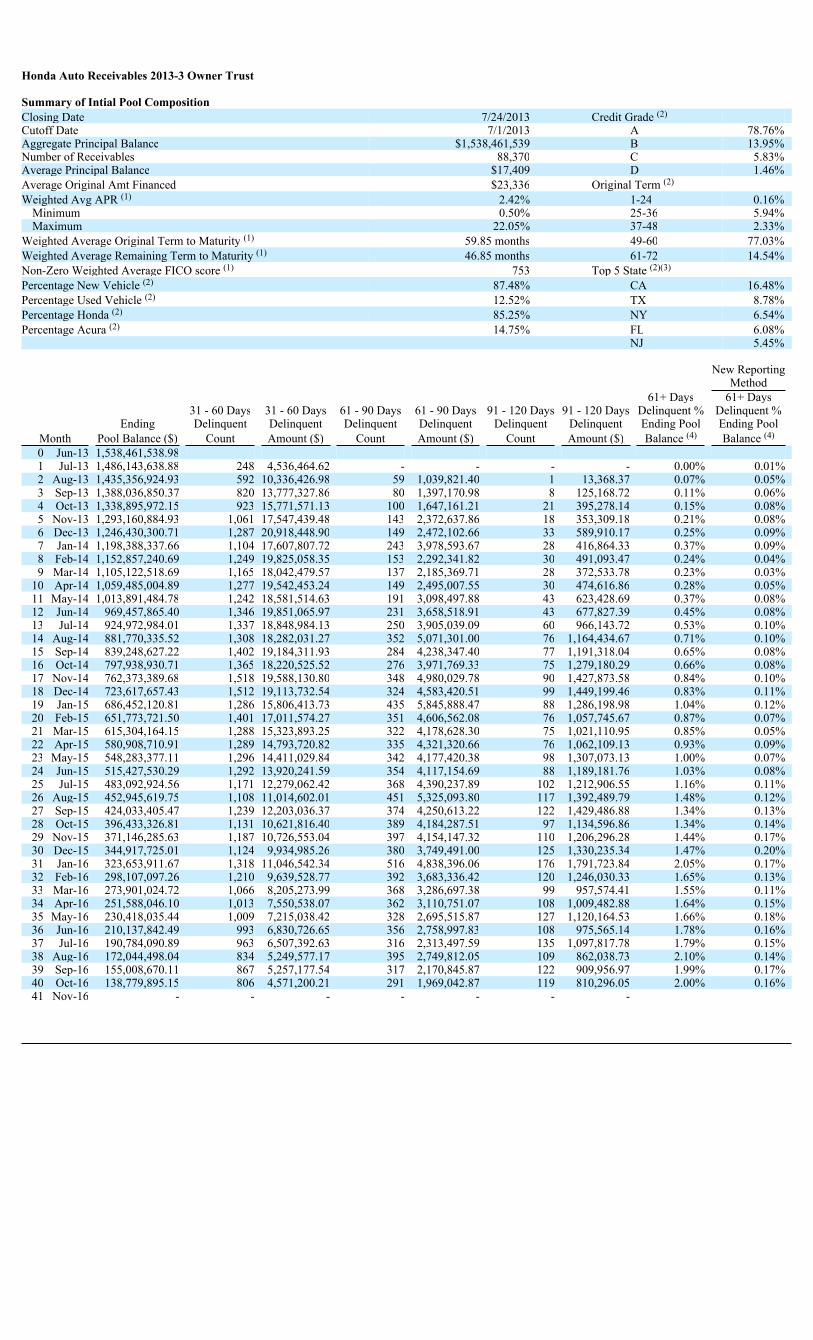
Honda Auto Receivables 2013-3 Owner Trust
Summary of Intial Pool CompositionClosing Date 7/24/2013 Credit Grade (2)
Cutoff Date 7/1/2013 A 78.76%Aggregate Principal Balance $1,538,461,539 B 13.95%Number of Receivables 88,370 C 5.83%Average Principal Balance $17,409 D 1.46%Average Original Amt Financed $23,336 Original Term (2)
Weighted Avg APR (1) 2.42% 1-24 0.16%Minimum 0.50% 25-36 5.94%Maximum 22.05% 37-48 2.33%
Weighted Average Original Term to Maturity (1) 59.85 months 49-60 77.03%Weighted Average Remaining Term to Maturity (1) 46.85 months 61-72 14.54%Non-Zero Weighted Average FICO score (1) 753 Top 5 State (2)(3)
Percentage New Vehicle (2) 87.48% CA 16.48%Percentage Used Vehicle (2) 12.52% TX 8.78%Percentage Honda (2) 85.25% NY 6.54%Percentage Acura (2) 14.75% FL 6.08%
NJ 5.45%
New ReportingMethod
61+ Days 61+ Days31 - 60 Days 31 - 60 Days 61 - 90 Days 61 - 90 Days 91 - 120 Days 91 - 120 Days Delinquent % Delinquent %
Ending Delinquent Delinquent Delinquent Delinquent Delinquent Delinquent Ending Pool Ending PoolMonth Pool Balance ($) Count Amount ($) Count Amount ($) Count Amount ($) Balance (4) Balance (4)
0 Jun-13 1,538,461,538.981 Jul-13 1,486,143,638.88 248 4,536,464.62 - - - - 0.00% 0.01%2 Aug-13 1,435,356,924.93 592 10,336,426.98 59 1,039,821.40 1 13,368.37 0.07% 0.05%3 Sep-13 1,388,036,850.37 820 13,777,327.86 80 1,397,170.98 8 125,168.72 0.11% 0.06%4 Oct-13 1,338,895,972.15 923 15,771,571.13 100 1,647,161.21 21 395,278.14 0.15% 0.08%5 Nov-13 1,293,160,884.93 1,061 17,547,439.48 143 2,372,637.86 18 353,309.18 0.21% 0.08%6 Dec-13 1,246,430,300.71 1,287 20,918,448.90 149 2,472,102.66 33 589,910.17 0.25% 0.09%7 Jan-14 1,198,388,337.66 1,104 17,607,807.72 243 3,978,593.67 28 416,864.33 0.37% 0.09%8 Feb-14 1,152,857,240.69 1,249 19,825,058.35 153 2,292,341.82 30 491,093.47 0.24% 0.04%9 Mar-14 1,105,122,518.69 1,165 18,042,479.57 137 2,185,369.71 28 372,533.78 0.23% 0.03%
10 Apr-14 1,059,485,004.89 1,277 19,542,453.24 149 2,495,007.55 30 474,616.86 0.28% 0.05%11 May-14 1,013,891,484.78 1,242 18,581,514.63 191 3,098,497.88 43 623,428.69 0.37% 0.08%12 Jun-14 969,457,865.40 1,346 19,851,065.97 231 3,658,518.91 43 677,827.39 0.45% 0.08%13 Jul-14 924,972,984.01 1,337 18,848,984.13 250 3,905,039.09 60 966,143.72 0.53% 0.10%14 Aug-14 881,770,335.52 1,308 18,282,031.27 352 5,071,301.00 76 1,164,434.67 0.71% 0.10%15 Sep-14 839,248,627.22 1,402 19,184,311.93 284 4,238,347.40 77 1,191,318.04 0.65% 0.08%16 Oct-14 797,938,930.71 1,365 18,220,525.52 276 3,971,769.33 75 1,279,180.29 0.66% 0.08%17 Nov-14 762,373,389.68 1,518 19,588,130.80 348 4,980,029.78 90 1,427,873.58 0.84% 0.10%18 Dec-14 723,617,657.43 1,512 19,113,732.54 324 4,583,420.51 99 1,449,199.46 0.83% 0.11%19 Jan-15 686,452,120.81 1,286 15,806,413.73 435 5,845,888.47 88 1,286,198.98 1.04% 0.12%20 Feb-15 651,773,721.50 1,401 17,011,574.27 351 4,606,562.08 76 1,057,745.67 0.87% 0.07%21 Mar-15 615,304,164.15 1,288 15,323,893.25 322 4,178,628.30 75 1,021,110.95 0.85% 0.05%22 Apr-15 580,908,710.91 1,289 14,793,720.82 335 4,321,320.66 76 1,062,109.13 0.93% 0.09%23 May-15 548,283,377.11 1,296 14,411,029.84 342 4,177,420.38 98 1,307,073.13 1.00% 0.07%24 Jun-15 515,427,530.29 1,292 13,920,241.59 354 4,117,154.69 88 1,189,181.76 1.03% 0.08%25 Jul-15 483,092,924.56 1,171 12,279,062.42 368 4,390,237.89 102 1,212,906.55 1.16% 0.11%26 Aug-15 452,945,619.75 1,108 11,014,602.01 451 5,325,093.80 117 1,392,489.79 1.48% 0.12%27 Sep-15 424,033,405.47 1,239 12,203,036.37 374 4,250,613.22 122 1,429,486.88 1.34% 0.13%28 Oct-15 396,433,326.81 1,131 10,621,816.40 389 4,184,287.51 97 1,134,596.86 1.34% 0.14%29 Nov-15 371,146,285.63 1,187 10,726,553.04 397 4,154,147.32 110 1,206,296.28 1.44% 0.17%30 Dec-15 344,917,725.01 1,124 9,934,985.26 380 3,749,491.00 125 1,330,235.34 1.47% 0.20%31 Jan-16 323,653,911.67 1,318 11,046,542.34 516 4,838,396.06 176 1,791,723.84 2.05% 0.17%32 Feb-16 298,107,097.26 1,210 9,639,528.77 392 3,683,336.42 120 1,246,030.33 1.65% 0.13%33 Mar-16 273,901,024.72 1,066 8,205,273.99 368 3,286,697.38 99 957,574.41 1.55% 0.11%34 Apr-16 251,588,046.10 1,013 7,550,538.07 362 3,110,751.07 108 1,009,482.88 1.64% 0.15%35 May-16 230,418,035.44 1,009 7,215,038.42 328 2,695,515.87 127 1,120,164.53 1.66% 0.18%36 Jun-16 210,137,842.49 993 6,830,726.65 356 2,758,997.83 108 975,565.14 1.78% 0.16%37 Jul-16 190,784,090.89 963 6,507,392.63 316 2,313,497.59 135 1,097,817.78 1.79% 0.15%38 Aug-16 172,044,498.04 834 5,249,577.17 395 2,749,812.05 109 862,038.73 2.10% 0.14%39 Sep-16 155,008,670.11 867 5,257,177.54 317 2,170,845.87 122 909,956.97 1.99% 0.17%40 Oct-16 138,779,895.15 806 4,571,200.21 291 1,969,042.87 119 810,296.05 2.00% 0.16%41 Nov-16 - - - - - - -
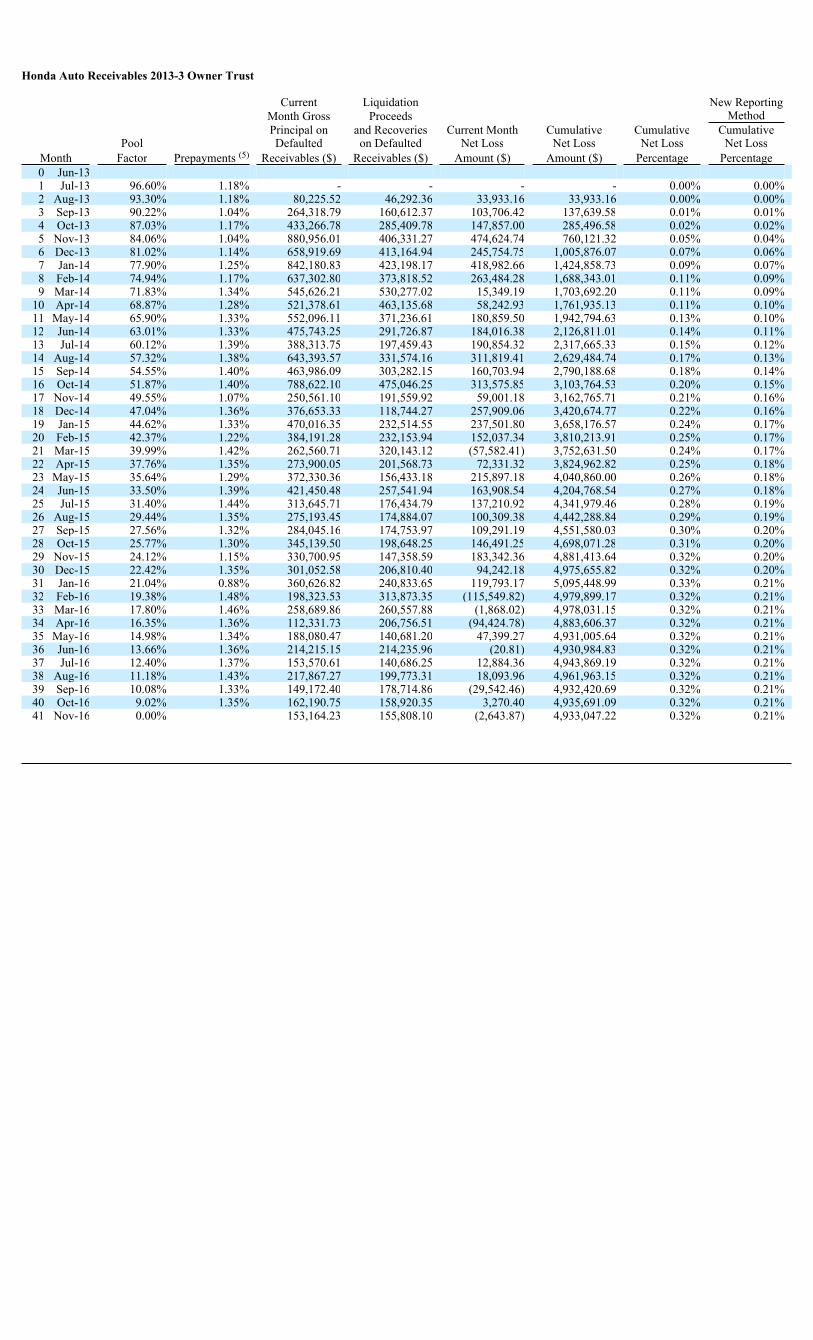
Honda Auto Receivables 2013-3 Owner Trust
Current Liquidation New ReportingMonth Gross Proceeds MethodPrincipal on and Recoveries Current Month Cumulative Cumulative Cumulative
Pool Defaulted on Defaulted Net Loss Net Loss Net Loss Net LossMonth Factor Prepayments (5) Receivables ($) Receivables ($) Amount ($) Amount ($) Percentage Percentage0 Jun-131 Jul-13 96.60% 1.18% - - - - 0.00% 0.00%2 Aug-13 93.30% 1.18% 80,225.52 46,292.36 33,933.16 33,933.16 0.00% 0.00%3 Sep-13 90.22% 1.04% 264,318.79 160,612.37 103,706.42 137,639.58 0.01% 0.01%4 Oct-13 87.03% 1.17% 433,266.78 285,409.78 147,857.00 285,496.58 0.02% 0.02%5 Nov-13 84.06% 1.04% 880,956.01 406,331.27 474,624.74 760,121.32 0.05% 0.04%6 Dec-13 81.02% 1.14% 658,919.69 413,164.94 245,754.75 1,005,876.07 0.07% 0.06%7 Jan-14 77.90% 1.25% 842,180.83 423,198.17 418,982.66 1,424,858.73 0.09% 0.07%8 Feb-14 74.94% 1.17% 637,302.80 373,818.52 263,484.28 1,688,343.01 0.11% 0.09%9 Mar-14 71.83% 1.34% 545,626.21 530,277.02 15,349.19 1,703,692.20 0.11% 0.09%
10 Apr-14 68.87% 1.28% 521,378.61 463,135.68 58,242.93 1,761,935.13 0.11% 0.10%11 May-14 65.90% 1.33% 552,096.11 371,236.61 180,859.50 1,942,794.63 0.13% 0.10%12 Jun-14 63.01% 1.33% 475,743.25 291,726.87 184,016.38 2,126,811.01 0.14% 0.11%13 Jul-14 60.12% 1.39% 388,313.75 197,459.43 190,854.32 2,317,665.33 0.15% 0.12%14 Aug-14 57.32% 1.38% 643,393.57 331,574.16 311,819.41 2,629,484.74 0.17% 0.13%15 Sep-14 54.55% 1.40% 463,986.09 303,282.15 160,703.94 2,790,188.68 0.18% 0.14%16 Oct-14 51.87% 1.40% 788,622.10 475,046.25 313,575.85 3,103,764.53 0.20% 0.15%17 Nov-14 49.55% 1.07% 250,561.10 191,559.92 59,001.18 3,162,765.71 0.21% 0.16%18 Dec-14 47.04% 1.36% 376,653.33 118,744.27 257,909.06 3,420,674.77 0.22% 0.16%19 Jan-15 44.62% 1.33% 470,016.35 232,514.55 237,501.80 3,658,176.57 0.24% 0.17%20 Feb-15 42.37% 1.22% 384,191.28 232,153.94 152,037.34 3,810,213.91 0.25% 0.17%21 Mar-15 39.99% 1.42% 262,560.71 320,143.12 (57,582.41) 3,752,631.50 0.24% 0.17%22 Apr-15 37.76% 1.35% 273,900.05 201,568.73 72,331.32 3,824,962.82 0.25% 0.18%23 May-15 35.64% 1.29% 372,330.36 156,433.18 215,897.18 4,040,860.00 0.26% 0.18%24 Jun-15 33.50% 1.39% 421,450.48 257,541.94 163,908.54 4,204,768.54 0.27% 0.18%25 Jul-15 31.40% 1.44% 313,645.71 176,434.79 137,210.92 4,341,979.46 0.28% 0.19%26 Aug-15 29.44% 1.35% 275,193.45 174,884.07 100,309.38 4,442,288.84 0.29% 0.19%27 Sep-15 27.56% 1.32% 284,045.16 174,753.97 109,291.19 4,551,580.03 0.30% 0.20%28 Oct-15 25.77% 1.30% 345,139.50 198,648.25 146,491.25 4,698,071.28 0.31% 0.20%29 Nov-15 24.12% 1.15% 330,700.95 147,358.59 183,342.36 4,881,413.64 0.32% 0.20%30 Dec-15 22.42% 1.35% 301,052.58 206,810.40 94,242.18 4,975,655.82 0.32% 0.20%31 Jan-16 21.04% 0.88% 360,626.82 240,833.65 119,793.17 5,095,448.99 0.33% 0.21%32 Feb-16 19.38% 1.48% 198,323.53 313,873.35 (115,549.82) 4,979,899.17 0.32% 0.21%33 Mar-16 17.80% 1.46% 258,689.86 260,557.88 (1,868.02) 4,978,031.15 0.32% 0.21%34 Apr-16 16.35% 1.36% 112,331.73 206,756.51 (94,424.78) 4,883,606.37 0.32% 0.21%35 May-16 14.98% 1.34% 188,080.47 140,681.20 47,399.27 4,931,005.64 0.32% 0.21%36 Jun-16 13.66% 1.36% 214,215.15 214,235.96 (20.81) 4,930,984.83 0.32% 0.21%37 Jul-16 12.40% 1.37% 153,570.61 140,686.25 12,884.36 4,943,869.19 0.32% 0.21%38 Aug-16 11.18% 1.43% 217,867.27 199,773.31 18,093.96 4,961,963.15 0.32% 0.21%39 Sep-16 10.08% 1.33% 149,172.40 178,714.86 (29,542.46) 4,932,420.69 0.32% 0.21%40 Oct-16 9.02% 1.35% 162,190.75 158,920.35 3,270.40 4,935,691.09 0.32% 0.21%41 Nov-16 0.00% 153,164.23 155,808.10 (2,643.87) 4,933,047.22 0.32% 0.21%
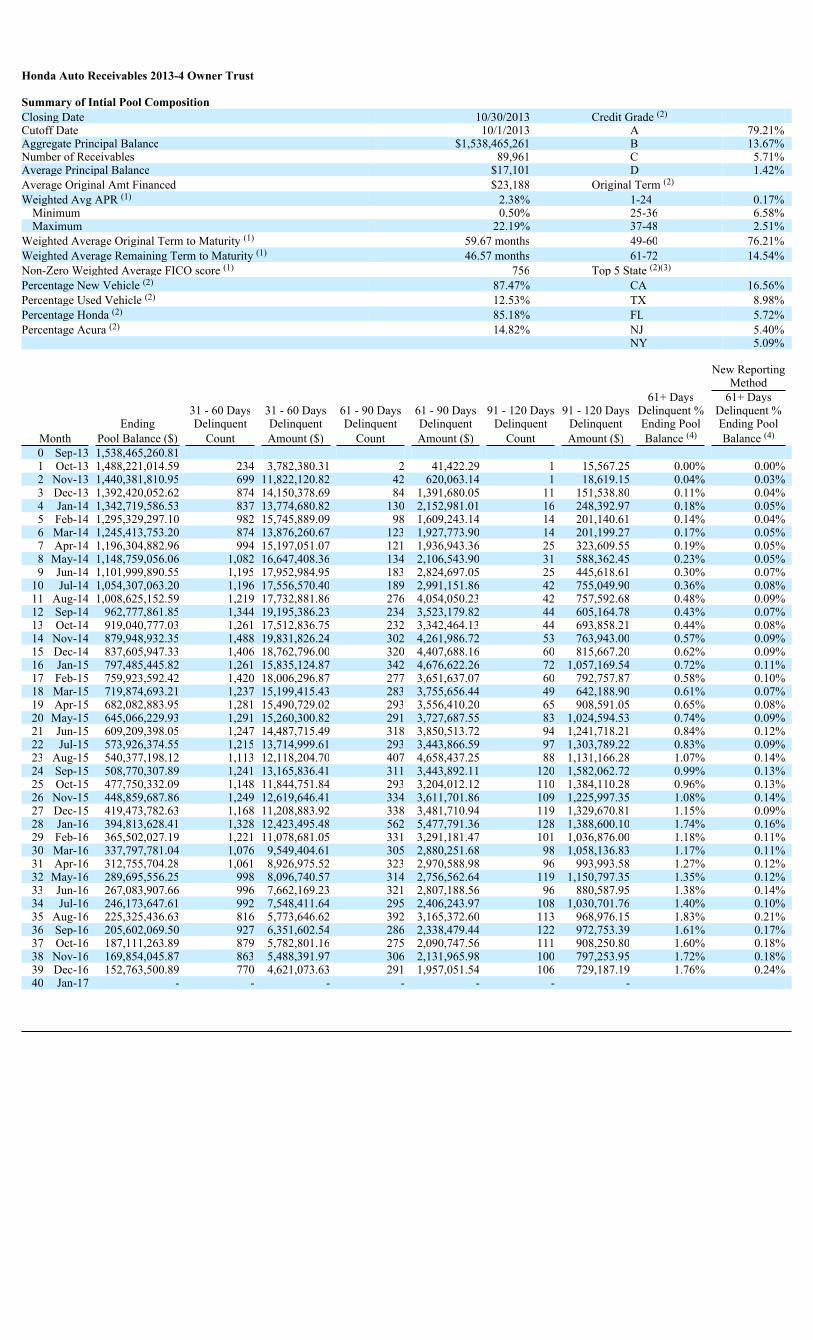
Honda Auto Receivables 2013-4 Owner Trust
Summary of Intial Pool CompositionClosing Date 10/30/2013 Credit Grade (2)
Cutoff Date 10/1/2013 A 79.21%Aggregate Principal Balance $1,538,465,261 B 13.67%Number of Receivables 89,961 C 5.71%Average Principal Balance $17,101 D 1.42%Average Original Amt Financed $23,188 Original Term (2)
Weighted Avg APR (1) 2.38% 1-24 0.17%Minimum 0.50% 25-36 6.58%Maximum 22.19% 37-48 2.51%
Weighted Average Original Term to Maturity (1) 59.67 months 49-60 76.21%Weighted Average Remaining Term to Maturity (1) 46.57 months 61-72 14.54%Non-Zero Weighted Average FICO score (1) 756 Top 5 State (2)(3)
Percentage New Vehicle (2) 87.47% CA 16.56%Percentage Used Vehicle (2) 12.53% TX 8.98%Percentage Honda (2) 85.18% FL 5.72%Percentage Acura (2) 14.82% NJ 5.40%
NY 5.09%
New ReportingMethod
61+ Days 61+ Days31 - 60 Days 31 - 60 Days 61 - 90 Days 61 - 90 Days 91 - 120 Days 91 - 120 Days Delinquent % Delinquent %
Ending Delinquent Delinquent Delinquent Delinquent Delinquent Delinquent Ending Pool Ending PoolMonth Pool Balance ($) Count Amount ($) Count Amount ($) Count Amount ($) Balance (4) Balance (4)
0 Sep-13 1,538,465,260.811 Oct-13 1,488,221,014.59 234 3,782,380.31 2 41,422.29 1 15,567.25 0.00% 0.00%2 Nov-13 1,440,381,810.95 699 11,822,120.82 42 620,063.14 1 18,619.15 0.04% 0.03%3 Dec-13 1,392,420,052.62 874 14,150,378.69 84 1,391,680.05 11 151,538.80 0.11% 0.04%4 Jan-14 1,342,719,586.53 837 13,774,680.82 130 2,152,981.01 16 248,392.97 0.18% 0.05%5 Feb-14 1,295,329,297.10 982 15,745,889.09 98 1,609,243.14 14 201,140.61 0.14% 0.04%6 Mar-14 1,245,413,753.20 874 13,876,260.67 123 1,927,773.90 14 201,199.27 0.17% 0.05%7 Apr-14 1,196,304,882.96 994 15,197,051.07 121 1,936,943.36 25 323,609.55 0.19% 0.05%8 May-14 1,148,759,056.06 1,082 16,647,408.36 134 2,106,543.90 31 588,362.45 0.23% 0.05%9 Jun-14 1,101,999,890.55 1,195 17,952,984.95 183 2,824,697.05 25 445,618.61 0.30% 0.07%
10 Jul-14 1,054,307,063.20 1,196 17,556,570.40 189 2,991,151.86 42 755,049.90 0.36% 0.08%11 Aug-14 1,008,625,152.59 1,219 17,732,881.86 276 4,054,050.23 42 757,592.68 0.48% 0.09%12 Sep-14 962,777,861.85 1,344 19,195,386.23 234 3,523,179.82 44 605,164.78 0.43% 0.07%13 Oct-14 919,040,777.03 1,261 17,512,836.75 232 3,342,464.13 44 693,858.21 0.44% 0.08%14 Nov-14 879,948,932.35 1,488 19,831,826.24 302 4,261,986.72 53 763,943.00 0.57% 0.09%15 Dec-14 837,605,947.33 1,406 18,762,796.00 320 4,407,688.16 60 815,667.20 0.62% 0.09%16 Jan-15 797,485,445.82 1,261 15,835,124.87 342 4,676,622.26 72 1,057,169.54 0.72% 0.11%17 Feb-15 759,923,592.42 1,420 18,006,296.87 277 3,651,637.07 60 792,757.87 0.58% 0.10%18 Mar-15 719,874,693.21 1,237 15,199,415.43 283 3,755,656.44 49 642,188.90 0.61% 0.07%19 Apr-15 682,082,883.95 1,281 15,490,729.02 293 3,556,410.20 65 908,591.05 0.65% 0.08%20 May-15 645,066,229.93 1,291 15,260,300.82 291 3,727,687.55 83 1,024,594.53 0.74% 0.09%21 Jun-15 609,209,398.05 1,247 14,487,715.49 318 3,850,513.72 94 1,241,718.21 0.84% 0.12%22 Jul-15 573,926,374.55 1,215 13,714,999.61 293 3,443,866.59 97 1,303,789.22 0.83% 0.09%23 Aug-15 540,377,198.12 1,113 12,118,204.70 407 4,658,437.25 88 1,131,166.28 1.07% 0.14%24 Sep-15 508,770,307.89 1,241 13,165,836.41 311 3,443,892.11 120 1,582,062.72 0.99% 0.13%25 Oct-15 477,750,332.09 1,148 11,844,751.84 293 3,204,012.12 110 1,384,110.28 0.96% 0.13%26 Nov-15 448,859,687.86 1,249 12,619,646.41 334 3,611,701.86 109 1,225,997.35 1.08% 0.14%27 Dec-15 419,473,782.63 1,168 11,208,883.92 338 3,481,710.94 119 1,329,670.81 1.15% 0.09%28 Jan-16 394,813,628.41 1,328 12,423,495.48 562 5,477,791.36 128 1,388,600.10 1.74% 0.16%29 Feb-16 365,502,027.19 1,221 11,078,681.05 331 3,291,181.47 101 1,036,876.00 1.18% 0.11%30 Mar-16 337,797,781.04 1,076 9,549,404.61 305 2,880,251.68 98 1,058,136.83 1.17% 0.11%31 Apr-16 312,755,704.28 1,061 8,926,975.52 323 2,970,588.98 96 993,993.58 1.27% 0.12%32 May-16 289,695,556.25 998 8,096,740.57 314 2,756,562.64 119 1,150,797.35 1.35% 0.12%33 Jun-16 267,083,907.66 996 7,662,169.23 321 2,807,188.56 96 880,587.95 1.38% 0.14%34 Jul-16 246,173,647.61 992 7,548,411.64 295 2,406,243.97 108 1,030,701.76 1.40% 0.10%35 Aug-16 225,325,436.63 816 5,773,646.62 392 3,165,372.60 113 968,976.15 1.83% 0.21%36 Sep-16 205,602,069.50 927 6,351,602.54 286 2,338,479.44 122 972,753.39 1.61% 0.17%37 Oct-16 187,111,263.89 879 5,782,801.16 275 2,090,747.56 111 908,250.80 1.60% 0.18%38 Nov-16 169,854,045.87 863 5,488,391.97 306 2,131,965.98 100 797,253.95 1.72% 0.18%39 Dec-16 152,763,500.89 770 4,621,073.63 291 1,957,051.54 106 729,187.19 1.76% 0.24%40 Jan-17 - - - - - - -
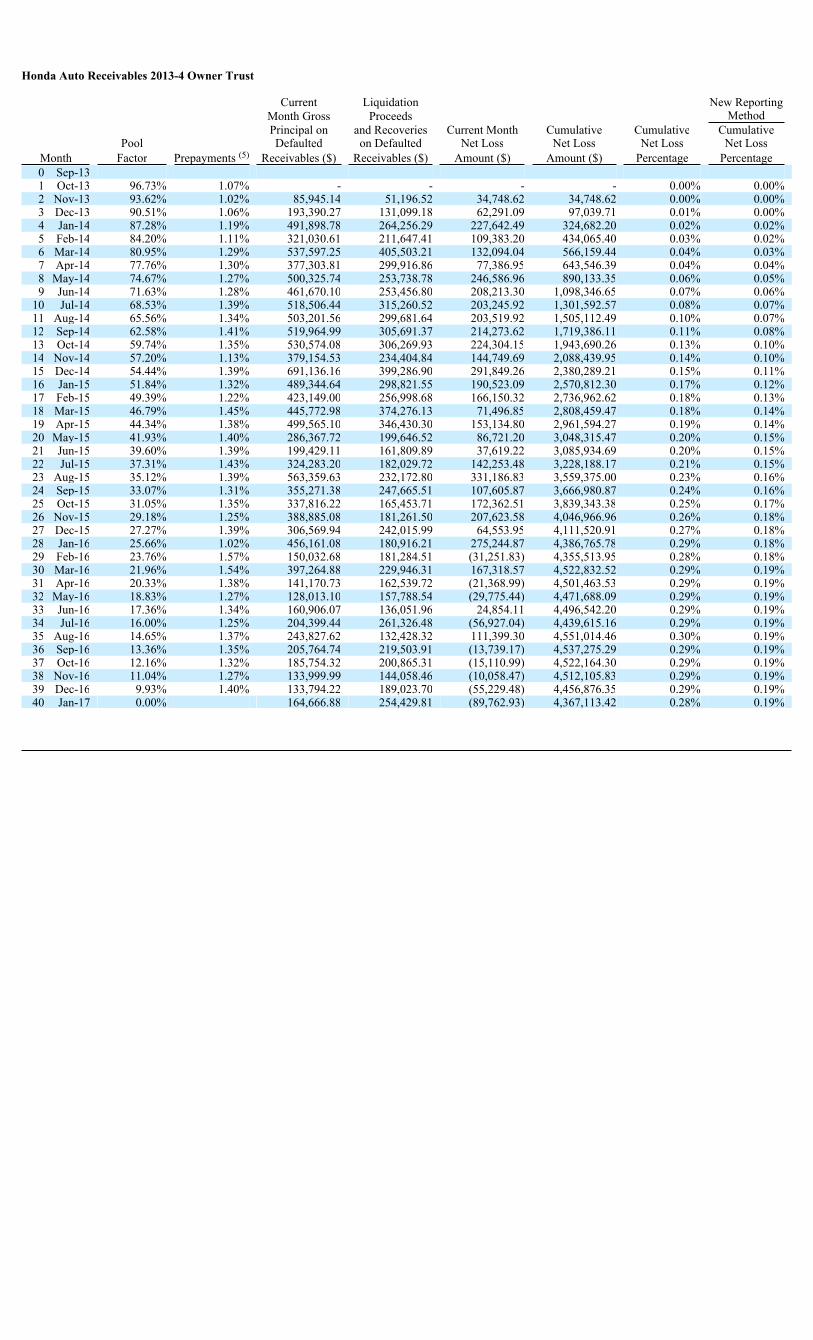
Honda Auto Receivables 2013-4 Owner Trust
Current Liquidation New ReportingMonth Gross Proceeds MethodPrincipal on and Recoveries Current Month Cumulative Cumulative Cumulative
Pool Defaulted on Defaulted Net Loss Net Loss Net Loss Net LossMonth Factor Prepayments (5) Receivables ($) Receivables ($) Amount ($) Amount ($) Percentage Percentage0 Sep-131 Oct-13 96.73% 1.07% - - - - 0.00% 0.00%2 Nov-13 93.62% 1.02% 85,945.14 51,196.52 34,748.62 34,748.62 0.00% 0.00%3 Dec-13 90.51% 1.06% 193,390.27 131,099.18 62,291.09 97,039.71 0.01% 0.00%4 Jan-14 87.28% 1.19% 491,898.78 264,256.29 227,642.49 324,682.20 0.02% 0.02%5 Feb-14 84.20% 1.11% 321,030.61 211,647.41 109,383.20 434,065.40 0.03% 0.02%6 Mar-14 80.95% 1.29% 537,597.25 405,503.21 132,094.04 566,159.44 0.04% 0.03%7 Apr-14 77.76% 1.30% 377,303.81 299,916.86 77,386.95 643,546.39 0.04% 0.04%8 May-14 74.67% 1.27% 500,325.74 253,738.78 246,586.96 890,133.35 0.06% 0.05%9 Jun-14 71.63% 1.28% 461,670.10 253,456.80 208,213.30 1,098,346.65 0.07% 0.06%
10 Jul-14 68.53% 1.39% 518,506.44 315,260.52 203,245.92 1,301,592.57 0.08% 0.07%11 Aug-14 65.56% 1.34% 503,201.56 299,681.64 203,519.92 1,505,112.49 0.10% 0.07%12 Sep-14 62.58% 1.41% 519,964.99 305,691.37 214,273.62 1,719,386.11 0.11% 0.08%13 Oct-14 59.74% 1.35% 530,574.08 306,269.93 224,304.15 1,943,690.26 0.13% 0.10%14 Nov-14 57.20% 1.13% 379,154.53 234,404.84 144,749.69 2,088,439.95 0.14% 0.10%15 Dec-14 54.44% 1.39% 691,136.16 399,286.90 291,849.26 2,380,289.21 0.15% 0.11%16 Jan-15 51.84% 1.32% 489,344.64 298,821.55 190,523.09 2,570,812.30 0.17% 0.12%17 Feb-15 49.39% 1.22% 423,149.00 256,998.68 166,150.32 2,736,962.62 0.18% 0.13%18 Mar-15 46.79% 1.45% 445,772.98 374,276.13 71,496.85 2,808,459.47 0.18% 0.14%19 Apr-15 44.34% 1.38% 499,565.10 346,430.30 153,134.80 2,961,594.27 0.19% 0.14%20 May-15 41.93% 1.40% 286,367.72 199,646.52 86,721.20 3,048,315.47 0.20% 0.15%21 Jun-15 39.60% 1.39% 199,429.11 161,809.89 37,619.22 3,085,934.69 0.20% 0.15%22 Jul-15 37.31% 1.43% 324,283.20 182,029.72 142,253.48 3,228,188.17 0.21% 0.15%23 Aug-15 35.12% 1.39% 563,359.63 232,172.80 331,186.83 3,559,375.00 0.23% 0.16%24 Sep-15 33.07% 1.31% 355,271.38 247,665.51 107,605.87 3,666,980.87 0.24% 0.16%25 Oct-15 31.05% 1.35% 337,816.22 165,453.71 172,362.51 3,839,343.38 0.25% 0.17%26 Nov-15 29.18% 1.25% 388,885.08 181,261.50 207,623.58 4,046,966.96 0.26% 0.18%27 Dec-15 27.27% 1.39% 306,569.94 242,015.99 64,553.95 4,111,520.91 0.27% 0.18%28 Jan-16 25.66% 1.02% 456,161.08 180,916.21 275,244.87 4,386,765.78 0.29% 0.18%29 Feb-16 23.76% 1.57% 150,032.68 181,284.51 (31,251.83) 4,355,513.95 0.28% 0.18%30 Mar-16 21.96% 1.54% 397,264.88 229,946.31 167,318.57 4,522,832.52 0.29% 0.19%31 Apr-16 20.33% 1.38% 141,170.73 162,539.72 (21,368.99) 4,501,463.53 0.29% 0.19%32 May-16 18.83% 1.27% 128,013.10 157,788.54 (29,775.44) 4,471,688.09 0.29% 0.19%33 Jun-16 17.36% 1.34% 160,906.07 136,051.96 24,854.11 4,496,542.20 0.29% 0.19%34 Jul-16 16.00% 1.25% 204,399.44 261,326.48 (56,927.04) 4,439,615.16 0.29% 0.19%35 Aug-16 14.65% 1.37% 243,827.62 132,428.32 111,399.30 4,551,014.46 0.30% 0.19%36 Sep-16 13.36% 1.35% 205,764.74 219,503.91 (13,739.17) 4,537,275.29 0.29% 0.19%37 Oct-16 12.16% 1.32% 185,754.32 200,865.31 (15,110.99) 4,522,164.30 0.29% 0.19%38 Nov-16 11.04% 1.27% 133,999.99 144,058.46 (10,058.47) 4,512,105.83 0.29% 0.19%39 Dec-16 9.93% 1.40% 133,794.22 189,023.70 (55,229.48) 4,456,876.35 0.29% 0.19%40 Jan-17 0.00% 164,666.88 254,429.81 (89,762.93) 4,367,113.42 0.28% 0.19%
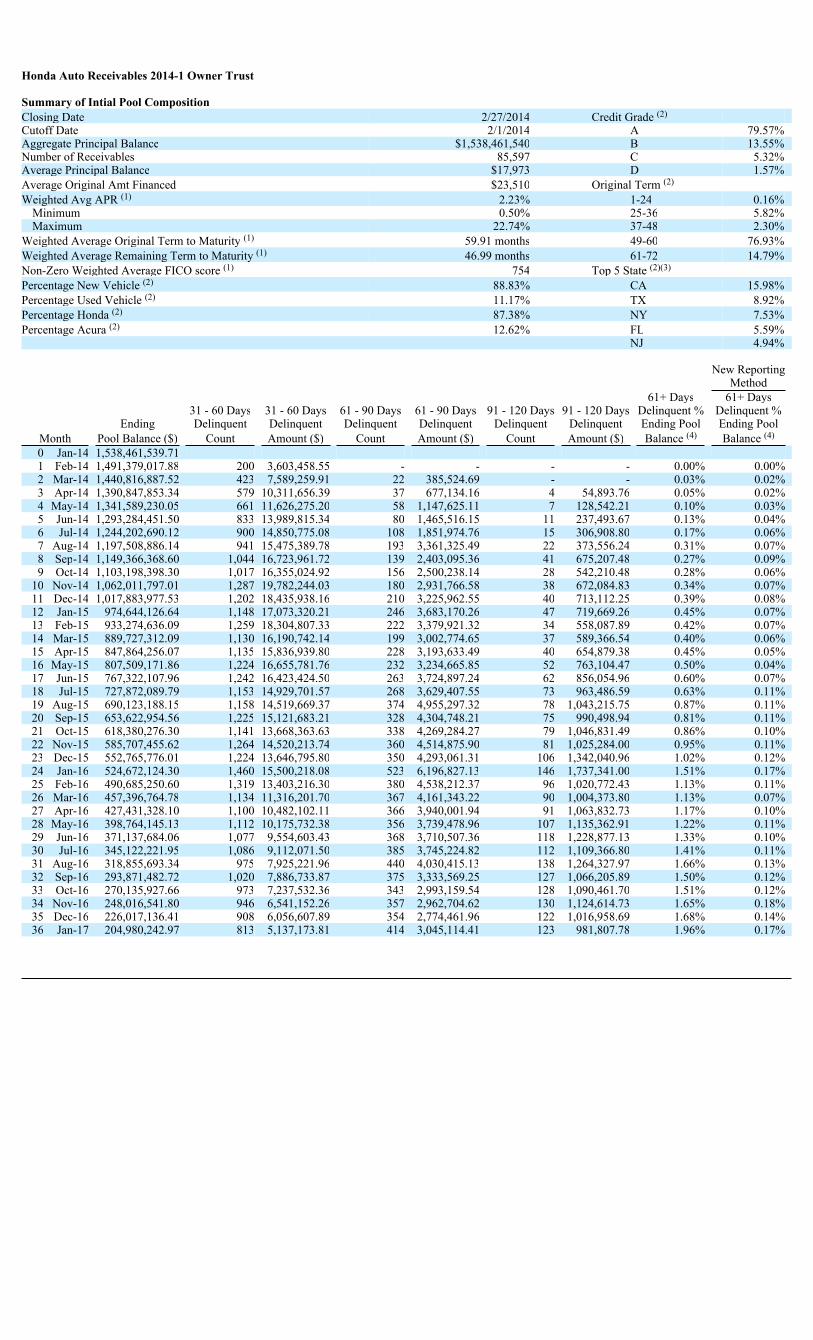
Honda Auto Receivables 2014-1 Owner Trust
Summary of Intial Pool CompositionClosing Date 2/27/2014 Credit Grade (2)
Cutoff Date 2/1/2014 A 79.57%Aggregate Principal Balance $1,538,461,540 B 13.55%Number of Receivables 85,597 C 5.32%Average Principal Balance $17,973 D 1.57%Average Original Amt Financed $23,510 Original Term (2)
Weighted Avg APR (1) 2.23% 1-24 0.16%Minimum 0.50% 25-36 5.82%Maximum 22.74% 37-48 2.30%
Weighted Average Original Term to Maturity (1) 59.91 months 49-60 76.93%Weighted Average Remaining Term to Maturity (1) 46.99 months 61-72 14.79%Non-Zero Weighted Average FICO score (1) 754 Top 5 State (2)(3)
Percentage New Vehicle (2) 88.83% CA 15.98%Percentage Used Vehicle (2) 11.17% TX 8.92%Percentage Honda (2) 87.38% NY 7.53%Percentage Acura (2) 12.62% FL 5.59%
NJ 4.94%
New ReportingMethod
61+ Days 61+ Days31 - 60 Days 31 - 60 Days 61 - 90 Days 61 - 90 Days 91 - 120 Days 91 - 120 Days Delinquent % Delinquent %
Ending Delinquent Delinquent Delinquent Delinquent Delinquent Delinquent Ending Pool Ending PoolMonth Pool Balance ($) Count Amount ($) Count Amount ($) Count Amount ($) Balance (4) Balance (4)
0 Jan-14 1,538,461,539.711 Feb-14 1,491,379,017.88 200 3,603,458.55 - - - - 0.00% 0.00%2 Mar-14 1,440,816,887.52 423 7,589,259.91 22 385,524.69 - - 0.03% 0.02%3 Apr-14 1,390,847,853.34 579 10,311,656.39 37 677,134.16 4 54,893.76 0.05% 0.02%4 May-14 1,341,589,230.05 661 11,626,275.20 58 1,147,625.11 7 128,542.21 0.10% 0.03%5 Jun-14 1,293,284,451.50 833 13,989,815.34 80 1,465,516.15 11 237,493.67 0.13% 0.04%6 Jul-14 1,244,202,690.12 900 14,850,775.08 108 1,851,974.76 15 306,908.80 0.17% 0.06%7 Aug-14 1,197,508,886.14 941 15,475,389.78 193 3,361,325.49 22 373,556.24 0.31% 0.07%8 Sep-14 1,149,366,368.60 1,044 16,723,961.72 139 2,403,095.36 41 675,207.48 0.27% 0.09%9 Oct-14 1,103,198,398.30 1,017 16,355,024.92 156 2,500,238.14 28 542,210.48 0.28% 0.06%
10 Nov-14 1,062,011,797.01 1,287 19,782,244.03 180 2,931,766.58 38 672,084.83 0.34% 0.07%11 Dec-14 1,017,883,977.53 1,202 18,435,938.16 210 3,225,962.55 40 713,112.25 0.39% 0.08%12 Jan-15 974,644,126.64 1,148 17,073,320.21 246 3,683,170.26 47 719,669.26 0.45% 0.07%13 Feb-15 933,274,636.09 1,259 18,304,807.33 222 3,379,921.32 34 558,087.89 0.42% 0.07%14 Mar-15 889,727,312.09 1,130 16,190,742.14 199 3,002,774.65 37 589,366.54 0.40% 0.06%15 Apr-15 847,864,256.07 1,135 15,836,939.80 228 3,193,633.49 40 654,879.38 0.45% 0.05%16 May-15 807,509,171.86 1,224 16,655,781.76 232 3,234,665.85 52 763,104.47 0.50% 0.04%17 Jun-15 767,322,107.96 1,242 16,423,424.50 263 3,724,897.24 62 856,054.96 0.60% 0.07%18 Jul-15 727,872,089.79 1,153 14,929,701.57 268 3,629,407.55 73 963,486.59 0.63% 0.11%19 Aug-15 690,123,188.15 1,158 14,519,669.37 374 4,955,297.32 78 1,043,215.75 0.87% 0.11%20 Sep-15 653,622,954.56 1,225 15,121,683.21 328 4,304,748.21 75 990,498.94 0.81% 0.11%21 Oct-15 618,380,276.30 1,141 13,668,363.63 338 4,269,284.27 79 1,046,831.49 0.86% 0.10%22 Nov-15 585,707,455.62 1,264 14,520,213.74 360 4,514,875.90 81 1,025,284.00 0.95% 0.11%23 Dec-15 552,765,776.01 1,224 13,646,795.80 350 4,293,061.31 106 1,342,040.96 1.02% 0.12%24 Jan-16 524,672,124.30 1,460 15,500,218.08 523 6,196,827.13 146 1,737,341.00 1.51% 0.17%25 Feb-16 490,685,250.60 1,319 13,403,216.30 380 4,538,212.37 96 1,020,772.43 1.13% 0.11%26 Mar-16 457,396,764.78 1,134 11,316,201.70 367 4,161,343.22 90 1,004,373.80 1.13% 0.07%27 Apr-16 427,431,328.10 1,100 10,482,102.11 366 3,940,001.94 91 1,063,832.73 1.17% 0.10%28 May-16 398,764,145.13 1,112 10,175,732.38 356 3,739,478.96 107 1,135,362.91 1.22% 0.11%29 Jun-16 371,137,684.06 1,077 9,554,603.43 368 3,710,507.36 118 1,228,877.13 1.33% 0.10%30 Jul-16 345,122,221.95 1,086 9,112,071.50 385 3,745,224.82 112 1,109,366.80 1.41% 0.11%31 Aug-16 318,855,693.34 975 7,925,221.96 440 4,030,415.13 138 1,264,327.97 1.66% 0.13%32 Sep-16 293,871,482.72 1,020 7,886,733.87 375 3,333,569.25 127 1,066,205.89 1.50% 0.12%33 Oct-16 270,135,927.66 973 7,237,532.36 343 2,993,159.54 128 1,090,461.70 1.51% 0.12%34 Nov-16 248,016,541.80 946 6,541,152.26 357 2,962,704.62 130 1,124,614.73 1.65% 0.18%35 Dec-16 226,017,136.41 908 6,056,607.89 354 2,774,461.96 122 1,016,958.69 1.68% 0.14%36 Jan-17 204,980,242.97 813 5,137,173.81 414 3,045,114.41 123 981,807.78 1.96% 0.17%

Honda Auto Receivables 2014-1 Owner Trust
Current Liquidation New ReportingMonth Gross Proceeds MethodPrincipal on and Recoveries Current Month Cumulative Cumulative Cumulative
Pool Defaulted on Defaulted Net Loss Net Loss Net Loss Net LossMonth Factor Prepayments (5) Receivables ($) Receivables ($) Amount ($) Amount ($) Percentage Percentage0 Jan-141 Feb-14 96.94% 0.92% - - - - 0.00% 0.00%2 Mar-14 93.65% 1.16% 21,215.13 16,732.50 4,482.63 4,482.63 0.00% 0.00%3 Apr-14 90.41% 1.17% 213,000.90 167,396.23 45,604.67 50,087.30 0.00% 0.00%4 May-14 87.20% 1.18% 351,275.18 225,545.87 125,729.31 175,816.61 0.01% 0.01%5 Jun-14 84.06% 1.17% 312,319.31 192,009.29 120,310.02 296,126.63 0.02% 0.02%6 Jul-14 80.87% 1.26% 368,820.75 229,047.03 139,773.72 435,900.35 0.03% 0.02%7 Aug-14 77.84% 1.18% 513,961.19 285,161.69 228,799.50 664,699.85 0.04% 0.04%8 Sep-14 74.71% 1.30% 473,429.64 304,431.34 168,998.30 833,698.15 0.05% 0.04%9 Oct-14 71.71% 1.25% 492,303.77 249,364.07 242,939.70 1,076,637.85 0.07% 0.06%
10 Nov-14 69.03% 1.01% 457,089.87 285,236.32 171,853.55 1,248,491.40 0.08% 0.07%11 Dec-14 66.16% 1.23% 645,948.64 221,165.09 424,783.55 1,673,274.95 0.11% 0.09%12 Jan-15 63.35% 1.24% 558,945.46 299,235.82 259,709.64 1,932,984.59 0.13% 0.10%13 Feb-15 60.66% 1.18% 328,661.40 288,912.71 39,748.69 1,972,733.28 0.13% 0.10%14 Mar-15 57.83% 1.37% 328,940.15 277,945.77 50,994.38 2,023,727.66 0.13% 0.11%15 Apr-15 55.11% 1.33% 258,352.61 115,971.67 142,380.94 2,166,108.60 0.14% 0.11%16 May-15 52.49% 1.30% 294,173.70 127,560.00 166,613.70 2,332,722.30 0.15% 0.12%17 Jun-15 49.88% 1.35% 334,718.67 160,706.15 174,012.52 2,506,734.82 0.16% 0.13%18 Jul-15 47.31% 1.38% 279,641.25 143,125.81 136,515.44 2,643,250.26 0.17% 0.13%19 Aug-15 44.86% 1.33% 464,413.70 298,304.59 166,109.11 2,809,359.37 0.18% 0.13%20 Sep-15 42.49% 1.31% 275,247.31 146,940.42 128,306.89 2,937,666.26 0.19% 0.14%21 Oct-15 40.19% 1.29% 304,509.68 215,484.30 89,025.38 3,026,691.64 0.20% 0.14%22 Nov-15 38.07% 1.16% 353,757.44 186,560.53 167,196.91 3,193,888.55 0.21% 0.15%23 Dec-15 35.93% 1.26% 452,366.95 302,085.77 150,281.18 3,344,169.73 0.22% 0.16%24 Jan-16 34.10% 0.90% 521,684.94 247,714.78 273,970.16 3,618,139.89 0.24% 0.16%25 Feb-16 31.89% 1.51% 301,267.02 198,962.56 102,304.46 3,720,444.35 0.24% 0.16%26 Mar-16 29.73% 1.55% 320,950.32 264,576.03 56,374.29 3,776,818.64 0.25% 0.17%27 Apr-16 27.78% 1.36% 203,992.81 182,895.35 21,097.46 3,797,916.10 0.25% 0.17%28 May-16 25.92% 1.33% 219,566.75 181,193.28 38,373.47 3,836,289.57 0.25% 0.17%29 Jun-16 24.12% 1.33% 198,824.78 206,770.85 (7,946.07) 3,828,343.50 0.25% 0.17%30 Jul-16 22.43% 1.27% 355,723.13 201,149.38 154,573.75 3,982,917.25 0.26% 0.17%31 Aug-16 20.73% 1.41% 235,921.28 180,808.51 55,112.77 4,038,030.02 0.26% 0.18%32 Sep-16 19.10% 1.39% 321,641.81 181,275.97 140,365.84 4,178,395.86 0.27% 0.18%33 Oct-16 17.56% 1.36% 164,241.30 184,519.78 (20,278.48) 4,158,117.38 0.27% 0.18%34 Nov-16 16.12% 1.29% 204,398.26 163,980.43 40,417.83 4,198,535.21 0.27% 0.18%35 Dec-16 14.69% 1.41% 161,506.35 190,426.85 (28,920.50) 4,169,614.71 0.27% 0.18%36 Jan-17 13.32% 1.43% 187,413.98 157,794.73 29,619.25 4,199,233.96 0.27% 0.19%
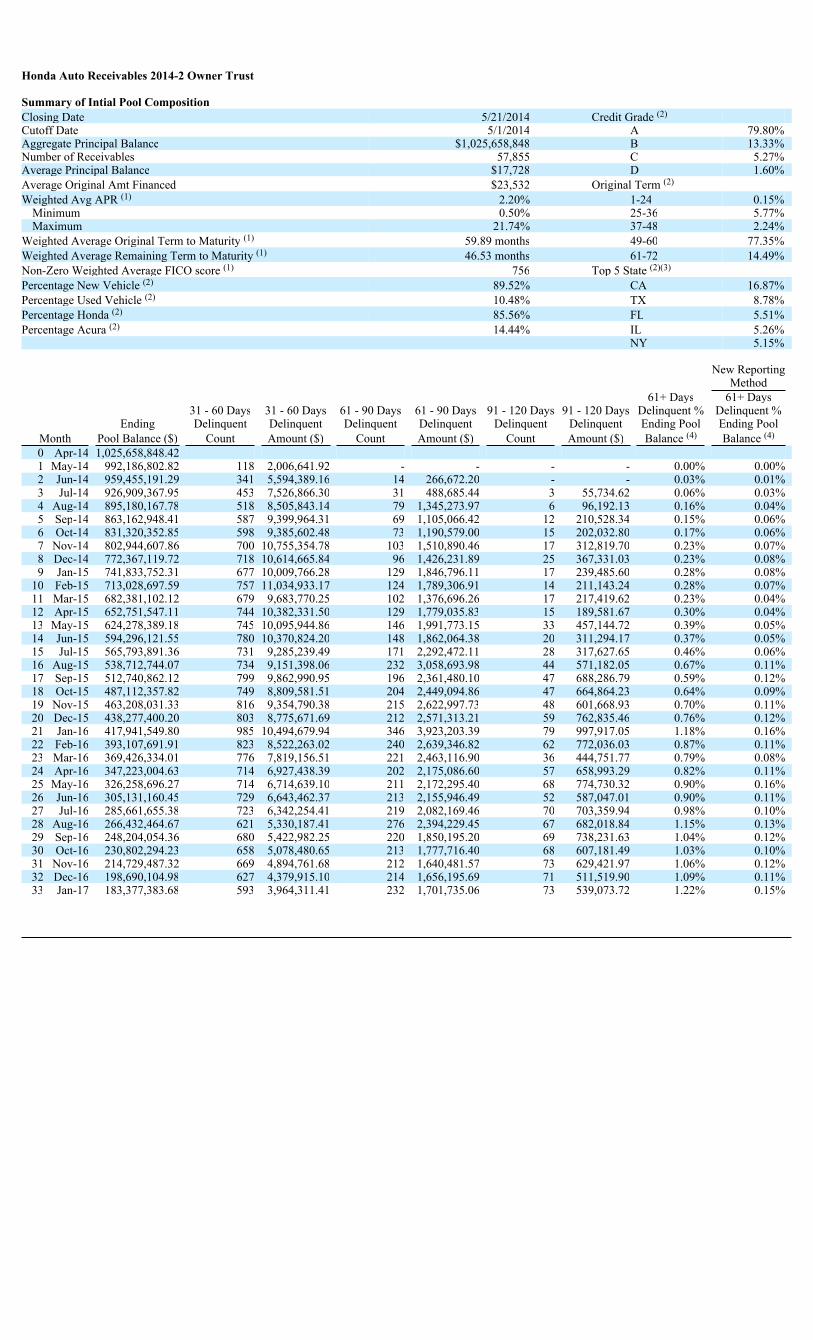
Honda Auto Receivables 2014-2 Owner Trust
Summary of Intial Pool CompositionClosing Date 5/21/2014 Credit Grade (2)
Cutoff Date 5/1/2014 A 79.80%Aggregate Principal Balance $1,025,658,848 B 13.33%Number of Receivables 57,855 C 5.27%Average Principal Balance $17,728 D 1.60%Average Original Amt Financed $23,532 Original Term (2)
Weighted Avg APR (1) 2.20% 1-24 0.15%Minimum 0.50% 25-36 5.77%Maximum 21.74% 37-48 2.24%
Weighted Average Original Term to Maturity (1) 59.89 months 49-60 77.35%Weighted Average Remaining Term to Maturity (1) 46.53 months 61-72 14.49%Non-Zero Weighted Average FICO score (1) 756 Top 5 State (2)(3)
Percentage New Vehicle (2) 89.52% CA 16.87%Percentage Used Vehicle (2) 10.48% TX 8.78%Percentage Honda (2) 85.56% FL 5.51%Percentage Acura (2) 14.44% IL 5.26%
NY 5.15%
New ReportingMethod
61+ Days 61+ Days31 - 60 Days 31 - 60 Days 61 - 90 Days 61 - 90 Days 91 - 120 Days 91 - 120 Days Delinquent % Delinquent %
Ending Delinquent Delinquent Delinquent Delinquent Delinquent Delinquent Ending Pool Ending PoolMonth Pool Balance ($) Count Amount ($) Count Amount ($) Count Amount ($) Balance (4) Balance (4)
0 Apr-14 1,025,658,848.421 May-14 992,186,802.82 118 2,006,641.92 - - - - 0.00% 0.00%2 Jun-14 959,455,191.29 341 5,594,389.16 14 266,672.20 - - 0.03% 0.01%3 Jul-14 926,909,367.95 453 7,526,866.30 31 488,685.44 3 55,734.62 0.06% 0.03%4 Aug-14 895,180,167.78 518 8,505,843.14 79 1,345,273.97 6 96,192.13 0.16% 0.04%5 Sep-14 863,162,948.41 587 9,399,964.31 69 1,105,066.42 12 210,528.34 0.15% 0.06%6 Oct-14 831,320,352.85 598 9,385,602.48 73 1,190,579.00 15 202,032.80 0.17% 0.06%7 Nov-14 802,944,607.86 700 10,755,354.78 103 1,510,890.46 17 312,819.70 0.23% 0.07%8 Dec-14 772,367,119.72 718 10,614,665.84 96 1,426,231.89 25 367,331.03 0.23% 0.08%9 Jan-15 741,833,752.31 677 10,009,766.28 129 1,846,796.11 17 239,485.60 0.28% 0.08%
10 Feb-15 713,028,697.59 757 11,034,933.17 124 1,789,306.91 14 211,143.24 0.28% 0.07%11 Mar-15 682,381,102.12 679 9,683,770.25 102 1,376,696.26 17 217,419.62 0.23% 0.04%12 Apr-15 652,751,547.11 744 10,382,331.50 129 1,779,035.83 15 189,581.67 0.30% 0.04%13 May-15 624,278,389.18 745 10,095,944.86 146 1,991,773.15 33 457,144.72 0.39% 0.05%14 Jun-15 594,296,121.55 780 10,370,824.20 148 1,862,064.38 20 311,294.17 0.37% 0.05%15 Jul-15 565,793,891.36 731 9,285,239.49 171 2,292,472.11 28 317,627.65 0.46% 0.06%16 Aug-15 538,712,744.07 734 9,151,398.06 232 3,058,693.98 44 571,182.05 0.67% 0.11%17 Sep-15 512,740,862.12 799 9,862,990.95 196 2,361,480.10 47 688,286.79 0.59% 0.12%18 Oct-15 487,112,357.82 749 8,809,581.51 204 2,449,094.86 47 664,864.23 0.64% 0.09%19 Nov-15 463,208,031.33 816 9,354,790.38 215 2,622,997.73 48 601,668.93 0.70% 0.11%20 Dec-15 438,277,400.20 803 8,775,671.69 212 2,571,313.21 59 762,835.46 0.76% 0.12%21 Jan-16 417,941,549.80 985 10,494,679.94 346 3,923,203.39 79 997,917.05 1.18% 0.16%22 Feb-16 393,107,691.91 823 8,522,263.02 240 2,639,346.82 62 772,036.03 0.87% 0.11%23 Mar-16 369,426,334.01 776 7,819,156.51 221 2,463,116.90 36 444,751.77 0.79% 0.08%24 Apr-16 347,223,004.63 714 6,927,438.39 202 2,175,086.60 57 658,993.29 0.82% 0.11%25 May-16 326,258,696.27 714 6,714,639.10 211 2,172,295.40 68 774,730.32 0.90% 0.16%26 Jun-16 305,131,160.45 729 6,643,462.37 213 2,155,946.49 52 587,047.01 0.90% 0.11%27 Jul-16 285,661,655.38 723 6,342,254.41 219 2,082,169.46 70 703,359.94 0.98% 0.10%28 Aug-16 266,432,464.67 621 5,330,187.41 276 2,394,229.45 67 682,018.84 1.15% 0.13%29 Sep-16 248,204,054.36 680 5,422,982.25 220 1,850,195.20 69 738,231.63 1.04% 0.12%30 Oct-16 230,802,294.23 658 5,078,480.65 213 1,777,716.40 68 607,181.49 1.03% 0.10%31 Nov-16 214,729,487.32 669 4,894,761.68 212 1,640,481.57 73 629,421.97 1.06% 0.12%32 Dec-16 198,690,104.98 627 4,379,915.10 214 1,656,195.69 71 511,519.90 1.09% 0.11%33 Jan-17 183,377,383.68 593 3,964,311.41 232 1,701,735.06 73 539,073.72 1.22% 0.15%
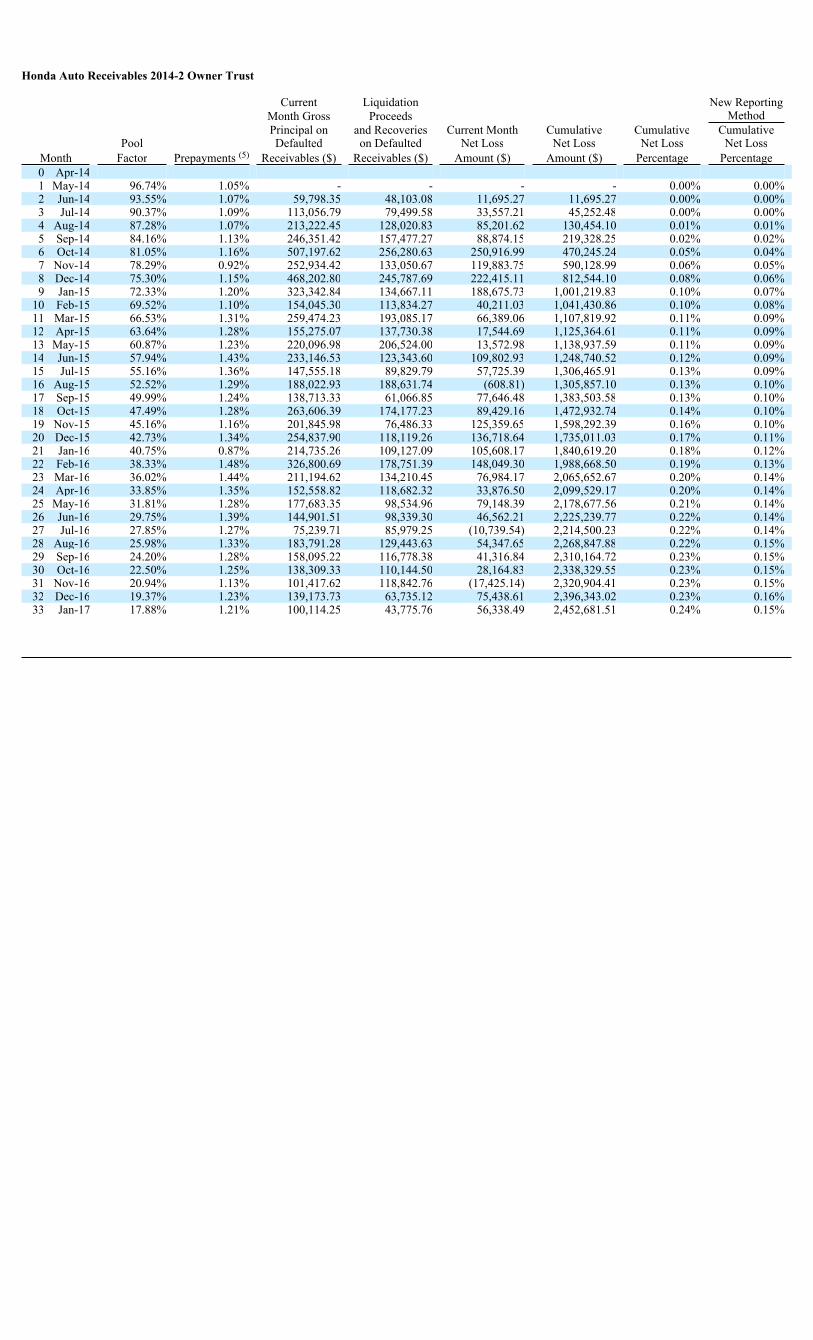
Honda Auto Receivables 2014-2 Owner Trust
Current Liquidation New ReportingMonth Gross Proceeds MethodPrincipal on and Recoveries Current Month Cumulative Cumulative Cumulative
Pool Defaulted on Defaulted Net Loss Net Loss Net Loss Net LossMonth Factor Prepayments (5) Receivables ($) Receivables ($) Amount ($) Amount ($) Percentage Percentage0 Apr-141 May-14 96.74% 1.05% - - - - 0.00% 0.00%2 Jun-14 93.55% 1.07% 59,798.35 48,103.08 11,695.27 11,695.27 0.00% 0.00%3 Jul-14 90.37% 1.09% 113,056.79 79,499.58 33,557.21 45,252.48 0.00% 0.00%4 Aug-14 87.28% 1.07% 213,222.45 128,020.83 85,201.62 130,454.10 0.01% 0.01%5 Sep-14 84.16% 1.13% 246,351.42 157,477.27 88,874.15 219,328.25 0.02% 0.02%6 Oct-14 81.05% 1.16% 507,197.62 256,280.63 250,916.99 470,245.24 0.05% 0.04%7 Nov-14 78.29% 0.92% 252,934.42 133,050.67 119,883.75 590,128.99 0.06% 0.05%8 Dec-14 75.30% 1.15% 468,202.80 245,787.69 222,415.11 812,544.10 0.08% 0.06%9 Jan-15 72.33% 1.20% 323,342.84 134,667.11 188,675.73 1,001,219.83 0.10% 0.07%
10 Feb-15 69.52% 1.10% 154,045.30 113,834.27 40,211.03 1,041,430.86 0.10% 0.08%11 Mar-15 66.53% 1.31% 259,474.23 193,085.17 66,389.06 1,107,819.92 0.11% 0.09%12 Apr-15 63.64% 1.28% 155,275.07 137,730.38 17,544.69 1,125,364.61 0.11% 0.09%13 May-15 60.87% 1.23% 220,096.98 206,524.00 13,572.98 1,138,937.59 0.11% 0.09%14 Jun-15 57.94% 1.43% 233,146.53 123,343.60 109,802.93 1,248,740.52 0.12% 0.09%15 Jul-15 55.16% 1.36% 147,555.18 89,829.79 57,725.39 1,306,465.91 0.13% 0.09%16 Aug-15 52.52% 1.29% 188,022.93 188,631.74 (608.81) 1,305,857.10 0.13% 0.10%17 Sep-15 49.99% 1.24% 138,713.33 61,066.85 77,646.48 1,383,503.58 0.13% 0.10%18 Oct-15 47.49% 1.28% 263,606.39 174,177.23 89,429.16 1,472,932.74 0.14% 0.10%19 Nov-15 45.16% 1.16% 201,845.98 76,486.33 125,359.65 1,598,292.39 0.16% 0.10%20 Dec-15 42.73% 1.34% 254,837.90 118,119.26 136,718.64 1,735,011.03 0.17% 0.11%21 Jan-16 40.75% 0.87% 214,735.26 109,127.09 105,608.17 1,840,619.20 0.18% 0.12%22 Feb-16 38.33% 1.48% 326,800.69 178,751.39 148,049.30 1,988,668.50 0.19% 0.13%23 Mar-16 36.02% 1.44% 211,194.62 134,210.45 76,984.17 2,065,652.67 0.20% 0.14%24 Apr-16 33.85% 1.35% 152,558.82 118,682.32 33,876.50 2,099,529.17 0.20% 0.14%25 May-16 31.81% 1.28% 177,683.35 98,534.96 79,148.39 2,178,677.56 0.21% 0.14%26 Jun-16 29.75% 1.39% 144,901.51 98,339.30 46,562.21 2,225,239.77 0.22% 0.14%27 Jul-16 27.85% 1.27% 75,239.71 85,979.25 (10,739.54) 2,214,500.23 0.22% 0.14%28 Aug-16 25.98% 1.33% 183,791.28 129,443.63 54,347.65 2,268,847.88 0.22% 0.15%29 Sep-16 24.20% 1.28% 158,095.22 116,778.38 41,316.84 2,310,164.72 0.23% 0.15%30 Oct-16 22.50% 1.25% 138,309.33 110,144.50 28,164.83 2,338,329.55 0.23% 0.15%31 Nov-16 20.94% 1.13% 101,417.62 118,842.76 (17,425.14) 2,320,904.41 0.23% 0.15%32 Dec-16 19.37% 1.23% 139,173.73 63,735.12 75,438.61 2,396,343.02 0.23% 0.16%33 Jan-17 17.88% 1.21% 100,114.25 43,775.76 56,338.49 2,452,681.51 0.24% 0.15%
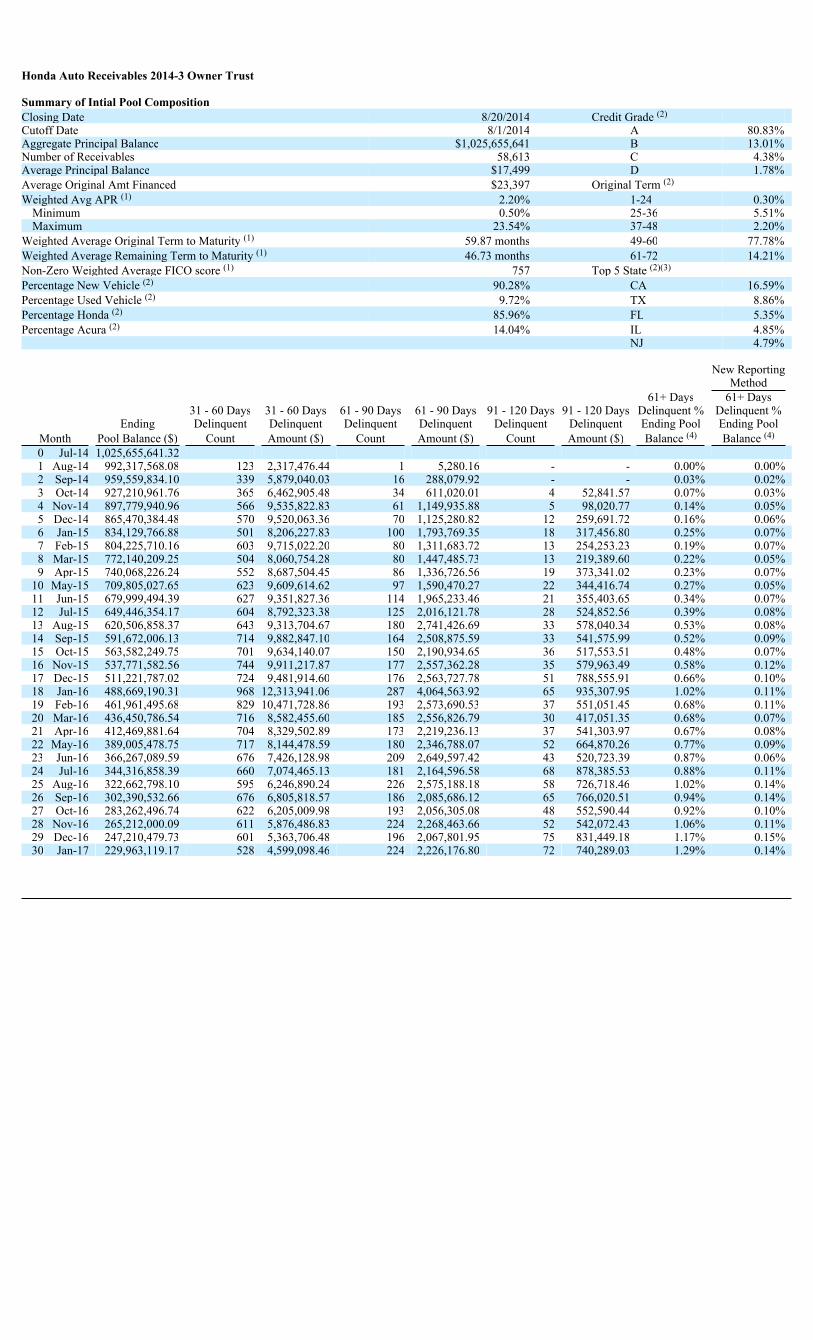
Honda Auto Receivables 2014-3 Owner Trust
Summary of Intial Pool CompositionClosing Date 8/20/2014 Credit Grade (2)
Cutoff Date 8/1/2014 A 80.83%Aggregate Principal Balance $1,025,655,641 B 13.01%Number of Receivables 58,613 C 4.38%Average Principal Balance $17,499 D 1.78%Average Original Amt Financed $23,397 Original Term (2)
Weighted Avg APR (1) 2.20% 1-24 0.30%Minimum 0.50% 25-36 5.51%Maximum 23.54% 37-48 2.20%
Weighted Average Original Term to Maturity (1) 59.87 months 49-60 77.78%Weighted Average Remaining Term to Maturity (1) 46.73 months 61-72 14.21%Non-Zero Weighted Average FICO score (1) 757 Top 5 State (2)(3)
Percentage New Vehicle (2) 90.28% CA 16.59%Percentage Used Vehicle (2) 9.72% TX 8.86%Percentage Honda (2) 85.96% FL 5.35%Percentage Acura (2) 14.04% IL 4.85%
NJ 4.79%
New ReportingMethod
61+ Days 61+ Days31 - 60 Days 31 - 60 Days 61 - 90 Days 61 - 90 Days 91 - 120 Days 91 - 120 Days Delinquent % Delinquent %
Ending Delinquent Delinquent Delinquent Delinquent Delinquent Delinquent Ending Pool Ending PoolMonth Pool Balance ($) Count Amount ($) Count Amount ($) Count Amount ($) Balance (4) Balance (4)
0 Jul-14 1,025,655,641.321 Aug-14 992,317,568.08 123 2,317,476.44 1 5,280.16 - - 0.00% 0.00%2 Sep-14 959,559,834.10 339 5,879,040.03 16 288,079.92 - - 0.03% 0.02%3 Oct-14 927,210,961.76 365 6,462,905.48 34 611,020.01 4 52,841.57 0.07% 0.03%4 Nov-14 897,779,940.96 566 9,535,822.83 61 1,149,935.88 5 98,020.77 0.14% 0.05%5 Dec-14 865,470,384.48 570 9,520,063.36 70 1,125,280.82 12 259,691.72 0.16% 0.06%6 Jan-15 834,129,766.88 501 8,206,227.83 100 1,793,769.35 18 317,456.80 0.25% 0.07%7 Feb-15 804,225,710.16 603 9,715,022.20 80 1,311,683.72 13 254,253.23 0.19% 0.07%8 Mar-15 772,140,209.25 504 8,060,754.28 80 1,447,485.73 13 219,389.60 0.22% 0.05%9 Apr-15 740,068,226.24 552 8,687,504.45 86 1,336,726.56 19 373,341.02 0.23% 0.07%
10 May-15 709,805,027.65 623 9,609,614.62 97 1,590,470.27 22 344,416.74 0.27% 0.05%11 Jun-15 679,999,494.39 627 9,351,827.36 114 1,965,233.46 21 355,403.65 0.34% 0.07%12 Jul-15 649,446,354.17 604 8,792,323.38 125 2,016,121.78 28 524,852.56 0.39% 0.08%13 Aug-15 620,506,858.37 643 9,313,704.67 180 2,741,426.69 33 578,040.34 0.53% 0.08%14 Sep-15 591,672,006.13 714 9,882,847.10 164 2,508,875.59 33 541,575.99 0.52% 0.09%15 Oct-15 563,582,249.75 701 9,634,140.07 150 2,190,934.65 36 517,553.51 0.48% 0.07%16 Nov-15 537,771,582.56 744 9,911,217.87 177 2,557,362.28 35 579,963.49 0.58% 0.12%17 Dec-15 511,221,787.02 724 9,481,914.60 176 2,563,727.78 51 788,555.91 0.66% 0.10%18 Jan-16 488,669,190.31 968 12,313,941.06 287 4,064,563.92 65 935,307.95 1.02% 0.11%19 Feb-16 461,961,495.68 829 10,471,728.86 193 2,573,690.53 37 551,051.45 0.68% 0.11%20 Mar-16 436,450,786.54 716 8,582,455.60 185 2,556,826.79 30 417,051.35 0.68% 0.07%21 Apr-16 412,469,881.64 704 8,329,502.89 173 2,219,236.13 37 541,303.97 0.67% 0.08%22 May-16 389,005,478.75 717 8,144,478.59 180 2,346,788.07 52 664,870.26 0.77% 0.09%23 Jun-16 366,267,089.59 676 7,426,128.98 209 2,649,597.42 43 520,723.39 0.87% 0.06%24 Jul-16 344,316,858.39 660 7,074,465.13 181 2,164,596.58 68 878,385.53 0.88% 0.11%25 Aug-16 322,662,798.10 595 6,246,890.24 226 2,575,188.18 58 726,718.46 1.02% 0.14%26 Sep-16 302,390,532.66 676 6,805,818.57 186 2,085,686.12 65 766,020.51 0.94% 0.14%27 Oct-16 283,262,496.74 622 6,205,009.98 193 2,056,305.08 48 552,590.44 0.92% 0.10%28 Nov-16 265,212,000.09 611 5,876,486.83 224 2,268,463.66 52 542,072.43 1.06% 0.11%29 Dec-16 247,210,479.73 601 5,363,706.48 196 2,067,801.95 75 831,449.18 1.17% 0.15%30 Jan-17 229,963,119.17 528 4,599,098.46 224 2,226,176.80 72 740,289.03 1.29% 0.14%
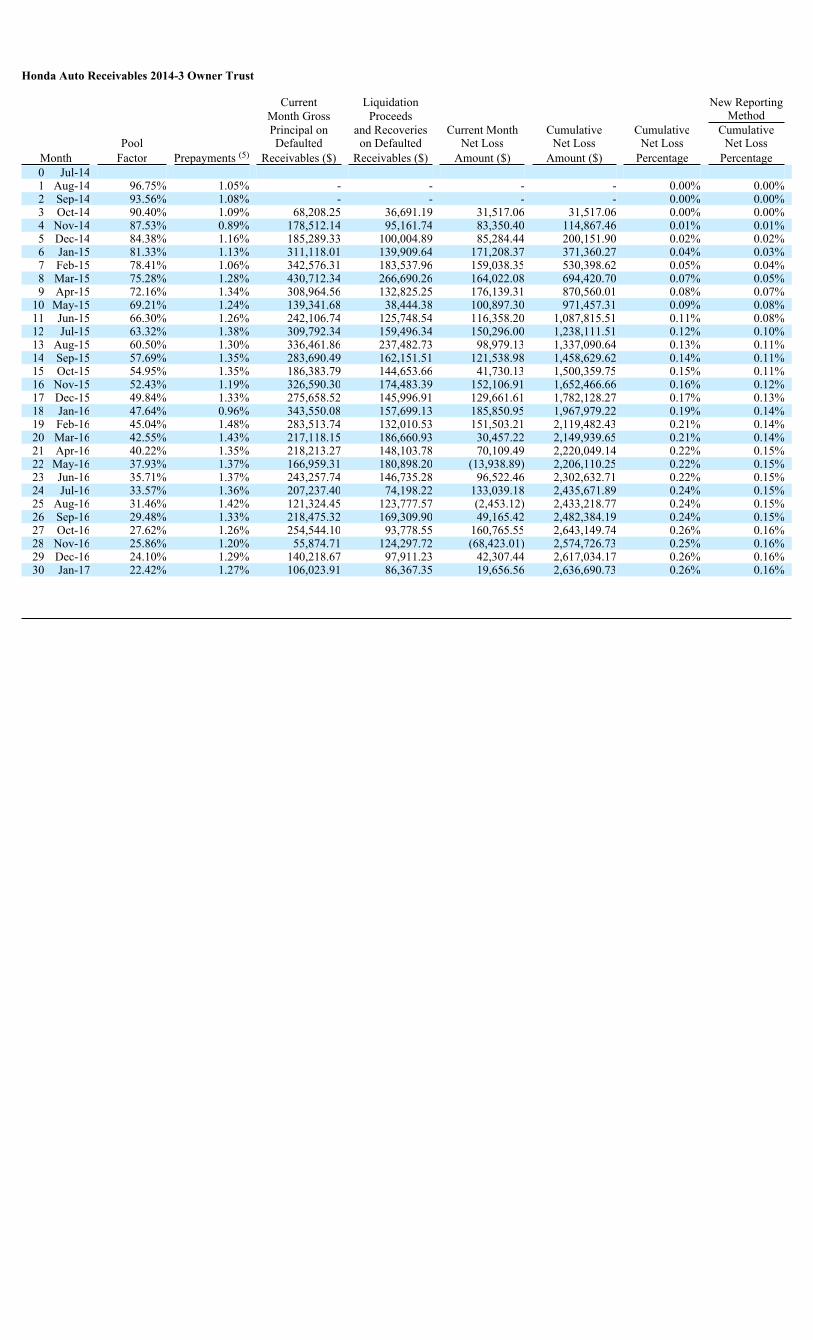
Honda Auto Receivables 2014-3 Owner Trust
Current Liquidation New ReportingMonth Gross Proceeds MethodPrincipal on and Recoveries Current Month Cumulative Cumulative Cumulative
Pool Defaulted on Defaulted Net Loss Net Loss Net Loss Net LossMonth Factor Prepayments (5) Receivables ($) Receivables ($) Amount ($) Amount ($) Percentage Percentage0 Jul-141 Aug-14 96.75% 1.05% - - - - 0.00% 0.00%2 Sep-14 93.56% 1.08% - - - - 0.00% 0.00%3 Oct-14 90.40% 1.09% 68,208.25 36,691.19 31,517.06 31,517.06 0.00% 0.00%4 Nov-14 87.53% 0.89% 178,512.14 95,161.74 83,350.40 114,867.46 0.01% 0.01%5 Dec-14 84.38% 1.16% 185,289.33 100,004.89 85,284.44 200,151.90 0.02% 0.02%6 Jan-15 81.33% 1.13% 311,118.01 139,909.64 171,208.37 371,360.27 0.04% 0.03%7 Feb-15 78.41% 1.06% 342,576.31 183,537.96 159,038.35 530,398.62 0.05% 0.04%8 Mar-15 75.28% 1.28% 430,712.34 266,690.26 164,022.08 694,420.70 0.07% 0.05%9 Apr-15 72.16% 1.34% 308,964.56 132,825.25 176,139.31 870,560.01 0.08% 0.07%
10 May-15 69.21% 1.24% 139,341.68 38,444.38 100,897.30 971,457.31 0.09% 0.08%11 Jun-15 66.30% 1.26% 242,106.74 125,748.54 116,358.20 1,087,815.51 0.11% 0.08%12 Jul-15 63.32% 1.38% 309,792.34 159,496.34 150,296.00 1,238,111.51 0.12% 0.10%13 Aug-15 60.50% 1.30% 336,461.86 237,482.73 98,979.13 1,337,090.64 0.13% 0.11%14 Sep-15 57.69% 1.35% 283,690.49 162,151.51 121,538.98 1,458,629.62 0.14% 0.11%15 Oct-15 54.95% 1.35% 186,383.79 144,653.66 41,730.13 1,500,359.75 0.15% 0.11%16 Nov-15 52.43% 1.19% 326,590.30 174,483.39 152,106.91 1,652,466.66 0.16% 0.12%17 Dec-15 49.84% 1.33% 275,658.52 145,996.91 129,661.61 1,782,128.27 0.17% 0.13%18 Jan-16 47.64% 0.96% 343,550.08 157,699.13 185,850.95 1,967,979.22 0.19% 0.14%19 Feb-16 45.04% 1.48% 283,513.74 132,010.53 151,503.21 2,119,482.43 0.21% 0.14%20 Mar-16 42.55% 1.43% 217,118.15 186,660.93 30,457.22 2,149,939.65 0.21% 0.14%21 Apr-16 40.22% 1.35% 218,213.27 148,103.78 70,109.49 2,220,049.14 0.22% 0.15%22 May-16 37.93% 1.37% 166,959.31 180,898.20 (13,938.89) 2,206,110.25 0.22% 0.15%23 Jun-16 35.71% 1.37% 243,257.74 146,735.28 96,522.46 2,302,632.71 0.22% 0.15%24 Jul-16 33.57% 1.36% 207,237.40 74,198.22 133,039.18 2,435,671.89 0.24% 0.15%25 Aug-16 31.46% 1.42% 121,324.45 123,777.57 (2,453.12) 2,433,218.77 0.24% 0.15%26 Sep-16 29.48% 1.33% 218,475.32 169,309.90 49,165.42 2,482,384.19 0.24% 0.15%27 Oct-16 27.62% 1.26% 254,544.10 93,778.55 160,765.55 2,643,149.74 0.26% 0.16%28 Nov-16 25.86% 1.20% 55,874.71 124,297.72 (68,423.01) 2,574,726.73 0.25% 0.16%29 Dec-16 24.10% 1.29% 140,218.67 97,911.23 42,307.44 2,617,034.17 0.26% 0.16%30 Jan-17 22.42% 1.27% 106,023.91 86,367.35 19,656.56 2,636,690.73 0.26% 0.16%
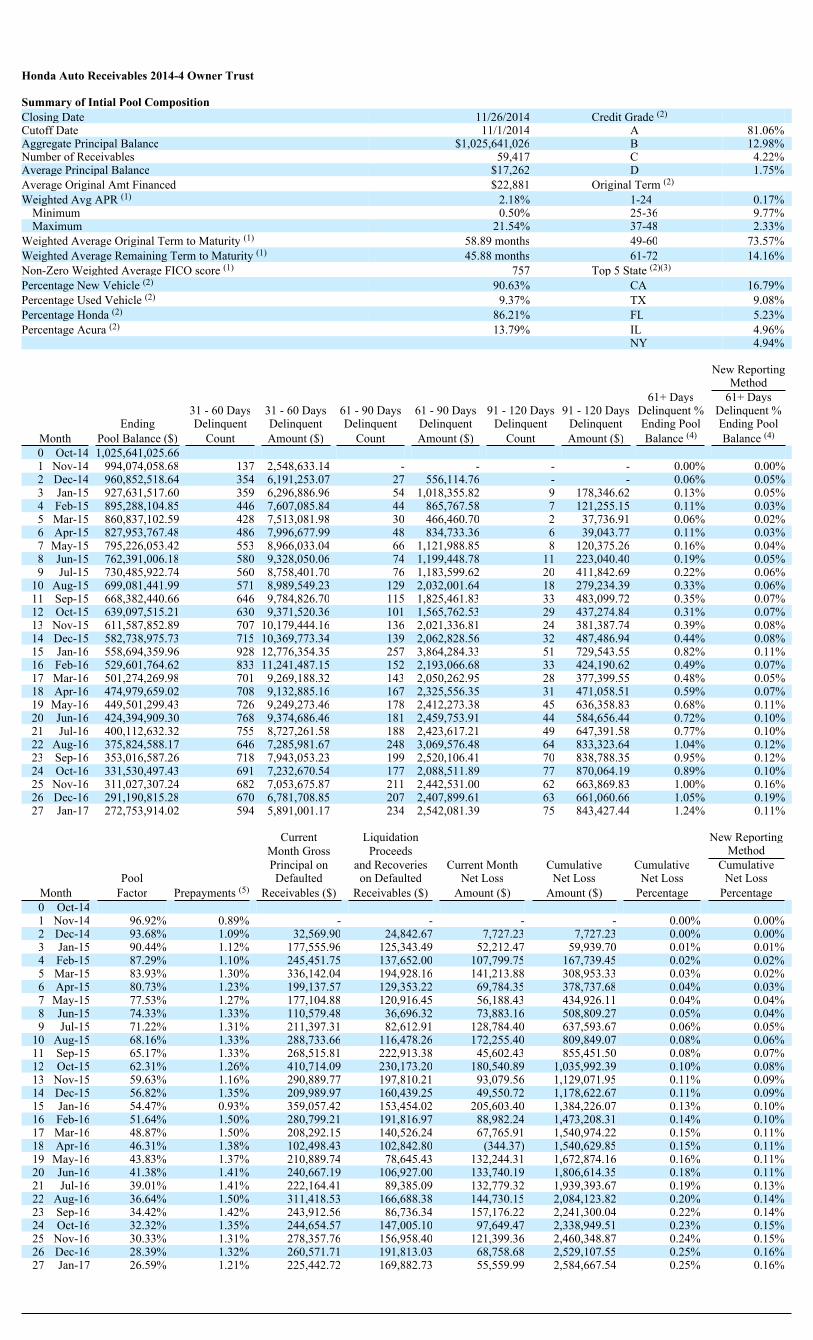
Honda Auto Receivables 2014-4 Owner Trust
Summary of Intial Pool CompositionClosing Date 11/26/2014 Credit Grade (2)
Cutoff Date 11/1/2014 A 81.06%Aggregate Principal Balance $1,025,641,026 B 12.98%Number of Receivables 59,417 C 4.22%Average Principal Balance $17,262 D 1.75%Average Original Amt Financed $22,881 Original Term (2)
Weighted Avg APR (1) 2.18% 1-24 0.17%Minimum 0.50% 25-36 9.77%Maximum 21.54% 37-48 2.33%
Weighted Average Original Term to Maturity (1) 58.89 months 49-60 73.57%Weighted Average Remaining Term to Maturity (1) 45.88 months 61-72 14.16%Non-Zero Weighted Average FICO score (1) 757 Top 5 State (2)(3)
Percentage New Vehicle (2) 90.63% CA 16.79%Percentage Used Vehicle (2) 9.37% TX 9.08%Percentage Honda (2) 86.21% FL 5.23%Percentage Acura (2) 13.79% IL 4.96%
NY 4.94%
New ReportingMethod
61+ Days 61+ Days31 - 60 Days 31 - 60 Days 61 - 90 Days 61 - 90 Days 91 - 120 Days 91 - 120 Days Delinquent % Delinquent %
Ending Delinquent Delinquent Delinquent Delinquent Delinquent Delinquent Ending Pool Ending PoolMonth Pool Balance ($) Count Amount ($) Count Amount ($) Count Amount ($) Balance (4) Balance (4)
0 Oct-14 1,025,641,025.661 Nov-14 994,074,058.68 137 2,548,633.14 - - - - 0.00% 0.00%2 Dec-14 960,852,518.64 354 6,191,253.07 27 556,114.76 - - 0.06% 0.05%3 Jan-15 927,631,517.60 359 6,296,886.96 54 1,018,355.82 9 178,346.62 0.13% 0.05%4 Feb-15 895,288,104.85 446 7,607,085.84 44 865,767.58 7 121,255.15 0.11% 0.03%5 Mar-15 860,837,102.59 428 7,513,081.98 30 466,460.70 2 37,736.91 0.06% 0.02%6 Apr-15 827,953,767.48 486 7,996,677.99 48 834,733.36 6 39,043.77 0.11% 0.03%7 May-15 795,226,053.42 553 8,966,033.04 66 1,121,988.85 8 120,375.26 0.16% 0.04%8 Jun-15 762,391,006.18 580 9,328,050.06 74 1,199,448.78 11 223,040.40 0.19% 0.05%9 Jul-15 730,485,922.74 560 8,758,401.70 76 1,183,599.62 20 411,842.69 0.22% 0.06%
10 Aug-15 699,081,441.99 571 8,989,549.23 129 2,032,001.64 18 279,234.39 0.33% 0.06%11 Sep-15 668,382,440.66 646 9,784,826.70 115 1,825,461.83 33 483,099.72 0.35% 0.07%12 Oct-15 639,097,515.21 630 9,371,520.36 101 1,565,762.53 29 437,274.84 0.31% 0.07%13 Nov-15 611,587,852.89 707 10,179,444.16 136 2,021,336.81 24 381,387.74 0.39% 0.08%14 Dec-15 582,738,975.73 715 10,369,773.34 139 2,062,828.56 32 487,486.94 0.44% 0.08%15 Jan-16 558,694,359.96 928 12,776,354.35 257 3,864,284.33 51 729,543.55 0.82% 0.11%16 Feb-16 529,601,764.62 833 11,241,487.15 152 2,193,066.68 33 424,190.62 0.49% 0.07%17 Mar-16 501,274,269.98 701 9,269,188.32 143 2,050,262.95 28 377,399.55 0.48% 0.05%18 Apr-16 474,979,659.02 708 9,132,885.16 167 2,325,556.35 31 471,058.51 0.59% 0.07%19 May-16 449,501,299.43 726 9,249,273.46 178 2,412,273.38 45 636,358.83 0.68% 0.11%20 Jun-16 424,394,909.30 768 9,374,686.46 181 2,459,753.91 44 584,656.44 0.72% 0.10%21 Jul-16 400,112,632.32 755 8,727,261.58 188 2,423,617.21 49 647,391.58 0.77% 0.10%22 Aug-16 375,824,588.17 646 7,285,981.67 248 3,069,576.48 64 833,323.64 1.04% 0.12%23 Sep-16 353,016,587.26 718 7,943,053.23 199 2,520,106.41 70 838,788.35 0.95% 0.12%24 Oct-16 331,530,497.43 691 7,232,670.54 177 2,088,511.89 77 870,064.19 0.89% 0.10%25 Nov-16 311,027,307.24 682 7,053,675.87 211 2,442,531.00 62 663,869.83 1.00% 0.16%26 Dec-16 291,190,815.28 670 6,781,708.85 207 2,407,899.61 63 661,060.66 1.05% 0.19%27 Jan-17 272,753,914.02 594 5,891,001.17 234 2,542,081.39 75 843,427.44 1.24% 0.11%
Current Liquidation New ReportingMonth Gross Proceeds MethodPrincipal on and Recoveries Current Month Cumulative Cumulative Cumulative
Pool Defaulted on Defaulted Net Loss Net Loss Net Loss Net LossMonth Factor Prepayments (5) Receivables ($) Receivables ($) Amount ($) Amount ($) Percentage Percentage0 Oct-141 Nov-14 96.92% 0.89% - - - - 0.00% 0.00%2 Dec-14 93.68% 1.09% 32,569.90 24,842.67 7,727.23 7,727.23 0.00% 0.00%3 Jan-15 90.44% 1.12% 177,555.96 125,343.49 52,212.47 59,939.70 0.01% 0.01%4 Feb-15 87.29% 1.10% 245,451.75 137,652.00 107,799.75 167,739.45 0.02% 0.02%5 Mar-15 83.93% 1.30% 336,142.04 194,928.16 141,213.88 308,953.33 0.03% 0.02%6 Apr-15 80.73% 1.23% 199,137.57 129,353.22 69,784.35 378,737.68 0.04% 0.03%7 May-15 77.53% 1.27% 177,104.88 120,916.45 56,188.43 434,926.11 0.04% 0.04%8 Jun-15 74.33% 1.33% 110,579.48 36,696.32 73,883.16 508,809.27 0.05% 0.04%9 Jul-15 71.22% 1.31% 211,397.31 82,612.91 128,784.40 637,593.67 0.06% 0.05%
10 Aug-15 68.16% 1.33% 288,733.66 116,478.26 172,255.40 809,849.07 0.08% 0.06%11 Sep-15 65.17% 1.33% 268,515.81 222,913.38 45,602.43 855,451.50 0.08% 0.07%12 Oct-15 62.31% 1.26% 410,714.09 230,173.20 180,540.89 1,035,992.39 0.10% 0.08%13 Nov-15 59.63% 1.16% 290,889.77 197,810.21 93,079.56 1,129,071.95 0.11% 0.09%14 Dec-15 56.82% 1.35% 209,989.97 160,439.25 49,550.72 1,178,622.67 0.11% 0.09%15 Jan-16 54.47% 0.93% 359,057.42 153,454.02 205,603.40 1,384,226.07 0.13% 0.10%16 Feb-16 51.64% 1.50% 280,799.21 191,816.97 88,982.24 1,473,208.31 0.14% 0.10%17 Mar-16 48.87% 1.50% 208,292.15 140,526.24 67,765.91 1,540,974.22 0.15% 0.11%18 Apr-16 46.31% 1.38% 102,498.43 102,842.80 (344.37) 1,540,629.85 0.15% 0.11%19 May-16 43.83% 1.37% 210,889.74 78,645.43 132,244.31 1,672,874.16 0.16% 0.11%20 Jun-16 41.38% 1.41% 240,667.19 106,927.00 133,740.19 1,806,614.35 0.18% 0.11%21 Jul-16 39.01% 1.41% 222,164.41 89,385.09 132,779.32 1,939,393.67 0.19% 0.13%22 Aug-16 36.64% 1.50% 311,418.53 166,688.38 144,730.15 2,084,123.82 0.20% 0.14%23 Sep-16 34.42% 1.42% 243,912.56 86,736.34 157,176.22 2,241,300.04 0.22% 0.14%24 Oct-16 32.32% 1.35% 244,654.57 147,005.10 97,649.47 2,338,949.51 0.23% 0.15%25 Nov-16 30.33% 1.31% 278,357.76 156,958.40 121,399.36 2,460,348.87 0.24% 0.15%26 Dec-16 28.39% 1.32% 260,571.71 191,813.03 68,758.68 2,529,107.55 0.25% 0.16%27 Jan-17 26.59% 1.21% 225,442.72 169,882.73 55,559.99 2,584,667.54 0.25% 0.16%
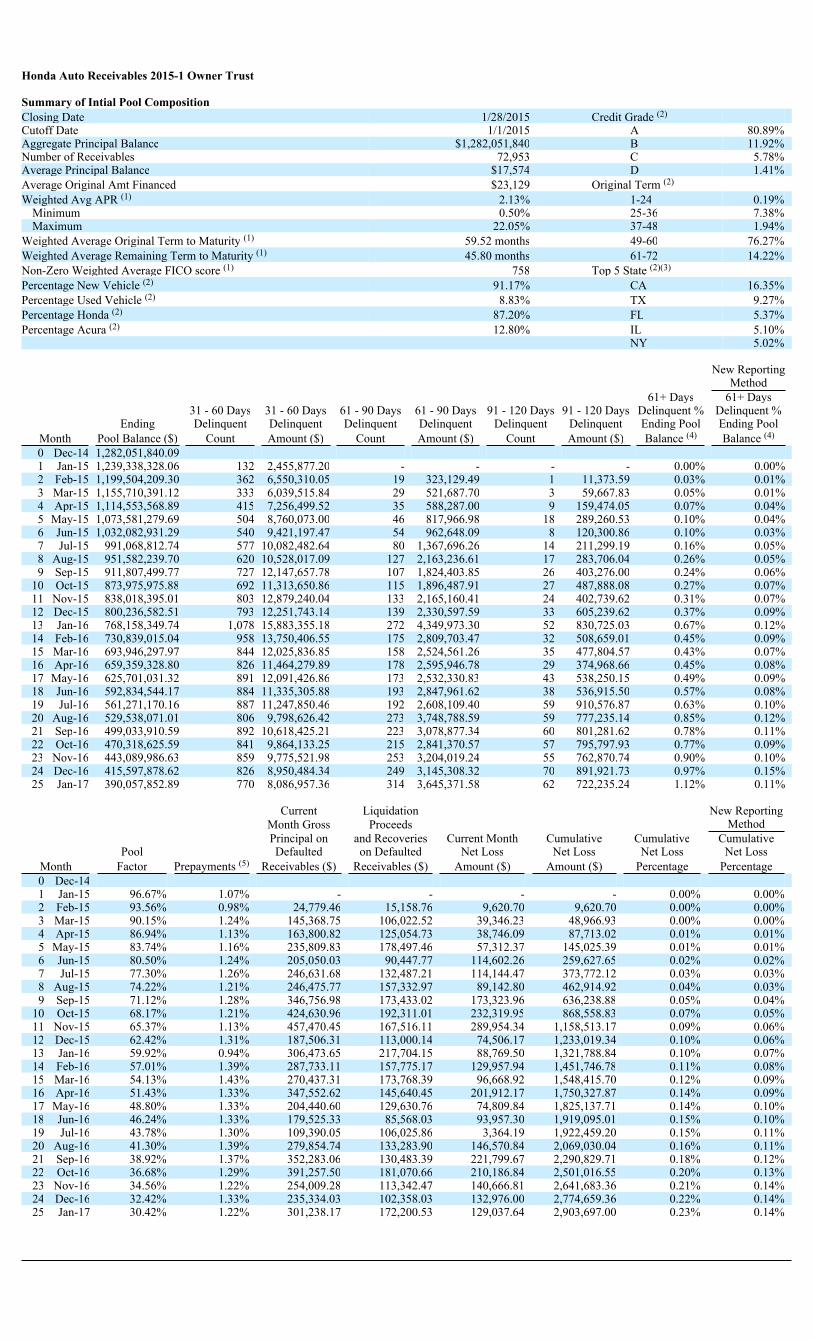
Honda Auto Receivables 2015-1 Owner Trust
Summary of Intial Pool CompositionClosing Date 1/28/2015 Credit Grade (2)
Cutoff Date 1/1/2015 A 80.89%Aggregate Principal Balance $1,282,051,840 B 11.92%Number of Receivables 72,953 C 5.78%Average Principal Balance $17,574 D 1.41%Average Original Amt Financed $23,129 Original Term (2)
Weighted Avg APR (1) 2.13% 1-24 0.19%Minimum 0.50% 25-36 7.38%Maximum 22.05% 37-48 1.94%
Weighted Average Original Term to Maturity (1) 59.52 months 49-60 76.27%Weighted Average Remaining Term to Maturity (1) 45.80 months 61-72 14.22%Non-Zero Weighted Average FICO score (1) 758 Top 5 State (2)(3)
Percentage New Vehicle (2) 91.17% CA 16.35%Percentage Used Vehicle (2) 8.83% TX 9.27%Percentage Honda (2) 87.20% FL 5.37%Percentage Acura (2) 12.80% IL 5.10%
NY 5.02%
New ReportingMethod
61+ Days 61+ Days31 - 60 Days 31 - 60 Days 61 - 90 Days 61 - 90 Days 91 - 120 Days 91 - 120 Days Delinquent % Delinquent %
Ending Delinquent Delinquent Delinquent Delinquent Delinquent Delinquent Ending Pool Ending PoolMonth Pool Balance ($) Count Amount ($) Count Amount ($) Count Amount ($) Balance (4) Balance (4)
0 Dec-14 1,282,051,840.091 Jan-15 1,239,338,328.06 132 2,455,877.20 - - - - 0.00% 0.00%2 Feb-15 1,199,504,209.30 362 6,550,310.05 19 323,129.49 1 11,373.59 0.03% 0.01%3 Mar-15 1,155,710,391.12 333 6,039,515.84 29 521,687.70 3 59,667.83 0.05% 0.01%4 Apr-15 1,114,553,568.89 415 7,256,499.52 35 588,287.00 9 159,474.05 0.07% 0.04%5 May-15 1,073,581,279.69 504 8,760,073.00 46 817,966.98 18 289,260.53 0.10% 0.04%6 Jun-15 1,032,082,931.29 540 9,421,197.47 54 962,648.09 8 120,300.86 0.10% 0.03%7 Jul-15 991,068,812.74 577 10,082,482.64 80 1,367,696.26 14 211,299.19 0.16% 0.05%8 Aug-15 951,582,239.70 620 10,528,017.09 127 2,163,236.61 17 283,706.04 0.26% 0.05%9 Sep-15 911,807,499.77 727 12,147,657.78 107 1,824,403.85 26 403,276.00 0.24% 0.06%
10 Oct-15 873,975,975.88 692 11,313,650.86 115 1,896,487.91 27 487,888.08 0.27% 0.07%11 Nov-15 838,018,395.01 803 12,879,240.04 133 2,165,160.41 24 402,739.62 0.31% 0.07%12 Dec-15 800,236,582.51 793 12,251,743.14 139 2,330,597.59 33 605,239.62 0.37% 0.09%13 Jan-16 768,158,349.74 1,078 15,883,355.18 272 4,349,973.30 52 830,725.03 0.67% 0.12%14 Feb-16 730,839,015.04 958 13,750,406.55 175 2,809,703.47 32 508,659.01 0.45% 0.09%15 Mar-16 693,946,297.97 844 12,025,836.85 158 2,524,561.26 35 477,804.57 0.43% 0.07%16 Apr-16 659,359,328.80 826 11,464,279.89 178 2,595,946.78 29 374,968.66 0.45% 0.08%17 May-16 625,701,031.32 891 12,091,426.86 173 2,532,330.83 43 538,250.15 0.49% 0.09%18 Jun-16 592,834,544.17 884 11,335,305.88 193 2,847,961.62 38 536,915.50 0.57% 0.08%19 Jul-16 561,271,170.16 887 11,247,850.46 192 2,608,109.40 59 910,576.87 0.63% 0.10%20 Aug-16 529,538,071.01 806 9,798,626.42 273 3,748,788.59 59 777,235.14 0.85% 0.12%21 Sep-16 499,033,910.59 892 10,618,425.21 223 3,078,877.34 60 801,281.62 0.78% 0.11%22 Oct-16 470,318,625.59 841 9,864,133.25 215 2,841,370.57 57 795,797.93 0.77% 0.09%23 Nov-16 443,089,986.63 859 9,775,521.98 253 3,204,019.24 55 762,870.74 0.90% 0.10%24 Dec-16 415,597,878.62 826 8,950,484.34 249 3,145,308.32 70 891,921.73 0.97% 0.15%25 Jan-17 390,057,852.89 770 8,086,957.36 314 3,645,371.58 62 722,235.24 1.12% 0.11%
Current Liquidation New ReportingMonth Gross Proceeds MethodPrincipal on and Recoveries Current Month Cumulative Cumulative Cumulative
Pool Defaulted on Defaulted Net Loss Net Loss Net Loss Net LossMonth Factor Prepayments (5) Receivables ($) Receivables ($) Amount ($) Amount ($) Percentage Percentage0 Dec-141 Jan-15 96.67% 1.07% - - - - 0.00% 0.00%2 Feb-15 93.56% 0.98% 24,779.46 15,158.76 9,620.70 9,620.70 0.00% 0.00%3 Mar-15 90.15% 1.24% 145,368.75 106,022.52 39,346.23 48,966.93 0.00% 0.00%4 Apr-15 86.94% 1.13% 163,800.82 125,054.73 38,746.09 87,713.02 0.01% 0.01%5 May-15 83.74% 1.16% 235,809.83 178,497.46 57,312.37 145,025.39 0.01% 0.01%6 Jun-15 80.50% 1.24% 205,050.03 90,447.77 114,602.26 259,627.65 0.02% 0.02%7 Jul-15 77.30% 1.26% 246,631.68 132,487.21 114,144.47 373,772.12 0.03% 0.03%8 Aug-15 74.22% 1.21% 246,475.77 157,332.97 89,142.80 462,914.92 0.04% 0.03%9 Sep-15 71.12% 1.28% 346,756.98 173,433.02 173,323.96 636,238.88 0.05% 0.04%
10 Oct-15 68.17% 1.21% 424,630.96 192,311.01 232,319.95 868,558.83 0.07% 0.05%11 Nov-15 65.37% 1.13% 457,470.45 167,516.11 289,954.34 1,158,513.17 0.09% 0.06%12 Dec-15 62.42% 1.31% 187,506.31 113,000.14 74,506.17 1,233,019.34 0.10% 0.06%13 Jan-16 59.92% 0.94% 306,473.65 217,704.15 88,769.50 1,321,788.84 0.10% 0.07%14 Feb-16 57.01% 1.39% 287,733.11 157,775.17 129,957.94 1,451,746.78 0.11% 0.08%15 Mar-16 54.13% 1.43% 270,437.31 173,768.39 96,668.92 1,548,415.70 0.12% 0.09%16 Apr-16 51.43% 1.33% 347,552.62 145,640.45 201,912.17 1,750,327.87 0.14% 0.09%17 May-16 48.80% 1.33% 204,440.60 129,630.76 74,809.84 1,825,137.71 0.14% 0.10%18 Jun-16 46.24% 1.33% 179,525.33 85,568.03 93,957.30 1,919,095.01 0.15% 0.10%19 Jul-16 43.78% 1.30% 109,390.05 106,025.86 3,364.19 1,922,459.20 0.15% 0.11%20 Aug-16 41.30% 1.39% 279,854.74 133,283.90 146,570.84 2,069,030.04 0.16% 0.11%21 Sep-16 38.92% 1.37% 352,283.06 130,483.39 221,799.67 2,290,829.71 0.18% 0.12%22 Oct-16 36.68% 1.29% 391,257.50 181,070.66 210,186.84 2,501,016.55 0.20% 0.13%23 Nov-16 34.56% 1.22% 254,009.28 113,342.47 140,666.81 2,641,683.36 0.21% 0.14%24 Dec-16 32.42% 1.33% 235,334.03 102,358.03 132,976.00 2,774,659.36 0.22% 0.14%25 Jan-17 30.42% 1.22% 301,238.17 172,200.53 129,037.64 2,903,697.00 0.23% 0.14%
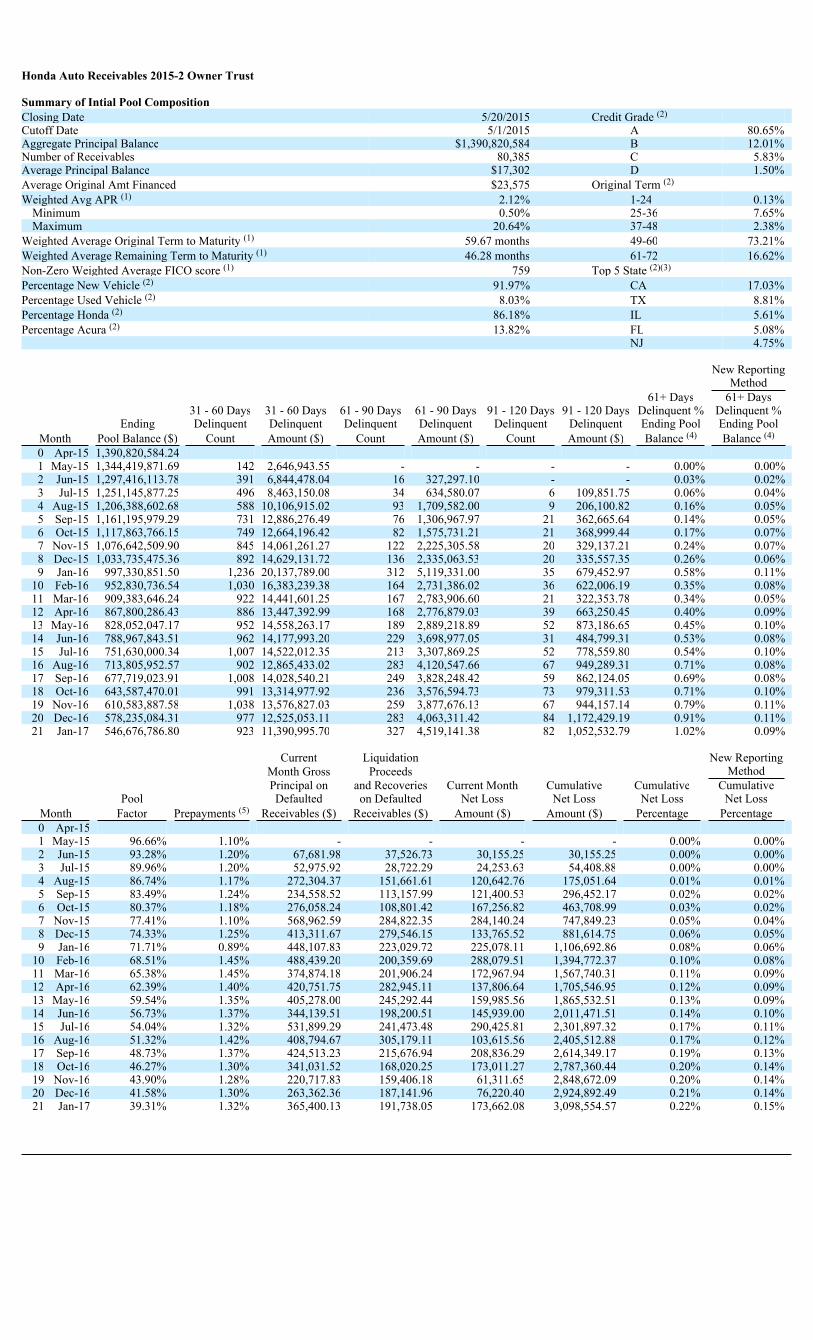
Honda Auto Receivables 2015-2 Owner Trust
Summary of Intial Pool CompositionClosing Date 5/20/2015 Credit Grade (2)
Cutoff Date 5/1/2015 A 80.65%Aggregate Principal Balance $1,390,820,584 B 12.01%Number of Receivables 80,385 C 5.83%Average Principal Balance $17,302 D 1.50%Average Original Amt Financed $23,575 Original Term (2)
Weighted Avg APR (1) 2.12% 1-24 0.13%Minimum 0.50% 25-36 7.65%Maximum 20.64% 37-48 2.38%
Weighted Average Original Term to Maturity (1) 59.67 months 49-60 73.21%Weighted Average Remaining Term to Maturity (1) 46.28 months 61-72 16.62%Non-Zero Weighted Average FICO score (1) 759 Top 5 State (2)(3)
Percentage New Vehicle (2) 91.97% CA 17.03%Percentage Used Vehicle (2) 8.03% TX 8.81%Percentage Honda (2) 86.18% IL 5.61%Percentage Acura (2) 13.82% FL 5.08%
NJ 4.75%
New ReportingMethod
61+ Days 61+ Days31 - 60 Days 31 - 60 Days 61 - 90 Days 61 - 90 Days 91 - 120 Days 91 - 120 Days Delinquent % Delinquent %
Ending Delinquent Delinquent Delinquent Delinquent Delinquent Delinquent Ending Pool Ending PoolMonth Pool Balance ($) Count Amount ($) Count Amount ($) Count Amount ($) Balance (4) Balance (4)
0 Apr-15 1,390,820,584.241 May-15 1,344,419,871.69 142 2,646,943.55 - - - - 0.00% 0.00%2 Jun-15 1,297,416,113.78 391 6,844,478.04 16 327,297.10 - - 0.03% 0.02%3 Jul-15 1,251,145,877.25 496 8,463,150.08 34 634,580.07 6 109,851.75 0.06% 0.04%4 Aug-15 1,206,388,602.68 588 10,106,915.02 93 1,709,582.00 9 206,100.82 0.16% 0.05%5 Sep-15 1,161,195,979.29 731 12,886,276.49 76 1,306,967.97 21 362,665.64 0.14% 0.05%6 Oct-15 1,117,863,766.15 749 12,664,196.42 82 1,575,731.21 21 368,999.44 0.17% 0.07%7 Nov-15 1,076,642,509.90 845 14,061,261.27 122 2,225,305.58 20 329,137.21 0.24% 0.07%8 Dec-15 1,033,735,475.36 892 14,629,131.72 136 2,335,063.53 20 335,557.35 0.26% 0.06%9 Jan-16 997,330,851.50 1,236 20,137,789.00 312 5,119,331.00 35 679,452.97 0.58% 0.11%
10 Feb-16 952,830,736.54 1,030 16,383,239.38 164 2,731,386.02 36 622,006.19 0.35% 0.08%11 Mar-16 909,383,646.24 922 14,441,601.25 167 2,783,906.60 21 322,353.78 0.34% 0.05%12 Apr-16 867,800,286.43 886 13,447,392.99 168 2,776,879.03 39 663,250.45 0.40% 0.09%13 May-16 828,052,047.17 952 14,558,263.17 189 2,889,218.89 52 873,186.65 0.45% 0.10%14 Jun-16 788,967,843.51 962 14,177,993.20 229 3,698,977.05 31 484,799.31 0.53% 0.08%15 Jul-16 751,630,000.34 1,007 14,522,012.35 213 3,307,869.25 52 778,559.80 0.54% 0.10%16 Aug-16 713,805,952.57 902 12,865,433.02 283 4,120,547.66 67 949,289.31 0.71% 0.08%17 Sep-16 677,719,023.91 1,008 14,028,540.21 249 3,828,248.42 59 862,124.05 0.69% 0.08%18 Oct-16 643,587,470.01 991 13,314,977.92 236 3,576,594.73 73 979,311.53 0.71% 0.10%19 Nov-16 610,583,887.58 1,038 13,576,827.03 259 3,877,676.13 67 944,157.14 0.79% 0.11%20 Dec-16 578,235,084.31 977 12,525,053.11 283 4,063,311.42 84 1,172,429.19 0.91% 0.11%21 Jan-17 546,676,786.80 923 11,390,995.70 327 4,519,141.38 82 1,052,532.79 1.02% 0.09%
Current Liquidation New ReportingMonth Gross Proceeds MethodPrincipal on and Recoveries Current Month Cumulative Cumulative Cumulative
Pool Defaulted on Defaulted Net Loss Net Loss Net Loss Net LossMonth Factor Prepayments (5) Receivables ($) Receivables ($) Amount ($) Amount ($) Percentage Percentage0 Apr-151 May-15 96.66% 1.10% - - - - 0.00% 0.00%2 Jun-15 93.28% 1.20% 67,681.98 37,526.73 30,155.25 30,155.25 0.00% 0.00%3 Jul-15 89.96% 1.20% 52,975.92 28,722.29 24,253.63 54,408.88 0.00% 0.00%4 Aug-15 86.74% 1.17% 272,304.37 151,661.61 120,642.76 175,051.64 0.01% 0.01%5 Sep-15 83.49% 1.24% 234,558.52 113,157.99 121,400.53 296,452.17 0.02% 0.02%6 Oct-15 80.37% 1.18% 276,058.24 108,801.42 167,256.82 463,708.99 0.03% 0.02%7 Nov-15 77.41% 1.10% 568,962.59 284,822.35 284,140.24 747,849.23 0.05% 0.04%8 Dec-15 74.33% 1.25% 413,311.67 279,546.15 133,765.52 881,614.75 0.06% 0.05%9 Jan-16 71.71% 0.89% 448,107.83 223,029.72 225,078.11 1,106,692.86 0.08% 0.06%
10 Feb-16 68.51% 1.45% 488,439.20 200,359.69 288,079.51 1,394,772.37 0.10% 0.08%11 Mar-16 65.38% 1.45% 374,874.18 201,906.24 172,967.94 1,567,740.31 0.11% 0.09%12 Apr-16 62.39% 1.40% 420,751.75 282,945.11 137,806.64 1,705,546.95 0.12% 0.09%13 May-16 59.54% 1.35% 405,278.00 245,292.44 159,985.56 1,865,532.51 0.13% 0.09%14 Jun-16 56.73% 1.37% 344,139.51 198,200.51 145,939.00 2,011,471.51 0.14% 0.10%15 Jul-16 54.04% 1.32% 531,899.29 241,473.48 290,425.81 2,301,897.32 0.17% 0.11%16 Aug-16 51.32% 1.42% 408,794.67 305,179.11 103,615.56 2,405,512.88 0.17% 0.12%17 Sep-16 48.73% 1.37% 424,513.23 215,676.94 208,836.29 2,614,349.17 0.19% 0.13%18 Oct-16 46.27% 1.30% 341,031.52 168,020.25 173,011.27 2,787,360.44 0.20% 0.14%19 Nov-16 43.90% 1.28% 220,717.83 159,406.18 61,311.65 2,848,672.09 0.20% 0.14%20 Dec-16 41.58% 1.30% 263,362.36 187,141.96 76,220.40 2,924,892.49 0.21% 0.14%21 Jan-17 39.31% 1.32% 365,400.13 191,738.05 173,662.08 3,098,554.57 0.22% 0.15%
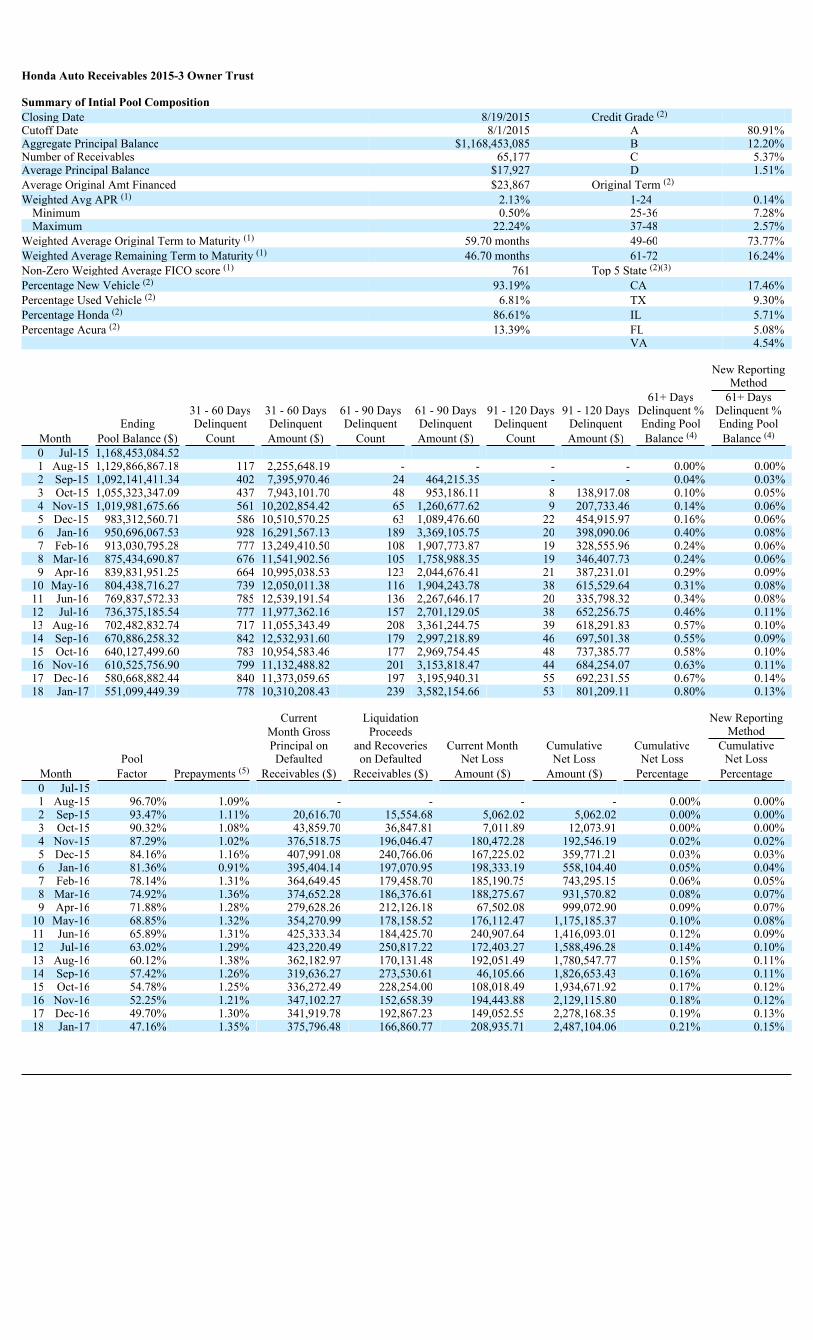
Honda Auto Receivables 2015-3 Owner Trust
Summary of Intial Pool CompositionClosing Date 8/19/2015 Credit Grade (2)
Cutoff Date 8/1/2015 A 80.91%Aggregate Principal Balance $1,168,453,085 B 12.20%Number of Receivables 65,177 C 5.37%Average Principal Balance $17,927 D 1.51%Average Original Amt Financed $23,867 Original Term (2)
Weighted Avg APR (1) 2.13% 1-24 0.14%Minimum 0.50% 25-36 7.28%Maximum 22.24% 37-48 2.57%
Weighted Average Original Term to Maturity (1) 59.70 months 49-60 73.77%Weighted Average Remaining Term to Maturity (1) 46.70 months 61-72 16.24%Non-Zero Weighted Average FICO score (1) 761 Top 5 State (2)(3)
Percentage New Vehicle (2) 93.19% CA 17.46%Percentage Used Vehicle (2) 6.81% TX 9.30%Percentage Honda (2) 86.61% IL 5.71%Percentage Acura (2) 13.39% FL 5.08%
VA 4.54%
New ReportingMethod
61+ Days 61+ Days31 - 60 Days 31 - 60 Days 61 - 90 Days 61 - 90 Days 91 - 120 Days 91 - 120 Days Delinquent % Delinquent %
Ending Delinquent Delinquent Delinquent Delinquent Delinquent Delinquent Ending Pool Ending PoolMonth Pool Balance ($) Count Amount ($) Count Amount ($) Count Amount ($) Balance (4) Balance (4)
0 Jul-15 1,168,453,084.521 Aug-15 1,129,866,867.18 117 2,255,648.19 - - - - 0.00% 0.00%2 Sep-15 1,092,141,411.34 402 7,395,970.46 24 464,215.35 - - 0.04% 0.03%3 Oct-15 1,055,323,347.09 437 7,943,101.70 48 953,186.11 8 138,917.08 0.10% 0.05%4 Nov-15 1,019,981,675.66 561 10,202,854.42 65 1,260,677.62 9 207,733.46 0.14% 0.06%5 Dec-15 983,312,560.71 586 10,510,570.25 63 1,089,476.60 22 454,915.97 0.16% 0.06%6 Jan-16 950,696,067.53 928 16,291,567.13 189 3,369,105.75 20 398,090.06 0.40% 0.08%7 Feb-16 913,030,795.28 777 13,249,410.50 108 1,907,773.87 19 328,555.96 0.24% 0.06%8 Mar-16 875,434,690.87 676 11,541,902.56 105 1,758,988.35 19 346,407.73 0.24% 0.06%9 Apr-16 839,831,951.25 664 10,995,038.53 123 2,044,676.41 21 387,231.01 0.29% 0.09%
10 May-16 804,438,716.27 739 12,050,011.38 116 1,904,243.78 38 615,529.64 0.31% 0.08%11 Jun-16 769,837,572.33 785 12,539,191.54 136 2,267,646.17 20 335,798.32 0.34% 0.08%12 Jul-16 736,375,185.54 777 11,977,362.16 157 2,701,129.05 38 652,256.75 0.46% 0.11%13 Aug-16 702,482,832.74 717 11,055,343.49 208 3,361,244.75 39 618,291.83 0.57% 0.10%14 Sep-16 670,886,258.32 842 12,532,931.60 179 2,997,218.89 46 697,501.38 0.55% 0.09%15 Oct-16 640,127,499.60 783 10,954,583.46 177 2,969,754.45 48 737,385.77 0.58% 0.10%16 Nov-16 610,525,756.90 799 11,132,488.82 201 3,153,818.47 44 684,254.07 0.63% 0.11%17 Dec-16 580,668,882.44 840 11,373,059.65 197 3,195,940.31 55 692,231.55 0.67% 0.14%18 Jan-17 551,099,449.39 778 10,310,208.43 239 3,582,154.66 53 801,209.11 0.80% 0.13%
Current Liquidation New ReportingMonth Gross Proceeds MethodPrincipal on and Recoveries Current Month Cumulative Cumulative Cumulative
Pool Defaulted on Defaulted Net Loss Net Loss Net Loss Net LossMonth Factor Prepayments (5) Receivables ($) Receivables ($) Amount ($) Amount ($) Percentage Percentage0 Jul-151 Aug-15 96.70% 1.09% - - - - 0.00% 0.00%2 Sep-15 93.47% 1.11% 20,616.70 15,554.68 5,062.02 5,062.02 0.00% 0.00%3 Oct-15 90.32% 1.08% 43,859.70 36,847.81 7,011.89 12,073.91 0.00% 0.00%4 Nov-15 87.29% 1.02% 376,518.75 196,046.47 180,472.28 192,546.19 0.02% 0.02%5 Dec-15 84.16% 1.16% 407,991.08 240,766.06 167,225.02 359,771.21 0.03% 0.03%6 Jan-16 81.36% 0.91% 395,404.14 197,070.95 198,333.19 558,104.40 0.05% 0.04%7 Feb-16 78.14% 1.31% 364,649.45 179,458.70 185,190.75 743,295.15 0.06% 0.05%8 Mar-16 74.92% 1.36% 374,652.28 186,376.61 188,275.67 931,570.82 0.08% 0.07%9 Apr-16 71.88% 1.28% 279,628.26 212,126.18 67,502.08 999,072.90 0.09% 0.07%
10 May-16 68.85% 1.32% 354,270.99 178,158.52 176,112.47 1,175,185.37 0.10% 0.08%11 Jun-16 65.89% 1.31% 425,333.34 184,425.70 240,907.64 1,416,093.01 0.12% 0.09%12 Jul-16 63.02% 1.29% 423,220.49 250,817.22 172,403.27 1,588,496.28 0.14% 0.10%13 Aug-16 60.12% 1.38% 362,182.97 170,131.48 192,051.49 1,780,547.77 0.15% 0.11%14 Sep-16 57.42% 1.26% 319,636.27 273,530.61 46,105.66 1,826,653.43 0.16% 0.11%15 Oct-16 54.78% 1.25% 336,272.49 228,254.00 108,018.49 1,934,671.92 0.17% 0.12%16 Nov-16 52.25% 1.21% 347,102.27 152,658.39 194,443.88 2,129,115.80 0.18% 0.12%17 Dec-16 49.70% 1.30% 341,919.78 192,867.23 149,052.55 2,278,168.35 0.19% 0.13%18 Jan-17 47.16% 1.35% 375,796.48 166,860.77 208,935.71 2,487,104.06 0.21% 0.15%
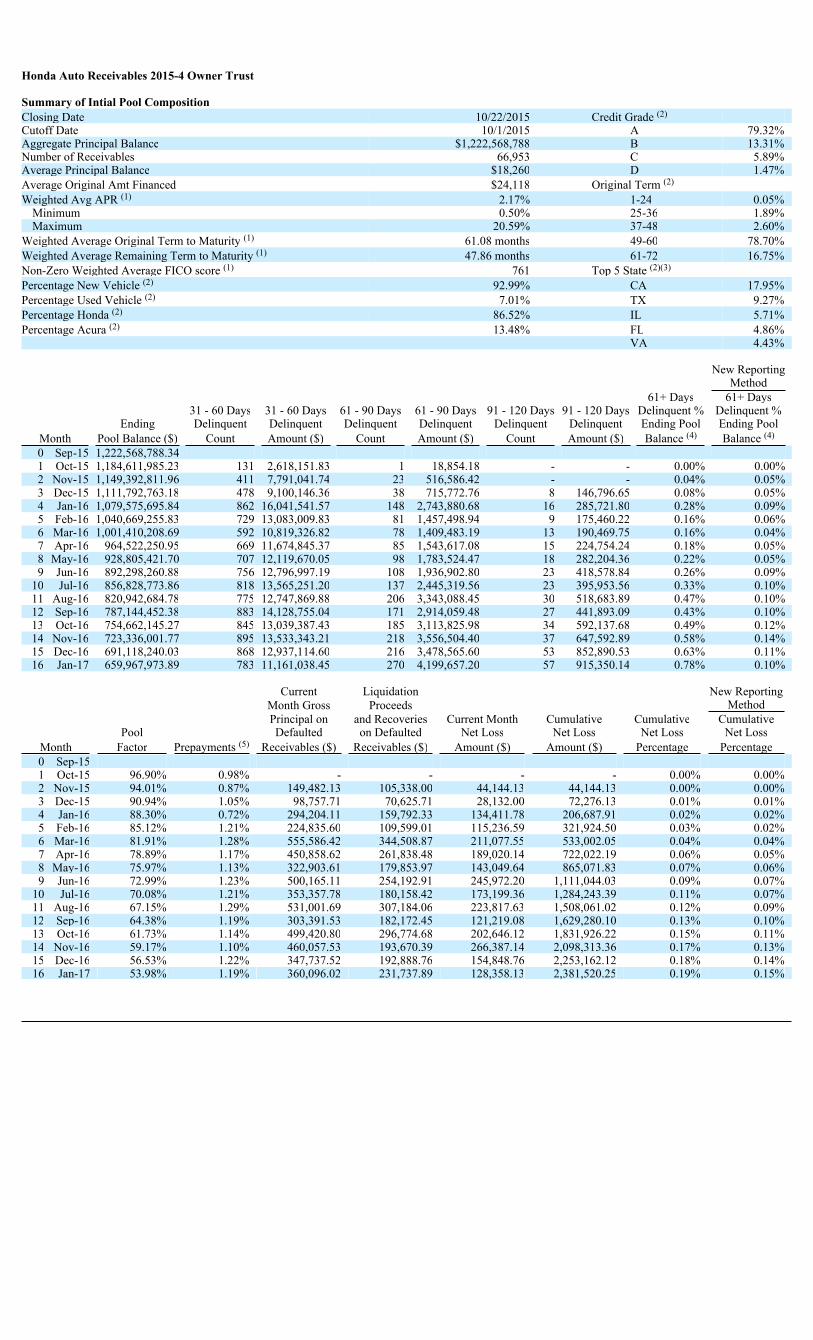
Honda Auto Receivables 2015-4 Owner Trust
Summary of Intial Pool CompositionClosing Date 10/22/2015 Credit Grade (2)
Cutoff Date 10/1/2015 A 79.32%Aggregate Principal Balance $1,222,568,788 B 13.31%Number of Receivables 66,953 C 5.89%Average Principal Balance $18,260 D 1.47%Average Original Amt Financed $24,118 Original Term (2)
Weighted Avg APR (1) 2.17% 1-24 0.05%Minimum 0.50% 25-36 1.89%Maximum 20.59% 37-48 2.60%
Weighted Average Original Term to Maturity (1) 61.08 months 49-60 78.70%Weighted Average Remaining Term to Maturity (1) 47.86 months 61-72 16.75%Non-Zero Weighted Average FICO score (1) 761 Top 5 State (2)(3)
Percentage New Vehicle (2) 92.99% CA 17.95%Percentage Used Vehicle (2) 7.01% TX 9.27%Percentage Honda (2) 86.52% IL 5.71%Percentage Acura (2) 13.48% FL 4.86%
VA 4.43%
New ReportingMethod
61+ Days 61+ Days31 - 60 Days 31 - 60 Days 61 - 90 Days 61 - 90 Days 91 - 120 Days 91 - 120 Days Delinquent % Delinquent %
Ending Delinquent Delinquent Delinquent Delinquent Delinquent Delinquent Ending Pool Ending PoolMonth Pool Balance ($) Count Amount ($) Count Amount ($) Count Amount ($) Balance (4) Balance (4)
0 Sep-15 1,222,568,788.341 Oct-15 1,184,611,985.23 131 2,618,151.83 1 18,854.18 - - 0.00% 0.00%2 Nov-15 1,149,392,811.96 411 7,791,041.74 23 516,586.42 - - 0.04% 0.05%3 Dec-15 1,111,792,763.18 478 9,100,146.36 38 715,772.76 8 146,796.65 0.08% 0.05%4 Jan-16 1,079,575,695.84 862 16,041,541.57 148 2,743,880.68 16 285,721.80 0.28% 0.09%5 Feb-16 1,040,669,255.83 729 13,083,009.83 81 1,457,498.94 9 175,460.22 0.16% 0.06%6 Mar-16 1,001,410,208.69 592 10,819,326.82 78 1,409,483.19 13 190,469.75 0.16% 0.04%7 Apr-16 964,522,250.95 669 11,674,845.37 85 1,543,617.08 15 224,754.24 0.18% 0.05%8 May-16 928,805,421.70 707 12,119,670.05 98 1,783,524.47 18 282,204.36 0.22% 0.05%9 Jun-16 892,298,260.88 756 12,796,997.19 108 1,936,902.80 23 418,578.84 0.26% 0.09%
10 Jul-16 856,828,773.86 818 13,565,251.20 137 2,445,319.56 23 395,953.56 0.33% 0.10%11 Aug-16 820,942,684.78 775 12,747,869.88 206 3,343,088.45 30 518,683.89 0.47% 0.10%12 Sep-16 787,144,452.38 883 14,128,755.04 171 2,914,059.48 27 441,893.09 0.43% 0.10%13 Oct-16 754,662,145.27 845 13,039,387.43 185 3,113,825.98 34 592,137.68 0.49% 0.12%14 Nov-16 723,336,001.77 895 13,533,343.21 218 3,556,504.40 37 647,592.89 0.58% 0.14%15 Dec-16 691,118,240.03 868 12,937,114.60 216 3,478,565.60 53 852,890.53 0.63% 0.11%16 Jan-17 659,967,973.89 783 11,161,038.45 270 4,199,657.20 57 915,350.14 0.78% 0.10%
Current Liquidation New ReportingMonth Gross Proceeds MethodPrincipal on and Recoveries Current Month Cumulative Cumulative Cumulative
Pool Defaulted on Defaulted Net Loss Net Loss Net Loss Net LossMonth Factor Prepayments (5) Receivables ($) Receivables ($) Amount ($) Amount ($) Percentage Percentage0 Sep-151 Oct-15 96.90% 0.98% - - - - 0.00% 0.00%2 Nov-15 94.01% 0.87% 149,482.13 105,338.00 44,144.13 44,144.13 0.00% 0.00%3 Dec-15 90.94% 1.05% 98,757.71 70,625.71 28,132.00 72,276.13 0.01% 0.01%4 Jan-16 88.30% 0.72% 294,204.11 159,792.33 134,411.78 206,687.91 0.02% 0.02%5 Feb-16 85.12% 1.21% 224,835.60 109,599.01 115,236.59 321,924.50 0.03% 0.02%6 Mar-16 81.91% 1.28% 555,586.42 344,508.87 211,077.55 533,002.05 0.04% 0.04%7 Apr-16 78.89% 1.17% 450,858.62 261,838.48 189,020.14 722,022.19 0.06% 0.05%8 May-16 75.97% 1.13% 322,903.61 179,853.97 143,049.64 865,071.83 0.07% 0.06%9 Jun-16 72.99% 1.23% 500,165.11 254,192.91 245,972.20 1,111,044.03 0.09% 0.07%
10 Jul-16 70.08% 1.21% 353,357.78 180,158.42 173,199.36 1,284,243.39 0.11% 0.07%11 Aug-16 67.15% 1.29% 531,001.69 307,184.06 223,817.63 1,508,061.02 0.12% 0.09%12 Sep-16 64.38% 1.19% 303,391.53 182,172.45 121,219.08 1,629,280.10 0.13% 0.10%13 Oct-16 61.73% 1.14% 499,420.80 296,774.68 202,646.12 1,831,926.22 0.15% 0.11%14 Nov-16 59.17% 1.10% 460,057.53 193,670.39 266,387.14 2,098,313.36 0.17% 0.13%15 Dec-16 56.53% 1.22% 347,737.52 192,888.76 154,848.76 2,253,162.12 0.18% 0.14%16 Jan-17 53.98% 1.19% 360,096.02 231,737.89 128,358.13 2,381,520.25 0.19% 0.15%
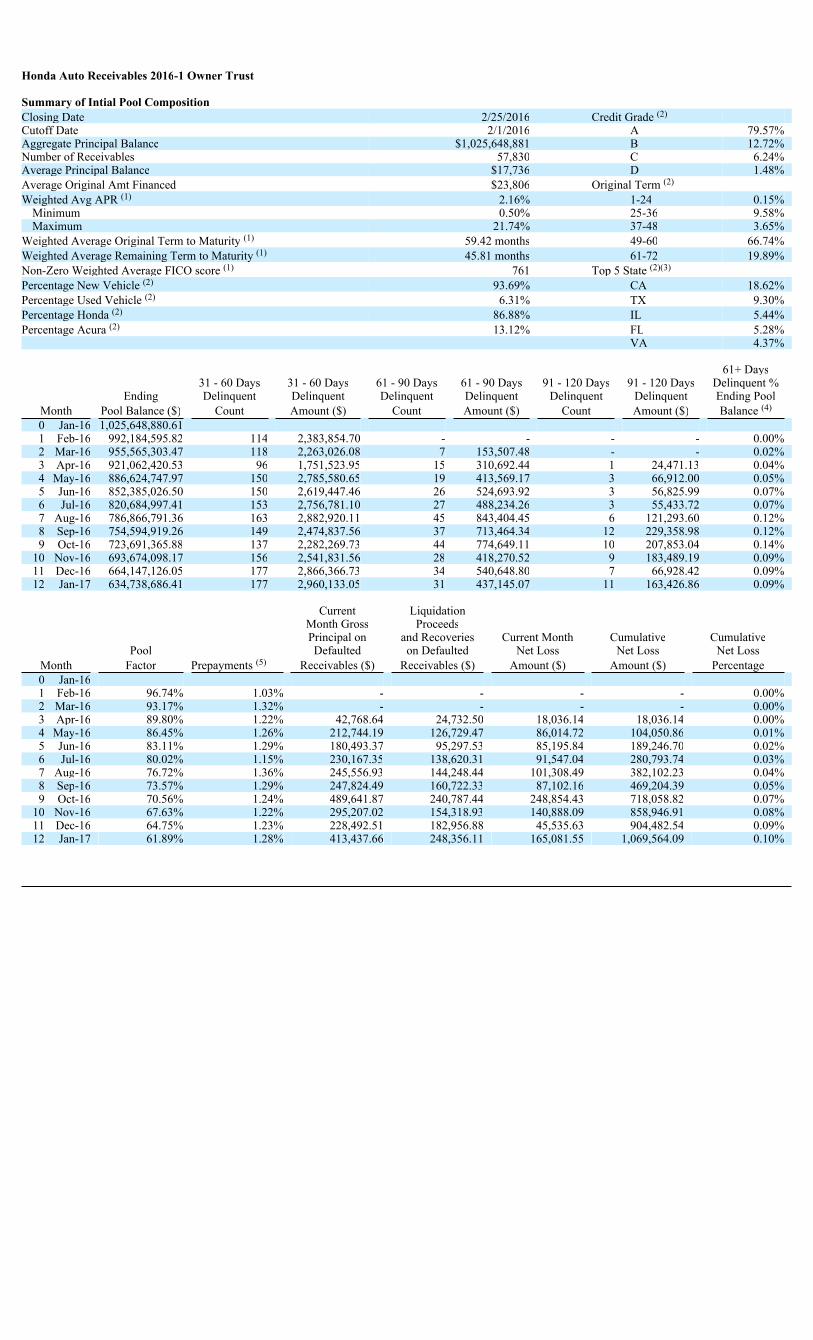
Honda Auto Receivables 2016-1 Owner Trust
Summary of Intial Pool CompositionClosing Date 2/25/2016 Credit Grade (2)
Cutoff Date 2/1/2016 A 79.57%Aggregate Principal Balance $1,025,648,881 B 12.72%Number of Receivables 57,830 C 6.24%Average Principal Balance $17,736 D 1.48%Average Original Amt Financed $23,806 Original Term (2)
Weighted Avg APR (1) 2.16% 1-24 0.15%Minimum 0.50% 25-36 9.58%Maximum 21.74% 37-48 3.65%
Weighted Average Original Term to Maturity (1) 59.42 months 49-60 66.74%Weighted Average Remaining Term to Maturity (1) 45.81 months 61-72 19.89%Non-Zero Weighted Average FICO score (1) 761 Top 5 State (2)(3)
Percentage New Vehicle (2) 93.69% CA 18.62%Percentage Used Vehicle (2) 6.31% TX 9.30%Percentage Honda (2) 86.88% IL 5.44%Percentage Acura (2) 13.12% FL 5.28%
VA 4.37%
61+ Days31 - 60 Days 31 - 60 Days 61 - 90 Days 61 - 90 Days 91 - 120 Days 91 - 120 Days Delinquent %
Ending Delinquent Delinquent Delinquent Delinquent Delinquent Delinquent Ending PoolMonth Pool Balance ($) Count Amount ($) Count Amount ($) Count Amount ($) Balance (4)
0 Jan-16 1,025,648,880.611 Feb-16 992,184,595.82 114 2,383,854.70 - - - - 0.00%2 Mar-16 955,565,303.47 118 2,263,026.08 7 153,507.48 - - 0.02%3 Apr-16 921,062,420.53 96 1,751,523.95 15 310,692.44 1 24,471.13 0.04%4 May-16 886,624,747.97 150 2,785,580.65 19 413,569.17 3 66,912.00 0.05%5 Jun-16 852,385,026.50 150 2,619,447.46 26 524,693.92 3 56,825.99 0.07%6 Jul-16 820,684,997.41 153 2,756,781.10 27 488,234.26 3 55,433.72 0.07%7 Aug-16 786,866,791.36 163 2,882,920.11 45 843,404.45 6 121,293.60 0.12%8 Sep-16 754,594,919.26 149 2,474,837.56 37 713,464.34 12 229,358.98 0.12%9 Oct-16 723,691,365.88 137 2,282,269.73 44 774,649.11 10 207,853.04 0.14%
10 Nov-16 693,674,098.17 156 2,541,831.56 28 418,270.52 9 183,489.19 0.09%11 Dec-16 664,147,126.05 177 2,866,366.73 34 540,648.80 7 66,928.42 0.09%12 Jan-17 634,738,686.41 177 2,960,133.05 31 437,145.07 11 163,426.86 0.09%
Current LiquidationMonth Gross ProceedsPrincipal on and Recoveries Current Month Cumulative Cumulative
Pool Defaulted on Defaulted Net Loss Net Loss Net LossMonth Factor Prepayments (5) Receivables ($) Receivables ($) Amount ($) Amount ($) Percentage0 Jan-161 Feb-16 96.74% 1.03% - - - - 0.00%2 Mar-16 93.17% 1.32% - - - - 0.00%3 Apr-16 89.80% 1.22% 42,768.64 24,732.50 18,036.14 18,036.14 0.00%4 May-16 86.45% 1.26% 212,744.19 126,729.47 86,014.72 104,050.86 0.01%5 Jun-16 83.11% 1.29% 180,493.37 95,297.53 85,195.84 189,246.70 0.02%6 Jul-16 80.02% 1.15% 230,167.35 138,620.31 91,547.04 280,793.74 0.03%7 Aug-16 76.72% 1.36% 245,556.93 144,248.44 101,308.49 382,102.23 0.04%8 Sep-16 73.57% 1.29% 247,824.49 160,722.33 87,102.16 469,204.39 0.05%9 Oct-16 70.56% 1.24% 489,641.87 240,787.44 248,854.43 718,058.82 0.07%
10 Nov-16 67.63% 1.22% 295,207.02 154,318.93 140,888.09 858,946.91 0.08%11 Dec-16 64.75% 1.23% 228,492.51 182,956.88 45,535.63 904,482.54 0.09%12 Jan-17 61.89% 1.28% 413,437.66 248,356.11 165,081.55 1,069,564.09 0.10%
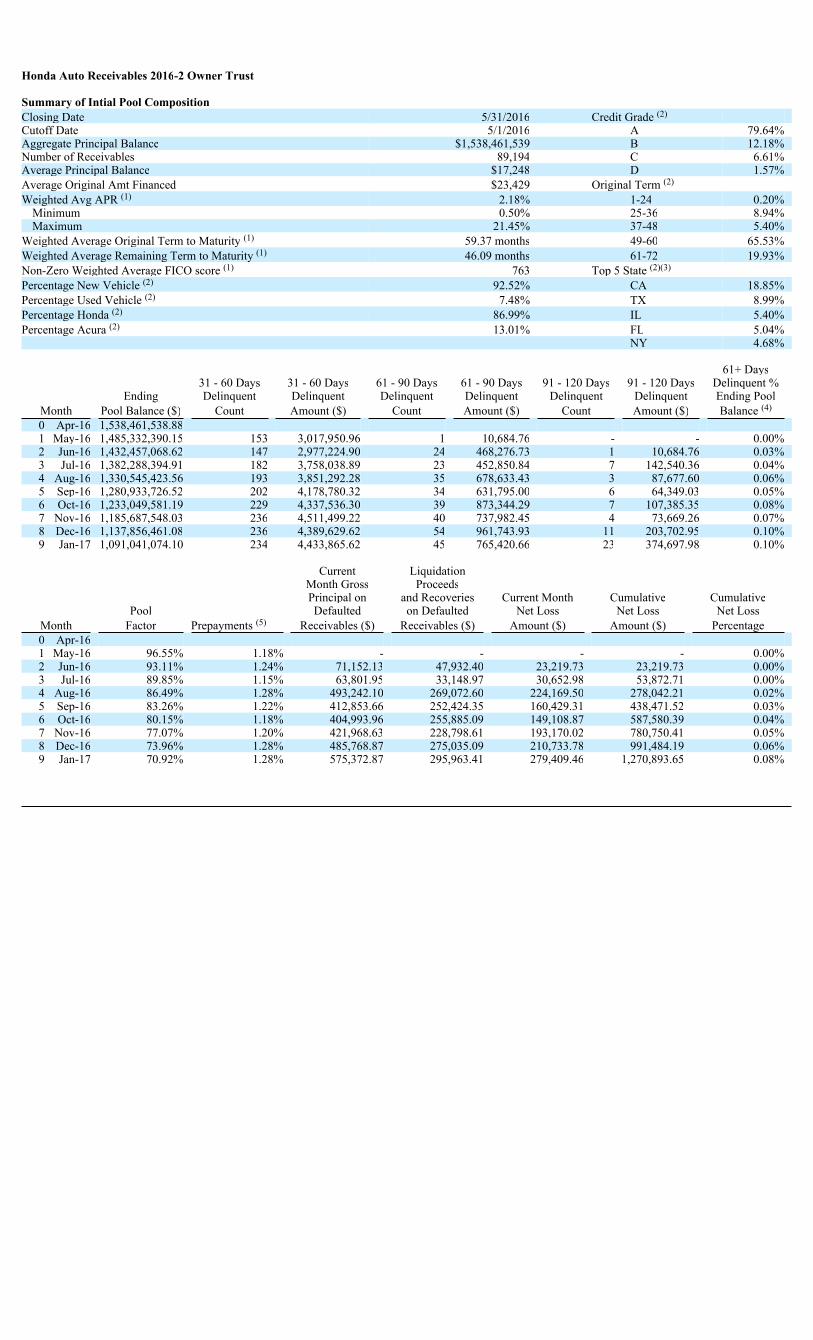
Honda Auto Receivables 2016-2 Owner Trust
Summary of Intial Pool CompositionClosing Date 5/31/2016 Credit Grade (2)
Cutoff Date 5/1/2016 A 79.64%Aggregate Principal Balance $1,538,461,539 B 12.18%Number of Receivables 89,194 C 6.61%Average Principal Balance $17,248 D 1.57%Average Original Amt Financed $23,429 Original Term (2)
Weighted Avg APR (1) 2.18% 1-24 0.20%Minimum 0.50% 25-36 8.94%Maximum 21.45% 37-48 5.40%
Weighted Average Original Term to Maturity (1) 59.37 months 49-60 65.53%Weighted Average Remaining Term to Maturity (1) 46.09 months 61-72 19.93%Non-Zero Weighted Average FICO score (1) 763 Top 5 State (2)(3)
Percentage New Vehicle (2) 92.52% CA 18.85%Percentage Used Vehicle (2) 7.48% TX 8.99%Percentage Honda (2) 86.99% IL 5.40%Percentage Acura (2) 13.01% FL 5.04%
NY 4.68%
61+ Days31 - 60 Days 31 - 60 Days 61 - 90 Days 61 - 90 Days 91 - 120 Days 91 - 120 Days Delinquent %
Ending Delinquent Delinquent Delinquent Delinquent Delinquent Delinquent Ending PoolMonth Pool Balance ($) Count Amount ($) Count Amount ($) Count Amount ($) Balance (4)
0 Apr-16 1,538,461,538.881 May-16 1,485,332,390.15 153 3,017,950.96 1 10,684.76 - - 0.00%2 Jun-16 1,432,457,068.62 147 2,977,224.90 24 468,276.73 1 10,684.76 0.03%3 Jul-16 1,382,288,394.91 182 3,758,038.89 23 452,850.84 7 142,540.36 0.04%4 Aug-16 1,330,545,423.56 193 3,851,292.28 35 678,633.43 3 87,677.60 0.06%5 Sep-16 1,280,933,726.52 202 4,178,780.32 34 631,795.00 6 64,349.03 0.05%6 Oct-16 1,233,049,581.19 229 4,337,536.30 39 873,344.29 7 107,385.35 0.08%7 Nov-16 1,185,687,548.03 236 4,511,499.22 40 737,982.45 4 73,669.26 0.07%8 Dec-16 1,137,856,461.08 236 4,389,629.62 54 961,743.93 11 203,702.95 0.10%9 Jan-17 1,091,041,074.10 234 4,433,865.62 45 765,420.66 23 374,697.98 0.10%
Current LiquidationMonth Gross ProceedsPrincipal on and Recoveries Current Month Cumulative Cumulative
Pool Defaulted on Defaulted Net Loss Net Loss Net LossMonth Factor Prepayments (5) Receivables ($) Receivables ($) Amount ($) Amount ($) Percentage0 Apr-161 May-16 96.55% 1.18% - - - - 0.00%2 Jun-16 93.11% 1.24% 71,152.13 47,932.40 23,219.73 23,219.73 0.00%3 Jul-16 89.85% 1.15% 63,801.95 33,148.97 30,652.98 53,872.71 0.00%4 Aug-16 86.49% 1.28% 493,242.10 269,072.60 224,169.50 278,042.21 0.02%5 Sep-16 83.26% 1.22% 412,853.66 252,424.35 160,429.31 438,471.52 0.03%6 Oct-16 80.15% 1.18% 404,993.96 255,885.09 149,108.87 587,580.39 0.04%7 Nov-16 77.07% 1.20% 421,968.63 228,798.61 193,170.02 780,750.41 0.05%8 Dec-16 73.96% 1.28% 485,768.87 275,035.09 210,733.78 991,484.19 0.06%9 Jan-17 70.92% 1.28% 575,372.87 295,963.41 279,409.46 1,270,893.65 0.08%
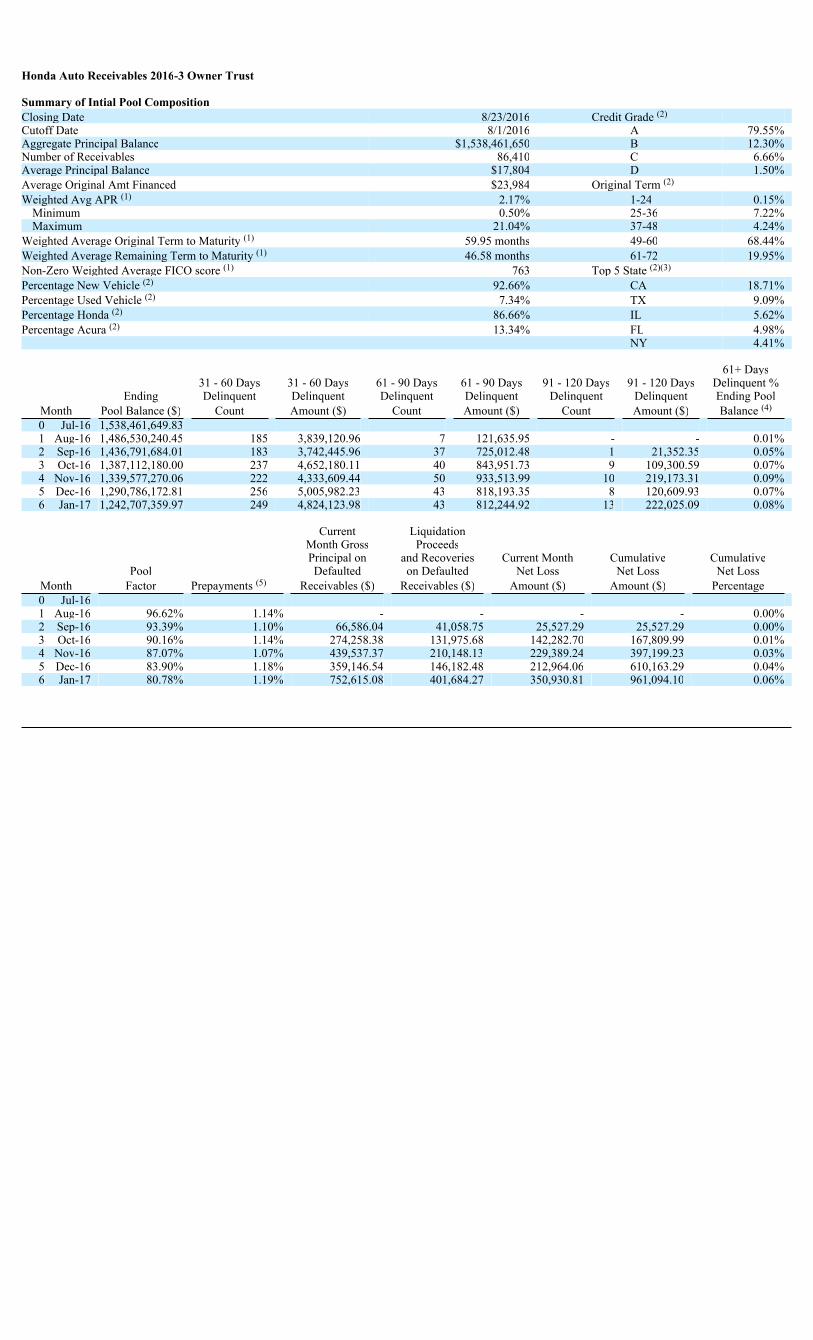
Honda Auto Receivables 2016-3 Owner Trust
Summary of Intial Pool CompositionClosing Date 8/23/2016 Credit Grade (2)
Cutoff Date 8/1/2016 A 79.55%Aggregate Principal Balance $1,538,461,650 B 12.30%Number of Receivables 86,410 C 6.66%Average Principal Balance $17,804 D 1.50%Average Original Amt Financed $23,984 Original Term (2)
Weighted Avg APR (1) 2.17% 1-24 0.15%Minimum 0.50% 25-36 7.22%Maximum 21.04% 37-48 4.24%
Weighted Average Original Term to Maturity (1) 59.95 months 49-60 68.44%Weighted Average Remaining Term to Maturity (1) 46.58 months 61-72 19.95%Non-Zero Weighted Average FICO score (1) 763 Top 5 State (2)(3)
Percentage New Vehicle (2) 92.66% CA 18.71%Percentage Used Vehicle (2) 7.34% TX 9.09%Percentage Honda (2) 86.66% IL 5.62%Percentage Acura (2) 13.34% FL 4.98%
NY 4.41%
61+ Days31 - 60 Days 31 - 60 Days 61 - 90 Days 61 - 90 Days 91 - 120 Days 91 - 120 Days Delinquent %
Ending Delinquent Delinquent Delinquent Delinquent Delinquent Delinquent Ending PoolMonth Pool Balance ($) Count Amount ($) Count Amount ($) Count Amount ($) Balance (4)
0 Jul-16 1,538,461,649.831 Aug-16 1,486,530,240.45 185 3,839,120.96 7 121,635.95 - - 0.01%2 Sep-16 1,436,791,684.01 183 3,742,445.96 37 725,012.48 1 21,352.35 0.05%3 Oct-16 1,387,112,180.00 237 4,652,180.11 40 843,951.73 9 109,300.59 0.07%4 Nov-16 1,339,577,270.06 222 4,333,609.44 50 933,513.99 10 219,173.31 0.09%5 Dec-16 1,290,786,172.81 256 5,005,982.23 43 818,193.35 8 120,609.93 0.07%6 Jan-17 1,242,707,359.97 249 4,824,123.98 43 812,244.92 13 222,025.09 0.08%
Current LiquidationMonth Gross ProceedsPrincipal on and Recoveries Current Month Cumulative Cumulative
Pool Defaulted on Defaulted Net Loss Net Loss Net LossMonth Factor Prepayments (5) Receivables ($) Receivables ($) Amount ($) Amount ($) Percentage0 Jul-161 Aug-16 96.62% 1.14% - - - - 0.00%2 Sep-16 93.39% 1.10% 66,586.04 41,058.75 25,527.29 25,527.29 0.00%3 Oct-16 90.16% 1.14% 274,258.38 131,975.68 142,282.70 167,809.99 0.01%4 Nov-16 87.07% 1.07% 439,537.37 210,148.13 229,389.24 397,199.23 0.03%5 Dec-16 83.90% 1.18% 359,146.54 146,182.48 212,964.06 610,163.29 0.04%6 Jan-17 80.78% 1.19% 752,615.08 401,684.27 350,930.81 961,094.10 0.06%
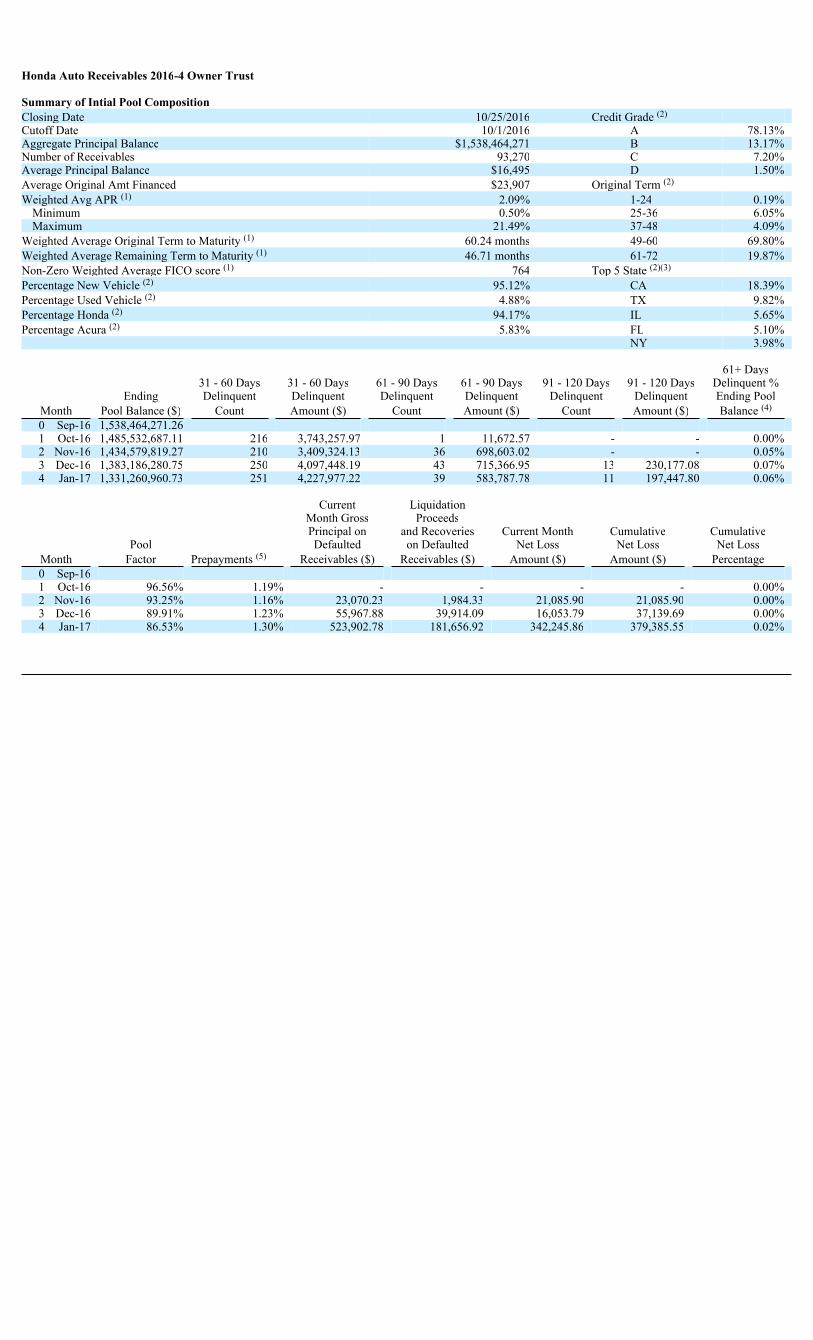
Honda Auto Receivables 2016-4 Owner Trust
Summary of Intial Pool CompositionClosing Date 10/25/2016 Credit Grade (2)
Cutoff Date 10/1/2016 A 78.13%Aggregate Principal Balance $1,538,464,271 B 13.17%Number of Receivables 93,270 C 7.20%Average Principal Balance $16,495 D 1.50%Average Original Amt Financed $23,907 Original Term (2)
Weighted Avg APR (1) 2.09% 1-24 0.19%Minimum 0.50% 25-36 6.05%Maximum 21.49% 37-48 4.09%
Weighted Average Original Term to Maturity (1) 60.24 months 49-60 69.80%Weighted Average Remaining Term to Maturity (1) 46.71 months 61-72 19.87%Non-Zero Weighted Average FICO score (1) 764 Top 5 State (2)(3)
Percentage New Vehicle (2) 95.12% CA 18.39%Percentage Used Vehicle (2) 4.88% TX 9.82%Percentage Honda (2) 94.17% IL 5.65%Percentage Acura (2) 5.83% FL 5.10%
NY 3.98%
61+ Days31 - 60 Days 31 - 60 Days 61 - 90 Days 61 - 90 Days 91 - 120 Days 91 - 120 Days Delinquent %
Ending Delinquent Delinquent Delinquent Delinquent Delinquent Delinquent Ending PoolMonth Pool Balance ($) Count Amount ($) Count Amount ($) Count Amount ($) Balance (4)
0 Sep-16 1,538,464,271.261 Oct-16 1,485,532,687.11 216 3,743,257.97 1 11,672.57 - - 0.00%2 Nov-16 1,434,579,819.27 210 3,409,324.13 36 698,603.02 - - 0.05%3 Dec-16 1,383,186,280.75 250 4,097,448.19 43 715,366.95 13 230,177.08 0.07%4 Jan-17 1,331,260,960.73 251 4,227,977.22 39 583,787.78 11 197,447.80 0.06%
Current LiquidationMonth Gross ProceedsPrincipal on and Recoveries Current Month Cumulative Cumulative
Pool Defaulted on Defaulted Net Loss Net Loss Net LossMonth Factor Prepayments (5) Receivables ($) Receivables ($) Amount ($) Amount ($) Percentage0 Sep-161 Oct-16 96.56% 1.19% - - - - 0.00%2 Nov-16 93.25% 1.16% 23,070.23 1,984.33 21,085.90 21,085.90 0.00%3 Dec-16 89.91% 1.23% 55,967.88 39,914.09 16,053.79 37,139.69 0.00%4 Jan-17 86.53% 1.30% 523,902.78 181,656.92 342,245.86 379,385.55 0.02%
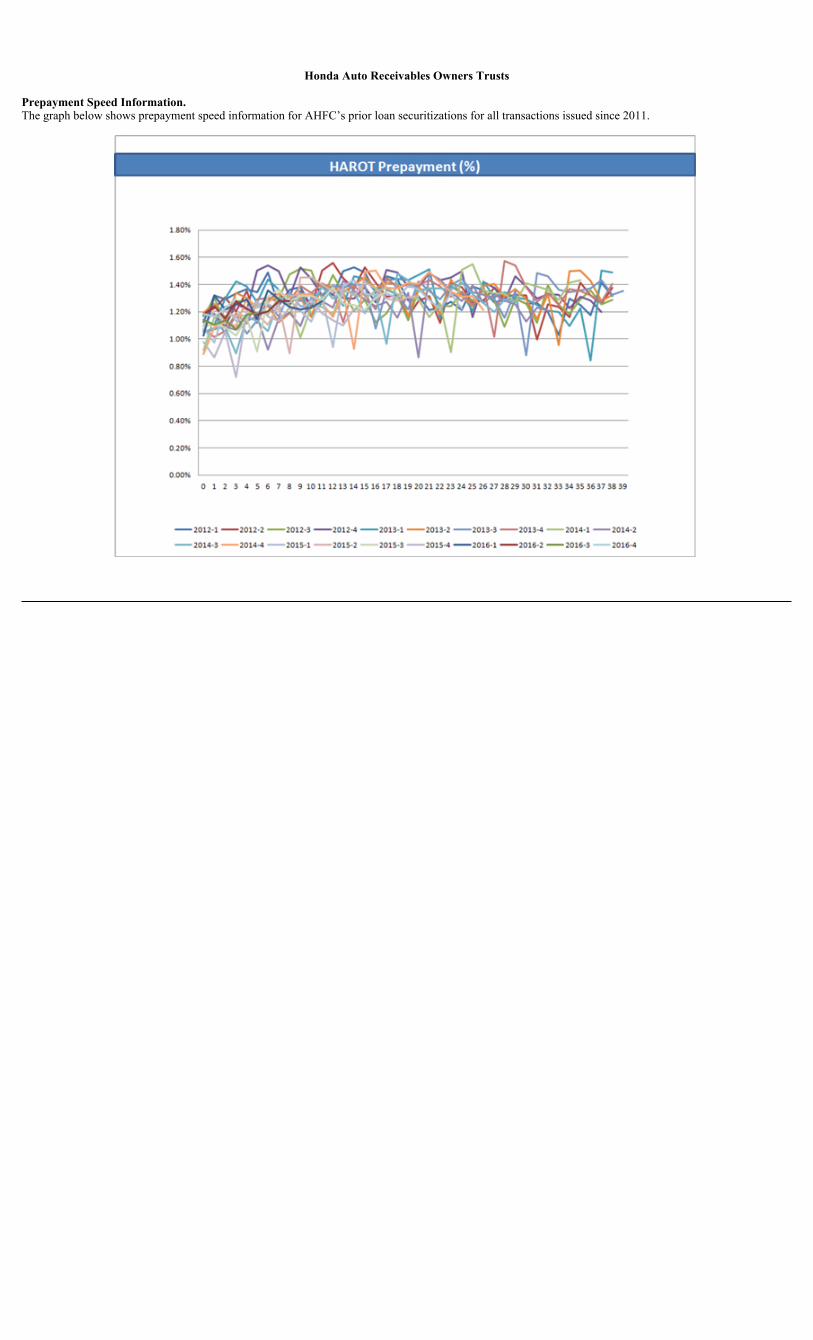
Honda Auto Receivables Owners Trusts
Prepayment Speed Information.The graph below shows prepayment speed information for AHFC’s prior loan securitizations for all transactions issued since 2011.
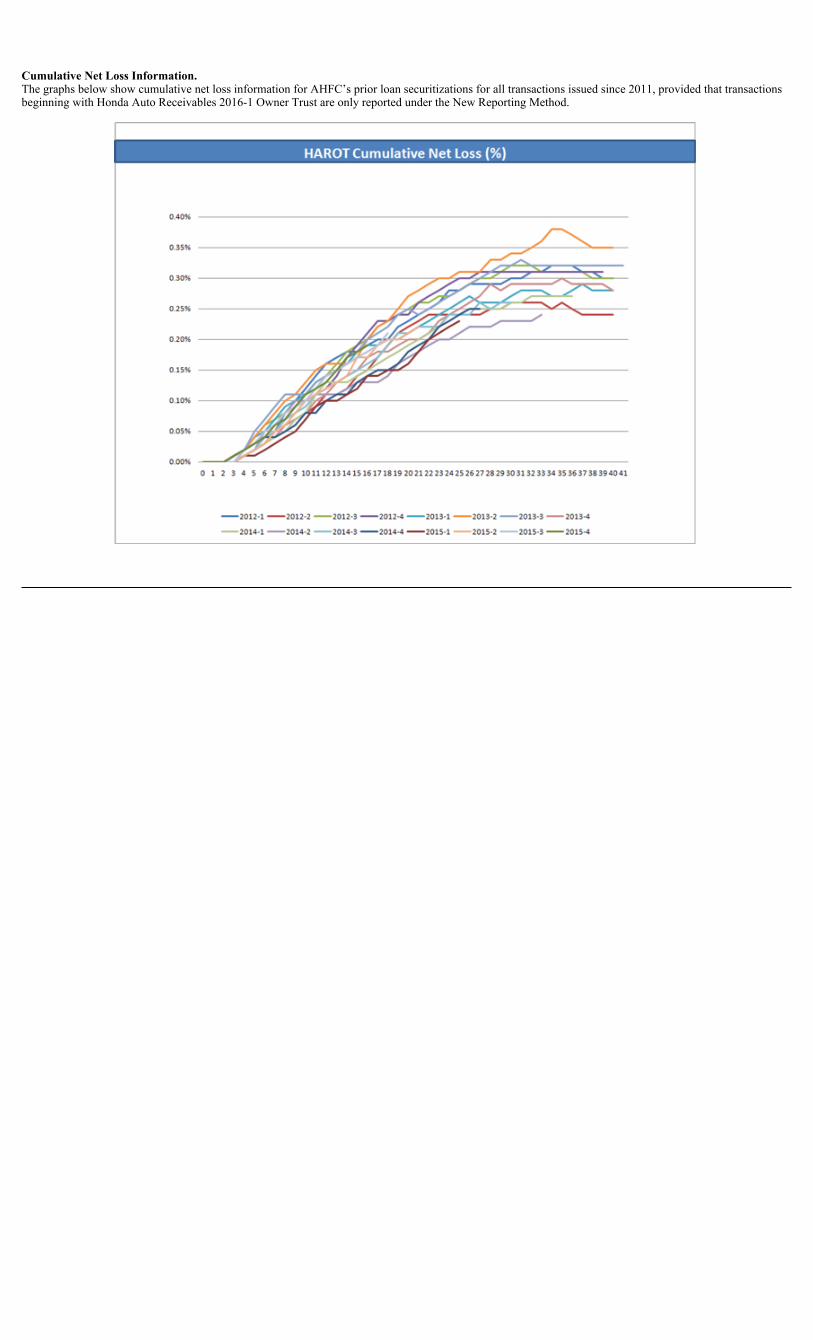
Cumulative Net Loss Information.The graphs below show cumulative net loss information for AHFC’s prior loan securitizations for all transactions issued since 2011, provided that transactions beginning with Honda Auto Receivables 2016-1 Owner Trust are only reported under the New Reporting Method.
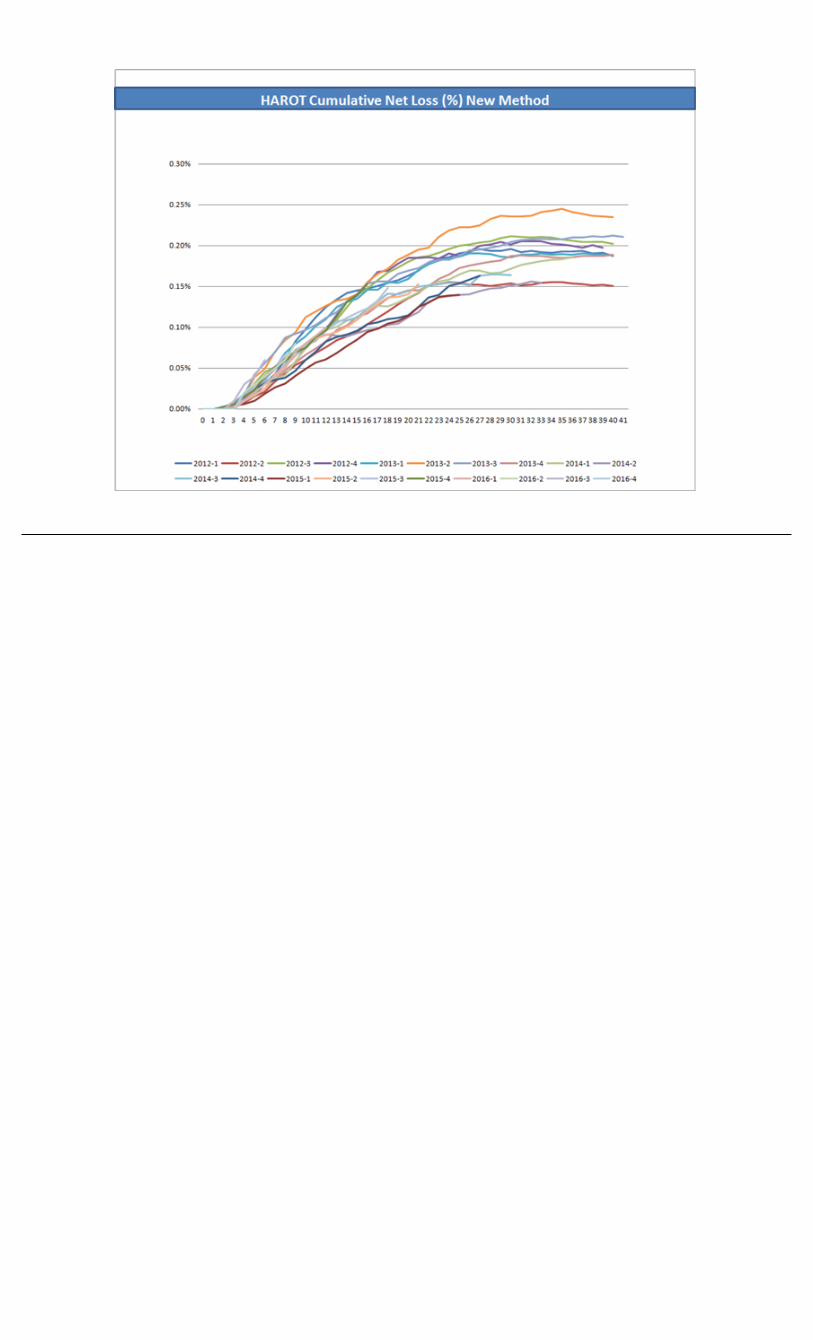
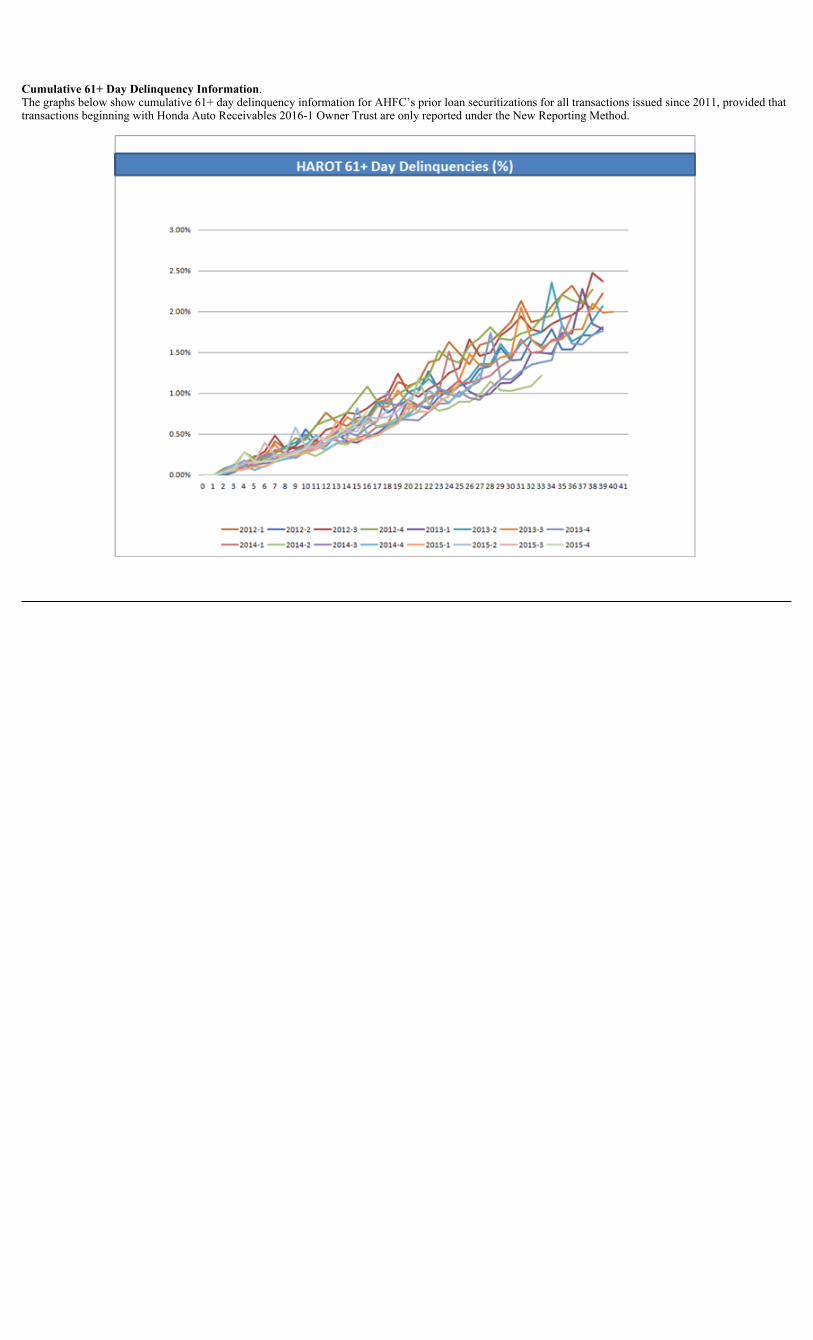
Cumulative 61+ Day Delinquency Information.The graphs below show cumulative 61+ day delinquency information for AHFC’s prior loan securitizations for all transactions issued since 2011, provided that transactions beginning with Honda Auto Receivables 2016-1 Owner Trust are only reported under the New Reporting Method.