Embed Size (px)
Citation preview

Issues in the Costing of Large Projects in Health and Healthcare
Centre for Health Economics Research and Evaluation
June 2008

NSW DEPARTMENT OF HEALTH
73 Miller Street
NORTH SYDNEY NSW 2060
Tel. (02) 9391 9000
Fax. (02) 9391 9101
TTY. (02) 9391 9900
www.health.nsw.gov.au
This work is copyright. It may be reproduced in whole or in part for study or
training purposes, subject to the inclusion of an acknowledgement of the
source. It may not be reproduced for commercial usage or sale. Reproduction
for purposes other than those indicated above, requires written permission
from the NSW Department of Health.
© NSW Department of Health 2008
SHPN (CHA) 080269
ISBN 978 1 74187 275 0
For further copies of this document please contact:
Better Health Centre – Publications Warehouse
Locked Mail Bag 5003
Gladesville NSW 2111
Tel. (02) 9816 0452
Fax. (02) 9816 0492
February 2009

NSW HEALTH Issues in the Costing of Large Projects in Health and Healthcare – June 2008 PAGE 1
Contents
Acknowledgements .......................................................2
Terms and Definitions Used in This How To Guide .........3
Introduction ...................................................................4
Cost Classifications ........................................................5
Direct Costs and Indirect Costs ......................................5
Fixed costs and variable costs .........................................5
Unit Costs ......................................................................7
How do we estimate unit costs? ....................................7
Which Approach is Preferred? .......................................8
The Role of Costing in Economic Evaluation ..................9
Steps in Producing Unit Costs ......................................11
The Example of the National Cervical Cancer Screening Program (NCSP) ...........................................12
Key facets of costing ...................................................15
Some lessons from existing costing analyses ................16
Appendix 1: Data Collection for Large Scale Programs ............................................................18
Tables
Table 1: Decision Making Using the ICER .......................9
Table 2: Cost Inclusion Under Different Perspectives ....10
Table 3: Costs of the NCSP ..........................................14

PAGE 2 NSW HEALTH Issues in the Costing of Large Projects in Health and Healthcare – June 2008
Acknowledgements
The authors would like to acknowledge the advice and
assistance of the following:
Andrew Milat Manager, Strategic Research and Development Branch, Centre for Health Advancement, NSW Health
Elizabeth Develin Director, Centre for Health Advancement, NSW Health
Robyn Newson Senior Policy Officer, Strategic Research and Development Branch Centre for Health Advancement
Sarah Thackway Director, Centre Epidemiology and Research, NSW Health
Lesley King Executive Officer, NSW Centre for Overweight and Obesity,
Louise Farrell Munch and Move Coordinator, NSW Prevention Research Centres
Luke Wolfenden Research Manager - Good for Kids. Good for Life, Hunter New England AHS
This work was undertaken as part of the Costing for
Health Economic Evaluation Program (CHEEP). NSW
Health and the Cancer Institute have contracted the
Centre for Health Economics Research and Evaluation
(CHERE), through the SAX Institute, to develop CHEEP.
The objectives of CHEEP are to:
n Provide evidence regarding the cost and consequences
of health interventions, services and systems that is
useful to NSW Health and the Cancer Institute NSW,
n Develop a model for defining and producing policy
relevant deliverables for these stakeholders;
n Develop and report new methods for studying, and
knowledge regarding, the costs and consequences of
health interventions, services and systems in the course
of its work for the stakeholders; and
n Build skills and capacity for undertaking these types of
analyses in New South Wales.

NSW HEALTH Issues in the Costing of Large Projects in Health and Healthcare – June 2008 PAGE 3
Terms and Definitions Used in This How to Guide
Activity An activity is a specific task, process or function that converts inputs (resources) into outputs (goods or services).
Activity based costing
Activity Based Costing (ABC) is a costing method used to assign costs associated with inputs to the production of goods and/or services (outputs). Outputs are measured in unit costs, which is the average cost of producing one unit of a good or service and may be goods, services, activities etc. ABC can be used with either the top-down or bottom-up approach to estimating unit costs.
Bottom-up approach
The bottom-up approach builds standard unit costs based on standard level of inputs and standard input prices, rather than using actual levels of inputs or prices. This approach is a forward looking costing method as the development of standard unit costs considers current/best practice, activities, cost drivers and service level specifications.
Cost driver A cost driver is a factor that has an effect on costs (either immediately or over a given time span), e.g. the level of activity or the volume of goods produced or services rendered.
Costing Costing is the process used for determining the cost of performing a given activity, e.g. manufacturing a good, rendering a service or performing a function.
Direct Cost A direct cost is a cost that is easily traceable to a particular cost object.
Economic Cost Economic costs include all financial costs, but also include non-financial costs e.g. the external costs to the community of increased crime.
Economies of Scale
Economies of scale occur as unit costs decrease in response to increases in the level of activity or output of an organisation.
Effective service hours
Effective service hours are the working hours for direct client activities excluding weekends, public holidays, all types of leave, training and non client related activities.
Establishment Cost
An establishment cost is an up-front capital and/or operating cost that is incurred to set up the provision of a new good or service or expand the provision of an existing one.
Establishment costs may be classified as direct or indirect costs.
Full time equivalent
A statistic representing the number of full-time employees that could have been employed if the reported number of hours worked by part-time employees had been worked by full-time employees. This statistic is calculated by dividing the ‘’part-time hours paid’’ by the standard number of hours for full-time employees and then adding the result to the number of full-time employees.
Indirect Cost An indirect cost is a cost that is not easily traceable to a particular cost object, generally because the cost is associated with more than one cost object.
Input An input is a resource used in an activity to produce a good or service, e.g. labour, materials and capital.
Output An output is a final good or service that is provided for external consumption, e.g. to children, young people, families and/or communities.
Overhead cost An overhead cost is a type of indirect cost associated with support services that contribute to the operation of goods or service provider. These costs can be significant and need to be allocated to cost objects.
Primary costs The primary costs associated with program management are related to the client support caseworker labour located at a central location and their associated costs, including motor vehicle, IT communications and other overheads.

PAGE 4 NSW HEALTH Issues in the Costing of Large Projects in Health and Healthcare – June 2008
Introduction
This document is a guide for all health promotion and
public health experts. It looks at a range of issues facing
professionals with relatively little experience in the area
of costing, identifying what questions they need to
ask, what they need to consider, and how they should
evaluate costing reports.
Some questions this document seeks to address are:
n How should an activity be defined?
n Which costs should be considered in a costing report?
n How should these costs be collected?
n How should these costs be developed to produce a
transparent and useful indication of the costs of an
activity?
n How should a costing report deal with uncertainty?
n If there is any issue regarding how to evaluate
or construct a costing report, what sources of
information are likely to be most helpful?
Costing in terms of public health and health promotion
programs is the collection of financial resource use
associated with an intervention or a program. Costing of
a program or intervention is important for two reasons.
The first, which can be loosely termed the accounting
and planning reason, is that it is important to be able to
identify where resources are flowing within a program
and whether the various arms are receiving money as
was intended in the original plan. The second reason
is that accurate and transparent costing analysis plays
a significant role in economic evaluation of health
and healthcare interventions. The way the analysis is
undertaken depends largely on the reason that a costing
exercise is being undertaken. The type of analysis may
differ according to the depth of the analysis, and the
costs that are included in the final figures. The work
presented here focuses primarily on the second of these
issues (ie costing required for inclusion in an economic
evaluation). It will highlight the key areas of divergence
between the economic evaluation side of costing and
the accountancy side.
This document aims to provide guidance in costing
programs and interventions for public health and health
promotion professionals and health sector managers.
It aims to:
n Outline the different kinds of costs a program might incur
and how they might be estimated accurately.
n Illustrate the implication of choice of perspective when
costing programs.
n Identify how accurate costing is an important aspect of
economic evaluation, the aim of which is to identify the
best use of scarce societal resources.
The structure of the report is as follows:
1. The issue of direct versus indirect costs is considered,
as well as the nature of costs (fixed, variable and
combinations of the two).
2. Costing approaches to develop unit costs are considered.
Top-down and bottom-up methods are discussed and
contrasted, identifying the relative merits of the two.
3. The role of costing as part of economic evaluation of
programs is discussed. Specifically, how accuracy in the
collection and interpretation of cost data is important
in balancing competing demands for limited financial
resources. This section deals with the important issue
of perspective.
4. A schematic representation of how to estimate unit costs
for a program is provided. While different programs will
use different methods to obtain costings based on the
availability of data and the configuration of the service
or program, this section aims to provide a system for
costing which is applicable across health promotion,
public health and clinical interventions and programs.
5. This approach is then illustrated with an example:
costing the National Cervical Cancer Screening Program.
6. A means of evaluating the quality of proposed and
existing costing reports is provided using a series of
questions.
7. Finally, some ideas about undertaking data collection for
large scale public health or health promotion programs,
and a sample data collection sheet are provided.

NSW HEALTH Issues in the Costing of Large Projects in Health and Healthcare – June 2008 PAGE 5
Cost Classifications
To track and compare types of costs, either over time or between different organisations, it is essential to have a good
understanding of how costs should be classified. This section will outline the most common dimensions along which
costs can be broken down and analysed.
Direct costs and indirect costs
Direct costs A direct cost is a cost that is easily traceable to a particular cost object. For example, the salary of a health professional can be traced to the program they are employed on. If the individual works across programs, the direct cost can be broken down in proportion to the amount of time the person spends on the programs.
Indirect costs An indirect cost is one which is not easily traceable to a particular cost object. An example of this might be meeting costs incurred by individuals from various projects at different points in time.
Clearly, there is a grey area between direct and indirect costs since many indirect costs can be transformed into direct
costs if investigation is undertaken. The person responsible for allocating costs to direct or indirect cost categories must
therefore consider the value in investigating and apportioning indirect costs more accurately. It should be noted that,
depending on the budget under consideration, a cost can be both direct and indirect. An example of this might be
the cost of a Human Resources manager supporting a Public Health program. This cost is a direct cost for the Human
Resources budget, but an indirect cost for each of the Public Health programs the individual supports.
Fixed costs and variable costs
Fixed costs A fixed cost is one which does not change in response to the level of activity in the short term. For example, office rental is a fixed cost for a Public Health program as, if the program increases its activities by 50%, the spending on office space remains constant. In the longer-run, the number of staff required to support the increase in activity may lead to a higher use of office space (and therefore make it a non-fixed cost) but, in the short-run, it is likely to remain constant.
Fixed costs
Co
sts
Output
120
100
80
60
40
20
0|
0
|
1000
|
2000
|
3000
|
4000
|
5000
|
6000

PAGE 6 NSW HEALTH Issues in the Costing of Large Projects in Health and Healthcare – June 2008
Variable costs A variable cost is one which does change as activity changes in the short run. If a Public Health program involves providing information packs to children, and, as a result of program expansion, the supply of information packs increases by 50%, the total cost of supplying information packs will increase by 50%.
As with the distinction between direct and indirect costs, there is uncertainty regarding whether certain costs are truly fixed or variable. There is a class in the middle known as semi-fixed costs, a subset of which is step costs.
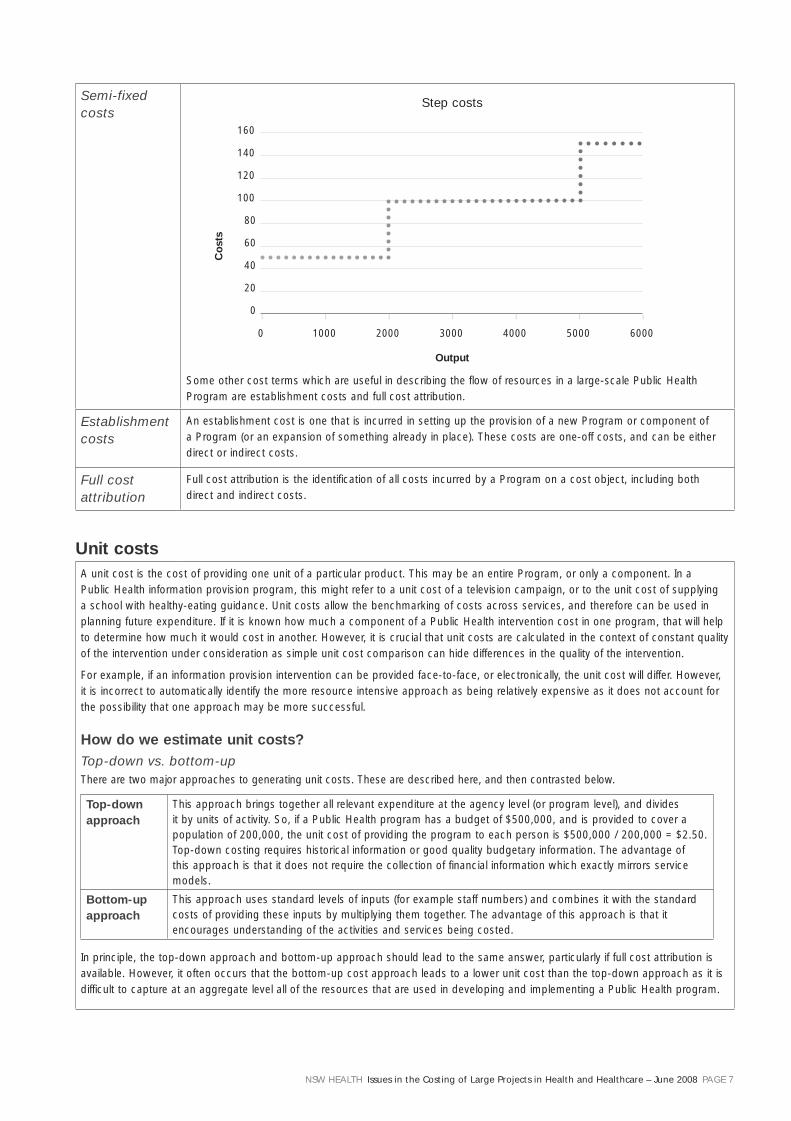
Semi-fixed costs
A semi-fixed cost has both fixed and variable components. In the previous example it was suggested that providing information packs to children was a variable cost. However, if the cost of the entire process of supplying these packs to children includes the salaries of the Public Health professional/s involved and the office space and creative input used in designing the packs, then the cost associated with the supply of the information packs is semi-fixed. A subset of semi-fixed costs is step costs. These are also made up of fixed and variable costs, but the total cost does not increase smoothly as activity increases. Rather, it is constant as activity increases over a particular range, and then increases dramatically at a point and then remains constant as activity continues to increase. Using the information pack example, a step cost would be transport costs for Public Health professionals involved in the Program. If they travel by car, a maximum of four can fit in a car. As activity increases to a point at which a fifth member is needed, the travel costs will increase significantly (they will approximately double) as a second car will be required.
Variable costs
Co
sts
Output
350
300
250
200
150
100
50
0|
0
|
1000
|
2000
|
3000
|
4000
|
5000
|
6000
Semi-fixed costs
Co
sts
Output
200
180
160
140
120
100
80
60
40
20
0|
0
|
1000
|
2000
|
3000
|
4000
|
5000
|
6000
NSW HEALTH Issues in the Costing of Large Projects in Health and Healthcare – June 2008 PAGE 7
Semi-fixed costs
Some other cost terms which are useful in describing the flow of resources in a large-scale Public Health Program are establishment costs and full cost attribution.
Establishment costs
An establishment cost is one that is incurred in setting up the provision of a new Program or component of a Program (or an expansion of something already in place). These costs are one-off costs, and can be either direct or indirect costs.
Full cost attribution
Full cost attribution is the identification of all costs incurred by a Program on a cost object, including both direct and indirect costs.
Unit costsA unit cost is the cost of providing one unit of a particular product. This may be an entire Program, or only a component. In a Public Health information provision program, this might refer to a unit cost of a television campaign, or to the unit cost of supplying a school with healthy-eating guidance. Unit costs allow the benchmarking of costs across services, and therefore can be used in planning future expenditure. If it is known how much a component of a Public Health intervention cost in one program, that will help to determine how much it would cost in another. However, it is crucial that unit costs are calculated in the context of constant quality of the intervention under consideration as simple unit cost comparison can hide differences in the quality of the intervention.
For example, if an information provision intervention can be provided face-to-face, or electronically, the unit cost will differ. However, it is incorrect to automatically identify the more resource intensive approach as being relatively expensive as it does not account for the possibility that one approach may be more successful.
How do we estimate unit costs?Top-down vs. bottom-upThere are two major approaches to generating unit costs. These are described here, and then contrasted below.
Top-down approach
This approach brings together all relevant expenditure at the agency level (or program level), and divides it by units of activity. So, if a Public Health program has a budget of $500,000, and is provided to cover a population of 200,000, the unit cost of providing the program to each person is $500,000 / 200,000 = $2.50. Top-down costing requires historical information or good quality budgetary information. The advantage of this approach is that it does not require the collection of financial information which exactly mirrors service models.
Bottom-up approach
This approach uses standard levels of inputs (for example staff numbers) and combines it with the standard costs of providing these inputs by multiplying them together. The advantage of this approach is that it encourages understanding of the activities and services being costed.
In principle, the top-down approach and bottom-up approach should lead to the same answer, particularly if full cost attribution is available. However, it often occurs that the bottom-up cost approach leads to a lower unit cost than the top-down approach as it is difficult to capture at an aggregate level all of the resources that are used in developing and implementing a Public Health program.
Output
Step costs
Co
sts
160
140
120
100
80
60
40
20
0|
0
|
1000
|
2000
|
3000
|
4000
|
5000
|
6000

PAGE 8 NSW HEALTH Issues in the Costing of Large Projects in Health and Healthcare – June 2008
Which Approach is Preferred?
Neither approach is intrinsically better than the other.
Top-down costing is likely to provide more accurate
costing details regarding the total resource use of an
activity. On the other hand, bottom-up costing is likely
to more accurately represent the cost per unit of activity.
The choice of which tool to adopt is dependent on the
needs of the project, the availability of detailed micro-
level data and the availability of resources needed to
analyse these data. The general rule is likely to be this:
If you are more interested in the costs of a program as
a whole, and are breaking it down into components
for the purpose of further investigation only, top-
down costing is likely to be preferable. However, if you
are more interested in the costs of components of a
program, bottom-up costing is likely to be preferable.
One additional advantage of bottom-up costing is that it
is more useful when adjusting a program for a different
population (for example if a school-based health
promotion activity was extended to a different age
group or a different geographic area). If the individual
contribution of different areas of costs can be identified
(which is the case when using bottom-up costing), it is
relatively straightforward to identify what would happen
to the total cost of the activity if certain aspects of it
were to change in tailoring it for the new population
group.
A flowchart for the estimation of unit costs is presented
on the next page, followed by a practical example in
a healthcare setting. The principles adopted in public
health interventions are comparable with those of health
promotion and clinical interventions.
NSW HEALTH Issues in the Costing of Large Projects in Health and Healthcare – June 2008 PAGE 9
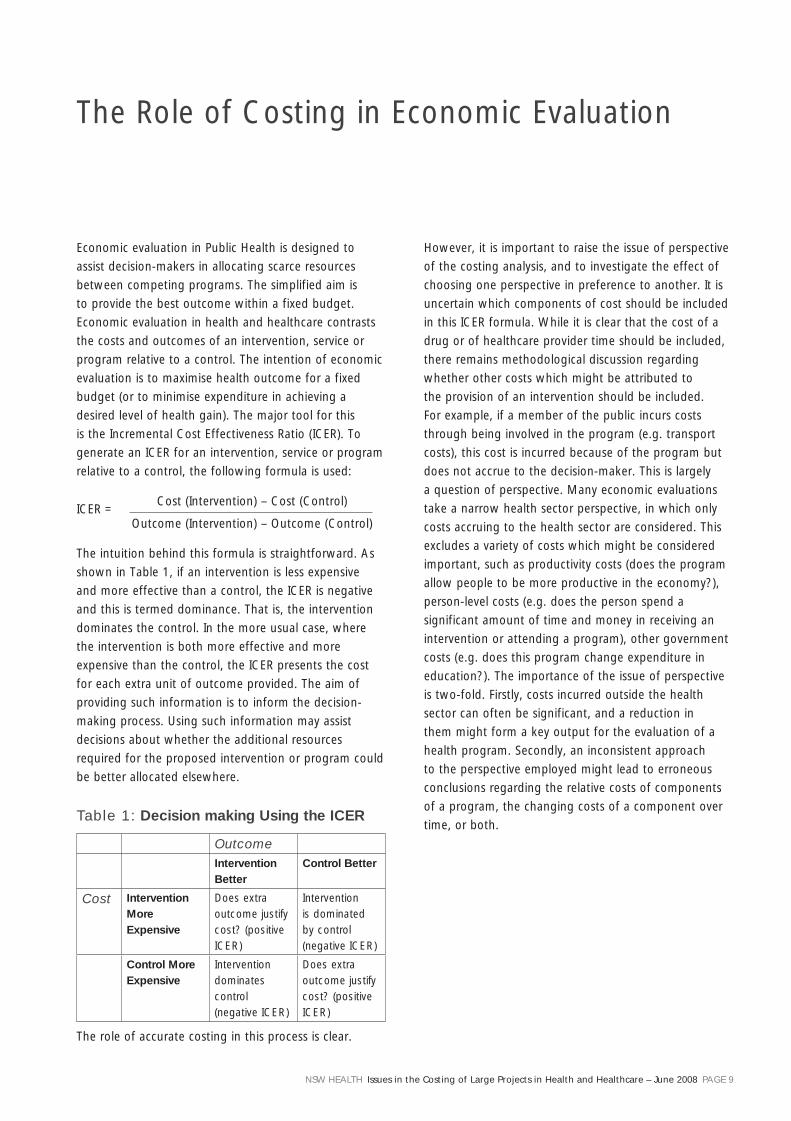
The Role of Costing in Economic Evaluation
Economic evaluation in Public Health is designed to
assist decision-makers in allocating scarce resources
between competing programs. The simplified aim is
to provide the best outcome within a fixed budget.
Economic evaluation in health and healthcare contrasts
the costs and outcomes of an intervention, service or
program relative to a control. The intention of economic
evaluation is to maximise health outcome for a fixed
budget (or to minimise expenditure in achieving a
desired level of health gain). The major tool for this
is the Incremental Cost Effectiveness Ratio (ICER). To
generate an ICER for an intervention, service or program
relative to a control, the following formula is used:
ICER = Cost (Intervention) – Cost (Control)
Outcome (Intervention) – Outcome (Control)
The intuition behind this formula is straightforward. As
shown in Table 1, if an intervention is less expensive
and more effective than a control, the ICER is negative
and this is termed dominance. That is, the intervention
dominates the control. In the more usual case, where
the intervention is both more effective and more
expensive than the control, the ICER presents the cost
for each extra unit of outcome provided. The aim of
providing such information is to inform the decision-
making process. Using such information may assist
decisions about whether the additional resources
required for the proposed intervention or program could
be better allocated elsewhere.
Table 1: Decision making Using the ICER
OutcomeIntervention Better
Control Better
Cost Intervention More Expensive
Does extra outcome justify cost? (positive ICER)
Intervention is dominated by control (negative ICER)
Control More Expensive
Intervention dominates control (negative ICER)
Does extra outcome justify cost? (positive ICER)
The role of accurate costing in this process is clear.
However, it is important to raise the issue of perspective
of the costing analysis, and to investigate the effect of
choosing one perspective in preference to another. It is
uncertain which components of cost should be included
in this ICER formula. While it is clear that the cost of a
drug or of healthcare provider time should be included,
there remains methodological discussion regarding
whether other costs which might be attributed to
the provision of an intervention should be included.
For example, if a member of the public incurs costs
through being involved in the program (e.g. transport
costs), this cost is incurred because of the program but
does not accrue to the decision-maker. This is largely
a question of perspective. Many economic evaluations
take a narrow health sector perspective, in which only
costs accruing to the health sector are considered. This
excludes a variety of costs which might be considered
important, such as productivity costs (does the program
allow people to be more productive in the economy?),
person-level costs (e.g. does the person spend a
significant amount of time and money in receiving an
intervention or attending a program), other government
costs (e.g. does this program change expenditure in
education?). The importance of the issue of perspective
is two-fold. Firstly, costs incurred outside the health
sector can often be significant, and a reduction in
them might form a key output for the evaluation of a
health program. Secondly, an inconsistent approach
to the perspective employed might lead to erroneous
conclusions regarding the relative costs of components
of a program, the changing costs of a component over
time, or both.

PAGE 10 NSW HEALTH Issues in the Costing of Large Projects in Health and Healthcare – June 2008
Table 2: Cost Inclusion Under Different Perspectives
Cost So
ciet
al
per
spec
tive
Hea
lth
sec
tor
per
spec
tive
Acc
ou
nta
ncy
p
ersp
ecti
ve
Public Health program material
Yes Yes Yes
Public Health professional time
Yes Yes Yes
Future costs to the health service
Yes Yes Probably not
The cost of individuals travelling to be involved in the program
Yes No No
The key advantage of using a societal perspective is that
it includes all costs which are incurred, irrespective of
where they occur. This prevents a situation occurring in
which a program is recommended on the basis of cost-
effectiveness, but appears cost-effective only because the
costs are shifted from (for example) the program to the
people participating in the program.
The counterpoint is noted by James Raftery, who
describes the difficulty in fully presenting the societal
perspective as there is a potentially large set of costs
which need to be considered (Raftery, 2000). Therefore,
the results of a costing analysis attempting to use a
societal perspective will necessarily be highly sensitive
to the components of societal cost considered.

NSW HEALTH Issues in the Costing of Large Projects in Health and Healthcare – June 2008 PAGE 11
Steps in Producing Unit Costs
Figure 1: Constructing Unit Costs
Step 1: Define the service and activities involved
n Define the good or service
n Identify all activities involved in producing the good or service
Step 2: Identify activity inputs and associated costs
n Identify a unit for measuring each activity
Top-down approach
– Collect cost data: direct, indirect and overhead costs
– Trace all direct costs to activities
– Trace all indirect costs to activities
Bottom-up approach
– Build up resource profile for each activity using best practices
– Establish standard input costs assumptions
Step 3: Gather total costs for each activity
Step 4: Calculate the unit cost for each activity
n Divide the total unit costs for each activity by the number of units
Step 5: Calculate the unit cost for each service (steps 4 and 5 can be combined if necessary)

PAGE 12 NSW HEALTH Issues in the Costing of Large Projects in Health and Healthcare – June 2008
The Example of the National Cervical Cancer Screening Program (NCSP)
This section builds on the schematic diagram presented
previously, outlining how to go about costing a program
in reality. Some of the content below is based on an
analysis undertaken within CHERE (Haas, Shanahan, &
Anderson, 2007).
Background
The Australian NCSP, a joint program of the
Commonwealth and State/Territory governments,
commenced in 1991. The Program operates on the
premise that organised regular screening using Pap
tests is an effective means of reducing morbidity and
mortality associated with cervical cancer. The program
aims to achieve these outcomes through encouraging
all States/Territories to meet agreed screening targets
among eligible women (all women aged 20-69 years).
The program was established against a background
of existing service delivery with general practitioners
providing most Pap tests. As a consequence, the focus
of the program was on changing existing service delivery
patterns and women’s behaviour rather than establishing
new health care services. However, some aspects of
the screening program were the direct result of specific
funding provided to the NCSP.
A major component of the NCSP is the organisation
and management within each State and Territory of a
Pap Test Register (PTR). The role of the PTR is to record
and monitor the outcome of Pap tests, ensure the
appropriate follow-up occurs, remind women when
their next Pap test is due and monitor the quality and
standard of pathology services. Other aspects of the
NCSP such as undertaking health promotion campaigns,
establishment of standards and performance measures
for the PTRs and for pathology laboratories are also
directly funded by the NCSP.
Following the flow-chart produced previously, the first
step is to define the service and activity involved:
Step 1: Define the service and activities involved
n Define the good or service
n Identify all activities involved in producing the good or service
To define the program, the following diagrammatic
description of the program was devised. Through
a description of the individual’s pathway through
the screening program, it is possible to identify the
components likely to include costs (i.e. recruitment,
education and communication, Pap test taking and
reading, program co-ordination, quality assurance
and monitoring, and follow-up).
A number of assumptions have been made in defining
the activity. For example, it is clear that costs to the
women have not been included. Therefore, time off
work, or travel costs are not considered. As discussed in
the section on perspective, this is a defensible position
to take but must be made explicit in the costing analysis.
Step 2: Identify activity inputs and associated costs
n Identify a unit for measuring each activity
Top-down approach
– Collect cost data: direct, indirect and overhead costs
– Trace all direct costs to activities
– Trace all indirect costs to activities
Bottom-up approach
– Build up resource profile for each activity using best practices
– Establish standard input costs assumptions
Step 2 involves identifying the types of costs accruing
in the program. Some were mainly fixed costs (such as
quality assurance), while some were variable (such as
Pap test costs). This means that an increase in the size of
the program will lead to an approximately proportional
increase in the cost of Pap test, but a much less than
proportional (or even zero) increase in the cost of quality
assurance.
Due to data limitations, in this example, a combination
of top-down and bottom-up costing was adopted. For
example, the cost of committee support and project
monitoring was costed using a top-down methodology,
with the aggregate figure being divided by the total
number of participating women to provide a unit cost.
On the other hand, medical expenses covered by the
Medical Benefits Schedule (MBS) were estimated using
a bottom-up approach. The cost per expense item was

NSW HEALTH Issues in the Costing of Large Projects in Health and Healthcare – June 2008 PAGE 13
known from the MBS listing, and this was multiplied
by the number of times each expense appeared within
Health Insurance Commission (HIC) MBS claims data.
Step 3: Gather total costs for each activity
As shown in Table 3, the total costs were then collected
using either bottom-up or top-down methods. It is
important at this stage to identify all assumptions
made in fitting sometimes imperfect data into the form
required to generate an accurate costing estimate.
Step 4: Calculate the unit cost for each activity
n Divide the total unit costs for each activity by the number of units
Step 5: Calculate the unit cost for each service (step 4 and 5 can be combined if necessary)
Steps 4 and 5 were not undertaken by Haas and
colleagues. However, they reported the total cost of
the program (i.e. $122 Million in 1997, $118 Million in
1998), and this can be combined with information from
the Australian Institute of Health and Welfare (AIHW)
(Australian Institute of Health and Welfare, 2000) to
provide a cost per screened woman. The AIHW figures
suggest that, over the two years, 2,721,650 women
were screened, suggesting a unit cost of $240 Million
/ 2.721 Million = $88. This figure can easily be broken
down by activity (e.g. the amount per woman spent on
education, recruitment etc), and a good quality costing
analysis would allow this breakdown to take place.
Table 3, providing the costs of the NCSP is provided
over:
Recruitment
Screening
Notification of Results
No Abnormality Detected
Treatment and Management
Ongoing Management
Diagnostic Investigation
False
Positives
Screening Reminder
Recruitment, Education and Communication
Smear Taking, Reading
Follow Up
SCREENING PROGRAM

PAGE 14 NSW HEALTH Issues in the Costing of Large Projects in Health and Healthcare – June 2008
Table 3: Costs of the NCSP
Costs to Government Units
Annual expenditure $’000s
Annual expenditure $’000s
Estimation assumptions and other comments
Committee support/Projects monitoring
N/A 315 Maximum level of detail that could be supplied
Salaries and Administration N/A 321
Communication activities N/A 186
Total health services coordination – DOHA
822 A
Coordination of the program N/A 1,802 From 7 of the 8 States and Territories
Monitoring and evaluation N/A 364 From 7 of the 8 States and Territories
Registry functions N/A 4,367 From all of the States and Territories
Education N/A 970 Only available from 3 States and Territories
Recruitment of women N/A 3,250 From all of the States and Territories
Other N/A 1,710 From 5 of the 8 States and Territories
Total health services coordination (State/Territory)
12,463 B
GP/Specialist smear-taking 1,616,656 + 311,040 =
1,927,6961
36,199 Annual counts of total smears1 (in private and public laboratories respectively) multiplied by weighted GP/specialist fee2 (= $28.89), and adjusted for multi-cause attendances (estimated that for every 20 consultations including a Pap smear, 13 (65%) consultation fees could be attributed to the taking of the Pap smear3.
Pathology (Cytology) examination for smears
1,927,6761 30,313 Counts of total smears1, multiplied by pathology fee (85% of $18.50 MBS fee) of $15.73
Patient episode initiation (PEI) fee claims
1,266,623 8.613 Counts of the number of PEI fees claimed1, multiplied by the PEI fee (85% of $8 MBS fee) of $6.80
Total cost of Pap smears 75,125
Medical procedures various MBS items
9,169 Summing the counts of diagnostic services provided1, multiplied by 85% of the relevant MBS fee
Specialist consultations 160,317 8,837 Number of different medical procedures carried out1, multiplied by fee specialist for a specialist consultation of $55.12 (= 85% of $64.85)
Histopathology tests various MBS items
3,054 Number of examinations of three different levels of complexity/biopsy sample type1, multiplied by 85% of the relevant MBS fee
Hospital costs various MBS items
9,257 Hospital and anaesthesia costs1 by MBS code or DRG (excluding expenditures relating toe chemotherapy, radiotherapy and palliative care)
Total diagnosis and management
30,318
Total health services provision 105,443,000 C
Total cost of the NCSP 118,729,000 (= A + B + C)
Sources:
1 Health Insurance Commission (HIC) MBS claims data
2 AIHW internal document
3 BEACH Study (Bettering the Evaluation And Care of Health, rolling survey of general practice activity)

NSW HEALTH Issues in the Costing of Large Projects in Health and Healthcare – June 2008 PAGE 15
Key facets of costing
Graves et al. identified four categories of questions that
should be addressed for costing analysis to be transparent
and thorough. (Graves, Walker, Raine, Hutchings, & Roberts,
2002) Therefore, in undertaking or in evaluating a costing,
it is essential that these questions can be answered and the
answers justified. The categories developed by Graves et al.,
with their constituent questions are presented below.
Category 1: General Costing Issues
Question 1: ‘Was the perspective of the cost analysis
stated?’
Question 2: ‘Was the perspective of the cost analysis
justified?’
Question 3: ‘If the response to Question 1 was
‘Yes’, were cost data included that satisfied the stated
perspective?’
Question 4: ‘Did the authors make a distinction
between short and long run costs?’
These questions target the transparency of the costing
analysis. Due to the methodological issues discussed
previously, it is uncertain which perspective is most
appropriate. However, it is clear that any costing analysis
should state a perspective, and follow the implicit
inclusion / exclusion criteria.
Category 2: Methods Used to Determine the Quantities of Resources
Question 5: ‘Were methods given for estimating the
quantities of resources (that reflected variable costs) used
per participant?’
Question 6: ‘Were methods given for allocating the
time of human resources (semi-fixed costs) between
participants?’
Question 7: ‘If relevant, were methods given for
allocating the use of other resources (fixed costs)
between participants?’
These questions are most concerned with the complete
allocation of resources to the costing analysis. Thus,
costing analyses should present all inputs and allocate
them appropriately between participants.
Category 3: Methods Used to Determine the Value of Resources Consumed
Question 8: ‘Were methods given for the estimation
of any prices, unit costs or charges?’
Question 9: ‘Were data other than program charges,
or charges developed by third party payers used?’
Question 9 is important as it deals with the issue of
opportunity cost. Opportunity cost, the preferred cost in
economic evaluation, is the benefit foregone by choosing a
particular approach compared with the next best alternative.
Category 4: Reporting of Data
Question 10: ‘Was the year(s) reported in which the
cost data were collected?’
Question 11: ‘Was the base cost year reported?’
Question 12: ‘Were adjustments made for costs
incurred in different time periods?’
All costs within a costing analysis for an economic
evaluation need to be estimated in a common base year.
This is important as prices change (generally upwards)
over time so using a relatively old cost figure for an
item will underestimate the true cost. The adjustments
referred to in Question 12 refer to both adjusting for
inflation, and for time preference. Time preference
(often called “discounting”) is an important concept in
economic evaluation as it reflects the relative importance
of costs and outcomes that accrue sooner. For a fuller
discussion of this issue, see Cairns.(Cairns, 2001)

PAGE 16 NSW HEALTH Issues in the Costing of Large Projects in Health and Healthcare – June 2008
Some lessons from existing costing analyses
In costing a large scale public health or health promotion
program, it is usually preferable for the data collection
of costs to occur in parallel with the measurement of
outcomes (intermediate or final). With regard to how
this is done, it is necessary to consider the specific
nature of each program and the reason for collecting
such information (as has been discussed previously).
However, some general principles are applicable. The
first is that it is important that cost data collection is
considered at an early stage in the development of the
program. Routine collection of cost-related data ensures
that the developmental nature of the program in the
early stages does not impede the accuracy of records in
what is liable to be a large area of expense.
Secondly, for large scale programs, it is important to
determine a clear pathway for the flow of data. For
example, each team member should be aware of their
responsibilities in relation to the collection of cost data,
and to know to whom it should be sent and at what
intervals. The method of data collection must be tailored
to the requirements of the individual program, but an
example of a data collection table is given as Appendix 1.
Thirdly, it is usually preferable to have one central data
collection agent. The responsibilities of this agent are
to ensure that all data is in the appropriate format, has
considered costs using the correct perspective, and that
data have been collected from all participants (either
directly or indirectly).

NSW HEALTH Issues in the Costing of Large Projects in Health and Healthcare – June 2008 PAGE 17
Australian Institute of Health and Welfare. (2000). Cervical Screening in Australia 1997-98. Canberra: Australian Institute of Health and Welfare.
Cairns, J. (2001). Discounting in economic evaluation. In M. Drummond & A. McGuire (Eds.), Economic Evaluation in Health Care. Oxford: OHE.
Graves, N., Walker, D., Raine, R., Hutchings, A., & Roberts, J. A. (2002). Cost data for individual patients included in clinical studies: no amount of statistical analysis can compensate for inadequate costing methods. Health Econ, 11(8), 735-739.
Haas, M., Shanahan, M., & Anderson, R. (2007). Assessing the costs of organised health programs: the case of the National Cervical Screening Program. Sydney: Centre for Health Economics Research and Evaluation.
Raftery, J. (2000). Costing in economic evaluation. Bmj, 320(7249), 1597.
References

PAGE 18 NSW HEALTH Issues in the Costing of Large Projects in Health and Healthcare – June 2008
Appendix 1: Data Collection for Large Scale Programs
Community-based Obesity Prevention Program
Program managers’ reporting template
Report date: Period covered (time since last meeting):
Stream:
Report completed by:
Contact number:
If further clarification is required, please contact XXX
Key tasks, milestones and process indicators
With reference to your stream’s program plan, what key tasks, milestones and process indicators have been completed
or were in progress during this period. For each, indicate whether completed or in progress.
Changes or delays to your stream’s program plan during this reporting period
Key meetings / presentations / dissemination
Outline any key meetings, presentations or communications that occurred during this reporting period.
Meeting/ presentation Audience/Target groupApprox no. in attendance/ reach Purpose
Future tasks and assistance required
Please outline any tasks, major actions or promotions that are scheduled for the next reporting period, and any
assistance, advice or areas for collaboration that your stream requires.
Tasks, major actions or promotions Assistance required

NSW HEALTH Issues in the Costing of Large Projects in Health and Healthcare – June 2008 PAGE 19
Budgets (complete March, June, September and December meetings)
Outline how actual expenditure compares to what was forecast in your stream’s budget, and if there are any actual or
anticipated underspends or overspends. For each, indicate if actual or anticipated.
Data Collection for the Economic Evaluation
If further clarification is required, please contact XXX.
Staff Costs
Please complete the following table listing the staff employed as part of the Good for Kids programme. Where possible
this should include staff employed by other agencies but involved with Good for Kids work. A hypothetical example is
included.
Staff Member Position NameWhole Time Equiv. (WTE, e.g. if full-time, WTE = 1)
Percentage of time spent on data collection related tasks
Other Costs
Please complete this table with any large non-staff costs incurred in the past month. This will include the cost of
equipment employed in the implementation of the Good for Kids program, and any non-staff related overheads. Some
(hypothetical) examples are included. If you have any questions about which costs should be included in this table,
please contact XXX
Description of Cost Cost ($)
When was this cost incurred? (if the cost is on-going, please indicate how long you expect it to exist)


SHPN (CHA) 080269