Embed Size (px)
Citation preview
Issues Impacting Work-Life Quality for People with Mobility Limitations Living in New York City Jessica Murray May 16, 2013 Table of Contents
Introduction ............................................................................................................................. 1 Part 1. Inclusions and Definitions ......................................................................................... 3
Expanded Definition of Disability .......................................................................................... 3 Measuring Mobility Disability: City, State and National Comparisons ................................... 4
Part 2. Quality of Life for People with Mobility Impairments .............................................. 5 Employment Barriers ............................................................................................................. 6
Hiring Incentives ................................................................................................................... 7 Economic Factors Affecting Employment Among the Disabled ............................................ 8 Recommendations for Improving Employment Tax Incentives/Disincentives ..................... 10
Accessible and Affordable Housing ................................................................................... 10 Recommendations to Expand Availability of Accessible Housing ...................................... 12
Transportation Barriers ........................................................................................................ 12 Walking (Wheeling) ............................................................................................................. 13 Recommendations for Improving Sidewalk Access: ........................................................... 14 Subway: 100 Accessible Stations vs. 100 Percent Accessibility ........................................ 14
Part III. Framing Mobility Disability and Universal Design ............................................... 17 Expanding Mobility for an Aging Generation ....................................................................... 18
Introduction
Work-life and work-family studies have grown in the past two decades as researchers
examine the benefits and conflicts between overlapping work, home and family
domains. Theories of positive and negative spillover between domains have
encouraged empirical research into the overlapping ecosystems of home and work
domains and the variables that can create conflict between domains.1 Less research
has been devoted to the transition between the two domains, but more recent research
has examined the impact of commuting on wellbeing.2 New York is unique in the United
States because it provides multiple commute mode choices, but many of these options
are out of reach for the small portion of the population with mobility impairments. In
addition to difficulties traveling between home and work, this group also faces

2
challenges in finding accessible housing and employment. This may partially explain
why the state of New York has a smaller percentage of disabled citizens than national3
and state averages.4
The types of problems studied in the work-family literature are likely to be more
pronounced for the disabled. This group has disproportionately low earnings and low
educational attainment in comparison with the general population.5 It’s important to first
understand the measurements of disability and how mobility disability fits into this
equation. Because of Americans with Disabilities Act in 1990 and its subsequent
amendment, the definition of disability has expanded to include short-term disabilities
and diseases that go into remittance, increasing the number of disabled, along with the
number of employment discrimination lawsuits.6 The ADA has been instrumental in
bringing some positive changes to the built environment, and has expanded the notion
of disability rights internationally, inspiring Disabilities Discrimination Act in Great Britain,
and the U.N. Convention on the Rights of the Persons with Disabilities in 2006.7 Still,
employment rates have been largely unchanged, and many other issues remain
unresolved for people with mobility impairments.
Second, it’s important to note how mobility disability stands out from the broader
umbrella of disability because of specific physical limitations. The struggle involves
environmental discrimination caused by inaccessible structures, most of which were
built long before the ADA became law. Wheelchairs are arguably the most visible type
of assistive device, and the most expensive for private and public entities to
accommodate, an often mentioned reason that renovations are not made to include
ramps or other wheelchair accessible features. As disability advocates frequently point

3
out, accessibility improvements made for wheelchair users benefit all of society, and
anyone can join the disabled minority at anytime. Nearly 25 years after the ADA was
signed into law, there are still a great number of physical barriers in New York City that
impact work-life quality for people with mobility impairments. As workers advance
through different life phases, especially retirement, removing these barriers will become
increasingly important.
Third, the framing of those with mobility impairments as the only group needing
universal access, along with the litigious framework of the ADA seem to have caused
further division and a resistance to accommodating mobility limitations. Including groups
like the aging, caretakers, and women with young children when assessing and
planning accessibility improvements, and framing universal access as a humane
endeavor rather than a liability may be a way forward for the goals of the disability rights
movement.8
Part 1. Inclusions and Definitions
Expanded Definition of Disability
The 1990 version of the ADA recognized walking and standing as major life activities,
and was amended in 2008 to clarity the definition of disability in regards to the term
“substantially limited”: “To have an ‘actual’ disability (or to have a ‘record of’ a disability)
an individual must be (or have been) substantially limited in performing a major life
activity as compared to most people in the general population.”
The amendment does not require a particular length of time for an impairment to be
considered substantially limiting, and also states, “an impairment that is episodic or in
remission is a disability if it would substantially limit a major life activity when active.”9
4
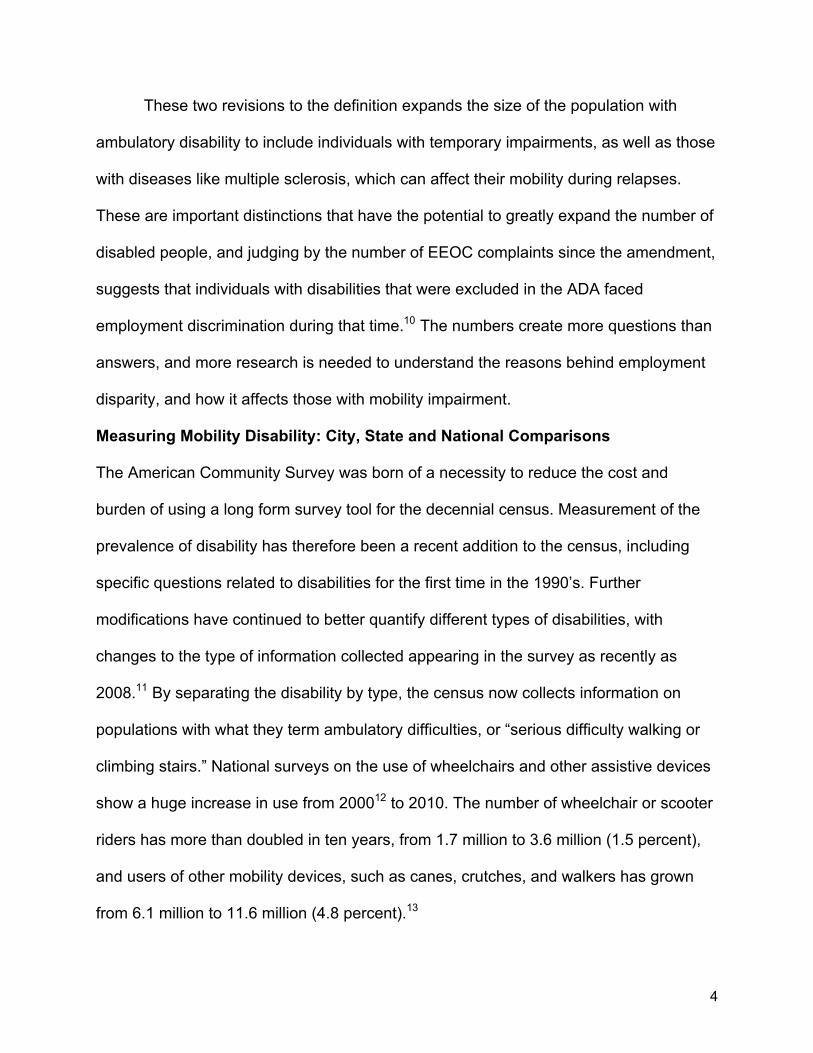
These two revisions to the definition expands the size of the population with
ambulatory disability to include individuals with temporary impairments, as well as those
with diseases like multiple sclerosis, which can affect their mobility during relapses.
These are important distinctions that have the potential to greatly expand the number of
disabled people, and judging by the number of EEOC complaints since the amendment,
suggests that individuals with disabilities that were excluded in the ADA faced
employment discrimination during that time.10 The numbers create more questions than
answers, and more research is needed to understand the reasons behind employment
disparity, and how it affects those with mobility impairment.
Measuring Mobility Disability: City, State and National Comparisons
The American Community Survey was born of a necessity to reduce the cost and
burden of using a long form survey tool for the decennial census. Measurement of the
prevalence of disability has therefore been a recent addition to the census, including
specific questions related to disabilities for the first time in the 1990’s. Further
modifications have continued to better quantify different types of disabilities, with
changes to the type of information collected appearing in the survey as recently as
2008.11 By separating the disability by type, the census now collects information on
populations with what they term ambulatory difficulties, or “serious difficulty walking or
climbing stairs.” National surveys on the use of wheelchairs and other assistive devices
show a huge increase in use from 200012 to 2010. The number of wheelchair or scooter
riders has more than doubled in ten years, from 1.7 million to 3.6 million (1.5 percent),
and users of other mobility devices, such as canes, crutches, and walkers has grown
from 6.1 million to 11.6 million (4.8 percent).13
5
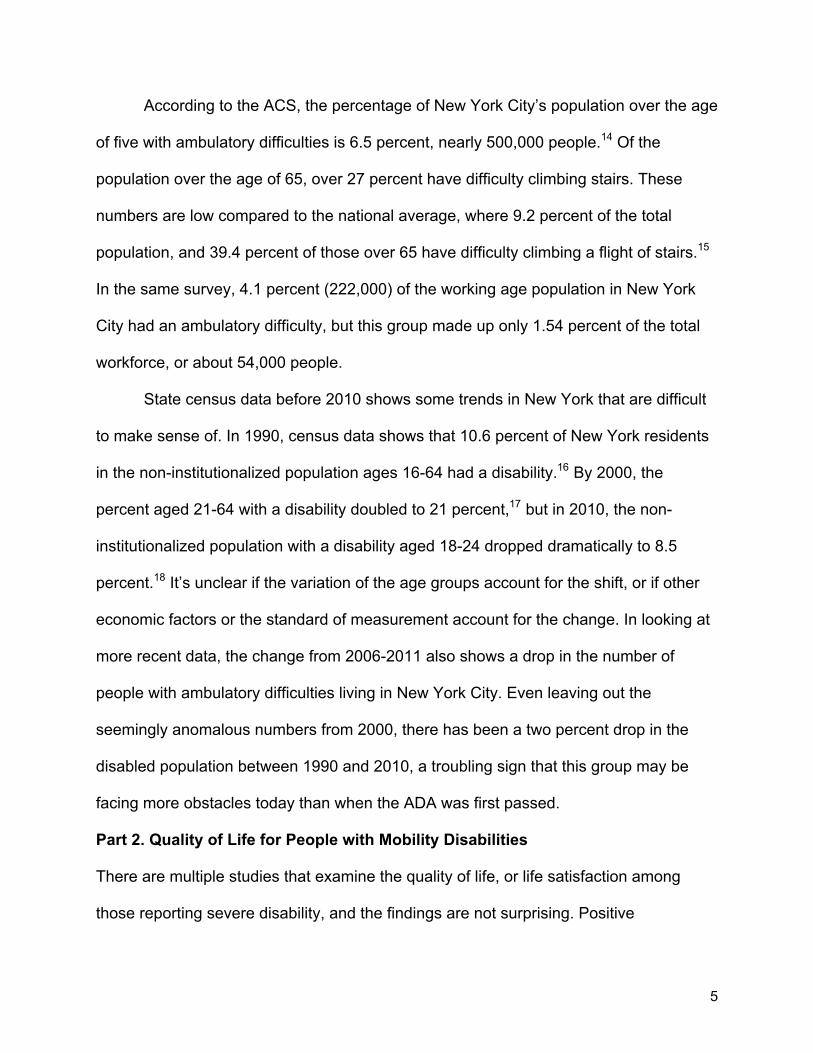
According to the ACS, the percentage of New York City’s population over the age
of five with ambulatory difficulties is 6.5 percent, nearly 500,000 people.14 Of the
population over the age of 65, over 27 percent have difficulty climbing stairs. These
numbers are low compared to the national average, where 9.2 percent of the total
population, and 39.4 percent of those over 65 have difficulty climbing a flight of stairs.15
In the same survey, 4.1 percent (222,000) of the working age population in New York
City had an ambulatory difficulty, but this group made up only 1.54 percent of the total
workforce, or about 54,000 people.
State census data before 2010 shows some trends in New York that are difficult
to make sense of. In 1990, census data shows that 10.6 percent of New York residents
in the non-institutionalized population ages 16-64 had a disability.16 By 2000, the
percent aged 21-64 with a disability doubled to 21 percent,17 but in 2010, the non-
institutionalized population with a disability aged 18-24 dropped dramatically to 8.5
percent.18 It’s unclear if the variation of the age groups account for the shift, or if other
economic factors or the standard of measurement account for the change. In looking at
more recent data, the change from 2006-2011 also shows a drop in the number of
people with ambulatory difficulties living in New York City. Even leaving out the
seemingly anomalous numbers from 2000, there has been a two percent drop in the
disabled population between 1990 and 2010, a troubling sign that this group may be
facing more obstacles today than when the ADA was first passed.
Part 2. Quality of Life for People with Mobility Disabilities
There are multiple studies that examine the quality of life, or life satisfaction among
those reporting severe disability, and the findings are not surprising. Positive

6
correlations exist between life satisfaction and employment, income, education, job
satisfaction, leisure activities, and social integration.19 Studies related to unemployment
also show a negative correlation between quality of life, financial strain and
unemployment.20 A more recent national survey of the disabled found a gap of 27
percentage points in those with disabilities saying they are very satisfied with life in
general than those without disabilities (34 percent versus 61 percent, respectively). Of
the group surveyed, 73 percent of unemployed were unable to work due to their
disability or health problem, 42 percent thought they couldn’t get the accommodations
needed to perform their job and 32 percent worried that the income would make them
ineligible for federal health benefits.21
While the disabled generally have higher levels of unemployment, many of the
quality of life issues still affect those with mobility impairments that are employed.
According to the survey, the disabled group as a whole experiences reduced levels of
leisure activities and social integration as compared to the general population. Below, I
will outline the disparities in employment, housing and transportation, analyze policies
that attempt to remove barriers for people with mobility disabilities, and recommend
measures to improve their effectiveness.
Employment Barriers
The negative impacts of unemployment affect an estimated 168,000 New York City
residents with ambulatory difficulties who are unemployed or no longer in the workforce,
and the causes of unemployment can include economic recession, disparities in
educational attainment, workplace discrimination, poor workplace accommodations,
transportations difficulties, and disincentives of federal and state health benefits. They

7
are generally overrepresented in low-status jobs, and underrepresented in occupations
requiring manual skills, and higher-paid managerial roles.22 The ADA attempts to limit
employment discrimination based on perceived and actual disability, but there is little
data about discrimination by type of disability. Still, the EEOC lists physical disability
discrimination as one of the top three bases of complaint.23
The Kessler Foundation/NOD 2010 Survey of Employment of Americans with
Disabilities was the third of its kind, surveying over 400 human resource managers and
executives at companies larger than fifty employees. Their findings show a persistent
gap in hiring disabled employees, with only 21 percent of people with any type of
disability being employed, as compared to 59 percent of the general population.24
Despite an increase from the previous survey in managers wanting to hire more
disabled people, 66 percent of managers reported having a hard time finding qualified
candidates with disabilities, and another 39 percent didn’t know where to look for
disabled candidates.
Hiring Incentives
In New York City, the employment gap between those with and without a disability is 43
percent.25 There is a plethora of federal and state tax benefits for employers who hire
employees with a disability, including a reimbursement of up to $4,200 of wages, 100
percent reimbursement of the first 160 paid hours under “work try-out,” the ability to
deduct alterations to a work environment to bring space up to ADA standards, and up to
$15,000 annually for architectural/transportation tax deductions to remove barriers for
employees or the general public.26 Recently, the VOW to Hire Heroes Act was passed

8
to encourage employers to hire permanent employees who were injured in battle, and
President Obama is pushing to make the tax cuts permanent.27
Despite the number of incentives available, a study published in 2003 showed
that 77 percent of businesses didn’t take advantage of these incentives.28 Additionally,
the types of jobs typically deemed suitable for those with mobility impairments are low-
skilled and low-wage jobs with little opportunity for advancement. Advocacy groups with
a mission to help the disabled find employment are sometimes in inaccessible buildings,
and are paid on a per-client basis, which encourages them to place the disabled in jobs
as quickly as possible, even if it is not the best opportunity.29
Economic Factors Affecting Employment Among the Disabled
Analysis of the recent 2007-2009 recession revealed a drop in employment for the
disabled population during this time, from 5.4 million to 4.9 million. Meanwhile there was
no significant change in the number of labor force participants without disabilities.30 This
study also found a 17.8 percent decline in employment for people with mobility
disabilities between October 2008 and June 2010. More recently, Bureau of Labor
Statistics show a decline in the employment rate by those with disabilities, and an
increase in the number of people who dropped out of the labor force. Meanwhile the
employment of the general population increased.31 Kaye (2010) attributes the increase
in unemployment and withdrawal from labor market to an increase in social security
benefits.
The cost and effectiveness of both Social Security Disability Insurance (SSDI)
and Supplemental Security Income (SSI) have been debated recently as the number of
people claiming benefits has increased in the last decade. The problems inherent in the

9
programs are two-fold, as those with mobility impairments receiving government
assistance must weigh the amount of benefits they receive against additional income
that may cause them to lose SSI benefits. Also, if they haven’t worked long enough to
sufficiently pay into social security, they may not qualify for SSDI benefits. The
complexities of unemployment and paucity of financial assistance puts almost a third of
the disabled population of New York City under the poverty line.32 An article in the New
York Times last year described what is essentially a “Disability Trap” that keeps those
with disabilities in a very low-income bracket.33 The structure of disability eligibility
provides only a minimal safety net while severely limiting the incentive to be financially
self-sufficient for fear of losing the safety net altogether.
Disabled employment has fallen from 32 percent in 1981 to 21 percent today,
due to a failure dating back to 1974 by the Social Security Administration to structure
the program in a way that motivates work. Information retrieved from the SSA’s website
highlights this disincentive, “Social Security's definition of disability is based on your
inability to work. Usually, if you are working and earning above a certain amount you are
not considered "disabled" and, therefore, you cannot get any type of disability benefit.”34
Recipients must have little or no income, and can’t have more than $2,000 in a savings
account. Supposed work incentives allow some income, but earnings that “exceed $65
per month reduces the amount of benefit received...plus one–half of the amount over
$65.” The monthly payment in New York for SSI for a single person is $797/month.35
This amount is $161 lower than earnings that would put a person at the poverty line, a
measure that some argue is also insufficient for high-cost cities like New York.36

10
Recommendations for Improving Employment Tax Incentives/Disincentives
Information on tax deductions and other tax incentives for employers may not be
reaching the intended audience, as evidenced by the low utilization rate. An information
campaign could be beneficial to inform business owners, but the types of incentives
offered to both businesses and job placement agencies don’t go far enough to address
the wage gap and lack of advancement opportunities for those with disabilities.
Disability payments are a necessary support for many, but the insecurity of refusing
benefits for the uncertainty of employment keeps many from working at all.
• Employer and job placement incentives should include provisions that reward
tenure of employment, not just initial hiring.
• Supplemental income should reflect the variation in cost of living and allow
earnings up to the poverty line. Stipulations about personal savings should be
eliminated or increased to encourage employment and personal asset
accumulation among the disabled.
Accessible and Affordable Housing
Quality of home or family life for people with mobility disability is greatly overshadowed
by the difficulty in finding accessible housing. Less than 9 percent of housing structures
in New York were built after 1990,37 and there are disturbing new revelations that many
new large housing developments have failed to build their developments up to
standards set by five separate federal and state guidelines; The Architectural Barriers
Act of 1968, Rehabilitation Act of 1973, Fair Housing Act of 1988, Americans With
Disabilities Act of 1990, and the New York Local Law 58 of 1987.38
11
In addition to difficulties for people with limited mobility in finding accessible
housing, affordability can also pose problems. While the NYCHA offers affordable
housing for low-income families, there is currently a waiting list for virtually all accessible
housing units, and as of 2009, there were only 7,000 wheelchair accessible apartments
in NYCHA buildings.39 The Disability Network of New York also points out that the
typical low-income rental unit costs twice the monthly SSI payment.40 A search for
accessible housing on nyhousingsearch.gov resulted in only two immediately available
options, with restrictions on income; qualified tenants must earn between $36,651 and
$47,520.41 More modern apartment buildings vary in price, and a studio apartment in a
luxury elevator building, Avalon Morningside Park (recommended as accessible housing
by Colombia University) would require an annual salary of 125,000.42 The housing
search is likely very difficult for anyone earning salaries between $50,000-$125,000 per
year. Even within apartments that are accessible from the outside, many do not meet
universal design guidelines inside, and can make home life difficult without personal
assistance.43
While federally funded housing projects must meet HUD guidelines that 5
percent of units be wheelchair accessible44 there seems to be a gap in regulating
private construction, and guidelines only apply to structures with more than five units,
not individual homes or small rental properties. In federally funded public housing, there
are also problems with elevator maintenance, another barrier to a seamless home-to-
work transition. NYCHA recently settled a lawsuit brought by the New York Legal
Assistance Group because of the continuous lack of maintenance within the housing
complexes.45 As part of the settlement, NYCHA agreed to move people with mobility

12
impairments to apartments on lower levels of their buildings. As the population ages, the
need for truly accessible housing will continue to increase, and not just in the public
housing sector.
Recommendations to Expand Availability of Accessible Housing
Building codes have proven to be confusing for some developers because there are
federal and state requirements with overlapping rules that are not always clear. The
enforcement of accessible construction appears to be skewed to impact public housing
projects that receive federal funding, resulting in further segregation of people with
mobility disabilities. To reduce confusion between building codes, encourage universal
accessibility in new construction, and gradually increase accessible housing stock over
time, a single accessible standard should apply to all ground floor residences. Additional
incentives should offer tax deductions for new construction and renovations that provide
wheelchair accessibility.
• Amend the building code to require accessible entries for new construction on
ground floor apartments in large buildings and multiple-family rental units.
• Create a system of monetary incentives to encourage development of new
accessible housing units that partially covers the cost of construction, while
reducing the threat of litigation and ensuring expansion of accessible housing
stock affordable for various income levels.
Transportation Barriers
Transportation is often cited as a reason for high unemployment, as well as reduced
leisure and social integration among people with disabilities. Nearly all modes of
transportation are permeated with barriers for those with mobility issues. Considering
13
the economic status of the disabled community, and the improvements that have
already been made to the MTA bus fleet, I’ll focus on two mode choices, walking and
the subway.
Walking (Wheeling)
Often, the biggest barrier for people with limited mobility is the sidewalk. The prevalence
of curb cuts in New York City has improved since the Architectural Barriers Act of 1968
was passed, but for many wheelchair users, the lack of a single curb cut can be a
barrier to independence. After settling a nearly decade-long lawsuit from the Eastern
Paralyzed Veterans Association (EPVA), the DOT agreed to invest $213 million in
pedestrian ramps throughout the city.46 According to the DOT website, “the City has
installed pedestrian ramps at 97,664 locations (reflecting 61.5 percent of the City's
158,738 corners).”47 This figure supposedly includes 80 percent of Manhattan curbs, but
it’s difficult to verify, and is a claim that hasn’t been updated since 2002.48
The DOT website also states that by New York law, property owners are required
to “at their own cost, install, construct, reconstruct, repave and repair the sidewalk
adjacent to their properties, including the intersection quadrant and pedestrian ramps
for corner properties, in accordance with DOT specifications.”49 Violators will be
ticketed, and they can make improvements themselves, or let the DOT make the repairs
and send them the bill. Receiving a citation is sometimes surprising for building owners,
and the gray area of accountability confuses even local pedestrian advocacy groups
calling on DOT to repair curb cuts and ensure smooth sidewalks.50 Some building
owners can get free repairs; recently the NYC Parks Department received federal
funding to replace sidewalks damaged by tree roots.51
14
Recommendations for Improving Sidewalk Access: While the DOT has made some projects and improved pedestrian safety in many areas,
there is still much work to be done to improve the overall quality of the sidewalk network
to remove cracks and other obstacles that are difficult to navigate for wheelchair users,
and elderly people using other assistive devices.52 Sharing the responsibility of a public
asset with individual property owners appears to lead to inaction, especially if many are
unaware they must maintain certain standards, or simply don’t want to pay for repairs.
Sidewalks should be public property, as they are essential to the most basic mode
choice of millions of New Yorkers, and an objective oversight entity should evaluate the
quality of sidewalks rather than Department of Transportation.
• Change Section 19-152 of New York's Administrative Code to make sidewalks the
responsibility of the DOT, and engage a separate city department to supervise
progress and handle complaints of inaccessible walkways.
• Find a way to standardize curb cuts to reduce construction costs.
Subway: 100 Accessible Stations vs. 100 Percent Accessibility
As part of an agreement with the Federal Transit Administration (FTA) in 1992, the MTA
agreed to make 100 “key stations” accessible by 2020, but are under no obligation to
make the system completely accessible. Using a simple equation (𝑛)(𝑛 − 1)/2 to
measure the number of trips possible between 100 accessible stations, and the total
468 stations in the system, people with ambulatory disability will be able to make about
4.5 percent of the possible trips as those who have no problem climbing stairs (4,950
vs. 109,278). A more in-depth analysis of ridership by station would be required to
weigh the impact of key stations, but the general principal of universal access seems to
15
have been forgotten, and the need for costly paratransit service will continue to rise for
a system with limited accessibility. Inconsistent mobility aids and other inaccessible
features in the subway only make the problem worse.
During an audit performed between 1994-2002, NYC Transit noted the absence
of wheelchair users in the system, and identified a number of areas that weren’t ADA
compliant, including excessive gaps between platforms and cars, incorrect signage, out-
of-service elevators, a lack of elevator redundancy, and no notification system for non-
functioning elevators.53 Even for stations with elevators, the other barriers that fail to be
corrected make the small number of stations with elevators inaccessible. As of 2008,
167 elevators and 169 escalators were still plagued with problems, and one in six
elevators were found to be out of service, with variation in parts, faulty construction, and
poor technician training cited as reasons for the breakdowns.54 An investigative article in
2011 found that “194 elevators in 73 stations, and its 178 escalators in 52 stations, work
far more often than not. Elevator availability was measured at 95.3 percent in the
second quarter of this year, compared with 96.8 percent in the same period last year;
escalators held steady at 92.8 percent.”55 Additionally, there are about 10 “out-of-
service” elevators and 13 escalators, which are owned and operated by private
companies, break down frequently, remain in a state of disrepair for long periods of
time, and are not accounted for on the MTA’s list of non-functioning elevators.56
By all appearances, the MTA seems content to make the key stations accessible,
but not much above the 100-station minimum. In two separate subway station
renovation projects, they failed to include plans for elevators and both stations opened
without elevators, or other considerations for accessibility. The first, the 1 at Dyckman

16
St. in Washington Heights, was modified after a class action lawsuit, and an elevator on
the southbound station was promised as part of the settlement.57 The second, at Smith-
9th Street station on the F and G lines opened recently to disappointment, but no legal
challenge as of yet.58 The projects cost $45 million and $32 million, respectively, but
MTA claimed “prohibitive costs” when questioned about the lack of elevators.
Recommendations for Improving Subway Accessibility:
Based on the MTA 2012 Adopted Budget, replacing 11 elevators was listed at a cost of
$44 Million. While the budget lacks project details, other mentions of elevators have
costs ranging from $0.5- $8.45 Million (for an unknown number of elevators).59 A
general estimate of $4 million per elevator would cost an average of $16 million per
station when elevators are necessary. The cost for outfitting the remaining 368 stations
(which may not all need elevators) would cost the same amount as operating paratransit
for ten years at the current projected cost ($ 5.9 Million for 2013). Additional ADA
upgrades could likely be covered by the 15% annual increase expected for paratransit
service in the coming years.
The subway is over a century old, but the MTA analyzes costs and plans budgets
in increments of five years. Failing to include accessibility for future generations is
shortsighted and defeats the purpose of public transportation. The impact on current
residents with mobility disability is exclusion from the “anywhere-to-anywhere” travel the
subway provides to the rest of the population, exclusion from choice in residential
location, and a harder time being able to get to job opportunities anywhere in the city.
• Mandate ADA compliance on all station renovations
17
• Budget appropriate amounts for elevator repairs throughout the system, including
privately owned elevators
• Set additional goals beyond 2020 to create more accessible stations, starting
with low-cost renovations on above ground stations
Part III. Framing Mobility Disability and Universal Design
The European Rail Vehicle Accessibility Regulations of 2008 changed the definition of
persons with reduced mobility to include people with disabilities, as well as others that
may experience reduced mobility, such as pregnant women, and people travelling with
small children.60 This inclusive definition expands the demographic that benefits from
mobility accessibility improvements from 6-7 percent of the population to 13-14 percent.
As other countries make strides forward in providing greater accessibility to
public transportation and public places, New York appears to be stubbornly stuck in a
time before handicap accessibility.61 Resources like the NYC Guidebook to Accessibility
and Universal Design62 offer additional guidance for architects building for a diverse
population, but developers continue to build inaccessible buildings, existing building
owners in New York City can easily obtain an ADA waiver to avoid making
renovations,63 and people with mobility limitations have one option for improving
accessibility; litigation. Some critics of the ADA believe that without a broad social
movement, perceptions of disability will take a very long time to change.64
For anyone with mobility disabilities who may dream of living and working in New
York, or simply visiting, the unfortunate truth is that the city will be far more hostile and
unforgiving to them than it is to those without limited mobility. For a city that proudly
accepts its title as the capital of the world, New York City is neglectful of its most
18
vulnerable groups; those with mobility disabilities, mothers with young children, and the
elderly. Reframing accessibility as a goal that we want to achieve because it impacts
people we know, or our future selves, rather than having to comply with federal law
could make a difference in attitudes towards people with disabilities.
Expanding Mobility for an Aging Generation
The potential for broader support for universal design may also come from a rapidly
growing segment of the population. The 65+ population in New York City is set to
exceed a million residents before 2020, and continue to rise in the decades to follow.65
Some say the nation’s housing isn’t ready for the looming demographic change, but the
realities of an aging population will force many to reconsider designing for both the
elderly and disabled, despite those who don’t want to face the uncomfortable truth that
we will all eventually get older.66 Support for the elderly is crucial to ensure continued
social integration; reduced mobility increases the tendency to be homebound after
reaching a certain age.67 The Mayor’s office and other city organizations are beginning
to pay attention to the needs of the elderly, but most measures don’t go far enough or
ask the tough questions. One report on making New York City more age-friendly bluntly
assesses that the subway is not age-friendly and that more cabs should be wheelchair
accessible.68
As more New Yorkers retire and find difficulties getting around, they are more
likely to become involved in addressing their needs.69 Given the voting power of this
group, the potential for the elderly community to affect local change is tremendous.
Additionally, the rise in numbers of the elderly community will lead to more
conversations about the uncomfortable topic of inevitable aging and may lead to more

19
empathy in the process. Making universal access a personal issue raises the stakes for
the entire population, and is key to a broader social movement that can foster
permanent change.
References
1 Grzywacz, J. G., & Marks, N. F. (2000). Reconceptualizing the work-family interface: An ecological perspective on the correlates of positive and negative spillover between work and family. Journal of occupational health psychology,5(1), 111-126.
2 Olsson, L. E., Gärling, T., Ettema, D., Friman, M., & Fujii, S. (2013). Happiness and satisfaction with
1 Grzywacz, J. G., & Marks, N. F. (2000). Reconceptualizing the work-family interface: An ecological perspective on the correlates of positive and negative spillover between work and family. Journal of occupational health psychology,5(1), 111-126.
2 Olsson, L. E., Gärling, T., Ettema, D., Friman, M., & Fujii, S. (2013). Happiness and satisfaction with work commute. Social indicators research,111(1), 255-263.
3 U.S. Census Bureau. (2006-2010). Selected social characteristics in the United States [Data]. 2010 American Community Survey 5-Year Estimates. Retrieved from http://factfinder2.census.gov
4 U.S. Census Bureau. (2009-2011) New York and New York City, NY--Disability Characteristics [Data]. 2010 American Community Survey 3-Year Estimates. Retrieved from http://factfinder2.census.gov
5 Profile America Facts for Features. (2012, July 25). U.S. Census Bureau. Retrieved from: http://www.census.gov/newsroom/releases/archives/facts_for_features_special_editions/cb12-ff16.html
6 McDonough, K. F. (2012, February 6). Labor: Increased litigation under the ADAAA. Inside Counsel. Retrieved from: http://www.insidecounsel.com/2012/02/06/labor-increased-litigation-under-the-adaaa
7 Hunt, A.R. (2010, July 25). Disabled See Progress, but Problems Persist. The New York Times. Retrieved from: http://www.nytimes.com/2010/07/26/us/26iht-letter.html
8 Dunlap, D. (1997, June 1). Architecture in the Age of Accessibility. The New York Times. Retrieved from: http://www.nytimes.com/1997/06/01/realestate/architecture-in-the-age-of-accessibility.html?pagewanted=all&src=pm
9 ADA Amendments Act of 2008. Retrieved from: http://www.eeoc.gov/laws/statutes/adaaa.cfm 10 Annual Report on the Federal Work Force Part I, EEO Complaints Processing Fiscal Year 2011. Retrieved from: http://www.eeoc.gov/federal/reports/fsp2011/index.cfm
11 U.S. Census Bureau American Community Survey History. Retrieved from: http://www.census.gov/people/disability/methodology/acs.html
12 Kaye, H. S., Kang, T., & LaPlante, M. P. (2000). Mobility device use in the United States (Vol. 14). National Institute on Disability and Rehabilitation Research, US Department of Education. 13 Brault, M. W. (2012). Americans with disabilities: 2010 household economic studies. Retrieved from US Census Bureau website: http://www.census.gov/prod/2012pubs/p70-131.pdf
20
14 U.S. Census Bureau. (2010) New York City, NY--Sex by Age by Ambulatory Difficulty - Universe: Civilian noninstitutionalized population 5 years and over [Data]. 2010 American Community Survey 1 Year Estimate. Retrieved from http://factfinder2.census.gov 15 U.S. Census Bureau. (2010) Disability Characteristics. 2010 American Community Survey 1-Year Estimates [Data]. Retrieved from http://factfinder2.census.gov 16 U.S. Census Bureau. (1990). Table 1. Selected Characteristics of Civ. Noninst. Persons 16 to 64. Retrieved from: http://www.census.gov/people/disability/methodology/census/tables/tab1st.txt 17 New York: 2000, Census 2000 Profile. (2002, August). U.S. Census Bureau. Retrieved from: http://www.census.gov/prod/2002pubs/c2kprof00-ny.pdf 18 U.S. Census Bureau. (2010) New York--Employment Status by Disability Status - Universe: Civilian noninstitutionalized population 18 to 64 years [Data]. Retrieved from http://factfinder2.census.gov 19 Mehnert, T., Krauss, H. H., Nadler, R., & Boyd, M. (1990). Correlates of life satisfaction in those with disabling conditions. Rehabilitation Psychology,35(1), 3. 20 Ervasti, H., & Venetoklis, T. (2010). Unemployment and Subjective Well-being An Empirical Test of Deprivation Theory, Incentive Paradigm and Financial Strain Approach. Acta Sociologica, 53(2), 119-139. 21 Kessler Foundation/National Organization on Disability. The 2010 Survey of Americans With Disabilities. Retrieved from: http://www.2010DisabilitySurveys.org 22 Kaye, H. S. (2009). Stuck at the bottom rung: occupational characteristics of workers with disabilities. Journal of occupational rehabilitation, 19(2), 115-128. 23 Annual Report on the Federal Work Force Part I, EEO Complaints Processing Fiscal Year 2011. Retrieved from: http://www.eeoc.gov/federal/reports/fsp2011/index.cfm 24 Kessler Foundation/National Organization on Disability. The 2010 Survey of Employment of Americans With Disabilities. Retrieved from: http://www.2010DisabilitySurveys.org 25 von Schrader, S., Erickson, W., Nazarov, Z., Golden, T. P., & Vilhuber, L. Disability & Employment Status Report. Retrieved from: http://ilr-edi-r1.ilr.cornell.edu/nymakesworkpay/docs/Report_Card_2011/NYS%20Reportdisabilities%20Card%202011.pdf 26 Learn about hiring / tax incentives. (2013) New York Makes Work Pay. Retrieved from: http://ilr-edi-r1.ilr.cornell.edu/nymakesworkpay/re-hiring.cfm 27 Denis McDonough, D. & Sperling, G. (2013, April 5). Incentivizing Employers to Hire Veterans through Permanent Tax Credits. White House Blog. Retrieved from: http://www.whitehouse.gov/blog/2013/04/05/incentivizing-employers-hire-veterans-through-permanent-tax-credits 28 Mark L. Lengnick-Hall, Philip Gaunt, and Jessica Collison, Employer Incentives for Hiring Individuals with Disabilities (SHRM Research, April 2003).

21
29 Jones, J. (2011, November 15). Barriers Keep Many Disabled New Yorkers Trapped in Poverty. Gotham Gazette. Retrieved from: http://www.gothamgazette.com/article/socialservices/20111115/15/3637 30 Kaye, H. S. (2010). The impact of the 2007–09 recession on workers with disabilities. Monthly Labor Review, 133(10), 19-30. 31 31. The Employment Situation. (2013, April 1). Bureau of Labor Statistics. Retrieved from: http://www.bls.gov/news.release/pdf/empsit.pdf 32 2010 Disability Status Report - New York (2012) Cornell University. Retrieved from: http://ilr-edi-r1.ilr.cornell.edu/nymakesworkpay/docs/Report_Card_2011/NYSReportCardStatusFINAL.html 33 Turkewitz, J. & Linderman, J. (2012, October 20). The Disability Trap. The New York Times. Retrieved from: http://www.nytimes.com/2012/10/21/sunday-review/the-trap-of-supplemental-security-income.html 34 Benefit Eligibility Screening Tool. Social Security Administration Website. Retrieved after entering survey questions: http://www.benefits.gov/ssa/questionnaire 35 Supplemental Security Income (SSI) In New York. Social Security Administration website. Retrieved from: http://www.ssa.gov/pubs/EN-05-11146.pdf 36 Rodriguez, C. (2012, September 20). NYC’s Poverty Rate Goes Up for 3rd Straight Year. WNYC News. Retrieved from: http://www.wnyc.org/articles/wnyc-news/2012/sep/20/new-york-city-poverty-rate-third-year-row/ 37 U.S. Census Bureau, 2007-2011 American Community Survey, New York City, New York. Year Structure Built, Universe: Housing units. 2007-2011 American Community Survey 5-Year Estimates 38 Bagli, C.V. (2008, August 18). U.S. Says Many Apartments Violate Law on Disabled. The New York Times. Retrieved from: http://www.nytimes.com/2008/08/19/nyregion/19disabled.html 39 Lederer, C. C. (2009, November 13). New York State Assembly Standing Committee on Housing and the Task Force on People with Disabilities. New York Legal Action Group. Retrieved from: http://nylag.org/wp-content/uploads/2012/02/Brito-Testimony.pdf 40 Housing Committee of the Disabilities Network of New York City Website. Retrieved from: http://www.dnnyc.net/housing.html 41 Search performed for wheelchair accessible housing: http://nyhousingsearch.gov/ 42 Housing Information for Persons with Disabilities. Columbia University in the City of New York. Retrieved on May 11, 2013 from: http://worklife.columbia.edu/disability-accomodations#section8 43 Collins, G. (2008, August 24). Accessible Homes? Not Really, Say Disabled Residents. New York Times. Retrieved from http://www.nytimes.com/2008/08/25/nyregion/25handicap.html?pagewanted=all&_r=0 44 Accessibility Requirements for Buildings. HUD.gov. Retrieved from: http://portal.hud.gov/hudportal/HUD?src=/program_offices/fair_housing_equal_opp/disabilities/accessibilityR
22
45 NYCHA Sued for Widespread Failure to Maintain Public Housing Elevators. (2009, June 1). NYLAG Website. Retrieved from: http://nylag.org/news/2009/06/nycha-sued-for-widespread-failure-to-maintain-public-housing-elevators/ 46 Ross, V. (2002, September 18). Queens Corners To Be Ramped. The Queens Courier. Retrieved from: http://queenscourier.com/2002/queens-corners-to-be-ramped-137 47 Pedestrian Ramps. New York City Department of Transportation Website. Retrieved from: http://www.nyc.gov/html/dot/html/pedestrians/pedramps.shtml 48 Silver, S. (2002) Curb Your Enthusiasm. City Streets Blog. Retrieved from: http://www.citystreets.org/oped072704-1.html 49 Questions & Answers to Common Sidewalk Violations. New York City Department of Transportation Website. Retrieved from: http://www.nyc.gov/html/dot/html/infrastructure/sidewalk-faq.shtml 50 East Side Action Plan. Transportation Alternatives. Retrieved from: http://www.transalt.org/files/newsroom/reports/2011/East_Side_Action_Plan.pdf 51 Sidewalk Repair. NYC Parks Website. Retrieved from: http://www.nycgovparks.org/services/forestry/sidewalk-repair 52 New York City Department of City Planning. Mobility Initiatives For An Aging Population: A Scan of Current Practices, 2011. Chapter 6: Pedestrian Improvements - Signage and Crosswalk Changes. Retreived from: http://www.nyc.gov/html/dcp/pdf/transportation/mobility_initiatives_aging_06.pdf 53 Executive Summary. (2002). MTA – New York City Transit, Rapid Transit Services for Persons with Disabilities. Retrieved from: http://www.osc.state.ny.us/audits/allaudits/093004/01s69.pdf 54 Neuman, W. (2008, May 19) $1 Billion Later, New York’s Subway Elevators Still Fail. The New York Times. Retrieved from: http://www.nytimes.com/2008/05/19/nyregion/19elevators.html 55 Haughney, C. (2011, October 13). Common Sight for Some Subway Riders: Broken Elevators and Escalators. The New York Times. Retrieved from: http://www.nytimes.com/2011/10/14/nyregion/subway-elevators-and-escalators-still-break-down-often.html
56 Kluger, B.L. (2011, November). MTA and NYC Transit Have Not Fully Managed Their Responsibilities Regarding Privately Owned Elevators, Escalators, and Stairways. MTA/OIG Report #2011-12. Retrieved from: http://mtaig.state.ny.us/assets/pdf/11-12.pdf 57 Zanoni, C. (2011, July 21). MTA Agrees to Add Elevator at Dyckman Street Subway Station Following Lawsuit. DNAInfo.com. Retrieved from: http://www.dnainfo.com/new-york/20110721/washington-heights-inwood/mta-agrees-add-elevator-at-dyckman-street-subway-station-following-lawsuit
58 Kabak, B. (2013, April 30). On Smith/9th Sts. and ADA compliance. Second Avenue Sagas. Retrieved from: http://secondavenuesagas.com/2013/04/30/on-smith9th-sts-and-ada-compliance/ 59 MTA 2012 Adopted Budget, February Financial Plan 2012 – 2015. Retrieved from: http://www.mta.info/mta/budget/feb2012/Master.pdf
23
60 New York City Department of City Planning. Mobility Initiatives For An Aging Population: A Scan of Current Practices, 2011. Chapter 5: Public Transportation, Taxis and For Hire. Retreived from: http://www.nyc.gov/html/dcp/pdf/transportation/mobility_initiatives_aging_06.pdf 61 Dasilva, J. (2013, January 17). The Long Wait. The New York Times. Retrieved from: http://www.nytimes.com/2013/01/17/opinion/the-long-wait.html 62 Levine, D. (2006). The NYC Guidebook to Accessibility and Universal Design.New York: Center for Inclusive Design & Environmental Access,-(also referred to as Universal Design New York) University at Buffalo, The State University of New York. Retrieved from: http://www.nyc.gov/html/ddc/downloads/pdf/udny/udny2.pdf 63 Accessibility Waiver. (1991) Mayor’s Office for People with Disabilities. Retrieved from: http://www.nyc.gov/html/mopd/html/waiver/waiver.shtml 64 Selmi, M.(2011) The Stigma of Disabilities and the Americans with Disabilities Act. Disability and Aging Discrimination. 2011, pp 123-143. 65 New York City Population Projections by Age/Sex & Borough 2000–2030. (2006). Department of City Planning. Retrieved from: http://www.nyc.gov/html/dcp/pdf/census/projections_report.pdf 66 Badger, E. (2012, May 10). Do We Need Social Security for Our Houses, Too? The Atlantic Cities. Retrieved from: http://www.theatlanticcities.com/housing/2012/05/do-we-need-social-security-our-houses-too/1965/ 67 Stowell-Ritter, A., Bridges, K., & Sims, R. (2006, October) Good to Go: Assessing the Transit Needs of New York Metro and Western New York AARP Members. AARP Member Opinion Research. Retrieved from: http://www.aarp.org/home-garden/transportation/info-2006/ny_transit_06.html 68 Toward an Age-friendly New York CitY: A Findings Report. (2008). New York Academy of Medicine. Retrieved from: http://www.health.ny.gov/diseases/aids/conferences/docs/nyam_age_friendly_report.pdf 69 Huang , M. (2012, July 25). Seniors Take Pedestrian Safety Into Their Own Hands. Thirteen. Retrieved from: http://www.thirteen.org/metrofocus/2012/07/seniors-take-pedestrian-safety-into-their-own-hands/