Embed Size (px)
Citation preview

6 Lancaster County Road • Suite Four • Harvard, Massachusetts • 01451
508 • 772 • 7557 508 • 772 • 6183 FAX
EXPERT REPORT
ISSUES CONCERNINGTRICHLOROETHENE AND
CARBON TETRACHLORIDECONTAMINATION
AT THECONRAIL SUPERFUND SITE
ELKHART, INDIANA
Prepared for: March 8, 1994
Consolidated Rail Corporation2001 Market StreetP.O. Box 41403Philadelphia, PA 19101-1403

EXPERT REPORT
ISSUES CONCERNINGTRICHLOROETHENE AND CARBON TETRACHLORIDE
CONTAMINATIONAT THE
CONRAIL SUPERFUND SITEELKHART, INDIANA
Prepared for:
Consolidated Rail Corporation2001 Market Street
P.O. Box 41403Philadelphia, PA 19101-1403
Prepared by:
GeoTrans, Inc.6 Lancaster County Road
Suite FourHarvard, MA 01451
Project Number 8042-001
March 8, 1994
w 11047.030115IJWI
GeoTrans, inc.
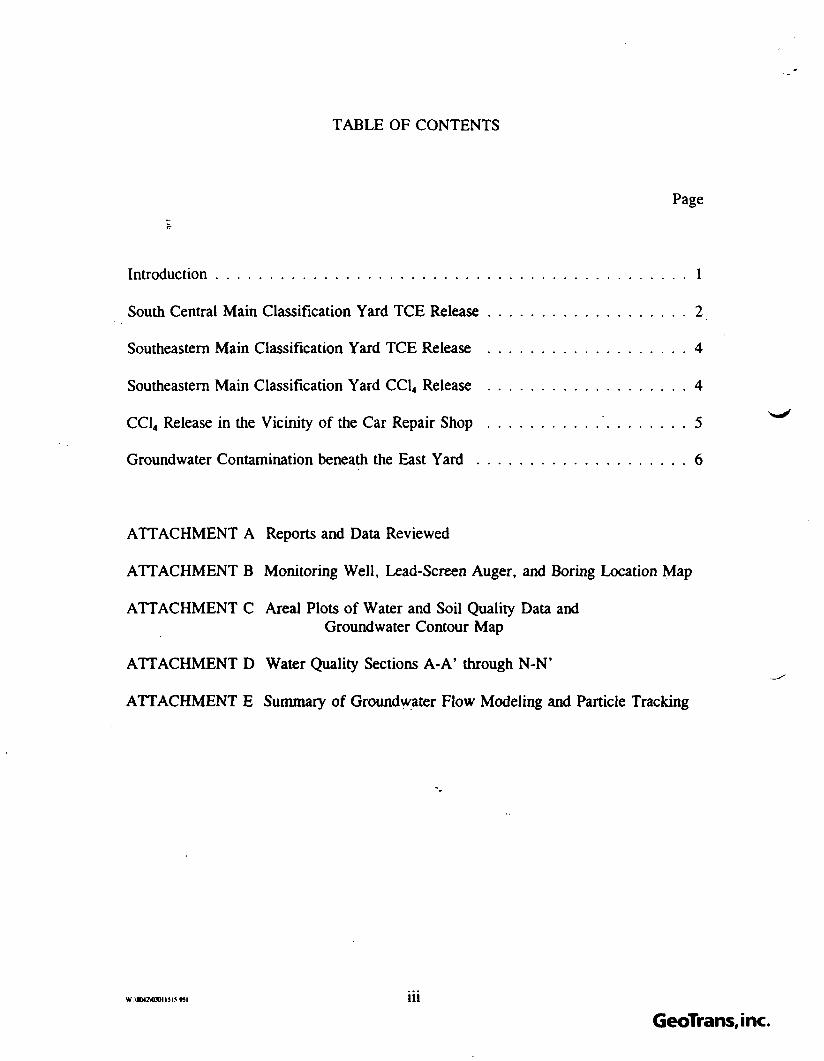
TABLE OF CONTENTS
Page
Introduction . . . . . . . . . . . . . . . . . . . . . . . . . . . . . . . . . . . . . . . . . . . . 1
South Central Main Classification Yard TCE Release . . . . . . . . . . . . . . . . . . . 2
Southeastern Main Classification Yard TCE Release . . . . . . . . . . . . . . . . . . . 4
Southeastern Main Classification Yard CC14 Release . . . . . . . . . . . . . . . . . . . 4
CC14 Release in the Vicinity of the Car Repair Shop . . . . . . . . . . . . . . . . . . . 5
Groundwater Contamination beneath the East Yard . . . . . . . . . . . . . . . . . . . . 6
ATTACHMENT A Reports and Data Reviewed
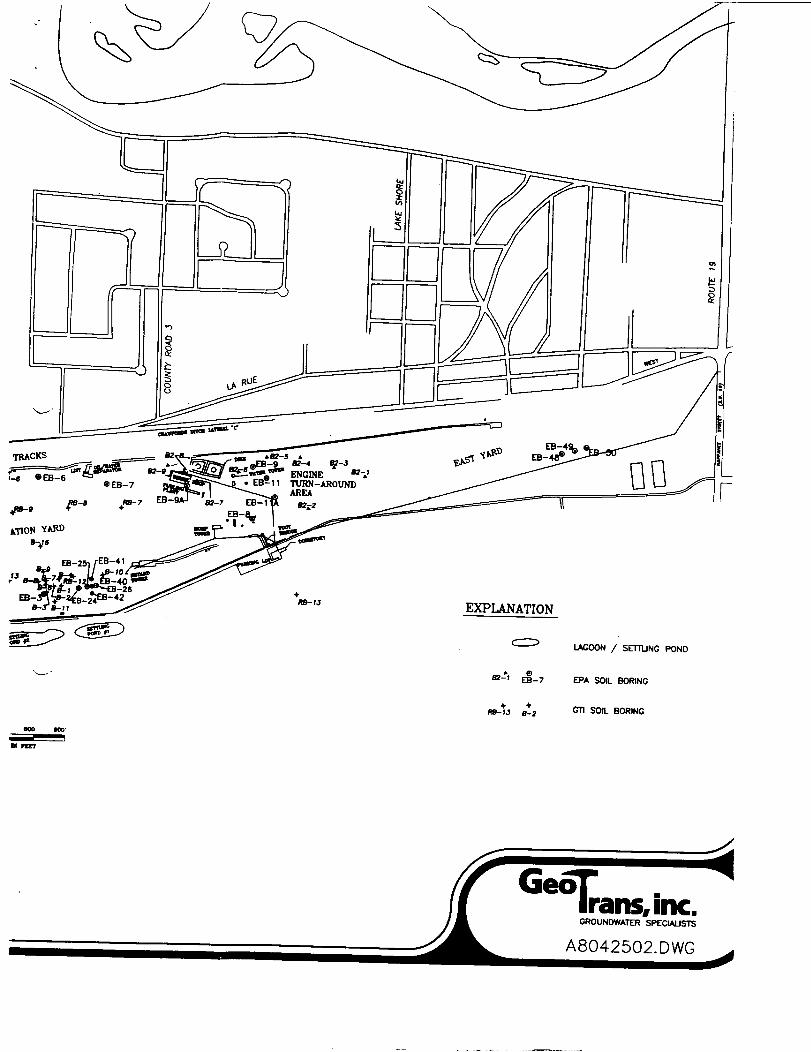
ATTACHMENT B Monitoring Well, Lead-Screen Auger, and Boring Location Map
ATTACHMENT C Areal Plots of Water and Soil Quality Data andGroundwater Contour Map
ATTACHMENT D Water Quality Sections A-A' through N-N'
ATTACHMENT E Summary of Groundwater Flow Modeling and Particle Tracking
iiiGeoTransJnc.
Introduction
GeoTrans has been asked by Conrail to provide a technical opinion regardingcertain issues related to groundwater contamination within the Conrail Superfund Site (the
i.
"Site") in Elkhart, Indiana. The Site, as defined by EPA, is bounded to the east byNappanee Avenue, to the south by the southernmost property line of the Conrail railyard,to the west by Baugo Bay, and to the north by the St. Joseph River. Specifically, wehave been asked to consider the following issues:
1. Whether there are sources of trichloroethene (TCE) and carbon tetrachloride(CC14) contamination on the Conrail property (the "Railyard") that contribute tothe groundwater contamination at or near the Conrail property.
2. The extent of groundwater contamination which resulted from TCE and CC14
contaminant sources on the Railyard, if any.
3. Whether there are sources of TCE and/or CC14 contamination off the Conrailproperty which contribute to groundwater contamination within the Site.
4. For any identified TCE and CC14 sources on the Railyard, what conclusionscan be drawn regarding whether the contamination originated before or afterApril 1, 1976?
In considering these issues, we reviewed various reports and data collected forthe general area of the Railyard and the Site (see Attachment A). In addition toreviewing reports and data collected by others, we prepared various maps, sections, andsummaries including, but not limited to, water table maps, tabular summaries of soil andwater quality data and groundwater level data, areal maps of groundwater quality data,and hydrogeologic sections showing water quality data. These maps, sections, andsummaries are included as Attachments B, C, and D. We also developed a three-
GeoTrans, inc.

dimensional groundwater flow model of the Main Classification Yard and surroundingareas to the north and west for the purpose of aiding our understanding of hydrogeologicfactors affecting flow direction and velocity and to assist our evaluation of the timing ofTCE and CC14 releases on the Railyard. A description of the model is included asAttachment E.
Our opinions regarding the above-stated issues are summarized below.
South Central Main Classification Yard TCE Release
There was a release of TCE in the south-central portion of the Main ClassificationYard in the approximate region of EPA soil borings EB28, EB29, and EB32; GTI soilboring RB10; lead-screen auger borings LSA-29, LSA-38, and LSA-42; and monitoringwell MW-47 (see soil boring, lead-screen auger, and monitoring well location maps inAttachment B). TCE concentrations in soil and groundwater samples from this area anddowngradient indicate that TCE was released as a dense non-aqueous phase liquid(DNAPL). The result of this release is a generally widespread region of TCE-contami-nated groundwater within, as well as downgradient of, the western portion of the MainClassification Yard. The predominant direction of TCE migration was approximatelynorthwesterly from the release area toward the general area of monitoring well MW-41.TCE migration as a DNAPL also resulted in lateral spreading of TCE as well as verticalmigration downward through the unconsolidated deposits which underlie the Railyard.In the vicinity of the release area, the TCE concentrations are relatively greater in theshallow groundwater and, at the northern Railyard boundary, the relatively greaterconcentrations are found in the deeper groundwater.
Along the Railyard boundary in the area north of the Main Classification Yard,TCE-contaminated groundwater has been detected in all monitoring locations betweenLSA-43 and LSA-11 (see LSA and monitoring well location map in Attachment B andsection A-A' in Attachment D). The greatest reported TCE concentrations along this line
W \KM2ttm 1)13 Ml
GeoTransjnc.
of monitoring points have been from monitoring wells MW-41 and MW-51 and lead-screen auger boring LSA-46. Detectable concentrations have been reported throughoutthe entire thickness of the unconsolidated deposits but the greater concentrations havegenerally been detected at depths of 70 to 110 feet below land surface.
Groundwater flow from this portion of the northern boundary of the Railyard is
generally northwesterly through the County Road 1 area and toward the Vistula Avenueneighborhood. Refer to groundwater contours for January 1993 provided in Attach-ment C and model-calculated groundwater contours and flow paths in Attachment E.Results of groundwater sampling and analysis from residential wells, lead-screen augerborings, and monitoring wells indicate a continuous region of TCE-contaminated ground-water extending from the Conrail yard to beyond the Vistula Avenue neighborhood (seeAttachments C and D). Available water quality data indicate that there are one or moreadditional sources of TCE contamination which contribute to the TCE contaminationfound northwest of the Railyard but it appears from the water quality data that TCE-contaminated groundwater which originates beneath the Railyard extends to the VistulaAvenue neighborhood and the St. Joseph River. As TCE contamination has been"detected in the Vistula Avenue neighborhood since 1986, the TCE release in the southcentral portion of the Railyard must have occurred prior to April 1, 1976.
Analysis of groundwater flow directions and travel times using the three-dimens-ional groundwater flow model described in Attachment E indicate an average ground-water travel time of about 25 years from this TCE release area to the Vistula Avenueneighborhood. A groundwater travel time of 25 years represents an average groundwatervelocity of about 400 feet per year. Based on organic carbon content measurementscollected during investigations of the nearby Gemeinhardt site (Attachment A; ENSR,1988), it is expected that there would be some adsorption of TCE to the sediment matrixand a consequent reduction in the average transport velocity of TCE compared to theaverage groundwater velocity. The organic carbon content measurements reported forthe Gemeinhardt site are generally low and the consequent retardation of TCE averagetransport velocity is likewise expected to be low.
w \KW\030II5I5 «l GeoTransJnc.

Water quality data of shallow samples from lead-screen auger LSA-14 indicatean additional source of TCE contamination near the southeastern portion of the CountyRoad 1 area. Cross section G-G' (Attachment C) illustrates the vertical distribution ofTCE contamination along a line which extends from the Conrail property toward and intothe County Road 1 residential area and toward the Vistula Avenue neighborhood. Therelatively high TCE concentrations in the shallow samples from LSA-14 compared towater quality analyses from comparable depths in LSA-8 reflect an additional TCEcontamination source between the Railyard and LSA-14. ^
Southeastern Main Classification Yard TCE Release
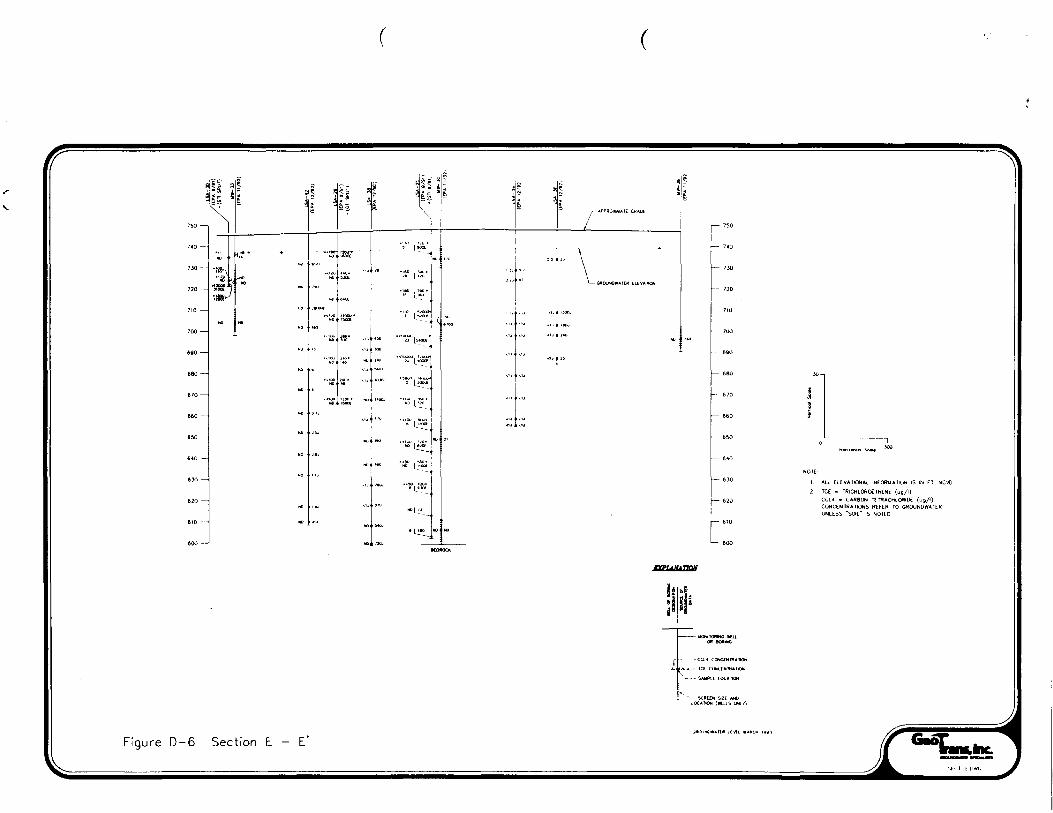
There was an apparent release of TCE in the southeastern portion of the MainClassification Yard. This release area is about 2,000 feet east of, and along approxi-mately the same trackline as, the previously described TCE release. Water quality datafrom monitoring wells MW-32I, MW-46I, and BMW-6S and lead screen augers LSA-28,LSA-18, and LSA-17 (see monitoring well and lead-screen auger water quality maps inAttachment C) indicate that TCE-contaminated groundwater is found at relatively lowconcentrations and at relatively shallow depths in this portion of the Railyard. TCE-contaminated groundwater extends in a generally north northwesterly direction from theapproximate area of monitoring wells MW-32I and MW-46I toward monitoring wellsMW-36I and BMW-6S. The lateral extent of the TCE-contaminated groundwater fromthis release area cannot be determined from the available data but it would be locatednorth and east of the previously described TCE-contaminated groundwater. Section E-E'(Attachment D, Figure D-5) indicates that there may be some co-mingling of the twoTCE releases.
Southeastern Main Classification Yard CC14 Release
There was a release of CC14 in the southeasterly portion in the Main ClassificationYard. Soil and groundwater quality data indicate that CC14 was released as a DNAPL
W l»4?«)JOIISIS.WI 4
GeoTransJnc.

in the approximate region of EPA soil borings EB24, EB25, EB40, EB41, EB42; GTIsoil borings Bl, B6, B7, B8, and B9; lead-screen auger borings LSA-22, LSA-23, andLSA-32; and monitoring well MW-46 (Attachment C).
* From this CC14 release area, groundwater flows in a generally north northwesterlydirection toward the St. Joseph River (Attachments C and E). The lateral extent of CC14-contaminated groundwater from this release area cannot been determined from theexisting information but it would be located north and east of the TCE-contaminatedgroundwater flowing from the south-central portion of the Main Classification Yard.
CC14 Release in the Vicinity of the Car Repair Shop
There is also a CC14 release area in the western portion of the Main ClassificationYard in the general vicinity of the car repair shop. Groundwater quality data from wellsin the vicinity of the car repair shop, such as MW-24, RMW-2, and PDPW-1, indicateCC14 concentrations of about 200 micrograms per liter (/xg/1) (Attachment C).Groundwater flows in a generally northwesterly direction from the vicinity of the carrepair shop toward monitoring locations LSA-11, MW-42, and MW-23 (Attachments Cand E). CC14 concentrations in groundwater samples from these two monitoring pointshave also been about 200 pig/1 (Attachment C).
From the vicinity of LSA-11, MW-42, and MW-23, CCl4-contaminated ground-water flows northwesterly beneath the Elkhart Office Machine property, the southwesternportion of the County Road 1 area, and toward the area of MW-37, MW-44, and MW-50(Attachments C and E). The CCl4-contaminated groundwater is generally located to thewest and south of the TCE-contaminated groundwater which originates in the south-central portion of the Main Classification Yard and there appears to be some co-minglingor mixing of the TCE and CCl4-contaminated groundwater. The mixing of the TCE andCC14 contamination is indicated on section A-A' (Attachment D, Figure D-2).
W \«XM»I IJI5 951
GeoTrans/inc.
Water quality data of samples collected from residential wells and monitoringwells located downgradient of the Conrail railyard indicate that there are one or moreadditional sources of CC14 contamination which contribute to the CCl4-contaminatedgroundwater found northwest of the car repair shop. One suspected source area islocated north of the Railyard in the general vicinity of the Elkhart Office Machineproperty. An EPA soil gas survey indicated CC14 contamination near the Elkhart OfficeMachine Building and at a location along Tower Road (Ecology and Environment,
19905). Several residential wells along the eastern end of Tower Road in the CountyRoad 1 area have consistently had significantly higher CC14 concentrations relative to theCC14 concentration detected in groundwater in the vicinity of the car repair shop. Duringthe period July 1986 to December 1993, residential wells at 30066, 30096, and 30113Tower Road have had CC14 concentrations ranging between 1,500 and 27,500 /ig/1. CC14
concentrations have frequently been observed between 3,000 and 5,000 /xg/1 at theseresidences between 1986 and 1993. The magnitude and persistence of CC14 concentra-tions in these residential wells along with the high CC14 concentration reported in theEPA soil gas survey in the vicinity of the Elkhart Office Machine property indicate alocal source of CC14 contamination in the southeastern portion of County Road 1.
There also appears to be an additional source of CC14 contamination in the vicinityof the Osceola drag strip. Water quality samples from monitoring well cluster MW-38have had CC14 concentrations that are considerably greater than samples from comparabledepths in upgradient well cluster MW-37. In addition, relatively high CC14 concentra-tions have been detected in groundwater samples collected from near the water table inMW-38. Consequently, it appears there is a local source of CC14 contamination in thisarea.
Groundwater Contamination beneath the East Yard
In the vicinity of the East Yard portion of the Conrail property, groundwatergenerally flows in a northerly direction from south of the Railyard beneath the East Yard
W:MM2\OMII3I3.«SI
GeoTransJnc.
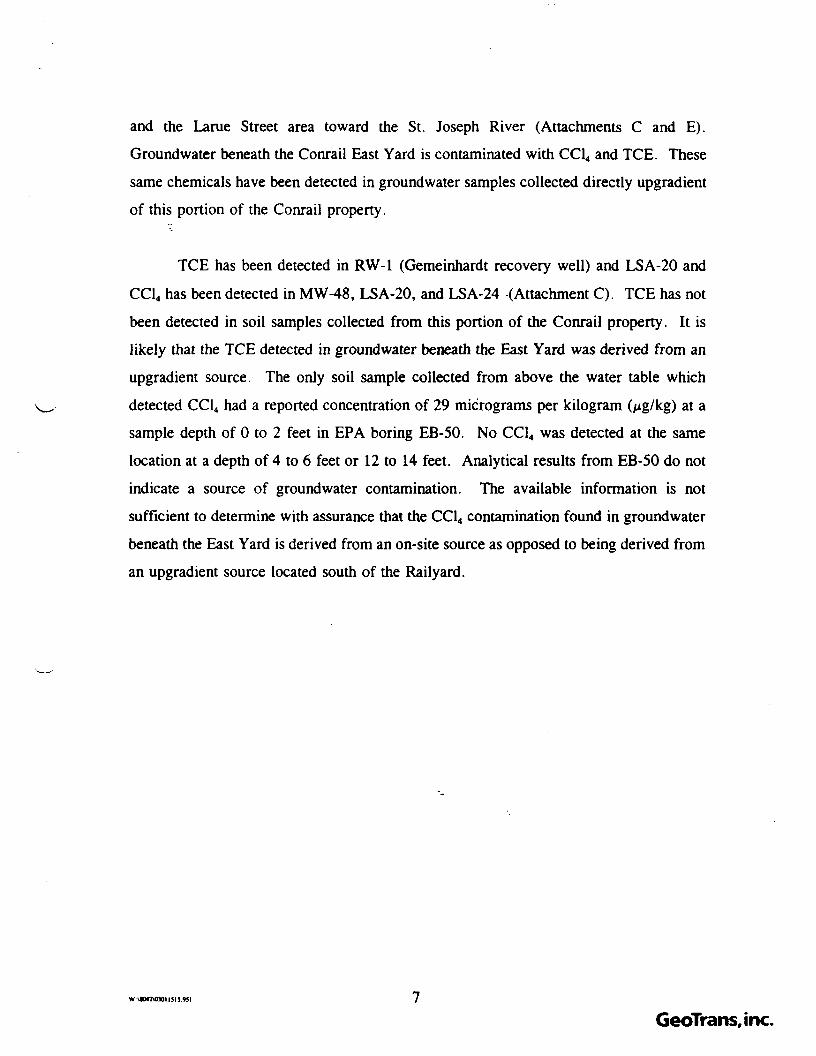
and the Larue Street area toward the St. Joseph River (Attachments C and E).Groundwater beneath the Conrail East Yard is contaminated with CC14 and TCE. Thesesame chemicals have been detected in groundwater samples collected directly upgradientof this portion of the Conrail property.
TCE has been detected in RW-1 (Gemeinhardt recovery well) and LSA-20 andCC14 has been detected in MW-48, LSA-20, and LSA-24 (Attachment C). TCE has notbeen detected in soil samples collected from this portion of the Conrail property. It islikely that the TCE detected in groundwater beneath the East Yard was derived from anupgradient source. The only soil sample collected from above the water table whichdetected CC14 had a reported concentration of 29 micrograms per kilogram (/xg/kg) at asample depth of 0 to 2 feet in EPA boring EB-50. No CC14 was detected at the samelocation at a depth of 4 to 6 feet or 12 to 14 feet. Analytical results from EB-50 do notindicate a source of groundwater contamination. The available information is notsufficient to determine with assurance that the CC14 contamination found in groundwaterbeneath the East Yard is derived from an on-site source as opposed to being derived froman upgradient source located south of the Railyard.
W:MM2\0»IISI593I
GeoTransJnc.

ATTACHMENT A
Reports and Data Reviewed
W:\KM2UUOII3I3.9SI
GeoTrans,inc.

REPORTS AND DATA REVIEWED
Ecology and Environment, Inc., 1990a. Technical memoranda of aquifer characteristictests at the Conrail/County Road 1 site.
Ecology and Environment, Inc., 1990b. Preliminary Evaluation of Phase 1 RI Resultsand Interim Remedial Alternatives for the Conrail/County Road 1 RI/FS WorkAssignment (WA) 01-5L7Y.
Ecology and Environment, Inc., 1992. Phase II Remedial Investigation Conrail RI/FSElkhart, Indiana Technical Memorandum Work Assignment Number 01 - 5L7Y.
Ecology and Environment, Inc., 1993. Remedial Investigation/Feasibility Study for theConrail Site Elkhart, Indiana Alternative Array Document ARCS Contract No.68-W8-0086 Work Assignment No. 01-5L7Y.
Ecology and Environment, Inc., 1994. Remedial Investigation/Feasibility Study for theConrail Site Elkhart, Indiana Feasibility Study Report ARCS Contract No. 68-W8-0086 Work Assignment No. 01-5L7Y.
ENSR Consulting and Engineering, June 1987. Progress report, hydrogeologicalinvestigation, Gemeinhardt site area, Elkhart, Indiana.
ENSR Consulting and Engineering, 1988a. Final report, hydrogeological investigationand hazard evaluation, Gemeinhardt site area, Elkhart, Indiana.
ENSR Consulting and Engineering, 1988b. Remedial action evaluation and recommend-ation, Gemeinhardt site area, Elkhart, Indiana.
ENSR Consulting and Engineering, June 1991. Design report for groundwater recoveryand treatment system, Gemeinhardt site, Elkhart, Indiana.
ENSR Consulting and Engineering, December 1991. Letter from David B. Urban toJoseph Horowitz of CBS, Inc. re. update of contaminant plume maps for theGemeinhardt off-site remediation.
GeoTrans, Inc., 1990. FTWORK: Groundwater flow and solute transport in threedimensions, Version 2.8B
GeoTrans, Inc., 1995. Water quality database, summary of water quality data in Geo-Trans files.
Gray, Henry H. et al., 1987. Bedrock Geologic Map of Indiana, State of IndianaGeological Survey Department of Natural Resources, Miscellaneous Map 48.
W \KMM30II5I595I A-1
GeoTrans, inc.
Gray, Henry H. 1989. Quaternary Geologic Map of Indiana, State of Indiana GeologicalSurvey Department of Natural Resources, Miscellaneous Map 49.
Groundwater Technology, Inc., 1989. Subsurface Investigation for the Conrail RailyardElkhart, Indiana November 10, 1989.
Groundwater Technology, Inc., 199la. Soil vapor survey results, Fibertron and RobertMartin drum site.
Groundwater Technology, Inc., 1991b. Soil vapor survey results. Track 69 investiga-tion.
Groundwater Technology, Inc., 1992. Soil vapor survey results, southwest area of MainClassification Yard.
Groundwater Technology, Inc., 1993. Soil vapor survey results, Elkhart OfficeMachines and Walerko Tool and Engineering.
Groundwater Technology, Inc. Aquifer pump test results, March 1993.
Groundwater Technology, Inc., 2/93 - 9/94. Quarterly groundwater analytical results.
Johnson, Gerald H. et al., 1992. Geologic Map of the l°x 2° Fort Wayne Quadrangle,Indiana, Michigan, and Ohio, showing bedrock and unconsolidated deposits,Michigan State Geological Survey, Regional Geologic Map No. 8.
Residential well water quality data collected by the Indiana Department of EnvironmentalManagement, 1986 to!991.
Residential well water quality data collected by Groundwater Technology, 3rd quarter1992 to 2nd quarter 1994.
Reussow J.P. et al. 1975. Water Resources of the St. Joseph River Basin in Indiana,U.S. Geological Survey, Hydrologic Investigations Atlas HA-357.
Roy F. Weston, Inc., 1986a. Regional ground water investigation of volatile organiccontamination in Elkhart, Indiana.
Roy F. Weston, Inc., 1986b. Site Assessment for Conrail Rail Yard, Elkhart, Indiana.
Roy F. Weston, Inc., November 1986. County Road 1 Site Assessment for Conrail RailYard, Elkhart, Indiana.
St. Joseph River Gauging Station data at Elkhart, Indiana, 10/1/90 to 8/12/93.
W:M04IUnOII3IS.*9l
GeoTrans.inc.

U.S. EPA, 1990. Site analysis, Conrail Railyard, Elkhart, Indiana, Volume 2, Environ-mental Monitoring Systems Laboratory, TS-PIC-89136.
U.S. Geological Survey Quadrangle Map for Elkhart, Indiana, 1961 (photo revised1981). Scale 1:24000, 7.5 minute series (topographic).
U.S. Geological Survey Quadrangle Map for Osceola, Indiana, 1969 (photo revised1986). Scale 1:24000, 7.5 minute series (topographic).
U.S. Geological Survey, 1989. Documentation of computer programs to compute anddisplay pathlines using results from the USGS modular three-dimensional finite-difference ground-water flow model, USGS Open File Report 89-381, Ver-sion 1.8A.
W:\HM2I030II5I9.95I A~3
GeoTrans,inc.
During the past four years. Dr. Guswa has testified as an expert in the following matters:
Purex Industries. Inc. v. Lesley Walpole Procter, et al.. No. C 446 935 (Superior Courtfor Los Angeles County, California) (Deposition and Trial)
Cohas'set Heights Landfill v. Massachusetts Dept. of Public Works (Arbitration Hearing)
Robert Shaw Controls Company v. Watts Regulator. No. 91-0392-TC (United StatesDistrict Court for the District of Maine) (Deposition)
Cummings Properties Management. Inc. v. W.R. Grace & Co. No. 91-2641-L (SuperiorCourt of Middlesex County, Massachusetts) (Deposition)
E.I, du Pont de Nemours and Company v. Admiral Insurance Company et al.. CivilAction No. 89-C-AU-99-CV (Superior Court for Newcastle County, Delaware)(Deposition)
Town of Shrewsbury v. Neles-Jamesbury. Inc. and Goddard Industries. Inc.. CivilAction No. 90-3741 (Worcester Superior Court, Massachusetts) (Deposition)
Cash Energy. Inc. et al. v. Melvin L. Weiner. et al.. Civil Action No. 90-12624-REK(U.S. District Court, District of Massachusetts) (Deposition)
General Electric v. Kvsor Industrial Company. Civil Action No. 4:90 CZ 143 (U.S.District Court, District of Western Michigan Southern Division) (Deposition)
W:\JOO030II9I59JI A~4
GeoTransJnc.
>y Q
m-13 EXPLANATION
C^^ LAGOON / SETTLING POND
82-) E§_7 ERA SOIL BORING
«-« <£* CT SOIL BORING
r

WESTOESIGNATEDUNK CARASSESSMENT
Soi Borings
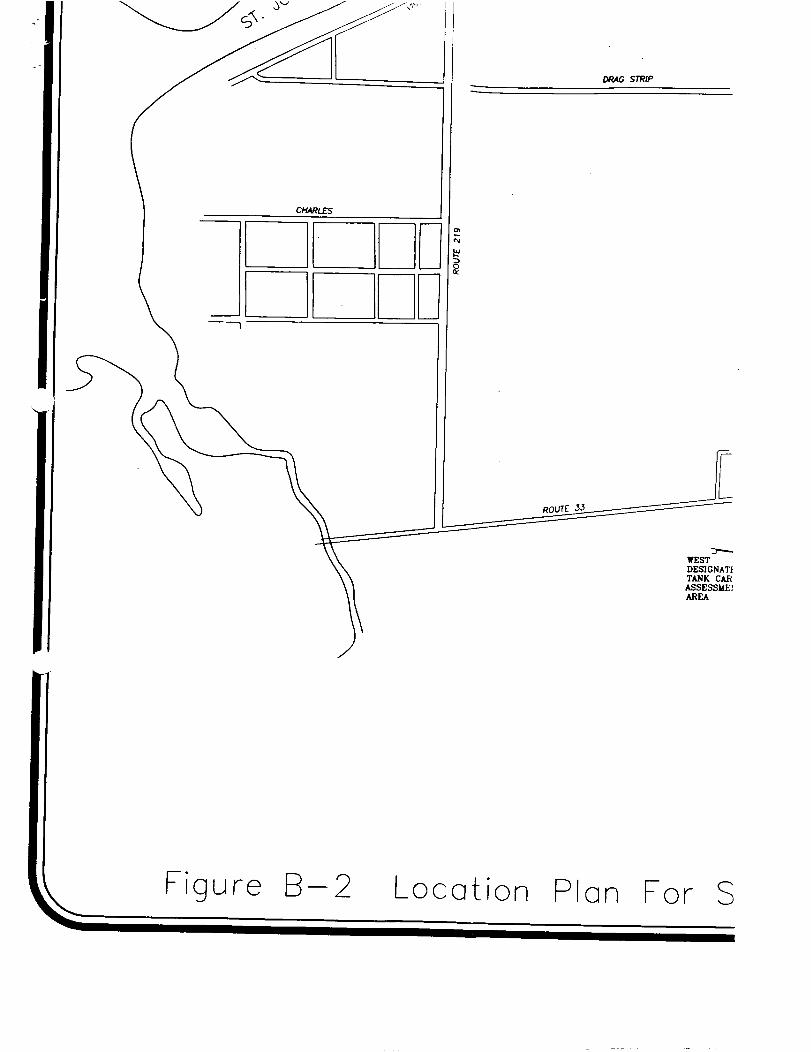
Figure B-2 Location Plan For

•HSA-J9 . J&-44MW-26 * LS4-30

NOTE
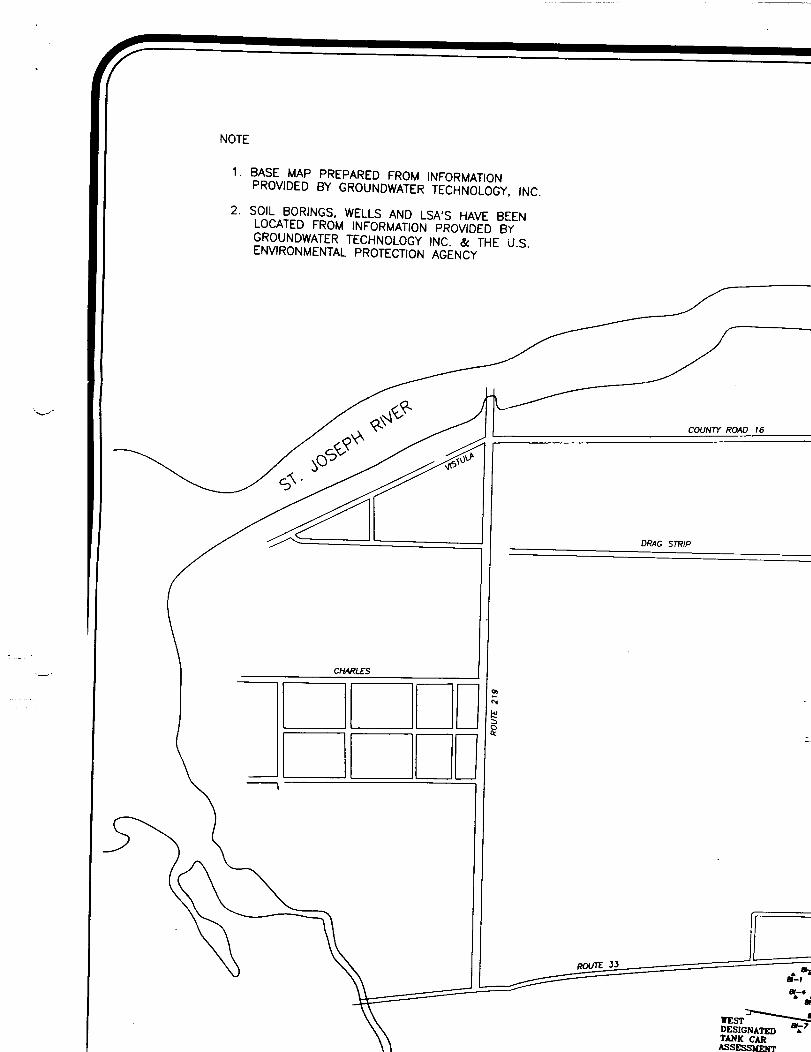
1. BASE MAP PREPARED FROM INFORMATIONPROVIDED BY GROUNDWATER TECHNOLOGY, INC.
2. SOIL BORING, WELLS AND LSA'S HAVE BEENLOCATED FROM INFORMATION PROVIDED BYGROUNDWATER TECHNOLOGY INC. & THE U.S.ENVIRONMENTAL PROTECTION AGENCY
WESTDESIGNATm


.TEDiRfENT
• MW-13
o aoo
acux » nzr
Veils and Lead Screen Auger Borings

Figure B —1 Location Plan For V\

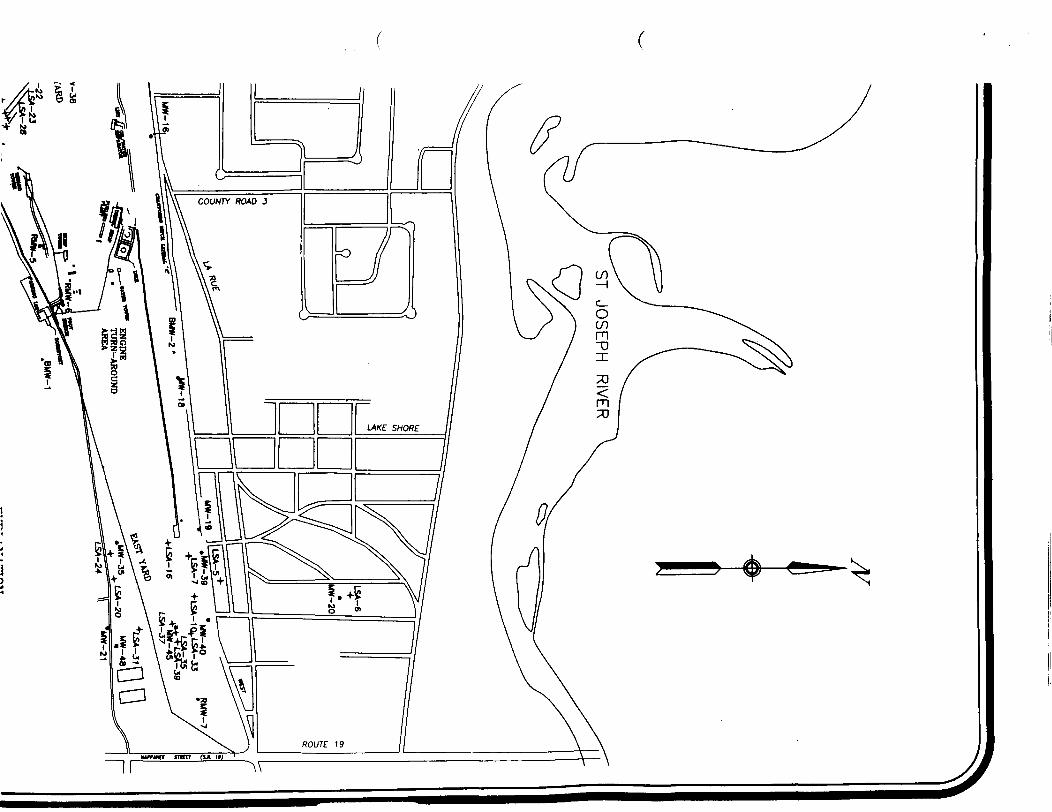
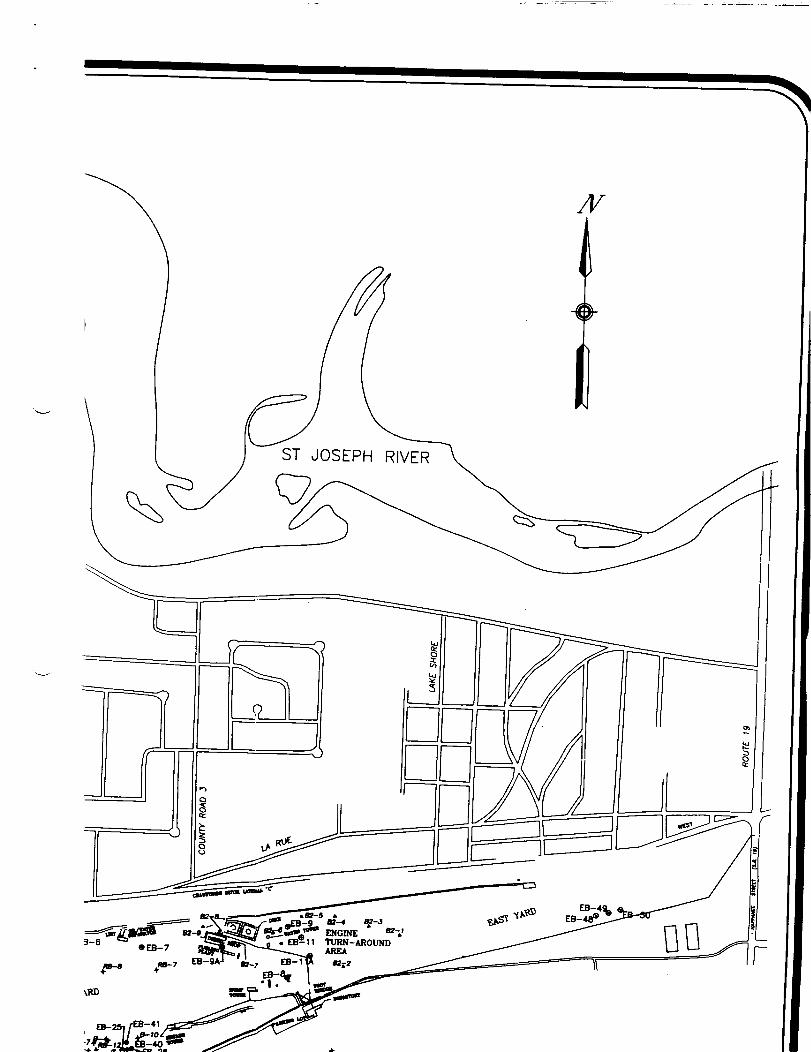
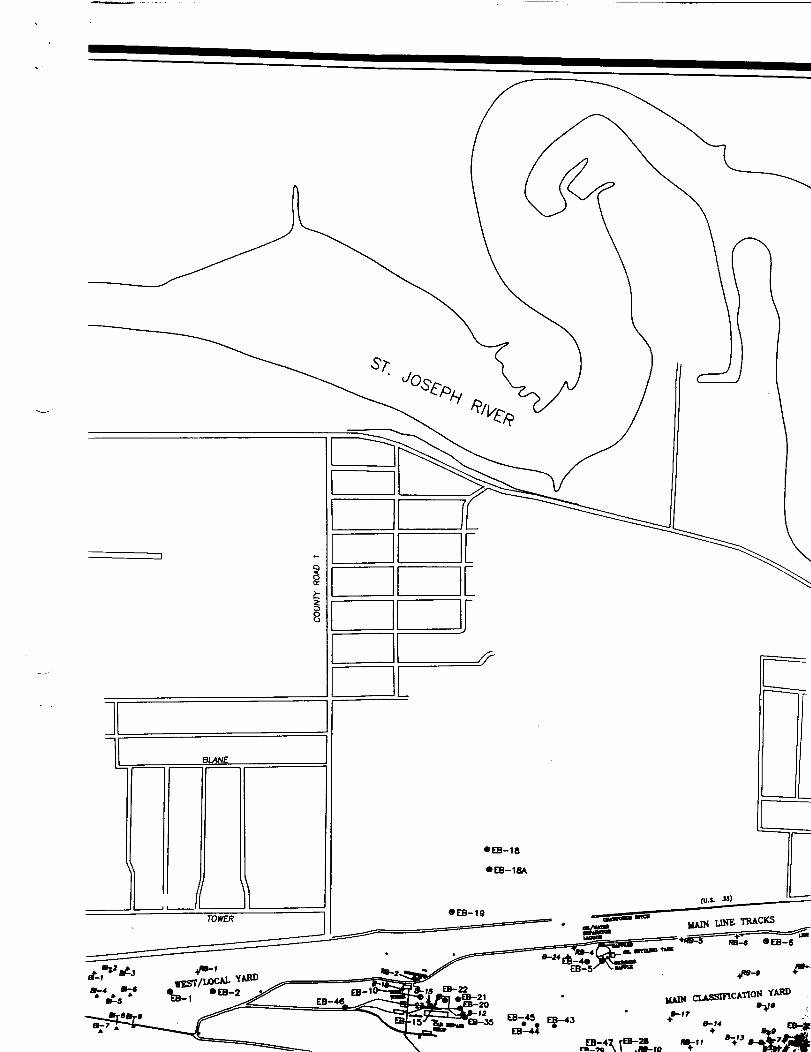
ATTACHMENT B
Monitoring Well, Lead-Screen Auger, and Boring Location Map
W:\SWM3011515 »l
GeoTrans,inc.
ST JOSEPH RIVER
»•*EB-47 rfB-28nfSo \ I .»-t
«5-,, I3 •4s*
1. BASE MAP PREPARED FROM INFORMATIONPROVIDED BY GROUNDWATER TECHNOLOGY, INC.
2. SOIL BORINGS, WELLS AND LSA'S HAVE BEENLOCATED FROM INFORMATION PROVIDED BYGROUNDWATER TECHNOLOGY INC. & THE U.S.ENVIRONMENTAL PROTECTION AGENCY
WESTDESIGNATEDTANK CARASSESSMENT
ATTACHMENT C
Areal Plots of Water and Soil Quality Dataand
Groundwater Contour Map
W:\J042VOX>I ISISWI
GeoTrans.inc.
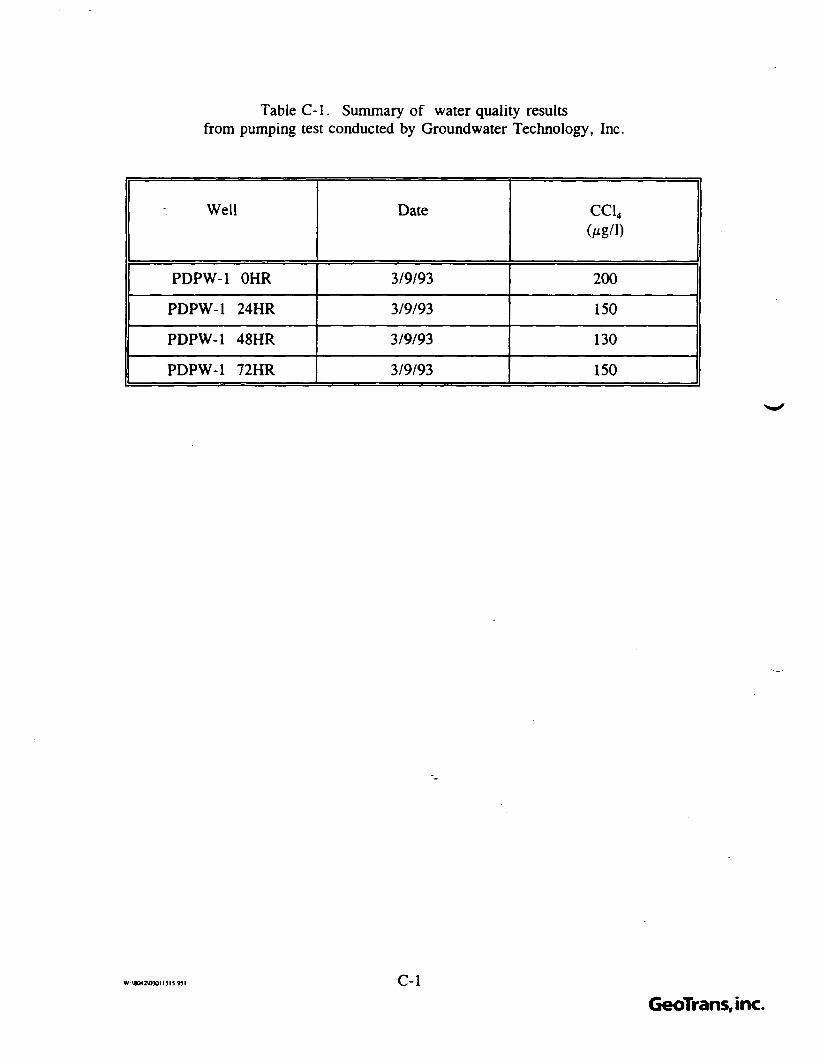
Table C-l. Summary of water quality resultsfrom pumping test conducted by Ground water Technology, Inc.
Well
PDPW-1 OHR
PDPW-1 24HR
PDPW-1 48HR
PDPW-1 72HR
Date
3/9/93
3/9/93
3/9/93
3/9/93
CC14
(Mg/D
200
150
130
150
WMMZI03011515 Wl C-lGeoTransJnc.

SUMMARY OF TCE AND CCL4 SOIL DATA FOR CONRAIL PROPERTY
SAMPLE NUMBERB-01-00B-01-02B-01-04B-01-06B-01-08B-01-10B-01-15B-01-20B-01-25B-01-30B-01-35B-02-00B-02-02B-02-04B-02-06B-02-08B-02-10B-02-1 5B-02-15.5B-02-1 8B-02-20B-02-25B-02-30B-02-35B-03-00B-03-02B-03-04B-03-06B-03-10B-03-15B-03-20B-03-25B-03-30B-03-35B-04-00B-04-02B-04-04B-04-06B-04-08B-04-10B-04-15B-04-17.5B-04-1 8
DATE03/06/9103/06/9103/06/9103/06/9103/06/9103/06/9103/06/9103/06/9103/06/9103/06/9103/06/9103/05/9103/05/9103/05/9103/05/9103/05/9103/05/9103/05/9103/05/9103/05/9103/05/9103/05/9103/05/9103/05/9103/05/9103/05/9103/05/9103/05/9103/05/9103/05/9103/05/9103/05/9103/05/9103/05/9103/12/9103/12/9103/12/9103/12/9103/12/9103/12/9103/12/9103/12/9103/12/91
FIELD GC (ug/kg)CCL4NDNDNDNDNDNDNDNDNDNDNDNDNDNDNDNDNDNDND460011300110NDNDNANDND34NDNDNDNDNDNDNDNDNDNDNDND246526
TCENDNDNDNDNDNDNDNDNDNDNDNDNDNDNDNDNDNDNDNDNDNDNDNDNANDNDNDNDNDNDNDNDNDNDNDNDNDNDNDNDNDND
LAB VOC (ug/kg)CCL4
8100
50
<40
400
TCE
NA
NA
NA
NA
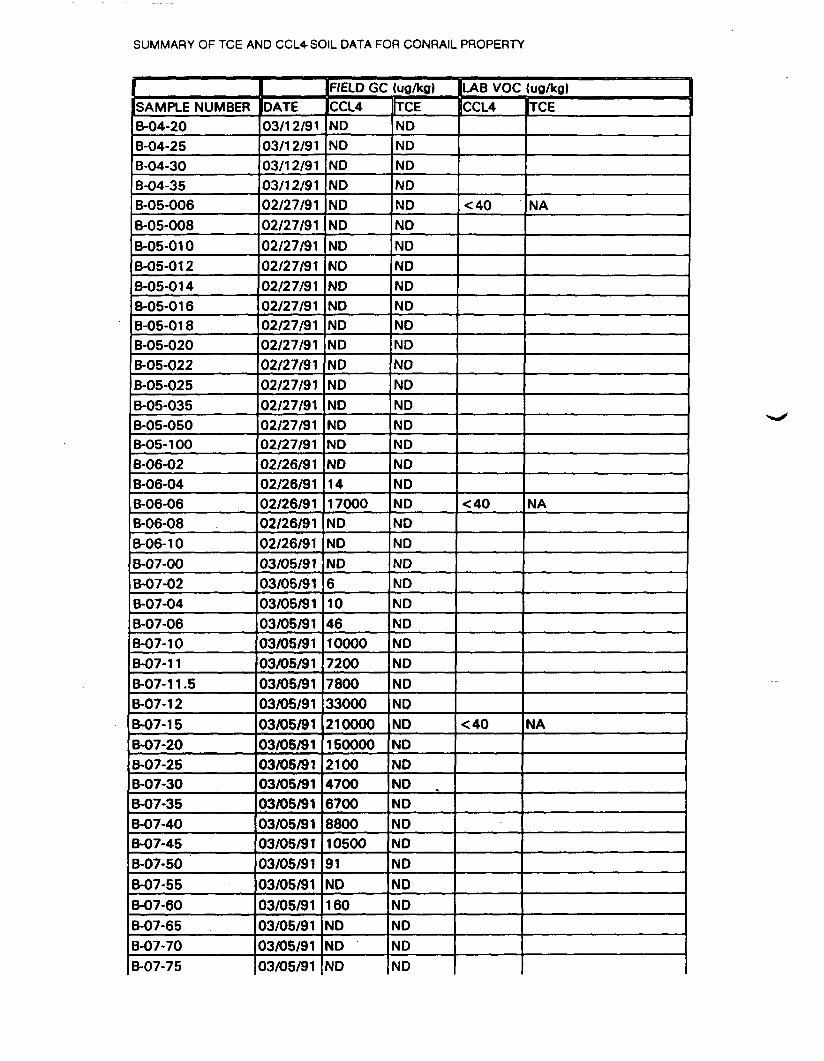
SUMMARY OF TCE AND CCL4-SOIL DATA FOR CONRAIL PROPERTY
SAMPLE NUMBERB-04-208-04-25B-04-30B-04-35B-05-006B-05-008B-05-010B-05-01 2B-05-014B-05-01 6B-05-01 8B-05-020B-05-022B-05-025B-05-035B-05-050B-05-100B-06-02B-06-04B-06-06B-06-08B-06-10B-07-00B-07-02B-07-04B-07-06B-07-10B-07-1 1B-07-1 1 .5B-07-1 2B-07-1 5B-07-20B-07-25B-07-30B-07-35B-07-40B-07-45B-07-50B-07-55B-07-60B-07-65B-07-70B-07-75
DATE03/12/9103/12/9103/12/9103/12/9102/27/9102/27/9102/27/9102/27/9102/27/9102/27/9102/27/9102/27/9102/27/9102/27/9102/27/9102/27/9102/27/9102/26/9102/26/9102/26/9102/26/9102/26/9103/05/9103/05/9103/05/9103/05/9103/05/9103/05/9103/05/9103/05/9103/05/9103/05/9103/05/9103/05/9103/05/9103/05/9103/05/9103/05/9103/05/9103/05/9103/05/9103/05/9103/05/91
FIELD GC fug/kg)CCL4NDNDNDNDNDNDNDNDNDNDNDNDNDNDNDNDNDND1417000NDNDND6104610000720078003300021000015000021004700670088001050091ND160NDNDND
TCENDNDNDNDNDNDNDNDNDNDNDNDNDNDNDNDNDNDNDNDNDNDNDNDNDNDNDNDNDNDNDNDNDNDNDNDNDNDNDNDNDNDND
LAB VOC (ug/kg)CCL4
<40
<40
<40
TCE
NA
NA
NA
SUMMARY OF TCE AMD CCL4 SOIL DATA FOR CONRAIL PROPERTY
SAMPLE NUMBERB-08-00B-08-02B-08-04B-08-06B-08-06.5B-08-10B-08-15B-08-15.33B-08-20B-08-30B-08-35B-08-40B-08-45B-08-50B-08-55B-08-60B-08-65B-08-70B-08-75B-08-80B-08-85B-09-04B-09-06B-09-13B-09-15B-09-20B-09-25B-09-29B-09-30B-09-35B-09-40B-09-45B-09-50B-09-55B-09-60B-09-65B-09-70B-09-80B-09-85B- 10-09B-10-14B-10-24B- 10-31
DATE03/12/9203/12/9203/12/9203/12/9203/12/9203/12/9203/12/9203/1 2/9203/1 2/9203/1 2/9203/12/9203/12/9203/12/9203/12/9203/12/9203/12/9203/12/9203/12/9203/12/9203/12/9203/12/9203/13/9103/13/9103/13/9103/13/9103/13/9103/13/9103/13/9103/13/9103/13/9103/13/9103/13/9103/13/9103/13/9103/13/9103/13/9103/13/9103/13/9103/13/9107/15/9107/15/9107/15/9107/15/91
FIELD GC (ug/kg)CCL4NDNDNDND180ND30000055000120120ND260ND116012025ND12ND9NDNDNDND<200330550005300970670026003500530120077NDNDNDNDNDND
TCENDNDNDNDNDNDNDNDNDNDNDNDND12<56NDNDNDNDNDNDNDNDNDNDNDNDNDNDNDNDNDND .NDNDNDNDNDNDNDND<5
LAB VOC (yg/kg)CCL4
35000
3100
TCE
NA
NA
SUMMARY OF TCE AND CCL4 SOIL DATA FOR CONRAIL PROPERTY
SAMPLE NUMBERB- 10-34B- 10-44B- 10-54B-11-08B-11-13B-11-23B-11-33B-11-43B-11-53B-12-10B-12-15B- 12-25B-12-35B-1 2-45B-1 2-55B-1 2-65B-1 3-08B-1 3-11B-1 3-1 3B-1 3-23B-1 3-27B-1 3-33B-1 3-43B-1 3-53B-1 4-09B-1 4-1 5B-1 4-25B-1 4-35B-1 4-37B-1 4-45B-1 4-55B-1 5-01 2B-1 5-01 7B-1 5-025B-1 5-029B-1 5-035B-1 5-041B-1 5-045B-1 5-055B-1 5-065B-1 5-075B-1 5-085B-1 5-095
DATE07/15/9107/15/9107/15/9107/16/9107/16/9107/16/9107/16/9107/16/9107/16/9107/19/9107/19/9107/19/9107/19/9107/19/9107/19/9107/19/9107/29/9107/29/9107/29/9107/29/9107/29/9107/29/9107/29/9107/29/9107/31/9107/31/9107/31/9107/31/9107/31/9107/31/9107/31/9108/01/9108/01/9108/01/9108/01/9108/01/9108/01/9108/01/9108/01/9108/01/9108/01/9108/01/9108/01/91
FIELD GC (ug/kg)CCL4NDNDND5.7<5<5NDNDNDND<5<5<5<5<5NDNDNDNDNDNDNDNDNDNDNDNDNDNDNDND16269.73.47
7.76.543212024
>
TCENDNDNDNDND<5<5NDNDNDNDNDNDNDNDNDNDNDNDNDNDNDNDNDND8.91520NDNDND5.3
><5 .NDNDNDND4.35.1<5NDND
LAB VOC {ug/kg)CCL4
<40
<40
<40
<40
TCE
<40
<40
50
<40
SUMMARY OF TCE AND CCL4 SOIL DATA FOR CONRAIL PROPERTY
SAMPLE NUMBERB-15-100B-1 6-011B-16-016B-1 6-020B-1 6-02 5B-1 6-035B-1 6-045B-1 6-055B-1 6-065B-1 6-075B-1 6-085B-1 6-095B-1 6-1 05B-1 7-011B-1 7-01 6B-1 7-025.5B-1 7-035.5B-1 7-045. 5B-1 7-055.5B-1 7-065.5B-1 7-075.5B-1 7-085. 5B-1 7-095.5B-17-105.5B-1 8-01 2B-1 8-01 6.5B-1 8-025B-1 8-035.5B-1 8-045B-1 8-055B-1 8-065B-1 8-075B-1 8-085B-1 8-095B-1 8-1 05B-24-006B-24-015B-24-019B-24-030B-24-036.4B-24-040B-24-050B-24-060
DATE08/01/9108/05/9108/05/9108/05/9108/05/9108/05/9108/05/9108/05/9108/05/9108/05/9108/05/9108/05/9108/05/9108/06/9108/06/9108/06/9108/06/9108/06/9108/06/9108/06/9108/06/9108/06/9108/06/9108/06/9108/12/9108/12/9108/12/9108/12/9108/12/9108/12/9108/12/9108/12/9108/12/9108/12/9108/12/9109/12/9109/12/9109/12/9109/12/9109/12/9109/12/9109/12/9109/12/91
FIELD GC (ug/kg)CCL44.1NDNDNDNDNDNDNDNDND<10NDNDND<5<5ND<5NDNDNDNDNDNDNDNDNDNDND<59.8<5<5NDNDNDNDND126.5NDNDND
TCENDND10NDNDNDND229.84110NDNDND6.31926100<51019NDNDNDNDNDNDNDNDNDNDNDNDNDNDNDNDND60337.19192
LAB VOC (ug/kg)CCL4
<40
<40
<40
<40
140
TCE
<40
1800
<40
<40
1000
SUMMARY OF TCE AND CCL4 SOIL DATA FOR CONRAIL PROPERTY
SAMPLE NUMBERB-24-070B-24-080B-24-090B-24-100BB1-01ABB1-01BBB1-02ABB1-02BBB1-03ABB1-03BBB1-04ABB1 -04BBB1-05ABB1-05BBB1-06ABB1-06BBB1-06DBB1-07ABB1-07BBB1-08ABB1-08BBB1-09ABB1-09BBB2-01BB2-01ABB2-01BBB2-02ABB2-02BBB2-03ABB2-03BBB2-04ABB2-04BBB2-05ABB2-05BBB2-06ABB2-06BBB2-07BB2-08ABB2-08BBB2-09ABB2-09BBMW-01 ABMW-0 1B
DATE09/12/9109/12/9109/12/9109/12/9102/14/8902/14/8902/14/8902/14/8902/1 5/8902/1 5/8902/07/8902/07/8902/07/8902/07/8902/08/8902/08/8902/08/8902/02/8902/02/8902/02/8902/02/8902/02/8902/02/8902/20/8902/20/8902/20/8902/20/8902/20/8902/20/8902/20/8902/21/8902/21/8902/20/8902/21/8902/17/8902/17/8902/17/8902/17/8902/17/8902/17/8902/17/8902/17/8902/1 7/89
FIELD GC (ug/kg)CCL4NDNDNDND
TCE46181621
LAB VOC (ug/kg)CCL4
<40<40<40<40<40<40<40<40<40<40<40<40<40<40<40<40<40<40<40<40<40<40<40<40<40<40<40<40<40<40<40<40<40<40<40<40<40<40<40
TCE
<40<40<40<40<40<40<40<40<40<40<40<40<40<40<40<40<40<40<40<40<40<40<40<40<40<40<40<40<40<40<40<40<40<40<40<40<40<40<40
SUMMARY OF TCE AND CCL4 SOIL DATA FOR CONRAIL PROPERTY
SAMPLE NUMBERBMW-02ABMW-02BBMW-03ABMW-03BBMW-04D-06BMW-04D-10BMW-04D-20BMW-04D-26BMW-04D-30BMW-04D-40BMW-04D-50BMW-04D-60BMW-04D-70BMW-04D-80BMW-04D-86BMW-06-009BMW-06-014BMW-06-025BMW-06-035BMW-06-045BMW-06-055BMW-06-065BMW-06-075BMW-06-085BMW-06-095BMW-06-105BMW-06-115BMW-06-130BMW-07-01 1BMW-07-020BMW-07-030BMW-07-038BMW-07-041BMW-07-050BMW-07-060BMW-07-070BMW-07-080BMW-07-090BMW-07-100BMW-08D-010BMW-08D-015BMW-08D-025BMW-08D-026
DATE02/21/8902/21/8902/1 5/8902/15/8903/07/9103/07/9103/07/9103/07/9103/07/9103/07/9103/07/9103/07/9103/07/9103/07/9103/07/9108/20/9108/20/9108/20/9108/20/9108/20/9108/20/9108/20/9108/20/9108/20/9108/20/9108/20/9108/20/9108/20/9109/04/9109/04/9109/04/9109/04/9109/04/9109/04/9109/04/9109/04/9109/04/9109/04/9109/04/9108/13/9108/13/9108/13/9108/13/91
FIELD GC (ug/kg)CCL4
NONDNONDNDNDNDNDNDNDNDNDNDNDNDNDND180630015002700255NDNA<5<5NA<56<5688NANDNDNDND
TCE
NDNDNDND180NDNDNDNDNDNDNDNDNDNDNDND73<3000<500ND<40NDNDNA71.4NA159012032034866NAND<5<5ND
LAB VOC- tag/kg)CCL4<40<40 ?-"<40<40
<40
TCE<40<40<40<40
2600

SUMMARY OF TCE AND CCL4 SOIL DATA FOR CONRAIL PROPERTY
SAMPLE NUMBERBMW-08D-035BMW-08D-045BMW-08D-055BMW-08D-065BMW-08D-075BMW-08D-085BMW-08D-095BMW-08D-105BMW-09-009BMW-09-014BMW-09-025BMW-09-035BMW-09-045BMW-09-055BMW-09-065BMW-09-089BMW-09-095BMW-09-105BMW- 10-0 11BMW-10-016BMW- 10-025BMW- 10-035BMW- 10-045BMW- 10-055BMW- 10-065BMW-10-075BMW- 10-085BMW- 10-095BMW-10-105RB-01ARB-01BRB-02RB-02BRB-03ARB-03BRB-04ARB-04BRB-05ARB-05BRB-06ARB-06BRB-07ARB-07B
DATE08/13/9108/13/9108/13/9108/13/9108/13/9108/13/9108/13/9108/13/9108/23/9108/23/9108/23/9108/23/9108/23/9108/23/9108/23/9108/23/9108/23/9108/23/9108/29/9108/29/9108/29/9108/29/9108/29/9108/29/9108/29/9108/29/9108/29/9108/29/9108/29/9102/13/8902/13/8902/16/8902/16/8902/16/8902/16/8902/13/8902/13/8902/13/8902/13/8902/13/8902/13/8901/30/8901/30/89
FIELD GC (ug/kg)CCL4NDNDNDNDNDNDNDNDNDNDNDNDNDNDNDNDNDNDNDNDNDNDNDNDNDNDND<5<5
TCEND<5<5<5<5<5<5<5NDNDNDNDNDNDNDNDNDNDNDNDNDNDNDNDNDNDND<5<5
LAB VOC (ug/kg)CCL4
<40<40
<40
<40<40<40<40<40<40<40<40<40<40<40<40<40<40
TCE
<40<40
<40
<40<40<40<40<40<40<40<40<40<40<40<40<40<40

SUMMARY OF TCE AND CCL4 SOIL DATA FOR CONRAIL PROPERTY
SAMPLE NUMBERRB-08ARB-08BRB-09ARB-09BRB-10ARB-10BRB-11ARB-11BRB-12ARB-12BRB-13ARB-13BRB-14ARB-14BRB-15ARB-15BRB-16ARB-16BRB-17ARB-1 7BRB-17DRMW-01ARMW-01 BRMW-02ARMW-02BRMW-02D-10RMW-02D-1 5RMW-02D-25RMW-02D-35RMW-02D-45RMW-02D-55RMW-02D-65RMW-02D-75RMW-02D-85RMW-03ARMW-03BRMW-04ARMW-04BRMW-05ARMW-05BRMW-05CRMW-05DRMW-06A
DATE01/31/8901/31/8901/31/8901/31/8902/01/8902/01/8902/01/8902/01/8902/01/8902/01/8902/18/8902/18/8902/03/8902/03/8902/06/8902/06/8902/19/8902/19/8902/20/8902/20/8902/21/8902/13/8902/13/8902/16/8902/16/8902/28/9102/28/9102/28/9102/28/9102/28/9102/28/9102/28/9102/28/9102/28/9102/16/8902/16/8902/1 6/8902/1 6/8902/19/8902/1 9/8902/19/8902/19/8902/18/89
FIELD GC (ug/kg)CCL4
NDNDNDNDNDNDNDNDND
TCE
NDNDNDNDNDNDNDNDND
LAB VQQ (Mg/kg)CCL4<40<40 . '<40<40<40<40<40<40<40510<40<40<40<40<40<40<40<40<40<40<40<40<40<40<40
<40<40<40<40<40<40<40<40<40
TCE<40[<40<40<4029007500<40<40<40<40<40<40<40<40<40<40<40<40<40<40<40<40<40<40<40
<40<40<40<40<40<40<40<40<40

SUMMARY OF TCE AND CCL4 SOIL DATA FOR CONRAIL PROPERTY
SAMPLE NUMBERRMW-06BRMW-06CRMW-07ARMW-07BEPA-B20-C-5-6.5EPA-B20-D-7.5-9.5EPA-B20-E-10-12EPA-B21 -2.5-4.5EPA-B21-5-7EPA-B21-10-12EPA-B22-2.5-4.5EPA-B22-2.5-4.5DEPA-B22-5-7EPA-B22-10-12EPA-B23-2. 5-4.5EPA-B23-5-7EPA-B23-10-12EPA-B24-5-7EPA-B24-22.5-24.5EPA-B25-5-7EPA-B25-20-22EPA-B25-23.5-25.5EPA-B26-2.5-4.5EPA-B26-22.5-24.5EPA-B26-27-29EPA-B27-10-12EPA-B28-0-2EPA-B28-0-2DUPEPA-B28-2.5-4.5EPA-B28-15-17EPA-B29-0-2EPA-B32-0-2EPA-35-O-2EPA-B35-7.5-9.5EPA-B35-1 2.5-1 4.5EPA-B36-2.5-4.5EPA-B36-5-7EPA-B36-1 2.5-1 4.5EPA-B37-5-7EPA-B37-15-17EPA-B37-1 7.5-1 9.5EPA-B38-2.5-4.5EPA-B38-10-12
DATE02/18/8902/1 8/8902/1 9/8902/1 9/8909/17/9109/17/9109/17/9109/17/9109/17/9109/17/9109/18/9109/18/9109/18/9109/18/9109/18/9109/18/9109/18/9110/02/9110/02/9110/02/9110/02/9110/02/9110/02/9110/02/9110/02/9110/04/9110/04/9110/04/910/04/910/04/910/04/910/04/910/05/910/05/910/05/910/05/910/05/910/05/910/09/910/09/910/09/910/09/910/09/91
FIELD GC (ug/kg)CCL4 TCE
.
LAB VOC (ug/kg)CCL4<40<40<40<40<1300<53<11<11<11<11<11<11<11<11<11<11<114J23000D2J800023000<11<112J<13<11<11<21<12<11<11<56<11<11<14<11<11<11<11<12<11<11
TCE<40<40<40<40<1300<53<11<11<11<11<11<11<11<11<11<11<11123J12<1300<1300<116J8J5J15000D13000D2406J131709J<11U<14<11<11<111J<12<11<11
SUMMARY OF TCE AND CCL4 SOIL DATA FOR CONRAIL PROPERTY
SAMPLE NUMBEREPA-B38-15-17EPA-B39-5-7EPA-B39-5-7DUPEPA-B39-15-17EPA-B40-8-10EPA-B40- 18-20EPA-B40-22-24EPA-B40-58-60EPA-B40-118-120EPA-B40-128-130EPA-B40-130-132EPA-B40-140-142EPA-B40-144-146EPA-B40-148-150EPA-B41-5-7EPA-B4 1-2 1-23EPA-B41 -23-25EPA-B42-3-5EPA-B42-21-23EPA-B42-23-25EPA-B43-3-5EPA-B43-13-15EPA-B43-23-25EPA-B44-7-9EPA-B44-15-17EPA-B44-23-25EPA-B45-7-9EPA-B45-15-17EPA-B45-23-25EPA-B46-7-9EPA-B46-17-19EPA-B46-19-21EPA-B47-0-2EPA-B47-2-4EPA-B47-12-14EPA-B48-4-6EPA-B48-14-16EPA-B48- 18-20EPA-B49-6-8EPA-B49-16-18EPA-B49-22-24EPA-B50-0-2EPA-B50-4-6
[FIELD GC (ug/kg)DATE10/09/9110/09/9110/09/9110/09/91Jan-93Jan-93Jan-93Jan-93Jan-93Jan-93Jan-93Jan-93Jan-93Jan-93Jan-93Jan-93Jan-93Jan-93Jan-93Jan-93Jan-93Jan-93Jan-93Jan-93Jan-93Jan-93Jan-93Jan-93Jan-93Jan-93Jan-93Jan-93Jan-93Jan-93Jan-93Jan-93Jan-93Jan-93Jan-93Jan-93Jan-93Jan-93Jan-93
CCL4 TCELAB VOC (ug/kg)CCL4<11< 1 1<11<11ND250E/11064000NDND16NDNDND/NDNDND210004000/420ND2900019NDNDNDNDNDNDNDNDNDND(1300)NDNDND/NDNDNDND/ND31NDND/ND22ND29ND
TCE1J<11<11UNDNDND(3100)NDNDNDNDNDND/NDNDNDN 0(1 400)ND(1300)/ND(1400>NDND< 14000
NDNDNDNDND8JNDNDND17ND(1300)NDNDND/ND70NDND/NDNDNDND/NDNDNDNDND

SUMMARY OF TCE AND CCL4 SOIL DATA FOR CONRAH. PROPERTY
SAMPLE NUMBEREPA-B5CM2-14EPA-B5 1-0-2EPA-B5 1-2-4EPA-B5 1-4-6EPA-B52-0.5-1 .5
DATEJan-93Jan-93Jan-93Jan-93Jan-93
FIELD GC (ug/kg)CCL4 TCE
LAB VOC (ug/kg)CCL4NDNDND/NDNDND
TCENDND20/4489ND
NOTES:
CONRAIL BORING NAMES
B-#-MEDIAN DEPTH:BB1-#AOR B:BB2-# A OR B:BMW-#-MEDIAN DEPTH:RB-#:RMW-#- DEPTH OR LETTER:EPA-B#-DEPTH RANGJE^
ANALYSIS METHOD®
GTI BORINGBIASED BORINGS AREA ONE (GTI)BIASED BORING AREA TWO (GTI)BIASED MONITORING WELLS (GTI)RANDOM BORING (GTI)RANDOM MONITORING WELL (GTI)EPA SOIL BORINGS
FIELD GC:LAB VOC:
FIELD GAS CHROMATOGRAPHLABORATORY ANALYSIS OF VOLITILE *GANIC COMPOUNDS

) BASi MAC INIOHMATION I'HOVIOEOCROONOWAILK IECMNOLOCY, INfAND 1HE U S EPA
Figure C-1 TCE & CCL4 in Shallow Wells, 0 to 30 FeetGeo ,mc
MIM0n
A8042W01.DWC
. .JATER QUALITY RESULTS FOR ISA SAMPlESCOUECTED BflWftN THE DEPTH Of 0-30 FEET
? ICE - IRiCMLOROClHENE (ug/i)CCL4 = CARBON Tl IHACHIORIOE (u<j/0
3 BASE MAP INFOWMAIION ^ROvlLftO titCROUNOWAIEH lECHNOtOCT. INC4 IHE U S EPA
Figure C-2 TCE 8c CCL4 in Lead Screen Auger Borings, 0 to 30 FeetGeo inc.
A8042L01.DWG
EXPLANATIONEPA MONITORING WELl
Gil MONITORING WELL
2 ICt - IHlCHLWOtlHtNE (uq/l)CCL4 = CARBON HlRACMlORlW (uq/l)
GROUNDWATtKi me us EP
Figure C-3 TCE & CCL4 in Intermediate Wells, 30 to 100 FeetGeo
A8042W02.DWG

EXPLANATION
2 TCE • IftlCHLOSOtrHENt (uq/l)Ca< - CARBON rCTRACHtORtDC (Uq/i)
3 BASC MAP INFORMATION PROVIDED BCROUNOWAIER UCHNOt OCY. INC
Figure C-4 ICE &: CCL4 in Lead Screen
""•'* LPA MONIlORlNG Wtll
"~'» *"V* Gl1 MONITORING Wf [ I
1 W A T f c R QUALITY RESUL'S f OH « 11 S WllH *^CRILNEO DEPrn Of 100 f (£ I OR CH(* r tW
2 1CI - IRiCMLOHUtrnENt (u.j/t)CCL* * CAKBOM I[ fRACMl OWlOf (o.g/1)
i B»bt MAM INfORMAPlOM CWOVlUK) Hf
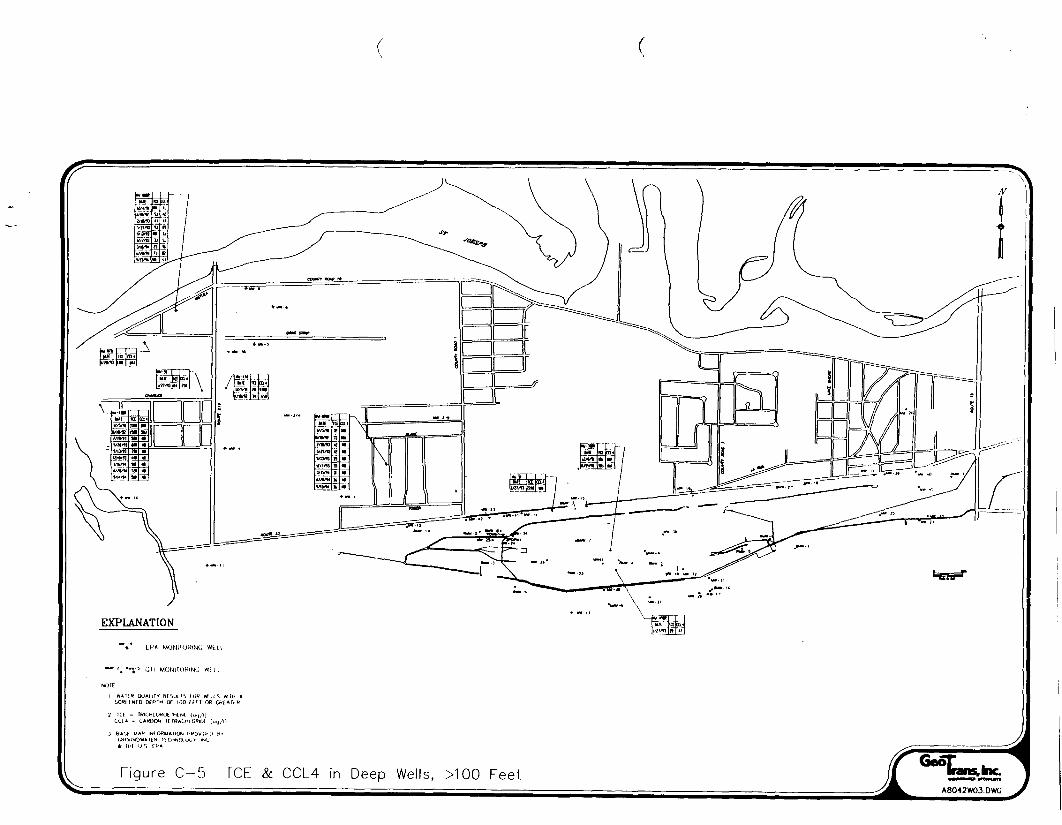
Figure C-5 TCE & CCL4 in Deep Wells, MOO Feet
CHOUNOWATf* THE u S t
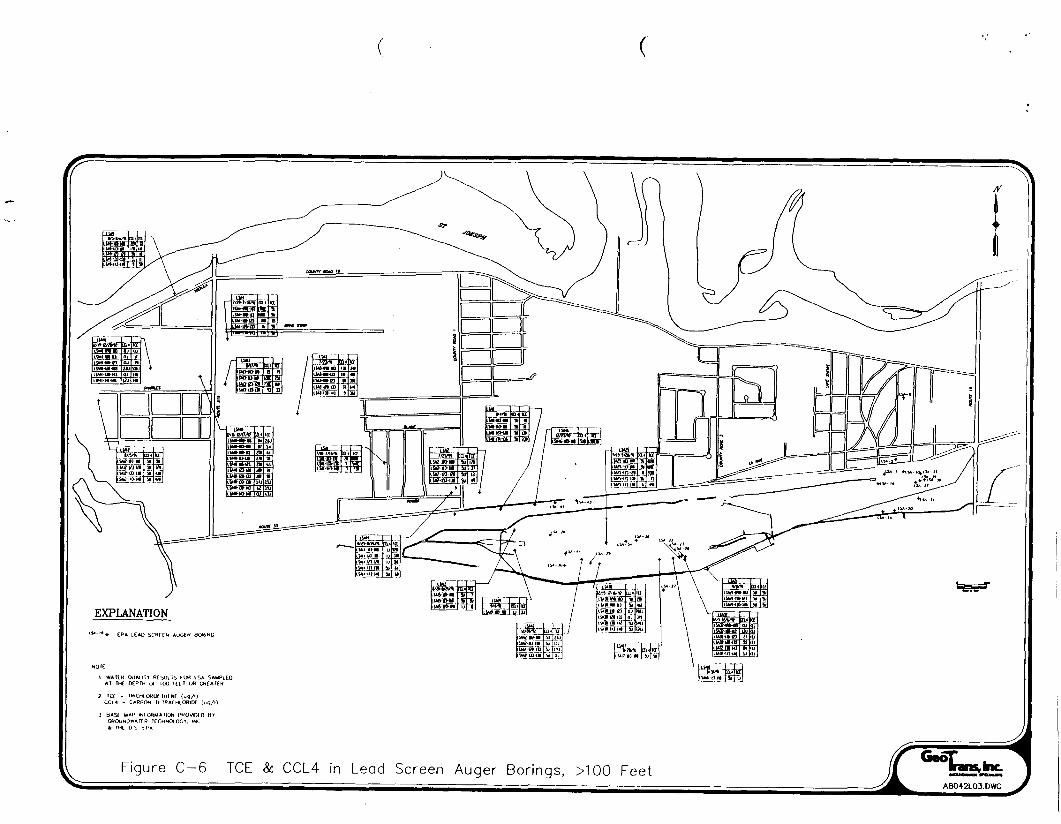
Figure C-6 TCE &: CCL4 in Lead Screen Auger Borings, >100 Feet

I WATER OUAlllY Hi iUl IS I (IK SOILBORINGS RESUIIS fRQU THE BORING1;VWFH DCIECTA8LE tEVFli
•2 ICE - TKICMLOROC1HFNE (Uq/i)CC14 - CARSON TETRACHIOHIIM (IKJ/I)
3 H*St MAP INfWWAllON PROVir>Eri HrGROUNOWAICR TECMNOtOOY, INCIt HHE EHA
Figure C-7 TCE & CCL4 in Soil Borings
QMIMMWDt 1CCMNOIj00y MC.
M11S MA LSVS WNE KEMPKMOED•C. * IHC
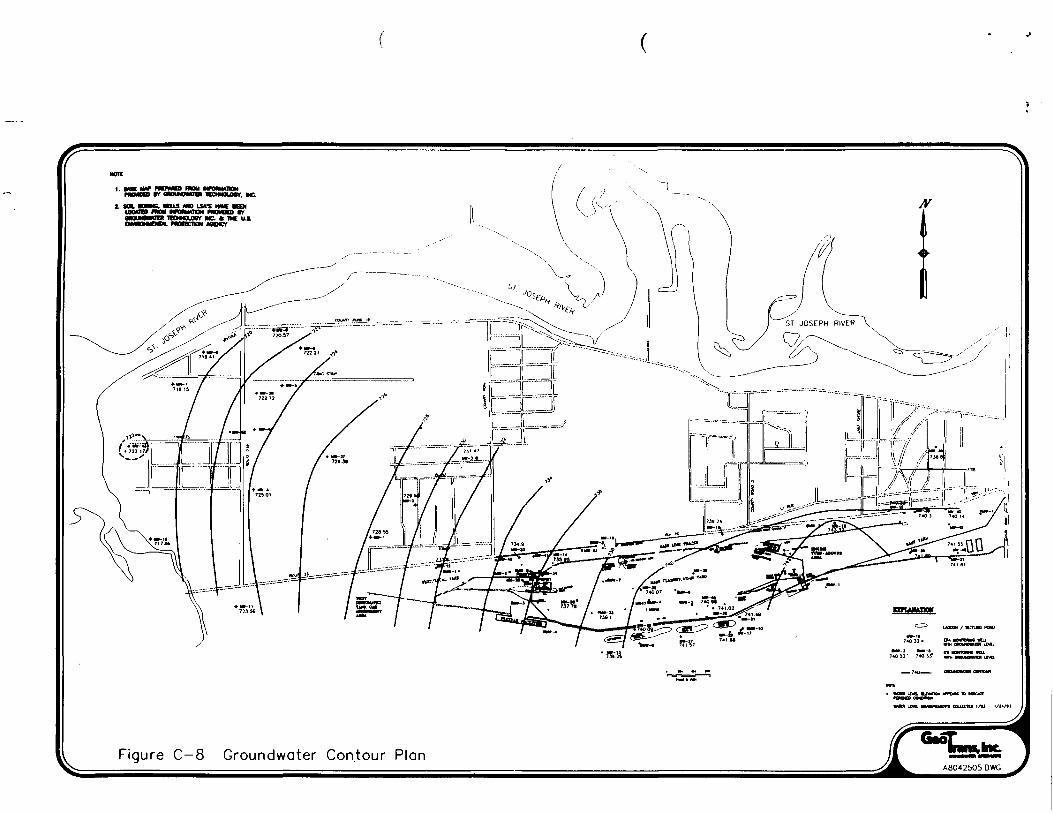
Figure C—8 Groundwater Contour Plan
ATTACHMENT D
Water Quality SectionsA-A' through N-N'
WA>042\030II51595I
GeoTrans,inc.

1. HOI tUP PKPMED FMH MFCMUnONnWMOCO 91 MOUNMMTn TECHNCUWr. INC.
2. SOL KMM*. WCUS <NO LWS HAX •»LOOTED FHOW MHWunON PKMOED (rOMUNDVHDI TCCHNOLOCr HC. * TOt liiENVMMWNTA. mOftcnCN WCNCV
Figure D —1 Section Location Plan

r
•Ill ?5'i
APPKOXMAIE OKADC
\.
Figure D—2 Section A - A*
MOMTOMHG Wu.
-CCL4 CONCSNTRAnON
ICt CONCCNTfUnON
- SAMPLt LOCATION5e»«
ALL ELLVAIIONAL INFORMATION IS IN TT HG1
TCE • TRlCMLOROETHENE (ug/l)CC14 - CARBON TFTRACHlORiOE (ug/l)CONCENTRATIONS REFER TO GHQUNDWATERUNLESS "SOIL" IL NOTED

APPHOXMATE GMADC
7M——1 —————
680—
670—
660—
—- 700
— 690
— MO
— 670
CCi.4 COMCtftTRATKM
ICt COKtKIHATWN
SAWH.E LOCATION
CftCUNOWAUH UVCL MAKO Iff]
ALL ELEVAIIONAL INFORUATIQN IS IN FT N&'
TCt - TRICMLOROtTMENE (uq/l)CCL4 - CARBON TETRACHlORIOC (ug/i)CONCENTRATIONS REFER TO CROUNDWAIERUNLESS 'SOIL' IS NOTED
Figure D-3 Section B - B'

730 —
720 —
710 —
700 —
-CCL4 CONCENTRATION
Figure D-4 Section C - C'
All ElEVATlONAL INFOfiMAIION 15 IN fT NGVD
ICE - TRICHLOROt THENE (ug/l)CCI4 * CAR8ON ItlKACMLORIM (ug/l)CONLlNtRATIONS REFER TO GROlJNDWATtRUNLtSS 'SOIL' IS NOTED

700
690-
680
650
640
6»
620
610
600
Figure D-5 Section D - D ' UVII UAHtH 149)
ALL tLtVAtlONAl INfORMAriON IS IN FT NCtfD
R-.F = fRiCHLOHOETHENE (uy/i)
CtH - CAWBON TE1RACHLORIL* (u<j/l)CONCE MIRATIONS RFFER TO GftOuN{j*AHRiiNtiSS "SOIL" IS NOTED
CO1
CD
Mi
JOCUtt
Moon
JSO
:uy
J1
\
a, 5 5
f= in p f1- ^rO 1 o 10
CD CD
6 5 6J> r> i/i*^^ A_-- /••-•'
„
„
'„,.**
„
i
\.
L
^ L
•*- i
«,L
HI [
**' L
Ml
!HI'
1
~ i
«"
HD
£
NC
c
*?
APPROBATE CHAW
1. All ELEVAHONAl INFORMATION >$ IN FT NCVD
2 TCE - TRICHLOROETHENE (ug/l)CCL4 * CARBON TFTRACMiOWDE (ug/0CONCENTRATIONS REFER TO GROONOWATLRUNLESS 'SOU' IS NOTED
Figure D-6 Section E - E'
i!
- ICS CUNUNTHArKlH
Figure D—7 Section F - F'
—— CCH COK«NTR*nU
i/o- rci cot^ctMmAnowSAUPU iOCAllOH
1 All f I f! VA TlONAL INFOHMMION IS IN fl NCVO
'1 TO. - IRK HLOROtTHENE (uy/l)C C L 4 - l.AKBON ILtKAf.MLORIOf (ug/t)i-ONaNrRAIIONc, RCFER 1O CROUNDWATERUNLESS "SO«L' ^ NOTED

CO. 4 CONCENTRATION
- ICE CtMCENTRAnON
- SAMPLE lOCATON
GNOUNOVATtR LEVtL MARCH 1M3
ALL LLLVATIONAi INFORMATION IS IN FT. HCVD
TC£ - TRICHLOROtTHENE (ug/l)CCL4 - CARBON ItTRACHLORlOE (ug/\)CONCINTRATIONS RtFER TO CROUNOWATERUNUSS "SOIL" IS NOTED

7» -
720-
710 -
700-
Figure D-8 Section G - G'
- iWftOMMATE OftAK
iTER ELfVAIKW

i* i
II*W f N
OWMAH CHAOE
Figure D-9 Section H - H'Ail ElFVATlONAl INFORMATION IS IN FT NO1
IU * T«ll,HLO«Ol tHINI (ug/l)
CCL4 ^ CARBON TElRACHLOKIOt (ug/l)CONCLNlRATIONb KtFtR TO GROUNOWATERUNliSS SOU " IS MOTTO
rtPLAIUTIOH
Figure D-10 Section I - l'
Ail I l tVAllONAl INFORMAIIUN ib IN FT NGVD
ICt - IRILMLO«OETH£N£ (U4/I>Cf.l 4 =• CAHBON IE 1RACMIO«IOt (ug/l)CONCfNTRAllONS »(FER TO OftOUNDWATfRUNLti1.. "iOIL" IS NOTLU
C131ON <il .1(01 a3J3a SNOU
J
eao —
era —
«60 —
650 —
640 -
630 -
Figure D-12 Section K - K'
ICt CCWCtHTRATlOW
=,*MPL£ LOCATION
AH ELEVAIKJNAi. INfUHMAriUN li IN F 1 NL.VO
I([ = IMCHi OR(Jt THLN€ (ug/l)CCu* - CAHBON rtTRACMLORIDE (uq/0CONCtN IRA IIONS RiFER TO GfiOUNDWA'tKUNLESS "SO«L" IS NOTED
Figure D-13 Section L - l_'
CCL4 CONliNlRAtlOU
All FlTVAllONAl \HKjffU A [\(JH I1! IH t\ NOVTJ
ICt « TRICHLOROI IHFNE fug// )CCl* , CARBON TEIRACMLORlDt (u>j/l)LON(.CNIRA!lONb HEFEH tO GROUNDWATERUMLfiS "SO" " IS NOItD

r
e»o -
«70-
Figure D-14 Section M - M'
- - -• CCl4 CONCCHtfiATKJN
•O-—— ICt COKENTH*!10N
x——— SAMPLE LOCUTION
"~- - SCBEtfJ SIZE *HOIOCAIION (WlL^, OMY)
GAQUNDVMTEft IfVfl M<
ALL [I.EVAIHJUAL iNfQHMATION IS IN f I NGVD
ICE - TRlOd OftOfTHENf (ug/l)LCL4 - CARBON ILIKALMLORIDf (uq/0CONt:iNTHATION5 HlffR TO GROUNOWATEKuNifSS "SOIL" IS NOTED
— 690
— 680
— 670
— 660
Figure D —15 Section N — N'
CC14 CONdNIMAIION
— tCf LGNCEWTRAIMJN
1 ALL CLFvAttONAI INFORMATION J$ IN ( T
2 ICL - IKICMlOHOl IHINt (uq/l)
CO 4 - CARBON rETRACHLQftlOE (uy/l)

ATTACHMENT E
Summary of Groundwater Flow Modeling and Particle Tracking
W\«04M30I1515 951
GeoTransJnc.
GROUNDWATER FLOW MODEL ANALYSIS
CONRAIL RAIL YARD, ELKHART, INDIANA
Source Code
FTWORK is a three-dimensional finite-difference code which can be used to sim-ulate flow of groundwater under confined and unconfined conditions. The FTWORKcode was developed to simulate groundwater flow through large, complex, multilayered,fully-saturated, porous, hydrogeologic systems. FTWORK solves both transient andsteady state flow with source and sink terms. The model allows for approximation oflayers of irregular thickness and layers that are not horizontal.
Model Conceptualization
The geology in the Elkhart, Indiana, area is characterized as areally extensive,thick outwash deposits composed of sand and gravel overlying bedrock. The bedrockconsists of Coldwater Shale of Mississippian age and Sunbury and Ellswonh Shales ofDevonian and Mississippian age (Imbrigiotta and Martin, 1981). Within the Site area,the outwash deposits are about 150 feet thick and contain discontinuous silt and claylenses. The geology encountered within the Site is discussed in an Alternatives ArrayDocument prepared by Ecology and Environment, 1993. Boring logs contained invarious technical reports for the Site provide a description of the lithology encounteredduring drilling.
The modeled area encompasses approximately 4.2 square miles. The north andwest boundaries of the model are the St. Joseph River. The elevation of the St. JosephRiver ranges from 717 to 715 feet within the modeled area. The south boundary of themodel is approximately 300 feet south of the tracks on the Railyard and the eastboundary is in the vicinity of the engine turnaround area. The model area isapproximately 7,700 feet north to south and 15,400 feet east to west.
W \*>I2>0»M;I595I
GeoTransJnc.
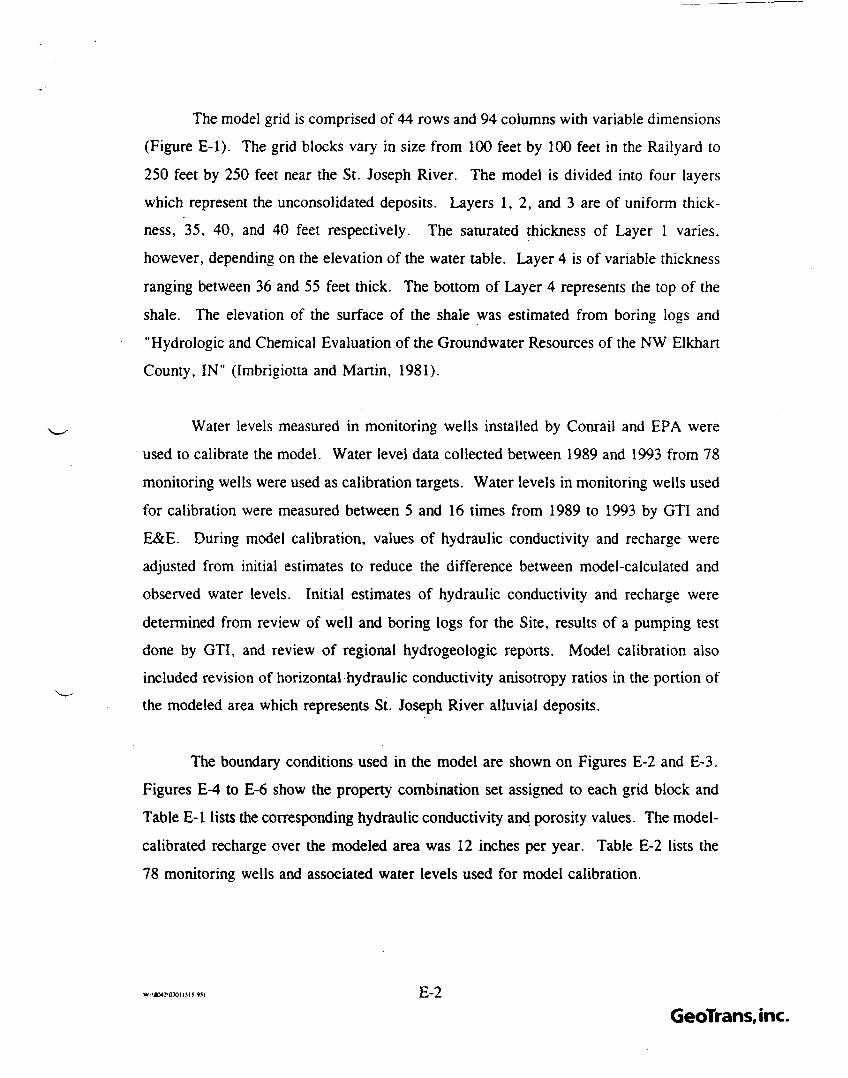
The model grid is comprised of 44 rows and 94 columns with variable dimensions
(Figure E-l). The grid blocks vary in size from 100 feet by 100 feet in the Railyard to250 feet by 250 feet near the St. Joseph River. The model is divided into four layerswhich represent the unconsolidated deposits. Layers 1, 2, and 3 are of uniform thick-ness, 35, 40, and 40 feet respectively. The saturated thickness of Layer 1 varies,however, depending on the elevation of the water table. Layer 4 is of variable thicknessranging between 36 and 55 feet thick. The bottom of Layer 4 represents the top of theshale. The elevation of the surface of the shale was estimated from boring logs and"Hydrologic and Chemical Evaluation of the Groundwater Resources of the NW ElkhartCounty, IN" (Imbrigiotta and Martin, 1981).
Water levels measured in monitoring wells installed by Conrail and EPA wereused to calibrate the model. Water level data collected between 1989 and 1993 from 78monitoring wells were used as calibration targets. Water levels in monitoring wells usedfor calibration were measured between 5 and 16 times from 1989 to 1993 by GTI andE&E. During model calibration, values of hydraulic conductivity and recharge wereadjusted from initial estimates to reduce the difference between model-calculated andobserved water levels. Initial estimates of hydraulic conductivity and recharge weredetermined from review of well and boring logs for the Site, results of a pumping testdone by GTI, and review of regional hydrogeologic reports. Model calibration alsoincluded revision of horizontal hydraulic conductivity anisotropy ratios in the portion ofthe modeled area which represents St. Joseph River alluvial deposits.
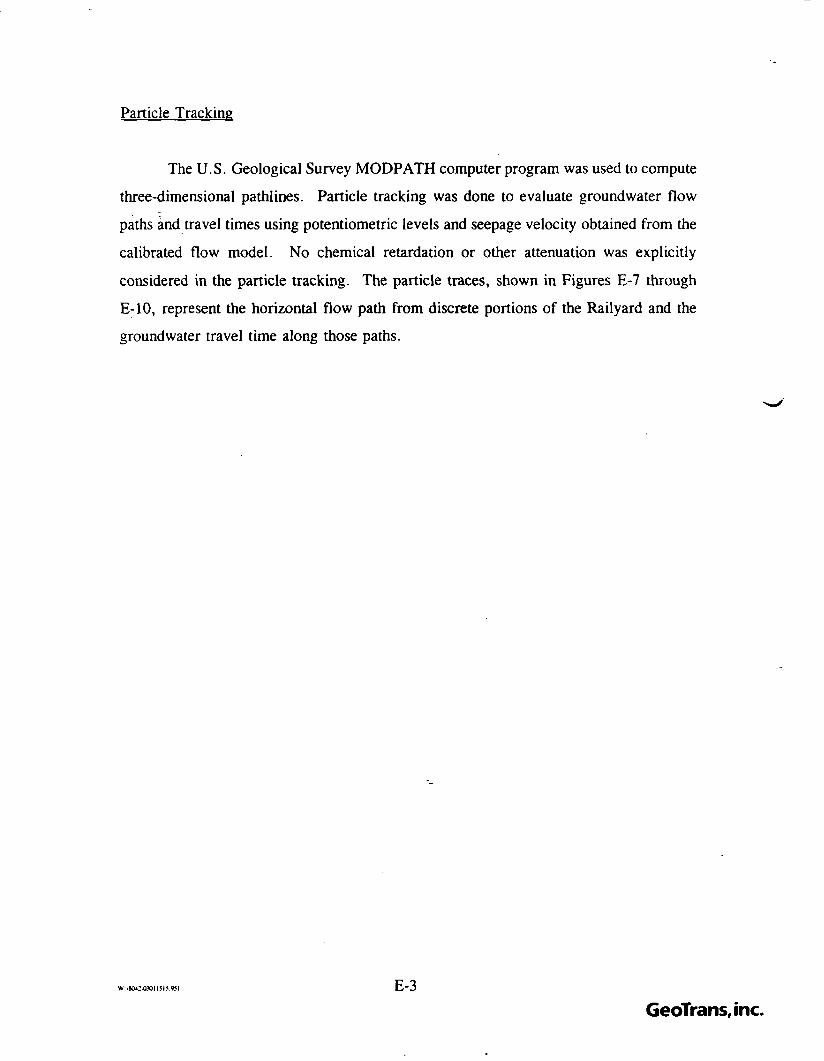
The boundary conditions used in the model are shown on Figures E-2 and E-3.Figures E-4 to E-6 show the property combination set assigned to each grid block andTable E-l lists the corresponding hydraulic conductivity and porosity values. The model-calibrated recharge over the modeled area was 12 inches per year. Table E-2 lists the78 monitoring wells and associated water levels used for model calibration.
GeoTrans,inc.
Particle Tracking
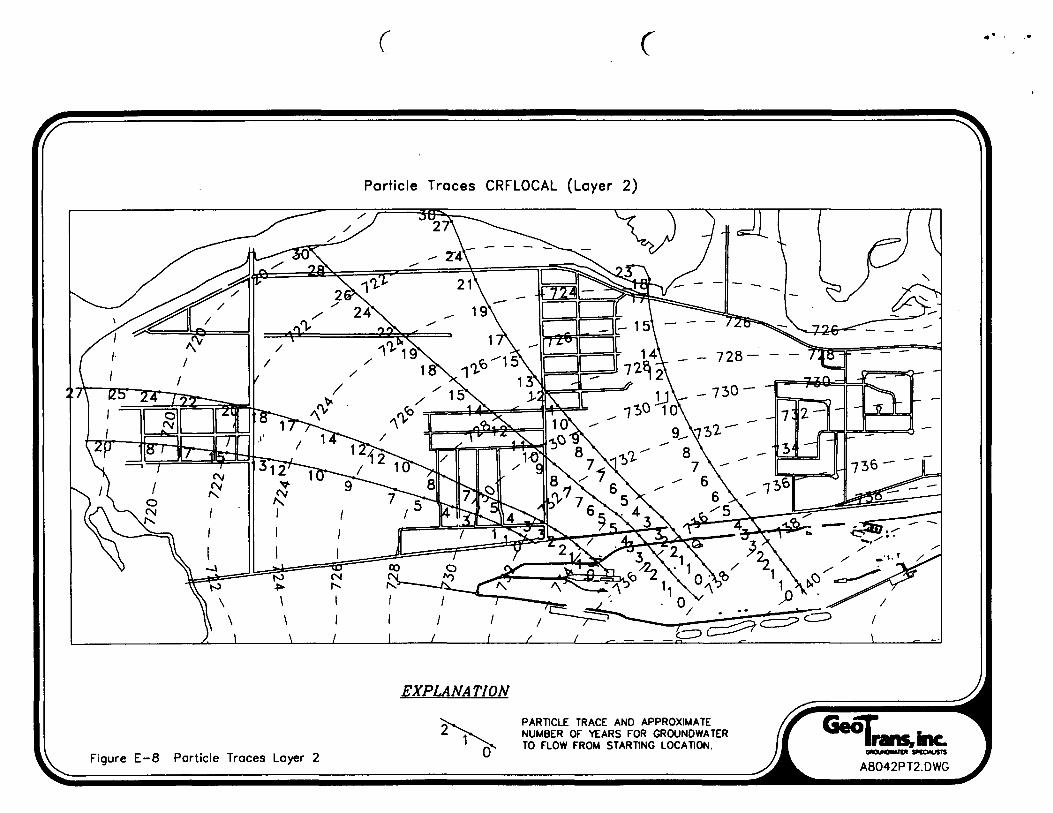
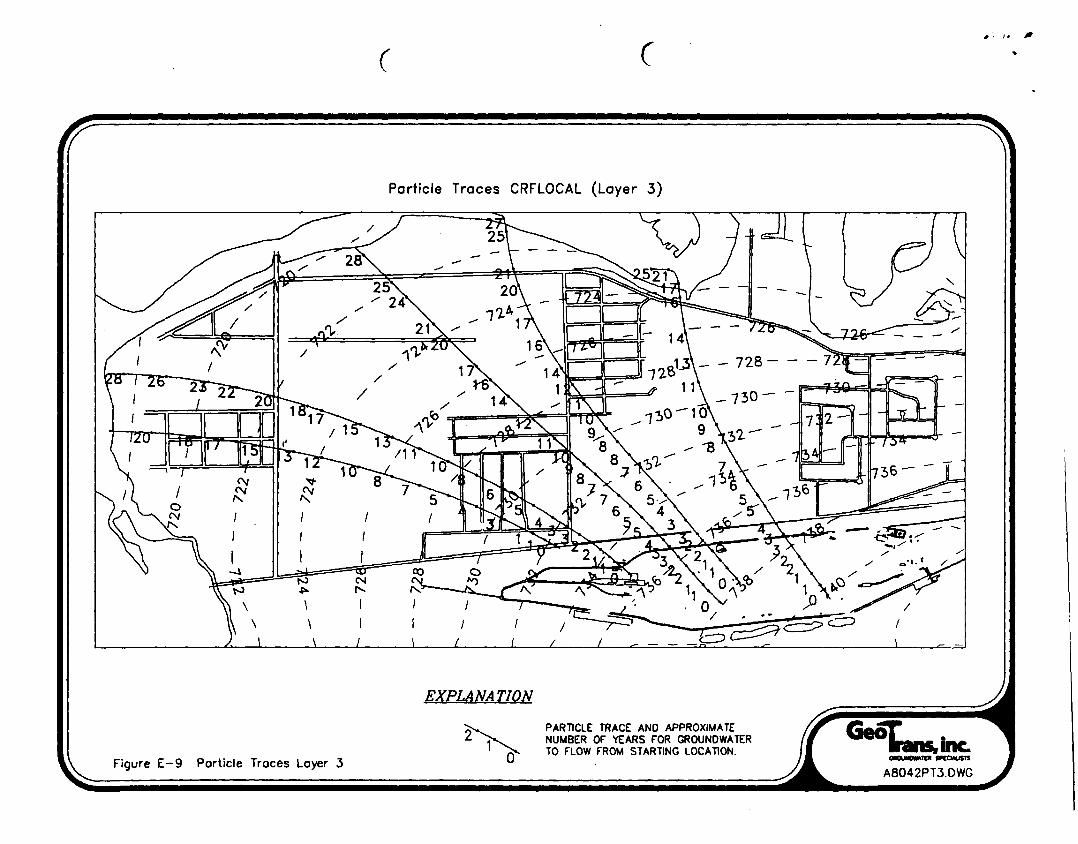
The U.S. Geological Survey MODPATH computer program was used to computethree-dimensional pathlines. Particle tracking was done to evaluate groundwater flowpaths and travel times using potentiometric levels and seepage velocity obtained from thecalibrated flow model. No chemical retardation or other attenuation was explicitlyconsidered in the particle tracking. The particle traces, shown in Figures E-7 throughE-10, represent the horizontal flow path from discrete portions of the Kailyard and thegroundwater travel time along those paths.
W:\SOU.O.>OIIM<9?I
GeoTrans,inc.

Table E-l. Property combination sets
Set Number
1
2
3
4
5
6
7
Porosity
0.2
0.1
0.2
0.2
0.2
0.2
0.2
HydraulicConductivity(Kx feet/day)
120
25
120
120
120
120
120
HydraulicConductivity(Ky feet/day)
60
25
120
120
60
120
60
HydraulicConductivity(Kz feet/day)
12
2.5
12
12
12
12
12
W VKMMBOM5IS 9<l E-4GeoTransJnc.

Table E-2. Monitoring wells and associated water levels used for model calibration
Monitoring Well
MW-1
MW-2S
MW-3
MW-4S
MW-5S
MW-6
MW-7S
MW-8S
MW-9
MW-10S
MW-1 IS
MW-1 2
MW-14
MW-16
MW-1 7
MW-23S
MW-24
MW-25
MW-26
MW-27S
MW-28S
MW-29S
MW-30S
MW-3 IS
Water Level Elevation(feet)
727.19
727.86
729.99
723.7
722.36
721.26
718
718.8
719.83
717.41
722.52
731.14
734.68
738.42
740.38
733.57
735.03
734.31
736.77
741.18
739.55
741.26
739.56
740.99
E-5GeoTransJnc.

label E-2 (continued).
Monitoring Well
MW-32S
MW-33S
MW-37S
MW-38S
MW-43S
MW-46S
RMW-2
RMW-3
RMW-4
RMW-6
BMW-3
BMW-4
BMW-5
MW-2D
MW-4D
MW-5D
MW-8D
MW-10D
MW-11D
MW-23D
MW-27I
MW-28I
MW-29I
MW-30I
Water Level Elevation(feet)
740.5
738.72
725.69
722.08
721.62
740.6
734.27
735.79
737.94
743.2
735.57
739.34
740.99
727.75
723.73
721.96
718.72
720.48
722.48
732.67
740.71
739.28
741.28
738.89
E-6GeoTrans,inc.

Tabel E-2 (continued).
Monitoring Well
MW-31I
MW-32I
MW-33I
MW-34I
MW-46I
MW-42I
MW-41D
BMW-6
BMW-7
BMW-8
MW-15
MW-30D
MW-37D
MW-38D
MW-51
MW-49D
RMW-2D
BMW-4D
BMW-5D
BMW-6D
BMW-7D
BMW-8D
MW-7D
MW-2BR
Water Level Elevation(feet)
740.97
740.46
738.23
735.73
740.72
732.38
734.66
739.09
737.68
734.58
737.13
738.89
725.71
722.08
736.6
738.98
733.81
738.75
740.38
739.09
737.68
734.58
718.01
728.87
WVHM2UUOI1515 951 E-7GeoTrans,inc.

label E-2 (continued).
Monitoring Welli
MW-8BR
MW-30BR
MW-43BR
MW-44D
MW-49BR
MW-50
Water Level Elevation(feet)
718.9
738.86719.76
723.42
739
722.71
W\»OOJOIIJIS*SI E-8GeoTransJnc.

t £
IDcCD
mI
ooo5'3
TJD13
OQ.
O
Q.'
r c
EXPLANATION• CONSTANT HEAD NODEo NO FLOW NODE
. STREAM BOUNDARY BLOCKFigure E-2 Boundory Conditions for Loyer 1
wans.incA8042B01.DWG

c c
EXPLANATIONCONSTANT HEAD NODENO FLOW NODE
Figure E-3 Boundory Conditions for Layer 2, 3, & 4irans,!Inc
rtcuanA8042B02.DWG

c
SEE TABLE E-1 FOR PROPERTYCOMBINATION SET DESIGNATIONS
Figure E—4 Property Combination Sets Layer 1

<Nu^^^NO
_Jcn
(/)c
oc!Q£oo
Q.Ool
0)
J

c c
JfI
NOTE:
SEE TABLE E-1 FOR PROPERTYCOMBINATION SET DESIGNATIONS
Figure E—6 Property Combination Sets Layer 3 & 4

r c
Particle Traces CRFLOCAL (Layer 1)
EXPLANATION
Figure E-7 Particle Traces Layer 1
PARTICLE TRACE AND APPROXIMATENUMBER OF YEARS FOR GROUND WATERTO FLOW FROM STARTING LOCATION.
GeoTIrans,A8042PT1.DWG
r c
Particle Traces CRFLOCAL (Layer 2)
EXPLANATION
Figure E-8 Particle Traces Layer 2
PARTICLE TRACE AND APPROXIMATENUMBER OF YEARS FOR GROUND WATERTO FLOW FROM STARTING LOCATION.
c
/rParticle Traces CRFLOCAL (Layer 3)
Figure E-9 Porticle Troces Loyer 3
PARTICLE TRACE AND APPROXIMATENUMBER OF YEARS FOR GROUNDWATERTO FLOW FROM STARTING LOCATION.

Particle Traces CRFLOCAL (Layer 4)
EXPLANATION
Figure E-10 Particle Traces Layer 4
PARTICLE TRACE AND APPROXIMATENUMBER OF YEARS FOR GROUNOWATERTO FLOW FROM STARTING LOCATION.