Embed Size (px)
Citation preview
Issues and Options for High Efficiency and Low Carbon
Urbanization in China
Prof. He Kebin Tsinghua University, Beijing, PRC
SB26 Bonn, Germany May 11, 2007
Contents
Trends and Challenges
Policies and Measures
Future Demands

GDP and primary energy consumption, on per capita base, are still low in China
Source:
Li Zheng, Tsinghua Univ.
Still in low stage according to U.N. standardsFurther development is expected
1997$)

Imbalance: eastern and westernSome rural area in China’s west
Some urban area in China’s southeast
Services Buildings Transportation Education
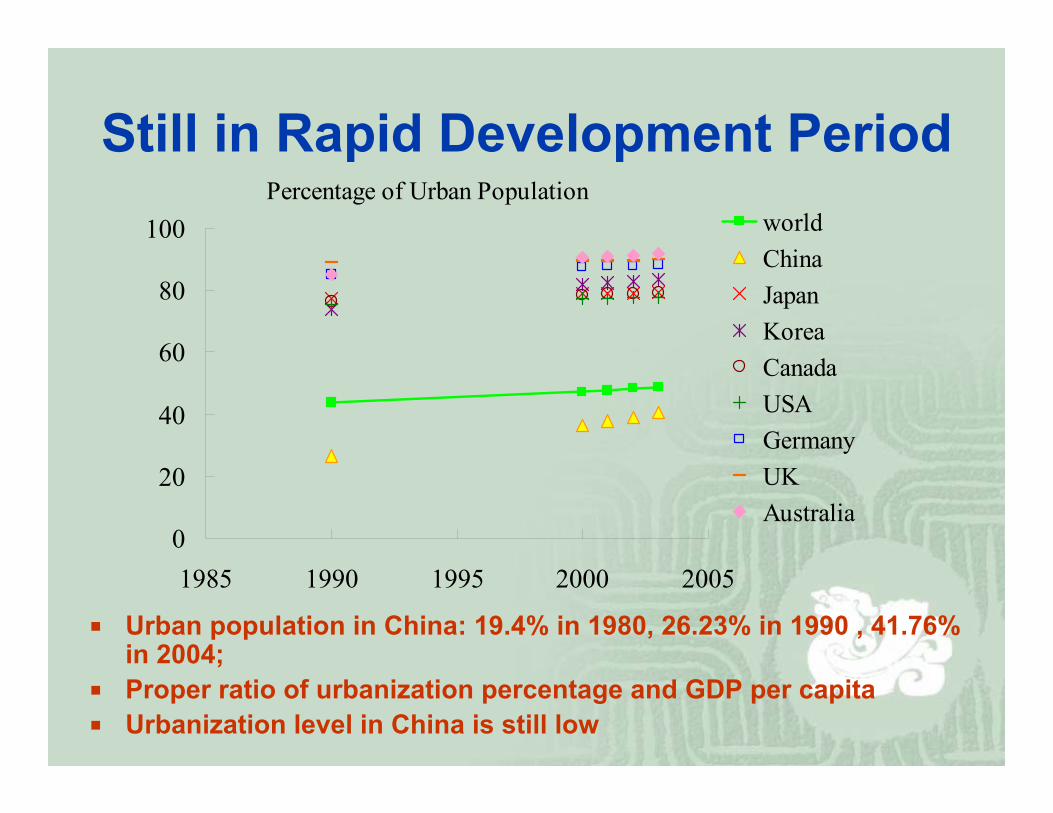
Still in Rapid Development Period
Urban population in China: 19.4% in 1980, 26.23% in 1990 , 41.76% in 2004; Proper ratio of urbanization percentage and GDP per capita Urbanization level in China is still low
Percentage of Urban Population
0
20
40
60
80
100
1985 1990 1995 2000 2005
worldChinaJapanKoreaCanadaUSAGermanyUKAustralia
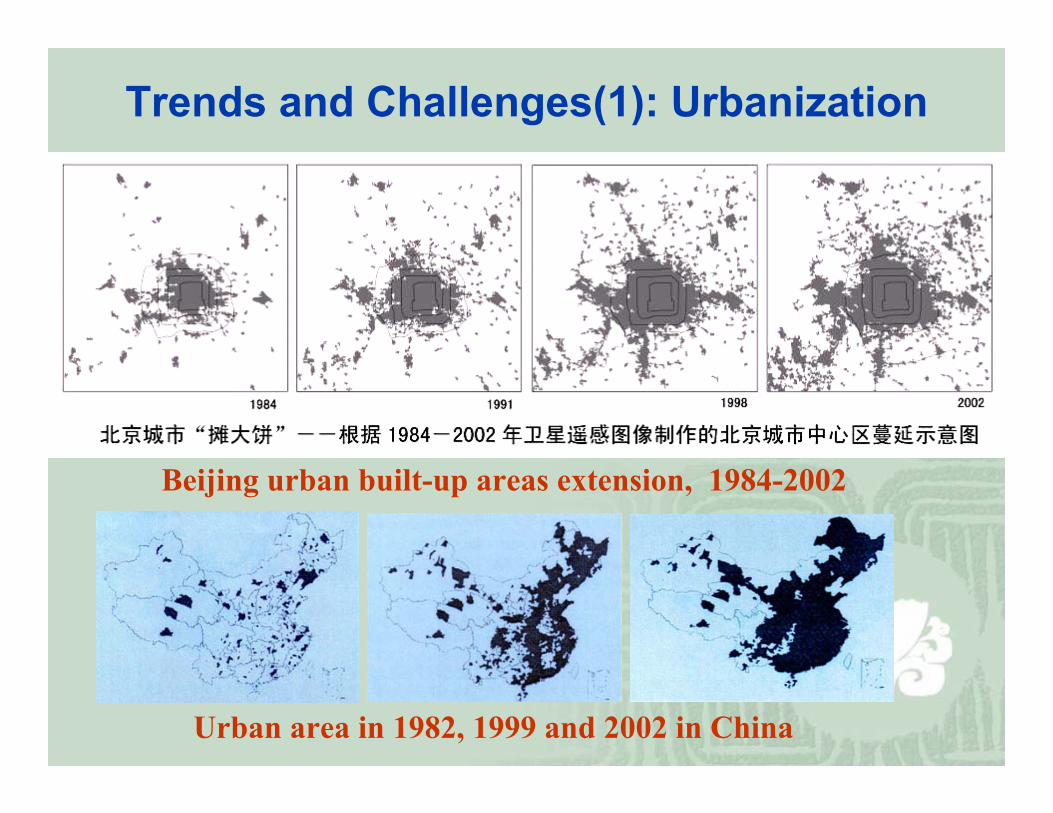
Trends and Challenges(1): Urbanization
Beijing urban built-up areas extension, 1984-2002
Urban area in 1982, 1999 and 2002 in China
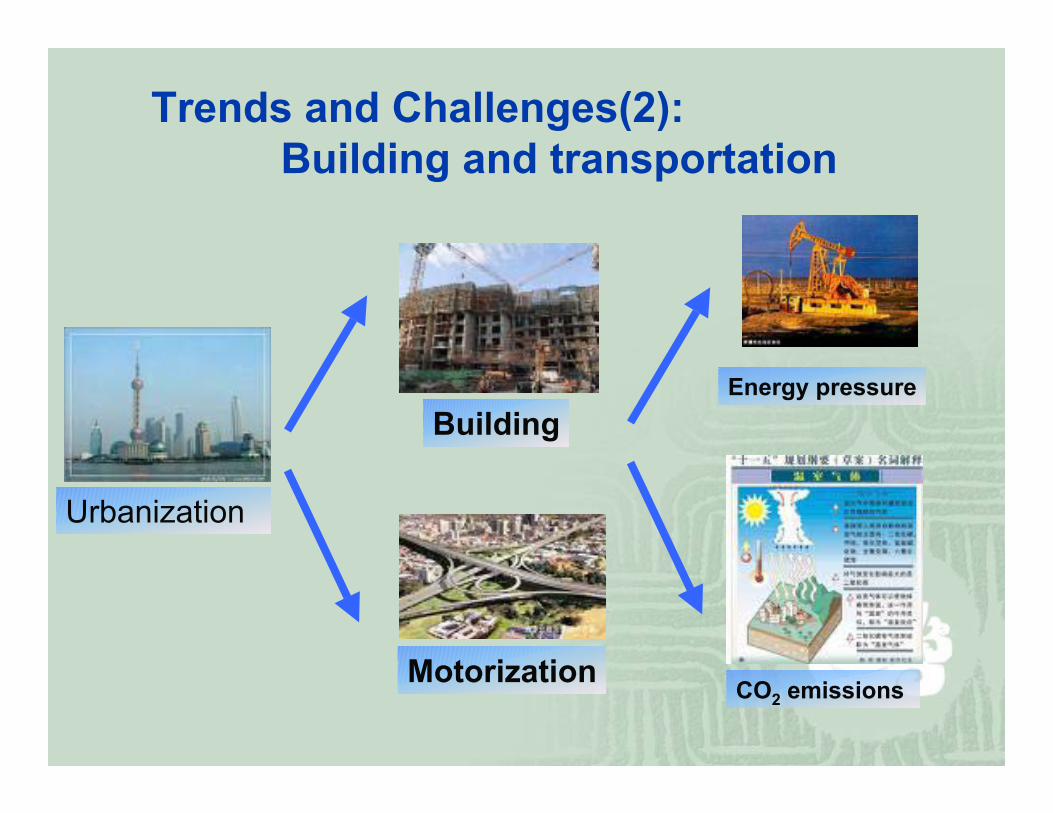
Trends and Challenges(2): Building and transportation
Urbanization
Motorization CO2 emissions
Energy pressureBuilding

Trends and Challenges(3): Building energy consumption
Energy
Coal
Electric
0%
5%
10%
15%
20%
25%
30%
35%
Building Energy/primary energy consumptionNorthern building heating coal/total coal consumptionBuilding electric consumption/total electric consumption
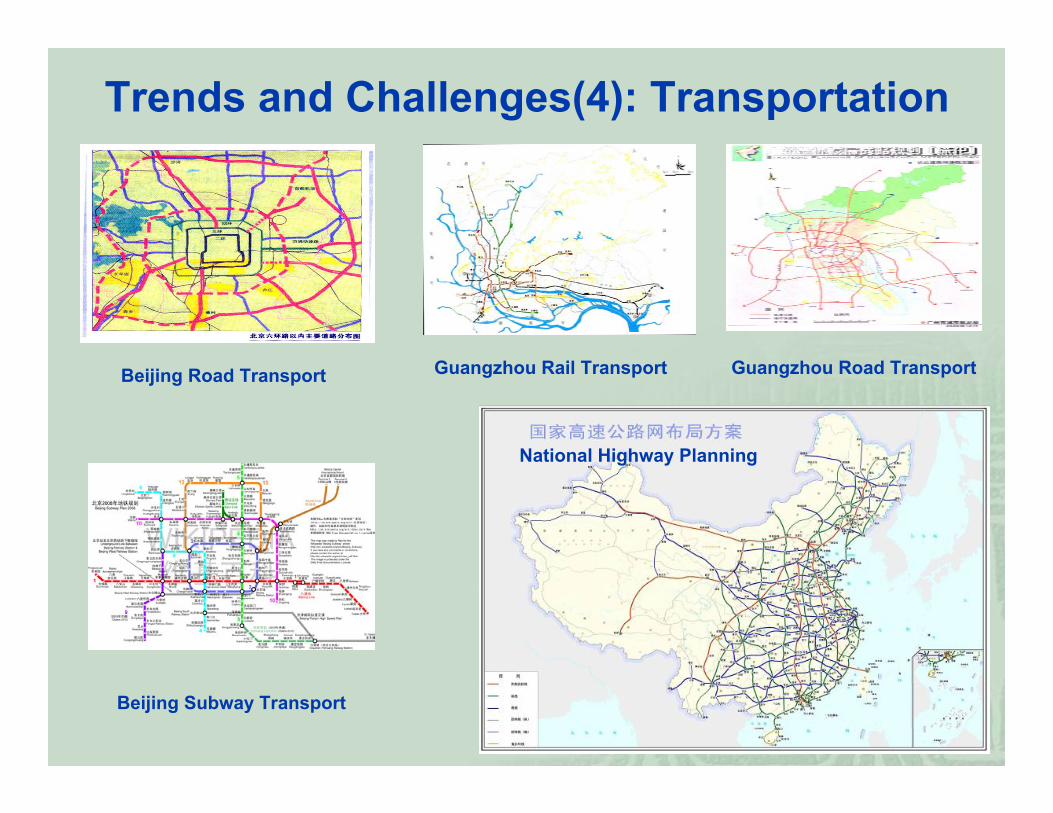
Trends and Challenges(4): Transportation
Beijing Road Transport
Beijing Subway Transport
Guangzhou Rail Transport Guangzhou Road Transport
National Highway Planning

Trends and Challenges(5): Motorization
0
20
40
60
80
100
120
140
160
180
200
2000 2005 2010 2015 2020 2025 2030
mill
ion
US DOE
NAS High
NAS Low
CATARC 1
CATARC 2
From the early 1990s to today:annual growth rate ----13%
By the end of 2006:total automobiles 35.9 millions;total private cars 11.5 millions.
2020:1-1.3 billion vehicles
05
10152025303540
1990
1991
1992
1993
1994
1995
1996
1997
1998
1999
2000
2001
2002
2003
2004
2005
2006
million

BAU
0.00
100.00
200.00
300.00
400.00
500.00
600.00
2000
2002
2004
2006
2008
2010
2012
2014
2016
2018
2020
2022
2024
2026
2028
2030
mill
ion
tons
Motorcycle
Car
Mini Bus
LDB
MDB
HDB
Mini Truck
LDT
MDT
HDT
Trends and Challenges(6):Fuel Consumption in Road Transportation
300 million tons in 2020500 million tons in 2030
BAU
0
200
400
600
800
1000
1200
1400
1600
1800
2000200220042006200820102012201420162018202020222024202620282030
mill
ion
tons
Motorcycle
Car
Mini Bus
LDB
MDB
HDB
Mini Truck
LDT
MDT
HDT
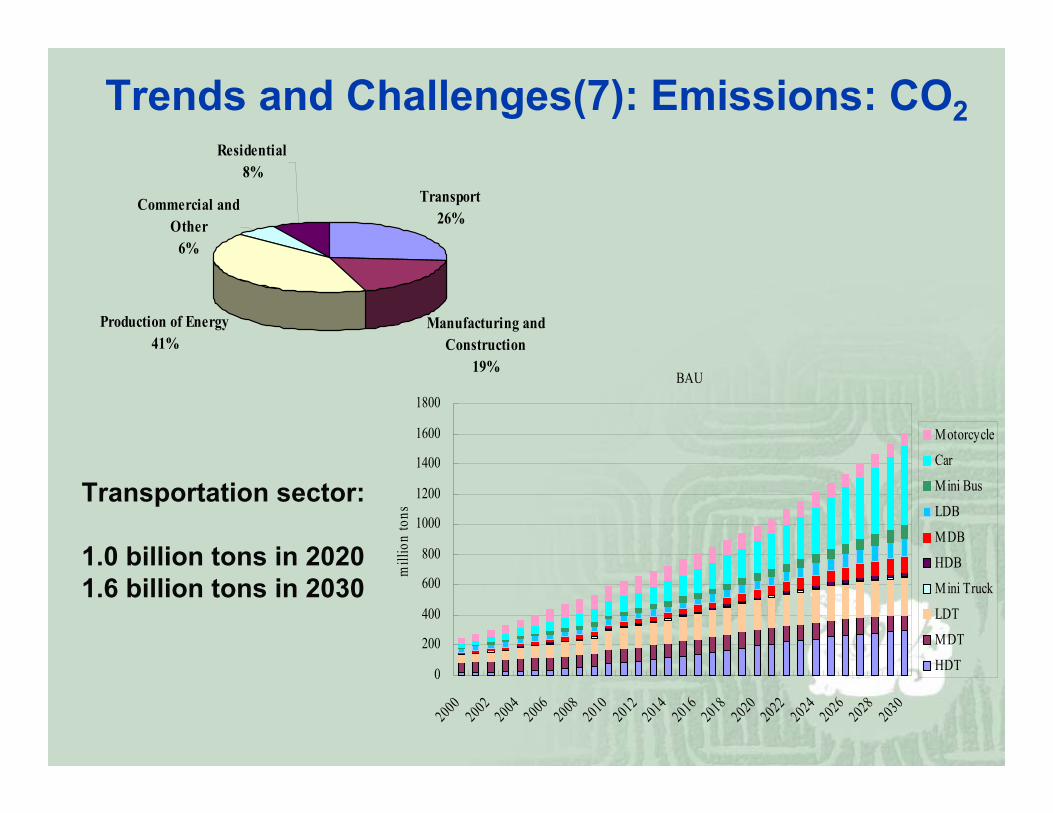
Transportation sector:
1.0 billion tons in 20201.6 billion tons in 2030
Transport26%
Manufacturing andConstruction
19%
Production of Energy41%
Commercial andOther
6%
Residential8%
Trends and Challenges(7): Emissions: CO2

Contents
Trends and Challenges
Policies and Measures
Future Demands

Policies and Measures (1)Building energy efficiency
“11th-five-years”:energy saving target for buildings 101 million
Tec 42% of total energy saving target
101 million TecNew building:70 million Tec
Old building:31 million Tec
Renewable Energy
Policies and Measures (2)Energy saving from transportation
Four ways to improve energy efficiency and limit carbon emissions:
Fuel Economy
Fuel Quality
Fuel Diversity
Reducing VKT

Fuel Economy (1):
2005 to 2008:
after 2008:
further reduce by 15%
reduce per-VKT fuel consumption by 5%~10%
National Fuel Efficiency Standard(issued by SDPC in 2003)

Fuel economy (2): Effectiveness
78
186
312
507
78
183
299
476
160 170 180
0
100
200
300
400
500
600
2000 2010 2020 2030
mill
ion
tons
BAU
fuel economy standards
domestic production Fuel saving:13 million tons in 2020 31 million tons in 2030
0
20
40
60
80
100
120
2000 2003 2006 2009 2012 2015 2018 2021 2024 2027 2030
mill
ion
tons
CO2 emission reduction
CO2 emission reduction:100 million tonsin 2030

Fuel Economy (3): further improvements(under consideration)
Measures:2012 , light-duty passenger cars:Further reduction 25% to 5.6 L/100km (European requirement for 2008)
2016 , light-duty passenger cars:To 4.8 L/100 km (catch up with Europe and Japan )
Effects:Fuel saving:Additional 19 million tons oil in 2020; 60 million tons in 2030
CO2 emission reduction:Additional 61 million tons in 2020; 189 million tons in 2030
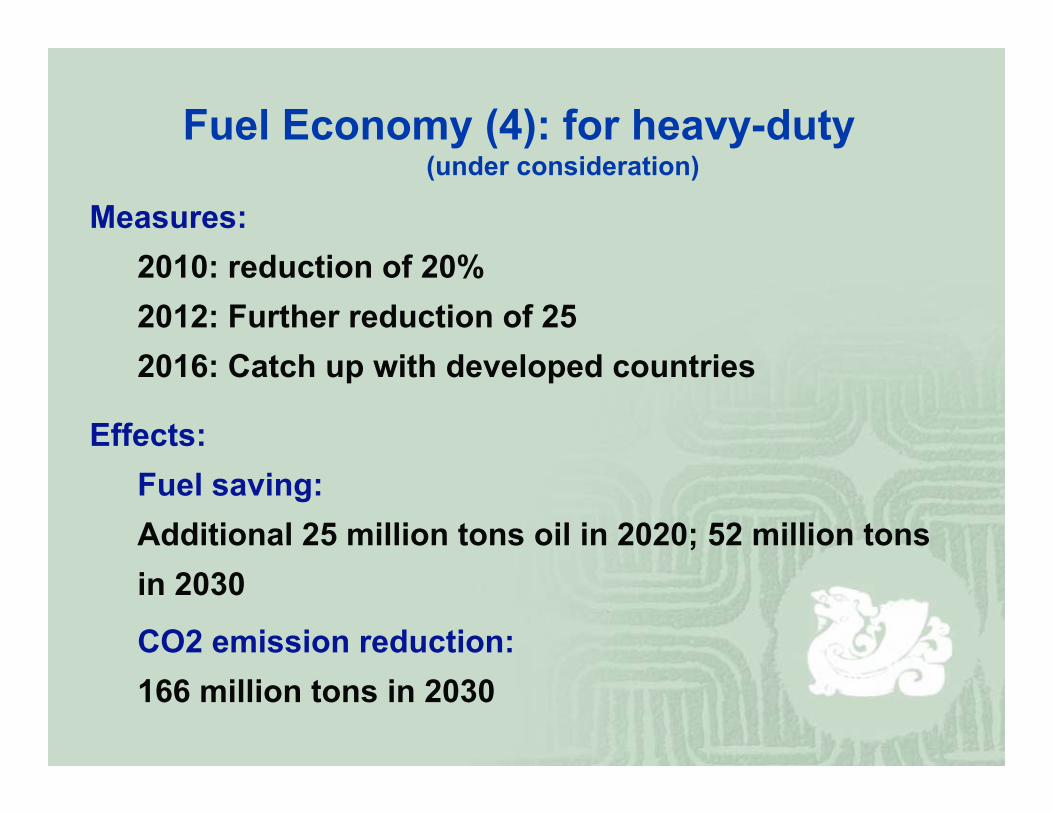
Measures:2010: reduction of 20%2012: Further reduction of 252016: Catch up with developed countries
Effects:Fuel saving:Additional 25 million tons oil in 2020; 52 million tons in 2030
CO2 emission reduction:166 million tons in 2030
Fuel Economy (4): for heavy-duty(under consideration)

Fuel Quality
Unleaded petrol (gasoline) for motor vehicles Low sulfur fuels
Vehicle emission standards in China
Emission
00.20.40.60.8
11.2
I II III IV
g/km

Fuel Diversity (1)
Liquid fuels
EthanolEthanol made from bio-plants
Rapeseed oilRapeseed oil (bio(bio--diesel)diesel) from bio-plants
Gaseous fuels
CNG, LNG and LPG, but low specific powerCNG, LNG and LPG, but low specific power
Problem and Perspective
High cost to produce the bioHigh cost to produce the bio--fuelsfuels

Optimization of Traditional Technologies Future small cars Efficiency of internal combustion engine achieve 45%-55
Battery Electric Vehicles “Zero-emission” vehicle;
Fuel Cell VehiclesHigh efficiency, low emission electrical power system;Long-term potential, obstacles for commercialization.
Fuel Diversity (2)

Fuel Diversity (3): Diesel vehicles
In China:23.7% of all vehicles are diesel but only 0.2% of cars are diesel
diesel percentage in passenger vehicles is proposed to
increase to 5%, 15% and 30% in 2010, 2015 and 2020
If 20% of PC were diesel, 30 million tons oil would be saved
6789
1011
Europe USA
L/10
0 km
19802000
International Experience
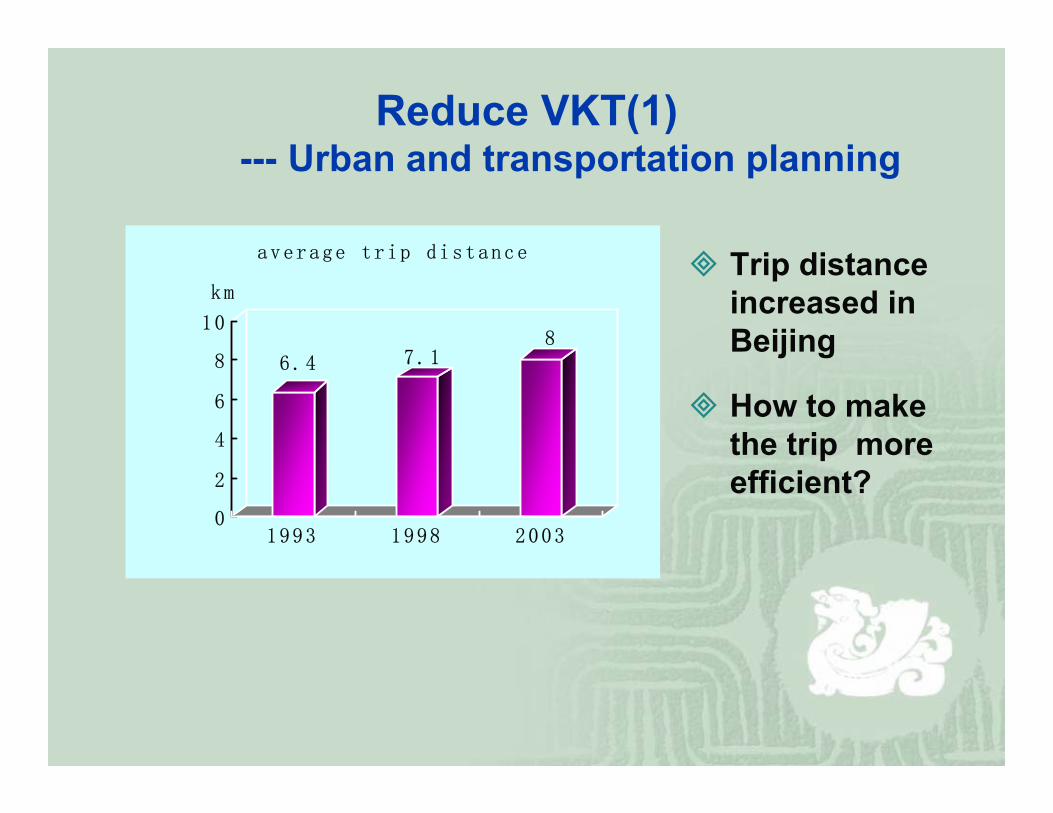
Reduce VKT(1)--- Urban and transportation planning
6.4 7.18
0
2
4
6
8
10
km
1993 1998 2003
average trip distance Trip distance increased in Beijing
How to make the trip more efficient?
Reduce VKT(2) --- TDM
National Fuel tax proposed to be increased
Car ownership controls already in Shanghai
Off Street parking provision limited for new developments
Differential parking pricing in Beijing & Shanghai
Development of subway/BRT systems in major urban areas

Reduce VKT(3) -- Trip mode shift
0
20
40
60
80
100
120
140
160
BRT Rail Bus MC Taxi Car
ton
CO
2/m
illio
n pe
rson
-km
CO2 Emission of Six Transportation Modes
Cars produce the largest CO2 emission per passenger-kilometer, 7 times of the busesPromotion of mass public transfer tool: light rail, subway or BRT
Source:Energy Foundation

BRT Practice in China
CDCQTJSYXAGZ
FZNJSZSZWXHAXMTY
Under Operation:BJ, HZ, and KM
Under Construction:Jinan
Under planning:

Technical potential to reach the target (1) building
0
500
1000
1500
2000
2500
3000
3500
2020
Ene
rgy
savi
ng p
oten
tiam
illio
n kW
h/a
In-used large public buildings
New large public buildings
Electrical appliances
Heating system
Building enclosure

Technical potential to reach the target (2) transportation
0
20
40
60
80
100
2010 2020
AF
ATV (hybrid)
System Integration
Urban mode shift
HDV FE
LDV FE

Contents
Trends and Challenges
Policies and Measures
Future Demands

Demands for International supportsTechnical (1)
Mid-term, long-term technologies to improve building energy efficiency:
new technologies in building fabrics
ventilators and exhaust heat recovers
heat pumps
technologies to reduce energy consumption in distribution systems
temperature and humidity independent control system
energy saving optimizing control of building automatic systems
building combined power
heating & cooling system (BCHP)
new type of configuration of district heating system as well as high efficiency lightings
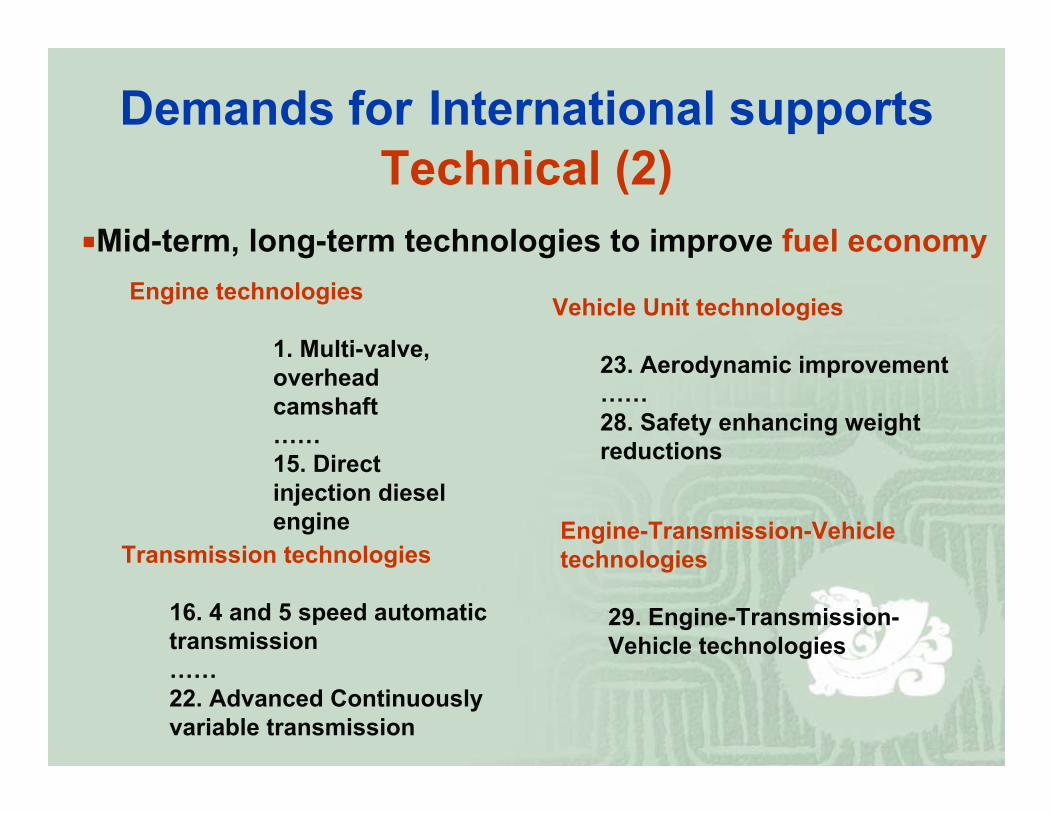
Demands for International supports Technical (2)
Vehicle Unit technologies
23. Aerodynamic improvement……28. Safety enhancing weight reductions
Engine-Transmission-Vehicle technologies
29. Engine-Transmission-Vehicle technologies
Mid-term, long-term technologies to improve fuel economyEngine technologies
1. Multi-valve, overhead camshaft……15. Direct injection diesel engine
Transmission technologies
16. 4 and 5 speed automatic transmission……22. Advanced Continuously variable transmission

Demands for International supportsMethodology
Buildingbuilding energy consumption model
energy estimation for commercial buildings
energy label system for residential buildings
energy label system for home appliances
TransportationEvaluate the effect of advanced technologies, including
alternative fuels
Evaluate the effect of transportation system optimizing

Demands for International supportsFinancial
Demo projects for
energy saving building
advanced vehicle technologies
low carbon transport mode (i.e. BRT)
eco-friendly town or city development
Capacity building

ConclusionChina’s Urbanization Process is in a normal and relatively low development stage; there is very serious Imbalance of developments between east and west China; Future development is expected and necessary.Great efforts have been made in China to promote sustainable urbanization process, especially for energy saving and emission reduction in building and transportation sectors.Technical, scientific and financial supports from international society are needed for further efforts to improve energy efficiency and reduce emissions.